Embed Size (px)
Citation preview

Annual Data Report2013-2014
A Report of the
Association of American Veterinary Medical Colleges
1101 Vermont Avenue, NW 20005
202-371-9195
http://www.aavmc.org
As of June 12, 2014

Introduction• The membership of the Association of American Veterinary Medical Colleges is pleased to
present the AAVMC Annual Data Report 2013-2014. This report includes data concerning veterinary school faculty, students and applicants and represents the most frequently requested data from the AAVMC.
• This report includes, but is not limited to, a collection of data compiled through an internal members-only survey conducted each fall. The 28 colleges and schools of veterinary medicine in the United States were surveyed. A final report is distributed exclusively to participating members of the AAVMC in December. The Annual Data Report features data on faculty and students from the 28 colleges and schools in the United States.

FACULTY DATA

Total number of faculty = 3862
3.3%
56.0%
23.4%
17.3%
0.0%
10.0%
20.0%
30.0%
40.0%
50.0%
60.0%
Faculty Administrators Tenured/Tenure Track Faculty Non-Tenure Faculty: Clinical Non-Tenure Faculty: Non-clinical
Per
cen
tage
of
Tota
l Fac
ult
y
Faculty Type
Distribution of Faculty at US Schools and Colleges of Veterinary Medicine
AAVMC Internal Reports2014

2014 Total number of women faculty = 13062014 Total number of women faculty = 1577
31.3%
54.1%
43.3%
23.5%
37%33.3%
57.9%
43.3%
34.1%
40.8%
0%
10%
20%
30%
40%
50%
60%
70%
80%
Tenure/Tenure TrackFaculty
Non-Tenure Faculty: ClinicalAll Ranks
Non-Tenure Faculty: Non-Clinical All Ranks
Faculty Administrators Total Percentage of WomenFaculty
Per
cen
tage
of
Facu
lty
by
Typ
e
Academic Position Type
Change in the Presence of Women Faculty at US Colleges of Veterinary Medicine
by Position TypeAAVMC Internal Reports
2009-2014
2009 2014
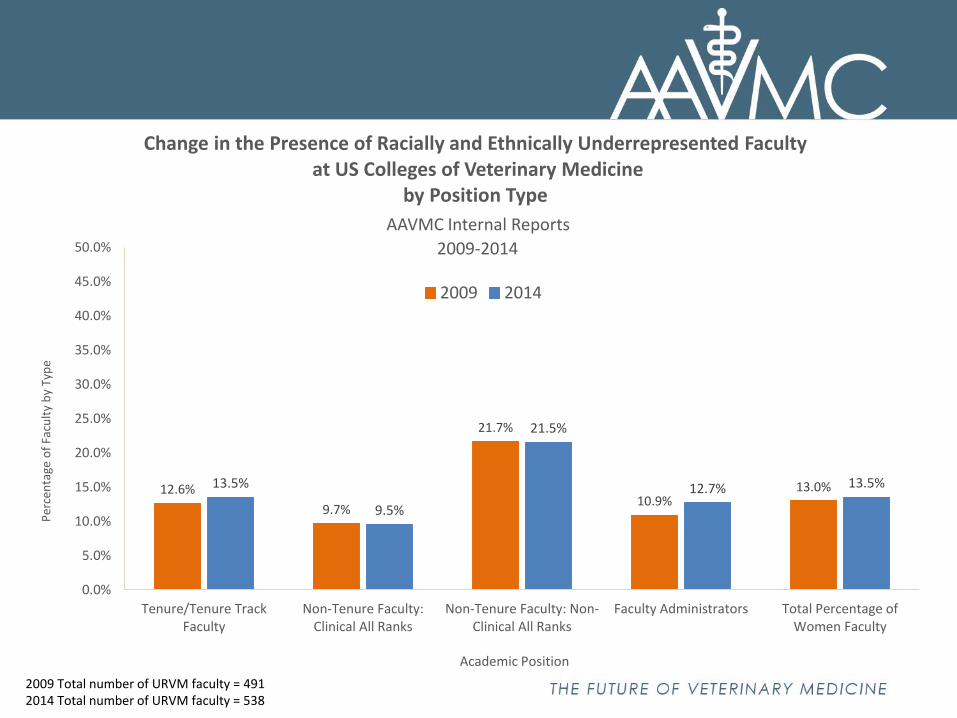
2009 Total number of URVM faculty = 4912014 Total number of URVM faculty = 538
12.6%
9.7%
21.7%
10.9%13.0%13.5%
9.5%
21.5%
12.7% 13.5%
0.0%
5.0%
10.0%
15.0%
20.0%
25.0%
30.0%
35.0%
40.0%
45.0%
50.0%
Tenure/Tenure TrackFaculty
Non-Tenure Faculty:Clinical All Ranks
Non-Tenure Faculty: Non-Clinical All Ranks
Faculty Administrators Total Percentage ofWomen Faculty
Per
cen
tage
of
Facu
lty
by
Typ
e
Academic Position
Change in the Presence of Racially and Ethnically Underrepresented Faculty at US Colleges of Veterinary Medicine
by Position Type
AAVMC Internal Reports
2009-2014
2009 2014

STUDENT RELATED DATA
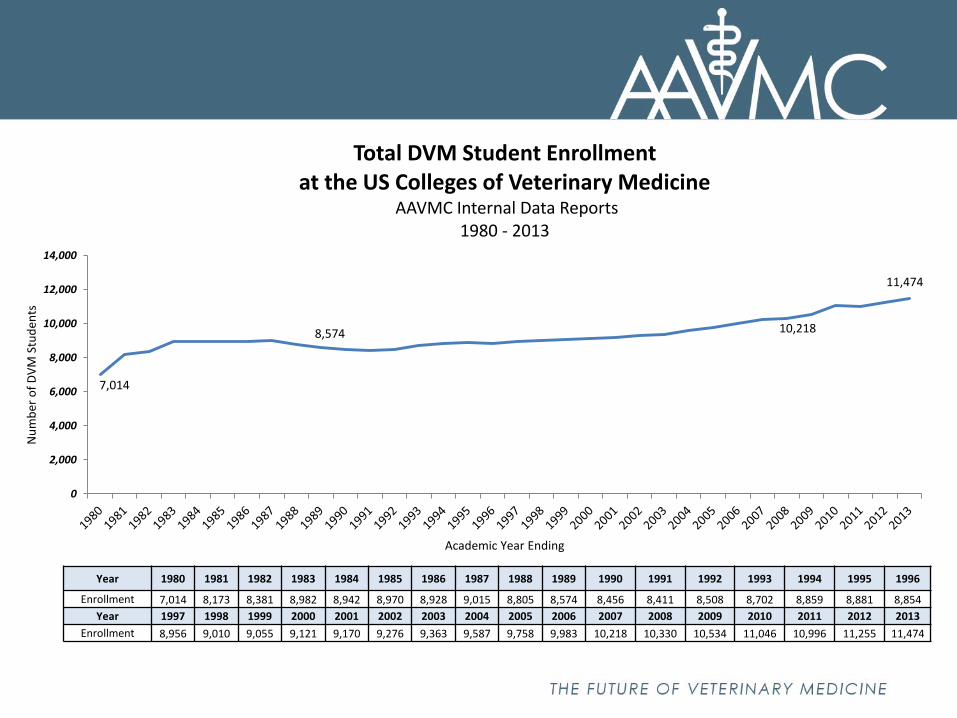
7,014
8,574 10,218
11,474
0
2,000
4,000
6,000
8,000
10,000
12,000
14,000
Nu
mb
er o
f D
VM
Stu
den
ts
Academic Year Ending
Total DVM Student Enrollmentat the US Colleges of Veterinary Medicine
AAVMC Internal Data Reports1980 - 2013
Year 1980 1981 1982 1983 1984 1985 1986 1987 1988 1989 1990 1991 1992 1993 1994 1995 1996
Enrollment 7,014 8,173 8,381 8,982 8,942 8,970 8,928 9,015 8,805 8,574 8,456 8,411 8,508 8,702 8,859 8,881 8,854
Year 1997 1998 1999 2000 2001 2002 2003 2004 2005 2006 2007 2008 2009 2010 2011 2012 2013
Enrollment 8,956 9,010 9,055 9,121 9,170 9,276 9,363 9,587 9,758 9,983 10,218 10,330 10,534 11,046 10,996 11,255 11,474

Year 1980 1981 1982 1983 1984 1985 1986 1987 1988 1989 1990 1991 1992 1993 1994 1995 1996
Enrollment 2,027 2,254 2,247 2,320 2,247 2,281 2,279 2,207 2,208 2,194 2,193 2,195 2,258 2,296 2,276 2,283 2,334
Year 1997 1998 1999 2000 2001 2002 2003 2004 2005 2006 2007 2008 2009 2010 2011 2012 2013
Enrollment 2,326 2,299 2,361 2,381 2,382 2,406 2,488 2,570 2,570 2,657 2,704 2,766 2,793 2,843 2,933 3,013 2,981
2,027
2,279
2,193
2,299
2,570
2,981
1,500
1,700
1,900
2,100
2,300
2,500
2,700
2,900
3,100
Tota
l Nu
mb
er o
f Fi
rst
Year
DV
M S
tud
ents
Academic Year
First Year DVM Student Enrollment at the US Colleges of Veterinary Medicine
AAVMC Internal Reports1980-2013

Year 1980 1981 1982 1983 1984 1985 1986 1987 1988 1989 1990 1991 1992 1993 1994 1995 1996
Graduates 1,746 1,931 1,969 2,011 2,138 2,151 2,103 2,219 2,220 2,139 2,117 2,166 2,212 2,074 2,065 2,126 2,130
Year 1997 1998 1999 2000 2001 2002 2003 2004 2005 2006 2007 2008 2009 2010 2011 2012 2013
Graduates 2,170 2,165 2,185 2,175 2,171 2,186 2,209 2,307 2,263 2,326 2,466 2,485 2,499 2,547 2,603 2,687 2686
1,746
2,219
2,209
2,686
1,200
1,400
1,600
1,800
2,000
2,200
2,400
2,600
2,800
3,000
3,200
Nu
mb
er
of
Gra
du
ate
s
Year of Graduation
Total Number of Graduates from US Colleges of Veterinary Medicine
AAVMC Internal Data Reports1980-2013

264
175
143
11099
8070
6050
41
2010
5 1 00
50
100
150
200
250
300
CA TX FL NY IL
OH PA
GA
NC
CO MI
WI
MD
VA
TN NJ
LA WA
MN IA
MA
MO
OK IN AL
OR CT
KY KS
AZ
MS
SC AR
UT
NM PR
NV
WV
ND HI
ID MT
SD NH
WY
VT
DE
NE
ME RI
DC VI
AK
Enrolled First Year Students by State*Residency at the Time of Application
American Students OnlyAAVMC Internal Reports
2014
*Includes enrollees from US territories and the District of Columbia.

89.0%
66.2%
51.1%
23.2%
20.4%
11.0%
33.8%
49.5%
76.8%
79.6%
0.0%
10.0%
20.0%
30.0%
40.0%
50.0%
60.0%
70.0%
80.0%
90.0%
100.0%
19
70
19
71
19
72
19
73
19
74
19
75
19
76
19
77
19
78
19
79
19
80
19
81
19
82
19
83
19
84
19
85
19
86
19
87
19
88
19
89
19
90
19
91
19
92
19
93
19
94
19
95
19
96
19
97
19
98
19
99
20
00
20
01
20
02
20
03
20
04
20
05
20
06
20
07
20
08
20
09
20
10
20
11
20
12
20
13
20
14
Per
cen
tage
of
Tota
l En
rollm
ent
Academic Year
Enrollment in the US Veterinary Medical CollegesBy Sex
AAVMC Internal Reports1970-2013
Men Women

3.8%3.9%
4.6%5.2%5.8%6.1%6.3%6.8%7.0%
7.8%9.1%9.7%
10.3%10.8%
11.5%11.5%11.8%12.3%12.5%
13.2%13.5%13.7%
15.0%15.4%
17.1%18.4%18.9%
30.3%35.5%
76.6%
0.0% 10.0% 20.0% 30.0% 40.0% 50.0% 60.0% 70.0% 80.0% 90.0%
TENN
OSU
KSU
ISU
MIN
MIS
UMO
PENN
AUB
ORE
LSU
ILL
WIS
VMR
US Median
UGA
WSU
NCSU
TAMU
OKL
US Total
MSU
TUF
CSU
FLA
COR
PUR
UCD
WES
TUS
Presence of Racially and Ethnically Underrepresented Students at US Colleges of Veterinary Medicine
AAVMC Internal Reports2013 - 2014
Underrepresented in Veterinary Medicine (URVM) is defined as populations of individuals whose advancement in the veterinary medical profession has historically been disproportionately impacted
by six specific aspects of diversity (gender, race, ethnicity, geographic, socioeconomic, and educational disadvantage) due to legal, cultural, or social climate impediments.
Students who are of Asian descent are considered underrepresented in the veterinary medical profession and are included in the calculations for this bar graph.

3.53
3.53
3.55
3.54
3.57 3.57 3.57
3.59
3.59
3.60
3.59
3.48
3.5
3.52
3.54
3.56
3.58
3.6
3.62
2004 2005 2006 2007 2008 2009 2010 2011 2012 2013 2014
Ave
rage
GP
A
Academic Year Ending
1st Year Student Pre-Veterinary Grade Point Average10 Year Trend
AAVMC Internal Data Reports2002-2014

Additional Data
• Attrition Rates:• 2013 National Attrition Rate = .82%
• Class of 2016 - First Year Attrition Rate = 1.8%
• Class of 2013 (Recent Graduates) - Attrition Rate =1.7%
APPLICANT DATA

76.0% 76.2% 76.9% 77.4% 76.8% 78.0%
20.2% 19.7% 19.2% 18.2% 18.7% 17.5%
3.8% 4.0% 3.8% 4.4% 4.4% 4.4%
0.0%
10.0%
20.0%
30.0%
40.0%
50.0%
60.0%
70.0%
80.0%
90.0%
100.0%
2009 2010 2011 2012 2013 2014
VMCAS Applicants by Sex AAVMC Internal Data
2009 - 2014Women Men Unknown

4,453 4,581
5,194
5,7405,920
6,208 6,143 6,265 6,305
6,766 6,732
2,302 2,304 2,389 2,449 2,503 2,514 2,507 2,660 2,735 2,711
3,196
1.93 1.992.17
2.34 2.372.47 2.45
2.36 2.312.50 2.1
0.00
0.50
1.00
1.50
2.00
2.50
3.00
3.50
4.00
0
1,000
2,000
3,000
4,000
5,000
6,000
7,000
8,000
2002 2003 2004 2005 2006 2007 2008 2009 2010 2011 2012 2013 2014
Ap
plic
an
t to P
ositio
n R
atio
Nu
mb
er
of
Po
sitio
ns &
Ap
plic
an
ts
Veterinary College Applicants and Available First Year PositionsVMCAS Participating Institutions Only*
AAVMC Internal Reports2003-2013
Individual Applicants First Year Positions Applicant to Position Ratio
*This data represents only VMCAS applicants. VMCAS currently seats 90.5% of first year seats at the US colleges of veterinary medicine. The Fall 2014 (Class of 2018) ratio is projected; it includes first year seats created by the recent additions of Colleges of Veterinary Medicine at Midwestern University and Lincoln Memorial University. This data includes available seats at all VMCAS participating institutions, including non-US colleges of veterinary medicine.

3.3
2.8
2.4
2.1 1.9
1.8
2.02.3
2.8
2.9
2.9
1.0
1.5
2.0
2.5
3.0
3.5
4.0
1980 1981 1982 1983 1984 1985 1986 1987 1988 1989 1990 1991 1992 1993 1994 1995 1996 1997 1998 1999
Veterinary Medical College Applicants to Available First Year Seats (Presented as ratio figures)
AAVMC Internal ReportsHistorical Data
1980 - 1999

Additional Applicant Information
• Average Years of Pre-professional Preparation:
• 4.3 Years
• GRE Scores – Class of 2017
• Average Verbal Percentile= 68
• Average Quantitative Score = 61
• Degree status of Class of 2017 at admission– No Degree Completed = 10.4%
– BS/BA Completed = 82.6%
– MS/MA Competed = 5.6%
– PhD Completed = 1.2%
• Applicant Age
• 21-year-olds represent 28% of 2013 applicants
• 22-year-olds represent 19% of 2013 applicants
• 25-30 year olds represent over 16% of 2013 applicants

TUITION DATA
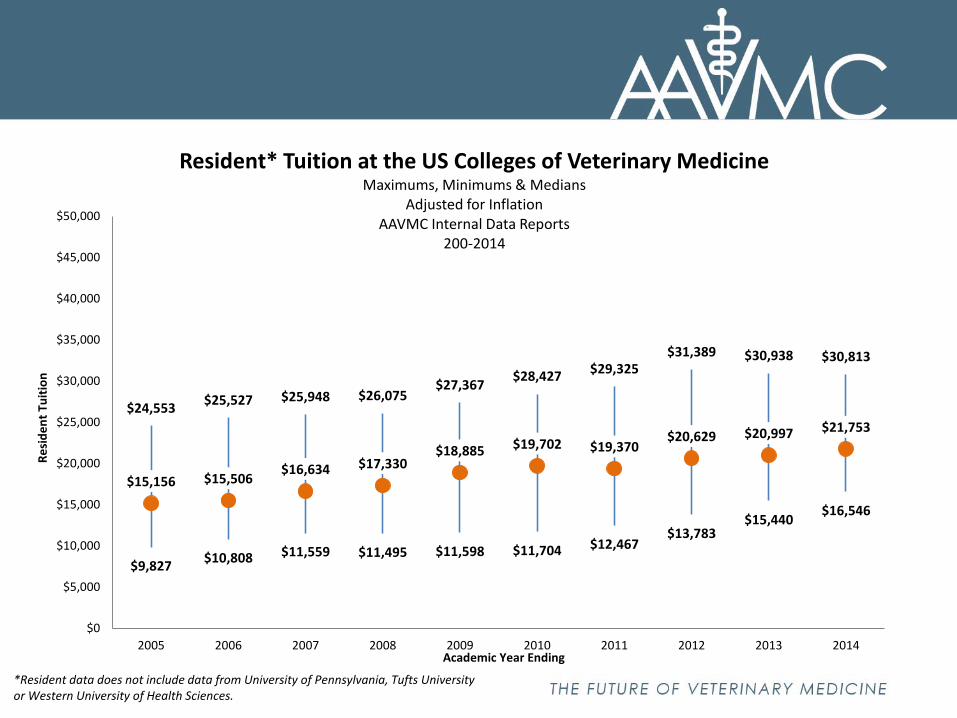
*Resident data does not include data from University of Pennsylvania, Tufts University or Western University of Health Sciences.
$9,827$10,808 $11,559 $11,495 $11,598 $11,704 $12,467
$13,783$15,440
$16,546
$24,553$25,527 $25,948 $26,075
$27,367$28,427
$29,325$31,389 $30,938 $30,813
$15,156 $15,506$16,634 $17,330
$18,885 $19,702 $19,370$20,629 $20,997 $21,753
$0
$5,000
$10,000
$15,000
$20,000
$25,000
$30,000
$35,000
$40,000
$45,000
$50,000
2005 2006 2007 2008 2009 2010 2011 2012 2013 2014
Re
sid
en
t Tu
itio
n
Academic Year Ending
Resident* Tuition at the US Colleges of Veterinary MedicineMaximums, Minimums & Medians
Adjusted for InflationAAVMC Internal Data Reports
200-2014

$12,212 $12,050 $12,304 $11,734 $13,136 $13,136 $12,734
$16,984 $17,148
$25,899
$49,837$52,513
$54,856$56,993
$60,448$62,790 $61,746
$63,446 $62,339 $62,083
$35,635$37,873 $38,324 $38,957 $40,441
$42,548 $43,157 $43,768 $44,708 $45,910
$0
$10,000
$20,000
$30,000
$40,000
$50,000
$60,000
$70,000
$80,000
$90,000
2005 2006 2007 2008 2009 2010 2011 2012 2013 2014
No
n-R
esi
de
nt
Tuit
ion
Academic Year Ending
Non-Resident Tuition at the US Colleges of Veterinary MedicineMaximums, Minimums & Medians
Adjusted for InflationAAVMC Internal Data Reports
2005-2014

Please Direct Inquiries to: Lisa Greenhill
Associate Executive Director
for Institutional Research & Diversity
This report should be cited as:
Annual Data Report 2013-2014 [Internet]. Washington, DC: Association of American
Veterinary Medical Colleges; 2014 March p. 1 - 24. Available from:
http://www.aavmc.org/About-AAVMC/Public-Data.aspx