Embed Size (px)
Citation preview

1
Annual Business Survey 2017
9 October 2017
Survey Report

2
Small 40.9%
Micro 31.1%
Large 5.6%
Medium 22.4%
Construction11.5%
Manufacturing 20.8%
Services67.7%
Voices from Business Community
▪ 710 respondents▪ Covered all sectors,
including manufacturing, construction and services
▪ Survey period: May-July 2017

3
Key Business Challenges
4
67.7%
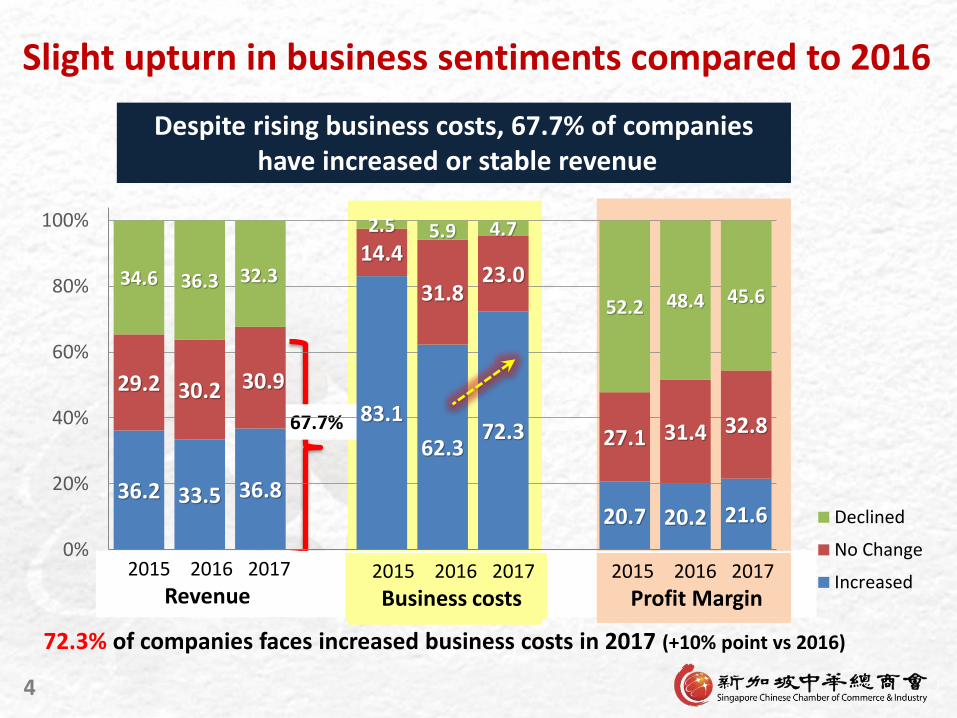
Slight upturn in business sentiments compared to 2016
72.3% of companies faces increased business costs in 2017 (+10% point vs 2016)
Despite rising business costs, 67.7% of companieshave increased or stable revenue
36.2 33.5 36.8
83.1
62.372.3
20.7 20.2 21.6
29.2 30.2 30.9
14.4
31.823.0
27.1 31.4 32.8
34.6 36.3 32.3
2.5 5.9 4.7
52.2 48.4 45.6
0%
20%
40%
60%
80%
100%
Rev 2015Rev 2016Rev 2017 Biz Cost 2015Biz Cost 2016Biz Cost 2017Profit M 2015Profit M 2016Profit M 2017
Declined
No Change
Increased2015 2016 2017
Business costs2015 2016 2017
Profit Margin
2015 2016 2017
Revenue

5
NA
0.0%
27.6%
23.1%
50.7%
58.2%
74.9%
20.4%
21.7%
24.7%
24.7%
46.0%
56.7%
68.4%
0% 20% 40% 60% 80%
Financing and cash flow
Challenges from disruptive technology
Sector facing restructuring
Stiff competition in overseas markets
Manpower shortage
Stiff competition in Singapore market
Rising business cost
2017
2016
Top Business ChallengesRising cost, Stiff competition & Manpower shortage
Business challenges

6
Rising Business CostsRental cost has eased but Compliance cost crept up
11.3%
33.3%
42.0%
53.0%
34.0%
73.5%
21.7%
31.5%
21.0%
58.2%
55.7%
72.0%
20.3%
21.9%
27.8%
50.5%
54.2%
74.4%
0% 20% 40% 60% 80%
Financing costs / interest payment
Transport costs (COE, ERP, road tax)
Govt compliance costs / admin fees
Rental costs
Cost of goods, raw material, equipment
Employees’ salary (excluding worker levies)
2017
2016
2015
Business costs
+6.8% pt
-7.7% pt

7
Taking positive steps to manage business concernsFind opportunities in new markets and Innovate
20.1%
45.5%
49.2%
53.8%
57.1%
0% 10% 20% 30% 40% 50% 60%
Use shared facilities & services /outsource non core business activities
Business restructuring / change businessmodel
Cost-cutting measures
Step up to find opportunity in newgrowth markets
Innovate products and services
2017
Strategies adopted to manage business concerns
Innovate products and services
Step up to find opportunity in new growth markets
Cost-cutting measures
Business restructuring / change business model
Use shared facilities & services / outsource non core biz activities

8
Productivity Efforts

9
87.5%
89.6%
95.7%
85.9%
92.0%
95.9%93.8%
90.5%
70%
75%
80%
85%
90%
95%
Overall MFG CONST SVC
2015 2016 2017
92% adopted Productivity Improvement Measures
Percentage of companies that have adopted productivity measures Overall +4.5%MFG +6.3%CONST -1.9%SVC +4.6%
+6.3%

10
87.5% 87.5%
85.1%
94.2%
95.5%
92.0%
87.7%
92.7%
95.5% 94.9%
70%
75%
80%
85%
90%
95%
Overall Micro Small Medium Large
2015
2016
2017
Percentage of companies that have adopted productivity measures
Overall +4.5%Micro +0.2%Small +7.6%Medium +1.3%Large -0.6%
< $1m $1m-10m >$10m to 100m > $100m
Company size by annual revenue band
More “small SMEs” embark on productivity improvement

11
Most Common Productivity Measures
Training & Changing Business Model
2017 20162017
vs 2016
Upgrade skill sets of workers through training 57.5% 43.6% +13.9%
Change business and management model 51.7% 47.9% +3.8%
Undertake higher value-added activities 34.5% 32.5% +2.0%
Adopt digital technologies (e-Commerce) 34.4%38.1%
NA
Adopt industrial automation 24.3% NA
Learn from successful examples from overseas 18.6% 15.0% +3.6%
Engage consultants on productivity improvement projects 10.8% 20.5% -9.7%
More businesses are upgrading their workers’ skills, changing business model and undertaking higher value-added activities

12
Effectiveness of Productivity Drive (1/3)
89% see a small extent of improvement or better
10.7% 57.6% 28.7% 3.0%
Not at all Small extent Moderate extent Great extent
89.3% of SMEs see at least a small extent of improvement or better*
*moderate extent / great extent

13
2.6%
4.5%
10.4%
16.9%
10.7%
48.7%
49.7%
60.1%
61.6%
57.6%
41.0%
40.1%
27.8%
19.6%
28.7%
7.7%
5.7%
1.7%
1.8%
3.0%
Not at all Small extent Moderate extent Great extent
Overall
Micro
Small
Medium
Large
Effectiveness of Productivity Drive (2/3)
Larger companies tend to get better results
Micro and small companies need more help to close the gap between their productivity effort and outcome
48.7% of large companies see moderate/great extent of improvement vs 21.4% (micro), 29.5% (small), 45.8% (medium) enterprises

14
6.8%
4.9%
12.8%
10.7%
49.0%
64.2%
59.2%
57.6%
37.4%
28.4%
26.1%
28.7%
6.8%
2.5%
1.9%
3.0%
Not at all Small extent Moderate extent Great extent
Overall
Services
Construction
Manufacturing
Effectiveness of Productivity Drive (3/3)
Manufacturing Sector sees better results
Scope for Services and Construction companies to achieve greater improvement in their productivity effort
44.2% from Manufacturing sector see moderate/great extent of improvement, vs 28.0% (services sector) and 30.9% (construction sector)

15
Findings on manpower

16
Notwithstanding a challenging economySMEs are keeping their Workforce
26.6% 25.7% 27.9%
57.1% 59.7% 55.5%
16.3% 14.6% 16.6%
0%
20%
40%
60%
80%
100%
MP 2015 MP 2016 MP 2017
Declined
No Change
Increased
2015 2016 2017
Staff Strength

17
Key manpower challenges
Difficult to attract and retain staffUnable to find staff with the right skills
19.6%
23.0%
47.2%
59.7%
0% 10% 20% 30% 40% 50% 60% 70%
Lack of suitable industry-specific training
Job re-design for business transformation
Not able to recruit staff with skills needed
Attract and retain staff

18
CFE Recommendations &
Govt Assistance Schemes

19
Top interests of businesses in CFE recommendations
Adopt Digital Tech, Innovate, Go Global
Recommendations from the Committee on the Future Economy %
Helping SMEs to adopt digital technologies 42.4%
Promoting innovation 41.3%
Promoting internationalization in a bigger way 34.7%
Facilitating workers to acquire and apply deep skills 34.0%
Creating a regulatory environment to support innovation 31.0%
Encouraging large enterprises to partner with small enterprises to help them scale up
27.7%
Implementing Industry Transformation Maps 17.7%
Businesses find implementing the Industry Transformation Maps to be of the least concern to them

20
9% increase in businesses who haveapplied for Govt schemes to transform & upgrade
61.7%
71.7%
68.1%
59.3%
70.4%
86.9%
77.8%
64.1%
40%
45%
50%
55%
60%
65%
70%
75%
80%
85%
90%
95%
Overall MFG CONST SVC
2015
2016
2017
+8.7%
Percentage of companies that have applied for Govt Schemes
Manufacturing sector has highest take-up rate in govt schemes
Overall +8.7%MFG +15.2%CONST +9.7%SVC +4.8%
+15.2%

21
More larger-sized companies adopted Govt Schemes
61.7%
49.7%
69.9%
79.1%
70.4%
46.6%
78.5%
89.2%
20%
30%
40%
50%
60%
70%
80%
90%
Overall Micro Small Medium
2015
2016
2017
+8.7%
+8.6%
+10.1%
Percentage of companies that have applied for Govt Schemes
Micro enterprises need to transform but lagging behind in adopting Government schemes
-3.1%

22
PIC remains the top scheme with increased usage of training schemes
Government Schemes 2017* 2016* 2017 vs 16
PIC and PIC+ Scheme for SMEs [IRAS] 85.4% 88.4% -3.0%
Training subsidies, Enterprise Training Support, WorkPro [WDA] 46.9% 41.9% +5.0%
Innovation & Capability Voucher (ICV) [SPRING] 32.9% 41.7% -8.8%
Capability Development Grant (CDG) [SPRING] 19.3% 18.9% +0.4%
Double Tax Deduction for internationalisation [IE Singapore] 11.6% 8.2% +3.4%
Market Readiness Assessment Grant [IE Singapore] 7.9% 4.6% +3.0%
iSPRINT – Funding for IT adoption [iDA] 5.9% 12.5% -6.6%
Micro-Loan Programme [SPRING] 4.7% 8.0% -3.3%
Global Company Partnership [IE Singapore] 4.1% 2.7% +1.4%
Internationalisation Finance Scheme [IE Singapore] 2.0% 0.7% +1.3%
GET-Up, Technology Adoption Program [A*STAR and partners] 1.4% 1.8% -0.4%
*2017: Among the 70.4 of respondents who have applied for govt schemes*2016: Among the 61.7% of respondents who have applied for govt schemes

23
Internationalisation

24
Top 3 overseas markets:
Malaysia, China & Indonesia
▪ 61% respondents indicated that they will venture overseas over the next 3 years (2016: 57%)
Rank Countries 2017 2016 2015 2017 vs 2016
1 Malaysia 55.3% 53.8% 40.8% +1.5%
2 China 46.7% 48.4% 43.6% -1.7%
3 Indonesia 46.0% 42.4% 33.0% +3.6%
4 Vietnam 31.4% 34.0% 21.3% -2.6%
5 Myanmar 28.6% 33.0% 17.8% -4.4%
6 Thailand 26.0% 28.8% 19.3% -2.8%
7 Cambodia 19.3% 23.1% 13.5% -3.8%
8 Australia / NZ 13.0% -- -- --
9 India 11.6% 16.1% 10.0% -4.5%
25
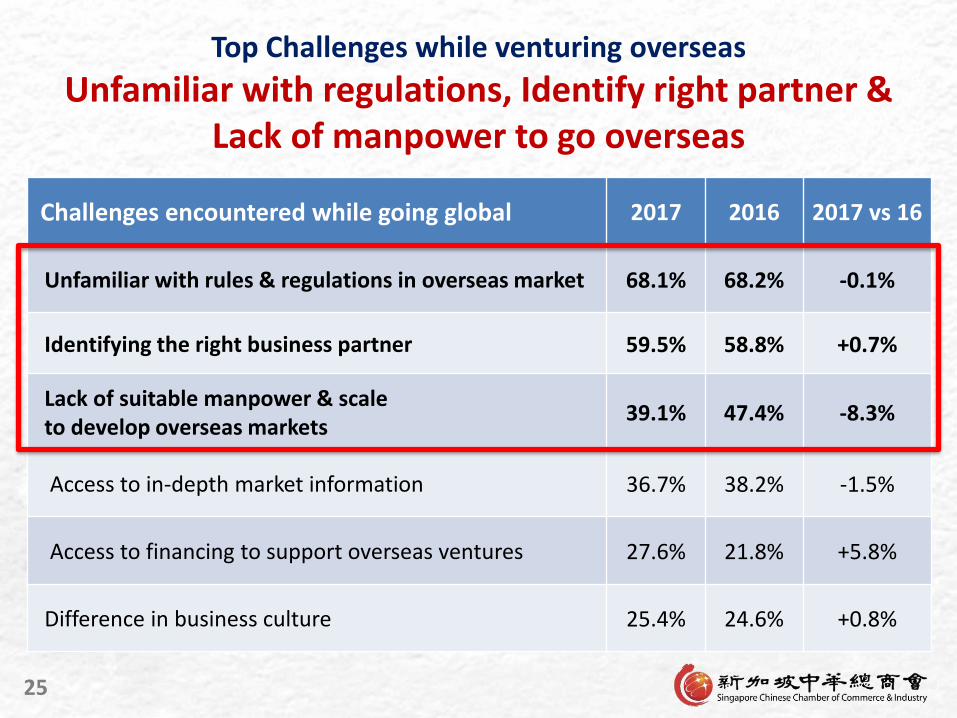
Challenges encountered while going global 2017 2016 2017 vs 16
Unfamiliar with rules & regulations in overseas market 68.1% 68.2% -0.1%
Identifying the right business partner 59.5% 58.8% +0.7%
Lack of suitable manpower & scale to develop overseas markets
39.1% 47.4% -8.3%
Access to in-depth market information 36.7% 38.2% -1.5%
Access to financing to support overseas ventures 27.6% 21.8% +5.8%
Difference in business culture 25.4% 24.6% +0.8%
Top Challenges while venturing overseas
Unfamiliar with regulations, Identify right partner &Lack of manpower to go overseas

26
27.2%
28.1%
45.0%
29.6%
57.7%
61.5%
24.6%
21.8%
38.2%
47.4%
58.8%
68.2%
25.4%
27.6%
36.7%
39.1%
59.5%
68.1%
0% 20% 40% 60% 80%
Diff in biz culture
Financing
Market Info
Suitable manpower
Biz Partners
Rules and regulations
2017
2016
2014
+5.8% pt
-8.3% pt
Top Challenges while venturing overseas
More difficult to access financingbut easier to find manpower
Unfamiliar with rules and regulations in overseas market
Identifying the right business partner
Lack of suitable manpower & scale to develop overseas markets
Access to in-depth market information
Access to financing to support overseas ventures
Difference in business culture

27
Digitalisation

28
▪ 220 respondents▪ Covered all sectors,
including manufacturing, construction and services
Small
33.1%
Micro 41.3%
Large 5.8%
Medium 19.8%
Construction6.4%
Manufacturing13.3%
Services80.4%
Respondents Profile

29
Have you digitalized your business?
49%
51%
30% 35% 40% 45% 50% 55% 60%
Yes
No
39%
61%
0% 20% 40% 60% 80%
Yes
No
Have you adopted E-commerce for your business?
Scope for more businesses to digitalize and adopt E-commerce

30
Key challenges during digitalization process or when deciding to go digital
9%
12%
17%
25%
30%
32%
42%
49%
0% 10% 20% 30% 40% 50% 60%
Competing interest with current business
Lack of management support
Current business processes too complicated fordigitalisation
Uncertain about the outcome of digitalisation
Uncertain about which areas to digitalise
Difficulties in finding the right vendors
Lack of resources (e.g. manpower, skills, time) todigitalise
Cost is too high
Key challenges in going digital: Cost and Resource constraint

31
Estimated percentage of sales deriving from E-commerce
20%
28%
18%
16%
18%
0% 5% 10% 15% 20% 25% 30% 35% 40%
Below 1%
1%-5%
>5% to 10%
>10% to 20%
More than 20%
Room for sales generated through E-commerceto improve

32
25%
62%
63%
75%
38%
37%
0% 20% 40% 60% 80%
The cost is too high
I am from traditional trade,"business as usual" is good
enough
E-commerce is notapplicable/relevant to my
business
Agree
Disagree
I am not planning to adopt E-commerce because…
24%
13%
76%
87%
0% 50% 100%
I don't know how tostart
I don't have theexpertise in my
company toexecute
Agree
Disagree
I am planning to adopt E-commerce but…
Businesses wanted to adopt E-commerce but don’t know how to start, lack expertise and
concerned about costs

33
Conclusion &
Recommendations

34
▪ Business sentiments have slightly improved compared to 2016, although 72% of businesses indicated that their costs have increased.
▪ Rising business costs, stiff competition in Singapore and manpower shortage are the top concerns from businesses
• Employee costs have risen;• Rental cost has eased but compliance cost has crept up.
▪ More than half of the businesses are taking positive steps to find opportunities in new markets and to innovate their products and services.
▪ About 90% of businesses indicated that their productivity improvement efforts have shown a small extent of results or better.
• Larger companies tend to reap better productivity results.
▪ Top manpower challenges for businesses are attracting and retaining staff and not able to recruit staff with the right skills.
Conclusion (1/2)

35
▪ Helping SMEs to adopt digital technologies, innovation and internationalization are the top interests of businesses among the recommendations in the Committee on the Future Economy (CFE).
• Businesses find implementing the Industry Transformation Maps to be of the least concern to them.
▪ A 9% increase in businesses who have applied for government schemesto transform and upgrade.
• This is aligned with the increase in businesses who have tapped on training schemes to upgrade their workers’ skills set as a key approach to increase productivity.
▪ Many companies have yet to digitize or adopt e-commerce for their business. They do not know how to start, lack expertise and are concerned about the costs.
Conclusion (2/2)

36
Recommendation 1:
Extend and enhance PIC and ICV for 3 years to continue the productivity improvement momentum of businesses
▪ The Productivity & Innovation Scheme (PIC) has remained the most popular government scheme over the last 3 years for businesses in their productivity improvement efforts. PIC will lapse in 2018.
▪ The Innovation & Capability Voucher (ICV) is another government scheme that has been popular and easy to apply and use by businesses.
▪ As businesses started to witness results in their productivity improvement effort, government should consider to extend and enhance the PIC and ICV for another 3 years.

37
Recommendation 2:
Trade associations should be proactive to engage government in the implementation of Industry Transformation Maps
▪ While the Industry Transformation Maps (ITMs) is a major strategy of the CFE, very few businesses found the ITMs to be of priority to them.
▪ For the relevant trade associations who fall within the 23 ITMs, and wanted to be involved in the ITM implementation, they should proactively engage the relevant implementing government agencies to discuss specific roles and ways in which they would like to be involved, and the agencies concerned should support them.
▪ For the industry sectors without ITMs:
→ Trade associations who wanted to develop their own equivalent industry development initiatives should proactively approach the relevant government agencies to seek guidance, support and assistance in the specific areas they would like to drive/implement; or
→ Trade associations can engage the relevant implementing government agencies to find synergies and explore how they can fit within the 23 ITMs.

38
Recommendation 3:
Tackle the concerns of cost and resource constraint to speed up SMEs’ adoption of e-commerce in the digital economy
▪ Our SMEs cannot be left behind as Singapore progresses to be a Smart Nation. The digital economy and e-commerce has impacted the businesses of SMEs, especially those from the traditional sectors. Participating in the digital economy can help them to transform their businesses and find new growth opportunities.
▪ The “SME Go Digital” programme should directly tackle our SMEs’ concerns of costs, lack of expertise and resource constraint so that we can speed up the process of them leveraging on the digital economy and e-commerce to benefit their businesses.
→ Solutions supported by the programme should be cost-effective, easy to use to reduce the difficulties and complexities involved for SMEs to readily participate in e-commerce and the digital economy.

39
Recommendation 4:
Help businesses to get workers with the right skills
▪ Singapore is facing a demographic trend of shrinking local labour force that is older and more educated. While government has maintained its firm position on curbing foreign workers inflow, more local workers are also being made redundant due to the ongoing economic restructuring.
▪ Traditional sectors of the economy that are still looking to hire continue to face manpower shortages, notwithstanding their ongoing efforts to transform.
▪ Armed with the latest workforce statistics, MOM and its agencies know where workers are made redundant that can be potentially channeled to sectors with hiring needs. MOM and WSG should use these workforce statistics to help trade associations and businesses improve their recruitment effort to access these workers. Where worker re-training is required, MOM and SSG should work with trade associations and businesses, and support them in such initiatives.

40
Thank you