Embed Size (px)
Citation preview
ANNUAL BUDGET OF
NGWATHE LOCAL
MUNICIPALITY
2014/15 TO 2016/17
MEDIUM TERM REVENUE AND
EXPENDITURE FORECASTS
Copies of this document can be viewed:
In the foyers of all municipal buildings
All public libraries within the municipality
At www.ngwathe.fs.gov.za
Ngwathe Local Municipality 2014/15 Annual Budget and MTREF
May 2014 i
Table of Contents
PART 1 – ANNUAL BUDGET ...................................................................................................................... 2
1.1 MAYOR’S REPORT ....................................................................................................................................... 2
1.2 COUNCIL RESOLUTIONS .............................................................................................................................. 2
1.3 EXECUTIVE SUMMARY ................................................................................................................................. 2
1.4 OPERATING REVENUE FRAMEWORK ........................................................................................................... 4
1.5 OPERATING EXPENDITURE FRAMEWORK .................................................................................................. 14
1.6 CAPITAL EXPENDITURE .............................................................................................................................. 18
1.7 ANNUAL BUDGET TABLES - PARENT MUNICIPALITY .................................................................................. 19
2 PART 2 – SUPPORTING DOCUMENTATION ............................................................................. 38
2.1 OVERVIEW OF THE ANNUAL BUDGET PROCESS ......................................................................................... 38
2.2 OVERVIEW OF ALIGNMENT OF ANNUAL BUDGET WITH IDP ....................................................................... 41
2.3 OVERVIEW OF BUDGET RELATED-POLICIES ............................................................................................... 46
2.4 OVERVIEW OF BUDGET ASSUMPTIONS ...................................................................................................... 53
2.5 OVERVIEW OF BUDGET FUNDING ............................................................................................................... 55
2.6 COUNCILLOR AND EMPLOYEE BENEFITS .................................................................................................... 60
2.7 MONTHLY TARGETS FOR REVENUE, EXPENDITURE AND CASH FLOW ........................................................ 62
2.8 ANNUAL BUDGETS AND SDBIPS – INTERNAL DEPARTMENTS ................................................................... 69
2.9 CONTRACTS HAVING FUTURE BUDGETARY IMPLICATIONS ........................................................................ 69
2.10 CAPITAL EXPENDITURE DETAILS ................................................................................................................ 69
2.11 LEGISLATION COMPLIANCE STATUS ........................................................................................................... 74
2.12 MUNICIPAL MANAGER’S QUALITY CERTIFICATE ......................................................................................... 75
Ngwathe Local Municipality 2014/15 Annual Budget and MTREF
ii
Abbreviations and Acronyms
AMR Automated Meter Reading ASGISA Accelerated and Shared Growth
Initiative BPC Budget Planning Committee CBD Central Business District CFO Chief Financial Officer CM City Manager CPI Consumer Price Index CRRF Capital Replacement Reserve Fund DBSA Development Bank of South Africa DoRA Division of Revenue Act DWA Department of Water Affairs EE Employment Equity EEDSM Energy Efficiency Demand Side
Management EM Executive Mayor FBS Free basic services GAMAP Generally Accepted Municipal
Accounting Practice GDP Gross domestic product GDS Gauteng Growth and Development
Strategy GFS Government Financial Statistics GRAP General Recognised Accounting
Practice HR Human Resources HSRC Human Science Research Council IDP Integrated Development Strategy IT Information Technology kℓ kilolitre km kilometre KPA Key Performance Area KPI Key Performance Indicator kWh kilowatt
ℓ Litre LED Local Economic Development MEC Member of the Executive Committee MFMA Municipal Financial Management Act
Programme MIG Municipal Infrastructure Grant MMC Member of Mayoral Committee MPRA Municipal Properties Rates Act MSA Municipal Systems Act MTEF Medium-term Expenditure
Framework MTREF Medium-term Revenue and
Expenditure Framework NERSA National Electricity Regulator South
Africa NGO Non-Governmental organisations NKPIs National Key Performance Indicators OHS Occupational Health and Safety OP Operational Plan PBO Public Benefit Organisations PHC Provincial Health Care PMS Performance Management System PPE Property Plant and Equipment PPP Public Private Partnership PTIS Public Transport Infrastructure
System RG Restructuring Grant RSC Regional Services Council SALGA South African Local Government
Association SAPS South African Police Service SDBIP Service Delivery Budget
Implementation Plan SMME Small Micro and Medium Enterprises

Ngwathe Local Municipality 2014/15 Annual Budget and MTREF
2
Part 1 – Annual Budget
1.1 Mayor’s Report
To be inserted
1.2 Council Resolutions
To be inserted
1.3 Executive Summary
The application of sound financial management principles for the compilation of the Municipality’s financial plan is essential and critical to ensure that the municipality remains financially viable and that municipal services are provided sustainably, economically and equitably to all communities. The Municipality’s business and service delivery priorities were reviewed as part of this year’s planning and budget process. Where appropriate, funds were transferred from low- to high-priority programmes so as to maintain sound financial stewardship. A critical review was also undertaken of expenditures on noncore and ‘nice to have’ items. The Municipality has embarked on implementing a range of revenue collection strategies to optimize the collection of debt owed by consumers. Furthermore, the Municipality has undertaken various customer care initiatives. National Treasury’s MFMA Circular No. 70 and 72 were used to guide the compilation of the 2014/15 MTREF. The main challenges experienced during the compilation of the 2014/15 MTREF can be summarised as follows:
• The ongoing difficulties in the national and local economy; • Aging and poorly maintained water, roads and electricity infrastructure; • The need to reprioritise projects and expenditure within the existing resource envelope
given the cash flow realities and declining cash position of the municipality; • The increased cost of bulk water and electricity (due to tariff increases from Rand Water
and Eskom), which is placing upward pressure on service tariffs to residents. Continuous high tariff increases are not sustainable - as there will be a point where services will no-longer be affordable;
• Wage increases for municipal staff that continue to exceed consumer inflation, as well as the need to fill critical vacancies;
• Affordability of capital projects – Endless list of legitimate capital project to address backlogs against limited resources to fund the capital projects; and
• Availability of affordable capital/borrowing.
Ngwathe Local Municipality 2014/15 Annual Budget and MTREF
3
The following budget principles and guidelines directly informed the compilation of the 2014/15 MTREF: • The 2013/14 Adjustments Budget priorities and targets, as well as the base line
allocations contained in that Adjustments Budget were adopted as the upper limits for the new baselines for the 2014/15 annual budget;
• Intermediate service level standards were used to inform the measurable objectives, targets and backlog eradication goals;
• Tariff and property rate increases should be affordable and should generally not exceed inflation as measured by the CPI, except where there are price increases in the inputs of services that are beyond the control of the municipality, for instance the cost of bulk water and electricity. In addition, tariffs need to remain or move towards being cost reflective, and should take into account the need to address infrastructure backlogs;
• There will be no budget allocated to national and provincial funded projects unless the necessary grants to the municipality are reflected in the national and provincial budget and have been gazetted as required by the annual Division of Revenue Act;
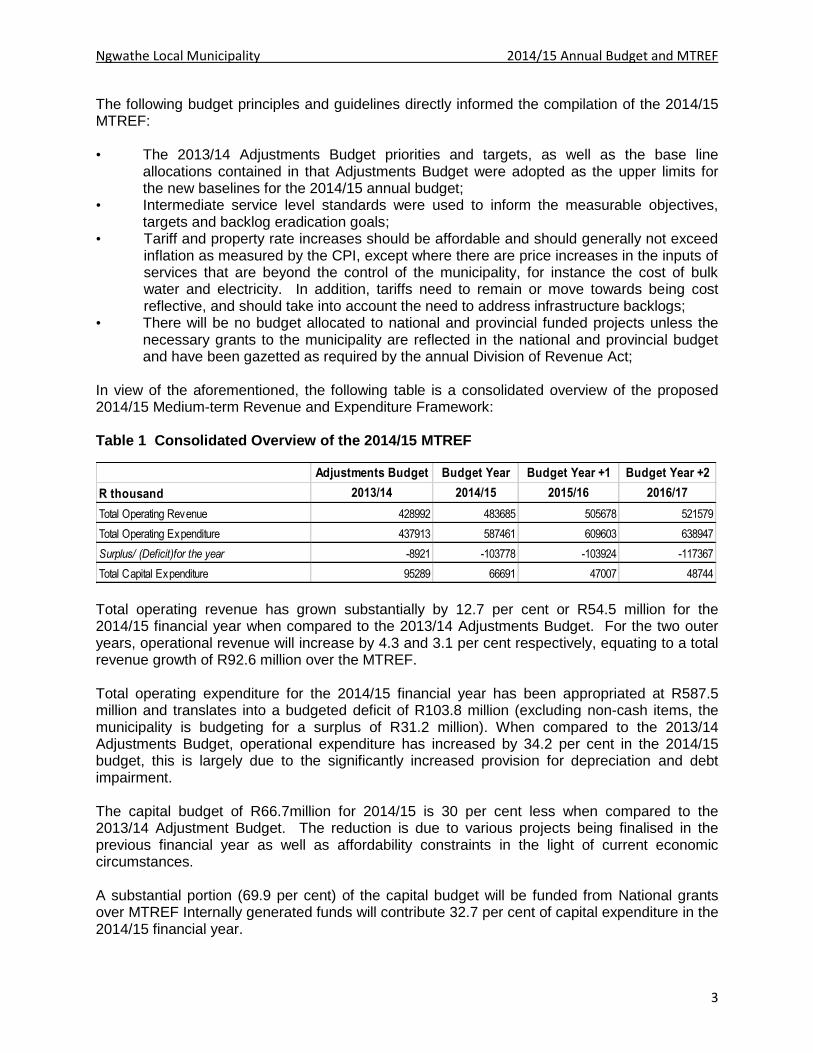
In view of the aforementioned, the following table is a consolidated overview of the proposed 2014/15 Medium-term Revenue and Expenditure Framework: Table 1 Consolidated Overview of the 2014/15 MTREF
Total operating revenue has grown substantially by 12.7 per cent or R54.5 million for the 2014/15 financial year when compared to the 2013/14 Adjustments Budget. For the two outer years, operational revenue will increase by 4.3 and 3.1 per cent respectively, equating to a total revenue growth of R92.6 million over the MTREF. Total operating expenditure for the 2014/15 financial year has been appropriated at R587.5 million and translates into a budgeted deficit of R103.8 million (excluding non-cash items, the municipality is budgeting for a surplus of R31.2 million). When compared to the 2013/14 Adjustments Budget, operational expenditure has increased by 34.2 per cent in the 2014/15 budget, this is largely due to the significantly increased provision for depreciation and debt impairment. The capital budget of R66.7million for 2014/15 is 30 per cent less when compared to the 2013/14 Adjustment Budget. The reduction is due to various projects being finalised in the previous financial year as well as affordability constraints in the light of current economic circumstances. A substantial portion (69.9 per cent) of the capital budget will be funded from National grants over MTREF Internally generated funds will contribute 32.7 per cent of capital expenditure in the 2014/15 financial year.
Adjustments Budget Budget Year Budget Year +1 Budget Year +2
R thousand 2013/14 2014/15 2015/16 2016/17
Total Operating Revenue 428992 483685 505678 521579
Total Operating Expenditure 437913 587461 609603 638947
Surplus/ (Deficit)for the year -8921 -103778 -103924 -117367
Total Capital Expenditure 95289 66691 47007 48744

Ngwathe Local Municipality 2014/15 Annual Budget and MTREF
4
1.4 Operating Revenue Framework
For Ngwathe Local Municipality to continue improving the quality of services provided to its citizens it needs to generate the required revenue. In these tough economic times strong revenue management is fundamental to the financial sustainability of the municipality. The reality is that we are faced with development backlogs and poverty. The expenditure required to address these challenges will inevitably always exceed available funding; hence difficult choices have to be made in relation to tariff increases and balancing expenditures against realistically anticipated revenues. The municipality’s revenue strategy is built around the following key components: • National Treasury’s guidelines and macroeconomic policy; • Growth in the Municipal area and continued economic development; • Sustainable revenue management, which aims to ensure a 80 per cent annual collection
rate for property rates and other key service charges; • Electricity tariff increases as approved by the National Electricity Regulator of South
Africa (NERSA); • Achievement of full cost recovery of specific user charges especially in relation to trading
services; • Determining the tariff escalation rate by establishing/calculating the revenue requirement
of each service; • The municipality’s Property Rates Policy approved in terms of the Municipal Property
Rates Act, 2004 (Act 6 of 2004) (MPRA); • The municipality’s Indigent Policy and rendering of free basic services; and • Tariff policies of the Municipality.
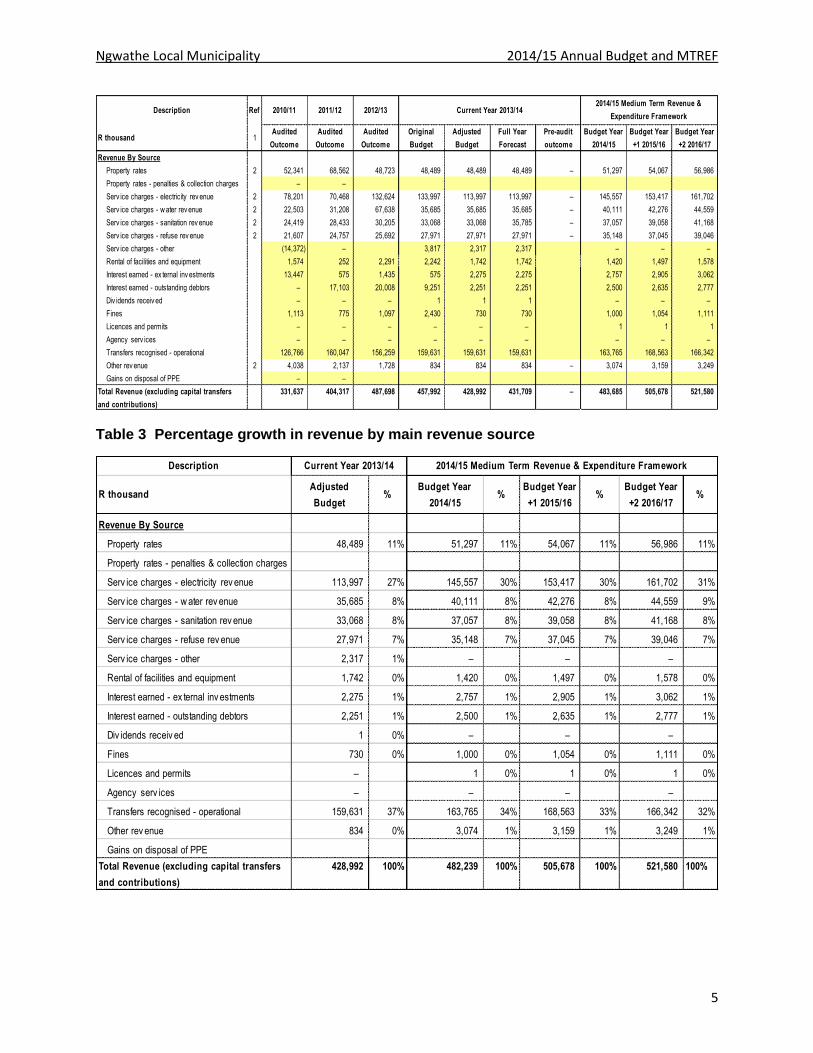
The following table is a summary of the 2014/15 MTREF (classified by main revenue source): Table 2 Summary of revenue classified by main revenue source
Ngwathe Local Municipality 2014/15 Annual Budget and MTREF
5
Table 3 Percentage growth in revenue by main revenue source
Description Ref 2010/11 2011/12 2012/13
R thousand 1Audited
Outcome
Audited
Outcome
Audited
Outcome
Original
Budget
Adjusted
Budget
Full Year
Forecast
Pre-audit
outcome
Budget Year
2014/15
Budget Year
+1 2015/16
Budget Year
+2 2016/17
Revenue By Source
Property rates 2 52,341 68,562 48,723 48,489 48,489 48,489 – 51,297 54,067 56,986
Property rates - penalties & collection charges – –
Serv ice charges - electricity rev enue 2 78,201 70,468 132,624 133,997 113,997 113,997 – 145,557 153,417 161,702
Serv ice charges - w ater rev enue 2 22,503 31,208 67,638 35,685 35,685 35,685 – 40,111 42,276 44,559
Serv ice charges - sanitation rev enue 2 24,419 28,433 30,205 33,068 33,068 35,785 – 37,057 39,058 41,168
Serv ice charges - refuse rev enue 2 21,607 24,757 25,692 27,971 27,971 27,971 – 35,148 37,045 39,046
Serv ice charges - other (14,372) – 3,817 2,317 2,317 – – –
Rental of facilities and equipment 1,574 252 2,291 2,242 1,742 1,742 1,420 1,497 1,578
Interest earned - ex ternal inv estments 13,447 575 1,435 575 2,275 2,275 2,757 2,905 3,062
Interest earned - outstanding debtors – 17,103 20,008 9,251 2,251 2,251 2,500 2,635 2,777
Div idends receiv ed – – – 1 1 1 – – –
Fines 1,113 775 1,097 2,430 730 730 1,000 1,054 1,111
Licences and permits – – – – – – 1 1 1
Agency serv ices – – – – – – – – –
Transfers recognised - operational 126,766 160,047 156,259 159,631 159,631 159,631 163,765 168,563 166,342
Other rev enue 2 4,038 2,137 1,728 834 834 834 – 3,074 3,159 3,249
Gains on disposal of PPE – –
Total Revenue (excluding capital transfers
and contributions)
331,637 404,317 487,698 457,992 428,992 431,709 – 483,685 505,678 521,580
2014/15 Medium Term Revenue &
Expenditure FrameworkCurrent Year 2013/14
Description
R thousandAdjusted
Budget%
Budget Year
2014/15%
Budget Year
+1 2015/16%
Budget Year
+2 2016/17%
Revenue By Source
Property rates 48,489 11% 51,297 11% 54,067 11% 56,986 11%
Property rates - penalties & collection charges
Serv ice charges - electricity rev enue 113,997 27% 145,557 30% 153,417 30% 161,702 31%
Serv ice charges - w ater rev enue 35,685 8% 40,111 8% 42,276 8% 44,559 9%
Serv ice charges - sanitation rev enue 33,068 8% 37,057 8% 39,058 8% 41,168 8%
Serv ice charges - refuse rev enue 27,971 7% 35,148 7% 37,045 7% 39,046 7%
Serv ice charges - other 2,317 1% – – –
Rental of facilities and equipment 1,742 0% 1,420 0% 1,497 0% 1,578 0%
Interest earned - ex ternal inv estments 2,275 1% 2,757 1% 2,905 1% 3,062 1%
Interest earned - outstanding debtors 2,251 1% 2,500 1% 2,635 1% 2,777 1%
Div idends receiv ed 1 0% – – –
Fines 730 0% 1,000 0% 1,054 0% 1,111 0%
Licences and permits – 1 0% 1 0% 1 0%
Agency serv ices – – – –
Transfers recognised - operational 159,631 37% 163,765 34% 168,563 33% 166,342 32%
Other rev enue 834 0% 3,074 1% 3,159 1% 3,249 1%
Gains on disposal of PPE
Total Revenue (excluding capital transfers
and contributions)
428,992 100% 482,239 100% 505,678 100% 521,580 100%
Current Year 2013/14 2014/15 Medium Term Revenue & Expenditure Framework

Ngwathe Local Municipality 2014/15 Annual Budget and MTREF
6
In line with the formats prescribed by the Municipal Budget and Reporting Regulations, capital transfers and contributions are excluded from the operating statement, as inclusion of these revenue sources would distort the calculation of the operating surplus/deficit. Revenue generated from rates and services charges forms a significant percentage of the revenue basket for the Municipality. Rates and service charge revenues comprise more than half the total revenue mix. In the 2013/14 financial year, revenue from rates and services charges totalled R261.5 million or 60.96 per cent. This increases to R309.1 million, R325.9 million and R343.6 million in the respective financial years of the MTREF. A notable trend is the increase in the total percentage revenue generated from rates and services charges which increases from 60.96 per cent in 2013/14 to 64.38 per cent in 2014/15. This growth can be mainly attributed to the increased share that the sale of electricity contributes to the total revenue mix, which in turn is due to rapid increases in the Eskom tariffs for bulk electricity. The above table excludes revenue foregone arising from discounts and rebates associated with the tariff policies of the Municipality. Property rates is the third largest revenue source totalling 11 per cent or R51.2 million rand and increases to R56.9 million by 2016/17. ‘Other revenue’ which consists of various items such as income received from permits and licenses, building plan fees, connection fees, transport fees and advertisement fees. Departments have been urged to review the tariffs of these items on an annual basis to ensure they are cost reflective and market related. Operating grants and transfers totals R159.6 million in the 2013/14 financial year and steadily increases to R166.3 million by 2016/17. Note that the year-on-year growth for the 2014/15 financial year is 2.5 per cent. The following table gives a breakdown of the various operating grants and subsidies allocated to the municipality over the medium term:
Table 4 Operating Transfers and Grant Receipts
Description 2010/11 2011/12 2012/13
R thousandAudited
Outcome
Audited
Outcome
Audited
Outcome
Original
Budget
Adjusted
Budget
Full Year
Forecast
Budget Year
2014/15
Budget Year
+1 2015/16
Budget Year
+2 2016/17
RECEIPTS:
Operating Transfers and Grants
National Government: 128 766 141 013 157 276 159 631 159 631 159 631 163 765 168 563 166 342
Local Gov ernment Equitable Share 126 766 137 311 153 983 156 191 156 191 156 191 160 231 165 946 163 623
EPWP Incentiv e 1 462 993 1 000 1 000 1 000 1 000 – –
Municipal Sy stems Improv ement 1 000 790 800 890 890 890 934 967 1 019
Finance Management 1 000 1 450 1 500 1 550 1 550 1 550 1 600 1 650 1 700
Other transfers/grants [insert description]
Provincial Government: – – – – – – – – –
Other transfers/grants [insert description]
District Municipality: – – – – – – – – –
[insert description]
Other grant providers: – – – – – – – – –
[insert description]
Total Operating Transfers and Grants 128 766 141 013 157 276 159 631 159 631 159 631 163 765 168 563 166 342
Current Year 2013/14 2014/15 Medium Term Revenue &
Expenditure Framework
Ngwathe Local Municipality 2014/15 Annual Budget and MTREF
7
Tariff-setting is a pivotal and strategic part of the compilation of any budget. When rates, tariffs and other charges were revised, local economic conditions, input costs and the affordability of services were taken into account to ensure the financial sustainability of the Municipality.
The percentage increases of both Eskom and Rand Water bulk tariffs are far beyond the mentioned inflation target. Given that these tariff increases are determined by external agencies, the impact they have on the municipality’s electricity and in these tariffs are largely outside the control of the Municipality. Discounting the impact of these price increases in lower consumer tariffs will erode the Municipality’s future financial position and viability.
It must also be appreciated that the consumer price index, as measured by CPI, is not a good measure of the cost increases of goods and services relevant to municipalities. The basket of goods and services utilised for the calculation of the CPI consist of items such as food, petrol and medical services, whereas the cost drivers of a municipality are informed by items such as the cost of remuneration, bulk purchases of electricity and water, petrol, diesel, chemicals, cement etc. The current challenge facing the municipality is managing the gap between cost drivers and tariffs levied, as any shortfall must be made up by either operational efficiency gains or service level reductions. Within this framework the municipality has undertaken the tariff setting process relating to service charges as follows.
1.4.1 Property Rates
Property rates cover the cost of the provision of general services. Determining the effective property rate tariff is therefore an integral part of the municipality’s budgeting process. National Treasury’s MFMA Circular No. 72 deals, inter alia with the implementation of the Municipal Property Rates Act, with the regulations issued by the Department of Co-operative Governance. These regulations came into effect on 1 July 2009 and prescribe the rate ratio for the non-residential categories, public service infrastructure and agricultural properties relative to residential properties to be 0.25:1. The implementation of these regulations was done in the previous budget process and the Property Rates Policy of the Municipality has been amended accordingly. The following stipulations in the Property Rates Policy are highlighted: • The first R15 000 of the market value of a property used for residential purposes is
excluded from the rate-able value (Section 17(h) of the MPRA). In addition to this rebate, a further R10 000 reduction on the market value of a property will be granted in terms of the Municipality’s own Property Rates Policy;
• 100 per cent rebate will be granted to registered indigents in terms of the Indigent Policy; • For pensioners, physically and mentally disabled persons, a maximum/total rebate of
100 per cent (calculated on a sliding scale) will be granted to owners of rate-able property if the total gross income of the applicant and/or his/her spouse, if any, does not to exceed the amount equal to twice the annual state pension as approved by the National Government for a financial year. In this regard the following stipulations are relevant:
- occupy the property as his/her normal residence;
- be at least 60 years of age or in receipt of a disability pension from the Department of Welfare and Population Development;
Ngwathe Local Municipality 2014/15 Annual Budget and MTREF
8
- be in receipt of a total monthly income from all sources as annually determined by the municipality (including income of spouses of owner);
- not be the owner of more than one property; and
- provided that where the owner is unable to occupy the property due to no fault of his/her own, the spouse or minor children may satisfy the occupancy requirement.
ii. Property owners must apply on a prescribed application form for a rebate as determined by the municipality. Applications must be accompanied by-
- a certified copy of the identity document or any other proof of the owners age which is acceptable to the municipality;
- sufficient proof of income of the owner and his/her spouse;
- an affidavit from the owner;
- if the owner is a disabled person proof of a disability pension payable by the state must be supplied; and
- if the owner has retired at an earlier stage for medical reasons proof thereof must be submitted. .
• The Municipality may award a 100 per cent grant-in-aid on the assessment rates of rate-
able properties of certain classes such as registered welfare organizations, institutions or organizations performing charitable work, sports grounds used for purposes of amateur sport. The owner of such a property must apply to the Chief Financial Officer in the prescribed format for such a grant.
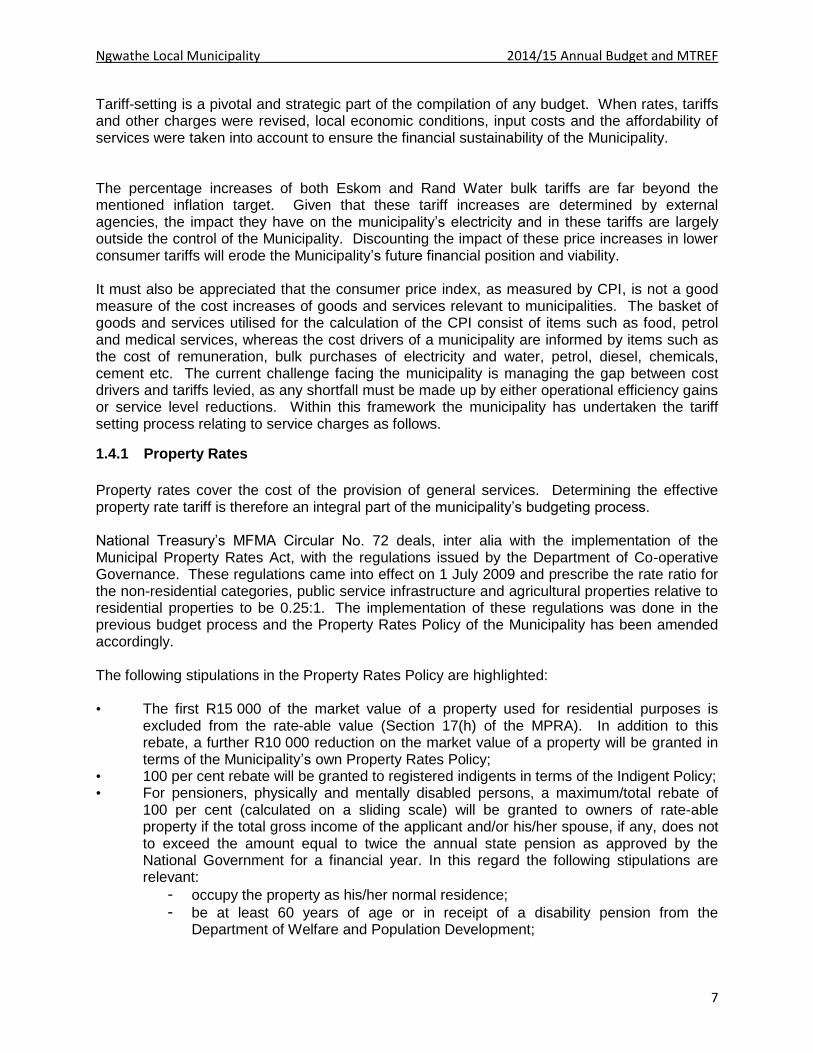
The categories of rate-able properties for purposes of levying rates and the proposed rates for the 2014/15 financial year based on a 5.79 per cent increase from 1 July 2014 is contained below:
Table 5 Comparison of proposed rates to levied for the 2014/15 financial year
Category Current Tariff (1 July 2013)
Proposed tariff (from 1 July 2014)
c C
Residential properties 0.0099 0.0105
State owned properties 0.0248 0.0263
Business & Commercial 0.0186 0.0197
Agricultural 0.0099 0.0105
Vacant land 0.0099 0.0105
Schools 0.0248 0.0263
Public service infrastructure 0.0099 0.0105
1.4.2 Sale of Water and Impact of Tariff Increases
With the current water and electricity supply challenges facing the municipality and the country at large, since demand growth outstrips supply. National Treasury has in the past encouraged all municipalities to carefully review the level and structure of their water tariffs to ensure: • Water tariffs are fully cost-reflective – including the cost of maintenance and renewal of
purification plants, water networks and the cost associated with reticulation expansion;
Ngwathe Local Municipality 2014/15 Annual Budget and MTREF
9
• Water tariffs are structured to protect basic levels of service and ensure the provision of free water to the poorest of the poor (indigent); and
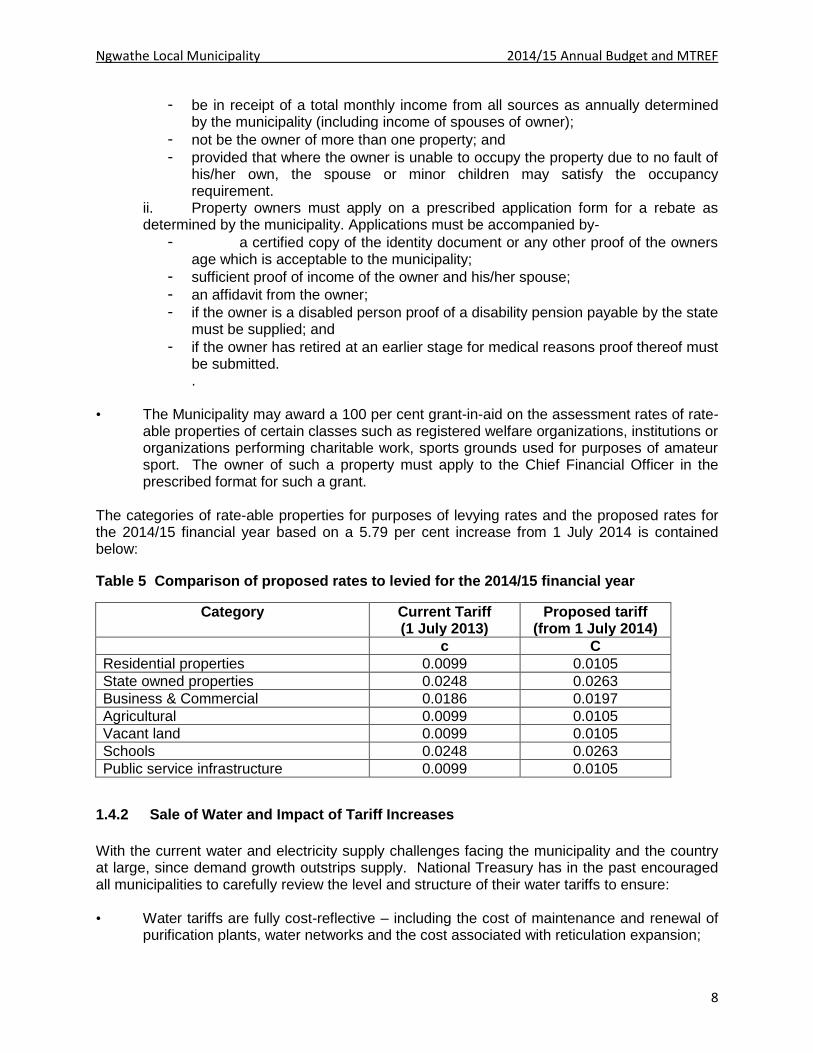
• Water tariffs are designed to encourage efficient and sustainable consumption. Better maintenance of infrastructure, new dam construction and cost-reflective tariffs will ensure that the supply challenges are managed in future to ensure sustainability. Although the municipality has increased the water tariffs by 5.79 per cent, actual growth in the anticipated revenue from the sale of water is 12 per cent, this is due to increased number in houses with water connection and the municipality’s decision to phase out the 6 kl subsidy given to non indigents. A tariff increase of 5.79 per cent from 1 July 2014 for water is proposed. This is based on input cost assumptions of the increase in the cost of bulk water (Rand Water), the cost of other inputs increasing by 6.79 per cent. In addition 6 kℓ water per 30-day period will again be granted free of charge to all residents. A summary of the proposed tariffs for households (residential) and non-residential are as follows: Table 6 Proposed Water Tariffs
1.4.3 Sale of Electricity and Impact of Tariff Increases
A proposed 7.39 per cent increase in the Eskom bulk electricity tariff to municipalities will be effective from 1 July 2014.
Schedule (b) Water Parys/Heibron/Vredefort/Koppies/Edenville
Tariffs excluding VAT Tariff Codes Services 2013/2014 2014/2015 VAT% TOTAL
Residential/Church - Conv BW001 Basic 35.82 37.89 5.31 43.20
0 - 6 Free Cons - - -
7 - 20 WA001 0 - 6 - - - -
21 - 30 WA001 7 - 20 7.23 7.65 1.07 8.72
31 - > WA001 21 - 30 7.34 7.76 1.09 8.85
31 - > 7.44 7.87 1.10 8.97
Business (per Business) BW002 Basic 115.04 121.70 17.04 138.74
WA002 Cons 7.23 7.65 1.07 8.72
Without meters BW002 Basic 115.04 121.70 17.04 138.74
- - -
Bulk/Government/Schools BW004 Basic 115.03 121.69 17.04 138.73
WA004 Cons 7.23 7.65 1.07 8.72
- - -
Industrial BW009 Basic 74.98 79.32 11.11 90.43
WA009 Cons 7.23 7.65 1.07 8.72
- - -
Small Business(Business from Home) BW010 Basic 57.07 60.38 8.45 68.83
WA015 Cons 7.23 7.65 1.07 8.72
- - -
Municipal WA005 Cons 7.23 7.65 1.07 8.72
- - -
Sewerage WA013 Cons 4.28 4.52 0.63 5.16
- - -
Unpurified WA014 Cons 4.28 4.52 0.63 5.16
- - -
Sports Organisations WA007 Cons 7.23 7.65 1.07 8.72
- - -
Vacant stands BW000 Basic 76.10 80.50 11.27 91.77

Ngwathe Local Municipality 2014/15 Annual Budget and MTREF
10
Considering the Eskom increases, the consumer tariff had to be increased by 6 per cent. Furthermore, it should be noted that given the magnitude of the tariff increase, it is expected to depress growth in electricity consumption, which will have a negative impact on the municipality’s revenue from electricity. Registered indigents will again be granted 50 kWh per 30-day period free of charge. In addition those residential customers that are not registered as indigent will receive on 5kWh free in line with the phasing out of free electricity to non-indigents strategy adopted by the municipality. The inadequate electricity bulk capacity and the impact on service delivery and development remains a challenge for the Municipality. Most of the municipality’s reticulation network was designed or strengthened in the early 1980’s with an expected 20-25 year life-expectancy. The upgrading of the Municipality’s electricity network has therefore become a strategic priority, especially the substations and transmission lines. The approved budget for the Electricity Division can only be utilised for certain committed upgrade projects and to strengthen critical infrastructure (e.g. substations without back-up supply). Owing to the high increases in Eskom’s bulk tariffs, it is clearly not possible to fund these necessary upgrades through increases in the municipal electricity tariff – as the resultant tariff increases would be unaffordable for the consumers. The municipality needs to explore other means of financing the required upgrades. The municipality has embarked on programme where it is replacing and fixing all bridged and broken meters, this will result in an increase in the anticipated revenue that is above the proposed tariff increase.
1.4.4 Sanitation and Impact of Tariff Increases
A tariff increase of 5.79 per cent for sanitation from 1 July 2014 is proposed. This is based on the input cost assumptions related to water.
The following table compares the current and proposed tariffs: Table 7 Comparison between current sanitation charges and increases
Ngwathe Local Municipality 2014/15 Annual Budget and MTREF
11
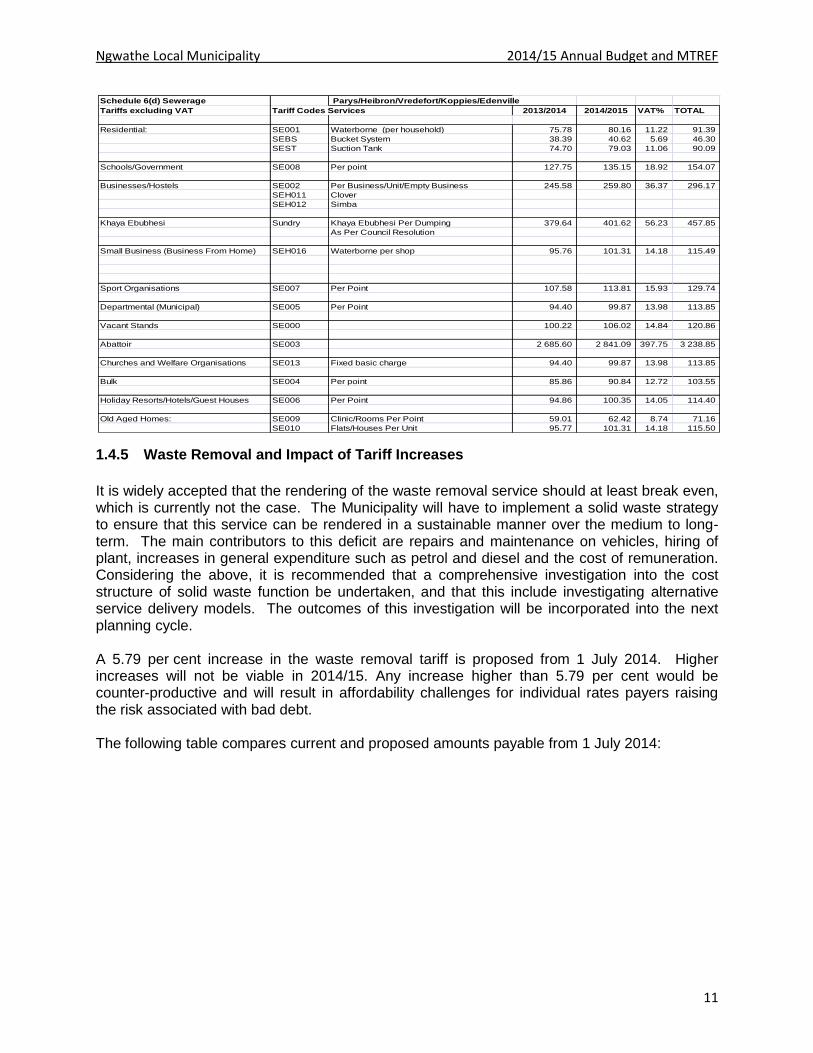
1.4.5 Waste Removal and Impact of Tariff Increases
It is widely accepted that the rendering of the waste removal service should at least break even, which is currently not the case. The Municipality will have to implement a solid waste strategy to ensure that this service can be rendered in a sustainable manner over the medium to long-term. The main contributors to this deficit are repairs and maintenance on vehicles, hiring of plant, increases in general expenditure such as petrol and diesel and the cost of remuneration. Considering the above, it is recommended that a comprehensive investigation into the cost structure of solid waste function be undertaken, and that this include investigating alternative service delivery models. The outcomes of this investigation will be incorporated into the next planning cycle. A 5.79 per cent increase in the waste removal tariff is proposed from 1 July 2014. Higher increases will not be viable in 2014/15. Any increase higher than 5.79 per cent would be counter-productive and will result in affordability challenges for individual rates payers raising the risk associated with bad debt. The following table compares current and proposed amounts payable from 1 July 2014:
Schedule 6(d) Sewerage Parys/Heibron/Vredefort/Koppies/Edenville
Tariffs excluding VAT Tariff Codes Services 2013/2014 2014/2015 VAT% TOTAL
Residential: SE001 Waterborne (per household) 75.78 80.16 11.22 91.39
SEBS Bucket System 38.39 40.62 5.69 46.30
SEST Suction Tank 74.70 79.03 11.06 90.09
Schools/Government SE008 Per point 127.75 135.15 18.92 154.07
Businesses/Hostels SE002 Per Business/Unit/Empty Business 245.58 259.80 36.37 296.17
SEH011 Clover
SEH012 Simba
Khaya Ebubhesi Sundry Khaya Ebubhesi Per Dumping 379.64 401.62 56.23 457.85
As Per Council Resolution
Small Business (Business From Home) SEH016 Waterborne per shop 95.76 101.31 14.18 115.49
Sport Organisations SE007 Per Point 107.58 113.81 15.93 129.74
Departmental (Municipal) SE005 Per Point 94.40 99.87 13.98 113.85
Vacant Stands SE000 100.22 106.02 14.84 120.86
Abattoir SE003 2 685.60 2 841.09 397.75 3 238.85
Churches and Welfare Organisations SE013 Fixed basic charge 94.40 99.87 13.98 113.85
Bulk SE004 Per point 85.86 90.84 12.72 103.55
Holiday Resorts/Hotels/Guest Houses SE006 Per Point 94.86 100.35 14.05 114.40
Old Aged Homes: SE009 Clinic/Rooms Per Point 59.01 62.42 8.74 71.16
SE010 Flats/Houses Per Unit 95.77 101.31 14.18 115.50

Ngwathe Local Municipality 2014/15 Annual Budget and MTREF
12
Table 8 Comparison between current waste removal fees and increases
1.4.6 Overall impact of tariff increases on households
The following table shows the overall expected impact of the tariff increases on a large and small household, as well as an indigent household receiving free basic services. Note that in all instances the overall impact of the tariff increases on household’s bills has been kept to between 12.3 and 14 per cent, with the increase for indigent households at 12.8 per cent.
Refuse
Tariffs excluding VAT Tariff Codes Services 2013/14 2014/15 VAT% TOTAL
Residential RF001 71.92 76.09 10.65 86.74
Holiday Resorts /Cottage RF016 28.17 29.80 4.17 33.97
Office considered as /Caravan Stand RF017 14.17 14.99 2.10 17.09
1 Cottage
Churches and Welfare RF018 71.60 75.75 10.60 86.35
Small Business(Business From Home) RF020 71.60 75.75 10.60 86.35
Municipal RF005 55.01 58.20 8.15 66.35
Sports Clubs RE007 23.69 25.06 3.51 28.57
Industrial Large RE009 325.55 344.40 48.22 392.62
Businesses Restau- 1 RF002 103.86 109.87 15.38 125.26
rants, café's, 2 156.12 165.16 23.12 188.28
3-99999999 233.83 247.37 34.63 282.00
Government properties 1-999999 237.93 251.71 35.24 286.94
Hotels, Supermarkets 0-2 RF015 470.81 498.07 69.73 567.80
Hospitals, Country 3-99999999 70.85 74.95 10.49 85.44
Club, Guest Houses
Old Aged Homes 1 RF019 33.37 35.30 4.94 40.25
Hostels 2-99999999 6.81 7.21 1.01 8.22
Bulk 1 RF004 447.55 473.46 66.28 539.75
Government 2-99999999 67.34 71.24 9.97 81.22
Schools 1 RF008 447.55 473.46 66.28 539.75
2-99999999 67.34 71.24 9.97 81.22

Ngwathe Local Municipality 2014/15 Annual Budget and MTREF
13
Table 9 MBRR Table SA14 – Household bills
2010/11 2011/12 2012/132014/15 Medium Term Revenue & Expenditure
Framework
Audited
Outcome
Audited
Outcome
Audited
Outcome
Original
Budget
Adjusted
Budget
Full Year
Forecast
Budget Year
2014/15
Budget Year
2014/15
Budget Year
+1 2015/16
Budget Year
+2 2016/17
Rand/cent % incr.
Monthly Account for Household - 'Middle
Income Range'
1
Rates and services charges:
Property rates 363.66 385.11 406.68 406.68 406.68 531.56 560.26 590.52
Electricity : Basic lev y – – –
Electricity : Consumption 1,052.88 1,141.44 1,232.76 1,232.76 1,232.76 1,363.15 1,436.76 1,514.35
Water: Basic lev y 32.00 33.89 35.79 35.79 35.79 43.20 45.53 47.99
Water: Consumption 157.51 166.80 176.14 176.14 176.14 184.60 194.57 205.08
Sanitation 67.70 71.69 75.71 75.71 75.71 80.09 84.41 88.97
Refuse remov al 64.26 68.05 71.86 71.86 71.86 76.09 80.20 84.53
Other – – –
sub-total – 1,738.01 1,866.99 1,998.94 1,998.94 1,998.94 14.0% 2,278.69 2,401.74 2,531.43
VAT on Serv ices 242.27 255.35 269.14
Total large household bill: – 1,738.01 1,866.99 1,998.94 1,998.94 1,998.94 26.1% 2,520.96 2,657.09 2,800.57
% increase/-decrease – 7.4% 7.1% – – 26.1% 5.4% 5.4%
Monthly Account for Household - 'Affordable
Range'
2
Rates and services charges:
Property rates 363.66 385.11 406.68 406.68 406.68 374.06 394.26 415.55
Electricity : Basic lev y – – –
Electricity : Consumption 412.48 446.60 477.86 477.86 477.86 678.15 714.77 753.37
Water: Basic lev y 32.00 33.89 35.79 35.79 35.79 43.20 45.53 47.99
Water: Consumption 157.51 166.80 176.14 176.14 176.14 145.90 153.78 162.08
Sanitation 67.70 71.69 75.71 75.71 75.71 80.09 84.41 88.97
Refuse remov al 64.26 68.05 71.86 71.86 71.86 76.09 80.20 84.53
Other – – –
sub-total – 1,097.61 1,172.15 1,244.04 1,244.04 1,244.04 12.3% 1,397.49 1,472.95 1,552.49
VAT on Serv ices 142.39 150.08 158.18
Total small household bill: – 1,097.61 1,172.15 1,244.04 1,244.04 1,244.04 23.8% 1,539.88 1,623.03 1,710.68
% increase/-decrease – 6.8% 6.1% – – 23.8% 5.4% 5.4%
- -0.10 -1.00 - Monthly Account for Household - 'Indigent'
Household receiving free basic services
3
Rates and services charges:
Property rates 191.14 202.41 213.75 213.75 213.75 #NAME? 216.56 228.25 240.58
Electricity : Basic lev y – – –
Electricity : Consumption 357.38 387.44 418.44 418.44 418.44 #NAME? 411.00 433.19 456.59
Water: Basic lev y 32.00 33.89 35.79 35.79 35.79 #NAME? 43.20 45.53 47.99
Water: Consumption 90.44 95.78 101.14 101.14 101.14 #NAME? 107.10 112.88 118.98
Sanitation 67.70 71.69 75.71 75.71 75.71 #NAME? 80.09 84.41 88.97
Refuse remov al 64.26 68.05 71.86 71.86 71.86 #NAME? 76.09 80.20 84.53
Other – – –
sub-total – 802.92 859.26 916.69 916.69 916.69 1.9% 934.04 984.48 1,037.64
VAT on Serv ices #NAME? 99.89 105.28 110.97
Total small household bill: – 802.92 859.26 916.69 916.69 916.69 12.8% 1,033.93 1,089.76 1,148.61
% increase/-decrease – 7.0% 6.7% – – 12.8% 5.4% 5.4%
Ref
Current Year 2013/14
Description
Ngwathe Local Municipality 2014/15 Annual Budget and MTREF
14
1.5 Operating Expenditure Framework
The Municipality’s expenditure framework for the 2014/15 budget and MTREF is informed by the following: • The asset renewal strategy and the repairs and maintenance plan (informed by the
municipal master plans); • Balanced budget constraint (operating expenditure should not exceed operating
revenue) unless there are existing uncommitted cash-backed reserves to fund any deficit;
• Funding of the budget over the medium-term as informed by Section 18 and 19 of the MFMA;
• The capital programme is aligned to the asset renewal strategy and backlog eradication plan;
• Operational gains and efficiencies will be directed to funding the capital budget and other core services; and
• Strict adherence to the principle of no project plan no budget. If there is no business plan no funding allocation can be made.
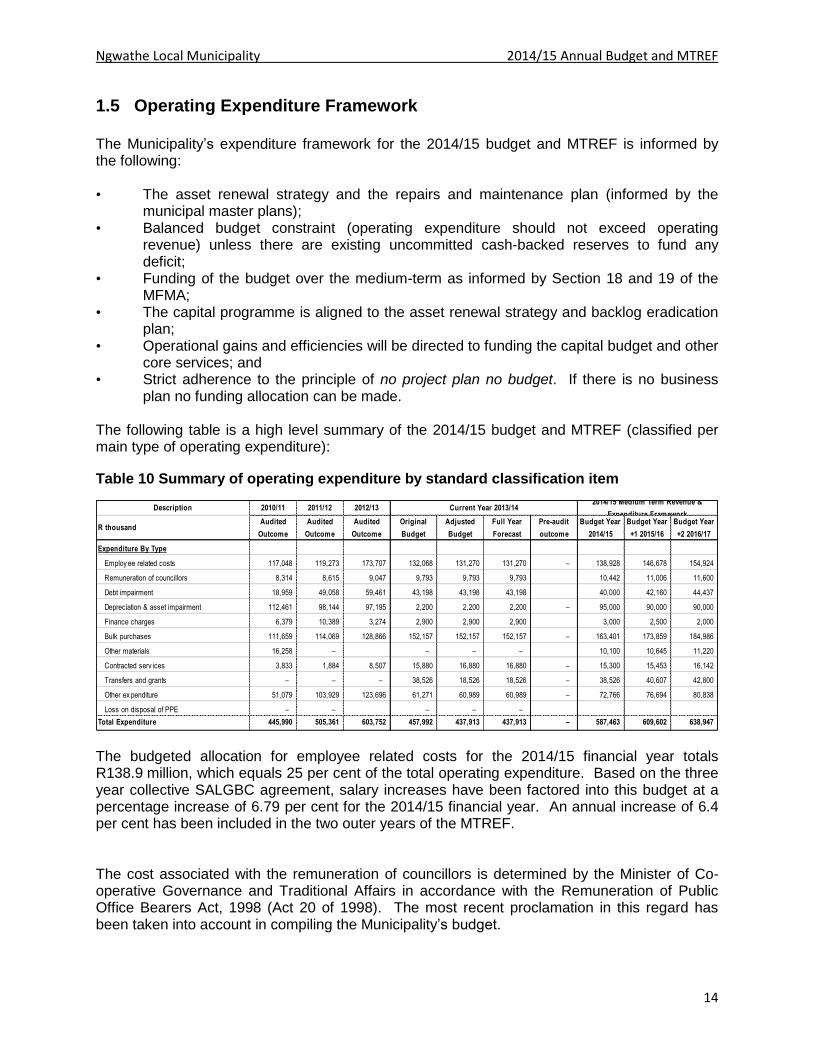
The following table is a high level summary of the 2014/15 budget and MTREF (classified per main type of operating expenditure):
Table 10 Summary of operating expenditure by standard classification item
The budgeted allocation for employee related costs for the 2014/15 financial year totals R138.9 million, which equals 25 per cent of the total operating expenditure. Based on the three year collective SALGBC agreement, salary increases have been factored into this budget at a percentage increase of 6.79 per cent for the 2014/15 financial year. An annual increase of 6.4 per cent has been included in the two outer years of the MTREF. The cost associated with the remuneration of councillors is determined by the Minister of Co-operative Governance and Traditional Affairs in accordance with the Remuneration of Public Office Bearers Act, 1998 (Act 20 of 1998). The most recent proclamation in this regard has been taken into account in compiling the Municipality’s budget.
Description 2010/11 2011/12 2012/13
R thousandAudited
Outcome
Audited
Outcome
Audited
Outcome
Original
Budget
Adjusted
Budget
Full Year
Forecast
Pre-audit
outcome
Budget Year
2014/15
Budget Year
+1 2015/16
Budget Year
+2 2016/17
Expenditure By Type
Employ ee related costs 117,048 119,273 173,707 132,068 131,270 131,270 – 138,928 146,678 154,924
Remuneration of councillors 8,314 8,615 9,047 9,793 9,793 9,793 10,442 11,006 11,600
Debt impairment 18,959 49,058 59,461 43,198 43,198 43,198 40,000 42,160 44,437
Depreciation & asset impairment 112,461 98,144 97,195 2,200 2,200 2,200 – 95,000 90,000 90,000
Finance charges 6,379 10,389 3,274 2,900 2,900 2,900 3,000 2,500 2,000
Bulk purchases 111,659 114,069 128,866 152,157 152,157 152,157 – 163,401 173,859 184,986
Other materials 16,258 – – – – 10,100 10,645 11,220
Contracted serv ices 3,833 1,884 8,507 15,880 16,880 16,880 – 15,300 15,453 16,142
Transfers and grants – – – 38,526 18,526 18,526 – 38,526 40,607 42,800
Other ex penditure 51,079 103,929 123,696 61,271 60,989 60,989 – 72,766 76,694 80,838
Loss on disposal of PPE – – – – –
Total Expenditure 445,990 505,361 603,752 457,992 437,913 437,913 – 587,463 609,602 638,947
2014/15 Medium Term Revenue &
Expenditure FrameworkCurrent Year 2013/14

Ngwathe Local Municipality 2014/15 Annual Budget and MTREF
15
The provision of debt impairment was determined based on an annual collection rate of 75 per cent and the Debt Write-off Policy of the municipality. For the 2014/15 financial year this amount equates to R40 million and escalates to R44.4 million by 2016/17. While this expenditure is considered to be a non-cash flow item, it informed the total cost associated with rendering the services of the municipality, as well as the municipality’s realistically anticipated revenues. The municipality is aware that the provision for debt impairment is understated, the provision will be revised during the adjustments budget period when the municipality’s debt book would have been reviewed by the service provider appointed to assist the municipality with the collection of outstanding debt. Provision for depreciation and asset impairment has been informed by the Municipality’s Asset Management Policy. Depreciation is widely considered a proxy for the measurement of the rate asset consumption. Budget appropriations in this regard total R95 million for the 2014/15 financial and equates to 16.1 per cent of the total operating expenditure. Note that the implementation of GRAP 17 accounting standard has meant bringing a range of assets previously not included in the assets register onto the register. This has resulted in a significant increase in depreciation relative to previous years. Finance charges consist primarily of the repayment of interest and capital portions on long-term borrowing (cost of capital). Finance charges make up 0.51 per cent (R3 million) of operating expenditure for 2014/15 and decrease to R2 million by 2016/17. Bulk purchases are directly informed by the purchase of electricity from Eskom and water from Rand Water. The annual price increases have been factored into the budget appropriations and directly inform the revenue provisions. The expenditures include distribution losses. Other materials comprises of the purchase of fuel, diesel, and chemicals. For 2014/15 the appropriation against this group of expenditure is R10.1 million. Contracted services has been identified as a cost saving area for the Municipality. As part of the compilation of the 2014/15 MTREF this group of expenditure was critically evaluated and operational efficiencies were enforced. In the 2014/15 financial year, this group of expenditure totals R15.3 million and has been decreased by just 10.3 per cent, clearly demonstrating the application of cost efficiencies Other expenditure comprises of various line items relating to the daily operations of the municipality.
Ngwathe Local Municipality 2014/15 Annual Budget and MTREF
16
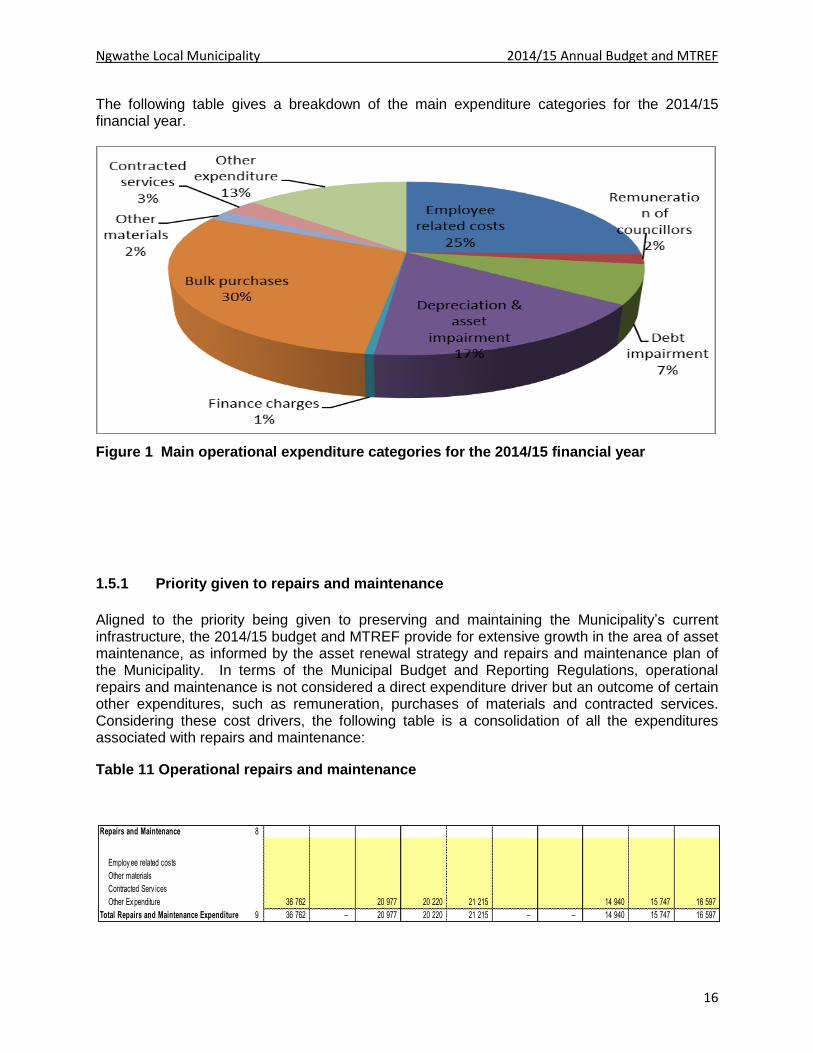
The following table gives a breakdown of the main expenditure categories for the 2014/15 financial year.
Figure 1 Main operational expenditure categories for the 2014/15 financial year
1.5.1 Priority given to repairs and maintenance
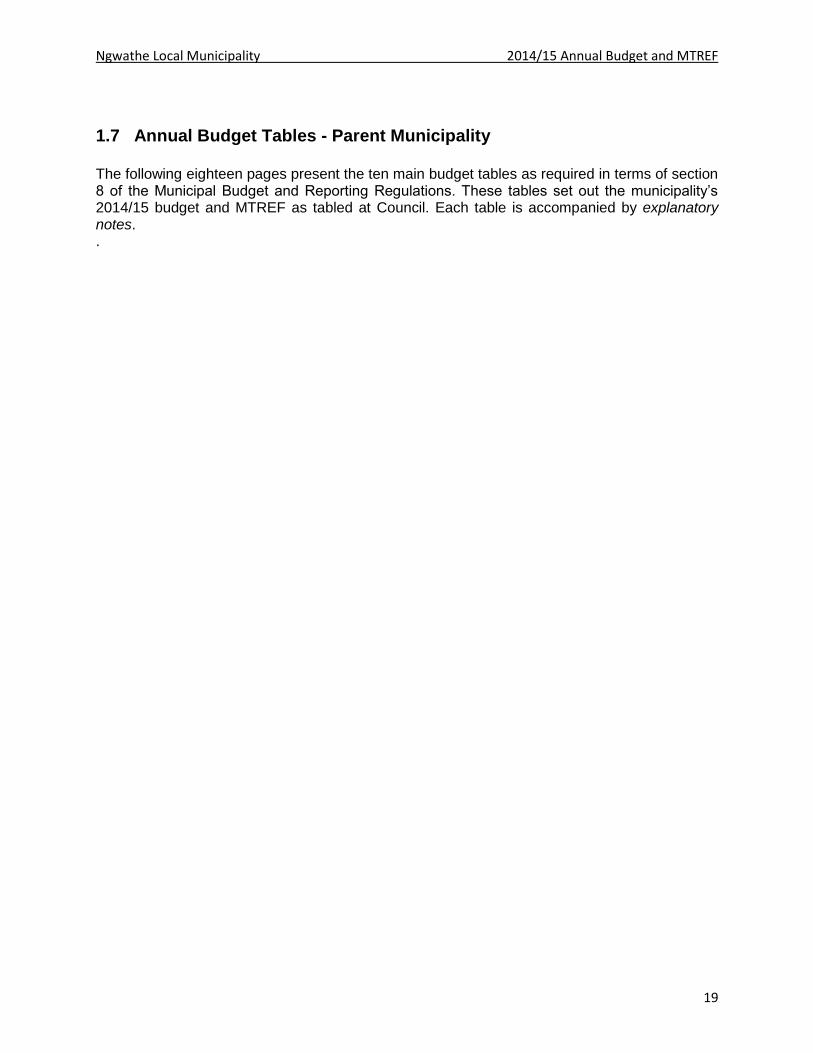
Aligned to the priority being given to preserving and maintaining the Municipality’s current infrastructure, the 2014/15 budget and MTREF provide for extensive growth in the area of asset maintenance, as informed by the asset renewal strategy and repairs and maintenance plan of the Municipality. In terms of the Municipal Budget and Reporting Regulations, operational repairs and maintenance is not considered a direct expenditure driver but an outcome of certain other expenditures, such as remuneration, purchases of materials and contracted services. Considering these cost drivers, the following table is a consolidation of all the expenditures associated with repairs and maintenance:
Table 11 Operational repairs and maintenance
Repairs and Maintenance 8
Employ ee related costs
Other materials
Contracted Serv ices
Other Ex penditure 36 762 20 977 20 220 21 215 14 940 15 747 16 597
Total Repairs and Maintenance Expenditure 9 36 762 – 20 977 20 220 21 215 – – 14 940 15 747 16 597

Ngwathe Local Municipality 2014/15 Annual Budget and MTREF
17
During the compilation of the 2014/15 MTREF operational repairs and maintenance was identified as a strategic imperative owing to the aging of the Municipality’s infrastructure and historic deferred maintenance. During the 2013/14 financial year, the municipality had incorrectly budgeted for the purchase of operational assets under repairs and maintenance incorrectly. This was corrected during the 2014/15 budget process, hence the sharp decline in the repairs and maintenance budget compared to the 2013/14 financial year. The total allocation for 2014/15 equates to R14.9 million, the allocation grows at 5.4 and 5.4 per cent over the MTREF. In relation to the total operating expenditure, repairs and maintenance comprises of 2.5, 2.5 and 2.6 per cent for the respective financial years of the MTREF. The table below provides a breakdown of the repairs and maintenance in relation to asset class:
Table 12 Repairs and maintenance per asset class
For the 2014/15 financial year, 49.2 per cent or R7.4 million of total repairs and maintenance will be spent on infrastructure assets. Road infrastructure has received a significant proportion of this allocation totalling 40.81 per cent (R3 million), followed by Electricity infrastructure at 27.21 per cent (R 2 million), water at 21.76 per cent (R1.6 million) and other at 10.2 per cent (R750 000).Community assets has been allocated R1.8 million of total repairs and maintenance equating to 12.3 per cent.
Description 2010/11 2011/12 2012/13
R thousandAudited
Outcome
Audited
Outcome
Audited
Outcome
Original
Budget
Adjusted
Budget
Full Year
Forecast
Budget Year
2014/15
Budget Year
+1 2015/16
Budget Year
+2 2016/17
Repairs and maintenance expenditure by Asset Class/Sub-class
Infrastructure 25,452 12,685 12,838 6,800 7,350 7,350 7,350 7,747 8,165
Infrastructure - Road transport 5,769 2,916 1,859 1,300 1,100 1,100 3,000 3,162 3,333
Infrastructure - Electricity 6,350 3,210 3,574 1,800 2,000 2,000 2,000 2,108 2,222
Infrastructure - Water 3,557 1,617 1,731 2,200 2,600 2,600 1,600 1,686 1,777
Infrastructure - Sanitation 4,446 2,247 2,596 1,400 1,550 1,550 500 527 555
Infrastructure - Other 5,330 2,694 3,079 100 100 100 250 264 278
Community 8,522 4,098 1,690 810 1,010 1,010 1,840 1,939 2,044
Other assets 2,784 1,798 6,449 12,616 12,861 12,861 5,750 5,750 6,061
Total Repairs and Maintenance Expenditure 36,762 18,581 20,977 20,226 21,221 21,221 14,940 15,747 16,597
Current Year 2013/142014/15 Medium Term Revenue &
Expenditure Framework

Ngwathe Local Municipality 2014/15 Annual Budget and MTREF
18
1.6 Capital expenditure
The following table provides a breakdown of budgeted capital expenditure by vote: Table 13 2014/15 Medium-term capital budget per vote
For 2014/15 an amount of R44.9 million has been appropriated for the development of infrastructure which represents 67.3 per cent of the total capital budget. Waste water Management receives the highest allocation of R12.1 million in 2014/15 which equates to 26.9 per cent followed by water infrastructure at 28.2 per cent, R12.6 million and then Electricity at 17.8 per cent, R8 million. Some of the salient projects to be undertaken over the medium-term includes, amongst others:
Heilbron: upgrading of sewer treatment works - R 5.7 million
Parys: Upgrading of sewer treatment works - R 650 000
Parys: Refurbishment and upgrading of water treatment works Phase 3 - R 11.9 million
Koppies: Refurbishment of the tennis court - R 60 000
Phiritona: Construction of the sports complex - R 40 703
Schonkenville: Refurbishment of the sports complex - R 1.2 million
Edenville: Paving of internal roads 1 km - R 322 000
Koppies: Paving of internal roads 1 Km - R 1.4 million
Kwakwatsi: Construction of sports facility - R 3.5 million
Parys: Upgrade of low level bridge in Mandela section, Tumahole - R 3.8 million
Mokwallo: Construction of sports complex - R 3.5 million
Construction of a solid waste disposal site in Parys - R 5.8 million
FS203 Ngwathe - Table A5 Budgeted Capital Expenditure by vote, standard classification and funding
Vote Description Ref 2010/11 2011/12 2012/13
R thousand 1Audited
Outcome
Audited
Outcome
Audited
Outcome
Original
Budget
Adjusted
Budget
Full Year
Forecast
Pre-audit
outcome
Budget Year
2014/15
Budget Year
+1 2015/16
Budget Year
+2 2016/17
Capital Expenditure - Standard
Governance and administration 3,956 1,539 – – – – – 7,500 – –
Ex ecutiv e and council 3,956 759 5,500 –
Budget and treasury office – – 2,000 –
Corporate serv ices – 780
Community and public safety – – – 8,604 8,604 8,604 – 12,241 6,385 –
Community and social serv ices – – 6,000 –
Sport and recreation – – 8,604 8,604 8,604 5,981 6,385
Public safety – – 260 –
Housing – –
Health – –
Economic and environmental services – – – 9,602 9,602 3,602 – 2,878 12,321 –
Planning and dev elopment – –
Road transport – – 9,602 9,602 3,602 2,878 12,321
Env ironmental protection – –
Trading services – 6,741 – 53,289 74,689 74,689 – 42,078 26,250 –
Electricity – – 20,000 20,000 20,000 8,000 6,000
Water – – 19,693 19,693 19,693 12,676 4,100
Waste w ater management – 6,741 13,596 34,996 34,996 12,100 1,650
Waste management – – – – 9,303 14,500
Other – – 2,394 2,394 2,394 1,994 2,050
Total Capital Expenditure - Standard 3 3,956 8,281 – 73,889 95,289 89,289 – 66,691 47,007 –
Current Year 2013/14 2014/15 Medium Term Revenue &
Ngwathe Local Municipality 2014/15 Annual Budget and MTREF
19
1.7 Annual Budget Tables - Parent Municipality
The following eighteen pages present the ten main budget tables as required in terms of section 8 of the Municipal Budget and Reporting Regulations. These tables set out the municipality’s 2014/15 budget and MTREF as tabled at Council. Each table is accompanied by explanatory notes. .
Ngwathe Local Municipality 2014/15 Annual Budget and MTREF
20
Table 14 MBRR Table A1 - Budget Summary
Description 2010/11 2011/12 2012/13
R thousandsAudited
Outcome
Audited
Outcome
Audited
Outcome
Original
Budget
Adjusted
Budget
Full Year
Forecast
Pre-audit
outcome
Budget Year
2014/15
Budget Year
+1 2015/16
Budget Year
+2 2016/17
Financial Performance
Property rates 52,341 68,562 48,723 48,489 48,489 48,489 – 51,297 54,067 56,986
Serv ice charges 132,358 154,866 256,157 234,538 213,038 215,755 – 257,872 271,797 286,474
Inv estment rev enue 13,447 575 1,435 575 2,275 2,275 – 2,757 2,905 3,062
Transfers recognised - operational 126,766 160,047 156,259 159,631 159,631 159,631 – 163,765 168,563 166,342
Other ow n rev enue 6,725 20,267 25,123 14,758 5,558 5,558 – 7,995 8,345 8,715
Total Revenue (excluding capital transfers
and contributions)
331,637 404,317 487,698 457,992 428,992 431,709 – 483,685 505,678 521,580
Employ ee costs 117,048 119,273 173,707 132,068 131,270 131,270 – 138,928 146,678 154,924
Remuneration of councillors 8,314 8,615 9,047 9,793 9,793 9,793 – 10,442 11,006 11,600
Depreciation & asset impairment 112,461 98,144 97,195 2,200 2,200 2,200 – 95,000 90,000 90,000
Finance charges 6,379 10,389 3,274 2,900 2,900 2,900 – 3,000 2,500 2,000
Materials and bulk purchases 127,917 114,069 128,866 152,157 152,157 152,157 – 173,501 184,504 196,206
Transfers and grants – – – 38,526 18,526 18,526 – 38,526 40,607 42,800
Other ex penditure 73,871 154,871 191,664 120,349 121,067 121,067 – 128,066 134,307 141,417
Total Expenditure 445,990 505,361 603,752 457,992 437,913 437,913 – 587,463 609,602 638,947
Surplus/(Deficit) (114,353) (101,044) (116,055) (0) (8,921) (6,204) – (103,778) (103,924) (117,367)
Transfers recognised - capital – – 45,939 67,889 67,889 67,889 – 44,881 47,007 48,744
Contributions recognised - capital & contributed assets – – – – – – – – – –
Surplus/(Deficit) after capital transfers &
contributions
(114,353) (101,044) (70,115) 67,889 58,968 61,685 – (58,897) (56,917) (68,623)
Share of surplus/ (deficit) of associate – – – – – – – – – –
Surplus/(Deficit) for the year (114,353) (101,044) (70,115) 67,889 58,968 61,685 – (58,897) (56,917) (68,623)
Capital expenditure & funds sources
Capital expenditure 3,956 8,281 – 73,889 95,289 89,289 – 66,691 47,007 –
Transfers recognised - capital 3,759 7,522 – 67,889 89,289 89,289 – 44,881 47,007 48,744
Public contributions & donations – – – – – – – – – –
Borrow ing – – – 6,000 6,000 – – – – –
Internally generated funds 197 759 – – – – – 21,810 – –
Total sources of capital funds 3,956 8,281 – 73,889 95,289 89,289 – 66,691 47,007 48,744
Financial position
Total current assets 195,225 289,843 141,691 412,922 412,922 412,922 328,867 480,767 507,888 534,528
Total non current assets 1,376,872 1,286,967 1,118,769 1,280,737 1,280,737 1,280,737 1,272,296 1,237,232 1,192,234 916,961
Total current liabilities 200,527 281,366 285,569 247,900 247,900 241,900 273,135 257,066 217,172 205,077
Total non current liabilities 51,499 53,896 – 50,896 50,896 20,467 51,766 42,820 41,864 42,053
Community w ealth/Equity 1,320,070 1,218,045 – 68,079 68,079 67,889 1,261,692 1,240,520 1,203,880 939,029
Cash flows
Net cash from (used) operating 36,206 35,168 20,191 41,982 52,118 52,118 – 26,985 46,696 30,862
Net cash from (used) inv esting (6,196) (8,281) (1,407) (73,889) (95,289) (89,289) – (66,691) (47,007) (48,744)
Net cash from (used) financing (3,200) (424) (2,032) 3,100 3,100 (2,900) – (3,000) (2,500) (2,000)
Cash/cash equivalents at the year end 3,099 29,562 46,315 17,508 6,244 6,244 46,315 3,609 798 (19,084)
Cash backing/surplus reconciliation
Cash and inv estments av ailable 3,757 38,836 1,240 41,850 41,850 41,850 48,271 60,240 64,653 67,358
Application of cash and inv estments 34,665 130,534 184,185 23,945 19,831 21,645 260,092 (73,057) (151,971) (180,982)
Balance - surplus (shortfall) (30,908) (91,699) (182,945) 17,905 22,019 20,205 (211,821) 133,297 216,624 248,340
Asset management
Asset register summary (WDV) 152,718 1,383,050 1,283,164 1,509,771 1,509,771 1,509,771 1,569,661 1,569,661 1,614,617 1,429,296
Depreciation & asset impairment 112,461 98,144 97,195 2,200 2,200 2,200 95,000 95,000 90,000 90,000
Renew al of Ex isting Assets 32,029 – 42,616 38,985 38,985 32,985 32,985 16,374 – –
Repairs and Maintenance 36,762 18,581 20,977 20,226 21,221 21,221 14,940 14,940 15,747 16,597
Free services
Cost of Free Basic Serv ices prov ided 57,500 57,500 – – – – 3,174 3,174 3,345 3,525
Rev enue cost of free serv ices prov ided 57,511 57,511 – 38,526 18,526 18,526 38,526 38,526 40,606 42,799
Households below minimum service level
Water: – – – – – – – – – –
Sanitation/sew erage: 3 3 – 3 3 3 1 1 1 1
Energy : – – – – – – – – – –
Refuse: – – – – – – – – – –
2014/15 Medium Term Revenue &
Expenditure FrameworkCurrent Year 2013/14
Ngwathe Local Municipality 2014/15 Annual Budget and MTREF
21
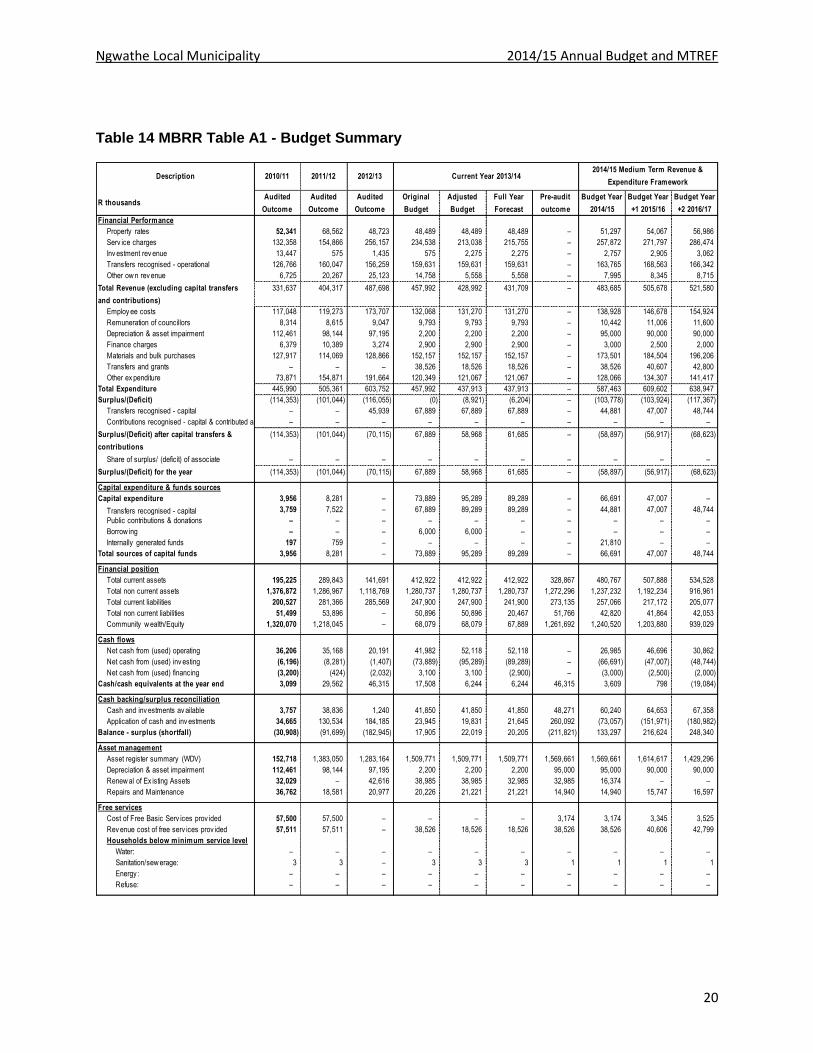
Explanatory notes to MBRR Table A1 - Budget Summary 1. Table A1 is a budget summary and provides a concise overview of the Municipality’s budget
from all of the major financial perspectives (operating, capital expenditure, financial position, cash flow, and MFMA funding compliance).
2. The table provides an overview of the amounts tabled at Council for operating performance, resources deployed to capital expenditure, financial position, cash and funding compliance, as well as the municipality’s commitment to eliminating basic service delivery backlogs.
3. Financial management reforms emphasises the importance of the municipal budget being funded. This requires the simultaneous assessment of the Financial Performance, Financial Position and Cash Flow Budgets, along with the Capital Budget. The Budget Summary provides the key information in this regard:
a. The operating surplus/deficit (after Total Expenditure) is positive over the MTREF b. Capital expenditure is balanced by capital funding sources, of which
i. Transfers recognised is reflected on the Financial Performance Budget; ii. Borrowing is incorporated in the net cash from financing on the Cash Flow
Budget iii. Internally generated funds is financed from the current operating surplus.
4. Even though the Council is placing great emphasis on securing the financial sustainability of the municipality, this is not being done at the expense of services to the poor. The section of Free Services shows that the amount spent on Free Basic Services and the revenue cost of free services provided by the municipality continues to increase.
Ngwathe Local Municipality 2014/15 Annual Budget and MTREF
22
Table 15 MBRR Table A2 - Budgeted Financial Performance (revenue and expenditure by standard classification)
Standard Classification Description Ref 2010/11 2011/12 2012/13
R thousand 1Audited
Outcome
Audited
Outcome
Audited
Outcome
Original
Budget
Adjusted
Budget
Full Year
Forecast
Budget Year
2014/15
Budget Year
+1 2015/16
Budget Year
+2 2016/17
Revenue - Standard
Governance and administration 168,212 222,520 265,409 210,049 203,249 203,249 220,803 228,600 229,539
Ex ecutiv e and council 3,806 – – 5,355 5,355 5,355 – – –
Budget and treasury office 162,730 221,383 264,037 203,180 197,380 197,380 220,500 228,281 229,203
Corporate serv ices 1,677 1,137 1,371 1,515 515 515 303 319 337
Community and public safety 4,100 1,336 1,612 4,854 2,654 2,654 2,733 2,881 3,036
Community and social serv ices 1,245 561 677 1,352 852 852 920 970 1,022
Sport and recreation 2,077 – – 1,541 1,541 1,541 1,008 1,062 1,120
Public safety 777 775 935 1,961 261 261 805 848 894
Housing – – – – – – – – –
Health – – – – – – – – –
Economic and environmental services 1,290 131 158 59 59 59 1,530 1,612 1,699
Planning and dev elopment 1,287 131 158 54 54 54 1,528 1,610 1,697
Road transport 3 – – 5 5 5 2 2 2
Env ironmental protection – – – – – – – – –
Trading services 157,771 180,330 220,519 243,030 223,030 225,747 258,619 272,585 287,304
Electricity 107,453 95,932 118,716 135,143 115,143 115,143 146,052 153,939 162,251
Water 14,683 31,208 37,644 46,848 46,848 46,848 40,311 42,487 44,782
Waste w ater management 20,531 28,433 34,297 33,068 33,068 35,785 37,109 39,113 41,225
Waste management 15,104 24,757 29,863 27,971 27,971 27,971 35,148 37,045 39,046
Other 4 264 – – – – – – – –
Total Revenue - Standard 2 331,637 404,317 487,697 457,992 428,992 431,709 483,684 505,678 521,579
Expenditure - Standard
Governance and administration 150,205 170,200 203,337 175,196 153,018 153,018 189,947 197,105 206,570
Ex ecutiv e and council 38,289 43,386 51,833 40,129 38,256 38,256 45,280 46,986 49,226
Budget and treasury office 88,108 99,837 119,275 116,569 95,512 95,512 122,628 127,249 133,374
Corporate serv ices 23,808 26,977 32,229 18,497 19,251 19,251 22,038 22,870 23,970
Community and public safety 43,726 49,546 59,194 40,794 41,097 41,097 48,818 50,659 53,128
Community and social serv ices 17,683 20,037 23,939 17,448 17,891 17,891 21,480 22,289 23,362
Sport and recreation 12,452 14,109 16,856 10,978 11,653 11,653 12,429 12,897 13,548
Public safety 12,291 13,927 16,639 11,117 10,376 10,376 13,653 14,169 14,851
Housing 1,300 1,473 1,760 1,252 1,177 1,177 1,257 1,304 1,367
Health – – – – – – – – –
Economic and environmental services 27,452 31,107 37,165 28,878 28,409 28,409 124,985 129,696 135,939
Planning and dev elopment 6,836 7,746 9,255 2,924 2,605 2,605 4,282 4,443 4,657
Road transport 20,615 23,361 27,909 25,954 25,804 25,804 120,703 125,252 131,281
Env ironmental protection – – – – – – – – –
Trading services 224,609 254,510 304,058 213,124 215,388 215,388 223,711 232,142 243,310
Electricity 162,731 184,394 220,289 156,923 157,365 157,365 165,768 172,016 180,296
Water 25,830 29,269 34,968 25,981 26,042 26,042 25,686 26,655 27,938
Waste w ater management 21,228 24,053 28,737 17,652 19,204 19,204 18,843 19,553 20,494
Waste management 14,821 16,794 20,064 12,567 12,777 12,777 13,413 13,919 14,582
Other 4 – – – – – – – – –
Total Expenditure - Standard 3 445,991 505,364 603,754 457,992 437,912 437,912 587,461 609,602 638,947
Surplus/(Deficit) for the year (114,354) (101,047) (116,056) (0) (8,920) (6,204) (103,776) (103,924) (117,368)
Current Year 2013/142014/15 Medium Term Revenue &
Expenditure Framework

Ngwathe Local Municipality 2014/15 Annual Budget and MTREF
23
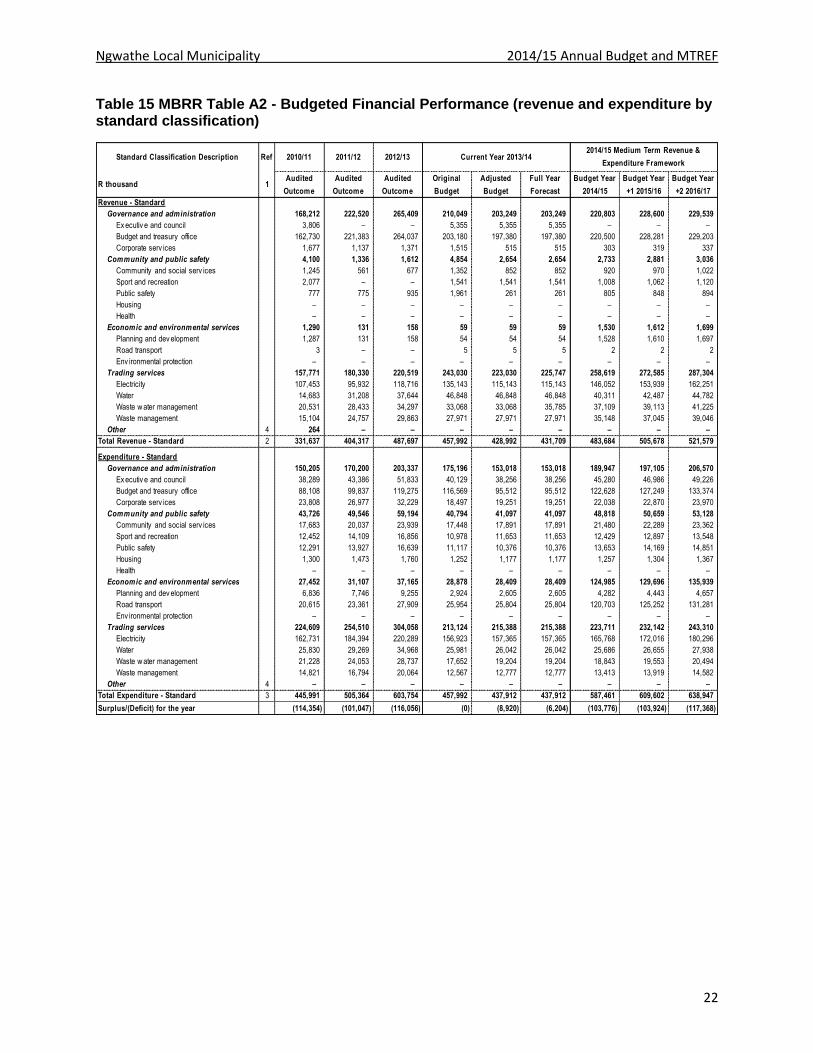
Explanatory notes to MBRR Table A2 - Budgeted Financial Performance (revenue and expenditure by standard classification) 1. Table A2 is a view of the budgeted financial performance in relation to revenue and
expenditure per standard classification. The modified GFS standard classification divides the municipal services into 15 functional areas. Municipal revenue, operating expenditure and capital expenditure are then classified in terms if each of these functional areas which enables the National Treasury to compile ‘whole of government’ reports.
2. Note that as a general principle the revenues for the Trading Services should exceed their expenditures. The table highlights that this is the case for Water and Waste water functions and Waste management function but not the Electricity function. This is mainly due to losses experienced on the electricity function, the municipality has action plans in place to address losses in the electricity function.
3. Other functions that show a deficit between revenue and expenditure are being financed from rates revenues and other revenue sources.
Ngwathe Local Municipality 2014/15 Annual Budget and MTREF
24
Table 16 MBRR Table A3 - Budgeted Financial Performance (revenue and expenditure by municipal vote)
Vote Description Ref 2010/11 2011/12 2012/13
R thousandAudited
Outcome
Audited
Outcome
Audited
Outcome
Original
Budget
Adjusted
Budget
Full Year
Forecast
Budget Year
2014/15
Budget Year
+1 2015/16
Budget Year
+2 2016/17
Revenue by Vote 1
Vote 1 - Ex ecutiv e and Council 3,806 – – 5,355 5,355 5,355 – – –
Vote 2 - Finance and Admin 164,407 222,520 265,409 204,695 197,895 197,895 220,803 228,600 229,539
Vote 3 - Planning and Dev elopment 1,287 131 158 54 54 54 1,528 1,610 1,697
Vote 4 - Community and Social serv ices 1,245 561 677 1,352 852 852 920 970 1,022
Vote 5 - Housing – – – – – – – – –
Vote 6 - Public Safety 777 775 935 1,961 261 261 805 848 894
Vote 7 - Sports and Recreation 2,077 – – 1,541 1,541 1,541 1,008 1,062 1,120
Vote 8 - Waste Management 15,104 24,757 29,863 27,971 27,971 27,971 35,148 37,045 39,046
Vote 9 - Waste Water Management 20,531 28,433 34,297 33,068 33,068 35,785 37,109 39,113 41,225
Vote 10 - Road Transport 3 – – 4 4 4 2 2 2
Vote 11 - Water 14,683 31,208 37,644 46,848 46,848 46,848 40,311 42,487 44,782
Vote 12 - Electricity 107,453 95,932 118,716 135,143 115,143 115,143 146,052 153,939 162,251
Vote 13 - Technical Serv ices and PMU – – – 2 2 2 – – –
Vote 14 - Airport 264 – – – – – – – –
Vote 15 - [NAME OF VOTE 15] – – – – – – – – –
Total Revenue by Vote 2 331,637 404,317 487,698 457,992 428,992 431,709 483,685 505,678 521,579
Expenditure by Vote to be appropriated 1
Vote 1 - Ex ecutiv e and Council 38,289 43,386 51,833 40,129 38,256 38,256 45,280 46,987 49,226
Vote 2 - Finance and Admin 111,915 126,813 151,504 135,067 114,763 114,763 144,666 150,118 157,344
Vote 3 - Planning and Dev elopment 6,836 7,746 9,255 2,924 2,605 2,605 4,282 4,443 4,657
Vote 4 - Community and Social serv ices 17,683 20,037 23,939 17,448 17,891 17,891 21,480 22,289 23,362
Vote 5 - Housing 1,300 1,473 1,760 1,252 1,177 1,177 1,257 1,304 1,367
Vote 6 - Public Safety 12,291 13,927 16,639 11,117 10,376 10,376 13,653 14,169 14,851
Vote 7 - Sports and Recreation 12,452 14,109 16,856 10,978 11,653 11,653 12,429 12,897 13,548
Vote 8 - Waste Management 14,821 16,794 20,064 12,567 12,777 12,777 13,413 13,919 14,582
Vote 9 - Waste Water Management 21,228 24,053 28,737 17,652 19,204 19,204 18,843 19,553 20,494
Vote 10 - Road Transport 10,804 12,243 14,627 10,931 10,151 10,151 102,695 106,565 111,695
Vote 11 - Water 25,830 29,269 34,968 25,981 26,042 26,042 25,686 26,655 27,938
Vote 12 - Electricity 162,731 184,394 220,289 156,923 157,365 157,365 165,768 172,016 180,296
Vote 13 - Technical Serv ices and PMU 9,812 11,118 13,283 15,023 15,652 15,652 18,008 18,687 19,586
Vote 14 - Airport – – – – – – – – –
Vote 15 - [NAME OF VOTE 15] – – – – – – – – –
Total Expenditure by Vote 2 445,991 505,363 603,753 457,992 437,912 437,912 587,461 609,602 638,947
Surplus/(Deficit) for the year 2 (114,354) (101,046) (116,055) (0) (8,920) (6,203) (103,776) (103,924) (117,368)
Current Year 2013/142014/15 Medium Term Revenue &
Expenditure Framework
Ngwathe Local Municipality 2014/15 Annual Budget and MTREF
25
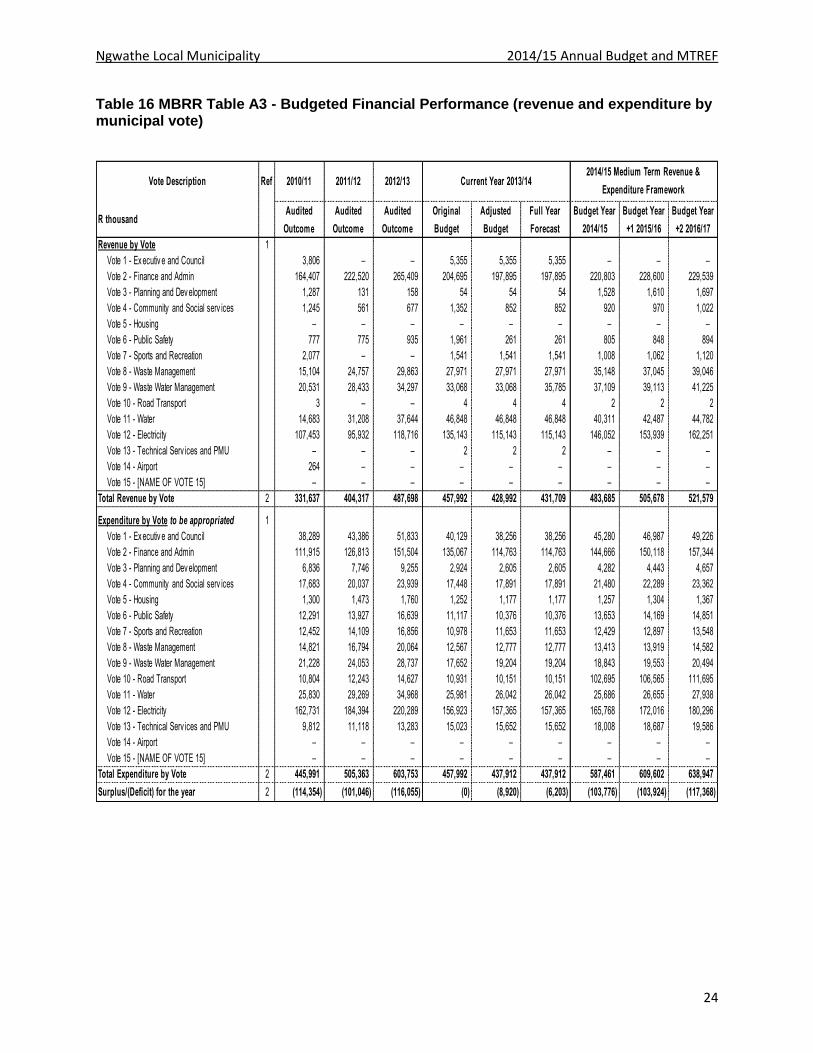
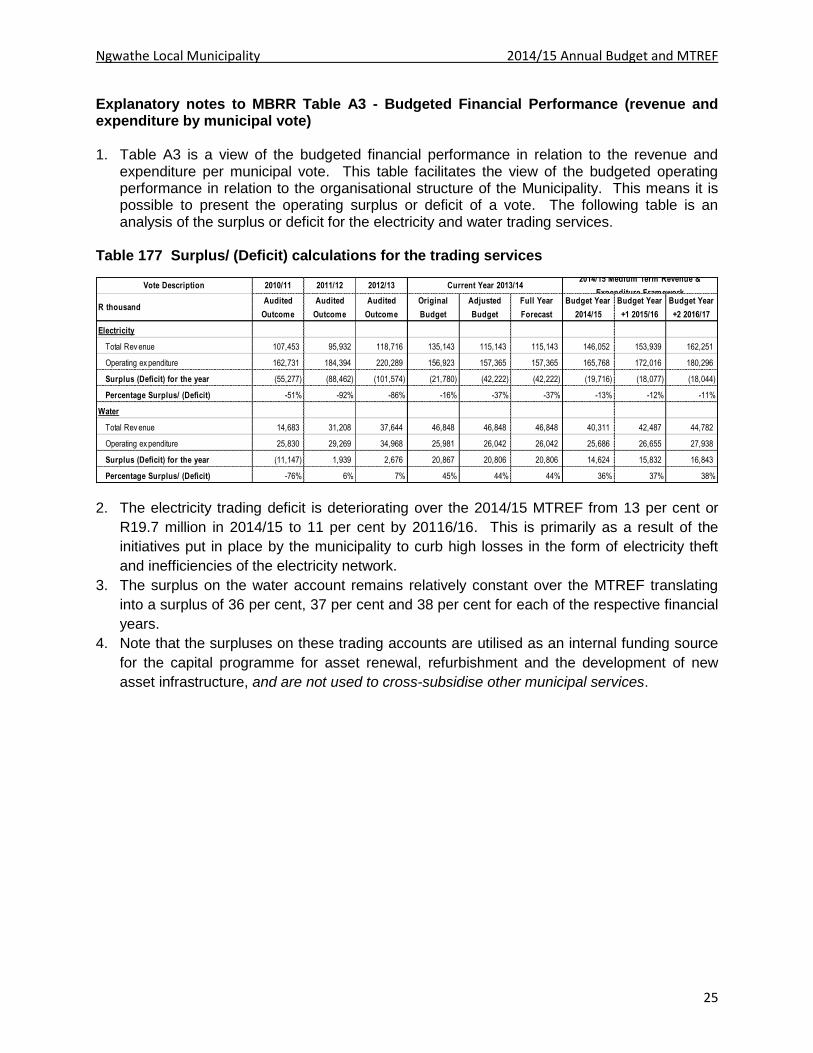
Explanatory notes to MBRR Table A3 - Budgeted Financial Performance (revenue and expenditure by municipal vote) 1. Table A3 is a view of the budgeted financial performance in relation to the revenue and
expenditure per municipal vote. This table facilitates the view of the budgeted operating performance in relation to the organisational structure of the Municipality. This means it is possible to present the operating surplus or deficit of a vote. The following table is an analysis of the surplus or deficit for the electricity and water trading services.
Table 177 Surplus/ (Deficit) calculations for the trading services
2. The electricity trading deficit is deteriorating over the 2014/15 MTREF from 13 per cent or
R19.7 million in 2014/15 to 11 per cent by 20116/16. This is primarily as a result of the
initiatives put in place by the municipality to curb high losses in the form of electricity theft
and inefficiencies of the electricity network.
3. The surplus on the water account remains relatively constant over the MTREF translating
into a surplus of 36 per cent, 37 per cent and 38 per cent for each of the respective financial
years.
4. Note that the surpluses on these trading accounts are utilised as an internal funding source
for the capital programme for asset renewal, refurbishment and the development of new
asset infrastructure, and are not used to cross-subsidise other municipal services.
Vote Description 2010/11 2011/12 2012/13
R thousandAudited
Outcome
Audited
Outcome
Audited
Outcome
Original
Budget
Adjusted
Budget
Full Year
Forecast
Budget Year
2014/15
Budget Year
+1 2015/16
Budget Year
+2 2016/17
Electricity
Total Rev enue 107,453 95,932 118,716 135,143 115,143 115,143 146,052 153,939 162,251
Operating ex penditure 162,731 184,394 220,289 156,923 157,365 157,365 165,768 172,016 180,296
Surplus (Deficit) for the year (55,277) (88,462) (101,574) (21,780) (42,222) (42,222) (19,716) (18,077) (18,044)
Percentage Surplus/ (Deficit) -51% -92% -86% -16% -37% -37% -13% -12% -11%
Water
Total Rev enue 14,683 31,208 37,644 46,848 46,848 46,848 40,311 42,487 44,782
Operating ex penditure 25,830 29,269 34,968 25,981 26,042 26,042 25,686 26,655 27,938
Surplus (Deficit) for the year (11,147) 1,939 2,676 20,867 20,806 20,806 14,624 15,832 16,843
Percentage Surplus/ (Deficit) -76% 6% 7% 45% 44% 44% 36% 37% 38%
Current Year 2013/142014/15 Medium Term Revenue &
Expenditure Framework

Ngwathe Local Municipality 2014/15 Annual Budget and MTREF
26
Table 18 MBRR Table A4 - Budgeted Financial Performance (revenue and expenditure)
Description Ref 2010/11 2011/12 2012/13
R thousand 1Audited
Outcome
Audited
Outcome
Audited
Outcome
Original
Budget
Adjusted
Budget
Full Year
Forecast
Pre-audit
outcome
Budget Year
2014/15
Budget Year
+1 2015/16
Budget Year
+2 2016/17
Revenue By Source
Property rates 2 52,341 68,562 48,723 48,489 48,489 48,489 – 51,297 54,067 56,986
Property rates - penalties & collection charges – –
Serv ice charges - electricity rev enue 2 78,201 70,468 132,624 133,997 113,997 113,997 – 145,557 153,417 161,702
Serv ice charges - w ater rev enue 2 22,503 31,208 67,638 35,685 35,685 35,685 – 40,111 42,276 44,559
Serv ice charges - sanitation rev enue 2 24,419 28,433 30,205 33,068 33,068 35,785 – 37,057 39,058 41,168
Serv ice charges - refuse rev enue 2 21,607 24,757 25,692 27,971 27,971 27,971 – 35,148 37,045 39,046
Serv ice charges - other (14,372) – 3,817 2,317 2,317 – – –
Rental of facilities and equipment 1,574 252 2,291 2,242 1,742 1,742 1,420 1,497 1,578
Interest earned - ex ternal inv estments 13,447 575 1,435 575 2,275 2,275 2,757 2,905 3,062
Interest earned - outstanding debtors – 17,103 20,008 9,251 2,251 2,251 2,500 2,635 2,777
Div idends receiv ed – – – 1 1 1 – – –
Fines 1,113 775 1,097 2,430 730 730 1,000 1,054 1,111
Licences and permits – – – – – – 1 1 1
Agency serv ices – – – – – – – – –
Transfers recognised - operational 126,766 160,047 156,259 159,631 159,631 159,631 163,765 168,563 166,342
Other rev enue 2 4,038 2,137 1,728 834 834 834 – 3,074 3,159 3,249
Gains on disposal of PPE – –
Total Revenue (excluding capital transfers
and contributions)
331,637 404,317 487,698 457,992 428,992 431,709 – 483,685 505,678 521,580
Expenditure By Type
Employ ee related costs 2 117,048 119,273 173,707 132,068 131,270 131,270 – 138,928 146,678 154,924
Remuneration of councillors 8,314 8,615 9,047 9,793 9,793 9,793 10,442 11,006 11,600
Debt impairment 3 18,959 49,058 59,461 43,198 43,198 43,198 40,000 42,160 44,437
Depreciation & asset impairment 2 112,461 98,144 97,195 2,200 2,200 2,200 – 95,000 90,000 90,000
Finance charges 6,379 10,389 3,274 2,900 2,900 2,900 3,000 2,500 2,000
Bulk purchases 2 111,659 114,069 128,866 152,157 152,157 152,157 – 163,401 173,859 184,986
Other materials 8 16,258 – – – – 10,100 10,645 11,220
Contracted serv ices 3,833 1,884 8,507 15,880 16,880 16,880 – 15,300 15,453 16,142
Transfers and grants – – – 38,526 18,526 18,526 – 38,526 40,607 42,800
Other ex penditure 4, 5 51,079 103,929 123,696 61,271 60,989 60,989 – 72,766 76,694 80,838
Loss on disposal of PPE – – – – –
Total Expenditure 445,990 505,361 603,752 457,992 437,913 437,913 – 587,463 609,602 638,947
Surplus/(Deficit) (114,353) (101,044) (116,055) (0) (8,921) (6,204) – (103,778) (103,924) (117,367)
Transfers recognised - capital 45,939 67,889 67,889 67,889 44,881 47,007 48,744
Contributions recognised - capital 6 – – – – – – – – – –
Contributed assets
Surplus/(Deficit) after capital transfers &
contributions
(114,353) (101,044) (70,115) 67,889 58,968 61,685 – (58,897) (56,917) (68,623)
Tax ation
Surplus/(Deficit) after taxation (114,353) (101,044) (70,115) 67,889 58,968 61,685 – (58,897) (56,917) (68,623)
Attributable to minorities
Surplus/(Deficit) attributable to municipality (114,353) (101,044) (70,115) 67,889 58,968 61,685 – (58,897) (56,917) (68,623)
Share of surplus/ (deficit) of associate 7
Surplus/(Deficit) for the year (114,353) (101,044) (70,115) 67,889 58,968 61,685 – (58,897) (56,917) (68,623)
2014/15 Medium Term Revenue &
Expenditure FrameworkCurrent Year 2013/14

Ngwathe Local Municipality 2014/15 Annual Budget and MTREF
27
Explanatory notes to Table A4 - Budgeted Financial Performance (revenue and expenditure) 1. Total revenue is R483.7 million in 2014/15 and escalates to R521.6 million by 2016/17. This
represents a year-on-year increase of 4.5 per cent for the 2015/16 financial year and 3.1 per cent for the 2016/17 financial year.
2. Revenue to be generated from property rates is R51.3 million in the 2014/15 financial year and increases to R56.9 million by 2016/17 which represents 10.7 per cent of the operating revenue base of the Municipality and therefore remains a significant funding source for the municipality. It remains relatively constant over the medium-term and tariff increases have been factored in at 5.6 per cent, 5.4 per cent and 5.4 per cent for each of the respective financial years of the MTREF.
3. Services charges relating to electricity, water, sanitation and refuse removal constitutes the biggest component of the revenue basket of the City totalling R257.9 million for the 2014/15 financial year and increasing to R286.5 million by 2016/17. For the 2014/15 financial year services charges amount to 54 per cent of the total revenue base and grows by 1 per cent per annum over the medium-term. This growth can mainly be attributed to the increase in the bulk prices of electricity and water.
4. Transfers recognised – operating includes the local government equitable share and other operating grants from national government as gazetted.
5. Bulk purchases have significantly increased over the 2010/11 to 2016/17 period escalating from R111.6 million to R184.9 million. These increases can be attributed to the substantial increase in the cost of bulk electricity from Eskom and water from Rand Water.
6. Employee related costs and bulk purchases are the main cost drivers within the municipality and alternative operational gains and efficiencies will have to be identified to lessen the impact of wage and bulk tariff increases in future years.

Ngwathe Local Municipality 2014/15 Annual Budget and MTREF
28
Table 19 MBRR Table A5 - Budgeted Capital Expenditure by vote, standard classification and funding source
Vote Description Ref 2010/11 2011/12 2012/13
R thousand 1Audited
Outcome
Audited
Outcome
Audited
Outcome
Original
Budget
Adjusted
Budget
Full Year
Forecast
Pre-audit
outcome
Budget Year
2014/15
Budget Year
+1 2015/16
Budget Year
+2 2016/17
Capital expenditure - Vote
Multi-year expenditure to be appropriated 2
Vote 1 - Ex ecutiv e and Council – – – – – – – – – –
Vote 2 - Finance and Admin – – – – – – – – – –
Vote 3 - Planning and Dev elopment – – – – – – – – – –
Vote 4 - Community and Social serv ices – – – – – – – – – –
Vote 5 - Housing – – – – – – – – – –
Vote 6 - Public Safety – – – – – – – – – –
Vote 7 - Sports and Recreation – – – – – – – – – –
Vote 8 - Waste Management – – – – – – – – – –
Vote 9 - Waste Water Management – – – – – – – – – –
Vote 10 - Road Transport – – – – – – – – – –
Vote 11 - Water – – – – – – – – – –
Vote 12 - Electricity – – – – – – – – – –
Vote 13 - Technical Serv ices and PMU – – – – – – – – – –
Vote 14 - Airport – – – – – – – – – –
Vote 15 - [NAME OF VOTE 15] – – – – – – – – – –
Capital multi-year expenditure sub-total 7 – – – – – – – – – –
Single-year expenditure to be appropriated 2
Vote 1 - Ex ecutiv e and Council 3,956 759 – – – – – 5,500 – –
Vote 2 - Finance and Admin – 780 – – – – – 2,000 – –
Vote 3 - Planning and Dev elopment – – – – – – – – – –
Vote 4 - Community and Social serv ices – – – – – – – 2,500 – –
Vote 5 - Housing – – – – – – – – – –
Vote 6 - Public Safety – – – – – – – 3,760 – –
Vote 7 - Sports and Recreation – – – 8,604 8,604 8,604 – 5,981 6,385 –
Vote 8 - Waste Management – – – – – – – 9,303 14,500 –
Vote 9 - Waste Water Management – 6,741 – 13,596 34,996 34,996 – 12,100 1,650 –
Vote 10 - Road Transport – – – 9,602 9,602 3,602 – 2,878 12,321 –
Vote 11 - Water – – – 19,693 19,693 19,693 – 12,676 4,100 –
Vote 12 - Electricity – – – 20,000 20,000 20,000 – 8,000 6,000 –
Vote 13 - Technical Serv ices and PMU – – – 2,394 2,394 2,394 – 1,994 2,050 –
Vote 14 - Airport – – – – – – – – – –
Vote 15 - [NAME OF VOTE 15] – – – – – – – – – –
Capital single-year expenditure sub-total 3,956 8,281 – 73,889 95,289 89,289 – 66,691 47,007 –
Total Capital Expenditure - Vote 3,956 8,281 – 73,889 95,289 89,289 – 66,691 47,007 –
Capital Expenditure - Standard
Governance and administration 3,956 1,539 – – – – – 7,500 – –
Ex ecutiv e and council 3,956 759 5,500 –
Budget and treasury office – – 2,000 –
Corporate serv ices – 780
Community and public safety – – – 8,604 8,604 8,604 – 12,241 6,385 –
Community and social serv ices – – 6,000 –
Sport and recreation – – 8,604 8,604 8,604 5,981 6,385
Public safety – – 260 –
Housing – –
Health – –
Economic and environmental services – – – 9,602 9,602 3,602 – 2,878 12,321 –
Planning and dev elopment – –
Road transport – – 9,602 9,602 3,602 2,878 12,321
Env ironmental protection – –
Trading services – 6,741 – 53,289 74,689 74,689 – 42,078 26,250 –
Electricity – – 20,000 20,000 20,000 8,000 6,000
Water – – 19,693 19,693 19,693 12,676 4,100
Waste w ater management – 6,741 13,596 34,996 34,996 12,100 1,650
Waste management – – – – 9,303 14,500
Other – – 2,394 2,394 2,394 1,994 2,050
Total Capital Expenditure - Standard 3 3,956 8,281 – 73,889 95,289 89,289 – 66,691 47,007 –
Funded by:
National Gov ernment 3,759 7,522 67,889 89,289 89,289 44,881 47,007 48,744
Prov incial Gov ernment
District Municipality
Other transfers and grants
Transfers recognised - capital 4 3,759 7,522 – 67,889 89,289 89,289 – 44,881 47,007 48,744
Public contributions & donations 5
Borrowing 6 6,000 6,000 –
Internally generated funds 197 759 21,810 – –
Total Capital Funding 7 3,956 8,281 – 73,889 95,289 89,289 – 66,691 47,007 48,744
2014/15 Medium Term Revenue &
Expenditure FrameworkCurrent Year 2013/14

Ngwathe Local Municipality 2014/15 Annual Budget and MTREF
29
Explanatory notes to Table A5 - Budgeted Capital Expenditure by vote, standard classification and funding source 1. Table A5 is a breakdown of the capital programme in relation to capital expenditure by
municipal vote (multi-year and single-year appropriations); capital expenditure by standard classification; and the funding sources necessary to fund the capital budget, including information on capital transfers from national and provincial departments.
2. The MFMA provides that a municipality may approve multi-year or single-year capital budget appropriations.
3. Single-year capital expenditure has been appropriated at R66.7million for the 2014/15 financial year and R47 million in the 2015/16 financial year.
4. The capital programme is funded from capital grants and transfers and internally generated funds from current year surpluses. For 2014/15, capital transfers totals R44.9 million (67.3 per cent) and escalates to R48.7 million by 2016/17 (100 per cent). Internally generated funding totaling R21.8 million in the 2014/15 financial year. These funding sources are further discussed in detail in 2.5 (Overview of Budget Funding).
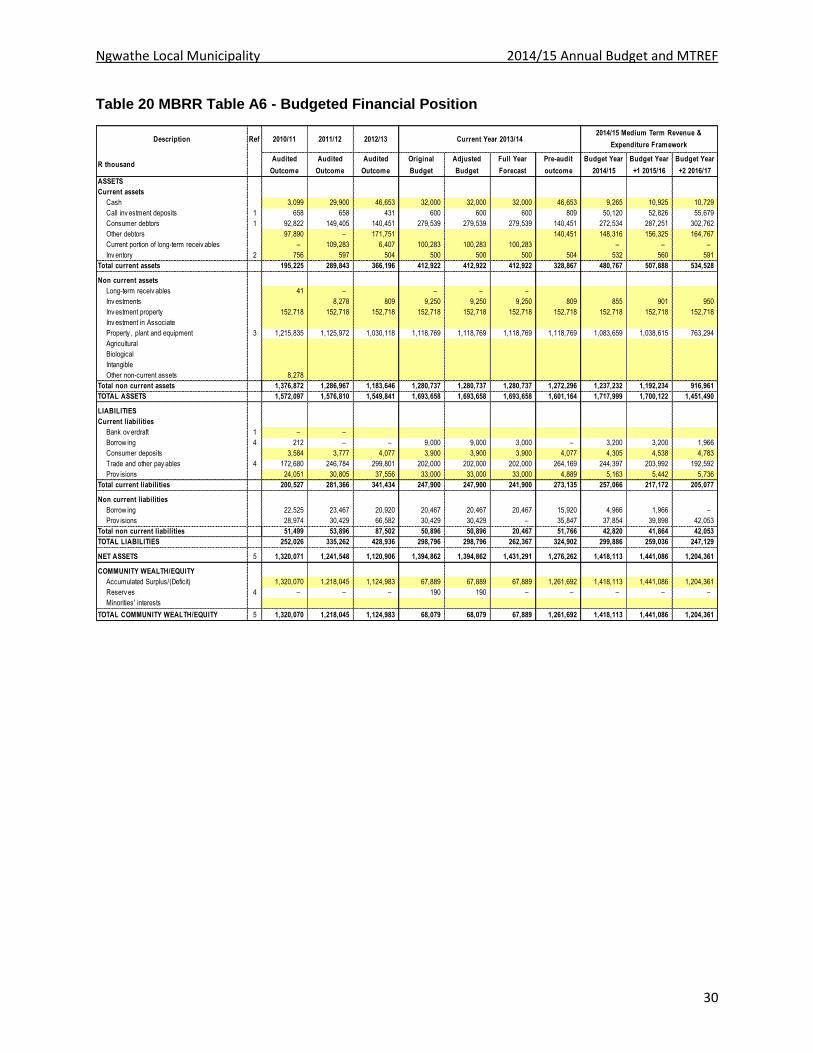
Ngwathe Local Municipality 2014/15 Annual Budget and MTREF
30
Table 20 MBRR Table A6 - Budgeted Financial Position
Description Ref 2010/11 2011/12 2012/13
R thousandAudited
Outcome
Audited
Outcome
Audited
Outcome
Original
Budget
Adjusted
Budget
Full Year
Forecast
Pre-audit
outcome
Budget Year
2014/15
Budget Year
+1 2015/16
Budget Year
+2 2016/17
ASSETS
Current assets
Cash 3,099 29,900 46,653 32,000 32,000 32,000 46,653 9,265 10,925 10,729
Call inv estment deposits 1 658 658 431 600 600 600 809 50,120 52,826 55,679
Consumer debtors 1 92,822 149,405 140,451 279,539 279,539 279,539 140,451 272,534 287,251 302,762
Other debtors 97,890 – 171,751 140,451 148,316 156,325 164,767
Current portion of long-term receiv ables – 109,283 6,407 100,283 100,283 100,283 – – –
Inv entory 2 756 597 504 500 500 500 504 532 560 591
Total current assets 195,225 289,843 366,196 412,922 412,922 412,922 328,867 480,767 507,888 534,528
Non current assets
Long-term receiv ables 41 – – – –
Inv estments 8,278 809 9,250 9,250 9,250 809 855 901 950
Inv estment property 152,718 152,718 152,718 152,718 152,718 152,718 152,718 152,718 152,718 152,718
Inv estment in Associate
Property , plant and equipment 3 1,215,835 1,125,972 1,030,118 1,118,769 1,118,769 1,118,769 1,118,769 1,083,659 1,038,615 763,294
Agricultural
Biological
Intangible
Other non-current assets 8,278
Total non current assets 1,376,872 1,286,967 1,183,646 1,280,737 1,280,737 1,280,737 1,272,296 1,237,232 1,192,234 916,961
TOTAL ASSETS 1,572,097 1,576,810 1,549,841 1,693,658 1,693,658 1,693,658 1,601,164 1,717,999 1,700,122 1,451,490
LIABILITIES
Current liabilities
Bank ov erdraft 1 – –
Borrow ing 4 212 – – 9,000 9,000 3,000 – 3,200 3,200 1,966
Consumer deposits 3,584 3,777 4,077 3,900 3,900 3,900 4,077 4,305 4,538 4,783
Trade and other pay ables 4 172,680 246,784 299,801 202,000 202,000 202,000 264,169 244,397 203,992 192,592
Prov isions 24,051 30,805 37,556 33,000 33,000 33,000 4,889 5,163 5,442 5,736
Total current liabilities 200,527 281,366 341,434 247,900 247,900 241,900 273,135 257,066 217,172 205,077
Non current liabilities
Borrow ing 22,525 23,467 20,920 20,467 20,467 20,467 15,920 4,966 1,966 –
Prov isions 28,974 30,429 66,582 30,429 30,429 – 35,847 37,854 39,898 42,053
Total non current liabilities 51,499 53,896 87,502 50,896 50,896 20,467 51,766 42,820 41,864 42,053
TOTAL LIABILITIES 252,026 335,262 428,936 298,796 298,796 262,367 324,902 299,886 259,036 247,129
NET ASSETS 5 1,320,071 1,241,548 1,120,906 1,394,862 1,394,862 1,431,291 1,276,262 1,418,113 1,441,086 1,204,361
COMMUNITY WEALTH/EQUITY
Accumulated Surplus/(Deficit) 1,320,070 1,218,045 1,124,983 67,889 67,889 67,889 1,261,692 1,418,113 1,441,086 1,204,361
Reserv es 4 – – – 190 190 – – – – –
Minorities' interests
TOTAL COMMUNITY WEALTH/EQUITY 5 1,320,070 1,218,045 1,124,983 68,079 68,079 67,889 1,261,692 1,418,113 1,441,086 1,204,361
2014/15 Medium Term Revenue &
Expenditure FrameworkCurrent Year 2013/14
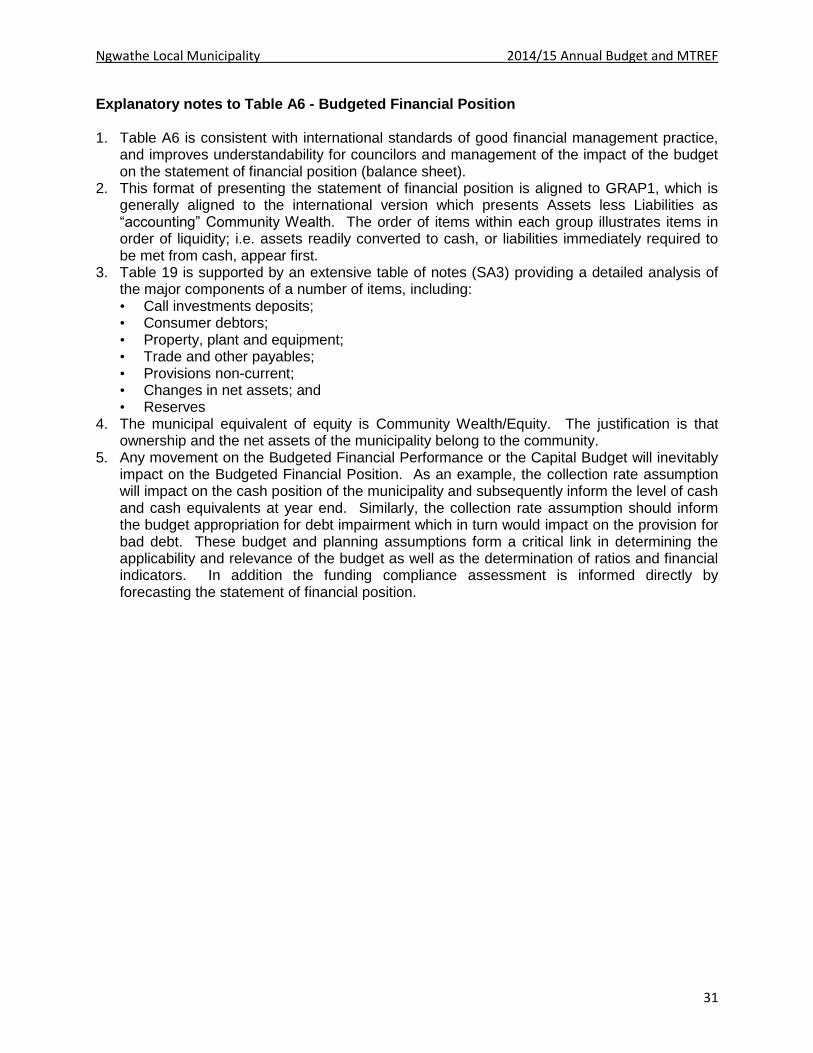
Ngwathe Local Municipality 2014/15 Annual Budget and MTREF
31
Explanatory notes to Table A6 - Budgeted Financial Position 1. Table A6 is consistent with international standards of good financial management practice,
and improves understandability for councilors and management of the impact of the budget on the statement of financial position (balance sheet).
2. This format of presenting the statement of financial position is aligned to GRAP1, which is generally aligned to the international version which presents Assets less Liabilities as “accounting” Community Wealth. The order of items within each group illustrates items in order of liquidity; i.e. assets readily converted to cash, or liabilities immediately required to be met from cash, appear first.
3. Table 19 is supported by an extensive table of notes (SA3) providing a detailed analysis of the major components of a number of items, including: • Call investments deposits; • Consumer debtors; • Property, plant and equipment; • Trade and other payables; • Provisions non-current; • Changes in net assets; and • Reserves
4. The municipal equivalent of equity is Community Wealth/Equity. The justification is that ownership and the net assets of the municipality belong to the community.
5. Any movement on the Budgeted Financial Performance or the Capital Budget will inevitably impact on the Budgeted Financial Position. As an example, the collection rate assumption will impact on the cash position of the municipality and subsequently inform the level of cash and cash equivalents at year end. Similarly, the collection rate assumption should inform the budget appropriation for debt impairment which in turn would impact on the provision for bad debt. These budget and planning assumptions form a critical link in determining the applicability and relevance of the budget as well as the determination of ratios and financial indicators. In addition the funding compliance assessment is informed directly by forecasting the statement of financial position.

Ngwathe Local Municipality 2014/15 Annual Budget and MTREF
32
Table 21 MBRR Table A7 - Budgeted Cash Flow Statement
Table 22 MBRR Table A8 - Cash Backed Reserves/Accumulated Surplus Reconciliation
Description Ref 2010/11 2011/12 2012/13
R thousandAudited
Outcome
Audited
Outcome
Audited
Outcome
Original
Budget
Adjusted
Budget
Full Year
Forecast
Pre-audit
outcome
Budget Year
2014/15
Budget Year
+1 2015/16
Budget Year
+2 2016/17
CASH FLOW FROM OPERATING ACTIVITIES
Receipts
Ratepay ers and other 138,500 182,928 228,633 187,547 172,142 172,142 235,997 265,259 279,518
Gov ernment - operating 1 126,766 160,385 157,198 159,631 159,631 159,631 163,765 168,563 166,342
Gov ernment - capital 1 – (338) 45,939 67,889 89,289 89,289 44,881 47,007 48,744
Interest 13,233 17,678 21,443 6,588 3,738 3,738 4,632 4,882 5,145
Div idends – 1 – 1 1 1 – – –
Payments
Suppliers and employ ees (242,292) (315,103) (429,748) (341,148) (354,157) (354,157) (383,764) (398,408) (426,088)
Finance charges (1) (10,384) (3,274) – – – – –
Transfers and Grants 1 – – (38,526) (18,526) (18,526) (38,526) (40,607) (42,800)
NET CASH FROM/(USED) OPERATING ACTIVITIES 36,206 35,168 20,191 41,982 52,118 52,118 – 26,985 46,696 30,862
CASH FLOWS FROM INVESTING ACTIVITIES
Receipts
Proceeds on disposal of PPE 2,368 – (65)
Decrease (Increase) in non-current debtors – – –
Decrease (increase) other non-current receiv ables – – –
Decrease (increase) in non-current inv estments – – –
Payments
Capital assets (8,564) (8,281) (1,342) (73,889) (95,289) (89,289) (66,691) (47,007) (48,744)
NET CASH FROM/(USED) INVESTING ACTIVITIES (6,196) (8,281) (1,407) (73,889) (95,289) (89,289) – (66,691) (47,007) (48,744)
CASH FLOWS FROM FINANCING ACTIVITIES
Receipts
Short term loans – – – 6,000 6,000 –
Borrow ing long term/refinancing – – –
Increase (decrease) in consumer deposits – – –
Payments
Repay ment of borrow ing (3,200) (424) (2,032) (2,900) (2,900) (2,900) (3,000) (2,500) (2,000)
NET CASH FROM/(USED) FINANCING ACTIVITIES (3,200) (424) (2,032) 3,100 3,100 (2,900) – (3,000) (2,500) (2,000)
NET INCREASE/ (DECREASE) IN CASH HELD 26,810 26,464 16,753 (28,807) (40,071) (40,071) – (42,706) (2,811) (19,882)
Cash/cash equiv alents at the y ear begin: 2 (23,711) 3,099 29,562 46,315 46,315 46,315 46,315 46,315 3,609 798
Cash/cash equiv alents at the y ear end: 2 3,099 29,562 46,315 17,508 6,244 6,244 46,315 3,609 798 (19,084)
2014/15 Medium Term Revenue &
Expenditure FrameworkCurrent Year 2013/14
Description Ref 2010/11 2011/12 2012/13
R thousandAudited
Outcome
Audited
Outcome
Audited
Outcome
Original
Budget
Adjusted
Budget
Full Year
Forecast
Pre-audit
outcome
Budget Year
2014/15
Budget Year
+1 2015/16
Budget Year
+2 2016/17
Cash and investments available
Cash/cash equiv alents at the y ear end 1 3,099 29,562 46,315 17,508 6,244 6,244 46,315 3,609 798 (19,084)
Other current inv estments > 90 day s 658 996 (45,075) 15,092 26,356 26,356 1,147 55,776 62,954 85,493
Non current assets - Inv estments 1 – 8,278 – 9,250 9,250 9,250 809 855 901 950
Cash and investments available: 3,757 38,836 1,240 41,850 41,850 41,850 48,271 60,240 64,653 67,358
Application of cash and investments
Unspent conditional transfers – 37,966 21,400 – – – – – – –
Unspent borrow ing – – – – – – – – –
Statutory requirements 2
Other w orking capital requirements 3 34,665 92,569 162,785 23,945 19,831 21,645 260,092 (73,057) (151,971) (180,982)
Other prov isions
Long term inv estments committed 4 – – – – – – – – – –
Reserv es to be backed by cash/inv estments 5
Total Application of cash and investments: 34,665 130,534 184,185 23,945 19,831 21,645 260,092 (73,057) (151,971) (180,982)
Surplus(shortfall) (30,908) (91,699) (182,945) 17,905 22,019 20,205 (211,821) 133,297 216,624 248,340
2014/15 Medium Term Revenue &
Expenditure FrameworkCurrent Year 2013/14

Ngwathe Local Municipality 2014/15 Annual Budget and MTREF
33
Explanatory notes to Table A7 - Budgeted Cash Flow Statement 1. The budgeted cash flow statement is the first measurement in determining if the budget is
funded. 2. It shows the expected level of cash in-flow versus cash out-flow that is likely to result from
the implementation of the budget. 3. It can be seen that the cash levels of the Municipality increase significantly over the 2010/11
to 2012/13 period owing directly to a net increase in cash for the 2010/11, 2011/12 and 2012/13 financial years.
Explanatory notes to Table A8 - Cash Backed Reserves/Accumulated Surplus Reconciliation 1. The cash backed reserves/accumulated surplus reconciliation is aligned to the requirements
of MFMA Circular 42 – Funding a Municipal Budget. 2. In essence the table evaluates the funding levels of the budget by firstly forecasting the cash
and investments at year end and secondly reconciling the available funding to the liabilities/commitments that exist.
3. The outcome of this exercise would either be a surplus or deficit. A deficit would indicate that the applications exceed the cash and investments available and would be indicative of non-compliance with the MFMA requirements that the municipality’s budget must be “funded”.
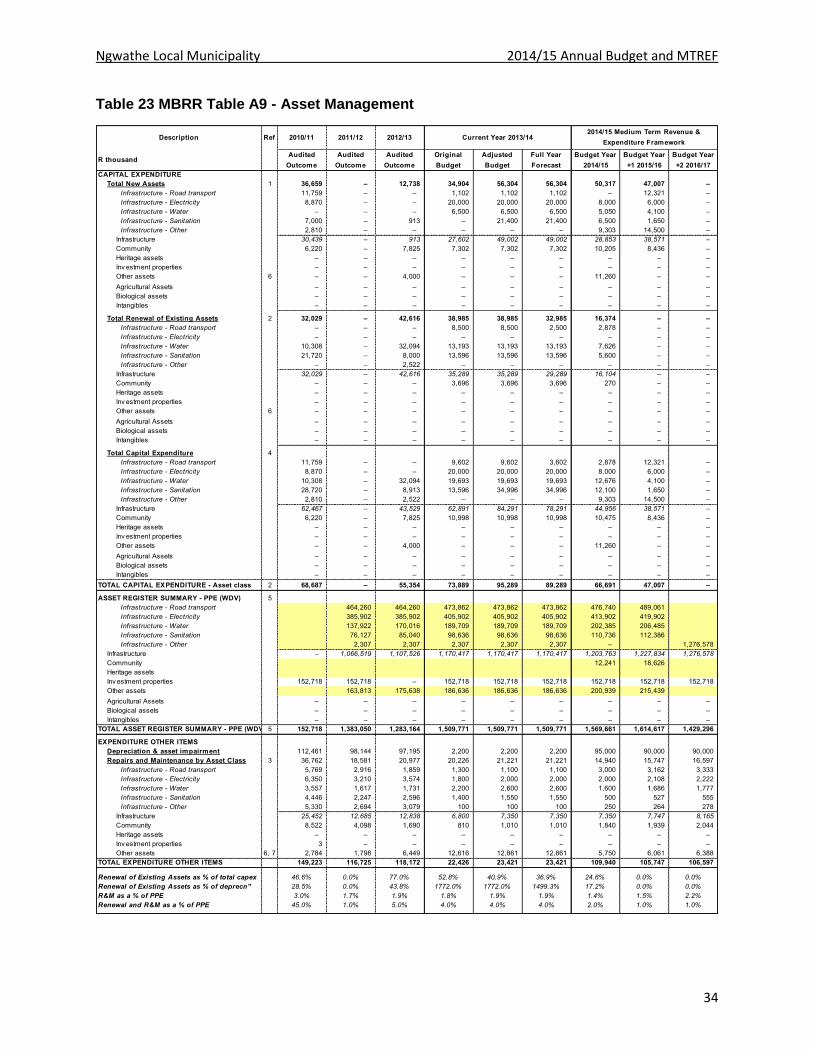
Ngwathe Local Municipality 2014/15 Annual Budget and MTREF
34
Table 23 MBRR Table A9 - Asset Management
Description Ref 2010/11 2011/12 2012/13
R thousandAudited
Outcome
Audited
Outcome
Audited
Outcome
Original
Budget
Adjusted
Budget
Full Year
Forecast
Budget Year
2014/15
Budget Year
+1 2015/16
Budget Year
+2 2016/17
CAPITAL EXPENDITURE
Total New Assets 1 36,659 – 12,738 34,904 56,304 56,304 50,317 47,007 –
Infrastructure - Road transport 11,759 – – 1,102 1,102 1,102 – 12,321 –
Infrastructure - Electricity 8,870 – – 20,000 20,000 20,000 8,000 6,000 –
Infrastructure - Water – – – 6,500 6,500 6,500 5,050 4,100 –
Infrastructure - Sanitation 7,000 – 913 – 21,400 21,400 6,500 1,650 –
Infrastructure - Other 2,810 – – – – – 9,303 14,500 –
Infrastructure 30,439 – 913 27,602 49,002 49,002 28,853 38,571 –
Community 6,220 – 7,825 7,302 7,302 7,302 10,205 8,436 –
Heritage assets – – – – – – – – –
Inv estment properties – – – – – – – – –
Other assets 6 – – 4,000 – – – 11,260 – –
Agricultural Assets – – – – – – – – –
Biological assets – – – – – – – – –
Intangibles – – – – – – – – –
Total Renewal of Existing Assets 2 32,029 – 42,616 38,985 38,985 32,985 16,374 – –
Infrastructure - Road transport – – – 8,500 8,500 2,500 2,878 – –
Infrastructure - Electricity – – – – – – – – –
Infrastructure - Water 10,308 – 32,094 13,193 13,193 13,193 7,626 – –
Infrastructure - Sanitation 21,720 – 8,000 13,596 13,596 13,596 5,600 – –
Infrastructure - Other – – 2,522 – – – – – –
Infrastructure 32,029 – 42,616 35,289 35,289 29,289 16,104 – –
Community – – – 3,696 3,696 3,696 270 – –
Heritage assets – – – – – – – – –
Inv estment properties – – – – – – – – –
Other assets 6 – – – – – – – – –
Agricultural Assets – – – – – – – – –
Biological assets – – – – – – – – –
Intangibles – – – – – – – – –
Total Capital Expenditure 4
Infrastructure - Road transport 11,759 – – 9,602 9,602 3,602 2,878 12,321 –
Infrastructure - Electricity 8,870 – – 20,000 20,000 20,000 8,000 6,000 –
Infrastructure - Water 10,308 – 32,094 19,693 19,693 19,693 12,676 4,100 –
Infrastructure - Sanitation 28,720 – 8,913 13,596 34,996 34,996 12,100 1,650 –
Infrastructure - Other 2,810 – 2,522 – – – 9,303 14,500 –
Infrastructure 62,467 – 43,529 62,891 84,291 78,291 44,956 38,571 –
Community 6,220 – 7,825 10,998 10,998 10,998 10,475 8,436 –
Heritage assets – – – – – – – – –
Inv estment properties – – – – – – – – –
Other assets – – 4,000 – – – 11,260 – –
Agricultural Assets – – – – – – – – –
Biological assets – – – – – – – – –
Intangibles – – – – – – – – –
TOTAL CAPITAL EXPENDITURE - Asset class 2 68,687 – 55,354 73,889 95,289 89,289 66,691 47,007 –
ASSET REGISTER SUMMARY - PPE (WDV) 5
Infrastructure - Road transport 464,260 464,260 473,862 473,862 473,862 476,740 489,061
Infrastructure - Electricity 385,902 385,902 405,902 405,902 405,902 413,902 419,902
Infrastructure - Water 137,922 170,016 189,709 189,709 189,709 202,385 206,485
Infrastructure - Sanitation 76,127 85,040 98,636 98,636 98,636 110,736 112,386
Infrastructure - Other 2,307 2,307 2,307 2,307 2,307 – 1,276,578
Infrastructure – 1,066,519 1,107,526 1,170,417 1,170,417 1,170,417 1,203,763 1,227,834 1,276,578
Community 12,241 18,626
Heritage assets
Inv estment properties 152,718 152,718 – 152,718 152,718 152,718 152,718 152,718 152,718
Other assets 163,813 175,638 186,636 186,636 186,636 200,939 215,439
Agricultural Assets – – – – – – – – –
Biological assets – – – – – – – – –
Intangibles – – – – – – – – –
TOTAL ASSET REGISTER SUMMARY - PPE (WDV) 5 152,718 1,383,050 1,283,164 1,509,771 1,509,771 1,509,771 1,569,661 1,614,617 1,429,296
EXPENDITURE OTHER ITEMS
Depreciation & asset impairment 112,461 98,144 97,195 2,200 2,200 2,200 95,000 90,000 90,000
Repairs and Maintenance by Asset Class 3 36,762 18,581 20,977 20,226 21,221 21,221 14,940 15,747 16,597
Infrastructure - Road transport 5,769 2,916 1,859 1,300 1,100 1,100 3,000 3,162 3,333
Infrastructure - Electricity 6,350 3,210 3,574 1,800 2,000 2,000 2,000 2,108 2,222
Infrastructure - Water 3,557 1,617 1,731 2,200 2,600 2,600 1,600 1,686 1,777
Infrastructure - Sanitation 4,446 2,247 2,596 1,400 1,550 1,550 500 527 555
Infrastructure - Other 5,330 2,694 3,079 100 100 100 250 264 278
Infrastructure 25,452 12,685 12,838 6,800 7,350 7,350 7,350 7,747 8,165
Community 8,522 4,098 1,690 810 1,010 1,010 1,840 1,939 2,044
Heritage assets – – – – – – – – –
Inv estment properties 3 – – – – – – – –
Other assets 6, 7 2,784 1,798 6,449 12,616 12,861 12,861 5,750 6,061 6,388
TOTAL EXPENDITURE OTHER ITEMS 149,223 116,725 118,172 22,426 23,421 23,421 109,940 105,747 106,597
Renewal of Existing Assets as % of total capex 46.6% 0.0% 77.0% 52.8% 40.9% 36.9% 24.6% 0.0% 0.0%
Renewal of Existing Assets as % of deprecn" 28.5% 0.0% 43.8% 1772.0% 1772.0% 1499.3% 17.2% 0.0% 0.0%
R&M as a % of PPE 3.0% 1.7% 1.9% 1.8% 1.9% 1.9% 1.4% 1.5% 2.2%
Renewal and R&M as a % of PPE 45.0% 1.0% 5.0% 4.0% 4.0% 4.0% 2.0% 1.0% 1.0%
Current Year 2013/142014/15 Medium Term Revenue &
Expenditure Framework

Ngwathe Local Municipality 2014/15 Annual Budget and MTREF
35
Explanatory notes to Table A9 - Asset Management
1. Table A9 provides an overview of municipal capital allocations to building new assets and the renewal of existing assets, as well as spending on repairs and maintenance by asset class.
2. National Treasury has recommended that municipalities should allocate at least 40 per cent of their capital budget to the renewal of existing assets, and allocations to repairs and maintenance should be 8 per cent of PPE.

Ngwathe Local Municipality 2014/15 Annual Budget and MTREF
36
Table 24 MBRR Table A10 - Basic Service Delivery Measurement
2010/11 2011/12 2012/13
Outcome Outcome OutcomeOriginal
Budget
Adjusted
Budget
Full Year
Forecast
Budget Year
2014/15
Budget Year
+1 2015/16
Budget Year
+2 2016/17
Household service targets 1
Water:
Piped w ater inside dw elling 20,380 20,380 23,005 23,005 23,005 23,005 23,005 23,005
Piped w ater inside y ard (but not in dw elling) 11,016 11,016 9,914 9,914 9,914 9,914 9,914 9,914
Using public tap (at least min.serv ice lev el) 2 2,188 2,188 783 783 783 783 783 783
Other w ater supply (at least min.serv ice lev el) 4
Minimum Service Level and Above sub-total 33,584 33,584 – 33,702 33,702 33,702 33,702 33,702 33,702
Using public tap (< min.serv ice lev el) 3
Other w ater supply (< min.serv ice lev el) 4
No w ater supply
Below Minimum Service Level sub-total – – – – – – – – –
Total number of households 5 33,584 33,584 – 33,702 33,702 33,702 33,702 33,702 33,702
Sanitation/sewerage:
Flush toilet (connected to sew erage) 43,429 43,429 50,120 50,120 50,120 25,764 27,389 27,389
Flush toilet (w ith septic tank) 410 410 410 410 410 – – –
Chemical toilet 290 290 290 290 290 2,410 2,410 2,410
Pit toilet (v entilated) 7,859 7,859 8,958 8,958 8,958 3,010 2,232 2,232
Other toilet prov isions (> min.serv ice lev el) 33,967 33,967 39,033 39,033 39,033 – – –
Minimum Service Level and Above sub-total 85,955 85,955 – 98,811 98,811 98,811 31,184 32,031 32,031
Bucket toilet 2,472 2,472 2,472 2,472 2,472 847 – –
Other toilet prov isions (< min.serv ice lev el) – –
No toilet prov isions 220 220 220 220 220 220 220 220
Below Minimum Service Level sub-total 2,692 2,692 – 2,692 2,692 2,692 1,067 220 220
Total number of households 5 88,647 88,647 – 101,503 101,503 101,503 32,251 32,251 32,251
Energy:
Electricity (at least min.serv ice lev el) 10,238 10,238 11,262 11,262 11,262 11,262 11,262 11,262
Electricity - prepaid (min.serv ice lev el) 11,920 11,920 10,728 10,728 10,728 10,728 10,728 10,728
Minimum Service Level and Above sub-total 22,158 22,158 – 21,990 21,990 21,990 21,990 21,990 21,990
Electricity (< min.serv ice lev el)
Electricity - prepaid (< min. serv ice lev el)
Other energy sources
Below Minimum Service Level sub-total – – – – – – – – –
Total number of households 5 22,158 22,158 – 21,990 21,990 21,990 21,990 21,990 21,990
Refuse:
Remov ed at least once a w eek 37,000 37,000 38,000 38,000 38,000 38,000 38,000 38,000
Minimum Service Level and Above sub-total 37,000 37,000 – 38,000 38,000 38,000 38,000 38,000 38,000
Remov ed less frequently than once a w eek
Using communal refuse dump
Using ow n refuse dump
Other rubbish disposal
No rubbish disposal
Below Minimum Service Level sub-total – – – – – – – – –
Total number of households 5 37,000 37,000 – 38,000 38,000 38,000 38,000 38,000 38,000
Households receiving Free Basic Service 7
Water (6 kilolitres per household per month) 18,000 18,000 16,000 5,000 5,000 16,000 16,000 16,000
Sanitation (free minimum lev el serv ice) 18,000 18,000 16,000 5,000 5,000 13,000 13,000 13,000
Electricity /other energy (50kw h per household per month) 18,000 18,000 16,000 5,000 5,000 16,000 16,000 16,000
Refuse (remov ed at least once a w eek) 18,000 18,000 16,000 5,000 5,000 13,000 13,000 13,000
Cost of Free Basic Services provided (R'000) 8
Water (6 kilolitres per household per month) 14,400 14,400 115 121 127
Sanitation (free sanitation serv ice) 13,300 13,300 1,042 1,098 1,158
Electricity /other energy (50kw h per household per month) 17,800 17,800 1,028 1,083 1,141
Refuse (remov ed once a w eek) 12,000 12,000 989 1,043 1,099
Total cost of FBS provided (minimum social package) 57,500 57,500 – – – – 3,174 3,345 3,525
Highest level of free service provided
Property rates (R v alue threshold) – – – 42,000 42,000 42,000 25,000 25,000 25,000
Water (kilolitres per household per month) 6 6 6 6 6 6 6 6 6
Sanitation (kilolitres per household per month) 6 6 6 6 6 6 6 6 6
Sanitation (Rand per household per month) – – – – – – – – –
Electricity (kw h per household per month) 55 55 55 50 50 50 50 50 50
Refuse (av erage litres per w eek) – – – – – – – – –
Revenue cost of free services provided (R'000) 9
Property rates (R15 000 threshold rebate) 11 11 444 468 493
Property rates (other ex emptions, reductions
and rebates) – –
Water 14,400 14,400 1,377 1,451 1,530
Sanitation 13,300 13,300 12,505 13,180 13,892
Electricity /other energy 17,800 17,800 12,330 12,996 13,698
Refuse 12,000 12,000 11,870 12,511 13,187
Municipal Housing - rental rebates
Housing - top structure subsidies 6
Other 38,526 18,526 18,526
Total revenue cost of free services provided
(total social package) 57,511 57,511 – 38,526 18,526 18,526 38,526 40,606 42,799
Current Year 2013/142014/15 Medium Term Revenue &
Expenditure FrameworkDescription Ref

Ngwathe Local Municipality 2014/15 Annual Budget and MTREF
37
Explanatory notes to Table A10 - Basic Service Delivery Measurement
1. Table A10 provides an overview of service delivery levels, including backlogs (below minimum service level), for each of the main services.
2. The budget provides for about 15 000 households to be registered as indigent in 2014/15, and therefore entitled to receiving Free Basic Services. The number is set to remain constant and hopefully decline by the 2016/17 financial year with the implementation of the Indigent exit strategy.
3. It is anticipated that these Free Basic Services will cost the municipality R38.5 million in 2014/15, increasing to R42.8 million in 2016/17. This is covered by the municipality’s equitable share allocation from national government.
Ngwathe Local Municipality 2014/15 Annual Budget and MTREF
38
2 Part 2 – Supporting Documentation
2.1 Overview of the annual budget process Section 53 of the MFMA requires the Mayor of the municipality to provide general political guidance in the budget process and the setting of priorities that must guide the preparation of the budget. In addition Chapter 2 of the Municipal Budget and Reporting Regulations states that the Mayor of the municipality must establish a Budget Steering Committee to provide technical assistance to the Mayor in discharging the responsibilities set out in section 53 of the Act. The Budget Steering Committee consists of the Municipal Manager and senior officials of the municipality meeting under the chairpersonship of the honourable mayor. The primary aims of the Budget Steering Committee is to ensure:
that the process followed to compile the budget complies with legislation and good budget practices;
that there is proper alignment between the policy and service delivery priorities set out in the Municipality’s IDP and the budget, taking into account the need to protect the financial sustainability of municipality;
that the municipality’s revenue and tariff setting strategies ensure that the cash resources needed to deliver services are available; and
That the various spending priorities of the different municipal departments are properly evaluated and prioritised in the allocation of resources.
2.1.1 Budget Process Overview
In terms of section 21 of the MFMA the Mayor is required to table in Council ten months before the start of the new financial year (i.e. in August 2013) a time schedule that sets out the process to revise the IDP and prepare the budget. The Mayor tabled in Council the required the IDP and budget time schedule on 26 October 2013.
2.1.2 IDP and Service Delivery and Budget Implementation Plan
This is the third review of the IDP as adopted by Council in May 2011. It started in October 2013 after the tabling of the IDP Process Plan and the Budget Time Schedule for the 2014/15 MTREF in October. The Municipality’s IDP is its principal strategic planning document, which directly guides and informs its planning, budget, management and development actions. This framework is rolled out into objectives, key performance indicators and targets for implementation which directly inform the Service Delivery and Budget Implementation Plan. The Process Plan applicable to the fourth revision cycle included the following key IDP processes and deliverables: • Registration of community needs;

Ngwathe Local Municipality 2014/15 Annual Budget and MTREF
39
• Compilation of departmental business plans including key performance indicators and targets;
• Financial planning and budgeting process; • Public participation process; • Compilation of the SDBIP, and During the compilation of the 2014/15 MTREF, each department/function (at strategic planning session) had to review the business planning process, including the setting of priorities and targets after reviewing the mid-year and third quarter performance against the 2013/14 Departmental Service Delivery and Budget Implementation Plan. Business planning links back to priority needs and master planning, and essentially informed the detailed operating budget appropriations and three-year capital programme.
2.1.3 Financial Modelling and Key Planning Drivers
As part of the compilation of the 2014/15 MTREF, extensive financial modelling was undertaken to ensure affordability and long-term financial sustainability. The following key factors and planning strategies have informed the compilation of the 2014/15 MTREF: • Municipal growth • Policy priorities and strategic objectives • Asset maintenance • Economic climate and trends (i.e. inflation, Eskom increases, household debt) • Performance trends • The approved 2013/14 adjustments budget and performance against the SDBIP • Cash Flow Management Strategy • Debtor payment levels • Loan and investment possibilities • The need for tariff increases versus the ability of the community to pay for services; • Improved and sustainable service delivery In addition to the above, the strategic guidance given in National Treasury’s MFMA Circulars 70 and 72 has been taken into consideration in the planning and prioritisation process.
2.1.4 Community Consultation
The draft 2014/15 MTREF as tabled before Council on 28 March 2014 for community consultation was published on the municipality’s website, and hard copies were made available at customer care offices, municipal notice boards and various libraries. All documents in the appropriate format (electronic and printed) were provided to National Treasury, and other national and provincial departments in accordance with section 23 of the MFMA, to provide an opportunity for them to make inputs. For the draft 2014/15 MTREF budget and IDP, the planned public participation schedule is as follows:
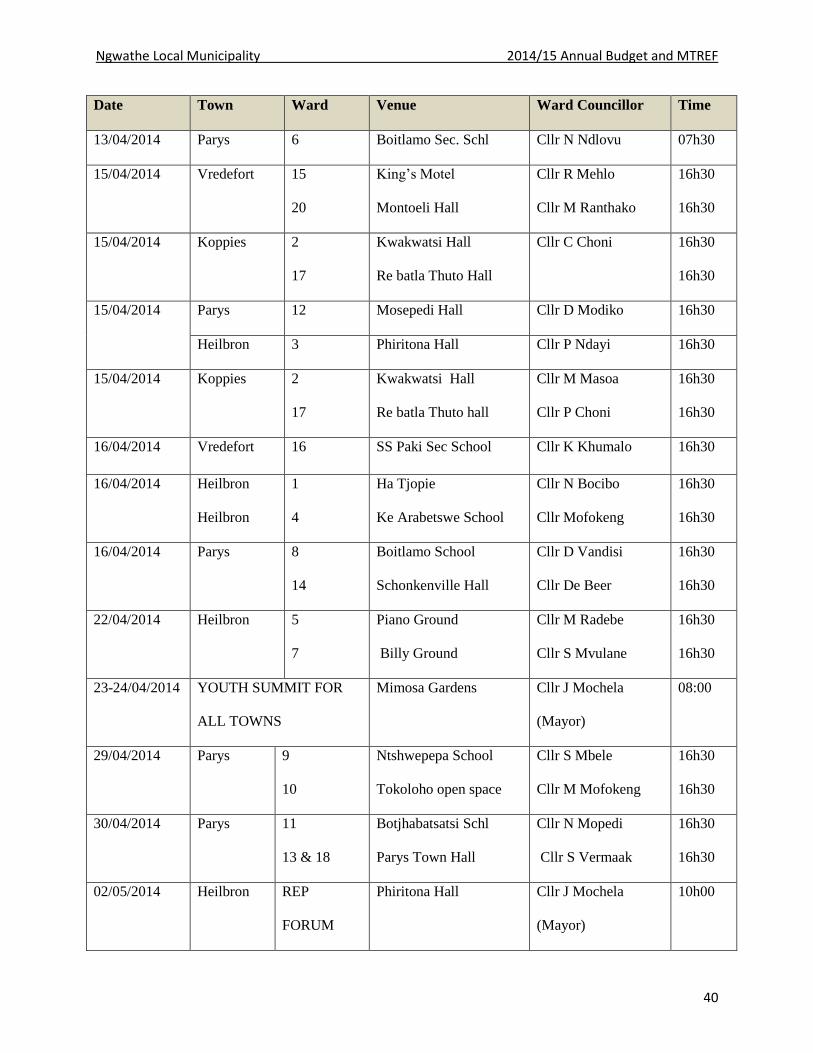
Ngwathe Local Municipality 2014/15 Annual Budget and MTREF
40
Date Town Ward Venue Ward Councillor Time
13/04/2014 Parys 6 Boitlamo Sec. Schl Cllr N Ndlovu 07h30
15/04/2014 Vredefort 15
20
King’s Motel
Montoeli Hall
Cllr R Mehlo
Cllr M Ranthako
16h30
16h30
15/04/2014 Koppies 2
17
Kwakwatsi Hall
Re batla Thuto Hall
Cllr C Choni 16h30
16h30
15/04/2014 Parys 12 Mosepedi Hall Cllr D Modiko 16h30
Heilbron 3 Phiritona Hall Cllr P Ndayi 16h30
15/04/2014 Koppies 2
17
Kwakwatsi Hall
Re batla Thuto hall
Cllr M Masoa
Cllr P Choni
16h30
16h30
16/04/2014 Vredefort 16 SS Paki Sec School Cllr K Khumalo 16h30
16/04/2014 Heilbron
Heilbron
1
4
Ha Tjopie
Ke Arabetswe School
Cllr N Bocibo
Cllr Mofokeng
16h30
16h30
16/04/2014 Parys 8
14
Boitlamo School
Schonkenville Hall
Cllr D Vandisi
Cllr De Beer
16h30
16h30
22/04/2014 Heilbron 5
7
Piano Ground
Billy Ground
Cllr M Radebe
Cllr S Mvulane
16h30
16h30
23-24/04/2014 YOUTH SUMMIT FOR
ALL TOWNS
Mimosa Gardens Cllr J Mochela
(Mayor)
08:00
29/04/2014 Parys 9
10
Ntshwepepa School
Tokoloho open space
Cllr S Mbele
Cllr M Mofokeng
16h30
16h30
30/04/2014 Parys 11
13 & 18
Botjhabatsatsi Schl
Parys Town Hall
Cllr N Mopedi
Cllr S Vermaak
16h30
16h30
02/05/2014 Heilbron REP
FORUM
Phiritona Hall Cllr J Mochela
(Mayor)
10h00
Ngwathe Local Municipality 2014/15 Annual Budget and MTREF
41
2.2 Overview of alignment of annual budget with IDP The Constitution mandates local government with the responsibility to exercise local developmental and cooperative governance. The eradication of imbalances in South African society can only be realized through a credible integrated developmental planning process. Municipalities in South Africa need to utilise integrated development planning as a method to plan future development in their areas and so find the best solutions to achieve sound long-term development goals. A municipal IDP provides a five year strategic programme of action aimed at setting short, medium and long term strategic and budget priorities to create a development platform, which correlates with the term of office of the political incumbents. The plan aligns the resources and the capacity of a municipality to its overall development aims and guides the municipal budget. An IDP is therefore a key instrument which municipalities use to provide vision, leadership and direction to all those that have a role to play in the development of a municipal area. The IDP enables municipalities to make the best use of scarce resources and speed up service delivery. Integrated developmental planning in the South African context is amongst others, an approach to planning aimed at involving the municipality and the community to jointly find the best solutions towards sustainable development. Furthermore, integrated development planning provides a strategic environment for managing and guiding all planning, development and decision making in the municipality. It is important that the IDP developed by municipalities correlate with National and Provincial intent. It must aim to co-ordinate the work of local and other spheres of government in a coherent plan to improve the quality of life for all the people living in that area. Applied to the City, issues of national and provincial importance should be reflected in the IDP of the municipality. A clear understanding of such intent is therefore imperative to ensure that the City strategically complies with the key national and provincial priorities. The aim of this revision cycle was to develop and coordinate a coherent plan to improve the quality of life for all the people living in the area, also reflecting issues of national and provincial importance. One of the key objectives is therefore to ensure that there exists alignment between national and provincial priorities, policies and strategies and the Municipality’s response to these requirements. The national and provincial priorities, policies and strategies of importance include amongst others: • Green Paper on National Strategic Planning of 2009; • Provincial Growth and Development Strategy (GGDS); • National and Provincial spatial development perspectives; • Relevant sector plans such as transportation, legislation and policy; • National Key Performance Indicators (NKPIs); • National Development Priorities; • National Spatial Development Perspective (NSDP) and • The National Priority Outcomes.
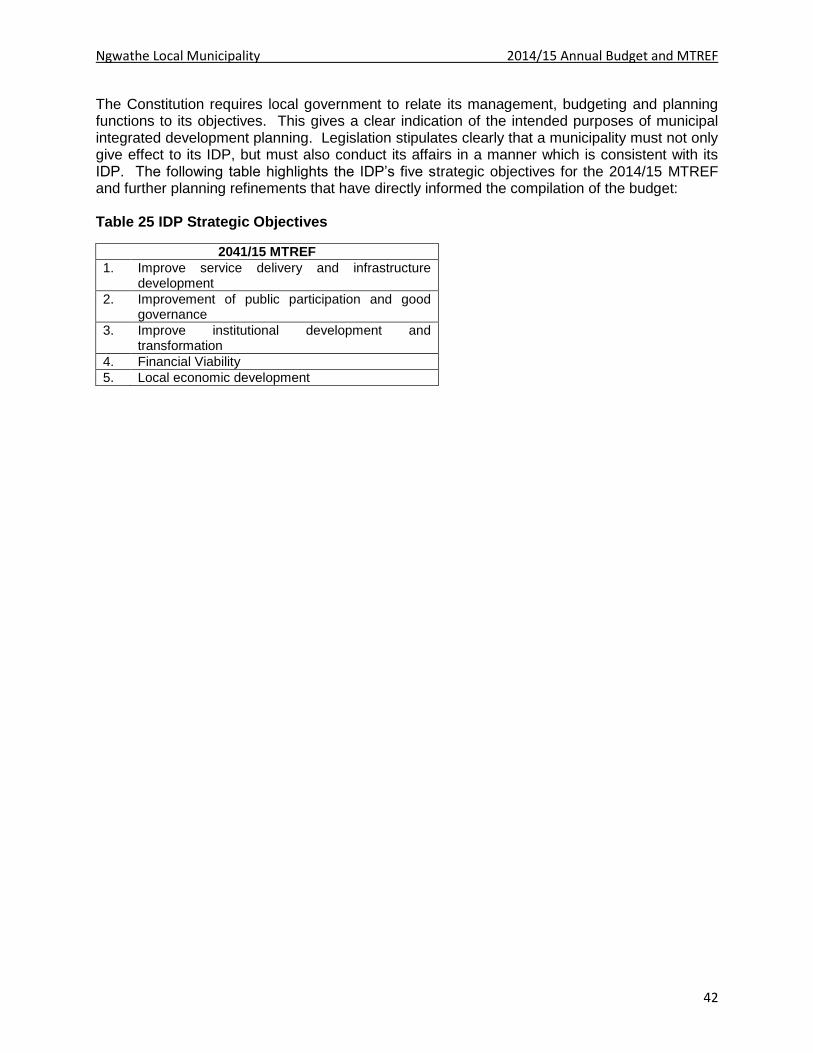
Ngwathe Local Municipality 2014/15 Annual Budget and MTREF
42
The Constitution requires local government to relate its management, budgeting and planning functions to its objectives. This gives a clear indication of the intended purposes of municipal integrated development planning. Legislation stipulates clearly that a municipality must not only give effect to its IDP, but must also conduct its affairs in a manner which is consistent with its IDP. The following table highlights the IDP’s five strategic objectives for the 2014/15 MTREF and further planning refinements that have directly informed the compilation of the budget: Table 25 IDP Strategic Objectives
2041/15 MTREF
1. Improve service delivery and infrastructure development
2. Improvement of public participation and good governance
3. Improve institutional development and transformation
4. Financial Viability
5. Local economic development
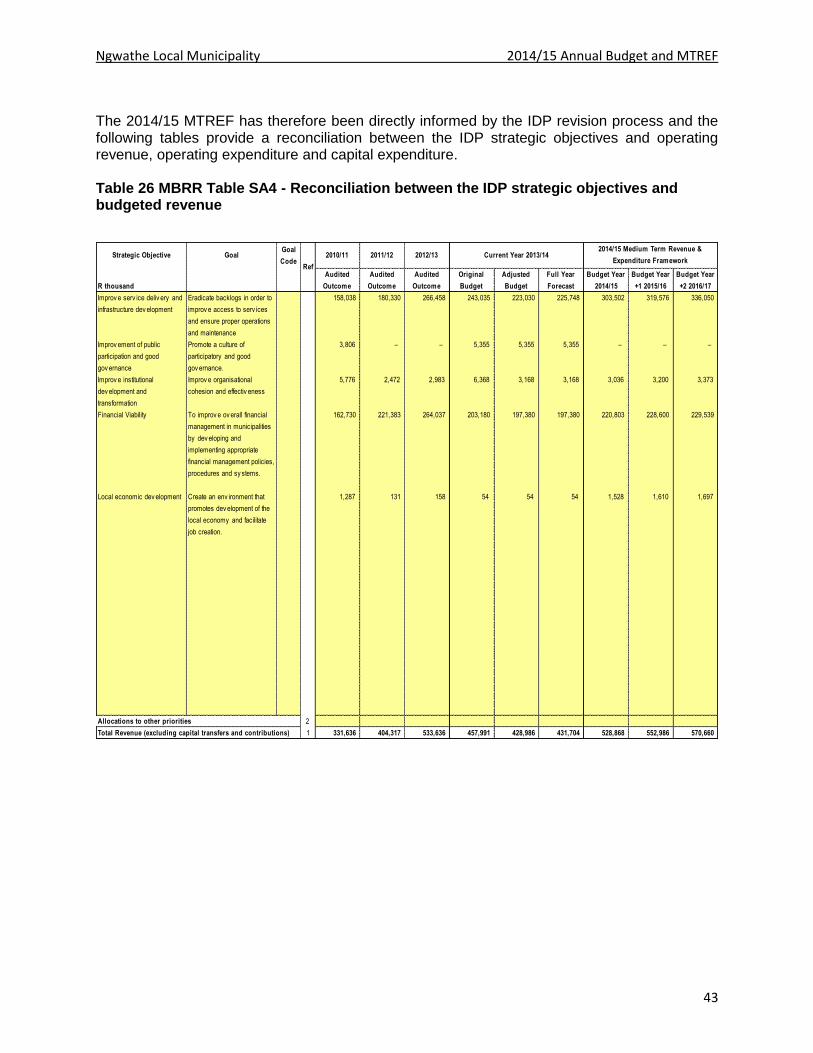
Ngwathe Local Municipality 2014/15 Annual Budget and MTREF
43
The 2014/15 MTREF has therefore been directly informed by the IDP revision process and the following tables provide a reconciliation between the IDP strategic objectives and operating revenue, operating expenditure and capital expenditure. Table 26 MBRR Table SA4 - Reconciliation between the IDP strategic objectives and budgeted revenue
Strategic Objective GoalGoal
Code2010/11 2011/12 2012/13
R thousand
Audited
Outcome
Audited
Outcome
Audited
Outcome
Original
Budget
Adjusted
Budget
Full Year
Forecast
Budget Year
2014/15
Budget Year
+1 2015/16
Budget Year
+2 2016/17
Improv e serv ice deliv ery and
infrastructure dev elopment
Eradicate backlogs in order to
improv e access to serv ices
and ensure proper operations
and maintenance
158,038 180,330 266,458 243,035 223,030 225,748 303,502 319,576 336,050
Improv ement of public
participation and good
gov ernance
Promote a culture of
participatory and good
gov ernance.
3,806 – – 5,355 5,355 5,355 – – –
Improv e institutional
dev elopment and
transformation
Improv e organisational
cohesion and effectiv eness
5,776 2,472 2,983 6,368 3,168 3,168 3,036 3,200 3,373
Financial Viability To improv e ov erall financial
management in municipalities
by dev eloping and
implementing appropriate
financial management policies,
procedures and sy stems.
162,730 221,383 264,037 203,180 197,380 197,380 220,803 228,600 229,539
Local economic dev elopment Create an env ironment that
promotes dev elopment of the
local economy and facilitate
job creation.
1,287 131 158 54 54 54 1,528 1,610 1,697
Allocations to other priorities 2
Total Revenue (excluding capital transfers and contributions) 1 331,636 404,317 533,636 457,991 428,986 431,704 528,868 552,986 570,660
Current Year 2013/142014/15 Medium Term Revenue &
Expenditure FrameworkRef

Ngwathe Local Municipality 2014/15 Annual Budget and MTREF
44
Table 27 MBRR Table SA5 - Reconciliation between the IDP strategic objectives and budgeted operating expenditure
Strategic Objective GoalGoal
Code2010/11 2011/12 2012/13
R thousand
Audited
Outcome
Audited
Outcome
Audited
Outcome
Original
Budget
Adjusted
Budget
Full Year
Forecast
Budget Year
2014/15
Budget Year
+1 2015/16
Budget Year
+2 2016/17
Improv e serv ice deliv ery and
infrastructure dev elopment
Eradicate backlogs in order to
improv e access to serv ices
and ensure proper operations
and maintenance
245,225 277,871 331,968 239,078 241,192 241,192 344,414 357,395 374,591
Improv ement of public
participation and good
gov ernance
Promote a culture of
participatory and good
gov ernance.
38,289 43,386 51,833 38,929 38,256 38,256 45,280 46,986 49,226
Improv e institutional
dev elopment and
transformation
Improv e organisational
cohesion and effectiv eness
67,533 76,523 91,423 59,292 60,347 60,347 70,857 73,529 77,098
Financial Viability To improv e ov erall financial
management in municipalities
by dev eloping and
implementing appropriate
88,108 99,837 119,275 117,769 95,512 95,512 122,628 127,249 133,374
Local economic dev elopment Create an env ironment that
promotes dev elopment of the
local economy and facilitate
job creation.
6,836 7,746 9,255 2,924 2,605 2,605 4,282 4,443 4,657
Allocations to other priorities
Total Expenditure 1 445,992 505,364 603,754 457,992 437,912 437,912 587,461 609,603 638,946
Current Year 2013/142014/15 Medium Term Revenue &
Expenditure FrameworkRef
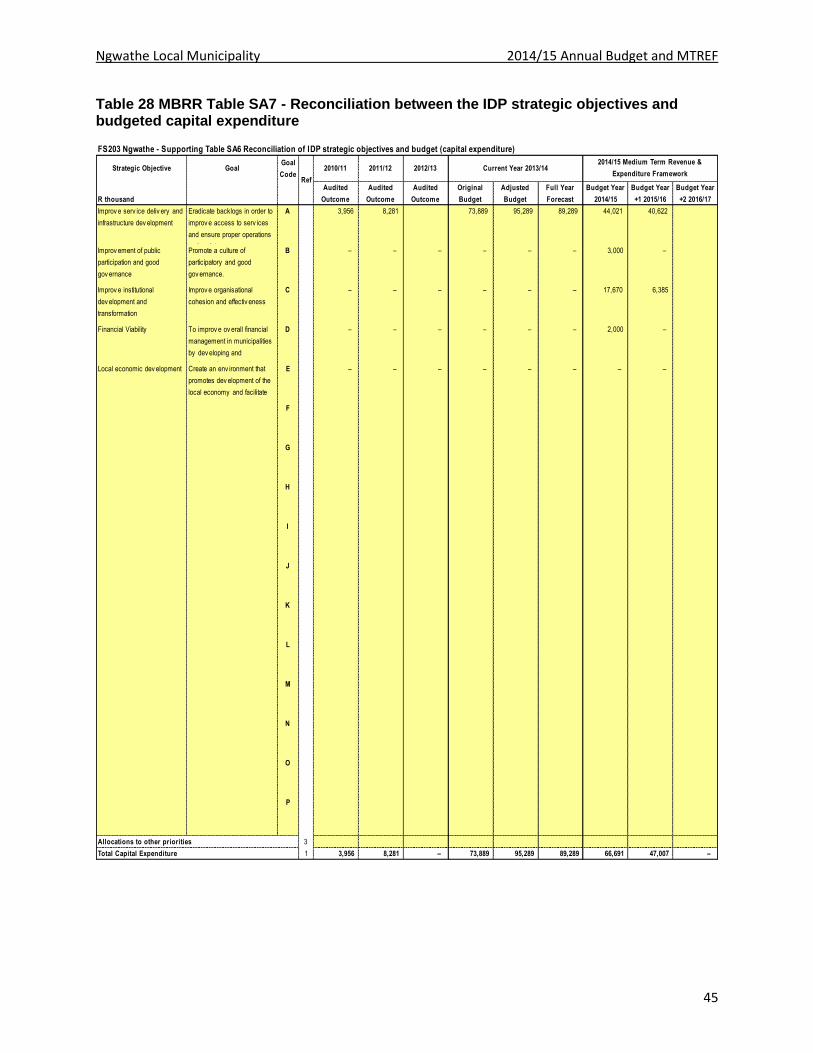
Ngwathe Local Municipality 2014/15 Annual Budget and MTREF
45
Table 28 MBRR Table SA7 - Reconciliation between the IDP strategic objectives and budgeted capital expenditure
FS203 Ngwathe - Supporting Table SA6 Reconciliation of IDP strategic objectives and budget (capital expenditure)
Strategic Objective GoalGoal
Code2010/11 2011/12 2012/13
R thousand
Audited
Outcome
Audited
Outcome
Audited
Outcome
Original
Budget
Adjusted
Budget
Full Year
Forecast
Budget Year
2014/15
Budget Year
+1 2015/16
Budget Year
+2 2016/17
Improv e serv ice deliv ery and
infrastructure dev elopment
Eradicate backlogs in order to
improv e access to serv ices
and ensure proper operations
and maintenance
A 3,956 8,281 73,889 95,289 89,289 44,021 40,622
Improv ement of public
participation and good
gov ernance
Promote a culture of
participatory and good
gov ernance.
B – – – – – – 3,000 –
Improv e institutional
dev elopment and
transformation
Improv e organisational
cohesion and effectiv eness
C – – – – – – 17,670 6,385
Financial Viability To improv e ov erall financial
management in municipalities
by dev eloping and
implementing appropriate
D – – – – – – 2,000 –
Local economic dev elopment Create an env ironment that
promotes dev elopment of the
local economy and facilitate
job creation.
E – – – – – – – –
F
G
H
I
J
K
L
M
N
O
P
Allocations to other priorities 3
Total Capital Expenditure 1 3,956 8,281 – 73,889 95,289 89,289 66,691 47,007 –
Current Year 2013/142014/15 Medium Term Revenue &
Expenditure FrameworkRef
Ngwathe Local Municipality 2014/15 Annual Budget and MTREF
46
2.2.1 Free Basic Services: basic social services package for indigent households
The social package assists residents that have difficulty paying for services and are registered as indigent households in terms of the Indigent Policy of the Municipality. With the exception of water, only registered indigents qualify for the free basic services. For the 2014/15 financial year approximately 15000 registered indigents have been provided for in the budget, the municipality envisages that the number of indigents will remain constant over the MTREF and hopefully decrease in line with the municipality’s indigent exit strategy which is directly influenced by the local economic development strategy in place. In terms of the Municipality’s indigent policy registered households are entitled to 6kℓ fee water, 50 kWh of electricity, 6 kℓ sanitation and free waste removal at least once a week, as well as a discount on their property rates. Further detail relating to the number of households receiving free basic services, the cost of free basic services, highest level of free basic services as well as the revenue cost associated with the free basic services is contained in Table 23 MBRR A10 (Basic Service Delivery Measurement) on page 36. Note that the number of households in informal areas that receive free services and the cost of these services (e.g. the provision of water through stand pipes, water tankers, etc.) are not taken into account in the table noted above.
2.3 Overview of budget related-policies The Municipality’s budgeting process is guided and governed by relevant legislation, frameworks, strategies and related policies.
2.3.1 Review of credit control and debt collection procedures/policies
The Collection Policy as approved by Council in May 2013 is currently under review. While the adopted policy is credible, sustainable, manageable and informed by affordability and value for money there has been a need to review certain components to achieve a higher collection rate. The lack of credible procedure manuals, has necessitated management to develop such procedure manuals. As most of the indigents within the municipal area are unable to pay for municipal services because they are unemployed, the Indigent Exit strategy aims to link the registered indigent households to development, skills and job opportunities. The programme also seeks to ensure that all departments as well as external role players are actively involved in the reduction of the number of registered indigent households. The 2014/15 MTREF has been prepared on the basis of achieving an average debtors’ collection rate of 75 per cent on current billings, whilst the municipality undertakes an in depth
Ngwathe Local Municipality 2014/15 Annual Budget and MTREF
47
data cleansing exercise. In addition the collection of debt in excess of 90 days has been prioritised as a pertinent strategy in increasing the Municipality’s cash levels.
2.3.2 Budget Policy
The budget and adjustment budget process is governed by various provisions in the MFMA and is aimed at instilling and establishing an increased level of discipline, responsibility and accountability in the financial management practices of municipalities. To ensure that the Municipality continues to deliver on its core mandate and achieves its developmental goals, the mid-year review and adjustment budget process will be utilised to ensure that underperforming functions are identified and funds redirected to performing functions.
2.3.3 Supply Chain Management Policy
An amended policy that is fully aligned to the MFMA and SCM regulations will be considered by Council in May 2014.
2.3.4 Budget and Virement Policy
The Budget and Virement Policy aims to empower senior managers with an efficient financial and budgetary amendment and control system to ensure optimum service delivery within the legislative framework of the MFMA and the Municipality’s system of delegations.
2.3.5 Cash Management and Investment Policy
The aim of the policy is to ensure that the Municipality’s surplus cash and investments are adequately managed, especially the funds set aside for the cash backing of certain reserves. The policy details the minimum cash and cash equivalents required at any point in time and introduces time frames to achieve certain benchmarks.
2.3.6 Tariff Policies
The Municipality’s tariff policies provide a broad framework within which the Council can determine fair, transparent and affordable charges that also promote sustainable service delivery. All the above policies are available on the Municipality’s website, as well as the following budget related policies: • Property Rates Policy; • Banking and investment Policy; • Bad Debts Policy; • Subsistence and travelling Policy; • Funding and Reserves Policy; • Borrowing Policy; and • Basic Social Services Package (Indigent Policy).
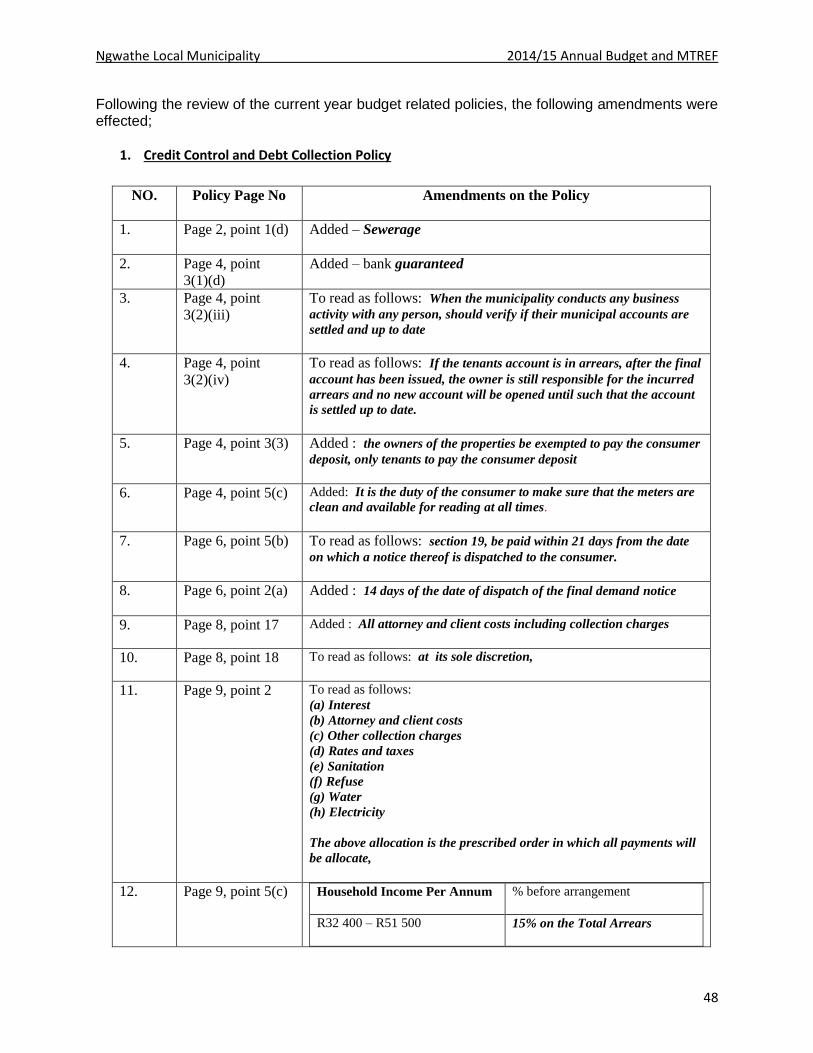
Ngwathe Local Municipality 2014/15 Annual Budget and MTREF
48
Following the review of the current year budget related policies, the following amendments were effected;
1. Credit Control and Debt Collection Policy
NO. Policy Page No Amendments on the Policy
1. Page 2, point 1(d) Added – Sewerage
2. Page 4, point
3(1)(d)
Added – bank guaranteed
3. Page 4, point
3(2)(iii)
To read as follows: When the municipality conducts any business
activity with any person, should verify if their municipal accounts are
settled and up to date
4. Page 4, point
3(2)(iv)
To read as follows: If the tenants account is in arrears, after the final
account has been issued, the owner is still responsible for the incurred
arrears and no new account will be opened until such that the account
is settled up to date.
5. Page 4, point 3(3) Added : the owners of the properties be exempted to pay the consumer
deposit, only tenants to pay the consumer deposit
6. Page 4, point 5(c) Added: It is the duty of the consumer to make sure that the meters are
clean and available for reading at all times.
7. Page 6, point 5(b) To read as follows: section 19, be paid within 21 days from the date
on which a notice thereof is dispatched to the consumer.
8. Page 6, point 2(a) Added : 14 days of the date of dispatch of the final demand notice
9. Page 8, point 17 Added : All attorney and client costs including collection charges
10. Page 8, point 18 To read as follows: at its sole discretion,
11. Page 9, point 2 To read as follows:
(a) Interest
(b) Attorney and client costs
(c) Other collection charges
(d) Rates and taxes
(e) Sanitation
(f) Refuse
(g) Water
(h) Electricity
The above allocation is the prescribed order in which all payments will
be allocate,
12. Page 9, point 5(c) Household Income Per Annum % before arrangement
R32 400 – R51 500 15% on the Total Arrears
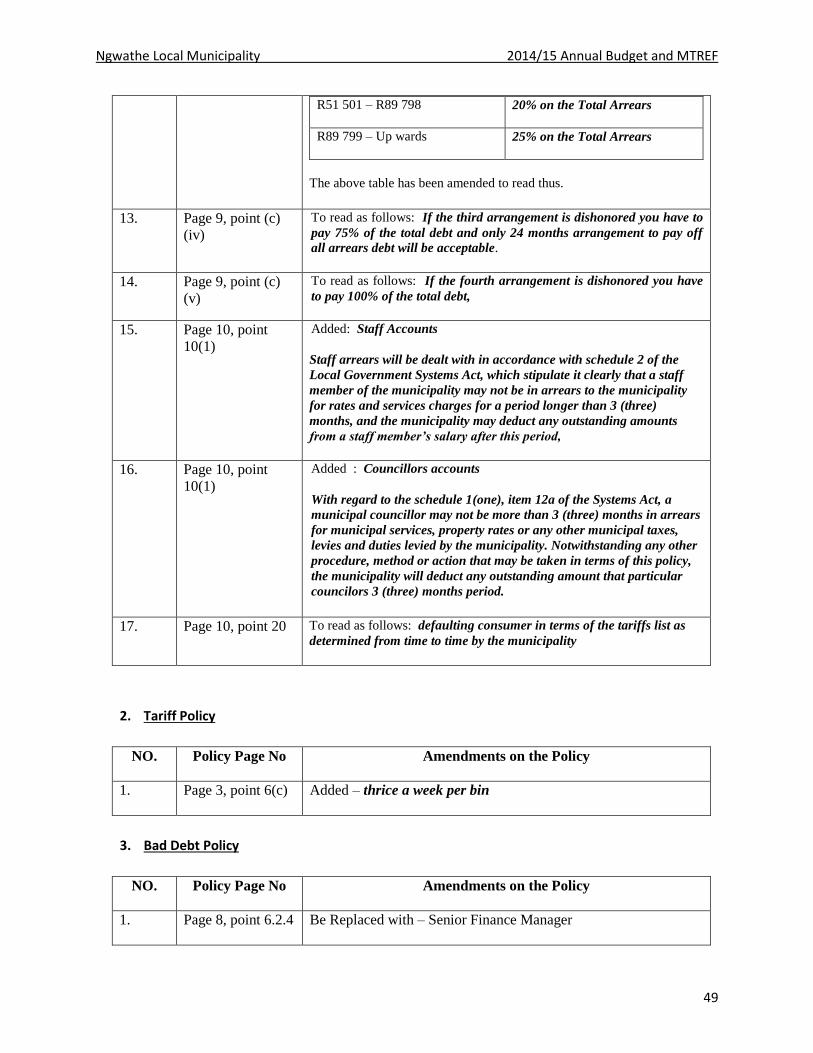
Ngwathe Local Municipality 2014/15 Annual Budget and MTREF
49
R51 501 – R89 798 20% on the Total Arrears
R89 799 – Up wards 25% on the Total Arrears
The above table has been amended to read thus.
13. Page 9, point (c)
(iv)
To read as follows: If the third arrangement is dishonored you have to
pay 75% of the total debt and only 24 months arrangement to pay off
all arrears debt will be acceptable.
14. Page 9, point (c)
(v)
To read as follows: If the fourth arrangement is dishonored you have
to pay 100% of the total debt,
15. Page 10, point
10(1)
Added: Staff Accounts
Staff arrears will be dealt with in accordance with schedule 2 of the
Local Government Systems Act, which stipulate it clearly that a staff
member of the municipality may not be in arrears to the municipality
for rates and services charges for a period longer than 3 (three)
months, and the municipality may deduct any outstanding amounts
from a staff member’s salary after this period,
16. Page 10, point
10(1)
Added : Councillors accounts
With regard to the schedule 1(one), item 12a of the Systems Act, a
municipal councillor may not be more than 3 (three) months in arrears
for municipal services, property rates or any other municipal taxes,
levies and duties levied by the municipality. Notwithstanding any other
procedure, method or action that may be taken in terms of this policy,
the municipality will deduct any outstanding amount that particular
councilors 3 (three) months period.
17. Page 10, point 20 To read as follows: defaulting consumer in terms of the tariffs list as
determined from time to time by the municipality
2. Tariff Policy
NO. Policy Page No Amendments on the Policy
1. Page 3, point 6(c) Added – thrice a week per bin
3. Bad Debt Policy
NO. Policy Page No Amendments on the Policy
1. Page 8, point 6.2.4 Be Replaced with – Senior Finance Manager
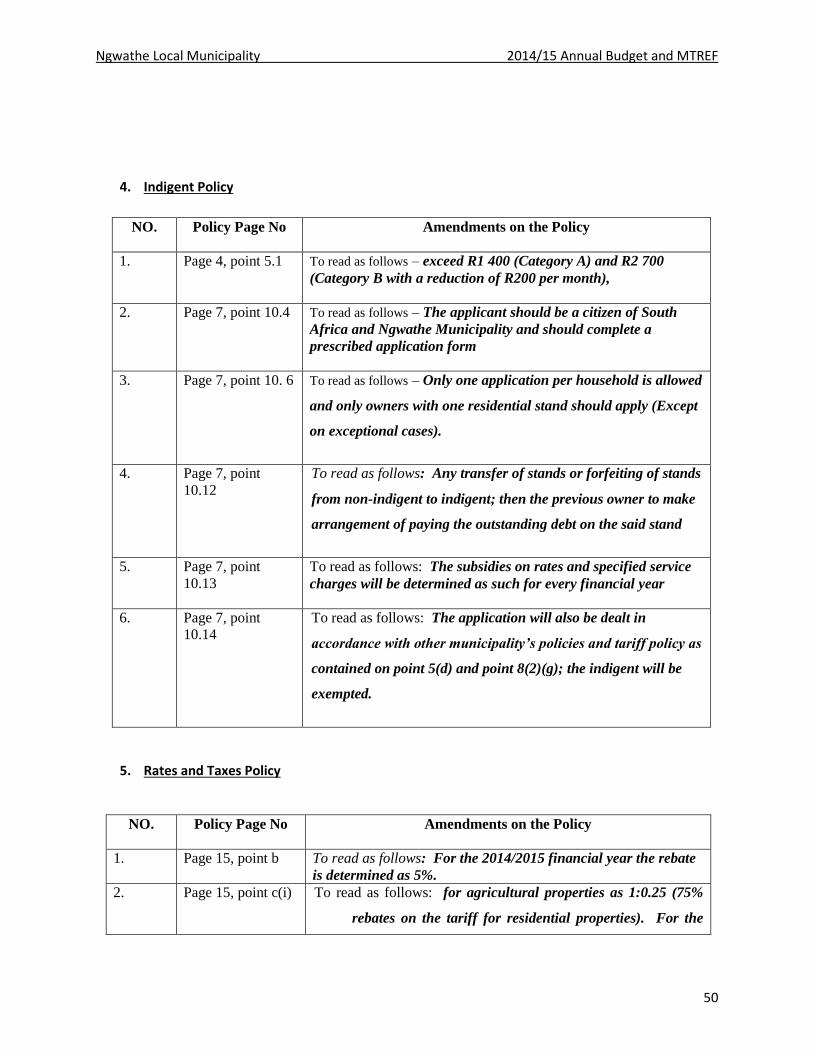
Ngwathe Local Municipality 2014/15 Annual Budget and MTREF
50
4. Indigent Policy
NO. Policy Page No Amendments on the Policy
1. Page 4, point 5.1 To read as follows – exceed R1 400 (Category A) and R2 700
(Category B with a reduction of R200 per month),
2. Page 7, point 10.4 To read as follows – The applicant should be a citizen of South
Africa and Ngwathe Municipality and should complete a
prescribed application form
3. Page 7, point 10. 6 To read as follows – Only one application per household is allowed
and only owners with one residential stand should apply (Except
on exceptional cases).
4. Page 7, point
10.12
To read as follows: Any transfer of stands or forfeiting of stands
from non-indigent to indigent; then the previous owner to make
arrangement of paying the outstanding debt on the said stand
5. Page 7, point
10.13
To read as follows: The subsidies on rates and specified service
charges will be determined as such for every financial year
6. Page 7, point
10.14
To read as follows: The application will also be dealt in
accordance with other municipality’s policies and tariff policy as
contained on point 5(d) and point 8(2)(g); the indigent will be
exempted.
5. Rates and Taxes Policy
NO. Policy Page No Amendments on the Policy
1. Page 15, point b To read as follows: For the 2014/2015 financial year the rebate
is determined as 5%.
2. Page 15, point c(i) To read as follows: for agricultural properties as 1:0.25 (75%
rebates on the tariff for residential properties). For the
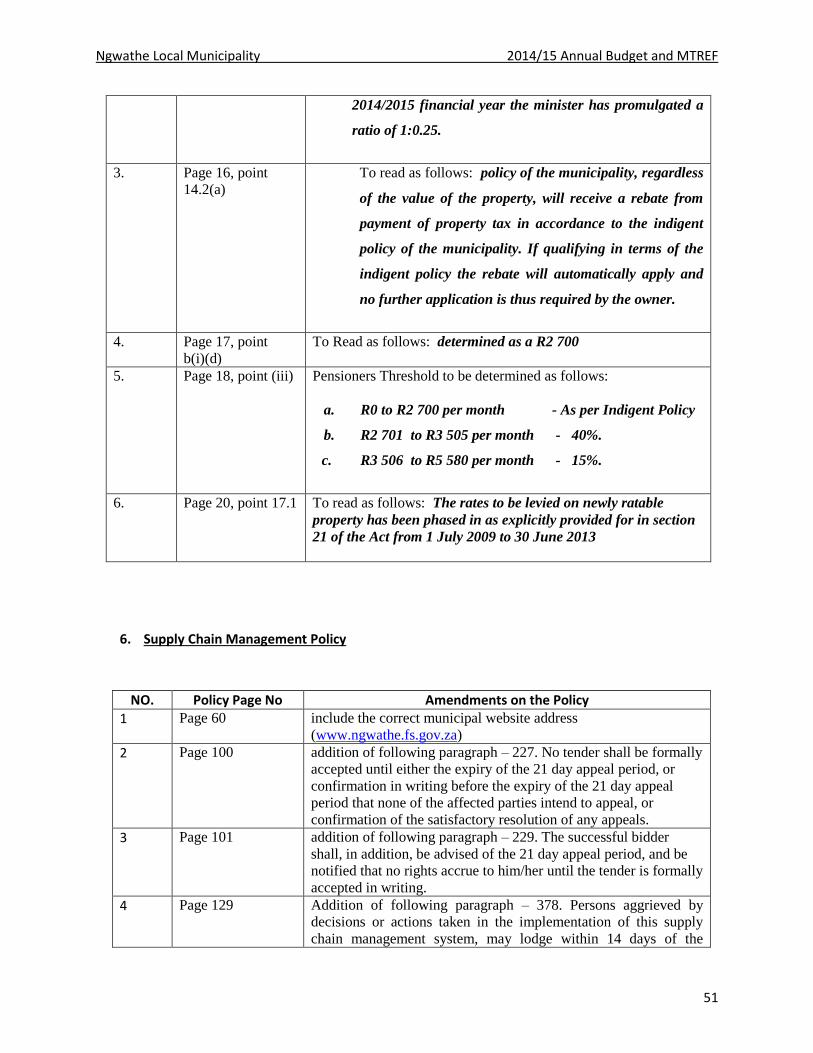
Ngwathe Local Municipality 2014/15 Annual Budget and MTREF
51
2014/2015 financial year the minister has promulgated a
ratio of 1:0.25.
3. Page 16, point
14.2(a)
To read as follows: policy of the municipality, regardless
of the value of the property, will receive a rebate from
payment of property tax in accordance to the indigent
policy of the municipality. If qualifying in terms of the
indigent policy the rebate will automatically apply and
no further application is thus required by the owner.
4. Page 17, point
b(i)(d)
To Read as follows: determined as a R2 700
5. Page 18, point (iii) Pensioners Threshold to be determined as follows:
a. R0 to R2 700 per month - As per Indigent Policy
b. R2 701 to R3 505 per month - 40%.
c. R3 506 to R5 580 per month - 15%.
6. Page 20, point 17.1 To read as follows: The rates to be levied on newly ratable
property has been phased in as explicitly provided for in section
21 of the Act from 1 July 2009 to 30 June 2013
6. Supply Chain Management Policy
NO. Policy Page No Amendments on the Policy
1 Page 60 include the correct municipal website address
(www.ngwathe.fs.gov.za)
2 Page 100 addition of following paragraph – 227. No tender shall be formally
accepted until either the expiry of the 21 day appeal period, or
confirmation in writing before the expiry of the 21 day appeal
period that none of the affected parties intend to appeal, or
confirmation of the satisfactory resolution of any appeals.
3 Page 101 addition of following paragraph – 229. The successful bidder
shall, in addition, be advised of the 21 day appeal period, and be
notified that no rights accrue to him/her until the tender is formally
accepted in writing.
4 Page 129 Addition of following paragraph – 378. Persons aggrieved by
decisions or actions taken in the implementation of this supply
chain management system, may lodge within 14 days of the

Ngwathe Local Municipality 2014/15 Annual Budget and MTREF
52
decision or action, a written objection or complaint against the
decision or action.
5 Page 132 Addition of following paragraph – 390.8. It is the NLM’s aim to
spend a minimum of 40% (forty percent) of its annual
procurement budget with Exempted Micro Enterprises, through
the application of preferential procurement.
6 Page 134 Addition of following phrase under paragraph 394.6 – “Exempted
Micro Enterprises”
7 Page 134 Addition of following paragraph – 390.10. Stipulating that, a
minimum of at least 30% must be sub-contracted to local
contractors registered on NLM’s Supplier Database in order to
involve local communities and develop skills as part of the
Expanded Public Works Program;
7. Fleet and vehicle Management Policy
New policy
8. Subsistence and Travelling Policy
NO. Policy Page No Amendments on the Policy 1 Page 3 Rate was changed from R2.30 to R4.10
2 Page 6 Section 10 To read as follows:
Only incidental costs- R80.00
Meals only - R 130.00
Meals and incidental costs- R210.00
In cases where breakfast and supper are served at the occasion or
are included in the accommodation package, an official or
Councillor will not be allowed to claim for meals.
In cases where an official or Councillor is away on official duty
for a period exceeding 6 hours, but does not sleep over, they will
be reimbursed for the actual cost incurred for meals to a
maximum of R 80, 00 and must provide proof of expenditure
before reimbursement.
Ngwathe Local Municipality 2014/15 Annual Budget and MTREF
53
If a delegate is for any reason not in a financial position to bear
the costs as indicated above out of his or her pocket, an advance
to a maximum of R 210 per day may be requested subject to the
following conditions:
3 Page 9 Section 16 to read as follows:
a) Approval by the Mayor shall be for attendance by:
Mayor
EXCO Members
Councillors
Accounting Officer / Municipal Manager
b) Approval by the Speaker shall be foe attendance by:
Councillors
c) Approval by the Accounting Officer shall be for attendance
by:
Directors
d) Approval by the Directors shall be for attendance by:
All other officials in their respective departments
2.4 Overview of budget assumptions
2.4.1 External factors
Owing to the economic slowdown, financial resources are limited due to reduced payment levels by consumers. This has resulted in declining cash inflows, which has necessitated restrained expenditure to ensure that cash outflows remain within the affordability parameters of the Municipality’s finances.
2.4.2 General inflation outlook and its impact on the municipal activities
There are five key factors that have been taken into consideration in the compilation of the 2014/15 MTREF: • National Government macro-economic targets; • The general inflationary outlook and the impact on Municipality’s residents and businesses;

Ngwathe Local Municipality 2014/15 Annual Budget and MTREF
54
• The impact of municipal cost drivers; • The increase in prices for bulk electricity and water; and • The increase in the cost of remuneration. Employee related costs comprise 23.64 per cent
of total operating expenditure in the 2014/15 MTREF and therefore this increase above inflation places a disproportionate upward pressure on the expenditure budget. The wage agreement SALGBC concluded with the municipal workers unions must be noted.
2.4.3 Collection rate for revenue services
The base assumption is that tariff and rating increases will increase at a rate slightly higher than CPI over the long term. It is also assumed that current economic conditions, and relatively controlled inflationary conditions, will continue for the forecasted term. The rate of revenue collection is currently expressed as a percentage (75 per cent) of annual billings. Cash flow is assumed to be 75 per cent of billings, plus an increased collection of arrear debt from the revenue enhancement initiatives currently being undertaken by the municipality. The performance of arrear collections will however only be considered a source of additional cash in-flow once the performance has been carefully monitored.
2.4.4 Growth or decline in tax base of the municipality
Debtors’ revenue is assumed to increase at a rate that is influenced by the consumer debtors’ collection rate, tariff/rate pricing, real growth rate of the Municipality, household formation growth rate and the poor household change rate.
2.4.5 Salary increases
As per the collective agreement regarding salaries/wages, annual salaries and wages were increased by 6.79 per cent (projected inflation rate plus 1 per cent).
2.4.6 Ability of the municipality to spend and deliver on the programmes
It is estimated that a spending rate of at least 100 per cent is achieved on employee related costs and at least 90 per cent on all other operating expenditure and 100 per cent on the capital programme for the 2014/15 MTREF of which performance has been factored into the cash flow budget.

Ngwathe Local Municipality 2014/15 Annual Budget and MTREF
55
2.5 Overview of budget funding
2.5.1 Medium-term outlook: operating revenue
The following table is a breakdown of the operating revenue over the medium-term:
Table 29 Breakdown of the operating revenue over the medium-term
The following graph is a breakdown of the operational revenue per main category for the 2014/15 financial year.
`
R thousandBudget Year
2014/15%
Budget Year
+1 2015/16%
Budget Year
+2 2016/17%
Revenue By Source
Property rates 51,297 11% 54,067 11% 56,986 11%
Serv ice charges 257,872 53% 271,797 54% 286,474 55%
Transfers recognised - operational 163,765 34% 168,563 33% 166,342 32%
Other rev enue 10,751 2% 11,251 2% 11,777 2%
Total Revenue (excluding capital transfers
and contributions)
483,685 100% 505,678 100% 521,580 100%
Total Expenditure 587,462 609,603 638,947
Surplus/(Deficit) for the year (103,777) (103,926) (117,368)
2014/15 Medium Term Revenue & Expenditure
Framework

Ngwathe Local Municipality 2014/15 Annual Budget and MTREF
56
Figure 2 Breakdown of operating revenue over the 2014/15 MTREF
Tariff setting plays a major role in ensuring desired levels of revenue. Getting tariffs right assists in the compilation of a credible and funded budget. The Municipality derives most of its operational revenue from the provision of goods and services such as water, electricity, sanitation and solid waste removal. Property rates, operating and capital grants from organs of state and other minor charges (such as building plan fees, licenses and permits etc.). The revenue strategy is a function of key components such as: • Revenue management and enhancement; • Achievement of a 75 per cent annual collection rate for consumer revenue; • National Treasury guidelines; • Electricity tariff increases within the National Electricity Regulator of South Africa (NERSA)
approval; • Determining tariff escalation rate by establishing/calculating revenue requirements; • The Property Rates Policy in terms of the Municipal Property Rates Act, 2004 (Act 6 of
2004) (MPRA), and
The above principles guide the annual increase in the tariffs charged to the consumers and the ratepayers aligned to the economic forecasts. The proposed tariff increases for the 2014/15 MTREF on the different revenue categories are: Table 30 Proposed tariff increases over the medium-term
Revenue category 2014/15
proposed tariff increase
2015/16 proposed tariff
increase
2016/17 proposed tariff
increase
2014/15 Total Budgeted revenue
% % % R’000
Property rates 5.79 5.4 5.4 51 297 Sanitation 5.79 5.4 5.4 37 057 Solid Waste 5.79 5.4 5.4 35 148
Water 5.79 5.4 5.4 40 111 Electricity 7.39 5.4 5.4 145 557
Total 309 169
Revenue to be generated from property rates is R51.3 million in the 2014/15 financial year and increases to R56.9 million by 2016/17 which represents 11 per cent of the operating revenue base of the Municipality. The Municipality is still in a process of further data verification and validation relating to the valuation roll. It is anticipated that the process will be concluded by the end of 2014/15 financial year. Services charges relating to electricity, water, sanitation and refuse removal constitutes the biggest component of the revenue basket of the Municipality totalling R257.9 million for the 2014/15 financial year and increasing to R286.5 million by 2016/17. For the 2014/15 financial year services charges amount to 54 per cent of the total revenue base and grows by 1 per cent over the medium-term. This growth can mainly be attributed to the increase in the bulk prices of electricity and water. Operational grants and subsidies amount to R163.8 million, R168.6 million and R166.3 million for each of the respective financial years of the MTREF, or 34, 34 and 32 per cent of operating
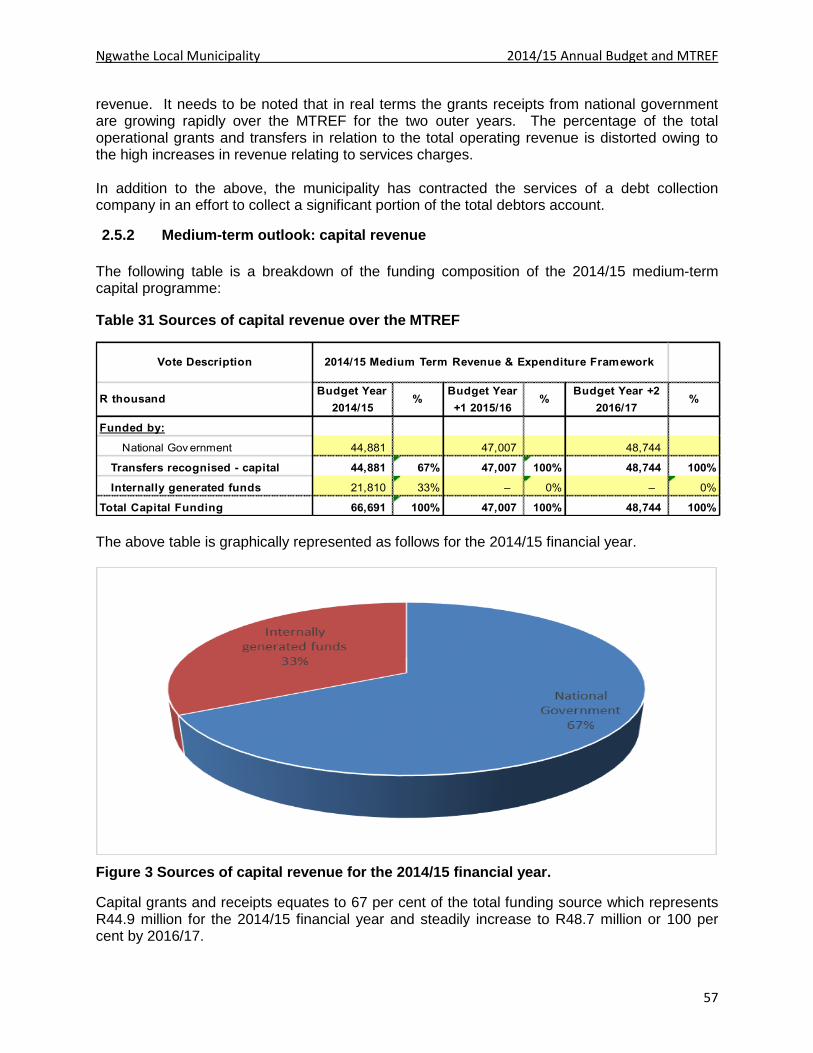
Ngwathe Local Municipality 2014/15 Annual Budget and MTREF
57
revenue. It needs to be noted that in real terms the grants receipts from national government are growing rapidly over the MTREF for the two outer years. The percentage of the total operational grants and transfers in relation to the total operating revenue is distorted owing to the high increases in revenue relating to services charges. In addition to the above, the municipality has contracted the services of a debt collection company in an effort to collect a significant portion of the total debtors account.
2.5.2 Medium-term outlook: capital revenue
The following table is a breakdown of the funding composition of the 2014/15 medium-term capital programme:
Table 31 Sources of capital revenue over the MTREF
The above table is graphically represented as follows for the 2014/15 financial year.
Figure 3 Sources of capital revenue for the 2014/15 financial year.
Capital grants and receipts equates to 67 per cent of the total funding source which represents R44.9 million for the 2014/15 financial year and steadily increase to R48.7 million or 100 per cent by 2016/17.
Vote Description
R thousandBudget Year
2014/15%
Budget Year
+1 2015/16%
Budget Year +2
2016/17%
Funded by:
National Gov ernment 44,881 47,007 48,744
Transfers recognised - capital 44,881 67% 47,007 100% 48,744 100%
Internally generated funds 21,810 33% – 0% – 0%
Total Capital Funding 66,691 100% 47,007 100% 48,744 100%
2014/15 Medium Term Revenue & Expenditure Framework
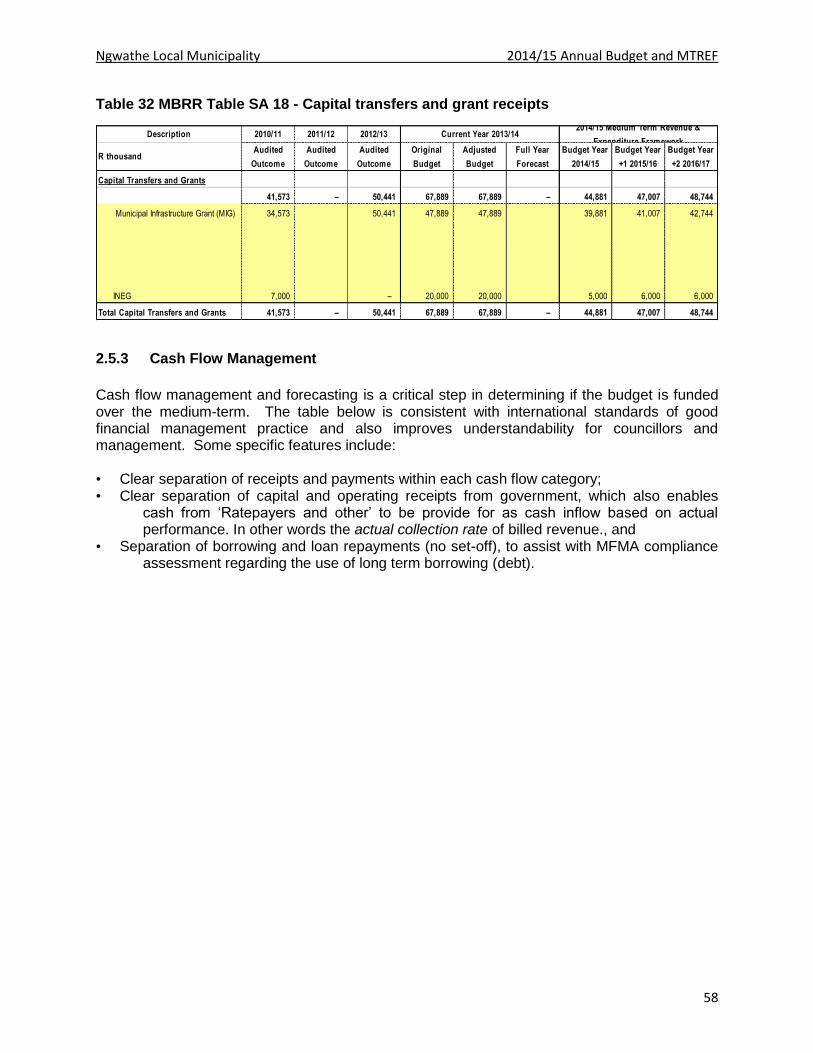
Ngwathe Local Municipality 2014/15 Annual Budget and MTREF
58
Table 32 MBRR Table SA 18 - Capital transfers and grant receipts
2.5.3 Cash Flow Management
Cash flow management and forecasting is a critical step in determining if the budget is funded over the medium-term. The table below is consistent with international standards of good financial management practice and also improves understandability for councillors and management. Some specific features include: • Clear separation of receipts and payments within each cash flow category; • Clear separation of capital and operating receipts from government, which also enables
cash from ‘Ratepayers and other’ to be provide for as cash inflow based on actual performance. In other words the actual collection rate of billed revenue., and
• Separation of borrowing and loan repayments (no set-off), to assist with MFMA compliance assessment regarding the use of long term borrowing (debt).
Description 2010/11 2011/12 2012/13
R thousandAudited
Outcome
Audited
Outcome
Audited
Outcome
Original
Budget
Adjusted
Budget
Full Year
Forecast
Budget Year
2014/15
Budget Year
+1 2015/16
Budget Year
+2 2016/17
Capital Transfers and Grants
41,573 – 50,441 67,889 67,889 – 44,881 47,007 48,744
Municipal Infrastructure Grant (MIG) 34,573 50,441 47,889 47,889 39,881 41,007 42,744
INEG 7,000 – 20,000 20,000 5,000 6,000 6,000
Total Capital Transfers and Grants 41,573 – 50,441 67,889 67,889 – 44,881 47,007 48,744
Current Year 2013/142014/15 Medium Term Revenue &
Expenditure Framework
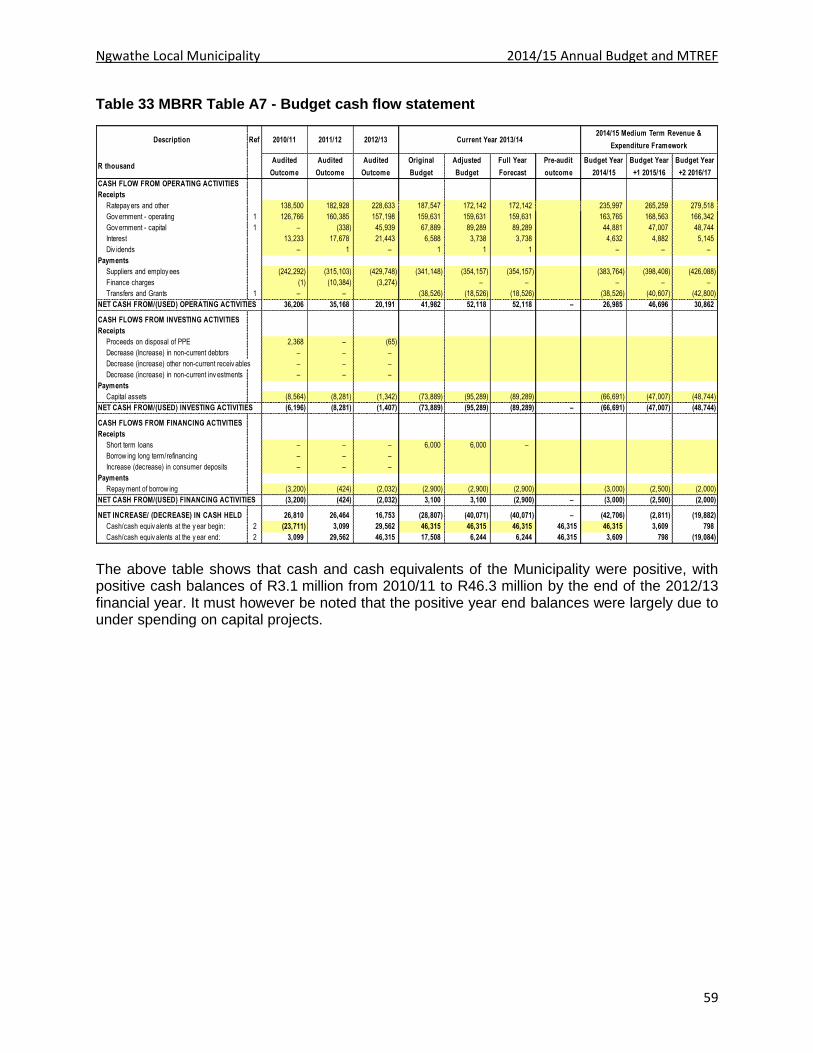
Ngwathe Local Municipality 2014/15 Annual Budget and MTREF
59
Table 33 MBRR Table A7 - Budget cash flow statement
The above table shows that cash and cash equivalents of the Municipality were positive, with positive cash balances of R3.1 million from 2010/11 to R46.3 million by the end of the 2012/13 financial year. It must however be noted that the positive year end balances were largely due to under spending on capital projects.
Description Ref 2010/11 2011/12 2012/13
R thousandAudited
Outcome
Audited
Outcome
Audited
Outcome
Original
Budget
Adjusted
Budget
Full Year
Forecast
Pre-audit
outcome
Budget Year
2014/15
Budget Year
+1 2015/16
Budget Year
+2 2016/17
CASH FLOW FROM OPERATING ACTIVITIES
Receipts
Ratepay ers and other 138,500 182,928 228,633 187,547 172,142 172,142 235,997 265,259 279,518
Gov ernment - operating 1 126,766 160,385 157,198 159,631 159,631 159,631 163,765 168,563 166,342
Gov ernment - capital 1 – (338) 45,939 67,889 89,289 89,289 44,881 47,007 48,744
Interest 13,233 17,678 21,443 6,588 3,738 3,738 4,632 4,882 5,145
Div idends – 1 – 1 1 1 – – –
Payments
Suppliers and employ ees (242,292) (315,103) (429,748) (341,148) (354,157) (354,157) (383,764) (398,408) (426,088)
Finance charges (1) (10,384) (3,274) – – – – –
Transfers and Grants 1 – – (38,526) (18,526) (18,526) (38,526) (40,607) (42,800)
NET CASH FROM/(USED) OPERATING ACTIVITIES 36,206 35,168 20,191 41,982 52,118 52,118 – 26,985 46,696 30,862
CASH FLOWS FROM INVESTING ACTIVITIES
Receipts
Proceeds on disposal of PPE 2,368 – (65)
Decrease (Increase) in non-current debtors – – –
Decrease (increase) other non-current receiv ables – – –
Decrease (increase) in non-current inv estments – – –
Payments
Capital assets (8,564) (8,281) (1,342) (73,889) (95,289) (89,289) (66,691) (47,007) (48,744)
NET CASH FROM/(USED) INVESTING ACTIVITIES (6,196) (8,281) (1,407) (73,889) (95,289) (89,289) – (66,691) (47,007) (48,744)
CASH FLOWS FROM FINANCING ACTIVITIES
Receipts
Short term loans – – – 6,000 6,000 –
Borrow ing long term/refinancing – – –
Increase (decrease) in consumer deposits – – –
Payments
Repay ment of borrow ing (3,200) (424) (2,032) (2,900) (2,900) (2,900) (3,000) (2,500) (2,000)
NET CASH FROM/(USED) FINANCING ACTIVITIES (3,200) (424) (2,032) 3,100 3,100 (2,900) – (3,000) (2,500) (2,000)
NET INCREASE/ (DECREASE) IN CASH HELD 26,810 26,464 16,753 (28,807) (40,071) (40,071) – (42,706) (2,811) (19,882)
Cash/cash equiv alents at the y ear begin: 2 (23,711) 3,099 29,562 46,315 46,315 46,315 46,315 46,315 3,609 798
Cash/cash equiv alents at the y ear end: 2 3,099 29,562 46,315 17,508 6,244 6,244 46,315 3,609 798 (19,084)
2014/15 Medium Term Revenue &
Expenditure FrameworkCurrent Year 2013/14
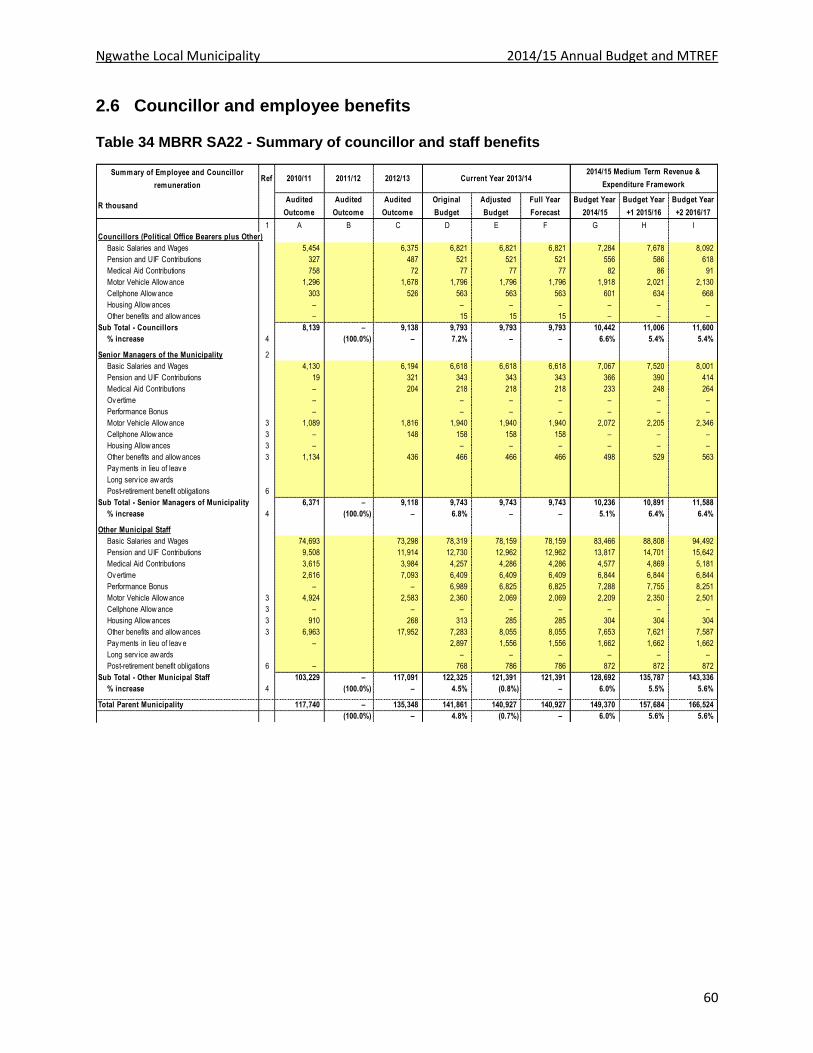
Ngwathe Local Municipality 2014/15 Annual Budget and MTREF
60
2.6 Councillor and employee benefits
Table 34 MBRR SA22 - Summary of councillor and staff benefits
Summary of Employee and Councillor
remunerationRef 2010/11 2011/12 2012/13
R thousandAudited
Outcome
Audited
Outcome
Audited
Outcome
Original
Budget
Adjusted
Budget
Full Year
Forecast
Budget Year
2014/15
Budget Year
+1 2015/16
Budget Year
+2 2016/17
1 A B C D E F G H I
Councillors (Political Office Bearers plus Other)
Basic Salaries and Wages 5,454 6,375 6,821 6,821 6,821 7,284 7,678 8,092
Pension and UIF Contributions 327 487 521 521 521 556 586 618
Medical Aid Contributions 758 72 77 77 77 82 86 91
Motor Vehicle Allow ance 1,296 1,678 1,796 1,796 1,796 1,918 2,021 2,130
Cellphone Allow ance 303 526 563 563 563 601 634 668
Housing Allow ances – – – – – – –
Other benefits and allow ances – 15 15 15 – – –
Sub Total - Councillors 8,139 – 9,138 9,793 9,793 9,793 10,442 11,006 11,600
% increase 4 (100.0%) – 7.2% – – 6.6% 5.4% 5.4%
Senior Managers of the Municipality 2
Basic Salaries and Wages 4,130 6,194 6,618 6,618 6,618 7,067 7,520 8,001
Pension and UIF Contributions 19 321 343 343 343 366 390 414
Medical Aid Contributions – 204 218 218 218 233 248 264
Ov ertime – – – – – – –
Performance Bonus – – – – – – –
Motor Vehicle Allow ance 3 1,089 1,816 1,940 1,940 1,940 2,072 2,205 2,346
Cellphone Allow ance 3 – 148 158 158 158 – – –
Housing Allow ances 3 – – – – – – –
Other benefits and allow ances 3 1,134 436 466 466 466 498 529 563
Pay ments in lieu of leav e
Long serv ice aw ards
Post-retirement benefit obligations 6
Sub Total - Senior Managers of Municipality 6,371 – 9,118 9,743 9,743 9,743 10,236 10,891 11,588
% increase 4 (100.0%) – 6.8% – – 5.1% 6.4% 6.4%
Other Municipal Staff
Basic Salaries and Wages 74,693 73,298 78,319 78,159 78,159 83,466 88,808 94,492
Pension and UIF Contributions 9,508 11,914 12,730 12,962 12,962 13,817 14,701 15,642
Medical Aid Contributions 3,615 3,984 4,257 4,286 4,286 4,577 4,869 5,181
Ov ertime 2,616 7,093 6,409 6,409 6,409 6,844 6,844 6,844
Performance Bonus – – 6,989 6,825 6,825 7,288 7,755 8,251
Motor Vehicle Allow ance 3 4,924 2,583 2,360 2,069 2,069 2,209 2,350 2,501
Cellphone Allow ance 3 – – – – – – – –
Housing Allow ances 3 910 268 313 285 285 304 304 304
Other benefits and allow ances 3 6,963 17,952 7,283 8,055 8,055 7,653 7,621 7,587
Pay ments in lieu of leav e – 2,897 1,556 1,556 1,662 1,662 1,662
Long serv ice aw ards – – – – – –
Post-retirement benefit obligations 6 – 768 786 786 872 872 872
Sub Total - Other Municipal Staff 103,229 – 117,091 122,325 121,391 121,391 128,692 135,787 143,336
% increase 4 (100.0%) – 4.5% (0.8%) – 6.0% 5.5% 5.6%
Total Parent Municipality 117,740 – 135,348 141,861 140,927 140,927 149,370 157,684 166,524
(100.0%) – 4.8% (0.7%) – 6.0% 5.6% 5.6%
Current Year 2013/142014/15 Medium Term Revenue &
Expenditure Framework

Ngwathe Local Municipality 2014/15 Annual Budget and MTREF
61
Table 35 MBRR SA23 - Salaries, allowances and benefits (political office bearers/councillors/ senior managers)
Disclosure of Salaries, Allowances & Benefits 1. RefContributions In-kind
benefits
Total
Package
Rand per annum 1. 2.
Councillors 3
Speaker 4 413,615 – 413,615
Chief Whip –
Ex ecutiv e May or 462,040 462,040
Deputy Ex ecutiv e May or – –
Ex ecutiv e Committee 1,241,182 1,241,182
Total for all other councillors 5,167,592 638,218 2,519,062 8,324,871
Total Councillors 8 – 7,284,428 638,218 2,519,062 10,441,707
Senior Managers of the Municipality 5
Municipal Manager (MM) 775,911 1,712 192,272 969,895
Chief Finance Officer 599,039 1,766 254,984 855,788
Director Technical serv ices 682,919 1,712 171,158 855,788
Director Corporate serv ices 630,956 104,475 120,358 855,788
Director Community serv ices 682,919 1,712 171,158 855,788
–
List of each offical with packages >= senior manager
Human Resource Manager 457,228 125,061 148,081 730,369
Senior Finance Manager 457,228 125,061 148,081 730,369
Supply Chain Manager 457,228 125,061 148,081 730,369
Internal Auditor 457,228 125,061 148,081 730,369
Strategic Ex ecutiv e Support Manager 457,228 125,061 148,081 730,369
Risk and Compliance Manager 457,228 125,061 148,081 730,369
Legal and Admin Manager 457,228 125,061 148,081 730,369
Public Safety and Recreation Manager 457,228 125,061 148,081 730,369
–
–
–
–
–
Total Senior Managers of the Municipality 8,10 – 7,029,565 1,111,862 2,094,573 – 10,236,000
No.
AllowancesSalary Performance
Bonuses

Ngwathe Local Municipality 2014/15 Annual Budget and MTREF
62
Table 36 MBRR SA24 – Summary of personnel numbers
2.7 Monthly targets for revenue, expenditure and cash flow
Summary of Personnel Numbers Ref
Number 1,2 PositionsPermanent
employees
Contract
employeesPositions
Permanent
employees
Contract
employeesPositions
Permanent
employees
Contract
employees
Municipal Council and Boards of Municipal Entities
Councillors (Political Office Bearers plus Other Councillors) 39 39 39 – 39 39 – 39
Board Members of municipal entities 4 – – – – – –
Municipal employees 5
Municipal Manager and Senior Managers 3 5 – 4 5 – 5 5 – 5
Other Managers 7 18 12 – 18 12 – 18 12 –
Professionals 496 203 12 496 216 2 496 216 2
Finance 2 1 1 2 2 1 2 2 1
Spatial/town planning 1 1 1 1 1 1 1 1 1
Information Technology – – – – – – –
Roads – – – – – – –
Electricity – – – – – – –
Water – – – – – – –
Sanitation – – – – – – –
Refuse – – – – – – –
Other 493 201 10 493 213 – 493 213 –
Technicians 13 8 228 13 236 5 13 236 5
Finance 5 5
Spatial/town planning
Information Technology 5 3 – 5 3 – 5 3 –
Roads 1 1 – 1 1 – 1 1 –
Electricity 4 1 – 4 1 – 4 1 –
Water 2 2 – 2 2 – 2 2 –
Sanitation 1 1 – 1 1 – 1 1 –
Refuse
Other – – 228 – 228 – – 228 –
Clerks (Clerical and administrativ e) 115 114 – 115 114 – 115 114 –
Serv ice and sales w orkers 25 19 – 25 19 – 25 19 –
Skilled agricultural and fishery w orkers – – – – – – – – –
Craft and related trades 22 22 – 22 22 – 22 22 –
Plant and Machine Operators 81 81 – 81 81 – 81 81 –
Elementary Occupations 362 362 – 362 362 – 362 362 –
TOTAL PERSONNEL NUMBERS 9 1,176 821 283 1,176 1,062 51 1,176 1,062 51
% increase – 29.4% (82.0%) – – –
Total municipal employees headcount 6, 10
Finance personnel headcount 8, 10
Human Resources personnel headcount 8, 10
Current Year 2013/14 Budget Year 2014/152012/13

Ngwathe Local Municipality 2014/15 Annual Budget and MTREF
March 2014 63
Table 37 MBRR SA25 - Budgeted monthly revenue and expenditure
Description Ref
R thousand July August Sept. October November December January February March April May JuneBudget Year
2014/15
Budget Year
+1 2015/16
Budget Year
+2 2016/17
Revenue By Source
Property rates 4,275 4,275 4,275 4,275 4,275 4,275 4,275 4,275 4,275 4,275 4,275 4,274 51,297 54,067 56,986
Property rates - penalties & collection charges – – – – – – – – – – – – – – –
Serv ice charges - electricity rev enue 8,767 13,332 16,363 19,913 13,369 9,122 17,836 13,037 8,017 10,220 8,884 6,696 145,557 153,417 161,702
Serv ice charges - w ater rev enue 2,704 3,445 2,692 3,993 3,744 2,805 3,235 3,675 3,511 3,600 4,075 2,631 40,111 42,276 44,559
Serv ice charges - sanitation rev enue 2,384 3,438 2,746 3,366 3,172 2,938 2,862 3,162 3,205 3,349 3,661 2,775 37,057 39,058 41,168
Serv ice charges - refuse rev enue 2,561 3,107 2,539 3,296 3,175 2,407 2,899 3,263 2,925 3,298 3,519 2,159 35,148 37,045 39,046
Serv ice charges - other – – – – – – – – – – – – – – –
Rental of facilities and equipment 304 86 87 155 80 46 199 71 173 124 72 25 1,420 1,497 1,578
Interest earned - ex ternal inv estments – – – – – – – – – – – 2,757 2,757 2,905 3,062
Interest earned - outstanding debtors 132 165 192 228 255 232 210 308 200 216 247 114 2,500 2,635 2,777
Div idends receiv ed – – – – – – – – – – – – – – –
Fines 72 90 36 78 54 9 198 123 109 133 97 – 1,000 1,054 1,111
Licences and permits 1 – – – – – – – – – – – 1 1 1
Agency serv ices – – – – – – – – – – – – – – –
Transfers recognised - operational 57,051 – – – 53,357 – – – 53,357 – – 0 163,765 168,563 166,342
Other rev enue 99 109 37 371 688 379 38 214 157 400 64 517 3,074 3,159 3,249
Gains on disposal of PPE – – – – – – – – – – – – – – –
Total Revenue (excluding capital transfers and contributions)78,349 28,048 28,967 35,675 82,169 22,214 31,752 28,127 75,928 25,614 24,893 21,948 483,685 505,678 521,580
Expenditure By Type
Employ ee related costs 11,575 11,575 11,575 11,575 11,575 11,575 11,575 11,575 11,575 11,575 11,575 11,607 138,928 146,678 154,924
Remuneration of councillors 870 870 870 870 870 870 870 870 870 870 870 870 10,442 11,006 11,600
Debt impairment 3,333 3,333 3,333 3,333 3,333 3,333 3,333 3,333 3,333 3,333 3,333 3,333 40,000 42,160 44,437
Depreciation & asset impairment 7,917 7,917 7,917 7,917 7,917 7,917 7,917 7,917 7,917 7,917 7,917 7,917 95,000 90,000 90,000
Finance charges 100 100 600 100 100 600 100 100 600 100 100 400 3,000 2,500 2,000
Bulk purchases 9,842 14,967 18,369 22,354 15,008 10,240 20,022 14,635 9,000 11,472 9,973 7,517 163,401 173,859 184,986
Other materials 497 429 – 315 – 141 900 44 21 5,791 – 1,962 10,100 10,645 11,220
Contracted serv ices 680 2,506 434 751 559 568 1,449 387 886 2,478 1,838 2,763 15,300 15,453 16,142
Transfers and grants 3,211 3,211 3,211 3,211 3,211 3,211 3,211 3,211 3,211 3,211 3,211 3,211 38,526 40,607 42,800
Other ex penditure 6,395 17,897 8,247 4,385 3,124 7,294 4,015 2,795 2,197 7,200 4,060 5,157 72,766 76,694 80,838
Loss on disposal of PPE – – – – – – – – – – – – – – –
Total Expenditure 44,419 62,804 54,556 54,811 45,697 45,749 53,392 44,866 39,609 53,947 42,876 44,737 587,463 609,602 638,947
Surplus/(Deficit) 33,930 (34,756) (25,589) (19,136) 36,472 (23,535) (21,640) (16,739) 36,320 (28,333) (17,984) (22,789) (103,778) (103,924) (117,367)
Transfers recognised - capital 22,441 – – – 15,708 – – – 6,732 – – 1 44,881 47,007 48,744
Contributions recognised - capital – – – – – – – – – – – – – – –
Contributed assets – – – – – – – – – – – – – – –
Surplus/(Deficit) after capital transfers &
contributions56,371 (34,756) (25,589) (19,136) 52,180 (23,535) (21,640) (16,739) 43,052 (28,333) (17,984) (22,789) (58,897) (56,917) (68,623)
Tax ation – – – – – – – – – – – – – –
Attributable to minorities – – – – – – – – – – – – – – –
Share of surplus/ (deficit) of associate – – – – – – – – – – – – – – –
Surplus/(Deficit) 1 56,371 (34,756) (25,589) (19,136) 52,180 (23,535) (21,640) (16,739) 43,052 (28,333) (17,984) (22,789) (58,897) (56,917) (68,623)
Budget Year 2014/15Medium Term Revenue and Expenditure
Framework
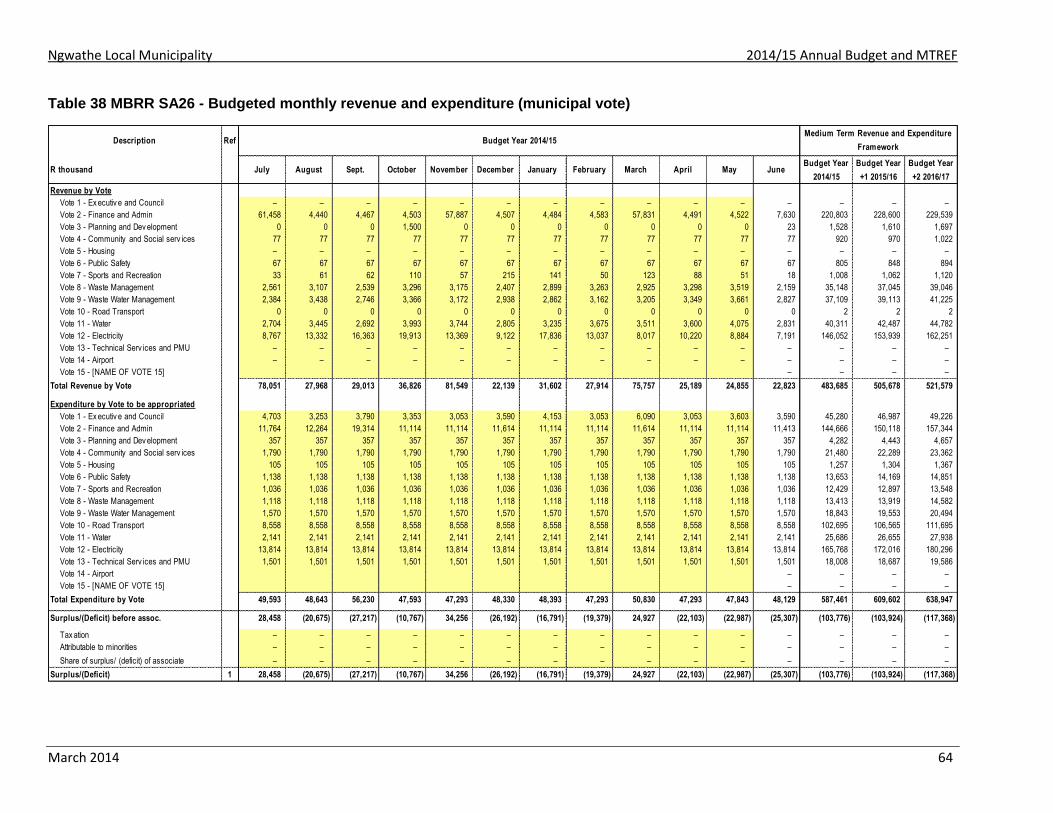
Ngwathe Local Municipality 2014/15 Annual Budget and MTREF
March 2014 64
Table 38 MBRR SA26 - Budgeted monthly revenue and expenditure (municipal vote)
Description Ref
R thousand July August Sept. October November December January February March April May JuneBudget Year
2014/15
Budget Year
+1 2015/16
Budget Year
+2 2016/17
Revenue by Vote
Vote 1 - Ex ecutiv e and Council – – – – – – – – – – – – – – –
Vote 2 - Finance and Admin 61,458 4,440 4,467 4,503 57,887 4,507 4,484 4,583 57,831 4,491 4,522 7,630 220,803 228,600 229,539
Vote 3 - Planning and Dev elopment 0 0 0 1,500 0 0 0 0 0 0 0 23 1,528 1,610 1,697
Vote 4 - Community and Social serv ices 77 77 77 77 77 77 77 77 77 77 77 77 920 970 1,022
Vote 5 - Housing – – – – – – – – – – – – – – –
Vote 6 - Public Safety 67 67 67 67 67 67 67 67 67 67 67 67 805 848 894
Vote 7 - Sports and Recreation 33 61 62 110 57 215 141 50 123 88 51 18 1,008 1,062 1,120
Vote 8 - Waste Management 2,561 3,107 2,539 3,296 3,175 2,407 2,899 3,263 2,925 3,298 3,519 2,159 35,148 37,045 39,046
Vote 9 - Waste Water Management 2,384 3,438 2,746 3,366 3,172 2,938 2,862 3,162 3,205 3,349 3,661 2,827 37,109 39,113 41,225
Vote 10 - Road Transport 0 0 0 0 0 0 0 0 0 0 0 0 2 2 2
Vote 11 - Water 2,704 3,445 2,692 3,993 3,744 2,805 3,235 3,675 3,511 3,600 4,075 2,831 40,311 42,487 44,782
Vote 12 - Electricity 8,767 13,332 16,363 19,913 13,369 9,122 17,836 13,037 8,017 10,220 8,884 7,191 146,052 153,939 162,251
Vote 13 - Technical Serv ices and PMU – – – – – – – – – – – – – – –
Vote 14 - Airport – – – – – – – – – – – – – – –
Vote 15 - [NAME OF VOTE 15] – – – –
Total Revenue by Vote 78,051 27,968 29,013 36,826 81,549 22,139 31,602 27,914 75,757 25,189 24,855 22,823 483,685 505,678 521,579
Expenditure by Vote to be appropriated
Vote 1 - Ex ecutiv e and Council 4,703 3,253 3,790 3,353 3,053 3,590 4,153 3,053 6,090 3,053 3,603 3,590 45,280 46,987 49,226
Vote 2 - Finance and Admin 11,764 12,264 19,314 11,114 11,114 11,614 11,114 11,114 11,614 11,114 11,114 11,413 144,666 150,118 157,344
Vote 3 - Planning and Dev elopment 357 357 357 357 357 357 357 357 357 357 357 357 4,282 4,443 4,657
Vote 4 - Community and Social serv ices 1,790 1,790 1,790 1,790 1,790 1,790 1,790 1,790 1,790 1,790 1,790 1,790 21,480 22,289 23,362
Vote 5 - Housing 105 105 105 105 105 105 105 105 105 105 105 105 1,257 1,304 1,367
Vote 6 - Public Safety 1,138 1,138 1,138 1,138 1,138 1,138 1,138 1,138 1,138 1,138 1,138 1,138 13,653 14,169 14,851
Vote 7 - Sports and Recreation 1,036 1,036 1,036 1,036 1,036 1,036 1,036 1,036 1,036 1,036 1,036 1,036 12,429 12,897 13,548
Vote 8 - Waste Management 1,118 1,118 1,118 1,118 1,118 1,118 1,118 1,118 1,118 1,118 1,118 1,118 13,413 13,919 14,582
Vote 9 - Waste Water Management 1,570 1,570 1,570 1,570 1,570 1,570 1,570 1,570 1,570 1,570 1,570 1,570 18,843 19,553 20,494
Vote 10 - Road Transport 8,558 8,558 8,558 8,558 8,558 8,558 8,558 8,558 8,558 8,558 8,558 8,558 102,695 106,565 111,695
Vote 11 - Water 2,141 2,141 2,141 2,141 2,141 2,141 2,141 2,141 2,141 2,141 2,141 2,141 25,686 26,655 27,938
Vote 12 - Electricity 13,814 13,814 13,814 13,814 13,814 13,814 13,814 13,814 13,814 13,814 13,814 13,814 165,768 172,016 180,296
Vote 13 - Technical Serv ices and PMU 1,501 1,501 1,501 1,501 1,501 1,501 1,501 1,501 1,501 1,501 1,501 1,501 18,008 18,687 19,586
Vote 14 - Airport – – – –
Vote 15 - [NAME OF VOTE 15] – – – –
Total Expenditure by Vote 49,593 48,643 56,230 47,593 47,293 48,330 48,393 47,293 50,830 47,293 47,843 48,129 587,461 609,602 638,947
Surplus/(Deficit) before assoc. 28,458 (20,675) (27,217) (10,767) 34,256 (26,192) (16,791) (19,379) 24,927 (22,103) (22,987) (25,307) (103,776) (103,924) (117,368)
Tax ation – – – – – – – – – – – – – – –
Attributable to minorities – – – – – – – – – – – – – – –
Share of surplus/ (deficit) of associate – – – – – – – – – – – – – – –
Surplus/(Deficit) 1 28,458 (20,675) (27,217) (10,767) 34,256 (26,192) (16,791) (19,379) 24,927 (22,103) (22,987) (25,307) (103,776) (103,924) (117,368)
Budget Year 2014/15Medium Term Revenue and Expenditure
Framework
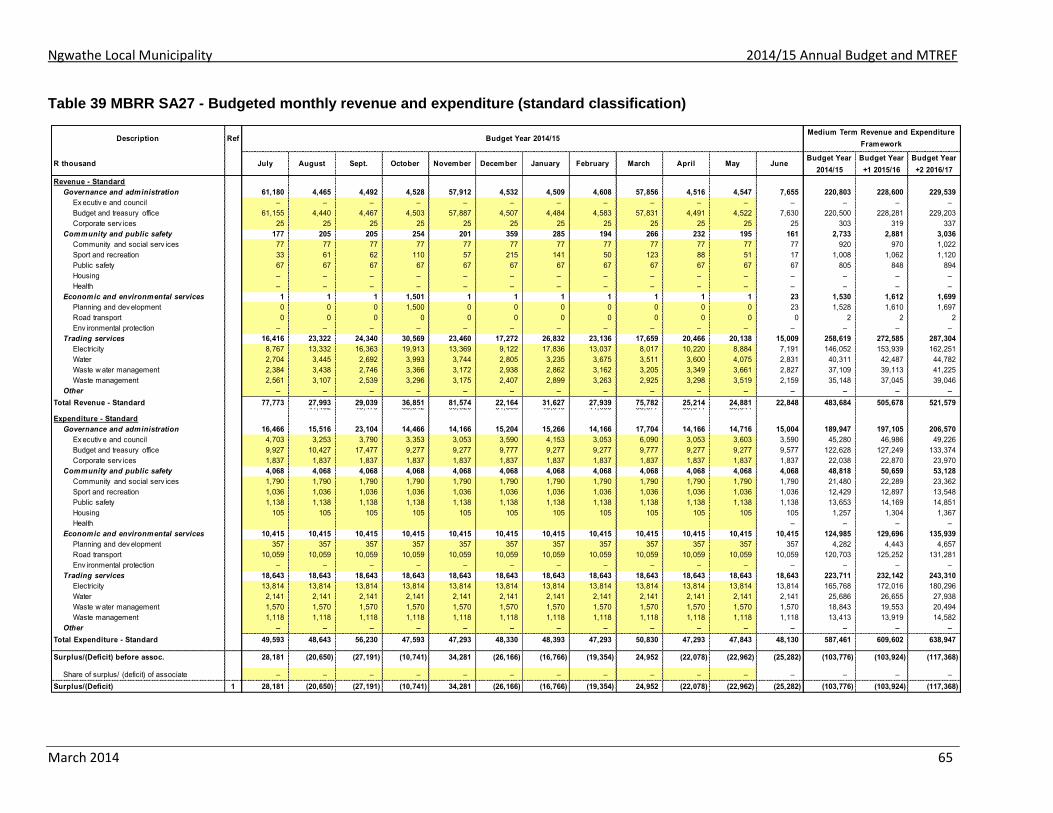
Ngwathe Local Municipality 2014/15 Annual Budget and MTREF
March 2014 65
Table 39 MBRR SA27 - Budgeted monthly revenue and expenditure (standard classification)
Description Ref
R thousand July August Sept. October November December January February March April May JuneBudget Year
2014/15
Budget Year
+1 2015/16
Budget Year
+2 2016/17
Revenue - Standard
Governance and administration 61,180 4,465 4,492 4,528 57,912 4,532 4,509 4,608 57,856 4,516 4,547 7,655 220,803 228,600 229,539
Ex ecutiv e and council – – – – – – – – – – – – – – –
Budget and treasury office 61,155 4,440 4,467 4,503 57,887 4,507 4,484 4,583 57,831 4,491 4,522 7,630 220,500 228,281 229,203
Corporate serv ices 25 25 25 25 25 25 25 25 25 25 25 25 303 319 337
Community and public safety 177 205 205 254 201 359 285 194 266 232 195 161 2,733 2,881 3,036
Community and social serv ices 77 77 77 77 77 77 77 77 77 77 77 77 920 970 1,022
Sport and recreation 33 61 62 110 57 215 141 50 123 88 51 17 1,008 1,062 1,120
Public safety 67 67 67 67 67 67 67 67 67 67 67 67 805 848 894
Housing – – – – – – – – – – – – – – –
Health – – – – – – – – – – – – – – –
Economic and environmental services 1 1 1 1,501 1 1 1 1 1 1 1 23 1,530 1,612 1,699
Planning and dev elopment 0 0 0 1,500 0 0 0 0 0 0 0 23 1,528 1,610 1,697
Road transport 0 0 0 0 0 0 0 0 0 0 0 0 2 2 2
Env ironmental protection – – – – – – – – – – – – – – –
Trading services 16,416 23,322 24,340 30,569 23,460 17,272 26,832 23,136 17,659 20,466 20,138 15,009 258,619 272,585 287,304
Electricity 8,767 13,332 16,363 19,913 13,369 9,122 17,836 13,037 8,017 10,220 8,884 7,191 146,052 153,939 162,251
Water 2,704 3,445 2,692 3,993 3,744 2,805 3,235 3,675 3,511 3,600 4,075 2,831 40,311 42,487 44,782
Waste w ater management 2,384 3,438 2,746 3,366 3,172 2,938 2,862 3,162 3,205 3,349 3,661 2,827 37,109 39,113 41,225
Waste management 2,561 3,107 2,539 3,296 3,175 2,407 2,899 3,263 2,925 3,298 3,519 2,159 35,148 37,045 39,046
Other – – – – – – – – – – – – – – –
Total Revenue - Standard 77,773 27,993 29,039 36,851 81,574 22,164 31,627 27,939 75,782 25,214 24,881 22,848 483,684 505,678 521,579 41,402 45,479 58,342 95,020 31,363 49,540 41,053 83,877 35,511 33,841
Expenditure - Standard
Governance and administration 16,466 15,516 23,104 14,466 14,166 15,204 15,266 14,166 17,704 14,166 14,716 15,004 189,947 197,105 206,570
Ex ecutiv e and council 4,703 3,253 3,790 3,353 3,053 3,590 4,153 3,053 6,090 3,053 3,603 3,590 45,280 46,986 49,226
Budget and treasury office 9,927 10,427 17,477 9,277 9,277 9,777 9,277 9,277 9,777 9,277 9,277 9,577 122,628 127,249 133,374
Corporate serv ices 1,837 1,837 1,837 1,837 1,837 1,837 1,837 1,837 1,837 1,837 1,837 1,837 22,038 22,870 23,970
Community and public safety 4,068 4,068 4,068 4,068 4,068 4,068 4,068 4,068 4,068 4,068 4,068 4,068 48,818 50,659 53,128
Community and social serv ices 1,790 1,790 1,790 1,790 1,790 1,790 1,790 1,790 1,790 1,790 1,790 1,790 21,480 22,289 23,362
Sport and recreation 1,036 1,036 1,036 1,036 1,036 1,036 1,036 1,036 1,036 1,036 1,036 1,036 12,429 12,897 13,548
Public safety 1,138 1,138 1,138 1,138 1,138 1,138 1,138 1,138 1,138 1,138 1,138 1,138 13,653 14,169 14,851
Housing 105 105 105 105 105 105 105 105 105 105 105 105 1,257 1,304 1,367
Health – – – –
Economic and environmental services 10,415 10,415 10,415 10,415 10,415 10,415 10,415 10,415 10,415 10,415 10,415 10,415 124,985 129,696 135,939
Planning and dev elopment 357 357 357 357 357 357 357 357 357 357 357 357 4,282 4,443 4,657
Road transport 10,059 10,059 10,059 10,059 10,059 10,059 10,059 10,059 10,059 10,059 10,059 10,059 120,703 125,252 131,281
Env ironmental protection – – – – – – – – – – – – – – –
Trading services 18,643 18,643 18,643 18,643 18,643 18,643 18,643 18,643 18,643 18,643 18,643 18,643 223,711 232,142 243,310
Electricity 13,814 13,814 13,814 13,814 13,814 13,814 13,814 13,814 13,814 13,814 13,814 13,814 165,768 172,016 180,296
Water 2,141 2,141 2,141 2,141 2,141 2,141 2,141 2,141 2,141 2,141 2,141 2,141 25,686 26,655 27,938
Waste w ater management 1,570 1,570 1,570 1,570 1,570 1,570 1,570 1,570 1,570 1,570 1,570 1,570 18,843 19,553 20,494
Waste management 1,118 1,118 1,118 1,118 1,118 1,118 1,118 1,118 1,118 1,118 1,118 1,118 13,413 13,919 14,582
Other – – – – – – – – – – – – – – –
Total Expenditure - Standard 49,593 48,643 56,230 47,593 47,293 48,330 48,393 47,293 50,830 47,293 47,843 48,130 587,461 609,602 638,947
Surplus/(Deficit) before assoc. 28,181 (20,650) (27,191) (10,741) 34,281 (26,166) (16,766) (19,354) 24,952 (22,078) (22,962) (25,282) (103,776) (103,924) (117,368)
Share of surplus/ (deficit) of associate – – – – – – – – – – – – – – –
Surplus/(Deficit) 1 28,181 (20,650) (27,191) (10,741) 34,281 (26,166) (16,766) (19,354) 24,952 (22,078) (22,962) (25,282) (103,776) (103,924) (117,368)
Budget Year 2014/15Medium Term Revenue and Expenditure
Framework
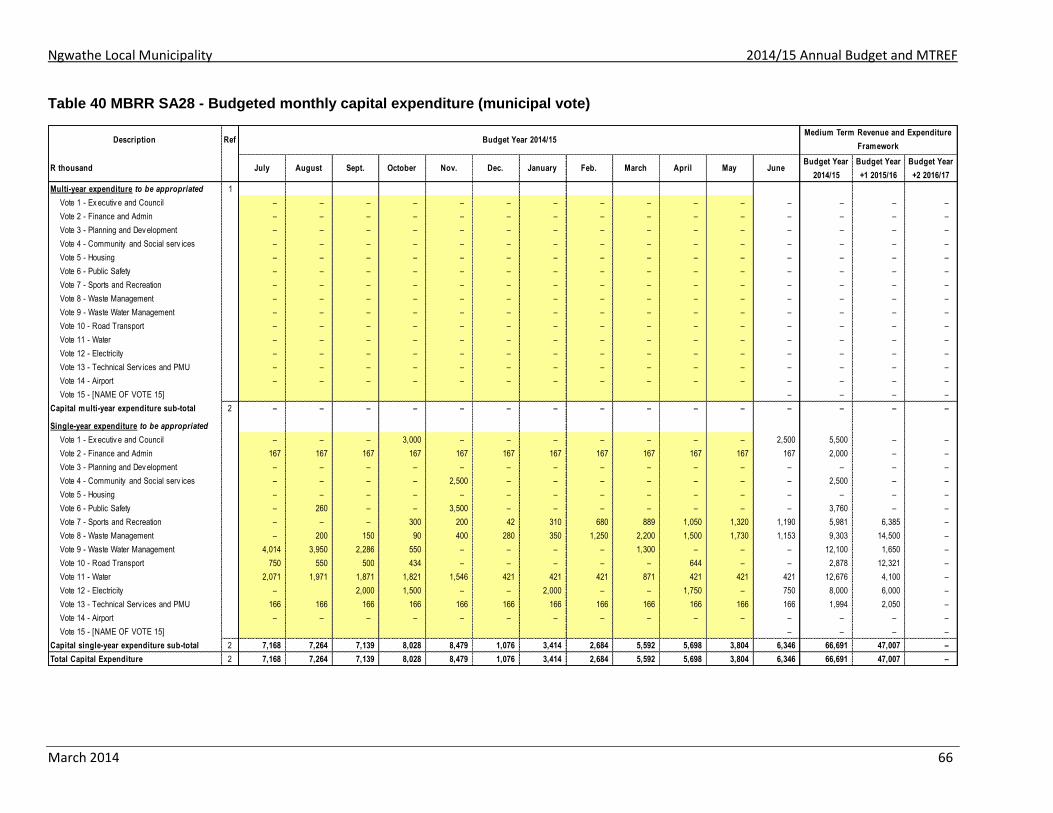
Ngwathe Local Municipality 2014/15 Annual Budget and MTREF
March 2014 66
Table 40 MBRR SA28 - Budgeted monthly capital expenditure (municipal vote)
Description Ref
R thousand July August Sept. October Nov. Dec. January Feb. March April May JuneBudget Year
2014/15
Budget Year
+1 2015/16
Budget Year
+2 2016/17
Multi-year expenditure to be appropriated 1
Vote 1 - Ex ecutiv e and Council – – – – – – – – – – – – – – –
Vote 2 - Finance and Admin – – – – – – – – – – – – – – –
Vote 3 - Planning and Dev elopment – – – – – – – – – – – – – – –
Vote 4 - Community and Social serv ices – – – – – – – – – – – – – – –
Vote 5 - Housing – – – – – – – – – – – – – – –
Vote 6 - Public Safety – – – – – – – – – – – – – – –
Vote 7 - Sports and Recreation – – – – – – – – – – – – – – –
Vote 8 - Waste Management – – – – – – – – – – – – – – –
Vote 9 - Waste Water Management – – – – – – – – – – – – – – –
Vote 10 - Road Transport – – – – – – – – – – – – – – –
Vote 11 - Water – – – – – – – – – – – – – – –
Vote 12 - Electricity – – – – – – – – – – – – – – –
Vote 13 - Technical Serv ices and PMU – – – – – – – – – – – – – – –
Vote 14 - Airport – – – – – – – – – – – – – – –
Vote 15 - [NAME OF VOTE 15] – – – –
Capital multi-year expenditure sub-total 2 – – – – – – – – – – – – – – –
Single-year expenditure to be appropriated
Vote 1 - Ex ecutiv e and Council – – – 3,000 – – – – – – – 2,500 5,500 – –
Vote 2 - Finance and Admin 167 167 167 167 167 167 167 167 167 167 167 167 2,000 – –
Vote 3 - Planning and Dev elopment – – – – – – – – – – – – – – –
Vote 4 - Community and Social serv ices – – – – 2,500 – – – – – – – 2,500 – –
Vote 5 - Housing – – – – – – – – – – – – – – –
Vote 6 - Public Safety – 260 – – 3,500 – – – – – – – 3,760 – –
Vote 7 - Sports and Recreation – – – 300 200 42 310 680 889 1,050 1,320 1,190 5,981 6,385 –
Vote 8 - Waste Management – 200 150 90 400 280 350 1,250 2,200 1,500 1,730 1,153 9,303 14,500 –
Vote 9 - Waste Water Management 4,014 3,950 2,286 550 – – – – 1,300 – – – 12,100 1,650 –
Vote 10 - Road Transport 750 550 500 434 – – – – – 644 – – 2,878 12,321 –
Vote 11 - Water 2,071 1,971 1,871 1,821 1,546 421 421 421 871 421 421 421 12,676 4,100 –
Vote 12 - Electricity – 2,000 1,500 – – 2,000 – – 1,750 – 750 8,000 6,000 –
Vote 13 - Technical Serv ices and PMU 166 166 166 166 166 166 166 166 166 166 166 166 1,994 2,050 –
Vote 14 - Airport – – – – – – – – – – – – – – –
Vote 15 - [NAME OF VOTE 15] – – – –
Capital single-year expenditure sub-total 2 7,168 7,264 7,139 8,028 8,479 1,076 3,414 2,684 5,592 5,698 3,804 6,346 66,691 47,007 –
Total Capital Expenditure 2 7,168 7,264 7,139 8,028 8,479 1,076 3,414 2,684 5,592 5,698 3,804 6,346 66,691 47,007 –
Budget Year 2014/15Medium Term Revenue and Expenditure
Framework
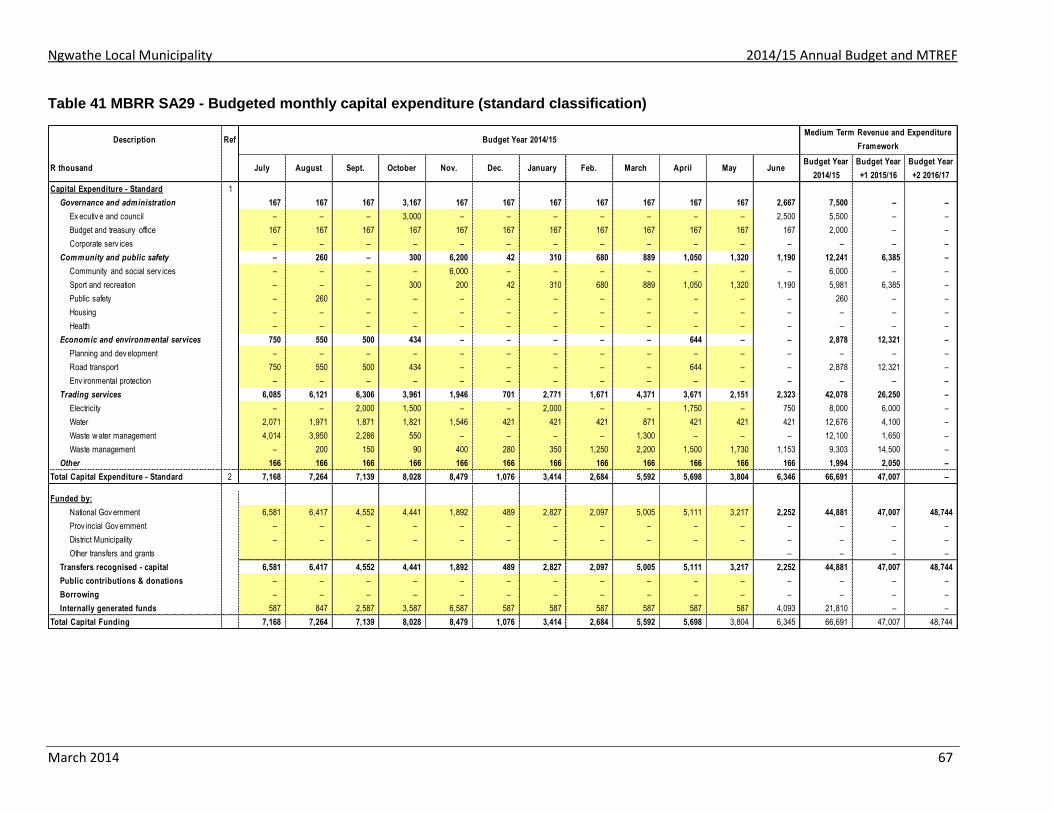
Ngwathe Local Municipality 2014/15 Annual Budget and MTREF
March 2014 67
Table 41 MBRR SA29 - Budgeted monthly capital expenditure (standard classification)
Description Ref
R thousand July August Sept. October Nov. Dec. January Feb. March April May JuneBudget Year
2014/15
Budget Year
+1 2015/16
Budget Year
+2 2016/17
Capital Expenditure - Standard 1
Governance and administration 167 167 167 3,167 167 167 167 167 167 167 167 2,667 7,500 – –
Ex ecutiv e and council – – – 3,000 – – – – – – – 2,500 5,500 – –
Budget and treasury office 167 167 167 167 167 167 167 167 167 167 167 167 2,000 – –
Corporate serv ices – – – – – – – – – – – – – – –
Community and public safety – 260 – 300 6,200 42 310 680 889 1,050 1,320 1,190 12,241 6,385 –
Community and social serv ices – – – – 6,000 – – – – – – – 6,000 – –
Sport and recreation – – – 300 200 42 310 680 889 1,050 1,320 1,190 5,981 6,385 –
Public safety – 260 – – – – – – – – – – 260 – –
Housing – – – – – – – – – – – – – – –
Health – – – – – – – – – – – – – – –
Economic and environmental services 750 550 500 434 – – – – – 644 – – 2,878 12,321 –
Planning and dev elopment – – – – – – – – – – – – – – –
Road transport 750 550 500 434 – – – – – 644 – – 2,878 12,321 –
Env ironmental protection – – – – – – – – – – – – – – –
Trading services 6,085 6,121 6,306 3,961 1,946 701 2,771 1,671 4,371 3,671 2,151 2,323 42,078 26,250 –
Electricity – – 2,000 1,500 – – 2,000 – – 1,750 – 750 8,000 6,000 –
Water 2,071 1,971 1,871 1,821 1,546 421 421 421 871 421 421 421 12,676 4,100 –
Waste w ater management 4,014 3,950 2,286 550 – – – – 1,300 – – – 12,100 1,650 –
Waste management – 200 150 90 400 280 350 1,250 2,200 1,500 1,730 1,153 9,303 14,500 –
Other 166 166 166 166 166 166 166 166 166 166 166 166 1,994 2,050 –
Total Capital Expenditure - Standard 2 7,168 7,264 7,139 8,028 8,479 1,076 3,414 2,684 5,592 5,698 3,804 6,346 66,691 47,007 –
Funded by:
National Gov ernment 6,581 6,417 4,552 4,441 1,892 489 2,827 2,097 5,005 5,111 3,217 2,252 44,881 47,007 48,744
Prov incial Gov ernment – – – – – – – – – – – – – – –
District Municipality – – – – – – – – – – – – – – –
Other transfers and grants – – – –
Transfers recognised - capital 6,581 6,417 4,552 4,441 1,892 489 2,827 2,097 5,005 5,111 3,217 2,252 44,881 47,007 48,744
Public contributions & donations – – – – – – – – – – – – – – –
Borrowing – – – – – – – – – – – – – – –
Internally generated funds 587 847 2,587 3,587 6,587 587 587 587 587 587 587 4,093 21,810 – –
Total Capital Funding 7,168 7,264 7,139 8,028 8,479 1,076 3,414 2,684 5,592 5,698 3,804 6,345 66,691 47,007 48,744
Budget Year 2014/15Medium Term Revenue and Expenditure
Framework
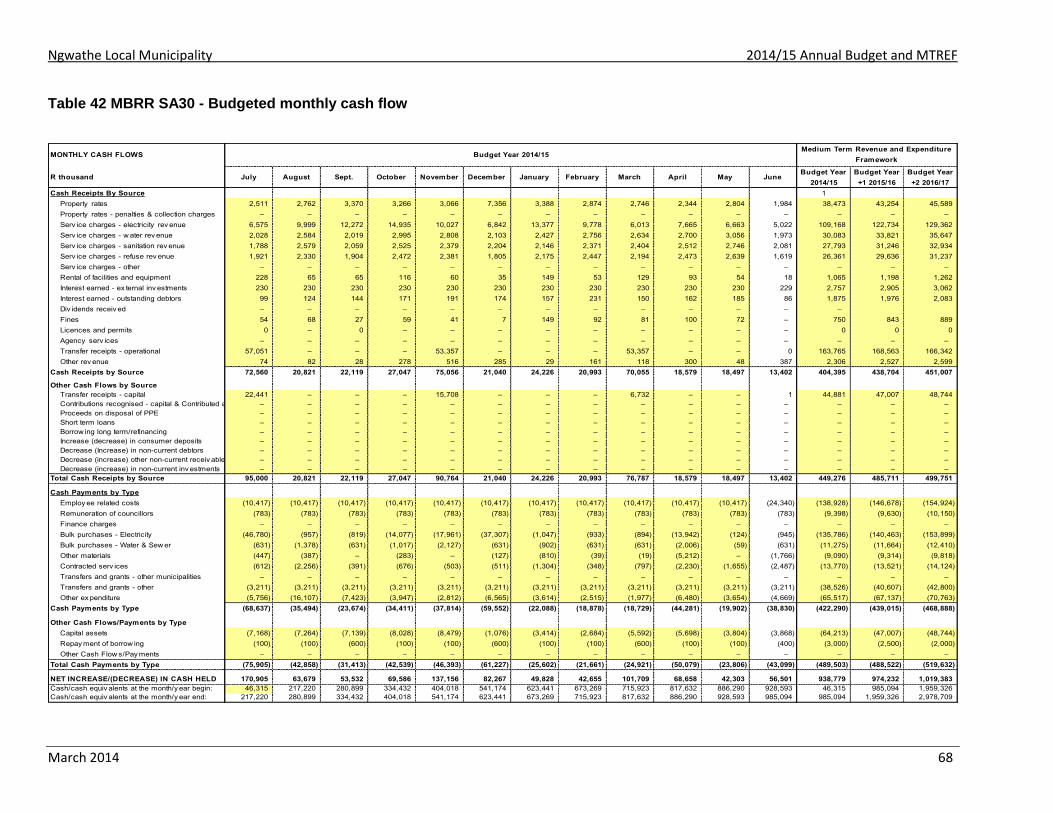
Ngwathe Local Municipality 2014/15 Annual Budget and MTREF
March 2014 68
Table 42 MBRR SA30 - Budgeted monthly cash flow
MONTHLY CASH FLOWS
R thousand July August Sept. October November December January February March April May JuneBudget Year
2014/15
Budget Year
+1 2015/16
Budget Year
+2 2016/17
Cash Receipts By Source 1
Property rates 2,511 2,762 3,370 3,266 3,066 7,356 3,388 2,874 2,746 2,344 2,804 1,984 38,473 43,254 45,589
Property rates - penalties & collection charges – – – – – – – – – – – – – – –
Serv ice charges - electricity rev enue 6,575 9,999 12,272 14,935 10,027 6,842 13,377 9,778 6,013 7,665 6,663 5,022 109,168 122,734 129,362
Serv ice charges - w ater rev enue 2,028 2,584 2,019 2,995 2,808 2,103 2,427 2,756 2,634 2,700 3,056 1,973 30,083 33,821 35,647
Serv ice charges - sanitation rev enue 1,788 2,579 2,059 2,525 2,379 2,204 2,146 2,371 2,404 2,512 2,746 2,081 27,793 31,246 32,934
Serv ice charges - refuse rev enue 1,921 2,330 1,904 2,472 2,381 1,805 2,175 2,447 2,194 2,473 2,639 1,619 26,361 29,636 31,237
Serv ice charges - other – – – – – – – – – – – – – – –
Rental of facilities and equipment 228 65 65 116 60 35 149 53 129 93 54 18 1,065 1,198 1,262
Interest earned - ex ternal inv estments 230 230 230 230 230 230 230 230 230 230 230 229 2,757 2,905 3,062
Interest earned - outstanding debtors 99 124 144 171 191 174 157 231 150 162 185 86 1,875 1,976 2,083
Div idends receiv ed – – – – – – – – – – – – –
Fines 54 68 27 59 41 7 149 92 81 100 72 – 750 843 889
Licences and permits 0 – 0 – – – – – – – – – 0 0 0
Agency serv ices – – – – – – – – – – – – – – –
Transfer receipts - operational 57,051 – – – 53,357 – – – 53,357 – – 0 163,765 168,563 166,342
Other rev enue 74 82 28 278 516 285 29 161 118 300 48 387 2,306 2,527 2,599
Cash Receipts by Source 72,560 20,821 22,119 27,047 75,056 21,040 24,226 20,993 70,055 18,579 18,497 13,402 404,395 438,704 451,007
Other Cash Flows by Source
Transfer receipts - capital 22,441 – – – 15,708 – – – 6,732 – – 1 44,881 47,007 48,744
Contributions recognised - capital & Contributed assets – – – – – – – – – – – – – – –
Proceeds on disposal of PPE – – – – – – – – – – – – – – –
Short term loans – – – – – – – – – – – – – – –
Borrow ing long term/refinancing – – – – – – – – – – – – – – –
Increase (decrease) in consumer deposits – – – – – – – – – – – – – – –
Decrease (Increase) in non-current debtors – – – – – – – – – – – – – – –
Decrease (increase) other non-current receiv ables – – – – – – – – – – – – – – –
Decrease (increase) in non-current inv estments – – – – – – – – – – – – – – –
Total Cash Receipts by Source 95,000 20,821 22,119 27,047 90,764 21,040 24,226 20,993 76,787 18,579 18,497 13,402 449,276 485,711 499,751
Cash Payments by Type
Employ ee related costs (10,417) (10,417) (10,417) (10,417) (10,417) (10,417) (10,417) (10,417) (10,417) (10,417) (10,417) (24,340) (138,928) (146,678) (154,924)
Remuneration of councillors (783) (783) (783) (783) (783) (783) (783) (783) (783) (783) (783) (783) (9,398) (9,630) (10,150)
Finance charges – – – – – – – – – – – – – – –
Bulk purchases - Electricity (46,780) (957) (819) (14,077) (17,961) (37,307) (1,047) (933) (894) (13,942) (124) (945) (135,786) (140,463) (153,899)
Bulk purchases - Water & Sew er (631) (1,378) (631) (1,017) (2,127) (631) (902) (631) (631) (2,006) (59) (631) (11,275) (11,664) (12,410)
Other materials (447) (387) – (283) – (127) (810) (39) (19) (5,212) – (1,766) (9,090) (9,314) (9,818)
Contracted serv ices (612) (2,256) (391) (676) (503) (511) (1,304) (348) (797) (2,230) (1,655) (2,487) (13,770) (13,521) (14,124)
Transfers and grants - other municipalities – – – – – – – – – – – – – – –
Transfers and grants - other (3,211) (3,211) (3,211) (3,211) (3,211) (3,211) (3,211) (3,211) (3,211) (3,211) (3,211) (3,211) (38,526) (40,607) (42,800)
Other ex penditure (5,756) (16,107) (7,423) (3,947) (2,812) (6,565) (3,614) (2,515) (1,977) (6,480) (3,654) (4,669) (65,517) (67,137) (70,763)
Cash Payments by Type (68,637) (35,494) (23,674) (34,411) (37,814) (59,552) (22,088) (18,878) (18,729) (44,281) (19,902) (38,830) (422,290) (439,015) (468,888)
Other Cash Flows/Payments by Type
Capital assets (7,168) (7,264) (7,139) (8,028) (8,479) (1,076) (3,414) (2,684) (5,592) (5,698) (3,804) (3,868) (64,213) (47,007) (48,744)
Repay ment of borrow ing (100) (100) (600) (100) (100) (600) (100) (100) (600) (100) (100) (400) (3,000) (2,500) (2,000)
Other Cash Flow s/Pay ments – – – – – – – – – – – – – – –
Total Cash Payments by Type (75,905) (42,858) (31,413) (42,539) (46,393) (61,227) (25,602) (21,661) (24,921) (50,079) (23,806) (43,099) (489,503) (488,522) (519,632)
NET INCREASE/(DECREASE) IN CASH HELD 170,905 63,679 53,532 69,586 137,156 82,267 49,828 42,655 101,709 68,658 42,303 56,501 938,779 974,232 1,019,383
Cash/cash equiv alents at the month/y ear begin: 46,315 217,220 280,899 334,432 404,018 541,174 623,441 673,269 715,923 817,632 886,290 928,593 46,315 985,094 1,959,326
Cash/cash equiv alents at the month/y ear end: 217,220 280,899 334,432 404,018 541,174 623,441 673,269 715,923 817,632 886,290 928,593 985,094 985,094 1,959,326 2,978,709
Medium Term Revenue and Expenditure
FrameworkBudget Year 2014/15

Ngwathe Local Municipality 2014/15 Annual Budget and MTREF
May 2014 69
2.8 Annual budgets and SDBIPs – internal departments
To be inserted
2.9 Contracts having future budgetary implications
In terms of the Municipality’s Supply Chain Management Policy, no contracts are awarded beyond the medium-term revenue and expenditure framework (three years). In ensuring adherence to this contractual time frame limitation, all reports submitted to either the Bid Evaluation and Adjudication Committees must obtain formal financial comments from the Financial Management Division of the Treasury Department.
2.10 Capital expenditure details
The following three tables present details of the Municipality’s capital expenditure programme, firstly on new assets, then the renewal of assets and finally on the repair and maintenance of assets.
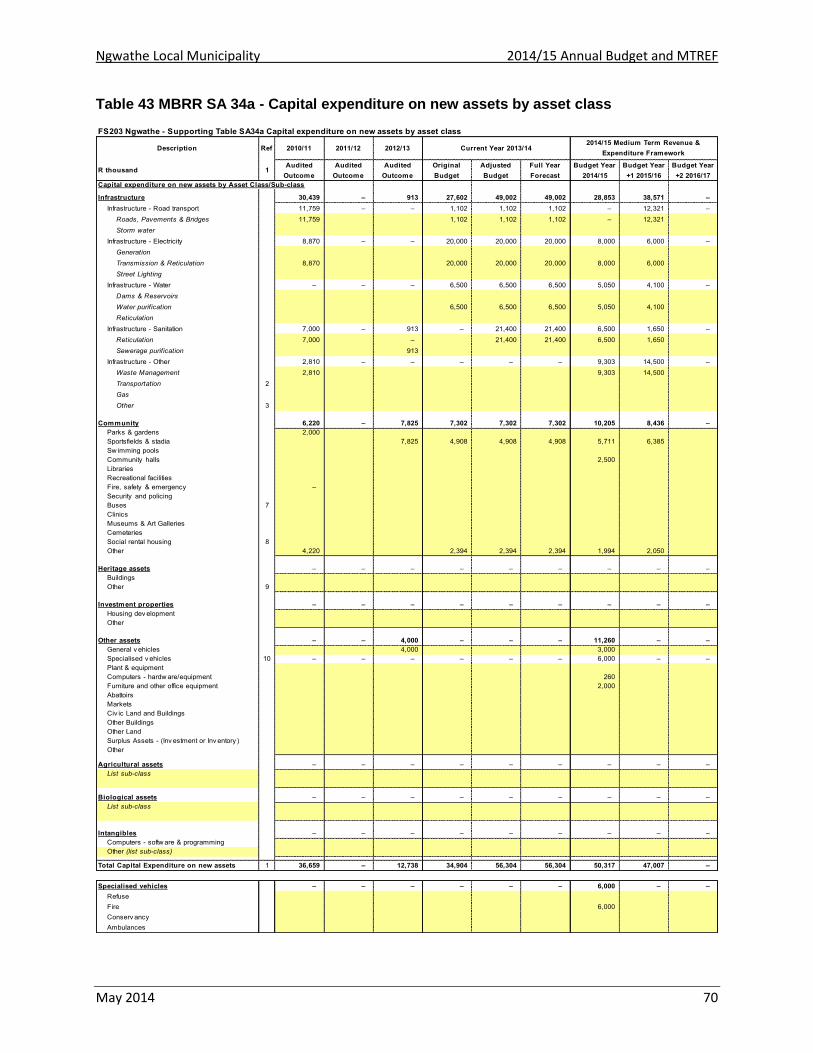
Ngwathe Local Municipality 2014/15 Annual Budget and MTREF
May 2014 70
Table 43 MBRR SA 34a - Capital expenditure on new assets by asset class
FS203 Ngwathe - Supporting Table SA34a Capital expenditure on new assets by asset class
Description Ref 2010/11 2011/12 2012/13
R thousand 1Audited
Outcome
Audited
Outcome
Audited
Outcome
Original
Budget
Adjusted
Budget
Full Year
Forecast
Budget Year
2014/15
Budget Year
+1 2015/16
Budget Year
+2 2016/17
Capital expenditure on new assets by Asset Class/Sub-class
Infrastructure 30,439 – 913 27,602 49,002 49,002 28,853 38,571 –
Infrastructure - Road transport 11,759 – – 1,102 1,102 1,102 – 12,321 –
Roads, Pavements & Bridges 11,759 1,102 1,102 1,102 – 12,321
Storm water
Infrastructure - Electricity 8,870 – – 20,000 20,000 20,000 8,000 6,000 –
Generation
Transmission & Reticulation 8,870 20,000 20,000 20,000 8,000 6,000
Street Lighting
Infrastructure - Water – – – 6,500 6,500 6,500 5,050 4,100 –
Dams & Reservoirs
Water purification 6,500 6,500 6,500 5,050 4,100
Reticulation
Infrastructure - Sanitation 7,000 – 913 – 21,400 21,400 6,500 1,650 –
Reticulation 7,000 – 21,400 21,400 6,500 1,650
Sewerage purification 913
Infrastructure - Other 2,810 – – – – – 9,303 14,500 –
Waste Management 2,810 9,303 14,500
Transportation 2
Gas
Other 3
Community 6,220 – 7,825 7,302 7,302 7,302 10,205 8,436 –
Parks & gardens 2,000
Sportsfields & stadia 7,825 4,908 4,908 4,908 5,711 6,385
Sw imming pools
Community halls 2,500
Libraries
Recreational facilities
Fire, safety & emergency –
Security and policing
Buses 7
Clinics
Museums & Art Galleries
Cemeteries
Social rental housing 8
Other 4,220 2,394 2,394 2,394 1,994 2,050
Heritage assets – – – – – – – – –
Buildings
Other 9
Investment properties – – – – – – – – –
Housing dev elopment
Other
Other assets – – 4,000 – – – 11,260 – –
General v ehicles 4,000 3,000
Specialised v ehicles 10 – – – – – – 6,000 – –
Plant & equipment
Computers - hardw are/equipment 260
Furniture and other office equipment 2,000
Abattoirs
Markets
Civ ic Land and Buildings
Other Buildings
Other Land
Surplus Assets - (Inv estment or Inv entory )
Other
Agricultural assets – – – – – – – – –
List sub-class
Biological assets – – – – – – – – –
List sub-class
Intangibles – – – – – – – – –
Computers - softw are & programming
Other (list sub-class)
Total Capital Expenditure on new assets 1 36,659 – 12,738 34,904 56,304 56,304 50,317 47,007 –
Specialised vehicles – – – – – – 6,000 – –
Refuse
Fire 6,000
Conserv ancy
Ambulances
Current Year 2013/142014/15 Medium Term Revenue &
Expenditure Framework
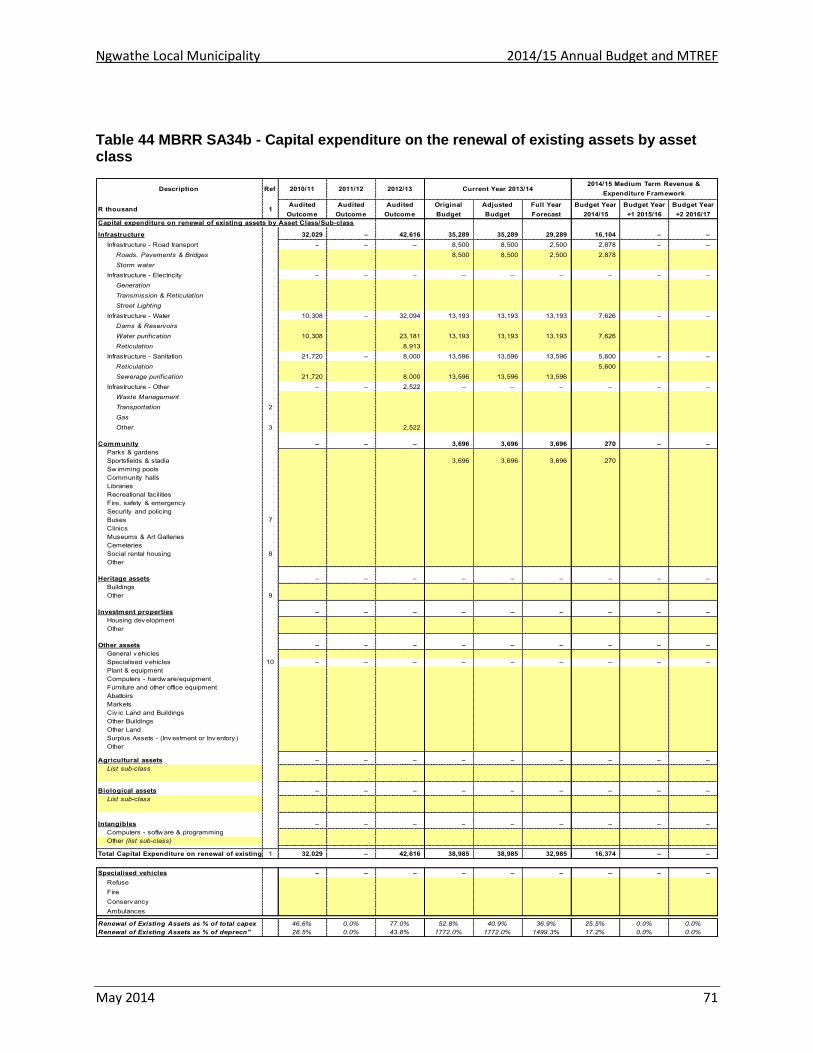
Ngwathe Local Municipality 2014/15 Annual Budget and MTREF
May 2014 71
Table 44 MBRR SA34b - Capital expenditure on the renewal of existing assets by asset class
Description Ref 2010/11 2011/12 2012/13
R thousand 1Audited
Outcome
Audited
Outcome
Audited
Outcome
Original
Budget
Adjusted
Budget
Full Year
Forecast
Budget Year
2014/15
Budget Year
+1 2015/16
Budget Year
+2 2016/17
Capital expenditure on renewal of existing assets by Asset Class/Sub-class
Infrastructure 32,029 – 42,616 35,289 35,289 29,289 16,104 – –
Infrastructure - Road transport – – – 8,500 8,500 2,500 2,878 – –
Roads, Pavements & Bridges 8,500 8,500 2,500 2,878
Storm water
Infrastructure - Electricity – – – – – – – – –
Generation
Transmission & Reticulation
Street Lighting
Infrastructure - Water 10,308 – 32,094 13,193 13,193 13,193 7,626 – –
Dams & Reservoirs
Water purification 10,308 23,181 13,193 13,193 13,193 7,626
Reticulation 8,913
Infrastructure - Sanitation 21,720 – 8,000 13,596 13,596 13,596 5,600 – –
Reticulation 5,600
Sewerage purification 21,720 8,000 13,596 13,596 13,596
Infrastructure - Other – – 2,522 – – – – – –
Waste Management
Transportation 2
Gas
Other 3 2,522
Community – – – 3,696 3,696 3,696 270 – –
Parks & gardens
Sportsfields & stadia 3,696 3,696 3,696 270
Sw imming pools
Community halls
Libraries
Recreational facilities
Fire, safety & emergency
Security and policing
Buses 7
Clinics
Museums & Art Galleries
Cemeteries
Social rental housing 8
Other
Heritage assets – – – – – – – – –
Buildings
Other 9
Investment properties – – – – – – – – –
Housing dev elopment
Other
Other assets – – – – – – – – –
General v ehicles
Specialised v ehicles 10 – – – – – – – – –
Plant & equipment
Computers - hardw are/equipment
Furniture and other office equipment
Abattoirs
Markets
Civ ic Land and Buildings
Other Buildings
Other Land
Surplus Assets - (Inv estment or Inv entory )
Other
Agricultural assets – – – – – – – – –
List sub-class
Biological assets – – – – – – – – –
List sub-class
Intangibles – – – – – – – – –
Computers - softw are & programming
Other (list sub-class)
Total Capital Expenditure on renewal of existing assets 1 32,029 – 42,616 38,985 38,985 32,985 16,374 – –
Specialised vehicles – – – – – – – – –
Refuse
Fire
Conserv ancy
Ambulances
Renewal of Existing Assets as % of total capex 46.6% 0.0% 77.0% 52.8% 40.9% 36.9% 25.5% 0.0% 0.0%
Renewal of Existing Assets as % of deprecn" 28.5% 0.0% 43.8% 1772.0% 1772.0% 1499.3% 17.2% 0.0% 0.0%
Current Year 2013/142014/15 Medium Term Revenue &
Expenditure Framework
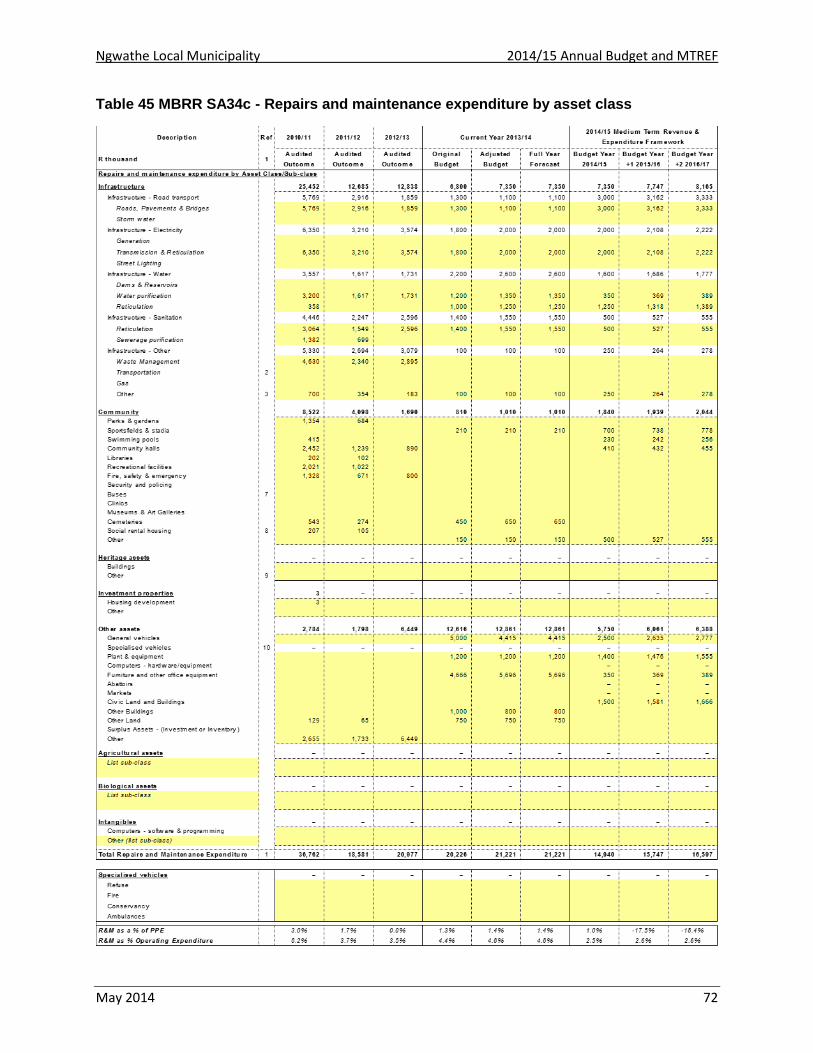
Ngwathe Local Municipality 2014/15 Annual Budget and MTREF
May 2014 72
Table 45 MBRR SA34c - Repairs and maintenance expenditure by asset class

Ngwathe Local Municipality 2014/15 Annual Budget and MTREF
May 2014 73
Table 46 MBRR SA36 - Detailed capital budget per municipal vote
Municipal Vote/Capital project Ref Individually Approved
(Yes/No)
Asset Class Asset Sub-Class GPS co-ordinates
R thousand 4 6 3 3 5
Audited
Outcome
2012/13
Current Year
2013/14
Full Year
Forecast
Budget Year
2014/15
Budget Year
+1 2015/16
Budget Year
+2 2016/17Ward location
New or
renewal
Parent municipality:
List all capital projects grouped by Municipal Vote
Waste water Management/SewerageHeilbron: Upgrading of sewer treatment worksMIG/FS0623/S/08/10 Yes Infrastructure - Sanitation Sewerage purification 56,430 10,856 4,500 400 – Renew al
Waste w ater Management/Sew erage Pary s: Upgrading of sew er treatment w orksMIG/FS0624/S/08/10 Yes Infrastructure - Sanitation Sewerage purification 85,500 2,740 1,100 – – Renew al
Water Pary s: Refurbishment and upgrading of w ater treatment w orks phase 3MIG/FS0714/W/09/09 Yes Infrastructure - Water Water purification 31,896 13,193 7,626 300 – Renew al
Sports and Recreation Koppies: Refurbishment of tennis courtMIG/FS0950/CF/12/13 Yes Community Sportsfields & stadia 1,000 100 60 – – Renew al
Sports and Recreation Phiritonia: Construction of sports complexMIG/FS0952/CF/13/13 Yes Community Sportsfields & stadia 4,200 2,358 41 – – New
Sports and Recreation Schonkenv ille: Refurbishment of sports complexMIG/FS0953/CF/12/14 Yes Community Sportsfields & stadia 4,622 1,896 210 – – Renew al
Roads Edenv ille: Pav ing of internal roads 1 KMMIG/FS0954/R,ST/13/14 Yes Infrastructure - Road transport Roads, Pavements & Bridges 6,559 576 322 – – Renew al
Roads Koppies: Pav ing of internal roads 1KMMIG/FS0955/F,ST/13/14 Yes Infrastructure - Road transport Roads, Pavements & Bridges 6,559 526 322 – – Renew al
Water Vredefort: Sew er connection in Mokw alo section, 1625 housesNot y et registered Yes Infrastructure - Sanitation Reticulation 27,897 6,500 6,500 1,250 – New
Sports and Recreation Edenv ille:Construction of sports facilitieMIG/FS0991/CF/13/15 Yes Community Sportsfields & stadia 5,494 1,250 – 5,094 400 New
Sports and Recreation Kw akw atsi:Construction of sports facilitiesMIG/FS0992/CF/13/15 Yes Community Sportsfields & stadia 7,412 1,300 5,670 1,292 450 New
Roads Pary s: Upgrade of low lev el bridge in Mandela section, TumaholeMIG/FS0999R,ST/13/14 Yes Infrastructure - Road transport Roads, Pavements & Bridges 4,184 2,500 2,234 250 – Renew al
Waste management Construction of a solid w aste disposal site in HeilbronNot y et registered Infrastructure - Other Waste Management 6,500 6,200 300 – New
Waste management Construction of a solid w aste disposal site in Pary sNot y et registered Infrastructure - Other Waste Management 11,500 3,103 8,000 397 New
Water Heilbron installation of 950 residential meters and 45 bulk w ater metersNot y et registered Infrastructure - Water Reticulation 4,000 – 3,800 200 New
Roads Phiritona Upgrade of low lev el bridge Not y et registered Infrastructure - Road transport Roads, Pavements & Bridges 6,500 – 6,100 400 New
Parent Capital expenditure 1 37,887 26,785 1,847
Entities:
List all capital projects grouped by Entity
Entity A
Water project A
Entity B
Electricity project B
Entity Capital expenditure – – – – –
Total Capital expenditure – 43,795 37,887 26,785 1,847
Project information
Program/Project descriptionProject
number
IDP
Goal
code
2
Prior year outcomes
Total Project
Estimate
2014/15 Medium Term Revenue &
Expenditure Framework

Ngwathe Local Municipality 2014/15 Annual Budget and MTREF
May 2014 74
2.11 Legislation compliance status
Compliance with the MFMA implementation requirements have been substantially adhered to through the following activities: 1. In year reporting
Reporting to National Treasury in electronic format was fully complied with on a monthly basis. Section 71 reporting to the Mayor (within 10 working days) has progressively improved and includes monthly published financial performance on the Municipality’s website.
2. Internship programme
The Municipality is participating in the Municipal Financial Management Internship programme and has employed five interns undergoing training in various divisions of the Financial Services Department. Of the five interns one has been appointed permanently from March 2013. The remaining four have completed their two year contract on 19 March 2014, and their contract have been extended for a further year. Four additional interns have been appointed with effect from 1 May 2014.
3. Budget and Treasury Office
The Budget and Treasury Office has been established in accordance with the MFMA. 4. Audit Committee
The municipality is utilising the services of the Fezile Dabi District Municipality audit committee in a shared agreement. The audit committee is functional.
5. Service Delivery and Implementation Plan
The detail SDBIP document is at a draft stage and will be finalised after approval of the 2014/15 MTREF in May 2014 directly aligned and informed by the 2014/15 MTREF.
6. Annual Report
Annual report is compiled in terms of the MFMA and National Treasury requirements. 7. MFMA Training
The MFMA training module in electronic format is presented at the Municipality’s internal centre and training is ongoing. Interns have completed the training.
8. Policies
Budget related policies are reviewed annually, the policies are sent for public participation.
Ngwathe Local Municipality 2014/15 Annual Budget and MTREF
May 2014 75
2.12 Municipal manager’s quality certificate
I …………………………………, municipal manager of Ngwathe Local Municipality, hereby
certify that the annual budget and supporting documentation have been prepared in accordance
with the Municipal Finance Management Act and the regulations made under the Act, and that
the annual budget and supporting documents are consistent with the draft Integrated
Development Plan of the municipality.
Print Name _____________________________________________
Municipal manager of Ngwathe Local municipality (FS203)
Signature ______________________________________________
Date _____________________________