Embed Size (px)
Citation preview


АННОТАЦИЯ
Автор Бручкус Сергей Игоревич, Власова НатальяСергеевна
Название ВКР Продвинутая аналитика для прогнозапотребительских предпочтений на примере кейсаL’Oréal
Образовательная программа Менеджмент
Направление подготовки Бизнес-аналитика и большие данные
Год 2021
Научный руководитель Яблонский Сергей Александрович
Описание цели, задач и основныхрезультатов
Целью исследования является анализ поведенияпотребителей продукции бренда Kiehl’s,принадлежащего компании L’Oréal, дляперсонализации клиентского опыта за счет выявлениясхожих паттернов в поведении, построениярекомендательной системы и алгоритма предсказаниясовершения заказа в будущем.
Задачами проекта являются:
1. Изучить проблему анализа потребительскогоповедения и проанализировать актуальныетеоретические и практические подходы кпроблеме;
2. Осуществить обзор литературы обиспользовании продвинутых аналитическихинструментов для персонализацииклиентского опыта на примерекластеризации и построениярекомендательной системы;
3. Определить методы и способыосуществления кластеризации потребителейна основе схожести их поведения,построения рекомендательной системы ипрогнозного алгоритма;
4. Провести разведочный анализ данных,осуществить кластеризацию с помощьювыбранного метода, создатьрекомендательную систему и прогнозныйалгоритм;
5. Оценить экономическую эффективностьвнедрения полученных решений компанией,описать первые этапы внедрения систем;

В результате работы была проведена кластеризацияклиентов компании, построена рекомендательнаясистема для товаров бренда, а также был разработаналгоритм, прогнозирующий совершение покупкиклиентов в краткосрочной перспективе. Полученныерезультаты были оценены с точки зренияэкономической эффективности, разработанныерешения были переданы компании.
Ключевые слова Поведение потребителей, онлайн-ритейл,кластеризация, рекомендательная система,прогнозирование заказа
ABSTRACT
Master Students’ Name Sergei I. Bruchkus, Natalia S. Vlasova
Master’s Thesis Title Advanced Analytics for Prediction of Customers’Preferences: L’Oréal Case
Educational Program Management
Main field of study Master in Business Analytics and Big Data
Year 2021
Academic Advisor’s Name Sergei A. Yablonskiy
Description of the goal, tasks andmain results
The goal of the project is to analyze consumer behavior ofKiehl’s brand products, owned by L’Oréal, to personalizecustomer experience by identifying similar patterns inbehavior, building a recommendation system and analgorithm for predicting future ordering.
Objectives of the project are:
1. Study the problem of analyzing consumerbehavior and analyze current theoretical andpractical approaches to the problem;
2. Review the literature on the use of advancedanalytical tools to personalize customerexperience using the example of clustering andbuilding a recommendation system;
3. Determine methods and ways of clusteringconsumers based on the similarity of theirbehavior, building a recommendation system anda purchase prediction algorithm;

4. Conduct exploratory data analysis, carry outclustering using the selected method, create arecommendation system and a predictivealgorithm;
5. Assess the economic efficiency of theimplementation of the solutions obtained by thecompany, describe the first stages of theimplementation of systems.
As a result of the work, the clustering of the company'sclients was carried out, a recommendation system forbrand goods was built, and an algorithm was developedthat predicts the completion of a customer's purchase inthe short term. The results obtained were evaluated interms of economic efficiency, the developed solutionswere transferred to the company.
Keywords Consumer behavior, online retail, clustering,recommendation system, order prediction

TABLE OF CONTENTS
INTRODUCTION 8
CHAPTER 1. INTRODUCTION TO CONSUMER BEHAVIOR ANALYSIS 10
1.1. Process and motives of consumer behavior analysis 10
1.2. Role of machine learning in consumer behavior analysis 14
1.3. Advanced techniques to analyse a consumer on the example of business cases 18
1.4. Typical challenges of consumer behavior analysis and recommendation system creation 27
1.5. Conclusion 31
CHAPTER 2. CONSUMER BEHAVIOR ANALYSIS METHODS REVIEW 32
2.1. Methods of data clustering 32
2.2. Methods of recommendation system development 39
2.3. Chosen methods for the project 46
2.4. Conclusion 50
CHAPTER 3. DATA ANALYSIS AND APPLICATION OF CHOSEN METHODS 52
3.1. Exploratory data analysis 52
3.2. Consumers clustering 62
3.2.1. Findings on consumer clustering 70
3.3. Recommender system creation 71
3.3.1. Utilization of the data set 71
3.3.2. Model description 71
3.3.3. Findings on recommendation system 72
3.3.4. Potential gaps of the recommender 76
3.4. Predictive model on customer’s potential purchase 77
3.4.1. Data preprocessing 77
3.4.2. Findings on the purchase prediction 78
3.5. Recommendations for further business implication 81
3.6. Future implementation process 88
3.7. Conclusion 91
6

CONCLUSION 94
LIST OF REFERENCES 101
APPENDICES 106
7

INTRODUCTION
This master’s thesis is a research project for one of the largest international FMCG
players in Russia and in the worl - L’Oréal company, and particularly for its brand Kiehl’s. The
company operates in the sector of beauty care products (including decorative cosmetics,
perfumery, skin care and hair care) and manages a portfolio of over 30 brands. The company has
4 main divisions: consumer products (decorative and care cosmetics of low and medium price
segment, available to a wide audience), luxury products (cosmetics and care products of the high
price segment), active cosmetics (medical and professional skin care products) and professional
products (various hair products intended for use by professionals in beauty and hairdressing
salons). The Kiehl’s brand itself, which this study is performed for, belongs to the luxury
products division.
Most previously existing papers on the topic of advanced techniques for consumer
behaviour analysis were mainly attempting to focus on short-term trends of consumer behavior,
while longer relationships between a company and a client tended to be a blind spot of most
researchers. Furthermore, the idea of bringing comprehensive analytics to the cosmetics industry
was not developed and embodied to a sufficient extent, since only few companies in this segment
were able to implement the findings and align customized solutions with their business
objectives. Thus, the above aspects result in a significant gap in investigation of advanced
analytics and recommender systems within the FMCG cosmetics niche with building the
ready-to-apply model introducing the main academic gap, which gives the team of researchers
the space to conduct this research.
The research is motivated by several factors. Firstly, there is a massive upcoming trend
for customizing the user experience, therefore, lack of product or service customization is a
significant competitive disadvantage for business. Business case analysis demonstrates that
customized approach is an effective way to build closer connections with customers and foster
their loyalty. Moreover, availability of big volumes of customer data to the companies and
lowering costs of storage and processing make the analysis of consumer behavior more
technically accessible to various companies. Finally, predictive analytics becomes more and
more in demand in business, since it leads to optimized activities of production, marketing,
logistics and R&D units, thus affecting a company’s overall financial performance.
8
This study is an attempt to close several revealed gaps. From the academic perspective,
there is a limited number of studies looking at the application of machine learning methods to
the analysis of consumer behavior. Moreover, there is also a significant lack of research on the
application of theoretical approaches to the creation of recommender systems for the Russian
FMCG industry. From the perspective of business, it was revealed that currently used advanced
analysis techniques and tools are very narrowly applied within short-term solutions within
L’Oréal and present a fragmented technology, which cannot be fully deployed and lead to
observable effects. In addition, the company does not cover long-term behavior prediction of
FMCG or cosmetics client’s future purchases. Finally, no one designed and implemented any
customer behaviour analysis system within the particular brand of Kiehl’s.
The goal of the project is to analyze consumer behavior in order to personalize the
customer experience by using recommendation models, clustering of clients or an algorithm for
predicting the order in the future. To address the issue of building recommendations for
particular brand of L’Oréal - Kiehl’s - as well as to highlight key parameters that influence the
customers’ choices, demonstrating the most effective way to make it a lasting solution for
increase in the brand’s performance, the following research questions (RQ) were formulated:
RQ 1: What are the main features and areas of application of consumer behavior analysis
in today's business environment?
RQ 2: What methods are used to solve the problems of consumer behavior analysis and
what methods can be chosen for Kiehl's case?
RQ 3: What similarities can be found in Kiehls’ consumer behavior, and how can we use
this to make the customer experience more personalized?
RQ 4: Is it possible to recommend to Kiehl’s customer an item from the proposed range
of products that is likely to be bought?
RQ 5: How, based on the previous purchase history, identify if Kiehl's client is about to
make an order within the next period (one month)?
In the first chapter of the study, the paper would consider consider the motivation,
specificities and procedure of conducting consumer behavior analysis, as well as highlight the
issue of using machine learning algorithms for consumer analysis, consider in detail the business
9

cases of large companies involved in consumer behavior analysis, and describe possible
difficulties. The second chapter is devoted to a theoretical review of existing methods used to
carry out the analysis, that would also assist in a decision on tools used for this investigation
later when it comes to the empirics.. The third chapter describes the practical application of the
methods selected in the second chapter on data provided by the brand’s representatives
specifically for this research. Then a closer look at details in data provided would reveal its
peculiarities, and after an initial analysis of the data is conducted, the research moves to
consumers clusterization, creation of a recommendation system and also an algorithm that
predicts whether a user is about to make an order for the brands’ products within next month.
Thus, the expected results are answers to the research questions outlined above,
highlighted consumer clusters, a reliably working recommendation system, and a purchase
predictor. There would also be a set of managerial recommendations provided for the company.
10

CHAPTER 1. INTRODUCTION TO CONSUMER BEHAVIOR ANALYSIS
With the drastic development of technology and increased access of people to the Internet
the position of E-commerce in the retail industry worldwide has grown stronger. According to
the work of Coppola (2021), in 2019 around 1.92 billion users have bought products and/or
services online. In 2020, despite the pandemic’s negative impacts on people’s purchasing
patterns, e-commerce sales volume grew by almost 28% and constituted $4.28 trillion globally
(Cramer-Flood 2021). As online sales volume grows, so does the amount of consumers and
orders data that businesses are able to collect, store, process, analyze and use to deliver more
personalized and specifically targeted products and services to better meet the needs of existing
customers, increasing both satisfaction and retention rates, and also attract new ones, increasing
total revenues.
The analysis of consumer behavior is used to process this data and implement the
designated goals. In this chapter, the first research question, stated as “What are the main
features and areas of application of consumer behavior analysis in today's business
environment?” is answered. The paper takes a closer look at what an analysis of consumer
behavior is, what data is needed to conduct it and in what directions a company can use its
results, and also we are going to consider several business cases that clearly demonstrate the
need for online stores and services in analyzing consumer behavior.
1.1. Process and motives of consumer behavior analysis
Currently, the choice of products and services in both online and offline retail is
overwhelming. Growing competition among companies leads to an intensifying struggle for each
consumer and makes consumer behavior analysis particularly relevant and, moreover, vital for
business success: according to Gartner research in 2020, collection of consumers data and
analysis of their experience predetermines revenue growth of the company, which are provided
by approaching data-driven marketing practices, i.e. targeting the right consumer at the right
time and in the right manner with best-suitable product, which are determined on the basis of
consumer behavior analysis.
Consumers’ behavior in this work is defined as the field of study concerning the actions
that consumers (primarily individual ones) make on the way of purchasing a product or service,
which will satisfy consumer’s need, along with the motives of such actions and different groups
10

of factors that have impact on consumer’s choices. The analysis of consumers’ behavior implies
using both quantitative and qualitative approaches to track consumers’ experience, preferences
and satisfaction.
Generally, analysis of consumer behavior allows business to obtain additional
information about the consumer's individual characteristics, his or her lifestyle, products
preferences, etc. In addition, it allows companies to understand what factors shape a consumer's
choice and what stages a buyer goes through before putting a particular product in the basket and
paying. This deep understanding of the consumer creates opportunities for enhancing customer
journey, which eventually leads to either cost savings or revenue increasing. There are several
groups of consumers’ behavior analysis parameters (Kotler and Armstrong 2010), which can
potentially affect preferences:
● Socio-cultural factors, including consumer’s social class, role in society, culture and
religion, reference group, etc.;
● Personal factors, which include a consumer’s gender, age, education, occupation and
level of income, marriage status and size of the family, health status, lifestyle, personality
and self-concept, etc.;
● Psychological factors, which means the set of values and attitudes of the consumer, his or
her motivation, perception and attitudes, previous experience, etc.;
The whole set of factors which can influence consumers’ behavior is extremely wide and
constantly evolving - new factors are regularly revealed and described in more recent scientific
and business papers, still leaving a room for further behavior examination. However, it is
difficult for companies to reliably identify such customers’ characteristics as self-concept, social
role, beliefs and attitudes, etc., especially when interacting with consumers online when traction
is held indirectly. To collect as much useful data as possible, companies try to analyze
consumer’s journey, therefore tracking geolocation, device identificators, web cookies,
consumers’ interaction with company’s social media, website (including tracing of computer
mouse movements) and/or apps, their reactions to online ads and promotional emails, search
history, information about orders and product usage, satisfaction metrics, etc. (Uzialko and
Freedman, 2018).
11

In our work, we are going to focus on consumer’ behavior analysis in the online retail
industry. Davey (2018) discusses the following types of such analysis in his work:
1. Pattern recognition – identifying specific regularly appearing patterns of consumers’
behavior regarding the frequency of purchases, the type of products selected, the
preferences shown depending on consumers’ personal characteristics, etc. According to
Vranik (2001), the most illustrative case where patterns recognition used is cross-selling;
2. Trend detection – revealing elongated and consequential changed in consumer data
during a certain period of time which enables adaptation of current operation and
marketing strategy and forecasting of consumers’ preferences in the nearest future;
3. Revealing most important product attributes – since product preferences are driven by
consumers’ personal tastes and perception of a product’s utility (Veres et al. 2014),
behavior analysis allows to reveal what particular distinguishing features of products
consumers find the most important and why they prefer one similar product to the other.
This study of main consumer behavior patterns is crucial for the company performance,
since deeper understanding of consumers allows to cluster them basing on revealed similarities,
forecast their demand and create recommendation engine (recommender) to offer consumers
products, which they are most likely to be interested in (extensive discussion of recommenders is
provided further). Correct application of the results of analysis of consumer behavior in practice
directly and indirectly influences various business metrics. For instance, if the classic
implementation of preferences analysis into a recommendation system in retail industry is
considered, the following factors of a company’s performance are influenced:
● Sales volume due to increase of recurring additional sales and of average check, since if a
consumer is recommended the right product at the exact time he or she needs it, the
probability that this product will be added to the shopping cart increases;
● Frequency of purchases, which is generally caused by two main reasons: firstly,
customers that enjoy the recommender service do turn back to the online shop more
often, and secondly, recommender can remind consumers to make regular purchases of
their favorite products on time;
12
● Level of satisfaction of a particular consumer, since appropriate recommendations ease
and improve customer journey and increases satisfaction with purchasing process and
company’s service;
● Customer loyalty and number of new clients who came on the advice of other satisfied
consumers - looking at recommendations, the consumer spends more time on the site,
gets used to the brand and interface, becomes closer to the company and gets a higher
level of engagement, while engaging other buyers;
● Decreased churn rate - results of consumer behavior analysis embedded in recommenders
can help re-engage consumers and prevent them from stopping purchasing in the online
store.
The results of consumers’ behavior analysis and retrieved insights are used by companies
in various spheres of business. In (Dekimpe 2020) the author distinguishes the following
directions of using the information received:
1. Marketing - one of the most dependable on consumers data spheres, in which the
behavior analysis enables revealing complimentary (from consumer’s point of view)
goods, forming product bundles, tuning targeting, clustering consumers and thus offering
them better customized products, revealing touchpoints to increase customers’ loyalty,
conducting sentiment analysis, improving interaction with consumers via various
marketing channels, etc.
2. Merchandising - concerns variety and availability of products displayed to a consumer,
and can be addressed by consumers’ behavior analysis in ways of goods assortment
restructuring and optimization, developing a flexible and responsive pricing system,
revising product display parameters, its description and design, etc.
3. Operations - in this sphere of a company’s business consumer analysis helps to plan
production volumes more reliably and adapt faster according to demand prediction,
changing products’ characteristics based on revealed preferences, significantly decrease
cost and increase performance transparency;
4. Logistics - in the field of online retail logistics primarily concerns purchased products
distribution and delivery, management of stocks, supply schedules and costs, dealing with13
order returns and other supply chain tasks that can be affected and improved by means of
consumers’ behavior analysis.
To sum up, analysis of consumers’ behavior is becoming more and more crucial for
business. This is especially true for the retail industry where consumers face regular products
(fast-moving consumer goods) with similar features and their choice is also guided by their
personal complex perception of products’ features and how the company treats them.
Appropriate application of consumer behavior analysis results in higher retention rates and
growing attraction of new customers coming to buy more products, thus increasing revenue and
strengthening the competitive position of the company.
1.2. Role of machine learning in consumer behavior analysis
To obtain reliable and comprehensive information about consumers, companies around
the world continuously use various methods of collecting consumer data - surveys, tracking
Internet activities, collecting personal data when registering in a loyalty system, analyzing
transactions, etc. - thus forming huge amounts of Big Data. According to Calciu (2018), only
Amazon, Google, Facebook and Microsoft store more than 1200 petabytes of customer data as
of 2020. Gathered data can be considered as Big Data when volume, velocity or variety (some
authors also mention veracity and value (White 2012)) of the data exceed the computational
capability of traditional IT operational systems and require capabilities for gathering, storing,
processing and analyzing ultra-large data volumes (Khade 2016). What is also important and
highlighted in (Bradlow et al. 2017), consumer big data implies not only a constant increase in
"rows", that is, an increasing increase in records about consumers, about orders, about the time
periods of making purchases, but also, and this is more significant, an increase in the number and
quality of "columns" that contain all new facts about themselves consumers, various parameters
affecting their behavior, which allow better study and prediction of preferences.
It is pointed (Kietzmann et al. 2018) that the consumer data gathered by companies can
be of two types:
● Structured data – sets that contain data on demographic characteristics of consumers,
their personal information, tracked transactions, history of browsing and purchasing
online. The datasets are rather standard and can be processed without additional data
14

preparation. Only about 20% of consumer data that companies collect are considered as
structured;
● Unstructured data – these data constitute the major part, are generated on a more regular
basis and include different results of customer surveys, feedback, images, records of
consumers’ interaction with customer service, comments on orders, etc.
Considering sources of both structured and unstructured data (Figure 1), the seven main sources
(though, the list is not exhaustive) are used by companies to gather reliable and comprehensive
consumer data (Bradlow et. al 2017). Location-based sources provide business with data on
consumers’ geolocation, typical mobility, nonconscious activities while browsing an online-shop
(e.g. movements of eyes, clicks paths), etc. Customer or household sources of data usually
include demographic characteristics, history of purchases and satisfaction with ordered products,
consumers’ reactions to ads, personalized offers and promotional materials sent by various
contact channels (E-mail, social networks, etc.), search history and browsing behavior and so on.
Finally, data from traditional enterprise systems sources are mainly collected via inventory
management systems, online payment systems or other software, which allows consumers'
baskets and complementarity or substitutability of the products purchased.
Figure 1. Sources of consumer data
Source: created by authors on the basis of [Bradlow et. al, 2017]
15

To retrieve useful information both from structured and unstructured data gathered from
various sources and to obtain goals of consumer behavior analysis, which were described in the
previous part, machine learning can be used. Machine learning itself is defined by (Alpaydin
2014) as a part of Artificial Intelligence aimed at "programming computers to optimize a
performance criterion using example data or past experience". Machine learning solves
predictive and descriptive tasks by applying models capable of learning in data and steadily
improving the performance over time.
The role of machine learning in retail is becoming increasingly important. Nowadays,
companies use machine learning for visual search engines, which allow consumers to find exact
goods by uploading an image (e.g. implemented by eBay, Tommy Hilfiger online brand shop, in
Russia embodied by Lamoda), for smart assistants, which are able to emulate a real shop
assistant, who can help a consumer find a product, choose a delivery option, pay for a purchase
and otherwise improve the customer experience (e.g. successfully used by Sephora, H&M), for
fraud detection and prevention by identification of anomalies in payment process (e.g. used by
Unilever) and so on. Moreover, there are several main tasks of consumer behavior analysis
results, which can be solved only by means of machine learning, since it allows the extraction of
valuable information from large volumes of consumer data due to a high level of automation of
data collection, processing and analysis:
● Dynamic pricing - to enable competitive prices setting, which can change quite rapidly
in real time, the analysis of consumers’ reactions and sales behavior depending on
changes in competitors’ prices can be applied. Dynamic pricing itself represents a
real-time price change and the offer of the same product to different user groups at
different prices. For example, Amazon uses dynamic pricing by tracking every 15
seconds the prices of competitors, amount of products sold, consumers’ actions on the
website and geographical data and then automatically adapting Amazon prices for goods,
which leads to 35% increase in revenues (Kopp 2013);
● Clustering of consumers and personalized marketing - finding individual clusters with
similar characteristics among the entire set of customers, that is, recognizing demand as
heterogeneous and requiring individualization, allows business to adapt the marketing
strategy depending on the requirements of each cluster and enhance personalization
(Frasquet 2021). Personalized offers, either concerning products or services themselves,
16

or promotional strategy, enables companies to achieve significant customer experience
improvements and is critical to consumers. According to the Deloitte study conducted by
Fenech and Perkins (2015), 36% of online shoppers want to buy personalized products
and about half of all shoppers agree to provide more data about themselves and wait
longer to get a personalized shopping experience. The illustrative example of how
consumer behavior analysis affects and further personalization can improve business
performance is provided by an e-commerce company Bikeberry, which had revealed
browsing patterns, personal information, login counts and previous purchases of its
consumers to form special offers for each consumer depending on the cluster to which he
or she belongs, and this eventually allowed Bikeberry to increase sales by 133% as well
as on-site engagement of customers by about 200% (Jao 2013);
● Demand prediction - consumer behavior analysis can be used to forecast future events
occurrence based on the clients’ data for a certain period of time. In retail predictive
analytics is usually used in forecasting of prospective demand on the basis of
consumption patterns revealed in historics purchase data. As it is stated in the research of
Gartner (2020), demand volatility is one of the most serious problems for business
executives, since volume of purchased products in the nearest future depends on a huge
number of various factors - from shifts in consumers’ motivation to unexpected
emergence of social trends. Consumer behavior analysis allows to track these factors and
smoothly incorporate various variables and data sources into predictive models. Being
able to forecast volumes of future purchases, companies can increase operational
efficiency, adapt inventory replenishment and supply chains thus reducing costs;
● Recommendation systems - as it was mentioned before, recommendation engines or
recommenders are aimed at offering a consumer particular product or set of products,
which he or she is most likely to buy based on their previous purchases and revealed
preferences. Analysis of consumer behavior allows to, first of all, reveal such preferences
and juxtapose them with the characteristics of products, which leads to the formation of a
list of recommended products with similar characteristics. Secondly, based on the results
of the analysis of behavior, consumers with similar characteristics can be combined into
groups, and then the recommendations will be based on the preferences of the members
of this particular group. Thus, the analysis of consumer behavior enables both item-based
and user-based recommendations.17

1.3. Advanced techniques to analyse a consumer on the example of business cases
In this part the main place is given to several most representative cases of how companies
address the issue of getting more insights on their consumers’ behavior and, as a result, how they
manage to extract additional value from this understanding. The focus is going to be
concentrated around some specific areas of user understanding that have been taken into
consideration earlier in this research. Firstly, it’s worth mentioning that many companies take the
advantage of clustering the customers they have in order to differentiate the range of products to
a higher extent and serve their requirements in a more personalized way (where a particular
"way" represents a service, which is commonly demanded by a group of clients). Secondly, an
illustrative business case of dynamic pricing is going to be considered. Finally, cases also include
ones when a company employs a recommendation system, which provides consumers with some
special personalized advice on what they might want to also purchase.
Procter & Gamble - consumer clustering
Another FMCG-giant, P&G, also implements analysis of consumer behavior for various
purposes. In 2019 the company initiated a transition to data-driven marketing, which implied the
fine clustering of consumers in order to create ‘smart audiences’ and enable more precise
targeting. P&G managed to divide almost 1 billion of customers into 350 clusters (Bryan 2019)
basing on demographic, behavioral, location-based data. Clustering is beneficial not only from
the point of view of improving the advertising mechanism and increasing the effectiveness of
marketing, but also in terms of testing specific ideas and business models on certain clusters,
enabling lean innovation.
Since 2020, the company has partnered with Google Cloud to personalize customer
experiences with consumer data analytics and artificial intelligence technologies, which was later
described by Google Cloud (2020). P&G collects customer data on its own, as well as purchases
from third parties, then uploads it to the cloud platform for operational processing and receiving
real-time insights. The partnership, expecially using such technologies as TensorFlow, BigQuery,
will allow P&G to deeply understand the needs and unspoken desires of consumers, and adapt
products and services to the preferences identified through the analysis.
One of the prime examples of how the company uses data to improve products and
improve customer satisfaction is the Lumi system, developed by the company under the Pampers
18

brand. This system allows the monitoring of a child's sleep pattern using a smart sensor that
attaches to the diaper and allows parents to continuously monitor their baby's development and
plan the day correctly. The technology was developed in response to parents' identified need for
an intelligent childcare assistant to ensure his or her maximum comfort. In addition to increasing
customer satisfaction with the Pampers service, the company has ensured itself a constant
collection of data on the daily routine of consumers and significantly increased sales, since the
Lumi sensor is adapted specifically for Pampers diapers.
Apotek Hjärtat - dynamic pricing
Since 2017, the largest private pharmacy chain in Sweden, Apotek Hjärtat, has been
using artificial intelligence technologies (Kuranov 2020) for dynamic pricing - algorithms
compare prices for Apotek Hjärtat products and those of competitors and optimize the company's
prices in the online store. In addition, the pharmacy chain collects data on consumer purchases
and uses machine learning to analyze and respond more quickly to changes in consumer
preferences. This pricing system is extremely flexible and allows prices to be updated in line
with market changes every hour. Prices can change both for individual articles and for whole
categories of goods at the level of one pharmacy or an entire chain, depending on how consumer
behavior changes. Having successfully implemented dynamic pricing, Apotek Hjärtat now
intends to use consumer analysis to improve marketing efficiency in order not only to offer its
customers the best prices, but also to advertise products that better suit their needs.
Next, we will pay special attention to several cases illustrating the experience of various
companies in building recommendation systems. First of all, it should be noticed that initially the
idea of providing a consumer with some recommendations regarding what they might want was
coming from the side of classic retail and shops (Sharma and Singh 2016), since trying to
penetrate new market and develop the existing one, sales managers were approaching potential
buyers to recommend them some of their products. Apparently, it wasn’t very successful as the
efficiency of these measures was mainly based on the competences of the seller to persuade the
person and it was not possible to identify if someone had a real preference for some product in
advance.
With increase of advanced technical tools available for data storage and processing as well as
decrease of the storage and processing costs many companies have found it attractive and also
profitable to estimate consumers preferences and use emerging techniques to understand the
19
customers needs and predict what they would want in a proactive way. It firstly became
achievable for large telecom and digital companies, because they own both a wide range of
diverse data sources available and special analysing tools at their disposal. The initial problem
was the lack of digital products and services they offered for the clients and recommenders as
they were not the first necessity for development. Eventually, with the global business dynamics
towards customization and increased requirements of end-users, i.e. consumers, these companies
started to implement different types of recommender systems to provide users with tailor-made
services to estimate their satisfaction. The most interesting and representative services were
firstly created by the following companies:
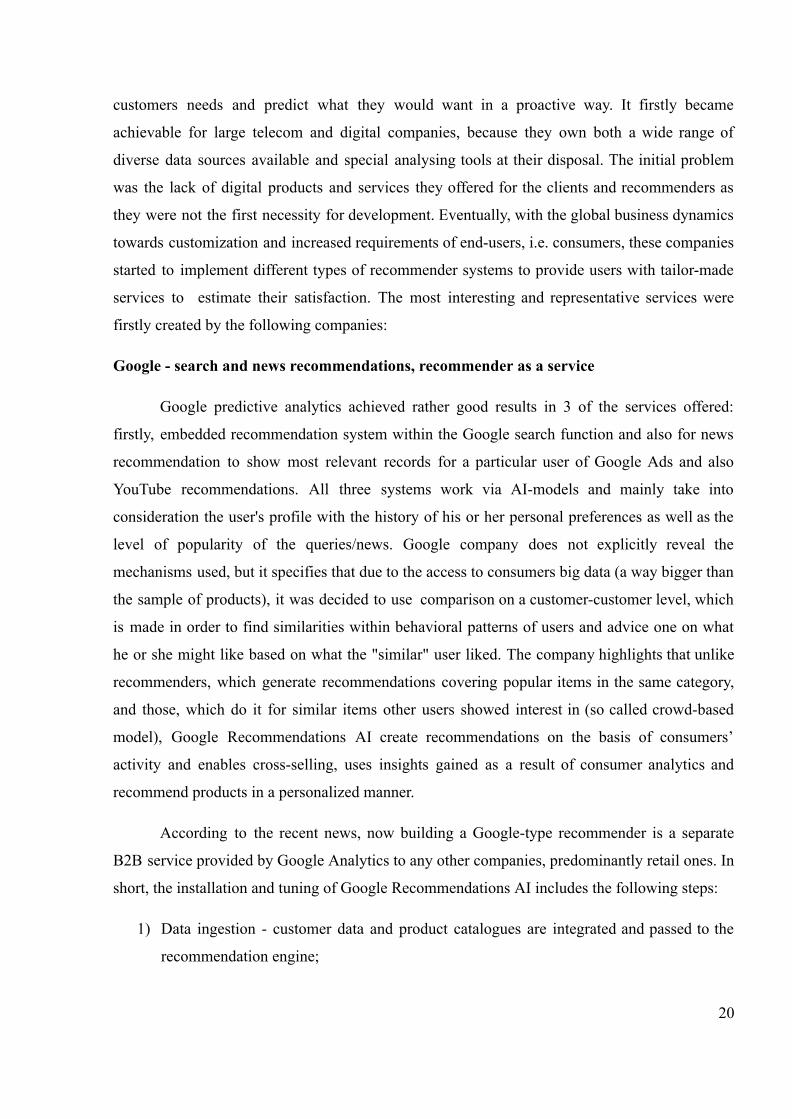
Google - search and news recommendations, recommender as a service
Google predictive analytics achieved rather good results in 3 of the services offered:
firstly, embedded recommendation system within the Google search function and also for news
recommendation to show most relevant records for a particular user of Google Ads and also
YouTube recommendations. All three systems work via AI-models and mainly take into
consideration the user's profile with the history of his or her personal preferences as well as the
level of popularity of the queries/news. Google company does not explicitly reveal the
mechanisms used, but it specifies that due to the access to consumers big data (a way bigger than
the sample of products), it was decided to use comparison on a customer-customer level, which
is made in order to find similarities within behavioral patterns of users and advice one on what
he or she might like based on what the "similar" user liked. The company highlights that unlike
recommenders, which generate recommendations covering popular items in the same category,
and those, which do it for similar items other users showed interest in (so called crowd-based
model), Google Recommendations AI create recommendations on the basis of consumers’
activity and enables cross-selling, uses insights gained as a result of consumer analytics and
recommend products in a personalized manner.
According to the recent news, now building a Google-type recommender is a separate
B2B service provided by Google Analytics to any other companies, predominantly retail ones. In
short, the installation and tuning of Google Recommendations AI includes the following steps:
1) Data ingestion - customer data and product catalogues are integrated and passed to the
recommendation engine;
20

2) Recommender customization - selection of recommendation type, objective and business
rules setting, which tune the prediction API;
3) Recommendations are generated by prediction API and demonstrated to consumers at
customer touchpoints.
Netflix - movie recommendation system
Illustrative example of recommender implications for digital services are provided by the
streaming industry, in particular by the Netflix company. Some researchers conclude that almost
80% of the Netflix stream volume was achieved through an accurate work of recommendation
system. This powerful outcome was achieved as a result of the company's aspiration to provide
consumers with the most personalized experience. Initially, the customization of Netflix services
was announced in 2000, and in 2006 the company launched the Netflix Prize competition
striving to find the most effective recommendation system it would buy and apply. The task was
to overcome by 10% used at those times algorithm Cinematch, which predicted how much the
client would like a particular movie based on linear regression, and which demonstrated RMSE
(root mean squared error, metric of prediction accuracy) of 0.9525. There were several pretty
promising models (with RMSE of 0.8567), but some were rejected due to huge engineering
effort demanded for implementation. Finally, it was chosen to award a model based on a linear
combination of matrix factorisation (specifically, SVD) and Restricted Boltzmann Machines
(RBM) with RMSE of 0.88.
But pretty soon the company has grown bigger, which made it face several issues with
the used model due to an increased data volume. They also began mass streaming as a service,
which made the amount of end-products bigger and transformed the task from a regression
problem predicting ratings to a ranking problem.
Since the final result was going to be designed as a recommendation page/section, it has
become a matter of a page-generation. Netflix uses the following strategy-based metrics to
estimate their performance: rate of new users acquisition, rate of cancellation, rate at which
former members rejoin. The input of the Netflix recommendation system is data of three types
(Figure 2):
21

Figure 2. Inputs of the Netflix recommenderSource: created by authors on the basis of [Taghavi et al., 2016]
As a result of the recommender, Netflix presents a two-tiered matrix with two axes
involved in identifying the likelihood of a match between the film and the user (more likely to
see on the upper left corner). This visual representation also allows the company to split the
films into genres/categories by these rows (Gomez-Uribe et al. 2015).
Netflix uses several algorithms/rankers depending on a particular stage of the ranking
process:
● Personalised Video Ranking (PVR) - general system, which narrows movies set by
specific rule (i.e. category);
● Top-N Video Ranker - engine, which recommends only top results for any movie list;
● Trending Now Ranker - recommender engine, which tracks recent trends affecting users’
behavior (e.g. recommendation of romantic comedies during the St. Valentine’s day);
● Continue Watching Ranker - the system tracks the level of completeness of movie/series
consumption and predicts the likelihood that he or she will finish watching it. This one
potentially uses recurrent neural network to predict the likelihood based on both
long-term context and discrete values.
Altogether, several ranking systems united by one algorithm with a unique page
construction process create one of the most demanded services provided by Netflix. Rows play
an important role in predicting, since each of the rankings given above go through an iterative
row generation process, as given on the chart below (Figure 3):
22

Figure 3. Recommendation generation process
Source: [Amatriain and Basilico, 2013]
The final step within the whole process of recommendations construction is page
generation. It tends to be one of the most resource-consuming and defines which rows generated
by the previous steps would appear in the final recommendation section. It is not only a task of
accuracy, but also of diversity and accessibility. Although the particular method used for this was
never revealed, most data-scientists believe that such a complex task can be used only through a
template-based approach with a fixed set of criteria chosen by designers.
There’s a smaller problem within this task, defined as row ranking issue, which is
typically solved be three approaches (Amatriain and Basilico 2013):
● Row-based approach (pretty fast method using learning-to-rank approach, but the lack of
diversity often occurs);
● Stage-wise approach (sequential choice of rows out of the list where the next item is
automatically chosen from the recomputed list after the previous one is selected);
● ML-algorithm (it actually represents the method employed by Netflix analysts and relies
on scoring of the rows).
Computational architecture consists of three zones in order to enable sufficient data management
(Amatriain and Basilico 2013):
● Offline computation - has the smallest requirements and spends the least amount of
computing power, since such a calculation does not need to update in real time, however,
23

due to the fact that new data arrives with a time lag, updates can become outdated in
terms of relevance;
● Online computation - fast updates in real time are required depending on user actions,
and therefore the calculation should be as less complex and costly as possible, and a
mechanism for returning to the previous calculation result is required if real-time updates
are not generated correctly. Personalized architectures perform best if online and offline
computation is combined;
● Nearline computation - recommendations resemble those generated with online
computation, but they are not required to be real-time, so the asynchronicity is allowed.
Amazon - item-based product recommendations
The Amazon company was the inventor of the item-based collaborative filtering method,
which will be discussed in detail in the next part of this chapter. Initially analysts of the company
were trying to implement user-based models, but faced low accuracy of predictions. Within the
period of deployment they were also thinking of possible ways to decrease computational efforts,
which were estimated as huge due to enormous numbers of users and products as well. Then the
analysts found out that the whole analysis could be performed within smaller user groups
associated with a specific region. Dividing users on subsets made the process computationally
feasible.
Amazon rejected the idea of using simple co-buying of several products because it would
be biased in terms of advicing some best-sellers (like Harry Potter books) with almost any single
purchase. Instead, a new metric of relatedness was applied: it was based on a probabilistic
approach - some item A is considered related to B if purchasers of B are more likely to buy A
compared to some average customer. Obviously, the higher the probability compared to this
average one, the more related the product is.
However, there were several other significant factors - for instance, the term of "heavy
purchasers" referred to the ones, which are more likely to buy a lot of items and, therefore, it’s
more likely that the given base item B is going to be found within their online shopping cart. The
task of analysts was still to estimate the likelihood within any given purchase without
dependence on a purchase size. Later on, they found a way to also consider preferences
regarding some brands, categories, seasonality and also recognize several people acting from the
same account. The task itself is based on matrix factorization, which was later transformed into a
24

task of multiple smaller matrices, which would generate a bigger volume of data by
multiplication of them. The method of matrix completion firstly used a type of neural network
called autoencoder, which brings outputs of the same format with inputs, but then was combined
to item-based collaborative filtering to gain higher performance. Similar mechanisms were later
employed by some other players in the market of online retail.
AliBaba - homepage recommendations
When Alibaba Group, the largest Chinese e-commerce company, firstly employed
recommender it led to 51% increase in the revenues the company generated. This system was
integrated in Alibaba marketing campaigns and let the company use personalized approach for
their consumers. As for the particular design of the model applied, judging by the information
presented by the company, they consequently used several different models, all based around
item-based collaborative filtering (Figure 4).
Figure 4. Alibaba recommender’s basic structure
Source: [Alibaba Clouder, 2020]
Most recommended goods are presented on the homepage, which a consumer first of all
and which, as the company assumes, can influence its further purchasing behavior. As the
company specifies, previous versions of recommenders were aimed at optimization of relevant
recommendations, however, more up-to-date versions optimize not only relevance, but also
discovery and variety of recommendations in order to increase efficiency and improve customer
experience. Alibaba implements different technologies in its recommender: Sequence to
Sequence machine learning, graph embeddings, deep learning, knowledge graphs, etc. To
25

evaluate the effectiveness of recommender Alibaba company uses, for example, such metric as
CTR (click-through rate), which have increased by more than 40%.
Unilever - healthy food recommendations
Being one of the biggest FMCG companies in the world and the main L'Oréal competitor
in the cosmetics market, Unilever places great emphasis on customer engagement and often
invests in research to improve product quality and customer experience. One of the studies began
when the company tried to influence the consumer audience and motivate them to buy healthier
spreads produced by Unilever, instead of classic butter, but studying consumers and how their
habits and preferences are changing led to the realization of the need to find a way to contact
directly with the buyer and influence his or her choice of more healthier products. Thus, in
collaboration with Tessella, the company created the SmartSwaps recommendation system
(Charles 2014), which was tested on real customers of the largest UK retail chain Tesco, who
could use their loyalty cards’ numbers on website to see which of previously bought or currently
put in cart goods have healthier alternatives.
The input to the recommendation system is data on past purchases of consumers, on
preferred categories, and on the characteristics of each product sold at Tesco in terms of
nutritional value. After processing this data, the algorithm generates a recommendation for
similar, no more healthy products. The first tests of SmartSwaps have shown that more than 80%
of consumers change their preferences due to relevant recommendations. Since Tesco has a huge
selection of healthy Unilever brands, most often consumers were recommended the products of
this particular company, which allowed Unilever not only to constantly contact the consumer
through the largest retail network, but also to track the dynamics and trends of demand and
increase turnover.
To sum up, based on numerous cases introduced above one might conclude that
companies use all the possibilities to make tailored and customized experience for their
customers: the extent to which the employ the systems and tools mainly depend on the following
factors: industry specifics, communication channels and availability of resources. The most
common "upgrades" within communication with customers relevant to the retail industry are
represented by splitting customers into specific clusters in order to treat them with somehow
differentiated services and also building a recommender which predicts the products that the
customer would want to purchase based on previous purchasing history. These particular
26
activities tend to be potentially more beneficial for business and therefore, are going to be
investigated later in this research on the example of data from a company operating in the FMCG
cosmetics market.
1.4. Typical challenges of consumer behavior analysis and recommendation system creation
Despite all the described business necessity and benefits of consumer data analysis and
application of the analysis results in various forms to increase market share, strengthen
competitive position, increase revenue and generally better understand the buyer, there are
several typical problems that retail faces when researching consumer data. Firstly, the paper
addresses the challenges regarding general handling and analysis of large arrays of consumer
data, after which the focus shifts to the problems that retailers experience when building
recommenders, since this analysis application is uppermost in this master’s thesis.
During the analysis of consumer data, companies encounter the following problems:
1. Consumer data quality - this problem has several sides. First of all, retail companies
collect a wide variety of information about users through different channels, including
website, mobile app, third-party trackers, social media, browser data, and many others. In
addition, order and customer interaction data is stored in disparate ERP, CRM, and other
enterprise systems, and aggregating user behavior data is a separate task for business
analysts. The other side of the problem is storing data in various formats and in an
unstructured form, while often the names of rows and columns do not reflect the essence
of the data, and the data tables are not connected at an intuitive level, which significantly
complicates the analysis. Finally, consumer data often contain errors caused by a failure
of the data collection algorithm, human faults, etc. These errors may be in the form of
duplicates, wrong records, misprints and so on. As Press (2016) states , data preparation
(including collecting datasets, cleaning and organizing them, mining them for revealing
patterns, applying refining algorithms, etc.) consumes almost 80% of retail analysts’
working time. To cope with the problems described, analysts have to collect data from
various sources (often using APIs), optimize data formats, cleanse the data (remove
duplicates, eliminate errors, identify and remove outliers, etc.) either manually or using
special programs;
27

2. Large expenditures of time and money for processing increasing volumes of data -
this is one of the statistical problems often encountered when processing big user data.
As has been already said, retail companies collect huge amounts of various data on a
daily basis, and as the amount of data grows, so does the amount of computational
resources and time it takes to analyze and use it. To reduce this burden on computing
power and shorten the time from data acquisition to the practical implementation of the
results of their analysis, analysts resort to data compression, which allows you to save
most of the useful information. Data compression implies both compression of file
formats (technical aspect), as well as compression of the data itself by means of
econometric tools or sampling (functional aspect). Econometric tools allow the
transformation of data, and compression can occur with or without loss of information.
Data compression usually refers to reduction of columns in data tables, but can also
reduce only rows, or both columns and rows (Bradlow et. al 2017);
3. Excessive data sparsity, implying a lack of data on some measurements for
individual consumers - another frequent problem of a statistical nature. Companies
strive to personalize products and customer experience as much as possible at the
individual consumer level, but this is difficult to do in the absence of data on many
parameters, that is, columns. The more records by consumers, that is, rows with missing
parameters there are, the more sparse the data is. Bayesian inference helps to overcome
this, which allows companies to fill in empty cells using data about other similar users
for which there are sufficiently known parameters. This approach is especially useful
when analyzing new customers about whom the retail company has not yet managed to
accumulate enough data, to replace the data that customers chose to hide, or to recover
data that was lost by mistake (Bradlow et. al 2017);
4. A delicate balance between the business value of analysis and the technical
complexity of data processing - This problem is highlighted in the work of Dekimpe,
(2020) and lies in the fact that some retail companies often stop regularly checking the
managerial feasibility of using large arrays of consumer data, delving instead into
overcoming the statistical problems of big data and using complex methodologies and
increasingly sophisticated tools. This leads to the fact that the extraction of information
from data is becoming an increasingly expensive and time-consuming process, while the
value of the information obtained for the business and support of management decisions
28

is decreasing. In his work, Houston (2016) expresses concern that retail companies, when
analyzing consumer behavior, will be more focused on “cool datasets we can find or the
advanced methodological techniques we can employ”, therefore author supposes to
always mind and prioritize a specific management task rather than the complexity of the
analysis.
5. Ethical and security aspects of consumer data collection - currently, a huge amount of
consumer data is in the public domain and is collected in many ways. However, simple
access to data does not make it ethical for customers, whose trust is extremely important
to the business. On a regular basis, companies are faced with the dilemma of being able
to use the data obtained without losing consumer confidence. In addition, the business
needs to take care of the security of the storage of the collected data, ensure their
confidentiality and inviolability, as well as exclude the possibility of leakage of user data
into the public domain or for unscrupulous purposes, because one mistake in privacy can
lead to the fact that a huge number of consumers will not ready to provide the company
with such valuable data (Dekimpe 2020).
Considering typical problems that occur while creating a recommendation system,
researchers and analysts mainly distinguish the following ones:
1. Cold-start problem - one of the most popular recommenders’ problems which appears
when a new product or a new consumer enters the recommendation engine. In such cases
there is no sufficient data on new consumer’s preferences and characteristics, and
similarly, there is not enough information about the new product as it has not yet been
purchased or rated. The cold-start problem leads to decrease of recommendations’
accuracy, and in the case of a new user, it can be resolved if a company asks a new
consumer to immediately evaluate several previously used products before buying in an
online store (relevant for large retail stores with a physical presence), conduct a survey of
a new client on his basic needs and product preferences. In the case of a new product, the
most effective method of solving the cold-start problem is to compare the characteristics
of the new product with the attributes of existing products ranked by consumers, and
build a recommendation based on the results of this comparison (Khusro et al. 2016);
2. Shilling attacks - the problem is that some users may accidentally or deliberately give
incorrect ratings to products, which leads to the fact that some products are recommended
29

to users more often, and some, on the contrary, artificially lose popularity. Not only
consumers, but also competitors of the online store can cause a problem. The solution to
the problem is only a proprietary monitoring system inside the online store, which allows
identifying such attacks and assessing them in terms of the damage caused to the
recommendation system (Mobasher et al. 2007).
3. Lack of product ratings - obtaining a consumer's rating of a product (that is, rating a
product) is a complex process. Despite the abundance of opportunities to ask the
consumer directly if he or she liked the product (through, for example, a 5-star rating and
a review window on the store's website, e-mails, calls to customers, etc.), most often the
evaluation of purchased products is a voluntary initiative of the consumer himself,
leading to insufficient product ratings for reliable recommendations. This problem is
often solved by the fact that instead of a quantitative assessment of the product by the
consumer, the frequency of repeat purchases is taken, which also reflects the level of
customer satisfaction;
4. Scalability problem - the quantity of products and the quantity of consumers are in
linear relations. Given the increase in assortment and growth of the number of
consumers, it becomes more difficult for recommender systems to process such huge
amounts of data. Most often, this scalability problem is solved by reducing the
dimensionality or dividing consumers into clusters, for a smaller number of which it will
be easier for the system to form accurate recommendations (Su and Khoshgoftaar 2009).
Despite the difficulties in customer analysis and the creation of recommendation systems,
machine learning algorithms are evolving and becoming more sophisticated, allowing you to
overcome many of the identified problems, and fully benefit from the business benefits from
using the results of consumer behavior analysis.
Thus, in this section, the basics of consumer behavior analysis was covered, described the
goals and objectives that companies solve using this analysis, and the various lines of business in
which it is used. In addition, the types of data that are used to implement it have been listed , and
it was also described how machine learning helps analyze consumer behavior. Among the
directions of the results of the analysis of consumer behavior, dynamic pricing was singled out,
as well as clustering of consumers, forecasting demand and building recommendation systems.
In addition to the introductory theoretical part, the paper also examined in detail several business
30

cases of the largest digital and online retail companies that use consumer behavior analysis for
various purposes. Recommender systems were the main focus of business case analysis. In
addition, the research has considered typical practical problems in the implementation of
analysis, as well as in the creation of recommender systems. Since the main tasks solved within
the framework of this master’s thesis are the clustering of consumers and the creation of a
recommendation system, in the next chapter there is presented a detailed analysis of the
academic and scientific literature on the main approaches to solving these problems, and also
select the methods that are most suitable for this project.
1.5. Conclusion
To sum up, in this chapter, the first research question was answered: “What are the main
features and areas of application of consumer behavior analysis in today's business
environment?”. The basics of consumer behavior analysis were examined, through on the
analysis of the literature, and found out that among the main features of such analysis are the
growing variety of data sources and types, opportunity to apply the analysis results in many
business spheres including marketing, merchandising, operations and logistics. There are also
the 4 main tasks of consumer behaviour analysis discussed including dynamic pricing, consumer
clustering, demand prediction and recommendation systems creation. After that, the paper
described the basics of using machine learning to analyze consumer behavior, analyzed the types
of data that are needed to implement it and underlined the growing role of machine learning for
retail.
A significant part of the chapter is devoted to the analysis of business cases illustrating
the practical application of consumer behavior analysis for solving three main tasks that are
important for this project. As an analysis of the literature and experience of large companies
shows, consumer behavior analysis is an extremely relevant and demanded topic that is available
to an increasing number of companies and provides an invaluable competitive advantage for
those firms that use analytics to personalize marketing, recommend products and forecast
demand. The research has also considered the typical problems and challenges that arise both in
the analysis in general and in the creation of recommender systems, which are the central part of
this work.
31

CHAPTER 2. CONSUMER BEHAVIOR ANALYSIS METHODS REVIEW
This chapter focuses on the study of Kiehl’s brand products consumers and the
identification of patterns in their behavior. According to the identified four main tasks of
conducting analysis of consumer behavior, which were described in the previous chapter, the
project is aimed at solving problems such as clustering consumers, building a recommendation
system and creating an algorithm for predicting demand.
There are different methods of dividing data into clusters, as well as different approaches
to generating recommendations and forecasts. In order to answer the second research question:
“What methods are used to solve the problems of consumer behavior analysis and what methods
can be chosen for Kiehl's case?” and to study the theoretical aspects of these problems in more
depth, to get acquainted with the methods in more detail and to determine the most suitable
methods for our work, in this section a study of academic literature on relevant topics is
conducted.
2.1. Methods of data clustering
Machine learning divides into supervised and unsupervised. The first type implies
working with previously labeled data, so the algorithms are learning from already labeled data,
that is, the training is supervised, and is aimed at predicting the result for new data. A classic
supervised machine learning problem is the classification problem in which the classes are
known in advance (that is, there are both an input and an output). However, there is also
unsupervised learning, in which the models work independently, extract information and reveal
previously unknown patterns (that is, there is only an input). Unsupervised training allows more
complex algorithms to be implemented and is often used by companies to analyze real data
without prior preparation. One of the objectives of this training is clustering.
To define clustering in the most explicit way there would be a reference to the definition
that is described by Omran et al. (2007): “the process of identifying natural groupings or clusters
within multidimensional data based on some similarity measure”. Thus, in general, clustering
allows to identify non-obvious similarity characteristics and combine items in a dataset into
groups based on the presence of these characteristics and provide a researcher with important
insights. The more narrow definition of clustering in retail is given in (Holý et al. 2017): "getting
knowledge about the structure of customers", and also in their work the authors point that
32

consumer clustering is used for targeted marketing, identification of market niches, brand
differentiation, etc.
There are various clustering methods that can be combined into several groups (the
classification is suggested in (Rokacha and Maimon 2007)): hierarchical, partitioning,
density-based, model-based. The researchers are going to consider each of them in more detail,
based on the theoretical ideas presented in (Li and Wu 2012), (Omran et al. 2007), (Rokach and
Maimon 2007), (Moscato and De Vries 2019) and (El Bouchefry 2020).
1) Hierarchical clustering
Implies sequential partitioning of dataset into clusters and thus forming a dendrogram - a graph
that displays the sequential division of data into clusters, resembling a tree in its appearance
(Figure 5). The vertical axis of the dendrogram shows how similar are several clusters that are
joined together, i.e. depicts the similarity level of grouping. Hierarchical clustering has two
approaches to dividing data into clusters: agglomerative, in which the algorithm starts working
"from the bottom" - one separate cluster is assigned to each data point, after which small clusters
begin to merge into larger ones based on the similarity of their contents (two most similar are
joined first), and thus the dendrogram "grows up"; divisive, in which all the data points are
considered firstly as one large cluster, and then the algorithm finds two least similar observations
and split them into two different clusters, and the process goes on until each data point is
assigned to a single cluster.
Figure 5. Hierarchical clustering types
Source: created by authors on the basis of [Moscato and De Vries, 2019]
33

One of the most popular examples of hierarchical clustering usage in retail is the categorization
of goods in online shop. If the products on the site are broken down into categories, the
consumer first selects the largest, general category, then more and more specific categories, thus
narrowing the search. For example, when purchasing hand cream from the Sephora online store,
the consumer first selects the "Care" category, then "Body Care", then "Hand Care", and thus the
consumer reaches the narrowest cluster. Many retail companies do not manually break down
products into categories, but use hierarchical clustering for this, which allows to combine
products with similar characteristics into one cluster and greatly simplify the search for a product
for a customer. The principle of hierarchical clustering is depicted in Figure 6:
Figure 6. Schematic representation of hierarchical clustering
Source: created by authors
The main advantage of hierarchical clustering algorithms, which is described in academic
literature, is the multiplicity of data partitions at different similarity levels that allows analysts to
choose themselves optimal number of clusters depending on the similarity required. Moreover,
this clustering type is not characterized with high consumption of time and computational
resources. However, there is no back-tracking capability when applying hierarchical clustering.
2) Partitional clustering
The core idea of this type is to initially divide the dataset into several disjoint clusters and then
relocate the data points between these clusters, maximizing the function of similarity of data
points within 1 cluster and minimizing the similarity of points in different clusters (Figure 7).
Thus, the relocation moves objects between k (predetermined amount of clusters) different
clusters in the iterative manner.34

Figure 7. Schematic representation of partitional clustering
Source: created by authors
Most algorithms of partitional clustering are aimed at error minimization, thus
minimization of a special criterion depicting the distance between an object and its
representative value. Usually, sum of squared error (SSE) is used as such a criterion. The most
popular partitional clustering algorithm, which measures SSE, is the K-means algorithm.
Initially an analyst chooses the desired number of cluster (k), and k objects of the original set are
randomly selected as the initial cluster centers. Each observation is assigned a group number
based on the closest centroid, i.e. based on the smallest Euclidean distance between the object
and the point . In every iteration objects are assigned to the closest center of cluster, and then𝐶𝑘
the error is calculated (i.e.centroids are calculated once again), computing within-cluster
variation W( ) as it is demonstrated in the formula (1):𝐶𝑘
W( ) = , (1)𝐶𝑘
𝑥𝑖∈𝐶
𝑘
∑ (𝑥𝑖
− µ𝑘)2
where is k cluster centroid - the most distant from each other centers of concentration𝐶𝑘
of points with a minimum variation within each cluster. Then the algorithm repeats once again
and stops when the convergence is reached, i.e. when assignment of objects to clusters stops
changing. In the formula (2), this is expressed as follows (the total variation is minimized):
(2)𝑊𝑡𝑜𝑡𝑎𝑙
= 𝑘∑ 𝑊(𝐶
𝑘) → 𝑚𝑖𝑛.
35

The algorithm is characterized with computational attractiveness due to linear
complexity, and it is also usually easy to interpret the results. However, K-means imply that the
number of clusters should be chosen initially. Moreover, it is sensitive to outliers and "noise" in
the dataset.
There is also another partitional clustering algorithm, K-medoids, which is quite similar
to K-means. It also aims at SSE minimization, but instead of representing a cluster with its mean,
K-medoids choose the most centric observation in the cluster, and this approach allows to
decrease algorithm’s sensitivity to outliers. Both algorithms require that the analyst predetermine
k firstly, and the most used way to decide on the optimal number of cluster is elbow method,
which considers how the variation of changes with an increase in the number of clusters k.𝑊𝑡𝑜𝑡𝑎𝑙
Combining all n observations into one cluster, the intra-cluster variance will take its largest
value, which will decrease to 0 as k → n. At some stage the decrease in this variance will slow
down, which will be indicated by “elbow” in the graph, so in Figure 8 elbow is visible for k=4:
Figure 8. Elbow method
Source: created by authors
In retail, partitional clustering is used for market segmentation and analysis of consumer
behavior. Also, there were cases of using K-means clustering for finding optimal transport
itineraries along with best launch and destination points in order to optimize the delivery process
(Hodgson 2020).
3) Density-based clustering
36

Within this clustering type the distribution in the dataset is considered to be a mixture of
a number of distributions, and data objects within clusters are seen to be taken from a certain
probability distribution. In this regard, the task is to identify clusters and the parameters of their
distribution. Such clusters are detached from each other by “continuous regions of low density of
objects”' (Moscato and De Vries 2019). The elements of one cluster form a region, the density of
objects inside which, according to some given threshold, exceeds the density outside it. The
cluster should have some "continuity" of data, in other words, if the points lie close to each
other, then the values of the function in them should not differ greatly. In Figure 9 the most used
density-based clustering algorithm - the Density-Based Spatial Clustering of Applications with
Noise (DBSCAN) - is depicted. Though visually it resembles partitional clustering, the core
principle is significantly different, since partitional algorithms divide data into k clusters and
conduct repartitioning until the best cluster division is not achieved, and density-based
algorithms enlarge clusters until their density exceeds some threshold.
Figure 9. Schematic representation of density-based clustering
Source: created by authors
The three areas of objects with the highest density are combined into clusters, while the
individual objects in the areas with the lowest density are considered as noise. Despite good
performance of the algorithm in revealing natural object grouping, it does not work well on big
datasets with many dimensions.
4) Model-based clustering
The core idea of algorithms in this group is to reach the fit between a particular
mathematical model and the data, which are assumed to be generated by a statistical process.
37
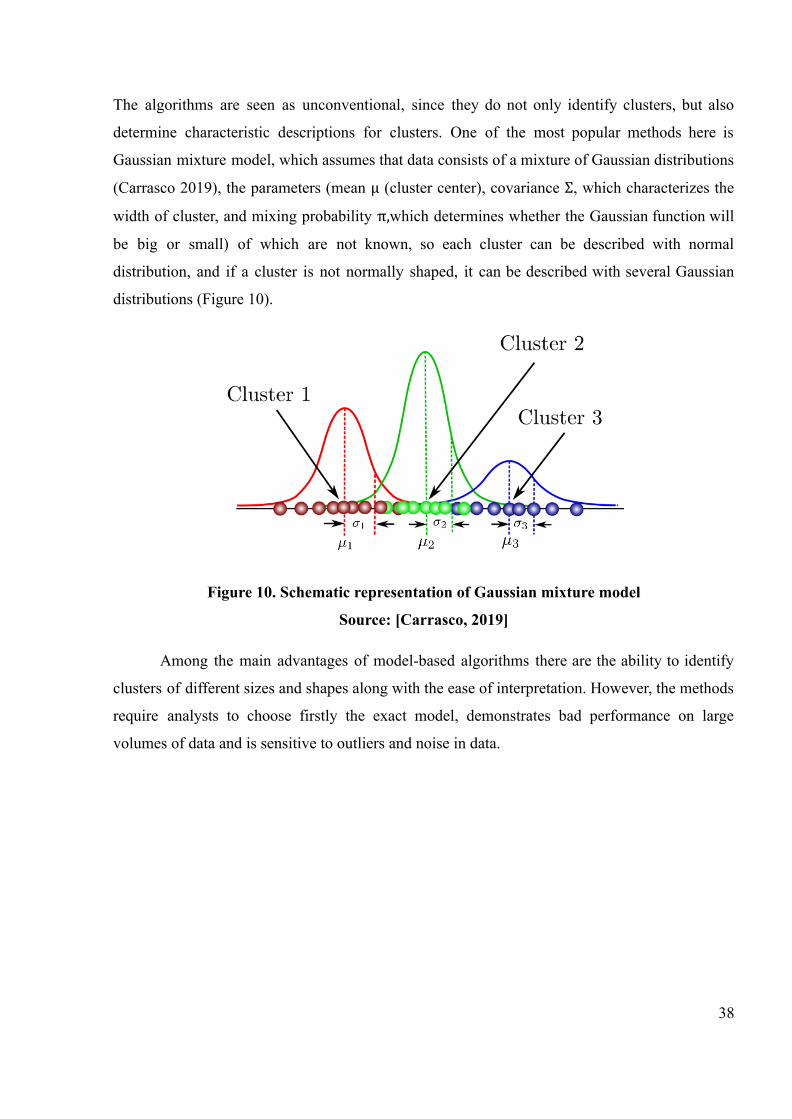
The algorithms are seen as unconventional, since they do not only identify clusters, but also
determine characteristic descriptions for clusters. One of the most popular methods here is
Gaussian mixture model, which assumes that data consists of a mixture of Gaussian distributions
(Carrasco 2019), the parameters (mean (cluster center), covariance , which characterizes theµ Σ
width of cluster, and mixing probability which determines whether the Gaussian function willπ,
be big or small) of which are not known, so each cluster can be described with normal
distribution, and if a cluster is not normally shaped, it can be described with several Gaussian
distributions (Figure 10).
Figure 10. Schematic representation of Gaussian mixture model
Source: [Carrasco, 2019]
Among the main advantages of model-based algorithms there are the ability to identify
clusters of different sizes and shapes along with the ease of interpretation. However, the methods
require analysts to choose firstly the exact model, demonstrates bad performance on large
volumes of data and is sensitive to outliers and noise in data.
38

2.2. Methods of recommendation system development
Unlike offline stores, which have live employees who provide direct contact with the
consumer and the desired level of service, online retail has a limitation in this area. To improve
the process of choosing a product for online buyers, online stores use various functions: "smart"
search in the catalog, virtual assistants, and so on. Recommender systems are a fundamentally
new level of providing quality service and increasing customer satisfaction, and although until
recently they were only an additional option to help companies improve customer relationships
and increase sales, in today's highly competitive online retail reality, recommendation systems
have become an integral part of maintaining market positions, especially for large FMCG
companies.
The classic definition of recommendation system, or recommender, is given in (Rashid et
al. 2002), where it is defined as "decision making strategy for users under complex information
environments". This is a rather capacious definition, which, however, emphasizes two extremely
important aspects of such systems: firstly, the contribution to the consumer's decision to
purchase a product, and secondly, the complexity of the information environment in which the
collection and processing of consumer data takes place, and also the functioning of the
recommender. A more complete definition is proposed in the work (Hwangbo et al. 2018), in
which the authors indicate that recommenders “use customer behavior and information, and
product information to identify customer preferences, and proactively suggest products that they
are likely to buy”.
A formalized task can be represented as follows in (Kutyanin 2017). Supposing that there
is a set of products P = { } and set of consumers (users) U = { }. Based on𝑝1, 𝑝
2,..., 𝑝
𝑚𝑢
1, 𝑢
2,..., 𝑢
𝑛
these sets, a matrix of size is composed, in which at the intersection of the user and the𝑚 × 𝑛
product there will be a rating that this user has given to this product, where𝑅 = (𝑟𝑖,𝑗
) 𝑖 ∈ 1... 𝑛,
and The ratings can be consumer evaluations of goods on a certain scale (for𝑗 ∈ 1... 𝑚. 𝑟𝑖,𝑗
example, from 1 to 5), reflecting the degree of customer satisfaction with the product, or binary
ratings (where 0 means that the product is not liked, and 1 means that consumer liked it). In
addition, the simple frequency of purchases of a certain product by a given user can also act as a
rating if there are no data on other evaluations. Ratings are usually divided into implicit and
explicit. The first type is derived through implicit buyer’s actions - clicks, scrolls, product
searches and actual purchases, while ratings of the second type are collected when a consumer39

explicitly demonstrates his or her attitude to the product with evaluations or comments. The
example of product-user (or sometimes called ‘utility’) matrix is provided in Table 1 (for
simplicity and clarity m = n = 3).
Table 1
General representation of the product-user matrix
Product 1 (𝑝1) Product 2 (𝑝
2) Product 3 (𝑝
3)
User 1 (𝑢1) 2 3 ?
User 2 (𝑢2) 5 ? 5
User 3 (𝑢3) ? 4 ?
The table contains question marks for those products j that consumer i has not yet rated.
Let's use to denote our forecast of what value will be in place of the question mark. Our task𝑟𝑖,𝑗
is to predict in the best way which estimates should be in place of the gaps, that is, to𝑟𝑖,𝑗
calculate Then, for each user u, based on the predicted ratings , a list of N products that𝑟𝑖,𝑗
. 𝑟𝑖,𝑗
most closely match the consumer's preferences and that have not yet been rated by him or her is
formed. The list of these N products will be denoted by the N-dimensional vector (𝑝𝑖1
, 𝑝𝑖2
,..., 𝑝𝑖𝑁
). Thus, the problem is reduced to finding such N-dimensional vector for a given user , where𝑢𝑖
the products , k N have not yet been evaluated by this user, that is, in the rating matrix𝑝𝑖𝑘
∈
a question mark stands in place of , and also so that these products in the best way𝑅 = (𝑟𝑖,𝑗
) 𝑟𝑖,𝑖𝑘
meet the user's preferences - in the other words, the predicted ratings are the highest.𝑟𝑖,𝑖
𝑘
The algorithms that do this can be very different and use different inputs. Some of them
form recommendations based only on data on known ratings. Others use additional product
characteristics, based on ratings, determine which of these characteristics best suits the user's
preferences, and then select products with those characteristics. Further the paper considers in
detail different methods of recommenders creation. In (Sahu et al. 2017), (Isinkaye et al. 2015),
(Milano et al. 2020) and other academic papers, the authors divide recommender systems into
40
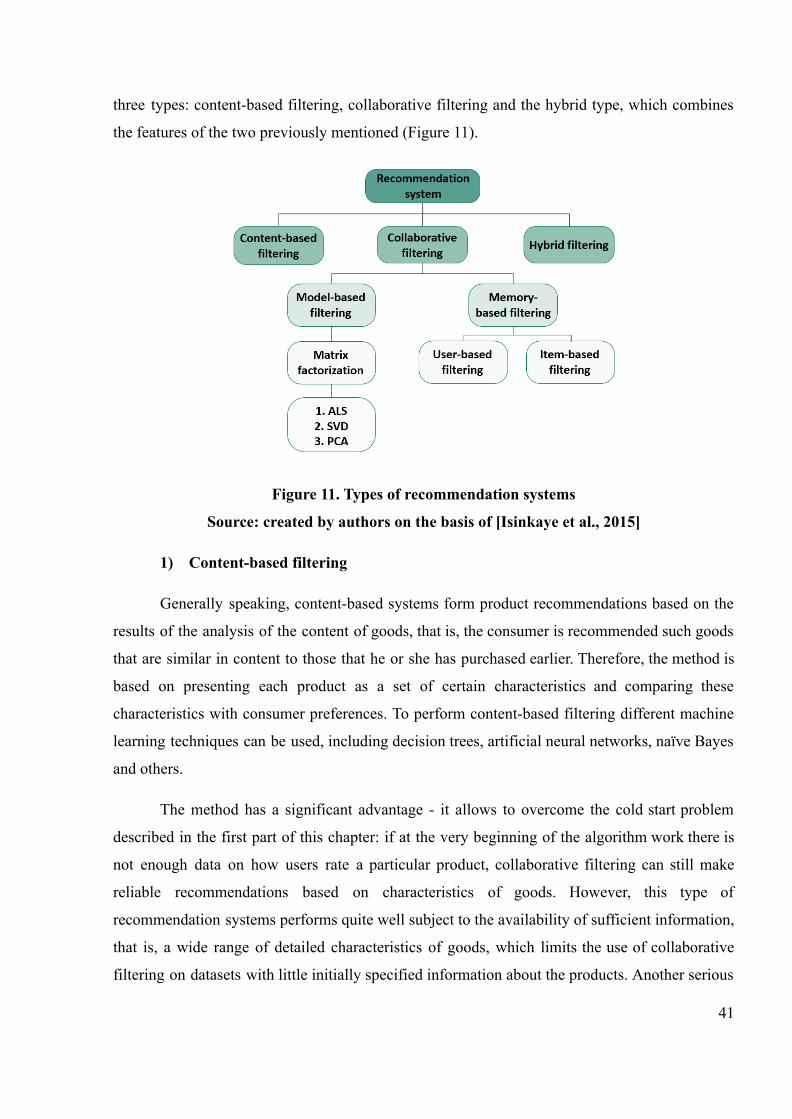
three types: content-based filtering, collaborative filtering and the hybrid type, which combines
the features of the two previously mentioned (Figure 11).
Figure 11. Types of recommendation systems
Source: created by authors on the basis of [Isinkaye et al., 2015]
1) Content-based filtering
Generally speaking, content-based systems form product recommendations based on the
results of the analysis of the content of goods, that is, the consumer is recommended such goods
that are similar in content to those that he or she has purchased earlier. Therefore, the method is
based on presenting each product as a set of certain characteristics and comparing these
characteristics with consumer preferences. To perform content-based filtering different machine
learning techniques can be used, including decision trees, artificial neural networks, naïve Bayes
and others.
The method has a significant advantage - it allows to overcome the cold start problem
described in the first part of this chapter: if at the very beginning of the algorithm work there is
not enough data on how users rate a particular product, collaborative filtering can still make
reliable recommendations based on characteristics of goods. However, this type of
recommendation systems performs quite well subject to the availability of sufficient information,
that is, a wide range of detailed characteristics of goods, which limits the use of collaborative
filtering on datasets with little initially specified information about the products. Another serious
41

limitation of this method is the significant dependence on the subject area, which limits the
usefulness of the recommendations. Moreover, the profile of users and elements must consist of
the same set of characteristics so that they can be compared, and in real business conditions this
condition is difficult to fulfill.
2) Collaborative filtering
This type of recommenders is more universal as compared with content-based filtering.
This method of building recommendations uses the preferences of a group of buyers (users) in
order to predict the preferences for another user. Consumers express their opinion about certain
products or services on the site - give them their assessment, leave reviews. As a result, it is
possible to form a group, or cluster, of consumers with the same interests and tastes. The
differences between the two approaches are schematically depicted in Figure 12:
Figure 12. Content-based and collaborative filtering
Source: created by authors
This type of recommenders is a more advanced and modern approach and tends to form
the most suitable products recommendations. The main benefit of collaborative filtering is that
this method does not require detailed product information to work. Instead of a detailed list of
the characteristics of products, both the history of the ratings of the user himself and other users
are used. Nevertheless, despite the significant advantages, collaborative filtering has a number of
disadvantages. First, these recommendation systems are prone to a cold start problem, that is, it
42
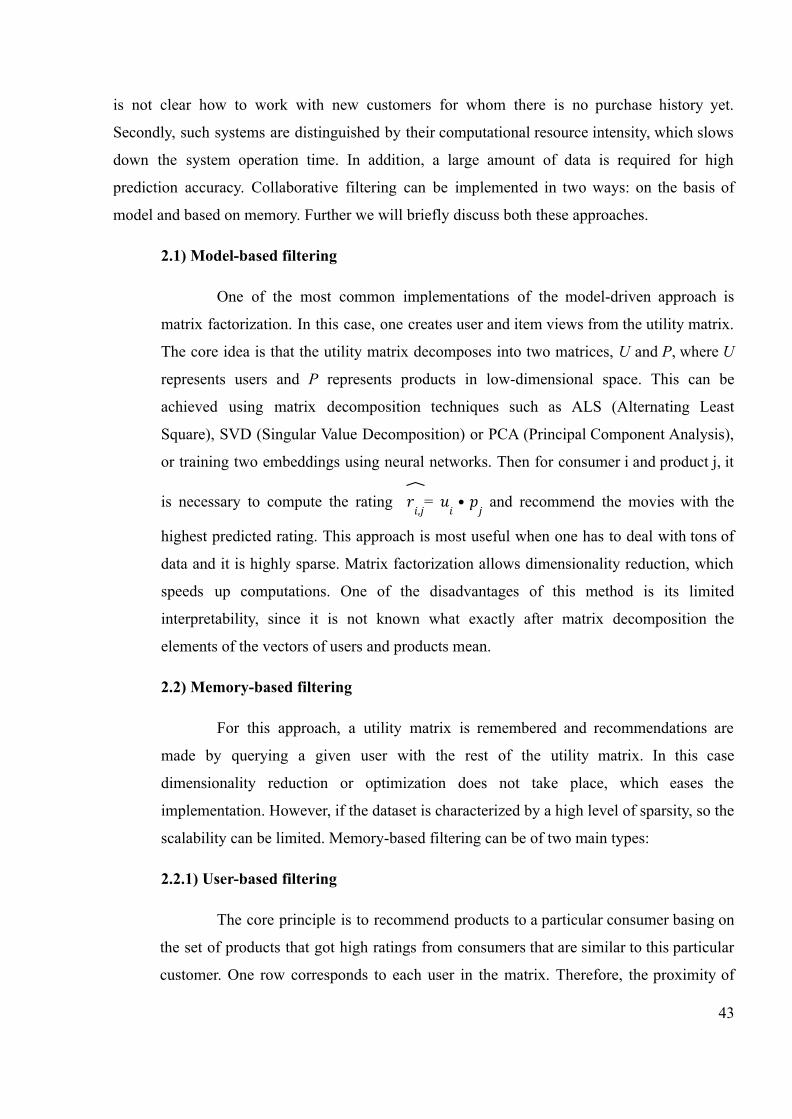
is not clear how to work with new customers for whom there is no purchase history yet.
Secondly, such systems are distinguished by their computational resource intensity, which slows
down the system operation time. In addition, a large amount of data is required for high
prediction accuracy. Collaborative filtering can be implemented in two ways: on the basis of
model and based on memory. Further we will briefly discuss both these approaches.
2.1) Model-based filtering
One of the most common implementations of the model-driven approach is
matrix factorization. In this case, one creates user and item views from the utility matrix.
The core idea is that the utility matrix decomposes into two matrices, U and P, where U
represents users and P represents products in low-dimensional space. This can be
achieved using matrix decomposition techniques such as ALS (Alternating Least
Square), SVD (Singular Value Decomposition) or PCA (Principal Component Analysis),
or training two embeddings using neural networks. Then for consumer i and product j, it
is necessary to compute the rating = and recommend the movies with the𝑟𝑖,𝑗
𝑢𝑖
• 𝑝𝑗
highest predicted rating. This approach is most useful when one has to deal with tons of
data and it is highly sparse. Matrix factorization allows dimensionality reduction, which
speeds up computations. One of the disadvantages of this method is its limited
interpretability, since it is not known what exactly after matrix decomposition the
elements of the vectors of users and products mean.
2.2) Memory-based filtering
For this approach, a utility matrix is remembered and recommendations are
made by querying a given user with the rest of the utility matrix. In this case
dimensionality reduction or optimization does not take place, which eases the
implementation. However, if the dataset is characterized by a high level of sparsity, so the
scalability can be limited. Memory-based filtering can be of two main types:
2.2.1) User-based filtering
The core principle is to recommend products to a particular consumer basing on
the set of products that got high ratings from consumers that are similar to this particular
customer. One row corresponds to each user in the matrix. Therefore, the proximity of
43

user row vectors is calculated. There are many ways to calculate the proximity of vectors
- cosine similarity, Pearson's correlation coefficient, Dice similarity coefficient, and
others (Su and Khoshgoftaar 2009). For example, let us consider a cosine similarity
between two vectors of consumers a and u in formula (3) (Gomzin and Korshunov 2012):
(3)
where sim (u, a) stands for a measure of the proximity (similarity) of users a and u,
and represents the value of the utility matrix: a stands for row (consumer) and j stands𝑟𝑎,𝑗
for column (product). Now one is selecting the set S, containing most similar to consumer
a customers. There are several ways to choose. Most often, the integer constant s is fixed.
Then all users are sorted in descending order of proximity measure. And the set S
includes the first s users closest to a. Given this set, one needs to calculate in formula (4)
the estimate that user a would give to product j:
, (4)𝑝𝑎,𝑗
=𝑟
𝑢,𝑗× 𝑠𝑖𝑚(𝑎,𝑢)
𝑢∈𝑆∑ 𝑠𝑖𝑚(𝑎,𝑢)
where is the predicted score of user a for product j. It constitutes the average over all𝑝𝑎,𝑗
users from the set S, and the closer user u to user a, (according to the closeness of sim(a,
u), the stronger is the contribution of the consumer to the prediction of the rating
estimate. Thus, a user-based algorithm predicts ratings for objects that the current user
has not yet rated. In order to make a recommendation for a given consumer, it is enough
to predict the ratings estimates for all unrated products and select the products with the
highest predicted score.
2.2.2) Item-based filtering
This type of filtering was invented by Amazon.com in 1998 and presented for
the first time during the scientific conference in 2001. The core idea is to consider a
product and find a set of consumers who gave high ratings to this product, and then to
44

identify other items, which were highly rated by these consumers or consumers similar to
them (Figure 13).
Figure 13. User-based and item-based collaborative filteringSource: created by authors
The algorithm starts with calculating for each object l, how similar it is to the
object j for which the rating is predicted, after which the set K of products closest to j is
formed. After that, the rating is calculated based on the ratings allocated to the set K of
products by a particular consumer a. Here one can also use cosine similarity measure to
calculate the similarity sim(j,l) between column vectors. Predicted score in this case is
calculated as follows in formula (5):
(5)𝑝𝑎,𝑗
= 𝑙∈𝐾∑ 𝑟
𝑎,𝑙× 𝑠𝑖𝑚(𝑗,𝑙)
𝑙∈𝐾∑ 𝑠𝑖𝑚(𝑗,𝑙)
.
The algorithm helps to overcome some limitations of the user-based algorithms described
above: for instance, unsatisfactory performance when there are a large number of
products, but a small number of user ratings, in addition, calculating the similarities
between all pairs of consumers is an extremely difficult task. Also, item-based algorithms
avoid the need for constant model recalculation when updating user profiles.
45

3) Hybrid filtering
Hybrid recommender systems combine content-based and collaborative filtering
approaches. According to (Burke 2007), there are several types of hybridization:
● Weighted - each of the two approaches is assigned a certain weight, and for each of the
objects a linear combination of ratings is calculated;
● Switching - choosing an approach between collaborative filtering and content-based
filtering depends on the situation - e.g. if the user is new to the recommendation
system, then the "cold start" problem can be solved by switching from collaborative
filtering to a content-based approach;
● Mixing - it is supposed to use several interspersed approaches at the same time - that
is, the user is shown all recommendations from multiple sources, i.e. provided by
collaborative and content-based filtering, but the recommendations are interleaved;
● Cascade - a consistent combination of both algorithms - usually the results of filtering
based on content in the form of a list of potential recommendations are fed to the input
of collaborative filtering.
Hybrid algorithms allow to combine the advantages of the previously described
recommender system approaches and overcome their disadvantages. However, such algorithms
are technically difficult to use and require more serious computing power.
Thus, in this part, the paper examined the main theoretical approaches to consumer
clustering and the creation of recommendation systems, presented in scientific and academic
works. In general terms, there was an examination of the underlying principles of hierarchical,
partitioning, density-based and model-based clustering, and pointed out their advantages and
disadvantages. Then we formalized the task of creating a recommender system and described the
most commonly used approaches to recommender systems: content-based filtering, collaborative
filtering (user-based and item-based), and also briefly described hybrid models. In the next part,
there would be a description of the methods that were chosen to carry out the work in this paper.
46
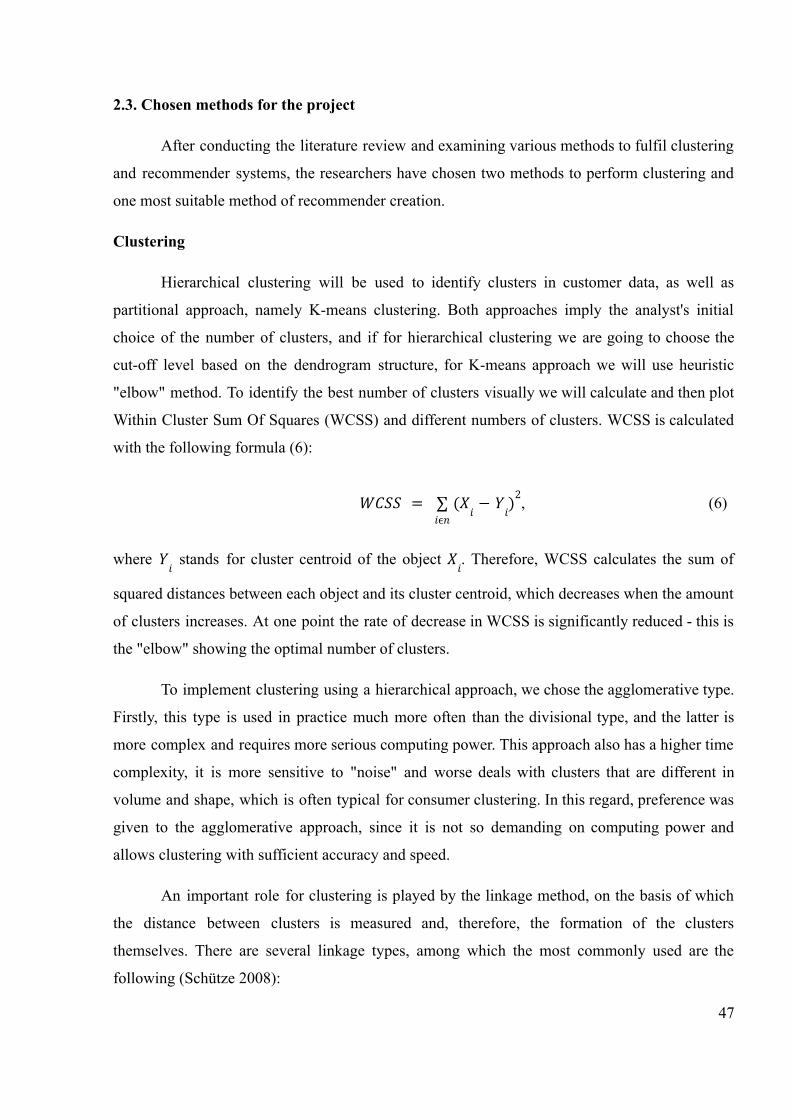
2.3. Chosen methods for the project
After conducting the literature review and examining various methods to fulfil clustering
and recommender systems, the researchers have chosen two methods to perform clustering and
one most suitable method of recommender creation.
Clustering
Hierarchical clustering will be used to identify clusters in customer data, as well as
partitional approach, namely K-means clustering. Both approaches imply the analyst's initial
choice of the number of clusters, and if for hierarchical clustering we are going to choose the
cut-off level based on the dendrogram structure, for K-means approach we will use heuristic
"elbow" method. To identify the best number of clusters visually we will calculate and then plot
Within Cluster Sum Of Squares (WCSS) and different numbers of clusters. WCSS is calculated
with the following formula (6):
, (6)𝑊𝐶𝑆𝑆 = 𝑖ϵ𝑛∑ (𝑋
𝑖− 𝑌
𝑖)2
where stands for cluster centroid of the object . Therefore, WCSS calculates the sum of𝑌𝑖
𝑋𝑖
squared distances between each object and its cluster centroid, which decreases when the amount
of clusters increases. At one point the rate of decrease in WCSS is significantly reduced - this is
the "elbow" showing the optimal number of clusters.
To implement clustering using a hierarchical approach, we chose the agglomerative type.
Firstly, this type is used in practice much more often than the divisional type, and the latter is
more complex and requires more serious computing power. This approach also has a higher time
complexity, it is more sensitive to "noise" and worse deals with clusters that are different in
volume and shape, which is often typical for consumer clustering. In this regard, preference was
given to the agglomerative approach, since it is not so demanding on computing power and
allows clustering with sufficient accuracy and speed.
An important role for clustering is played by the linkage method, on the basis of which
the distance between clusters is measured and, therefore, the formation of the clusters
themselves. There are several linkage types, among which the most commonly used are the
following (Schütze 2008):
47

● Average - the distance between two clusters is determined as the average distance
between objects of the first cluster towards the objects of the second cluster;
● Complete - firstly the distance between the outermost objects of each clusters pair is
computed and then clusters are combined on the basis of the shortest distance;
● Ward - variance of clusters is evaluated to calculate distance between clusters;
● Single - firstly the distance between the most close objects of each clusters pair is
computed and then clusters are combined on the basis of the shortest distance;
● Centroid - distance between clusters is determines as distance between their centroids;
● Median - the median of distances between all objects in one cluster to all objects of the
other cluster is calculated to calculate the distance between clusters.
To assess the quality of the constructed dendrogram, that is, a graphical representation of
the results of hierarchical clustering, and to choose the most suitable linkage method, we will
calculate cophenetic correlation coefficient, which demonstrates linear correlation between
cophenetic distances of the dendrogram and original distances between data objects, i.e. it is a
measure of how accurately the dendrogram maintains the pairwise distances between the original
unclustered data points. The cophenetic coefficient c is calculated with the formula 7:
(7)
where = - Euclidean distance between objects i and j, and stands for𝑥(𝑖, 𝑗) 𝑋𝑖
− 𝑋𝑗| | 𝑡(𝑖, 𝑗)
dendrogrammatic distance between the points of the model and . This distance is the height𝑇𝑖
𝑇𝑗
of the node in the tree at which these two points are first joined together. We will calculate the
cophenetic coefficient for each of the linkage methods described above and based on its value
we will choose the best method for the project.
Hierarchical clustering will be implemented by means of SciPy - library for the Python
programming language, particularly with the "clustering" package and its module "hierarchy",
which enables agglomerative clustering by identifying clusters based on distance matrices and
building dendrograms. For partitional clustering the other Python library - Scikit-learn - will be
used. This library is created for implementing algorithms of machine learning, and we will
48

conduct K-means clustering via module sklearn.cluster, which allows to use different clustering
methods, including K-means that is of our interest.
Recommendation system creation
To create a recommendation system it was decided to use collaborative filtering and opt
out of using content-based filtering due to the specifics of the dataset and absence of enough
information about products - there are no detailed characteristics and even names of the goods or
their categories, only vendor codes/product identifiers. Data volume and their specifics, in
particular, limited sparsity and the opportunity to track ratings history, allow us to implement
collaborative memory-based filtering algorithm, namely user-based one.
The first step in the recommender creation will be the construction of consumer-product
(or user-item) matrix, the columns of which represent goods’ identifiers and rows - consumers’
identifiers. Such matrices are usually very large because they consist mainly of null values and,
therefore, imply high time and space complexity. In order to make such matrices more
convenient for processing and reduce the load on computing power, which one has in an
extremely limited volume, the compressed sparse row (CSR) algorithm will be applied, which is
provided by SciPy library.
As for the model itself, LightFM was chosen as the most appropriate one, since it acts as
some “industrial” standard for building a proven recommender system. By its nature, LightFM
investigates the embeddings (latent users and items’ representations) within a high-dimensional
space with some special techniques that understand the preferences of a client toward an item
and then, based on multiplication task, it assigns each "crossing" a score. Higher score of an item
for a user means that he/she is more likely to buy it. Both user and item are represented through
their features and these embeddings are combined back to extract the recommended (or similar
to already consumed, for the customer) items. There are four options of loss function (logistic,
BPR, WARP and k-os WARP), which differ by the approach they treat positive and negative
representations. The most suitable one for this project is Weighted Approximate-Rank Pairwise
(WARP), because it works for maximising the rank of positive elements and reported to be
advantageous when we have only positive interactions and our main goal is to get a higher
precision rather than recall. It’s coherent with business objectives - it’s better to recommend
some item which is less likely to be preferred by a client than to miss some item which should be
49

recommended. Other attributes such as learning rate, user alpha and so on can be tuned within
several iterations to find the ideal values for this particular case.
Purchase prediction modelling
In order to create a reliable model, which would be able to predict whether a consumer
will make a purchase in the nearest time (for example, 1 month), the lag analysis will be
implemented. Such analysis takes into consideration changing of characteristics in time series -
for this, time lags are artificially created in the dataset, and of varying duration. In the model,
they act as independent variables. After the lags calculation, the grid, accumulating flat
structures of each characteristic’s dynamic changing over the period, is constructed. As for the
further steps, the splitting of the dataset to train, test and validation set will be implemented as it
is always done for machine learning models. For the predictor creation it was decided to use a
highly effective machine learning technique of Gradient Boosting, the feature of which is to
solve the prediction problem by creating an ensemble of weak predictive models, while the next
model will learn from the errors of the previous. Specifically, the CatBoost algorithm (which
uses ensembles of decision trees) will be applied due to its ease of implementation and
popularity for solving tasks like the described one.
2.4. Conclusion
The second chapter was devoted to the answer to the second research question: “What
methods are used to solve the problems of consumer behavior analysis and what methods can be
chosen for Kiehl's case?”. There was a review of the methods that can be used for the purpose of
analyzing consumer behavior. In this chapter, the research was mainly focused on reviewing the
theoretical groundwork for consumer clustering and building recommendation systems. As for
clustering, we have considered hierarchical, partitional, density-based and model-based types of
clustering. Due to specificity of the data and computational limitations it was decided to use
hierarchical and partitional clustering. Concerning recommendation system creation methods, we
have widely discussed three major types of filtering: content-based, collaborative and hybrid, for
each of the approaches the advantages and disadvantages of using were described. Collaborative
filtering was of our primary interest, and it types (model-based and memory-based) were
described. For the project concerning Kiehl’s products it was decided to use collaborative
filtering, specifically its memory-based type (user-based subtype).
50

Finally, the choice of methods that will be used in the next chapter to carry out the
practical part of the study were explicitly justified, and described in more detail the procedure for
applying each method and the necessary tools that will be used further. In the next part of the
work, we will implement the practical application of the selected methods on real consumer data
of the L’Oréal company.
51

CHAPTER 3. DATA ANALYSIS AND APPLICATION OF CHOSEN METHODS
This chapter is a description of the practical part of the work, within the framework of
which the methods selected in the second chapter will be applied to solve the problems described
in the first chapter of this study.
In this chapter we will analyze the data transmitted to us by L'Oréal about consumers and
their purchases of Kiehl’s products. The data provides detailed information on purchases of
several hundred thousand customers between May 2015 and April 2020. To answer the third
research question “What similarities can be found in Kiehls’ consumer behavior, and how can
we use this to make the customer experience more personalized?”, we are going to carry out
clustering of buyers, which will allow a deeper understanding of consumer preferences, improve
targeting in accordance with their desires, needs and predilections. To find the answer to the
fourth research question “Is it possible to recommend to Kiehl’s customer an item from the
proposed range of products that is likely to be bought?”, the purchase history of consumers will
be used as the basis of recommendation system creation. The system can potentially improve the
personalization of the online shopping experience and increase revenue. Finally, to answer the
fifth research question “How, based on the previous purchase history, identify if Kiehl's client is
about to make an order within the next period (one month)?” the predictive model will be
created.
3.1. Exploratory data analysis
The data set transmitted by the company to us for analysis consists of three files with
different data downloaded from various systems:
1. SKU data: list of orders with their unique identifiers (ID) from 03.24.2015 to 04.29.2020
and their composition: SKUs of specific goods and their types (finished or promotional
product) along with the cost of each SKU in the context of 10 items in each order. There
are 154 858 order records in this pre-cleaned dataset and 887 unique SKU IDs in total;
2. Orders data: list of orders with IDs from 10.04.2015 to 17.02.2021 with with the details
of ordering: customers’ IDs, the number of products in the order, payment amount, order
status, the method of payment, the date the order was created and the date of receipt of
the goods, the delivery methods and delivery addresses. The file contains 214 362 rows;
52

3. Consumer data: data on customers including their IDs (downloaded from the CRM
system), demographic data, phone number and email validity, subscriptions to some of
the company's brands, purchases of some brands (including Armani, Yves Saint Laurent,
Lancome, Urban Decay, Biotherm, Shu Uemura, Clarisonic, Helena Rubinstein and
Kiehl’s, which is of our primary interest). There are 741 056 rows in the file and at first
glance, a large number of empty cells is noticeable.
First of all, SKU data, orders data and consumer data were joined by columns containing
customer IDs and order IDs. Combining all three datasets at this stage would be impractical,
since it would lead to the loss of some of the data we need for the initial analysis. After
combining data, removing columns containing only nulls, and removing duplicates we got a
dataset with 143 277 rows and 160 columns. Next, we will sequentially explore the data.
To start with, it is necessary to look at dynamics of the number of orders over a 5-year
period (Figure 14). As it can be clearly seen, there is some seasonality, as the number of orders
increases in preparation for the New Year holidays, as well as in the months when Russians
celebrate national holidays on February 23 and March 8. In addition, there is a spike in demand
in June and November (a particularly strong spike) in 2019. This occurs due to the fact that the
Kiehl's brand ran promotions (for example, “Black Friday”) during these months, which
attracted a large number of consumers.
53

Figure 14. Amount of orders dynamics by month, 2015-2020
Source: created by authors
To examine demand dynamics closer, we will also look at orders amount distribution by
month of the year and day of month aggregated for the 5-year period (Figure 15). The number of
orders varies significantly throughout the month. This is due to both "gender" and other holidays,
on the occasion of which it is customary to give cosmetic products, as well as the promotional
activity of the company: for example, we see a high peak in November - as already noted, it is in
this month that the annual “Black Friday” is held, attracting a large number of buyers.
54
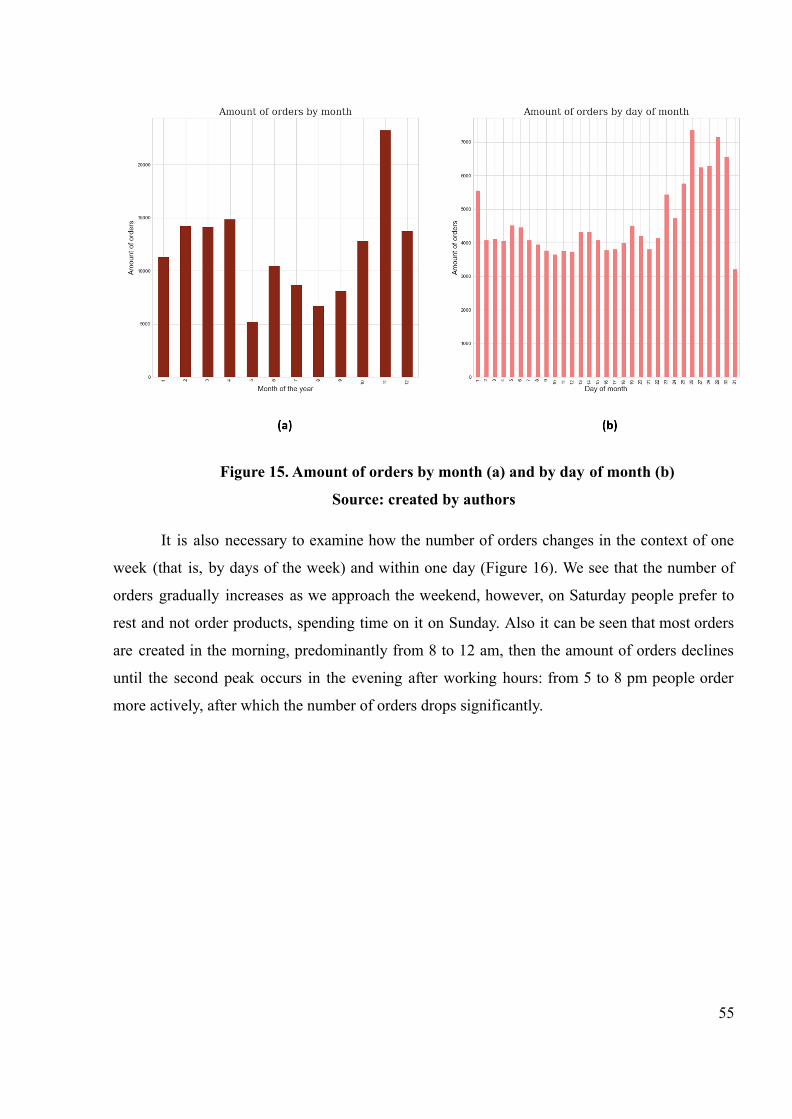
Figure 15. Amount of orders by month (a) and by day of month (b)
Source: created by authors
It is also necessary to examine how the number of orders changes in the context of one
week (that is, by days of the week) and within one day (Figure 16). We see that the number of
orders gradually increases as we approach the weekend, however, on Saturday people prefer to
rest and not order products, spending time on it on Sunday. Also it can be seen that most orders
are created in the morning, predominantly from 8 to 12 am, then the amount of orders declines
until the second peak occurs in the evening after working hours: from 5 to 8 pm people order
more actively, after which the number of orders drops significantly.
55
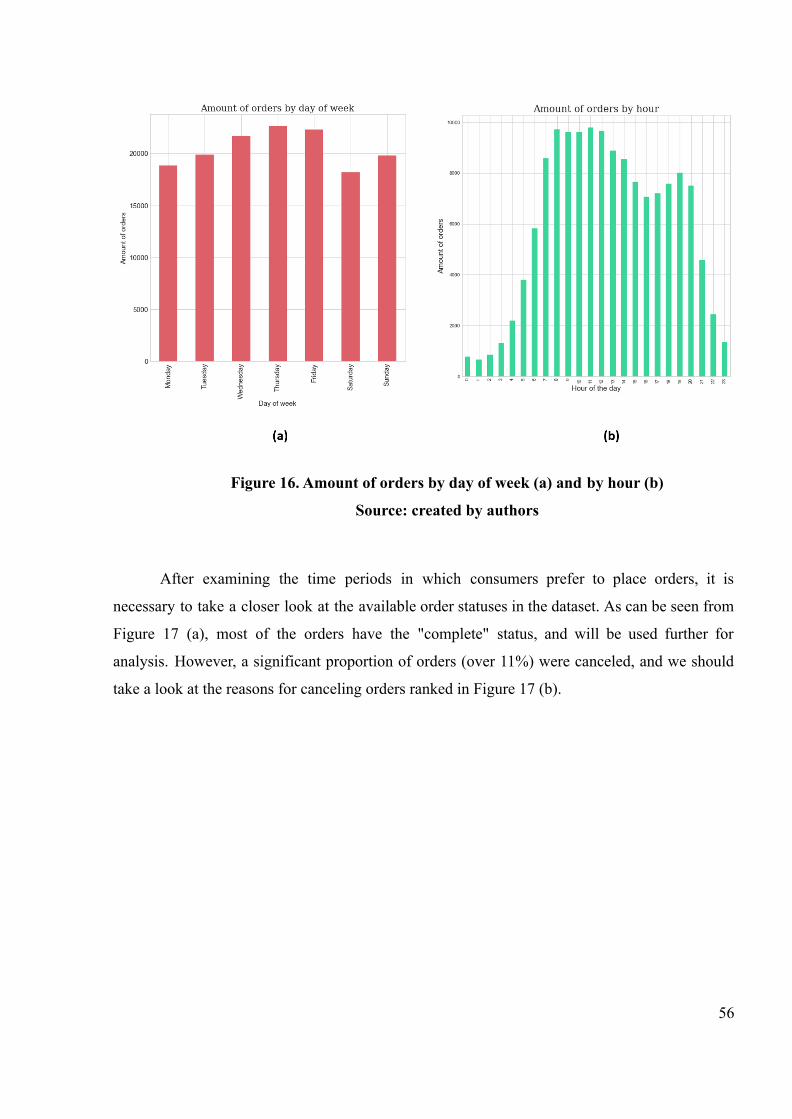
Figure 16. Amount of orders by day of week (a) and by hour (b)
Source: created by authors
After examining the time periods in which consumers prefer to place orders, it is
necessary to take a closer look at the available order statuses in the dataset. As can be seen from
Figure 17 (a), most of the orders have the "complete" status, and will be used further for
analysis. However, a significant proportion of orders (over 11%) were canceled, and we should
take a look at the reasons for canceling orders ranked in Figure 17 (b).
56

Figure 17. Orders distribution by status (a) and main reasons of order cancellation (b)
Source: created by authors
Among the most popular reasons for order cancellation is the incorrectly chosen payment
method, which may indicate an inconvenient for the user interface of the online store (which is
not intuitive or does not insure against mistakes), as well as the inaccessibility of the customer
for communication, which indicates the need for the company to check the relevance more often.
contact information of consumers, as well as one of the main reasons is the lack of goods in
stock, which indicates poor planning and supply within the company.
To explore fulfillment of orders and consumer behavior reliably we will focus only on
completed orders, therefore the number of rows is reduced to 116 107. In the dataset there are 55
845 unique clients, however only for about 30% of them the gender and date of birth are known.
Since L'Oréal primarily offers products for women and only a limited set of goods for men, it is
natural that the majority of consumers are women: among the consumers for whom we have
sufficient data, including gender and date of birth, 19,955 customers are women and only 920 are
men. The vast majority (90%) of consumers are of age between 25 and 49 (Figure 18):
57
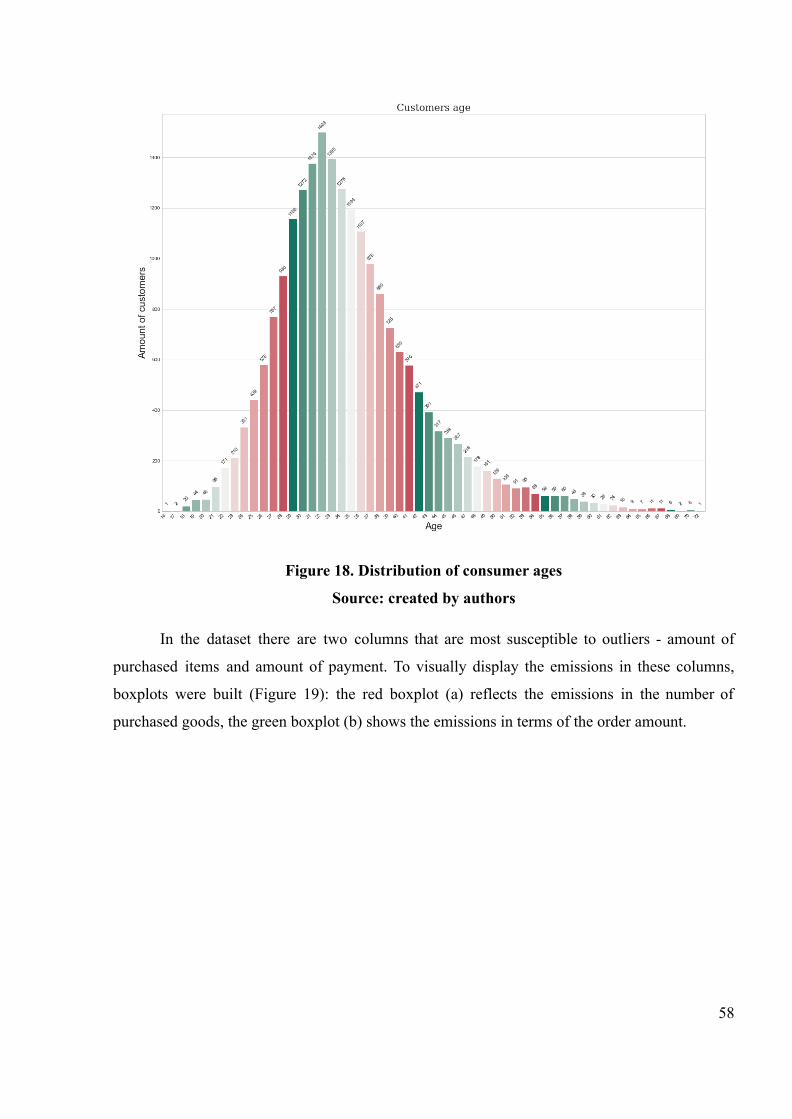
Figure 18. Distribution of consumer ages
Source: created by authors
In the dataset there are two columns that are most susceptible to outliers - amount of
purchased items and amount of payment. To visually display the emissions in these columns,
boxplots were built (Figure 19): the red boxplot (a) reflects the emissions in the number of
purchased goods, the green boxplot (b) shows the emissions in terms of the order amount.
58

Figure 19. Boxplots for identification outliers in amount of items (a) and orders prices (b)
Source: created by authors
Removal of outliers in the amount of purchased items data was carried out by calculating
percentiles - the upper limit was set at 99%, the lower one at 1% of the dataset. When removing
outliers from the data on the payment amount, we were guided by the company's directive that,
since the goods presented in the dataset belong to premium brands, then all orders where
payment amount is less than 1,000 rubles and more than 30,000 rubles are outliers. After outliers
removal the number of rows reduced to 91 506, and the histograms of purchased items and
payment amount look in the following way (Figure 20):
59

Figure 20. Distribution of amount of items in ordered (a) and payment amounts
distribution (b)
Source: created by authors
Thus, after removing outliers, we see an adequate number of items in orders (most
consumers order from 4 to 8 items), as well as order amounts that have a right skewed
distribution, which is natural for this indicator. It is worth noting that the dataset contains the
number of items in the order and article numbers in the context of 10 unique positions (SKU) of
the order, but there is no data on how many items of a particular article the consumer bought.
Thus, despite the fact that the order contains only 10 items, the consumer could purchase several
products of the same article and the amount of items in the order will be more than 10. As it can
be seen from the graph, most consumers had from 4 to 7 items in their orders, however, it should
be also mentioned that the orders data contain goods of 3 types (besides, some items are not
labeled): YFG - finished goods chosen by a consumer in the online-shop, and two types of
promotional goods - YPL2 and ZALI, which a consumer receives for free as a gift upon
purchase. Among labeled products, there are 91 506 finished goods bought by consumers, 91
447 and 2215 goods of types YPL2 and ZALI respectively. Therefore, talking about only those
products, which consumers pay for, 90% of orders contain 1 to 7 products of type YFG (Figure
21):
60

Figure 21. Distribution of amount of items of YFG type in orders
Source: created by authors
Looking closer at most prefered brands in the dataset, we can see a particularly high
demand for Kiehl's brand products, which is explained by the fact that the business problem is
being solved for this brand and the main focus is on it. In addition to Kiehl's products, the brands
Biotherm, Urban Decay, Lancome and others have also been popular for 5 years (Figure 22).
Figure 22. Number of products by various brands ordered in a 5-year retrospective
Source: created by authors
61

Finally, we will look at the data related to the completion of the purchase - payment and
delivery. Consumers have only 3 payment methods available: cash upon receipt (the most
popular option, 59% of orders were paid this way), payment by card on the site (38% of orders),
apple pay payment via CMS Magento used by the company (only 3% of orders). In terms of
delivery, the most popular delivery methods are shown in Figure 23 (a): courier delivery
methods by Strizh, SPSR and O-courier logistic services and pick-up from points provided by
PickPoint service. Delivery times in days are depicted in Figure 23 (b): most orders are delivered
within 2-9 days.
Figure 23. Delivery methods (a) and distribution of delivery time in days (b)
Source: created by authors
Thus, we conducted exploratory data analysis, built several visualizations and got an idea
of the data received from the company and initial insights. In addition, during the analysis, we
significantly modified the dataset, preparing it for further analysis.
3.2. Consumers clustering
For clustering, first of all, a dataset was prepared in advance. First, if the original dataset
was a list of orders, each of which had an identification number and was a separate line, then in
the current dataset the data was aggregated by customer identification numbers. In addition, in
the dataset for clustering, those consumers were selected for whom the most complete62
information was available, both in terms of demographic characteristics and product preferences.
In addition, since the original dataset contained a large amount of categorical data, dummy
variables, taking the values 0 and 1, were used to digitize them while maintaining account of
their influence. For example, the dataset initially had a column on preferred payment options,
containing three types of categorical values - cash after receipt ("pay_cash_after_receive"),
online card payment ("pay_card_online"), and Apple Pay mobile payment
("pay_applepay_magento"). From this one column, using dummy variables, we have created
three separate columns by the names of the specified categorical variables, which contain only 0
and 1, where 1 in one of the columns corresponds to the selected payment option for a particular
consumer. After the performed manipulations, a dataset of 20875 rows and 132 columns was
obtained.
Since the dataset contains data not only such data that takes only 2 possible values, but
also, for example, data on the number of items in an order and the cost of an order, that is, data in
different columns are measured in different ranges, then the data was normalized before
clustering, that is, changing the range of data without changing the shape of the distribution.
After preparing the dataset, we proceeded to clustering, starting with hierarchical clustering.
As stated in the theoretical part of this paper, we used an agglomerative type of
hierarchical clustering. For this, we have determined the most suitable linkage method by
calculating cophenetic coefficient for various methods described earlier. The visualization of
coefficient calculation is presented in Figure 24.
63

Figure 24. Cophenetic coefficient for different linkage types
Source: created by authors
As it can be seen from Figure 25, the median linkage method provides the highest
cophenetic coefficient for hierarchical clustering of consumers in our dataset. The following step
is to apply routine "linkage" from the clustering package of SciPy library for the chosen linkage
method. The resulting dendrogram is presented in Figure 25.
64

Figure 25. Dendrograms for median and centroid linkage methods
Source: created by authors
In the dendrogram 4 clusters are distinguishable, which are significantly different in size.
The median linkage algorithm application provides the following clusters (aggregated by mean
value and transposed), depicted in the Figure 26:
65

Figure 26. Clusters produced by median linkage (first 27 clusters’ characteristics)
Source: created by authors
Unfortunately, there is no way to automatically describe clusters according to given
characteristics, therefore, to highlight the specific features of each of the four identified clusters,
we studied the values of all 131 characteristics of clusters. A summary table with the analysis
results is presented below (Table 2).
Table 2
Description of hierarchical clustering results
Cluster number(color of
dendrogrambranch)
Amount ofconsumers
Cluster name Description
1 (blue) 102 Casual fans These consumers are looking for variety. They placeorders with a large number of positions of severalbrands besides Kiehl’s, use promo codes quite often,are subscribed to promo notifications in variousmessengers and social networks. Most of all they areinterested in products for the face: oils, scrubs,serums, tonics, products for oily and problem skin,
66

Continuation of Table 2
nourishing products for dry skin. Most of they areKiehl's loyalty program members and havemoderate number of points
2 (red) 101 Conditionallyloyal
The middle-aged group of consumers, who makemedium-sized orders, sometimes using promotionalcodes. Most of the male buyers belong to thiscluster. Interested in body and hair products andbestsellers. Subscribed to the mailings of a largenumber of brands in order not to miss the promooffer
3 (green) 97 Super fans The most aged audience is interested in cosmeticswith a moisturizing effect and an anti-aging effect.Interested in mini-formats. More often than otherconsumers subscribed to social media newslettershave the highest loyalty balance. They often usecoupons and make large orders at once (themaximum number of different brands in an order,the number of items can reach up to 90 pieces),preferring courier delivery
4 (purple) 20535 Ordinarybuyers
The youngest and the largest consumer group.These consumers buy small orders, the cost ofwhich does not exceed 4 thousand rubles. Mainly inorders there are products of 1-2 brands. They hardlyuse coupons, they often choose bestsellers andmini-formats. Often they are not members of theloyalty program or have a small number of points
Thus, using hierarchical clustering, we identified 4 clusters among consumers and carried
out their primary analysis. The next step will be clustering based on the partitional method of
K-means.
To determine the optimal number of clusters, we used the classic heuristic “elbow
method” described in the theoretical part of the paper. As it can be seen from Figure 27, four
clusters is the best number for this project, as it also was in the previous method.
67
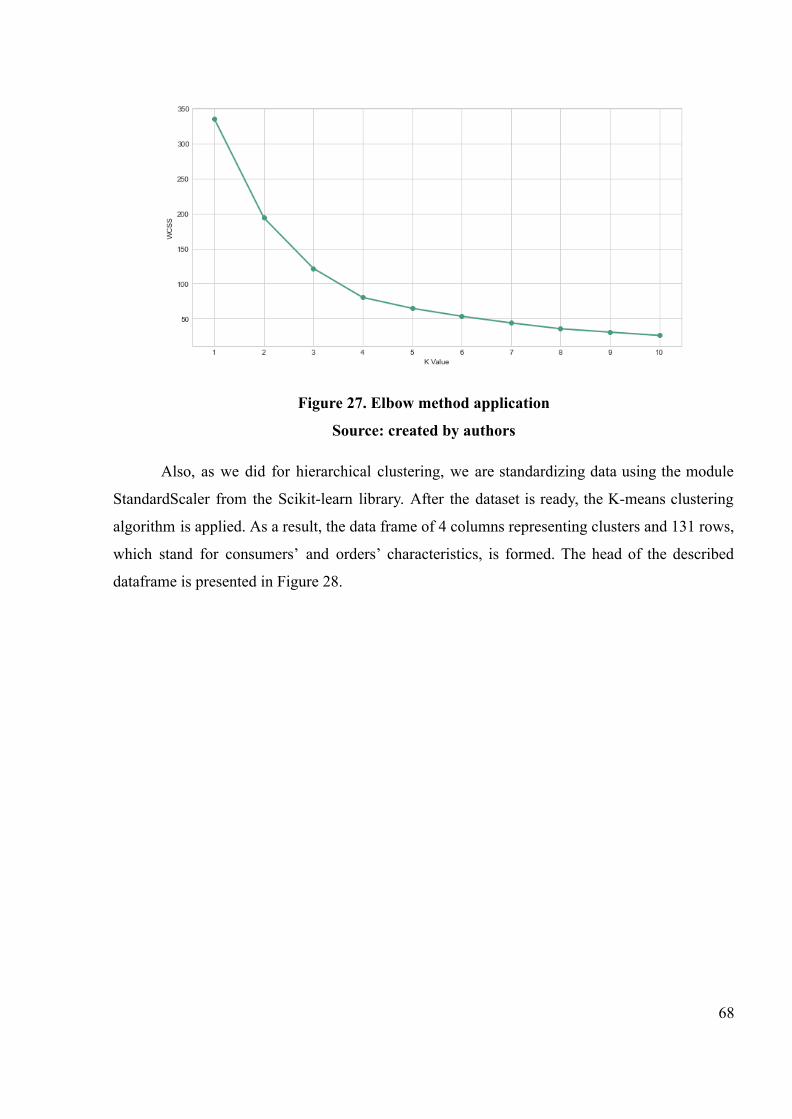
Figure 27. Elbow method application
Source: created by authors
Also, as we did for hierarchical clustering, we are standardizing data using the module
StandardScaler from the Scikit-learn library. After the dataset is ready, the K-means clustering
algorithm is applied. As a result, the data frame of 4 columns representing clusters and 131 rows,
which stand for consumers’ and orders’ characteristics, is formed. The head of the described
dataframe is presented in Figure 28.
68

Figure 28. K-means clustering results
Source: created by authors
Let us study the clusters obtained using this method in more detail and compare the
results with that given by hierarchical clustering. Again, a summary table with clusters’ size,
code names and primary description are presented in the summary table below.
Table 3
Description of partitional clustering results
Clusternumber
Amount ofconsumers
Cluster name Description
1 16408 Ordinary buyers This cluster is made up of the majority of consumers whomake small orders, on average 7 items of 1-3 brands, thetotal cost of which is up to 6 thousand rubles. The clusteris mostly composed of young buyers. They almost do notuse promo codes. Almost equally interested in allcategories of goods, giving preference to the bestsellers.They are often members of the Kiehl's loyalty program,but have a small number of points, in addition to thisbrand, they are also interested in others, subscribe to theirmailings
69

Continuation of Table 3
2 682 Casual fans The cluster consists mainly of consumers about 40 yearsold who make large orders worth about 48 thousandrubles. They prefer courier delivery (for other clusters,the difference in preferences between self-pickup andcourier delivery has not been identified), they often usecoupons, and there is a wide variety of brands in theirorders. They prefer hair products, oils, masks, scrubs andserums for the face, body products, and anti-agingproducts. Almost all consumers participate in the loyaltyprogram and have at least 650 points on the account
3 3686 Conditionallyloyal
A relatively large cluster of middle-aged buyers makingmedium-sized orders with an average cost of about 19thousand rubles. The orders contain products of 3-6brands, for half of the orders a promotional code is used.They prefer bestsellers and skin moisturizers. All othercategories are equally preferred. Most of them aresubscribed to mailing lists of many brands, includingKiehl's, in the loyalty program of which a large part alsoparticipates and has up to 500 points
4 99 Super fans Consumers of this cluster place huge and very expensiveorders with an average value of more than 110 thousandrubles. The average age of these customers is the same asthat of the "casual fans". Male consumers mainly belongto this cluster. These consumers also prefer courierdelivery, with a coupon used for the vast majority oforders. They buy many products from other brands,prefer hair products, mini-formats, products for oily skinand anti-aging, more than others, they are interested inmoisturizers. These are the most loyal consumers to theKiehl's brand; on average, they have about 1 000 pointson their loyalty account
3.2.1. Findings on consumer clustering
Thus, both clustering approaches yielded fairly similar results. In total, 4 clusters were
obtained, which were conditionally designated as “Ordinary buyers”, “Casual fans”,
“Conditionally loyal”, “Super fans”, based on the identified differences in consumer behavior. It
is noteworthy that for some characteristics, namely: the preferred method of payment, often the
preferred method of delivery, the size of the population of the consumer's city of residence, and
whether the order was made in the first / second half of the day / month, no significant
differences were revealed. That is, regardless of the cluster, consumers prefer to pay in cash after
70

receiving an order or with a card on the website; they make orders mainly in the afternoon and in
the second half of the month.
3.3. Recommender system creation
3.3.1. Utilization of the data set
As it was mentioned before, out of the 3 separated data sets introduced by the company
for the purpose of building the recommender (i.e. the classifier which identifies an element as
needed by the particular consumer) it was necessary to analyze the file with the orders history
given on the 5 years period (2015-2020). This file contains a unique order number (ID), which is
also used as an identifier for a particular purchase, identifier of the customer who bought it, the
date of purchase, the total purchase sum, items bought and the price of these items. The shortcut
of the sample described is presented in Figure 29.
Figure 29. Shortcut of the .xlsx file containing orders information
Source: created by authors
The main data needed here is one concerning the list of items purchased by a customer.
By one or several purchases within the given period we identify which products out of the range
the client bought and which of them he or she bought more than ones (by the frequency of these
purchases).
3.3.2. Model description
The used model is based on collaborative filtering on a user-based mode, or, in other
words, it aggregates the data available on a particular consumer’s preferences and so-called
"rankings". Ideally, this model works on explicit rankings, when the customer assesses the
71

experience of the product usage out of some scale. But we can also use implicit rankings where
they are estimated based on how often the customer bought the product and what’s the period
between two purchases (the shorter the period - the more the likelihood that the customer liked
it). As we described in the first chapter of this paper, the main difference between this model and
the second possible option of content-based filtering is the one that we are trying to evaluate the
whole profile of our client and give recommendations based on the whole knowledge we
accumulated. This is more beneficial for this project, since if we rely on a particular product a
consumer uses, we might be mislead by some products that are bought for the first time, and also
we have to deal with a special recommendation for every purchased item, which is still a huge
massive of data where we have to narrow down to a feasible amount. It would also make more
sense to use this approach when we deal with explicit ranking. So, instead, we identify the
behavioral patterns of the clients and say what he or she might like judging by this.
When we apply the model of collaborative filtering, it learns the most or least liked
products by a consumer. Given that both the set of customers and set of items (products) can be
placed within a K-dimensional pattern (or simplier, we can build a table of preferences in
2-dimensional axes), the model starts building matrix factorization, placing all the items with
some special vectors based on similarity of being liked by the "similar users" and also all the
users in the same manner. enerally, this procedure takes into account Root Mean Square Error
(RMSE) and tries to minimize this distance by placing more similar objects closer.
Even within this model there are some alternatives regarding what we are trying to
identify: whether we are looking for some goods that are similar to the most liked goods by the
consumer, or we are trying to find the customers which are placed closer to one another. As a
result of this stage, we get a matrix representation of the "likes" placed by customers to some
items. This model was chosen based on its proven success regarding the implicit rankings and
also for big massives of data (long purchase history). So it made sense to use a user-based
approach and treat a consumer as a unit for recommendations.
3.3.3. Findings on recommendation system
Going deeper into details of the process followed to the analysis itself, there were a few
steps covered sequentially. Firstly, the data was cleaned as described above in order to get rid of
odd, strange or outstanding features, as well as absent values to get more statistically justified
results, because including the mentioned features makes the statistics biased also. Furthermore,
72

the sample was cleaned out of duplicated results which also put a higher weight to some features,
introducing them as several distinguished purchase events. On this step we get 112030 features
from the list of more than 154000.
Technically, further we take the initial table as a pandas sample in order to be able to
transform it in a necessary way. We get rid of the prices as they are not present as significant
variables within the process. As a result, we get a table that looks like this (Figure 30):
Figure 30. Prepared dataset according to orders for building a recommender
Source: created by authors
Then, to produce a necessary matrix we launch a cycle-based function which tracks every
order and, if it consists of some of the goods, it stores this data in a special container
representing the consumer's "likes'', i.e. ratings. It is also worth mentioning that due to the
specifics of getting a matrix representation for building vector factorization later we deal with
significant extension of the columns we had, since now we use a combination of a product place
along with its unique identifiers to assign either 0 or some positive value to the field (the
crossing of the item and the consumer). As a result of the step we get a matrix of 6406 columns
(which are generated by different combinations of unique identifiers and one of the ten positions
within an order) and 63541 rows, representing consumers. The heading of its visual
representation is introduced in Figure 31.
Figure 31. Consumer-product (user-item) matrix
Source: created by authors
73
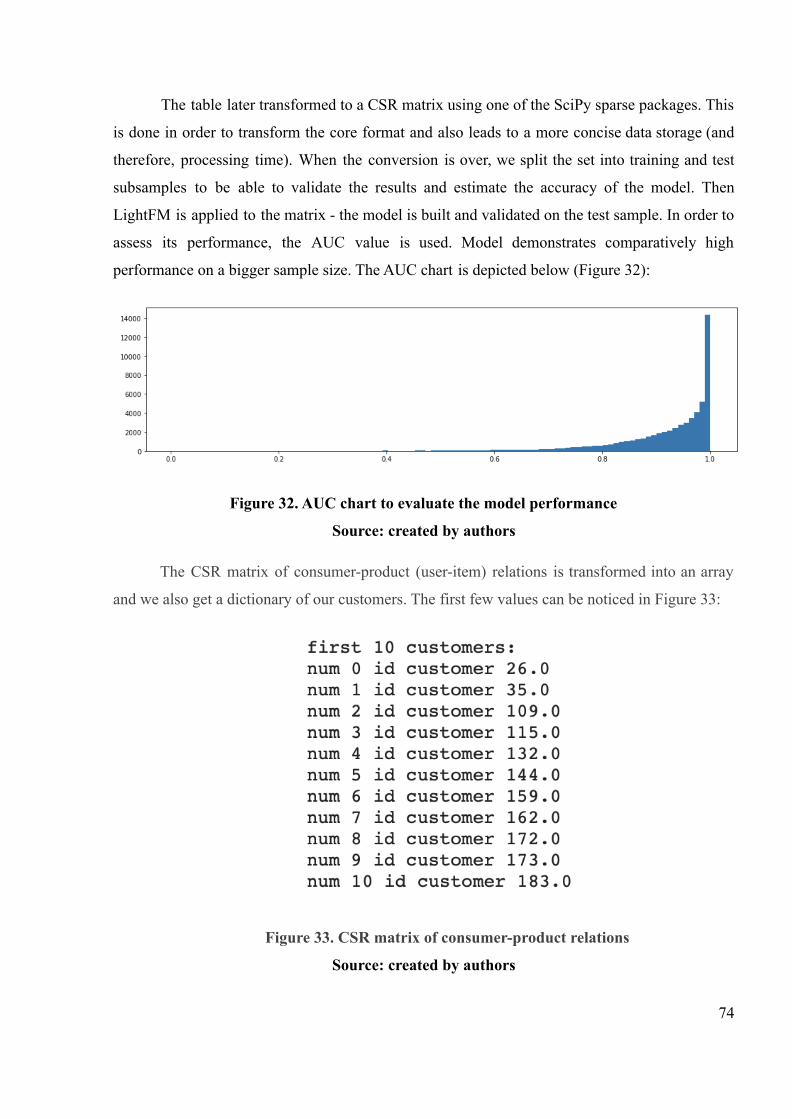
The table later transformed to a CSR matrix using one of the SciPy sparse packages. This
is done in order to transform the core format and also leads to a more concise data storage (and
therefore, processing time). When the conversion is over, we split the set into training and test
subsamples to be able to validate the results and estimate the accuracy of the model. Then
LightFM is applied to the matrix - the model is built and validated on the test sample. In order to
assess its performance, the AUC value is used. Model demonstrates comparatively high
performance on a bigger sample size. The AUC chart is depicted below (Figure 32):
Figure 32. AUC chart to evaluate the model performance
Source: created by authors
The CSR matrix of consumer-product (user-item) relations is transformed into an array
and we also get a dictionary of our customers. The first few values can be noticed in Figure 33:
Figure 33. CSR matrix of consumer-product relations
Source: created by authors
74

Finally, we define a function, which takes the customer identifier and returns the products
that are the closest ones to his or her real purchase history. Graphic representation is depicted in
Figure 34.
Figure 34. The result of the model's work on the example of one consumer
Source: created by authors
On the vertical axis the model places an amount of a particular product purchase. Colored
in orange we can see the real purchases, while blue columns demonstrate our recommendations.
In this case we observe raw recommendations, which are not fixed by the “likelihood” that the
customer would choose them. It also makes sense to offer consumers a fixed amount of products
because in this case the company would face less problems with visualization and
communication, and the client won’t be frustrated.
To eliminate the items that showed the lowest “likelihood”, we tune the parameters that
represent some cut-off value, or the meaning of the probability, which we estimate as high
enough to be taken into consideration. This role is played by the threshold value, and tuning it
sequentially, we faced the meaning of 0.5, which is high enough to eliminate all the odd products
but still allows us to highlight several products in the recommendation list. In this case we get
fewer products. To compare recommendation for the same client as on the Figure 35 above we
build the new one regarding the threshold we have set (Figure 35), the recommended products
are shown by the blue columns:
75

Figure 35. Adjusted model (threshold = 0.5)
Source: created by authors
3.3.4. Potential gaps of the recommender
Despite the satisfactory quality of the model, it does not reveal several pretty important
issues, which also act as some of the further areas for development of the model.
1) Firstly, potentially several people can act from the same account and therefore can lead to
discrepancies between the recommended items and the owner of the profile. However,
recommended products tend to be liked by some of the account users. At the same time,
several actors using the same account can be identified and distinguished in order to
provide a higher level of customization, but it requires more advanced classification
methods and before such an upgrade of the system the company has to check whether it
really faces such a problem;
2) It can also be a case when the company wants to put higher weight to the most recent
purchases to consider the changing patterns of the client which would also adapt
recommendations more. However, even the simple adding the new orders in the initial
dataset allows will take time to adjust the recommendations;
3) Another questionable area is the alignment of the company’s objectives with the model
results: so far it’s tuned in accordance with the company representative’s approach.
However, in case the company changes the attitude toward recommendation, some
criteria (like the threshold value) also should be changed a bit to advise more or less
products;
4) Finally, taking information from users in a more explicit form, which involves ranking
systems for the items consumed by every user, is also an area for improvement. This
76
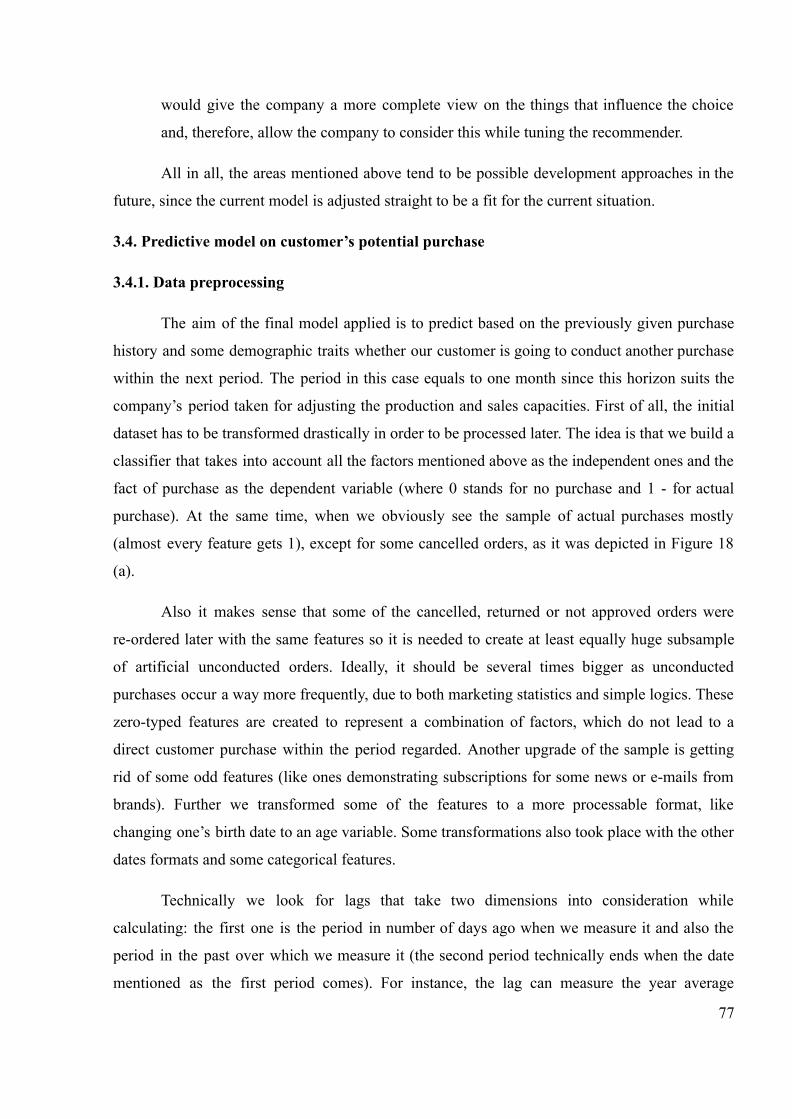
would give the company a more complete view on the things that influence the choice
and, therefore, allow the company to consider this while tuning the recommender.
All in all, the areas mentioned above tend to be possible development approaches in the
future, since the current model is adjusted straight to be a fit for the current situation.
3.4. Predictive model on customer’s potential purchase
3.4.1. Data preprocessing
The aim of the final model applied is to predict based on the previously given purchase
history and some demographic traits whether our customer is going to conduct another purchase
within the next period. The period in this case equals to one month since this horizon suits the
company’s period taken for adjusting the production and sales capacities. First of all, the initial
dataset has to be transformed drastically in order to be processed later. The idea is that we build a
classifier that takes into account all the factors mentioned above as the independent ones and the
fact of purchase as the dependent variable (where 0 stands for no purchase and 1 - for actual
purchase). At the same time, when we obviously see the sample of actual purchases mostly
(almost every feature gets 1), except for some cancelled orders, as it was depicted in Figure 18
(a).
Also it makes sense that some of the cancelled, returned or not approved orders were
re-ordered later with the same features so it is needed to create at least equally huge subsample
of artificial unconducted orders. Ideally, it should be several times bigger as unconducted
purchases occur a way more frequently, due to both marketing statistics and simple logics. These
zero-typed features are created to represent a combination of factors, which do not lead to a
direct customer purchase within the period regarded. Another upgrade of the sample is getting
rid of some odd features (like ones demonstrating subscriptions for some news or e-mails from
brands). Further we transformed some of the features to a more processable format, like
changing one’s birth date to an age variable. Some transformations also took place with the other
dates formats and some categorical features.
Technically we look for lags that take two dimensions into consideration while
calculating: the first one is the period in number of days ago when we measure it and also the
period in the past over which we measure it (the second period technically ends when the date
mentioned as the first period comes). For instance, the lag can measure the year average
77

calculated a month ago (or six month, and so on). This lag is calculated for all the variables taken
as the key one. The ones declined were somehow connected with email subscriptions and still
the average cannot be calculated once we do not know the exact day of subscription. The whole
range of lags calculated is introduced below (Figure 36):
Figure 36. Range of calculated lags
Source: created by authors
Once the lags are calculated we call the final table constructed the grid, which
accumulates flat structures of each parameter's dynamics over the period chosen in the past being
measured several times. Finally there’s a list of 66 parameters which consists of both
demographic and lag-related ones.
3.4.2. Findings on the purchase prediction
In order to be able to assess the performance of the classifier we split the sample into
training, validation and test samples, which are situated consequently (chronologically). We also
78
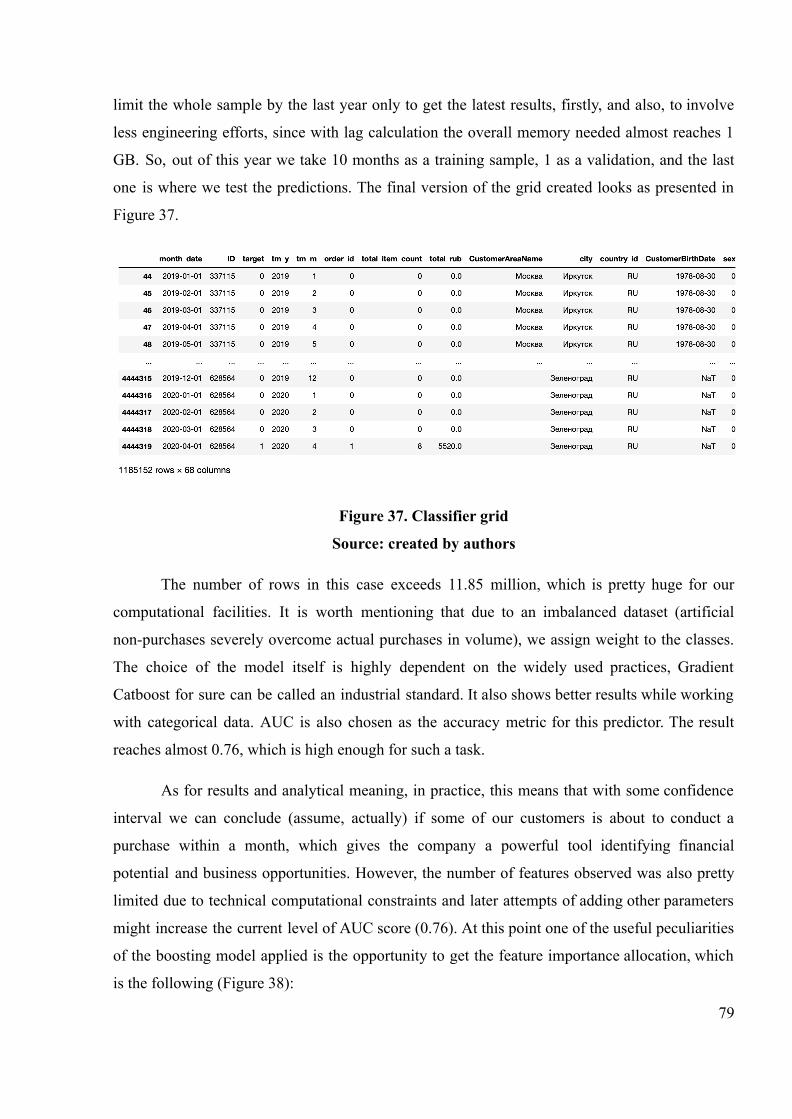
limit the whole sample by the last year only to get the latest results, firstly, and also, to involve
less engineering efforts, since with lag calculation the overall memory needed almost reaches 1
GB. So, out of this year we take 10 months as a training sample, 1 as a validation, and the last
one is where we test the predictions. The final version of the grid created looks as presented in
Figure 37.
Figure 37. Classifier grid
Source: created by authors
The number of rows in this case exceeds 11.85 million, which is pretty huge for our
computational facilities. It is worth mentioning that due to an imbalanced dataset (artificial
non-purchases severely overcome actual purchases in volume), we assign weight to the classes.
The choice of the model itself is highly dependent on the widely used practices, Gradient
Catboost for sure can be called an industrial standard. It also shows better results while working
with categorical data. AUC is also chosen as the accuracy metric for this predictor. The result
reaches almost 0.76, which is high enough for such a task.
As for results and analytical meaning, in practice, this means that with some confidence
interval we can conclude (assume, actually) if some of our customers is about to conduct a
purchase within a month, which gives the company a powerful tool identifying financial
potential and business opportunities. However, the number of features observed was also pretty
limited due to technical computational constraints and later attempts of adding other parameters
might increase the current level of AUC score (0.76). At this point one of the useful peculiarities
of the boosting model applied is the opportunity to get the feature importance allocation, which
is the following (Figure 38):
79

Figure 38. Feature importance of boosting model
Source: created by authors
We can notice the highest influence of the month, in which the purchase might happen
and the client’s age (tm_m and customer_age, respectively). The year also tends to be pretty
powerful in potential order recognition. Customer age also acts as a key factor within the
forecasting process. One can also observe that some of the calculated lags are also important in
building predictions. For instance, calculating yearly average for a month-ago-moment takes the
third position in order prediction, straight after month and year. More detailed analysis of this
80

information and more complicated models are to become one of the next steps in our research,
since there are numerous options of combining variables and their lags, where finding an optimal
proportion might take a lot of time.
3.5. Recommendations for further business implication
As a part of the FMCG market, the cosmetics and perfumery market where the company
operates is quite dynamic and rapidly changes. Such a market is characterized by a high level of
demand with relatively low consumer involvement due to the routine process of buying everyday
goods, while the market is highly competitive and with a large number of substitute goods
(Conroy 2016). Despite such intense competition, L'Oréal is the world leader in the cosmetics
market in terms of turnover, followed by Unilever, Estée Lauder, Procter & Gamble. One of the
reasons for its success, the company considers its special emphasis not only on the quality of
goods, but also a focus on creating a special customer journey at the strategy level (see the
Figure below) - L'Oréal emphasizes the special importance of good customer service at every
stage of the consumer's contact with individual products, the brand and the company as a whole.
The customer journey map, created specifically for Kiehl’s brand of L'Oréal, is presented in
Figure 39.
81

Figure 39. Customer journey map
Source: created by authors
This project aims to improve the customer experience as a result of offering consumers a
more personalized service based on the application of the results of consumer behavior analysis,
namely, as a result of consumer clustering and the creation of a recommendation system. Thus,
in order to remain the global market leader and offer consumers wider range of high-quality
services that will deepen the personalization of the shopping process and strengthen the
company's relationship with consumers, L'Oréal plans to be more proactive in understanding
customers’ needs, make interaction with consumers data-driven and implement relevant
approaches and modern technological instruments.
Based on the given characteristics of our clients and the potential recommended solution
they might like, we have come up with several most likely factors influencing the company’s
KPIs, mentioned in the beginning of the paper. Generally, there are three groups of anticipated
benefits, following the implementation of the recommender and the prediction system:
82

1) Direct financial benefits gained through average cheque increase
Increased average cheque due to adding to the shopping cart some more items by those
users, for whom the recommendations seemed to be persuading and fitting enough. This is the
direct financial benefit, which affects the revenues straight away. However, until the very
implication of the model by the company, or testing the viability of the implementation by A/B
testing, it is impossible to estimate financial benefits exactly because without testing on real
users, we will not be able to find out if the user has purchased the recommended product or not.
Therefore, we will focus on the approximate evaluation. The approximate level of financial
advantages can be estimated through assuming some of the factors and relying on the industrial
experience in applying similar models.
So, with the representatives of the L’Oréal company it was fixed that the
recommendation would include two additional goods to what the person’s already included into
the shopping cart. We assume that out of two at least one would fit a buyer’s desires and will be
chosen by him or her. The average number of items in an order by month, calculated on the basis
of historical data provided by L’Oréal, can be found below (Table 4):
Table 4
Number of items per order
Month
Year Jan Feb Mar Apr May Jun Jul Aug Sep Oct Nov Dec
2015 - - - - 4 4 6 6 6 7 7 7
2016 7 6 6 7 6 6 5 5 6 6 5 5
2017 5 5 6 6 6 5 5 5 5 5 5 5
2018 5 5 6 5 5 5 6 7 7 6 6 6
2019 6 7 6 6 7 7 7 7 7 6 6 6
2020 7 7 8 6 - - - - - - - -
For the calculation purpose it was decided to use the average number of 5.7 items per
cheque. The expert judgement of the L’Oréal company’s representative combined with the
experience of “in the fields” work for offline shopping points suggests that recommendations
tend to be declined by the clients in 4 cases out of 5, meaning that the percentage of accepted
recommendations is 20%.83
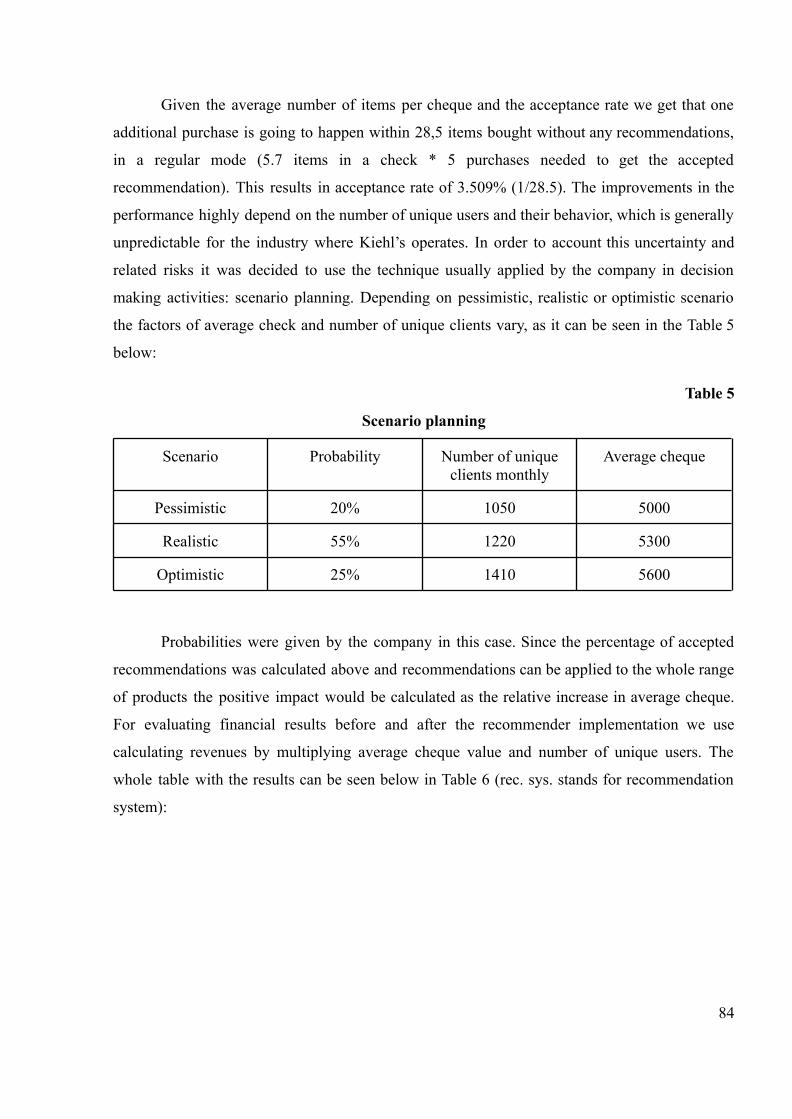
Given the average number of items per cheque and the acceptance rate we get that one
additional purchase is going to happen within 28,5 items bought without any recommendations,
in a regular mode (5.7 items in a check * 5 purchases needed to get the accepted
recommendation). This results in acceptance rate of 3.509% (1/28.5). The improvements in the
performance highly depend on the number of unique users and their behavior, which is generally
unpredictable for the industry where Kiehl’s operates. In order to account this uncertainty and
related risks it was decided to use the technique usually applied by the company in decision
making activities: scenario planning. Depending on pessimistic, realistic or optimistic scenario
the factors of average check and number of unique clients vary, as it can be seen in the Table 5
below:
Table 5
Scenario planning
Scenario Probability Number of uniqueclients monthly
Average cheque
Pessimistic 20% 1050 5000
Realistic 55% 1220 5300
Optimistic 25% 1410 5600
Probabilities were given by the company in this case. Since the percentage of accepted
recommendations was calculated above and recommendations can be applied to the whole range
of products the positive impact would be calculated as the relative increase in average cheque.
For evaluating financial results before and after the recommender implementation we use
calculating revenues by multiplying average cheque value and number of unique users. The
whole table with the results can be seen below in Table 6 (rec. sys. stands for recommendation
system):
84
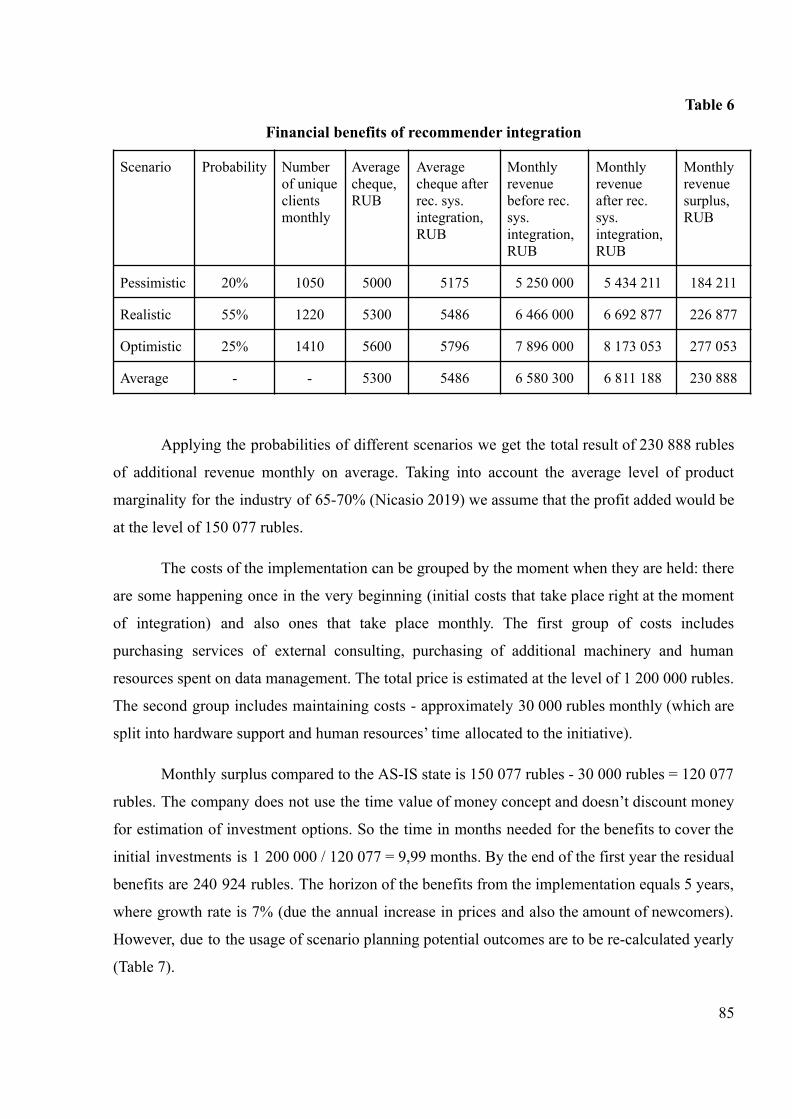
Table 6
Financial benefits of recommender integration
Scenario Probability Numberof uniqueclientsmonthly
Averagecheque,RUB
Averagecheque afterrec. sys.integration,RUB
Monthlyrevenuebefore rec.sys.integration,RUB
Monthlyrevenueafter rec.sys.integration,RUB
Monthlyrevenuesurplus,RUB
Pessimistic 20% 1050 5000 5175 5 250 000 5 434 211 184 211
Realistic 55% 1220 5300 5486 6 466 000 6 692 877 226 877
Optimistic 25% 1410 5600 5796 7 896 000 8 173 053 277 053
Average - - 5300 5486 6 580 300 6 811 188 230 888
Applying the probabilities of different scenarios we get the total result of 230 888 rubles
of additional revenue monthly on average. Taking into account the average level of product
marginality for the industry of 65-70% (Nicasio 2019) we assume that the profit added would be
at the level of 150 077 rubles.
The costs of the implementation can be grouped by the moment when they are held: there
are some happening once in the very beginning (initial costs that take place right at the moment
of integration) and also ones that take place monthly. The first group of costs includes
purchasing services of external consulting, purchasing of additional machinery and human
resources spent on data management. The total price is estimated at the level of 1 200 000 rubles.
The second group includes maintaining costs - approximately 30 000 rubles monthly (which are
split into hardware support and human resources’ time allocated to the initiative).
Monthly surplus compared to the AS-IS state is 150 077 rubles - 30 000 rubles = 120 077
rubles. The company does not use the time value of money concept and doesn’t discount money
for estimation of investment options. So the time in months needed for the benefits to cover the
initial investments is 1 200 000 / 120 077 = 9,99 months. By the end of the first year the residual
benefits are 240 924 rubles. The horizon of the benefits from the implementation equals 5 years,
where growth rate is 7% (due the annual increase in prices and also the amount of newcomers).
However, due to the usage of scenario planning potential outcomes are to be re-calculated yearly
(Table 7).
85

Table 7
Financial benefits over a five-year perspective
Period 1 2 3 4 5
Average cheque growth - 6% 6% 6% 6%
Number of clients growth - 4% 5% 6% 6%
Additional profit 240 924 1 588 475 1 767 972 1 986 494 2 232 024
Cumulative additional profit 240 924 1 829 399 3 597 371 5 583 864 7 815 889
As it can be seen from Table 7, cumulative financial benefits on the horizon of 5 years result in 7
815 889 RUB.
2) Benefits gained through decrease marketing costs
Since the company now has a better understanding of whom they focus while targeting
activities, the cost of marketing campaigns is expected to decrease. The second model (purchase
predictor) gives the chances of the customers to make an order in the upcoming month, in
percent. We consider the person is about to make an order when this probability reaches 50%
(which is a flexible cut off that can be tuned up to the needs of business). However, facing the
probability which is high enough means that the person is already pretty much likely to make an
order next month, so targeting him as a part of the marketing campaign can be redundant. The
level of “already likely to buy a product” is defined by the company and equals 80%.
Therefore, for conducting targeting activities we can use the database that consists of
consumers showing readiness to buy between 50% and 80%, as we find them the most
appropriate audience for the targeting activities. Judging by the prediction results on the listed
above set of factors - the number of these users is around 90. And this is out of 1200-1300
customers that were about to be targeted since they’ve bought something the previous month.
The estimated cost of one client attraction within the whole set of marketing activities by the
company is around 30 rubles (this value is provided by L’Oréal), which results in 30 rubles*1200
= 36 000 rubles monthly. If only 90 clients are targeted, then the total cost is 30 rubles*90 =
2700 rubles, which gives a difference of 33 300 rubles. However, the boundaries of the interval
within which the customer is considered to be worth targeting can be tuned.
86

One of the advantages of the predictor implementation is that it does not imply any
serious technical costs, since it can be recalculated once in a month when marketing activities are
planned in a manual mode using the same code.
On the horizon of the same 5 years it results in 2 204 390 rubles of saved money. Still the
parameters and characteristics of the chosen segment of clients could be tuned in accordance
with business objectives. The whole dynamics yearly can be seen on the Table 8 below.
Table 8
Calculating marketing cost savings over a five-year perspective
Period 1 2 3 4 5
Number of clients targeted beforethe implication 1200 1248 1310 1389 1472
Percent of clients targeted 0,075 0,075 0,075 0,075 0,075
Cost per client, in rubles 30 30 30 30 30
Cost savings 399 600 415 584 436 363 462 545 490 298
Cumulative cost savings 399 600 815 184 1 251 547 1 714 092 2 204 390
3) Non-financial benefits
The third group of benefits is non-financial, which still influence the overall performance
of the company in the market, since it can help L’Oréal attract new customers more efficiently
and also maintain relationships with the existing ones. This group of metrics affected by the
implication include:
● Customer satisfaction index increase - improving the customer journey through
personalization thanks to the recommendation system has a potential to increase customer
satisfaction score (CSAT), which is ine of the KPIs of L’Oréal. According to the company
representative’s estimation, a greater involvement of consumers in the purchase process
and a positive reaction to the recommendation of products suitable for the individual
requirements of each client can increase this metric by up to 10%;
● Retention rate increase - accroding to information given by the L’Oréal company
representative, at the moment retention rate is about 40%. This metric is expected to grow
after the recommender integration, since due to better personalization the customer's87

motivation to use another store is reduced, since it is the Kiehl's online store that
“understands” the consumer well and knows exactly what the customer wants and can
promptly recommend a product that the customer is likely to like and buy;
● Net promoter score increase - as the cases of implementation of recommendation
systems by large retail companies show, such systems can significantly increase
consumer loyalty to the brand, thus increasing NPS by up to 15% and amplifying the
number of positive reviews about the brand from the client in front of his friends and
family.
3.6. Future implementation process
The results, along with Python 3 code and cost benefit calculations, were transferred to
L'Oréal. The company gratefully accepted the results, highly appreciated the work done,
emphasized the importance of our achievements, and expressed this in a the Thank you letter
(Appendix 1).
Implementation of the clustering results, recommender or the predictor involves 2 huge
technical areas: applicability and IT-integration. While the first area is mainly associated with the
consumer's perception of the results of the recommender (less related to the predictor), the later
is more about managing dataflow in the company.
Applicability
The first step in implementation of the consumer clustering and recommender created and
described above is identifying whether there is a reaction of buyers to innovations and if so, is
this reaction positive for consumers (in terms of customer experience) and for the company (in
terms of economic benefits). This is typically done through A/B testing. Let us consider the
procedure for conducting this test using the example of a recommendation system (to check the
correctness of clustering, the procedure will be similar).
In the case of Kiehl’s the design of A/B testing would depend on the chosen mean of
delivery of the “message” to the client. With the assistance of the company’s representative it
was chosen to apply recommendations directly to the user shopping cart once. Another option
was to chose similar goods in the product card, as shown in the reference below:
88
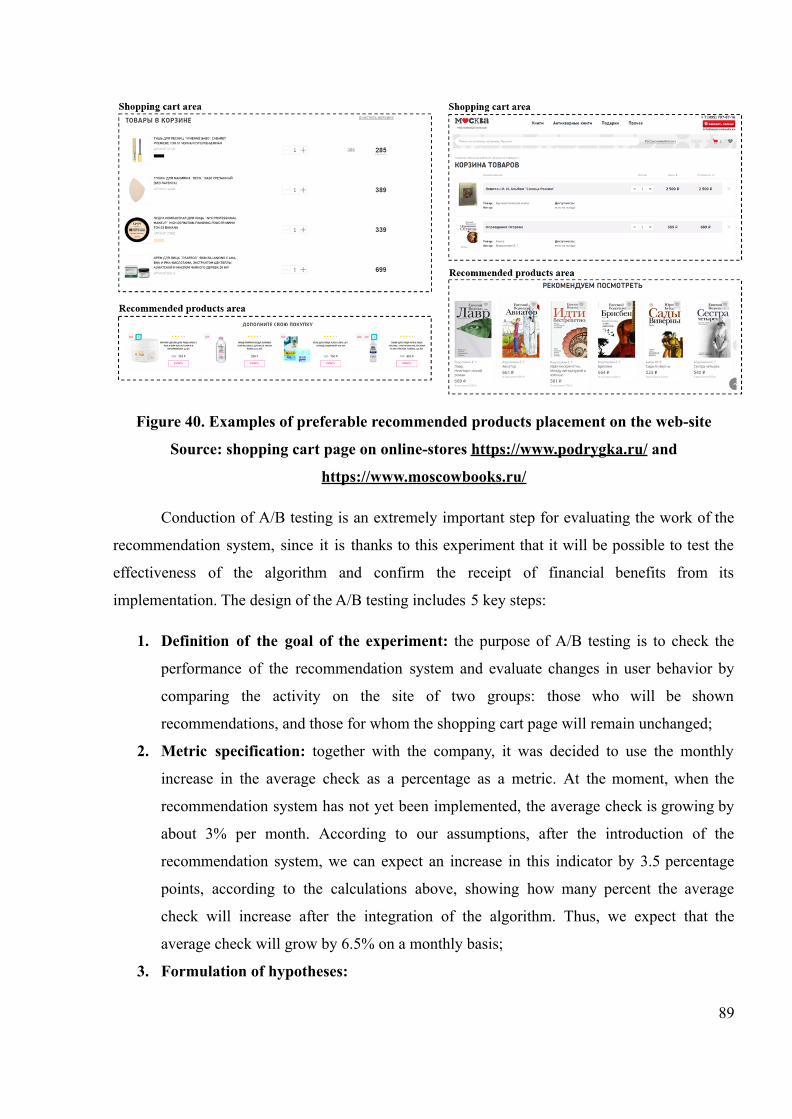
Figure 40. Examples of preferable recommended products placement on the web-site
Source: shopping cart page on online-stores https://www.podrygka.ru/ and
https://www.moscowbooks.ru/
Conduction of A/B testing is an extremely important step for evaluating the work of the
recommendation system, since it is thanks to this experiment that it will be possible to test the
effectiveness of the algorithm and confirm the receipt of financial benefits from its
implementation. The design of the A/B testing includes 5 key steps:
1. Definition of the goal of the experiment: the purpose of A/B testing is to check the
performance of the recommendation system and evaluate changes in user behavior by
comparing the activity on the site of two groups: those who will be shown
recommendations, and those for whom the shopping cart page will remain unchanged;
2. Metric specification: together with the company, it was decided to use the monthly
increase in the average check as a percentage as a metric. At the moment, when the
recommendation system has not yet been implemented, the average check is growing by
about 3% per month. According to our assumptions, after the introduction of the
recommendation system, we can expect an increase in this indicator by 3.5 percentage
points, according to the calculations above, showing how many percent the average
check will increase after the integration of the algorithm. Thus, we expect that the
average check will grow by 6.5% on a monthly basis;
3. Formulation of hypotheses:
89

using a recommendation system will not lead to an increase in the monthly average𝐻0:
check, that is, consumer behavior will remain the same in groups A and B;
using a recommendation system will increase the monthly average check, that is, the𝐻𝑎:
behavior of consumers in groups A and B will be different.
In our case, a one-tailed test will be enough to determine the change, so it will be used;
4. Preparing for the experiment: first of all, together with the IT department of the
company, a version of the site will be created, on which recommendations will be issued
by the algorithm. Consumers will randomly see versions A and B. Then, it is necessary to
calculate the approximate size of the testing sample (Noordzij et al. 2010). We are going
to use the standard formula here for one-tailed tests as the formula (8) depicts:
, (8)𝑛 = (𝑍
α+ 𝑍
1−β)2*(𝐴𝐶𝐼
𝐵*(1−𝐴𝐶𝐼
𝐵)+(𝐴𝐶𝐼
𝐴*(1−𝐴𝐶𝐼
𝐴))
(𝐴𝐶𝐼𝐵
−𝐴𝐶𝐼𝐴
)2
where and stand for average cheque increase for groups of people to whom𝐴𝐶𝐼𝐴
𝐴𝐶𝐼𝐵
recommended results are shown (B group) and to whom no recommendations are given
(A group). and are fixed for specific p-value and statistical power. Usually in𝑍α
𝑍1−β
academic works and in business cases the p-value of 5% and statistical power of 80% are
taken meaning that =1,65 and = 0,84.𝑍α
𝑍1−β
Using the formula, we have calculated the approximate size of the test sample is about
455 consumers. Taking into account that the average number of clients monthly visiting
the website is about 1200, and we will show recommendations only to 30% of the
audience (by agreement with L’Oréal), A/B testing will last a little more than a month
(about 38 days).
5. Analyzing results: based on the obtained experimental data, the selected metric will be
calculated, that is, the percentage increase in the average check, for samples A and B.
After that, we will determine the difference between us, and also identify whether the
difference is related to the recommendation system or is caused by chance or natural
changes. This will be determined by comparing the test statistics (and the resulting
90

p-value) with the chosen significance level (the p-value in our case is 5%). If the p-value
of the difference is less than the significance level, then we would reject the null
hypothesis and accept the alternative hypothesis that the recommendation system actually
allows you to increase the average check.
Integration
Integrating a complex technical solution into the company’s environment is both a
complicated and effort-consuming solution. At the moment the authors together with L’Oréal
representative and the company IT department are designing the target architecture (both IT and
business) for this transition through identifying the gap. These activities also include creating
logical data model and conceptual data model, creating business and functional requirements and
compiling everything into an action plan. Other plans for further analysis include attempts to
combine the two models on a specialized IT-platform that allows the company to integrate the
models into the existing strategic routes and enhance abilities to reach what’s planned in the
nearest future.
3.7. Conclusion
In accordance with the stated in the beginning of the research questions the analysis of
the Kiehl’s brand’s consumers was performed in terms of opportunities of advanced
customization techniques.
Firstly, the several clusters of customers were identified based on their peculiarities, this
step allowed us to answer the third research question “What similarities can be found in Kiehls’
consumer behavior, and how can we use this to make the customer experience more
personalized?”. It technically required investigation of categorical data provided on the clients
and application of several different tools and approaches, including Hierarchical clustering
(agglomerative) with SciPy and Partitional clustering (K-means) with Scikit-learn. As a result,
the allocation of the customers by the clusters was comprehended through the main division
factors (age, income level, ordering time, variability of product formats and purposes, and
others). Understanding of these factors gives the brand of Kiehl’s a hand in establishing new
campaigns and understanding of their target audience and their specifics which must be a
powerful knowledge for future development.
91

Then the recommendation system was built and the positive answer to the fourth research
question “Is it possible to recommend to Kiehl’s customer an item from the proposed range of
products that is likely to be bought?” was found. The initial idea of building a recommender
found its application in the form of building a collaborative filtering approach and processing the
data on the orders history to track consumers’ similarities and based on these similarities identify
the extra items, which also might be liked by the clients. The technical considerations of the
work involved building a LightFM model using the Jupyter notebook in Python as the main tool
of these analyses. Required data preprocessing was also a complicated process that demanded
several steps of feature engineering. Final result of the recommender was tuned in accordance
with business objectives introduced by the Kiehl’s representative. The overall performance of the
model demonstrated a high AUC score and also was highly estimated by the company’s
representative. Further company’s plan also involves implementations of the recommender with
the technical help of the team and also might involve designing of both technical requirements
and target architecture which is also applicable in this case. The model is planned to be
constantly dynamically updated and trained to show consistent and reliable results.
The third section of the chapter was connected with the prediction of purchases allowing
the team to answer the fifth research question “How, based on the previous purchase history,
identify if Kiehl's client is about to make an order within the next period (one month)?”. For this
reason the special grid was constructed with several extra parameters calculated as lags (on
different horizons of retrospective approach) and a huge number of non-purchase features were
artificially created to make the classifier. An industrial standard of CatBoost was chosen for
solving the task. As a result, an AUC score of almost 0.76 was demonstrated when testing the
model which is pretty high for this kind of task. The classifier would also be applicable for
solving the company’s everyday task and could also be combined with the recommender to give
the solution an ability to give recommendations timely.
Finally, the process of achieved results implementation by the company was described.
Then, on the example of using the recommendation system the three groups of benefits were
discussed. First of all, direct financial benefits estimation demonstrated that the introduction of a
recommendation system will pay off in about 10 months, bringing a monthly surplus of more
than 120 thousand rubles. According to our estimates, in a five-year perspective, the use of the
recommendation system will allow the company to receive about 7.8 million rubles of additional
profit. Further, we assessed how the recommendation system, by personalizing the purchase
92

process, can reduce marketing costs and found that in 5 years L’Orèal can achieve savings in
marketing costs in the amount of 2.2 million rubles. Finally, based on well-known business cases
analysis, together with a company representative, we determined that the use of a
recommendation system would allow obtaining non-financial benefits by increasing customer
satisfaction index, retention rate and net promoter score. The results obtained have been
demonstrated by L'Oréal. We received positive feedback and the Thank you letter (Appendix 1)
from the company.
93

CONCLUSION
1. Theoretical implications
All things considered, customer analysis, taking different forms and conducted by
numerous means and tools, is one of the biggest trends in any industry, with retail being not an
exception. Customers’ requirements toward service grow and business has to adopt its methods
in order to be able to provide a client with some tailor-made options to choose from. Moreover,
the whole process of consumers’ analysis tends to be an easier procedure now, since cheaper
methods of storage and data processing are available, sufficient volume of data generated and
existing cases of successful implication give one a chance to estimate and understand this
possibility better. This would mean, in practice, that any user-based experience could be in some
way analyzed to create a customized approach which would serve the lasting objectives of the
business.
Within the theoretical part of the research the main focus was placed on investigation of
consumer behavior analysis, where the main frameworks and concepts of different industries
were analyzed in order to identify how the analytical techniques and comprehensive data
analytics could be integrated into business techniques and used methods in order to build a better
solutions for both the business side itself and clients of the business.
In this part consumer behavior was mainly defined as a set actions a particular consumer
might perform with a product and service and also a respective set of attributes that might occur
when making a particular action or decision, including socio-cultural, personal and
psychological. This was estimated to have a noticeable impact on the techniques the businesses
use (pattern recognition, trend detection and revealing of any correlations) to affect their KPIs
positively (which can be represented by a wide range of factors, from sales revenues or profits,
to customer satisfaction index, retention rates and net promoter score, depending on particular
task a company sets). The diversity of factors also proved the outcomes which improve the
performance in different functional areas, such as marketing, sales and merchandising,
operations and logistics. So, that proved that the role of client analysis can not be overestimated
within the context of a retail company. Although the cases of implementing cush a kind of
customization ML-based solution, the project was designed to be the first related analysis created
specially for the Kiehl’s brand of the L’Orèal company, where the former has never applied
anything like this. Academic perspective of the research gap was mainly explained by the94

absence of links between existing theoretical concepts and in-depth analysis of Russian FMCG
companies, thus making the specific market of related Russian companies completely uncovered
by any researchers. From the business side, the gap was mainly introduced by the fact that the
particular brand Kiehl’s has never implied any advanced analytical tool in order to bring an
impact on the performance (financial as well) and the whole research would have had a chance
to give new insights on the company’s potential development. To set a direction for the further
investigation there were five research questions established. Firstly, “What are the main features
and areas of application of consumer behavior analysis in today's business environment?”. This
question is set to identify the feasibility of application of ML-based tools in consumer-related
issues. Secondly, “What methods are used to solve the problems of consumer behavior analysis
and what methods can be chosen for Kiehl's case?”, that serves for finding a set of solutions used
for solving similar problems in the market, which is aiming at finding the most applicable one.
Moreover, “What similarities can be found in consumer behavior, and how they can be used to
make the customer experience more personalized?”, answer for which would mainly reveal the
characteristics and traits of the customer that would be later used for more specified attitude and
communication of the messages. Furthermore, “Is it possible to recommend to Kiehl’s customer
an item from the proposed range of products that is likely to be bought?”, which would give the
company a chance to boost sales to some extent by adding to the orders exactly what a client
might desire. Finally, “How, based on the previous purchase history, identify if the client is about
to make an order within the next period (one month)?”, which matters since the possibility of
better planning in case some behavioral patterns are revealed.
Furthermore, it was identified that the only sufficient source of understanding the patterns
of customer behavior is one using machine learning technology, due to exceeding volumes of
data and necessity to keep the whole dataset updated always. Several possible implementations
in the sphere were analyzed, as well as the ML-based characteristics like structure of the data,
diversity of sources and basement of the model. As a result, the spectrum of ML-based decisions
which would be applicable for a retailer case was defined by the following directions: dynamic
pricing with ability to flexibly bill different client groups, clustering of customers in order to
split then into more narrow groups to sequentially concentrate efforts on each segment more
specifically and do what they want, recommendation system, which would understand to some
level of details specifics in behavior of a client and allow the company to offer this client
something he or she would really love to purchase and, finally, order predictor, which could
95

identify if the client is highly likely to make another order in the nearest future (the period
defined by the company). Thus, the answer for the first research question “What are the main
features and areas of application of consumer behavior analysis in today's business
environment?” is given, as these materials reveal the main application areas of the discussed
advanced techniques). To support the usage of these technologies, the number of representative
cases was introduced - a range of companies like P&G, Apotek Hjartat, Google, Netflix,
Amazon, Alibaba and Unilever implemented some tools as a way to personalization of user
experience and gained both popularity and high-image perception among target audience and
financial benefits as a following result. This is estimated within the context of this research as an
evidence of real practical value anticipated for the implementing organizations. However, a set
of restrictions to the data-based machine learning tools was found, which implies high
requirements to data quality, data sparsity, balanced complexity, ethical aspects and finding the
needed balance between in-depth detailed analysis and processing under limited finances. There
was also a list of problems, which, according to different sources act as the main issues to handle
while analyzing (cold-start problem, shilling attacks, implicity of data and also scalability
problem). This findings based on in-depth literature review and case analysis enabled the
researchers to find the answer for the second research question “What methods are used to solve
the problems of consumer behavior analysis and what methods can be chosen for Kiehl's case?”,
also the existing constraints demonstrated the particular moments to pay attention to while
choosing the proper method.
Then, in order to find all the needed prerequisites for empirical research and build the
basis for implication the research explored existing technical specifics and most relevant options
of execution for each of the solution that might be offered for the Kiehl’s (clustering,
recommendation system and order prediction, dynamic pricing was eliminated out of the list
since another pricing algorithms are already being used in L’Orèal and won’t be changed in the
nearest future). There’s a variety of different approaches to clustering, building the recommender
and predicting orders, which gives the business, in practice, a chance to choose the best suitable
option for their tasks and specifics of the information they work with. It has also given the team
a chance to apply the above-mentioned models for the L’Orèal’s case with the highest possible
level of adjustments and tuning, to make the tailor-made solution for the company.
2. Empirical implications
96

The work conducted in this particular part of the project allowed the researchers to apply
explored theoretical models and concepts within the real business conditions and constraints
imposed by the retail market and company’s capabilities. The set of interaction activities as well
as data provided by the company’s representatives built a strong base for understanding the
company’s strategic alternative and set a plan of how business analysis and related activities can
be built in the future. Constructed customer journey map has revealed that the recommendations
and predictions impact the stage of loyalty and advocacy, thus, leading to higher retention, net
promoter score and customer satisfaction among the non-financial factors involved.
Conducted preliminary data analysis of three provided documents (regarding orders
made, SKUs ordered and also customers and their details) revealed some general patterns in the
behavior of the customers with drastic peaks in number of orders around celebration of big
holidays, allocation of orders by the month days with a higher pressure on a few last days on the
months, seasonality and overall growth of the order year-to-year. It also revealed a serious
portion of orders being cancelled which can also be an issue for further investigation. There was
also data compiled revealing a typical image of a buyer and a typical order (number of items,
price, regularity, delivery time and delivery method).
The first application area of advanced analytics was clustering, where a chosen methods
of hierarchical (agglomerative) clustering executed with SciPy and partitional clustering
performed in Scikit-learn split the client in somehow similar groups, introducing ordinary
buyers, casual fans, conditionally loyal and superfans which differ mainly by their purchasing
behavior and some demographics and, therefore, can be further treated in different ways by the
company which would allow Kiehl’s managers to make a more customer-oriented service or
even higher differentiation within its product range. This area of investigation practically
answers the third research question “What similarities can be found in Kiehls’ consumer
behavior, and how can we use this to make the customer experience more personalized?” -
showing the similarities within each of the 4 identified clusters of clients that would be then used
for personal approach regarding how and what they purchase, as well as who they are.
The second machine learning solution developed by the researchers presented a
recommender system that was set to give recommendations to the company’s clients based on its
assumptions of what they might like. Out of the range of models that find its implication in
different industries it was decided to take a closer look at collaborative filtering and user-based
97
approach where the users with similarities in their purchasing patterns as well as items similar in
the way they are consumed are placed closer one to another during the matrix factorization. As a
result of this method, the clients get recommendations based on what other users similar to them
prefer. Another thing worth mentioning is that often the method of recommender works with
explicit rankings or ratings, where customers generally evaluate some of the products they
consumed, but here it had to deal with another type of dataset which bears an implicit nature and
all the preferences were extracted through frequency with which the items were bought. As a
result of the method, based on the previous purchasing history, two additional products of
Kiehl’s (the number was tuned based on the business objectives of the brand and can be tuned
again in case of necessity). The model demonstrated accuracy high enough on the test sample
and also was estimated as promising by the company’s decision makers. The overall economic
effect of the solution exceeds 7.8 million rubles within the 5-year horizon with 120 077 rubles of
monthly extra profit. The model is now discussed within the company as to be included within
its strategy toward digitalization since the anticipated benefits satisfy the Kiehl’s requirements
for qualitative improvements in processes. This part is closely bonded with the fourth research
question “Is it possible to recommend to Kiehl’s customer an item from the proposed range of
products that is likely to be bought?” - proving that it’s more than feasible to draw a
recommendation for a customer out of the company’s product range that would fit in the client’s
preferences and potential desires. The managerial implications following this part give insights
on how to boost revenues suggesting clients what they might desire to get. This is also promising
for the clients which would also have a chance to get acquainted with products they might like
and also to feel treated in a special way.
The final part of the empirical ML application is order prediction, which is set to estimate
how likely is the particular client to make an order within the next period (one month in this
particular case). Technically this is done through creation of artificial non-purchase subsample
(since the data provided by the company evidently consisted only of purchase cases). The model
created takes so-called lag variables which represent average for some of the initial variables
(like sum of the check) calculated for some distant moment in the past over some horizon. This
method is usually used as some industrial standard when analysis takes into account order
history. Then the model based on CatBoostClassifier finds the most important features that can
influence the fact of order within the next month with the highest probability. Actually, the
design of the model allows to tune the values for customers which are considered to make a
98

purchase within the period, so some financial benefits can be achieved through eliminating from
marketing campaigns those who demonstrate too low likeliness to make an order (meaning that
the campaign would not help) or, controversially, too high (meaning that they would make an
order without any incentives). There’s high potential for further managerial implications and
extra value for the whole company. Currently the borders are set on the level of 50-80%
likeliness which would result in saving slightly more than 2.3 million rubles under sufficient
conditions. This model was also taken into consideration by the respective decision makers
within the company of Kiehl’s. And this method also reveals the answer for the fifth research
question “How, based on the previous purchase history, identify if Kiehl's client is about to make
an order within the next period (one month)?” - the feature importance found within this part of
the research reveals the set of characteristics that suggest that a person is about to make an order
within the planning horizon.
Thus, all the research questions set in the very beginning of the investigation were
covered in full with the help of theoretical bases applied for constructing a sufficient solution for
the Kiehl’s case, which proves the effectiveness of machine learning tools implication for
solving retail companies’ issues.
3. Research limitations
Although the models developed are taken into consideration for more detailed analysis
and further installation, there is a number of limitations specific for the whole research project.
Firstly, this investigation is linked with the particular case of the brand Kiehl’s and therefore,
adjusted to its specifics and tuned to all the parameters in accordance with the business.
Secondly, the models demonstrate high performance within the given data samples (on the test
subsample), but to ensure comparatively high performance on the real clients when the model is
out for general use, the A/B testing is required. This project revealed the likely design of the test,
but the corporate compliance did not allow to conduct this within the short term of the research,
so this is the plan for the next collaboration stage with the company. Moreover, application of
such an analytical tool as recommender or predictor triggers several serious changes within the
IT-infrastructure used and general layout of business architecture, however, these adjustments
present a topic for a completely new discussion that would rely on another research which is not
covered by the existing investigation. Finally, since the data was provided by the company of
99

Kiehl’s, all the possible variables and their combinations are based on the given dataset which
also implies some limitations.
All the areas mentioned above tend to be very likely areas for further research that would
base on the current implications and findings of this paper. The brand Kiehl’s expresses its
gratitude (Appendix 1) and is highly interested in continuity of the research.
100

LIST OF REFERENCES
1) Alibaba Cloud. 2020. Basic Concepts and Architecture of a Recommender System.
Retrieved from:
https://wwwbasic-concepts-and-architecture-of-a-recomm.alibabacloud.com/blog/ender-syst
em_596642
2) Alpaydin, E. 2014. Introduction to Machine Learning, Third Edition. The MIT Press.
Retrieved from: http://library.books24x7.com.ezproxy.gsom.spbu.ru/toc.aspx?bookid=73664
3) Amatriain, X. and J. Basilico. 2013. System Architectures for Personalization and
Recommendation. Netflix Technology Blog. Retrieved from:
https://netflixtechblog.com/system-architectures-for-personalization-and-recommendation-e
081aa94b5d8
4) Bradlow, E., Gangwar, M., Kopalle, P., Voleti, S.. 2017. The role of big data and predictive
analytics in retailing. Journal of Retailing 93(1): 79-95. Retrieved from:
https://mycourses.aalto.fi/pluginfile.php/559125/mod_resource/content/1/Big%20Data%252
c%20Journal%20of%20Retailing%252c%202017.pdf
5) Bryan, K. 2019. P&G Shifts To Propensity Marketing, Leveraging Massive First-Party
Database. Digital Media Solutions. Retrieved from:
https://insights.digitalmediasolutions.com/articles/procter-gamble-q4-2019-results
6) Burke, R. 2007. Hybrid web recommender systems. The adaptive web: 377-408. Retrieved
from: https://link.springer.com/chapter/10.1007/978-3-540-72079-9_12
7) Calciu, M., Moulins, J., Salerno, F. 2018. Big Consumer Behavior Data and their Analytics:
Some Challenges and Solutions. Academy of Marketing Science World Marketing Congress,
Springer: 35-48. Retrieved from:
https://proxy.library.spbu.ru:2096/chapter/10.1007/978-3-030-02568-7_13
8) Carrasco, O. 2019. Gaussian Mixture Models Explained: From intuition to implementation.
Towards data science blog. Retrieved from:
https://towardsdatascience.com/gaussian-mixture-models-explained-6986aaf5a95
9) Charles, G. 2014. Change4Life enlists Unilever, Pepsi Max and Asda for healthy living
“Smart Swap” campaign. Campaign. Retrieved from:
https://www.campaignlive.co.uk/article/change4life-enlists-unilever-pepsi-max-asda-healthy
-living-smart-swap-campaign/1225714
10) Cramer-Flood, E. 2021 Global Ecommerce Update 2021. eMarketer report. Retrieved from:
101

https://www.emarketer.com/content/global-ecommerce-update-2021
11) Conroy, P., Porter, K., Nanda, R., Renner, B., Narula, A. 2016. Consumer Product
Trends–Navigating 2020. Deloitte University Press. Retrieved from:
https://www2.deloitte.com/content/dam/Deloitte/uk/Documents/consumer-business/deloitte-
uk-cpg-trends-2016.pdf
12) Coppola, D. 2021. E-commerce worldwide - Statistics and Facts. Statista. Retrieved from:
https://www.statista.com/topics/871/online-shopping/#:~:text=As%20internet%20access%2
0and%20adoption,3.5%20trillion%20U.S.%20dollars%20worldwide.
13) Davey, K. 2018. Artificial Intelligence and Machine Learning: In retail and CPG, AI and
ML have permeated the entire business planning process. Retail Leader 8(2): 12-13.
14) Dekimpe, M. 2020. Retailing and retailing research in the age of big data analytics.
International Journal of Research in Marketing 37(1): 3-14.
15) El Bouchefry, K., de Souza R. S. 2020. Learning in Big Data: Introduction to Machine
Learning. Knowledge Discovery in Big Data from Astronomy and Earth Observation,
Elsevier: 225-249.
16) Fenech, C., Perkins, B. 2015. Made-to-order: The rise of mass personalisation. The Deloitte
Consumer Review: 4-21. Retrieved from:
https://www2.deloitte.com/ch/en/pages/consumer-business/articles/made-to-order-the-rise-of
-mass-personalisation.html
17) Frasquet, M., Ieva, M., Ziliani, C. 2021. Online channel adoption in supermarket retailing.
Journal of Retailing and Consumer Services (59): 102374.
18) Gartner release. 2020. Gartner Says Growth Companies Are More Actively Collecting
Customer Experience Data Than Nongrowth Companies. Gartner. Retrieved from:
https://www.gartner.com/en/newsroom/press-releases/2020-03-31-gartner-says-growth-comp
anies-are-more-actively-collecting-customer-experience-data-than-nongrowth-companies
19) Gomez-Uribe, C., Hunt, N. 2015. The netflix recommender system: Algorithms, business
value, and innovation. ACM Transactions on Management Information Systems (TMIS) 6(4):
1-19. Retrieved from: https://dl.acm.org/doi/pdf/10.1145/2843948
20) Gomzin, A., Korshunov, A. 2012. Time-sensitive collaborative filtering [In Russian].
Lomonosov Moscow State University.
21) Google Cloud. 2020. Google Cloud Helps Power More Personalized Experience for Procter
& Gamble Consumers. Google Cloud Press Release. Retrieved from:
https://cloud.google.com/press-releases/2020/0714/google-cloud-procter-gamble-consumers
102

22) Holý, V., Sokol, O., Černý, M. 2017. Clustering retail products based on customer behavior.
Applied Soft Computing 60: 752-762.
23) Hodgson, E. 2020. K-Means Clustering And Why It’s Good For Business. dotActiv.
Retrieved from:
https://www.dotactiv.com/blog/why-k-means-clustering-is-good-for-business#:~:text=K%2
Dmeans%20clustering%20is%20an,strategically%20in%20the%20retail%20market.
24) Houston, M. 2016. Is ‘strategy’ a dirty word? Journal of the Academy of Marketing Science
44(5): 557-561.
25) Hwangbo, H., Kim, Y., Cha K. 2018. Recommendation system development for fashion
retail e-commerce. Electronic Commerce Research and Applications 28: 94-101.
26) Jao, J. 2013. Why big data Is A must In ecommerce. Big Data Landscape. Retrieved from:
http://www.bigdatalandscape.com/news/why-big-data-is-a-must-in-ecommerce
27) Khadeб A. 2016. Performing customer behavior analysis using big data analytics. Procedia
computer science 79: 986-992.
28) Khusro, S., Ali, Z., Ullah, I. 2016. Recommender systems: issues, challenges, and research
opportunities. Information Science and Applications (ICISA), Springer, Singapore:
1179-1189. Retrieved from:
https://www.researchgate.net/publication/303953909_Evolution_of_Recommender_Systems
_from_Ancient_Times_to_Modern_Era_A_Survey
29) Kietzmann, J., Paschen, J., Treen, E. 2018. Artificial intelligence in advertising: How
marketers can leverage artificial intelligence along the consumer journey. Journal of
Advertising Research 58(3): 263-267.
30) Kopp, M. 2013. Seizing the big data opportunity. Ecommerce Time. Retrieved from:
http://www.ecommercetimes.com/story/78390.html
31) Kotler, P., Armstrong, G. 2010. Principles of marketing. Pearson education: 254-271.
Retrieved from: http://library.wbi.ac.id/repository/212.pdf
32) Kuranov, A., Sendulskiy, A. 2020. Machine Learning in Retail: 5 juicy examples |
Technologies for business. MassMedia Group. Retrieved from:
https://massmediagroup.pro/en
33) Kutyanin A. 2017. Recommender systems: an overview of the main settings and results [In
Russian]. Intelligent systems. Theory and applications 21(4): 18-30.
34) Milano, S., Taddeo, M., Floridi, L. 2020. Recommender systems and their ethical
challenges. AI & SOCIETY 35(4): 957-967.103

35) Mobasher, B., Burke, R., Bhaumik, R., Sandvig, J. 2007. Attacks and remedies in
collaborative recommendation. IEEE Intelligent Systems 22(3): 56-63. Retrieved from:
https://www.researchgate.net/publication/3454466_Attacks_and_Remedies_in_Collaborativ
e_Recommendation
36) Moscato, P., De Vries, N. 2019. Business and Consumer Analytics: New Ideas. Springer.
37) Nicasio, F. 2019. Retail Benchmarks Report. Vend: 9. Retrieved from:
https://corp.vendcdn.com/Vend-Files/Vends-Retail-Benchmarks-Guide-2019.pdf
38) Noordzij, M., Tripepi, G., Dekker, F. W., Zoccali, C., Tanck, M. W., Jager, K. J. 2010.
Sample size calculations: basic principles and common pitfalls. Nephrology dialysis
transplantation 25(5): 1388-1393. Retrieved from:
https://academic.oup.com/ndt/article/25/5/1388/1842407
39) Omran, M., Engelbrecht, A., Salman, A. 2007. An overview of clustering methods.
Intelligent Data Analysis 11(6): 583-605.
40) Press, G. 2016. Cleaning Big Data: Most Time-Consuming, Least Enjoyable Data Science
Task, Survey Says. Forbes. Retrieved from:
https://www.forbes.com/sites/gilpress/2016/03/23/data-preparation-most-time-consuming-le
ast-enjoyable-data-science-task-survey-says/?sh=588d9e896f63
41) Rashid, A., Albert, I. 2020. Getting to know you: learning new user preferences in
recommender systems. Proceedings of the international conference on intelligent user
interfaces: 127-134.
42) Rokach, L., Maimon, O. 2005. Clustering methods. Data mining and knowledge discovery
handbook, Springer, Boston: 321-352.
43) Sahu, S. P., Nautiyal, A., Prasad, M. 2017. Machine Learing Algorithms for Recommender
System – a comparative analysis. International Journal of Computer Applications
Technology and Research 6(2): 97-100.
44) Sharma, R., Singh, R. 2016. Evolution of recommender systems from ancient times to
modern era: a survey. Indian Journal of Science and Technology 9(20): 1-12. - Retrieved
from:
https://www.researchgate.net/publication/303953909_Evolution_of_Recommender_Systems
_from_Ancient_Times_to_Modern_Era_A_Survey
45) Schütze, H., Manning, C., Raghavan, P. 2008. Introduction to information retrieval.
Cambridge: Cambridge University Press 39: 234-265.
46) Su, X., Khoshgoftaar, T. 2009. A survey of collaborative filtering techniques. Advances in
104

artificial intelligence. Retrieved from: https://www.hindawi.com/journals/aai/2009/421425/
47) Uzialko, A., Freedman, M. 2018. How businesses are collecting data (and what they're
doing with it). Business News Daily. Retrieved from:
https://www.businessnewsdaily.com/10625-businesses-collecting-data.html
48) Veres, Z., Tarjan, T., Hamornik, B. 2014. Product attribute preferences - A multidisciplinary
approach. European Scientific Journal 10(7). Retrieved from:
https://core.ac.uk/download/pdf/328024119.pdf
49) Vrancic, I. 2001. Pattern recognition approach to customer analysis. ISPA 2001. Proceedings
of the 2nd International Symposium on Image and Signal Processing and Analysis. In
conjunction with 23rd International Conference on Information Technology Interfaces:
325-329.
50) White, M. 2012. Digital workplaces vision and reality. Business Information Review 29:
205–214. Retrieved from: https://journals.sagepub.com/doi/abs/10.1177/0266382112470412
105

APPENDICES
Appendix 1. Thank you letter from L’Oréal
106