Embed Size (px)
Citation preview

A-1
����������
ANNEXURE I BASELINE ENVIRONMENTAL AND SOCIAL INFORMATION OF RIVER BASINS
CHENNAI BASIN
Demography
Chennai river basin consists of 11 taluks spread out in Tiruvellore, Vellore (part) and Kanchepuram(part) districts. There are 19 blocks covering the river basin within this, nearly 312 villages and 52 towns. According to 2001 population, the population concentration in villages is works out to be 6,62,320 and in urban areas (Chennai City, Municipalities and Townpanchayats) and total population located within 5 Km areas urban area 62,36,061, which shows high population concentration in Chennai river basin. Location
The Chennai basin is situated between latitudes 12º 40’N and longitudes 79º10’E and 80º25’E at the north east corner of Tamil Nadu. The basin area is 7,282 km2, out of which 5,542 km2 lie in Tamil Nadu limits and the remaining area lies in Andhra Pradesh limits. The present extent of Chennai city is 172sq km and the area covered by the Chennai Metropolitan area is 1167 sq kms. The length of the Chennai River basin is estimated to be about 329 Km, which passes through Tiruvallur, Kanchepuram(part) and Vellore (part)
Hydrology
Chennai River Basin consists of 4 important rivers i.e. Araniyar, Kosathalaiyar, Cooum and Adayar and each has its own sub basin to drain the surface runoff. Hydrogeology
The yield in the borehole in crystalline rock formation varies from 90 to 4541pm. In the Gondwana formations the yield of the well varies from 45 to 180 lpm. The yield in the tertiary formation varies from 68 to 90 lpm. The yield in quaternary formations varies from 158 lpm to 14900 lpm.
Ground water potential
The depth to ground water level in the different sub basins are in the range of 2 to 12m. Over the years, progressive lowering in the ground water level is observed in the lower reaches of the entire sub basin. The levels of groundwater in different sub basins are ranges from 2 to 12m. The total ground water potential of the basin is 1120 Mcum

A-2
Stage of Ground Water Exploitation
The level of water exploitation in the basin area over a period of time has been increased from 4 (dark areas) and 8 (> 100%) areas between 1997 and 2003. This has further defined into Critical and Semi critical zones, which indicate an alarming rate of 8 blocks.
Surface Water Potential
According to runoff coefficient of 0.15 adopted for plains for south-west and north east monsoon and based on the total surface water potential for 75% probably, the total Chennai basin has annual surface water potential of 784 MCM. Surface water potential during South west monsoon 248.0 MCM Surface water potential during North east Monsoon 422.0 MCM
Surface Water Quality
Based on the sample collected from BOD, heavy metals content, coliform content in the water collected from the Cooum, Adyar, and Buckingham canal are much in excess of permissible limits for domestic use. Pollution of surface water in Chennai City is very high due to addition of industrial and municipal waste.
Ground Water Quality
The general fall of groundwater level in Chennai basin group was observed to be 1m and 2m for 10 years and 20- years respectively. It is observed that the Chennai basin group is predominantly sodium chloride type. The ground water available in Chennai basin group is free from iron and fluoride. The nitrate content is seen in groundwater in the areas near Arakkonam.
Overall pH, Chloride, EC and TDS level exceeds in Cooum river and similarly, Kosathalaiyar water quality exceeds the limit in selected areas i.e. urban areas in North Chennai indicate the water quality level having high value of EC.
Industries
In Kosathalaiyar sub basin,out of the 96 industries ,nearly 50% of the industries are consuming less than 10 KLD of water for the industrial production. Some of the major chemical industries situated in Eranavur, Manali, Kosapur of Puzhal Block are utilizing 1000 KLD to 18000 KLD. Nearly 50% of industries are having trade effluent and 38 industries are having arrangement for treating the effluent and using it within their premises for various uses. Severe problem relating to air and water exit in North Chennai area i.e. Manali, Ennore areas. Tannery industry located in Chrompet area create pollution problem leading to contamination of groundwater in Pallavaram and Chrompet. Sewerage System

A-3
Chennai city’s sewerage system is serving for more than 41 lakhs population consists of a network of gravity sewers, force mains and pumping stations serving different parts of the city. Due to raw sewage inflow into the waterways level of B.O.D is very high in all river area within the city. Solid waste
In general, MSW is a continuous problem for all over India and TN is no exeption. The mix of sewage water into the system, spoils the environment at the tail end of the Cooum and Adayar rivers. Forest
The total area of forests located in the basin is 29,855 ha, which forms 5.1% of the total area. Flora and fauna details Guindy National Park, Arignar Anna Zoological Park and Pulicat lake Bird Sanctuary are some of the major spots in the basin.
Agriculture
The major crop is paddy as it occupies 69.3% of the gross cropped area. In the basin 3,66,858 tones of paddy, 5109 tones of oil seeds, 8206 tones of millets, 541 tones of pulses and 7,70,849 tones o-f sugarcane are produced on an average per annum.
Water weeds
It is observed from the field offices in Chennai Basin area that the aquatic weeds growth, ipomoea, locally known as Kadal Palai is found to be in almost 80% of the tanks. According to the officials the plant growth varies between 40% and 80% in various tanks. In general weeds growth restricts the water storage and loss in capacity of the tanks. There are nearly 47 tanks have been identified affected by the above weeds
Sedimentation
Siltation studies done in Kaveripakkkam tank show that average annual silt load is 0.0519 MCM/year and average annual silting rate is 0.0003228 MCM/Sq.Km. The studies done in Konasamudram tank show that annual rate of silting is 0.013 MCM.
Sand mining
Excess quarrying of sand from Cooum river near A.N.Kuppam anicut has resulted in washing away of anicut portion. The causeway near Tiruvallore Railway station across Cooum, the Karanodai Bridge across Kosathalaiyar in Chennai – Calcutta highway and the Tamaraipakkam anicut were affected due to excess sand quarrying.

A-4
Sea water intrusion
Seawater intrusion has started in many places, resulting in soil loosing their fertility and found uneconomical for cropping. Seawater instruction is noticed around Minjur belt, north of chennai and about 10000 ha. in Gummidipoondi, Sholavaram, and Ponneri blocks are affected.
Encroachments
River basin is being encroached for various kinds of activities;which includes urban activities, farming activities and industrial activities. Out of 1591 tanks in the basin, majority of the tanks are affected by encroachments near Arani, Periyapalayam, Pooneri and this may create the chances of occurrence of flood during monsoon period by arresting the free flow of water in the river
Fisheries
There are 58 Marine fishing villages are located in Thiruvallur district with a population of 55,000. The fisherman community use mechanised boats for their fishing activities and there are roughly 800 mechanised boats and 2500 Kattumarams are being used. Two fishing farms located in this region one at Pulicat and another at Chetpet using fresh water with a total production of 15,948 tonnes in the basin. Inland fishing is dominant in Kancheepuram district as there are 64 fisherman villages with a population of fisherman 45,000 identified in the district as per 2002 figures. The total production of fishing in Pulicat lake is 928 kg/ha. The Inland Fish production in Kanchepuram is 8221 Tonnes in 2002-01.
Adayar Estuary and Creek
Chennai is one of the few cities having an estuarine ecosystem. The Adayar creek is of a tidal type and a part of the natural estuarine ecosystem located right in the heart of the city. The Adayar river, of which the creek is a part, is highly polluted. But at the estuary there is still vegetation and nesting of migratory birds.
The ecological functions of a creek can be summarised as follows:
a)Acts as a natural flood control system b)Prevents storm damage by retaining storm water. c)Maintains water balance in the region. d)Is a nutrient-rich spawning ground for aquatic life. e)Provides visual contrast and diversity to the landscape. f)Cleans polluted water and prevents eutrophication. g)Supports biodiversity. Diseases
Acute Diarrhea is a major disease prevailing in the basin, however there are no deaths reported under this disease. In addition Dysentery and Jaundice is prevalent in

A-5
the basin (majority of the areas lies in Tiruvallur district) and few deaths reported due to Dysentery and Jaundice. This is due to contamination of sewage water and lack of knowledge with the people to boil and drink the water for safety reasons.
Sub Basins under IAMWARM for the 1st year
Araniyar, Kusathalaiyar, Cooum and Adyar River are the four important rivers in this basin, each having its own sub basin to drain the surface runoff.
Kosathalaiyar sub basin
The Kusathalaiyar River originates from the surplus waters of Kaveripakkam tank, which is one of the irrigation tanks supplied by Palar Anicut. Kesawaram anicut has been constructed across the Kusathalaiyar with a regulator to supply water to Cooum River. Nagari and Nandhi rivers are the tributaries of Kusathalaiyar just above Poondi reservoir. Chennai basin contains of 4-sub basin, Sathayamoorthy sagar, popularly known, as Poondi reservoir is the only reservoir constructed across Kusathalaiyar. Red Hills, Cholavaram and Chembarabakkam are the other reservoirs in this basin.
System deficiencies 1. Overall efficiency of tank irrigation system is 30-40%* 2. There is 15-20% reduction in tank storage capacity due to siltation 3. Poor water scheduling 4. Inadequate supplies produce water stress condition and yield is reduced. 5. Water losses due to unlined canals Proposed actions 1. Conjuctive use of surface and ground water 2. Renovating old tanks, desilting of ponds and supply channels and water harvesting 3. Crop rotation 4. Selective lining to canals where seepage loss is appreciable

A-6
PALAR RIVER BASIN
Demography
Palar river basin consists of 20 taluks spread out in Vellore, Kanchepuram and Tiruvanamalai districts. There are 45 blocks covering the river basin within these nearly 507 villages and 46 towns According to 2001 population, the population concentration in villages is works out to be 10,87,765 and in urban areas (Municipalities and Townpanchayats) is 15,12,565 and total population located within 5 Km areas is 25,00,3334, which shows quantum of population concentration near to palar river basin.
Location
The Palar river basin lies between 120 14’ N and 13037 N latitudes and 77048’40” E and 800 14’40” E longitudes. The total area of the basin is 18,300 km2 of which 10,910 km2 is present in Tamil Nadu. The basin area is spread in the districts namely, Vellore, Tiruvannamalai and Kancheepuram covering 4,710 km2, 4,013 km2 and 2,187 km2, respectively. The Palar river basin is bounded on its Northern side by the Swarnamughi river basin of Andhra Pradesh and the Chennai basin on the Northeastern side.
Hydrology
Palar River originates in Nandhi Durg, Kolar district in eastern part of Karnataka State at an elevation of 800m above MSL, which passes through the hilly terrain of south western part of Andhra Pradesh and enter into Tamilnadu on the west of Vaniyambadi town and flows through Vellore, Thiruvannamalai and Kancheepuram Districts and finally enter into Bay of Bengal near Sadarangapattinam The total length of the river is estimated to be about 350 Km.The important tributaries are Poiney, KavundinyanagaNadhi, Malattar, Cheyyar, Agaram, Kiliyar and Vegavathi
Geology
Palar river basin consists of hard crystalline rock masses of Archaean age in most of the basin area and sedimentary rocks of Gondwana, tertiary and quaternary age on the eastern part of the basin.

A-7
Hydrogeology
The hydrogeology of the Palar river basin is such that 87 % of the area under the basin is hard crystalline rock while the remaining 13 % is sedimentary. The general depth of the bedrock varies from 10 m to 60 m where crystalline formations are found. Ground water is found to occur in semi confined / confined or water table conditions.
Surface Water Potential
Palar river basin receives an average annual rainfall of 1039 mm. The Palar
River Basin having an annual potential of 1758 MCM and average annual flow into the sea works out to be 12.5 TMC. Ground Water Potential
The ground water potential of the basin is 2610.32 MCM.
Surface Water Quality
Analysis of water samples shows that during the flow pH, Electrical Conductivity, Total Hardness, Chloride and Coliform values are within the limits. Dissolved Oxygen falls below 5 mg/lit at places such as Koudanaya river, Nandhiyalam village, Rajakal head sluice, Mettur village and at stretches between Wallajabad to Asur due to mixing of Tannery effluent with water. This affects the aquaculture in the area. The river water is contaminated with domestic sewage. It is also found that Total Dissolved Solids is beyond the tolerable limit in tannery-polluted areas. Chloride is above the acceptable limit but below permissible limit. Total hardness fluctuates above and below tolerable limits and Biological Oxygen Demand is found to be very high in some head works.
Ground Water Quality
The ground water in Upper Palar basin is highly unsafe for domestic and irrigation purposes owing to the high chloride values which exceed the permissible limits. In Kamandala Naganadhi, Upper Cheyyar and Lower Cheyyar zone the salinity and chloride values are within the acceptable limits. In the Lower Palar zone comprising Wallajabad, Kanchepuram and Mamandur ground water contains high salinity and chloride caused by industrial and tannery effluents. Moderate salinity is observed in Kilsathamangalam, Nallulumalai, West Salai, Vendur and Thirukallukundram.
Industrial effluents have polluted ground water in Pernambut, Ambur, Thuthipattu and Vaniyambadi. The chloride concentration is of the order of 1000 mg / l against the standard of 250 mg / l. In certain packets at Pernambut, Ambur and Vaniyambadi irrigation water has high sodium concentration and is grouped under high saline and sodium water.

A-8
Industries
There are 120 large and medium scale industries and 11,000 small-scale industries are functioning in the basin area. This includes manufacturing of Textile, Wood, paper products rubber plastics, chemical, leather etc. There are sizable numbers of large scale industries are engaged in Leather, Automobiles, and Chemical products in this region. Vaniyambadi, Ambur, Arcot, Ranipet, Kanchepuram, Chengelput and Cheyyar. There are nearly 473 Tanneries are located in Vellore and Vaniyambadi region. Sewage and Solid waste
There are number of towns that are located all along the river course i.e.
Vaniyambadi, Ambur, Pallikonda, Vellore, Ranipet, Arcot, Gudiyattam, Peranambattu, Arani, Tiruvettipuram, Chengam, Kanchepuram, Ayyampettai, Walajabad, Chengalpattu etc. discharging heavy amount of untreated sewage water without any treatment into the river course and nearby water source. Dumping of solid waste along the river margins and tanks, which block the natural, recharge capacity of the water source.
Water weeds
Out of 661 tanks in the Palar Basin areas, it is identified that nearly 200 tanks
in the basin having weed growth for 80%.
Agriculture
Rice, Cholam, Cumbu, Ragi, Sugarcane, Pulses, Groundnut, Banana and Coconut, are cultivated extensively in Vellore district, while Cotton is cultivated in a few places. The total land used for cultivation of these crops is 2,76,062 ha. Rice, Ragi, Sugarcane, Pulses, Groundnut and Coconut are the major crops cultivated in Kanchepuram district. Land used for cultivation here is 2,324 ha which is comparatively lower than that used in Vellore District. The major crop in this river basin is paddy.
Seismic Zones
The basin area is falls under the Zone II of seismic zones classification. The basic seismic coefficient for Palar basin is 0.02 and the importance factor for all types of dams is 3. The design of dams and water retaining structures are based on IS: 1893 – 1984.
Forest
Forest Department records show a total extent of 1,92,461 ha under forests in the Vellore district. Among this area 89 % is Reserve forest, 2.6 % is Reserve Land and 8.4 % under unclassified forests. The total forest area in Tiruvannamalai district is 42,630.41ha. Kancheepuram district has a reserves forest area of 230.19 km2 while the reserved lands and unclassified forestlands are 5.61 km2 and 2.31 km2 respectively.

A-9
Sea Water Intrusion
Seawater intrusion is not predominant in the coastal area except some pockets near Kalpakkam, where the large-scale water extraction and sand mining activity trigger the factor of seawater intrusion especially in Vayallur areas in Thirukazukundrm block.
Sedimentation
Average annual rate of silting in the Uthiramerur tank, Maduranthakam tank, Dusi - Mamandur tank and Kalavai tank were 0.45 %, 0.051 %, 0.593 % and 2.37 % respectively. A loss of 37.63% and 16.24 % capacity were observed in the Maduranthakam tank and Uthiramerur tank in 1985 and 1987
Encroachments
Out of 661 tanks in Palar river basin, majority of the tanks are affected by encroachments. Damal tank is encroached by 25%. Dumping of Solid Waste is also one among the reasons for encroachment. Vegavathi river area near Ayyampettai encroached by 50%. River margins near Vellore, Ayyampettai, Wajajabad, Ambur, Vaniyambadi, Arni, Vandavasi and several other places are affected by encroachments. Fisheries
Inland and marine fishing are practiced in this basin. Brackish water fish farm at Vaninchavadi produce about 1 tonne /annum. Fishing in Kalavai Tank situated in Vellore district with fish production about 9000 tonnes. The marine fish production is estimated at 700 tonnes/annum.
Diseases
Acute Diarrrhoea Disese (ADD) is prevalent in all districts. Gastroenteritis is the most prevalent disease in Vellore and Thiruvanamalai districts. Malarial fever is also a common disease and Iodine Deficiency is a common problem in Vellore and Vaniyambadi region.
Sub basins under IAMWARM for the 1st year
Cheyyar Sub Basin Cheyyar sub basin originates from Javadhi hills and flow through
Thiruvannamalai and Kanchipuram districts and confluence with Palar near Thirumukkodal village in Walajabad. The maximum area is in Thiruvannamalai distict.The total area of the sub basin is 4311.88 sq.km. Cheyyar sub basin has 8 taluks i.e. Chengam, Thiruvannamalai, Aarcot, Cheyar, Polur, Uthiramerur, Vandavsi and Arni. There are 6 tributaries to the Cheyyar river and it has 2 reservoirs and 8

A-10
major anicuts. Paddy is the major crop in the sub basin. System deficiencies 1. Overall efficiency of tank irrigation system is 30-40% 2. There is 15-20% reduction in tank storage capacity due to siltation 3. Poor water scheduling 4. Inadequate supplies produce water stress condition and yield is reduced. 5. Water losses due to unlined canals Proposed actions 1. Conjuctive use of surface and ground water 2. Renovating old tanks, desilting of ponds and supply channels and water harvesting 3. Crop rotation 4. Selective lining to canals where seepage loss is appreciable Kliyar Sub Basin
Kliyar sub basin has four taluks i.e. Wandiwash, Uthirumerur,
Maduranthakam and Cheyyar. Wandiwash taluk consists Uthiramerur and Pernamallur blocks. Uthirumerur taluk consists of two blocks i.e. Kalasappakkam and Chetput. Maduranthakam taluk consists of Maudranthakam block and Cheyyar taluk consists of three blocks i.e. Lathur, Cheyyar and Anakkavur. System deficiencies 1. Overall efficiency of tank irrigation system is 30-40% 2. There is 15-20% reduction in tank storage capacity due to siltation 3. Poor water scheduling 4. Inadequate supplies produce water stress condition and yield is reduced. 5. Water losses due to unlined canals Proposed actions 1. Conjuctive use of surface and ground water 2. Renovating old tanks, desilting of ponds and supply channels and water harvesting 3. Crop rotation 4. Selective lining to canals where seepage loss is appreciable 5. Use of drip and sprinkler irrigation.

A-11
PENNAIYAR RIVER BASIN
Demography
The population, density of the basin is 4334 persons per sq.km. The literacy rate is 62.3% for male and 49.2% for female. The birth and death rates are 17.23 and 5.94 per thousand as per 2001 statistics. The distribution of population between urban and rural is 15% and 85% respectively. Agriculture is the main occupation of rural population. The farmers mostly depend on tank irrigation and well irrigation besides areas under projects like, Krishnagiri Reservoir, Sathanur Reservoir etc. Most of them are marginal and small farmers and there is inequality in the distribution of lands. This aspect has seriously eroded the economic viability of farm, leading to reduced efficiency, productivity and profit margin. Location
Pennaiyar River originates on the south-eastern slopes of Chennakesava Hills, northwest of Nandidurg in Karnataka State at an altitude of 1000 m above M.S.L. After flowing through Karnataka, the river enters Tamilnadu near Begalur village of Hosur Taluk. Pennaiyar river basin is bounded by Cauvery basin at its West, Vellar basin at South and Palar & Varahanadhi river basins at its North. The geographical co-ordinates of this basin are Latitude 11o45'00" North to 13o14'00" North and Longitude 77o45'00" East to 79o45'00 East. The total area of the basin in Tamilnadu State is 11,257 Sq.Kms.
Hydrology The Pennaiyar river is having 10 tributaries, namely, a. Chinnar-I, b. Chinnar-II, c. Markandanadhi, d. Pullampattinadhi, e. Pambar, f. Vaniar, g. Kallar, h. Pambanar, i. Musukundanadhi and j. Thurinjalar. There are 7 major Anicuts namely Nedungal Anicut, Kumarapatti Anicut, Ichembadi Anicut, Sathanur pick up Anicut, Tirukkoilur Anicut, Ellis Choultry Anicut and Sornavur Anicut, 152 Minor Anicuts and about 22 open offtake channels. Total ayacut of the basin is 90806 Ha. Geology The geology of the area include metamorphic complex meta sediments and younger intrusives of Archaean formations on the central and western portion and the overlying sedimentaries of upper Cretaceous, tertiary and quaternary formations of the eastern part. The Archaean formations include granite gneiss, charnockite, hybrid gneiss and mixed gneiss, magmatites, denites, pyroximites etc. of Dharwar group and Dolerite. Pegmatite, granites synites, carbonatites of younger intrusives. Hydrogeology Pennaiyar river basin is underlain by crystalline formations on the western part of the basin and by sedimentary formations in the eastern coastal part of the basin. The thickness of the weathered zone varies from 5 to 60 m bgl. The yield of the boreholes range from 27 lpm to 205 lpm. In hard rock area yield varies from 60 to 180 lpm and transmissivity vary from 0.45 m2/day to 338.4 m2/day. In sedimentary formations, the

A-12
yield of the borewells ranges from 61 lpm to 1273 lpm and transmissivity ranges from 17.5 m2/day to 1133 m2/day.
Ground Water Potential
The zone of water level fluctuation varies from 3.90 m to 10.78 m in hard rock areas and from 2.15 m to 7.10 m in alluvium areas. The water level elevation above MSL varies from 80.0 m to 40.0m in hard rock areas and from 40.0m to 0m in sedimentary formations of the basin. The hydraulic gradient of ground water in the basin is 3.15 m/km in hard rock areas and from 0.93 m/km in sedimentary areas.The Total Ground water potential in Pennaiyar basin is 1560 MCM. There are about 172 observation wells in this basin.
Ground Water Exploitation This river basin is converted into 51 blocks. Out of 51 blocks, 32 blocks are over exploited, 2 blocks are critical 13 blocks are semi critical and 4 blocks are safe. Surface Water Potential The annual surface water potentialin the 4 zones based on 75% dependable rainfall is 1282 MCM. Surface Water Quality
The quality of water in kelavarapally dam is polluted drastically due to the effluent and sewage let into the Pennaiyar River on the upstream side of kelavarapally reservoir. The surface water quality of krishnagiri reservoir shows that the water is alkaline in nature and the DO was present at near saturation levels; the nitrate concentration varied from 0.1-0.4 mg/l, while phosphate varied from 0.1-1.0 mg/l.
Ground Water Quality
In the basin, the chloride values do not exceed the limit. Total hardness above 180 mg/l exists in nearly 90% of ground water basin, which restricts the use of water for industries. Ground water in Melumalai, Mettupatti, Periyadobhai, Hanumanthapuram, Chinnamuthur, Bargur, Agaram, Kunnathur, Anandur, K. Vetripatti, Harur, Pappireddi areas are found to contain fluoride above the permissible limit of 1.5 mg/l. Ground water quality impairment has occurred on account of excessive salinity and fluoride in about 20% of the hard area of the basin. In the sedimentary area of the basin, the ground water is suitable for human consumption and irrigation use.

A-13
Industries In the Ponnaiyar river basin there are about 7146 numbers of small-scale industries and medium industries. The small scale industries include food, beverage, tobacco, cotton, textile, paper, leather, chemical, metal and machinery products and the large and medium industries belongs to the categories like, fertilizer, paper, sugar, automobiles, textiles and machinery products
Forest
The catchment area of Pennaiyar basin is having reserve forests to an extent of 97.25 Sq.Km. the reserve forest area covers 3 major reserve forests mainly Sanamavu Reserve Forest, Kamasandra Reserve Forest and Maharaja Kadai Reserve Forests. The types of forests found in the catchment are tropical dry mixed deciduous forests, Secondary dry deciduous forests and dry deciduous scrub forest. There are also plantations like Eucaluyptus, Bamboo, Tamarind and Cashew in some parts of the catchment
Deforestation The reserved forest area in the catchment area falling in Hosur, Krishnagiri, Uthanagarai and Dharmapuri taluks are in a highly degraded condition. While the forest area in Harur taluk, especially Chettari hills are fairly dense. The areas in Tirupattur taluk are fairly open due to heavy influences, especially goats. The forest in Chengam and Thiruvannamalai taluks are open due to excessive goat rearing and illicit felling of trees. Agriculture
In this basin major crop is paddy. Oil seed crops like groundnut, millets like cholam, campu, varagu, ragi, pulse crops like blackgram, greengram, sugarcane and banana are also cultivated in this area. The extent of crop area irrigated is 62227 Ha and the extent of Non-system crop area is 412106 Ha.
Seismic Zones
The basin area is falling under the Zone II. The basic seismic coefficient for Pennaiyar is taken as 0.02 and the value of importance factor of all types of dams is considered as 3. And being designed based on the specifications specified in IS 1893 – 1984.
Sedimentation The loss in storege capacity of Krishnagiri Reservoir in 26 years is 30.81% and the rate of silting is 1.19. Classification of reservoir curves indicated the Krishnagiri reservoir to be flood-plain-foot-hill type

A-14
Soil Erosion
Severe zones of erosion are seen in the Veppanapally water shed, the middle and lower part of Markhandanadhi water shed, the lower part of Nachikuppam water shed and the lower Pennaiyar water shed. Solid Waste
Dharmapuri, Thiruvannamalai, Villupuram, Cuddalore and Vridachalam municipalities are having compost yards. Other municipalities and town panchayat are not having disposal facilities. There is absolutely no solid waste collection and disposable mechanism at village level in river basin area.
Salinity
The Electrical Conductivity values in the hard rock area varied from 350 to 6400 micro siemens per centimeter. It has been observed that 19% of the wells exceeds the recommended limit of 1500 mg/l, which approximately corresponds to the Electrical conductivity value of 2250 microsiemens per cm. Saline pockets in hard rock area fall around Krishnagiri, near Thirupattur- around Papparapatti, Thoranapatti, Andiappanur and Alangayam and near Dharmapuri.
Sea Water Intrusion Sea water - fresh water interface is observed only shallow-phreatic aquifer located along the coastal width 1.5 - 4.0 km. Potable aquifer zone dispositioned in the range between 40 mts and 200 mts at Cuddalore O.T., General Hospital, Villipalayam, Kudikady and Periyapattu
Diseases
The observed general trend is that the number of cases of water borne diseases reported is larger during post monsoon period. Acute Diarrohea diseases (ADD) is the major disease reported in the basin
Sub basins under IAMWARM for the 1st year
Chinnar 1a sub basin Chinnar 1-a sub basin originates from Hosur taluk and it is having an area of 144.52 sq.km. This has been identified as a deficit sub basin at the rate of 0.25%. The registered ayacut of this sub basin is 461.87 Ha. System deficiencies
1. Unassured supply of water and prolongued drought

A-15
2. Low crop yields 3. Over exploitation of ground water 4. Non adopting modern irrigation and agriculture practices 5. No organized coordination among the farmer communities
Proposed actions
1. Strengthening of existing tank bunds and repairs to head sluice and surplus weir
2. Providing hitech micro irrigation facilities 3. Encouraging horticulture crops like fruits, vegetables, spices and medicinal
plants 4. Training to farmers and water user association members
Chinnar 1b sub basin Chinnar 1-b sub basin originates from Hosur taluk and it is having an area of 280.65 sq.km. This has been identified as a surplus sub basin. The registered ayacut of this sub basin is 749.47 Ha. System deficiencies
1. Unassured supply of water and prolongued drought 2. Low crop yields 3. Over exploitation of ground water 4. Non adopting modern irrigation and agriculture practices 5. No organized coordination among the farmer communities
Proposed actions
1. Strengthening of existing tank bunds and repairs to head sluice and surplus weir
2. Providing hitech micro irrigation facilities 3. Encouraging horticulture crops like fruits, vegetables, spices and medicinal
plants 4. Training to farmers and water user association members
Vaniar sub basin Vaniar is one of the tributaries of Pennaiyar River. It originates from the shaveroys hill ranges at an altitude of 1420 m above MSL and enters into the plains above 5km in Mullikadu in Papireddipatti taluk of Dharmapuri district. The total length of the river is 55 kms and the catchment area is 1100 sq.km. There are 2 reservoirs, 42 anicuts and 8 tanks in the sub basin. The total ayacut is 8003.16 Ha.

A-16
System deficiencies
1. Damaged anicuts 2. Canal silting and encroachments 3. Over exploitation of ground water 4. Non adopting modern irrigation and agriculture practices 5. No organized coordination among the farmer communities
Proposed actions
1. Provision of sand vent with shutter arrangements and construction of head sluices
2. Strengthening of existing tank bunds and repairs to head sluices,anicuts and surplus weir
3. Canal lining and eviction of encroachments 4. Providing hitech micro irrigation facilities 5. Rehabilitation of Vaniar dam infrastructures 6. Training to farmers and water user association members
Muskundhanadhi sub basin Muskundhanadhi sub basin originates from Kalrayan hills and extends through eastern part of sankarapuram and Rizivandhayam area. The total area of the sub basin is 175.59 sq.km. It is having 11 anicuts and 22 tanks. The average annual of the sub basin is 950 mm. it is proposed to construct a reservoir in the upper reaches of the river. The registered ayacut of the sub basin is 1185.71 Ha. Proposed actions
1. Desilting of tanks 2. Strengthening of existing tank bunds and repairs to head sluices,anicuts and
surplus weir 3. Canal lining 4. Alternate cropping 5. Introduction of micro irrigation facilities
Pennaiyar upto Krishnagiri dam sub basin The sub basin originates from Hosur taluk and has an area of 680.59 sq.km. this is a deficit sub basin at the rate of 0.39%. The registered ayacut of the sub basin is 5250.39 Ha. System deficiencies
1. Unassured supply of water and prolongued drought 2. Low crop yields 3. Over exploitation of ground water 4. Non adopting modern irrigation and agriculture practices 5. No organized coordination among the farmer communities
A-17
Proposed actions
1. Strengthening of existing tank bunds and repairs to head sluice and surplus weir
2. Providing hitech micro irrigation facilities 3. Encouraging horticulture crops like fruits, vegetables, spices and medicinal
plants 4. Training to farmers and water user association members

A-18
VARAHANADHI RIVER BASIN
Location
Varahanadhi basin is situated between Latitude 11º 55’ North and 12º 30’ North and Longitude 79º 05’ East 80º 05’ East. The total basin area is 4357 Sq. km of which 4214 sq. km lies in Tamil Nadu and 143 sq. km. lies in Pondichery State. The districts covered by the basin are Kancheepuram, Thiruvannamalai and Villupuram Districts.This basin is bounded by Palar basin on the North, Ponnaiyar basin on the West and South and Bay of Bengal on the East.
Hydrology
The Varahanadhi River originates in between the borders of Kilpenathur taluk of Thiruvanamalai District and western borders of Gingee Taluk in Villupuram District. The total length of the river estimated to be 78.50 Km with a total catchment area of 1936.75 Sq.Km. Varahanadhi River basin consists of two sub basins namely Varahanadhi and Ongur, the smaller sub basin called Nallavur or Kondamur located between Varahanadhi and Ongur sub basins, Other tributaries of this basin include Annamanagalam, Nariyar, Tondiar, Pambaiyar, Pambai channel and Chengai odai. Geology The terrain of Varahanadhi River Basin consists of different type of rocks, which is dominated by Crystalline by 87%, and sedimentary rock by 13 % and alluvial found along the coastal areas. The Varahanadhi basin completely drains in Villupuram district and geological formation identified underlain by crystalline metamorphic complex in the western parts of district and sedimentary tract in eastern side. Hydrogeology
The hydrogeology of this basin is such that 87 % of the area under the basin is hard crystalline rock while the remaining 13 % is sedimentary. The general depth of the bedrock varies from 10 m to 60 m where crystalline formations are found. Surface Water Potential:
The river basin has the water potential of 416 MCM based on 75% dependability of rainfall. Ground Water Potential
The utilizable ground water recharge, draft and balance potential of
Varahanadhi basin has been estimated, which shows the overall ground water recharge potential of 1482 MCM. Therefore, the total potential for this basin is estimated to be 1898 MCM.

A-19
Ground Water Exploitation Varahanadhi river basin has been exploited fully by excess of water
withdrawal, which makes the entire classification under over exploited category. According to 2003 data from the ground water department reveal that 7 blocks are identified with over exploitation ground water resources. Surface Water quality
Varahanadhi is a non-perennial river and flow is possible only during the rainy days i.e. north east monsoon period and since last two years there is no water is identified in the river basin area.
Ground Water Quality The ground water quality in different villages in the block of Villupuram, Tiruvannamalai and Kancheepuram (Varahanadhi River basin area only) indicate presence of EC value of 3640 microsiemen/cm in Omandur in Tindivanam Block of Villupuram District and 3140 in Orathur in Villupuram Block in Villupuram District . Similarly in Chitamur Block, the presence of EC value of 4890 microsiemen/cm indicates the quality is unfit for any safe use. Industries
There are about 30 large and medium scale industries and more than 2,600 small scale industries are functioning in this basin area. These industries mainly engaged in manufacturing of Oil, Sugar, machinery, Textile, chemical, leather, food, beverage, plastic paper, fertilizer, cement products etc. There are sizable numbers of large industries engaged in food, tobacco, textiles, automobiles, Chemical products in the region. Agriculture
Dominant irrigated cropping is paddy as it occupies 52.7% of the gross irrigated area. The other important irrigated crops in this basin cultivated in rotation with paddy are groundnut, sugarcane, millets like, cholam, cumbu and ragi, pulses, cotton etc. Under unirrigated cropping it is groundnut based. The organic farming in river basin support for growing of fruit and vegetable crops including flowers. There is high potential exist for organic farming in this are, which need proper attention for maintaining long term organic farming activities in the basin area .
A-20
Forest
Forest areas in this district contribute about 7.77% of the total area, which spread in the basin area bordering Salem, Dharmapuri and Tiruvanamalai Districts with divisions of Reserve Foret, interface forest and social forest. Teakwood, rosewood and Sandal wood trees are found to be grown in the hills.
Sand mining The sand mining is a major problem in this basin, which poses major treat to
riverbed of Varahanadhi. However the Water Resources Organisation having approved 5 places of sand quarry in this basin Water Logging
In the urban areas of Gingee, Villupuram etc. are having the problem of water
logging in selected pockets due to lack of drainage and storm water provisions.
Water Weeds
This basin is affected by the waterweeds in general. Out of 1421 tanks, nearly 100 tanks have been identified with 100% weeds growth spread out in the entire basin. Remaining tanks have 10% to 25% with aquatic weeds such as Cyprus rotundas, (korai, Velikattan. Seismic Zones
The basin area is falling under the Zone II. The basic seismic coefficient for Varahanadhi is taken as 0.02 and the value of importance factor of all types of dams is considered as 3. And being designed based on the specifications specified in IS 1893 – 1984.
Diseases
The observed general trend is that the number of cases of water borne diseases reported is larger during post monsoon period. Acute Diarrohea diseases (ADD) is the major disease reported in the basin
Varahanadhi sub basin
System deficiencies 1. Overall efficiency of tank irrigation system is 30-40% 2. There is 15-20% reduction in tank storage capacity due to siltation 3. Poor water scheduling 4. Inadequate supplies produce water stress condition and yield is reduced.

A-21
5. Water losses due to unlined canals Proposed actions 1. Conjuctive use of surface and ground water 2. Renovating old tanks, desilting of ponds and supply channels and water harvesting 3. Crop rotation 4. Selective lining to canals where seepage loss is appreciable 5. Use of drip and sprinkler irrigation.

A-22
VELLAR RIVER BASIN
Demography
Vellar river covers fully Athur taluk of Salem District, Thittagudi and Kallakurichi taluks of Villupuram District. It covers partly Harur taluk of Dharmapuri District, Salem taluk of Salem District, Rasipuram taluk of Namakkal District, Ariyalur & Perambalur taluks of Perambalur District, Udayarpalayam, Thuraiyur Taluks of Trichy District, Kattumannar Koil, Chidambaram & Vridachalam Taluks of Cuddalore District.
Location
The Vellar river basin is located in the Northern part of Tamilnadu state, between latitude 11° 13’ North and 12° 00’ North and longitude 78° 13’ East and 79° 47’ East. The total area of the Vellar river basin is 7659 Sq. Km. A portion of Dharmapuri, Salem, Trichy, Villupuram and Cuddalore districts are covered in Vellar river basin. This basin lies in between Ponnaiyar basin in the north and Cauvery basin in the south.
Hydrology
The river Vellar is having 6 tributaries. They are (i) Anaimaduvu, (ii) Swethanadhi, (iii) Kallar, (iv) Chinnar, (v) Manimukthanadhi, (vi) Gomukhi. A portion of Dharmapuri, Salem, Perambalur, Trichy, Villupuram and Cuddalore districts are covered in Vellar river basin. The Vellar basin is a medium river basin in Tamilnadu. The river Vellar originates at Chitteri hills in Salem District, flows entirely within Tamilnadu and falls into Bay of Bengal at Portonovo.
Geology
Both Archaen and sedimentary formations occupy this basin. Archaen group of rocks occurs on the western part of the basin (82% of-basin area) and sedimentary formations of cretaceous, tertiary and quaternary systems on the eastern part.
Hydrogeology
The depth to water level of aquifer varies from 2m to 15m in hard rock area and lowest water level is 9.00m in alluvium. The zone of water level fluctuation varies from 2.20m to 13.39m in hard rock areas and varies from 2.83m to 16.40m in sedimentary areas. The hydraulic gradient of ground water in this basin is 2.75m/km in hard rock areas and 0.65m/km in sedimentary areas. The average hydraulic gradient of Vellar river basin is 1.70m/km.
Stage of Ground Water Exploitation
Out of 39 blocks, the State Ground Water Department has identified 7 blocks as safe (< 70%), 11 blocks as semi critical (70% to 90%), 1 block as critical (90% to

A-23
100%) and 20 blocks as Over –exploited (> 100%). Water potential The annual total water resource potential of this basin is 2409 MCM. This basin also receives surplus water of 78 MCM from Veeranam tank of adjoining cauvery basin at Sethiathope anicut. Thus the total water potential of this basin is 2415 MCM.
Surface Water Quality
It is found that during flow pH, EC, Total Hardness, Chloride, Coliform values are within the limits. But in Koudinyar river, Palar in Nandhiyalam village and Palar river in Rajakal head sluice near perumbakkam on Kanchepuram to Arcot route, Palar in Mettur village enroute from Walajabad to Asur the Dissolved Oxygen falls below the limit of 5mg/lit, which is due to Tannery effluent mixing with water this effects the aquaculture in the area. Total dissolved solids are very high beyond the tolerable limit. Chloride is above the acceptable limit but below permissible limit, Total hardness fluctuates above and below tolerable limits and Biological oxygen demand found to be very high in some head works.
Ground Water Quality
In Mangalur, Thiyagadurgan, Viragathur, Kalathur, Edaicheruvai, Miralur, Keerapalayam, Karikai Athur and Peddanaickanpalayam areas, the quality of ground water is salined and unsafe for human consumption. The Chloride values are also high in these areas. The nitrate values are also found to exceed the permissible limits indicating the nitrate risk. The chemical composition data for few bore wells in Portonovo, Sethiathope and Purudakurayapettai locations indicate that they are of good quality. Overall ground water quality assessment indicate that about 80% of the ground waters are good to moderate in quality and may be used for human consumption and utilization purposes. Industries
There are 9229 industries located in basin area. The water pollution due to industrial activities is minimum except ground water pollution in Pennadam area in Perambular district and discharge of Neyveli mining waters into Wallaja tank
Sewage and Solid Waste
There is no Sewage treatment plant either for municipalities or Town Panchayats. They are letting untreated/ primary treated sewage either on land or into water bodies. There are very few villages in Vellar basin is having community toilets.
Except Vridhachalam municipality, no composting yard for solid waste management is available in Vellar River Basin. There is absolutely no solid waste collection and disposable mechanism at village level in river basin area.

A-24
Forest
Thick dense forest occurs in the chitteri and Kalrayan hills. Medium dense forest occurs in the Kolli, Pachamalai, Chitteri and Kalrayan hills. Low dense forest and shrub forests are well developed in the slopes and foot of hills. Isolated pockets of reserve forest occur in the basin. Total forest area of the basin is about 27 % Seismic Zones
The basin area is falling under the Zone II. The basic seismic coefficient for Vellar is taken as 0.02 and the value of importance factor of all types of dams is considered as 3. And being designed based on the specifications specified in IS 1893 – 1984.
Agriculture The major crop of this basin is paddy. Oil seeds crop like gingelly, groundnut, coconut, sunflower and castor, millets, pulses and sugarcane are grown in this area
Sedimentation
Though there are 5 reservoirs in this basin. In Wellington Reservoir, the loss in capacity over 61 years is 22.58% and % capacity loss per year is 0.36%. Some of the watercourses of the system run near the river Vellar and occurrence of the heavy rains due to the effect of cyclone results in floods in Vellar causing breaches and damages to the banks and structures in the irrigation system.
Water logging
Water logging seems to be a serious problem at least in one of the six tank ayacuts studied (Ambapuram, Kummadimoolai, Nathamedu, Chokkankollai, Kothavacheri and Sathappadi tanks). The farmers reported that about 25% of the total cropped area under Ambapuram tank are affected by water logging.
Water weeds
Kothavacheri, Nathamedu, Kummididmoolai, Sathappadi and Chokkankollai tanks are infested with weeds such as Water hyacinth and Ipomoea SP.

A-25
Sea Water Intrusion In the coastal area, i.e in Cuddalore district the analysis of water samples from bore wells and open dug wells were done. Open dug wells in the coastal villages Thopuiruppu, C-Muttlur, Kallai and Portnovo shows poor quality ground water. Deep bore wells drilled at Periyakomatti, Thatchakadu, Chidambaram IB, Pinnathur and Pichavaram shows very poor quality of water (EC- 12800 micromhos, TDS-7682 mg/l). Sub basins under IAMWARM for the 1st year
Manimuktha nandhi sub basin
The basin originates in Kalryan hills with drainage Area of 749.54 Km having I two drainages namely Mani river and Muktha river originating in the Northern par of the eastern slope of the Kalrayn Hills in Sankarapuram Taluk at an altitude of about 40 km and the Muktha River flows for 32 km. Manimuktha Nadhi sub basin having 18 Anicuts , 49 PWD tanks, and one Manimuktha Nadhi reservoir having the total Ayacut of 5027 Hectares. Average rainfall is 950mm in this sub basin. Upper Vellar sub basin
It originates at an altitude of 1266m. At its starting pointing, it is known as
Anaimaduvu River is called Anaimaduvu reservoir. Upper Vellar sub basin is having sixty-five Anicuts and thirty-three PWD tanks. Lower vellar basin
The lower velar river starts from Tholudur Anicut and finally falls into portnova in Bay of Bengal. The basin is situated between latitude 11° 13’ N-12° 00’N and Longitude 78° 13’ E-79° 47’E. The total area of this basin is 1753 Sq.Km. the total length of lower Velar River is 128 kms. The total register Ayacut of the sub basin is 44,166 hectares. The annual rainfall of the sub basin is 1165 mm
System deficiencies
1. Submersion of standing crops during heavy flood times. 2. Silting of channels and breaches of bunds in tanks and of channels. 3. Lack of adequate control of regulating structures like anicut etc., 4. Deteriorated canal with low efficiency and their inspection roads. 5. Full growth of Neyveli Kattamanakku, and other scrup jungles obstructs
the free flow and ayacuts at the tail end area suffering for inadequate supply.
A-26
Proposed actions
1. Lining of channels. 2. Rehabilitate the Irrigation Structures such as anicuts, regulators, head sluices
inlets, bed dam and tank sluices weirs etc., 3. Desilting channel. 4. Formation of fore shore bund in tanks. 5. Flow measurements structures etc., 6. On farm Development works to Anicuts and Tanks etc., 7. Construction of community wells etc.,
Anivari odai sub basin
Anivariodai originates in Perambalur taluk joins the vellar on its right flank at about 10 km below the confluence point of Chinnar. The total irrigated area is 1140 hectares and 59 tanks. The total population is 0.126 million. System deficiencies
1. Old irrigation network 2. Low Water use efficiencies 3. Inadequate transportation , storage and marketing facilities
Proposed actions
1. Lining of channels. 2. Rehabilitate the Irrigation Structures such as anicuts, regulators, head sluices
inlets, bed dam and tank sluices weirs etc., 3. Desilting channel. 4. Formation of fore shore bund in tanks. 5. Flow measurements structures etc., 6. On farm Development works to Anicuts and Tanks etc., 7. Construction of community wells etc.,

A-27
VAIGAI RIVER BASIN
Demography
In the Vaigai basin there has been a progressive increase in population in the last three decades. The projected figure for the year 2015 AD is about 46 million. Increase in population in the areas of catchment is also responsible for degradation and environmental impact. The catchment area hitherto untouched started getting exploited for daily domestic needs of the local inhabitants who have started concentrating in the area.
Location
Vaigai basin is one of the major seventeen river basins in Tamilnadu. It lies between the geographic co-ordinates N latitude 9º 15’ and 10º 20’ and E longitude 77º 10’ - 79º 05’. Vaigai river basin covers an area of about 7031 sq. km. and lies in the Madurai, Theni, Dindigul, Sivagangai and Ramnad Districts of Tamilnadu.
Hydrology
The hydrology of the vaigai basin has been worked out sub basin wise. The vaigai river basin has been divided into ten sub – basins from the origin to the sea. The total sub basin area is 7031.46 Sq.km against the basin area of 7039 Sq. km.
The major tributaries namely Suriliar, Theniar, Varatar, Nagalar, Varahanadhi,
Manjalar, Marudhandhi, Sirumalayar, Sathiar, Uppar etc. constitute the sub basins of vaigai basin. Vaigai basin consists of ten minor basins of Suruliar, Upper Vaigai, Theniyar, Nagalar, Varahanathi, Manjalar, Sirumalaiyar, Sathaiyar, Uppar and Lower vaigai. The major reservoirs in this basin are Periyar, Vaigai, Sothuparai, Manjalar and Marudhanadhi reservoirs. Geology
This area consists of Archaean formations like granite, charnockites, granite gneiss, and quartzite and Quaternary formations like alluvial sediments upper gondwana, tertiary sand stone. Hard rock occupies 74% sedimentary 26% of total area.
Hydrogeology
The borehole lithological and aquifer parameter studies have revealed the existence of weathered granular aquifer, phreatic to semi confined aquifer in the alluvium and valleyfills in the crystalline rock formation and confined to semi confined aquifer conditions in the sedimentary formations. The depth of bedrock thickness in the crystalline formations varies from 9 to 60m below ground level in the fracture zones. Valley fill thickness is varying from 10 to 25m below the ground level including the fracture zones. Alluvial thickness and the extent is phreatic and confined

A-28
to the river. The thickness is varying from .10 to 25m and the lateral extent is 6 to 12 km beyond Madurai.
Ground Water Potential Water levels are being observed in number of shallow observation wells and borewells in the entire vaigai basin. Water levels are observed every month during the first week. Hydrographs for all the wells are being maintained. As per the estimate, the net recharge of the Vaigai Basin is about 993.07 MCM. The net extraction is around 540.37 MCM and balance potential available is 452.70 MCM Surface Water Potential
The surface water potential of the basin is 2025.92 Mcum based on 50% dependability and 1571.01 Mcum based on 75% dependability Surface Water Quality
As per the samples taken from Peranai regulator indicates that water is clear and contains lesser amount of chemical constitutions such as TDS, PO4, NO2. Most of the physico – chemical parameters are within the permissible limits. This can be attributed to lesser human activities and provision of effluent treatment plants provided by the industries discharging their effluent into the river.
Ground Water Quality
The wells located at Ramanathapuram, Valantharavai, Idayanvalasai and Periyapattinam with the EC values ranging from 1125 to 2590. In other places like Mandapam, Devipattinam, Chithayankottai, Sembadayarkulam, the quality of water is poor with EC values ranging from 3125 to 6240. The poor quality is due to marine sedimentation in this area. Sand Mining
Indiscriminate and illegal sand mining was going on at an alarming rate throughout Vaigai riverbed. Sand was mined to a depth of more than 3 mts and even more in some places. As a result in a major portion of the river the entire sand in the riverbed has been removed and the rocky bed is exposed in many places like Mannadimangalam, Thenur and Thiruvedagam villages.

A-29
Sedimentation
The studies revealed that the capacity of the reservoir as on 1976 is 178.191 Mcum as against the original capacity of 194.785 Mcum. The rate of silting was observed to be 0.473% per year and the average rate of sedimentation per sq. km. of catchment area was 0.0004 Mcum. It was also observed that the useful life of the vaigai reservoir was estimated to be 155 years. So, the catchment area should be stablised by suitably addressing the causes of soil erosion.
Encroachment
On both sides of the Vaigai people encroached and constructed houses. Apart from the banks the riverbed is also encroached. Vaigai River from the headreach to the tail end, this menace of encroachment is there everywhere. Especially in the reaches where small villages and towns are located close to the main river and the irrigation channels taking off from Vaigai River and its tributaries the encroachment problem is predominant. The Raja Boobala Samudhram tank in Budipuram of Theni district is one of the classic example of encroachment. Solid Waste
Vaigai River is no exception. Solid waste dumping is a problem for all the
river basins. The tributaries of Vaigai like Theniyar, Varahanadhi etc. get the same treatment. Solid waste is dumped into the irrigation channels also in the Cumbum valley area. In the head reach in Varusanadu village solid waste is dumped in the river course. In Chinnamanur the solid waste is collected by vehicles and dumped in the compost yard. But the people living near by the river and the channel put their household solid waste in the channels nearby. In Periyakulam municipality the solid waste is dumped in the existing compost yard. In Madurai city the position is alarming. Even though large quantity of solid waste is collected and dumped in the compost yard people living on both banks of river dump the solid waste into the river. Similarly lower down reaches in Tiruppuvanam and Paramakudi the solid waste are put into the river and the irrigation channels. In Paramakudi the solid waste is dumped in the compost yard situated in Urapuli village near Paramakudi. Water Logging
A large area lies downstream of Sakkarakottai Kanmai near the villages Therkutharavai, Vallimadavalasai, Viranvalasai, Kannanendal and Pallamorkulam. Another stretch of land lies near the villages Naganada chaultry, Madattur, Pannakarai and Nattakulam. Another area lies near the villages Vannankundu, Badratharavai, Regunathapuram, Karantharavaikudi. In addition to this water logged area is available near Rettaiurani, Tamaraikulam, Vellariodai and Manangudi. Salinity
In vaigai basin the coastal areas such as Sivagangai and Ramanathapuram districts have been affected with soil salinity. The other districts such as Theni, Dindigul and Madurai are not affected with salinity. The coastal saline soils such as in Ramanathapuram and Sivagangai districts have saline ground water table at shallow
A-30
depth. Both the ground water and the soils are rich in chlorides and sulphates of sodium, magnesium and calcium. The soil salinity and depth to ground water table vary with the season. Soil salinities are maximum in dry seasons and minimum in monsoon months.
Industries
The industries in the vaigai basin are categorised as Rubber, Textiles, Spinning, Sugar, Distillery, Food Beverages, Dyeing, Pulp and Paper, Electro Platting chemicals, Dairy and Miscellaneous. These industries have been further classified as Red, Orange and Green categories depending upon the pollution level of the effluent.
Agriculture
In this basin there are well knitted irrigation systems from where water is supplied for irrigation from major reservoirs, anicuts, channels etc in addition to the tank systems. The dominant crops cultivated in the Vaigai basin are paddy, cholam, cumbu, ragi, green gram, black gram, chillies, groundnut, gingelly, cotton, sugarcane, vegetables and banana.
Seismic Zones
The basin area is falls under the Zone II of seismic zones classification. The basic seismic coefficient for Vaigai Basin is 0.02 and the importance factor for all types of dams is 3. The design of dams and water retaining structures are based on IS: 1893 – 1984.
Water Weeds The two common weeds responsible are “Eichhornia crassipes” and
“Ipomea carnea”. In Vaigai River, Ipomea carnea is the major bank and shore weed. Severe blockage of water by Ipomea carnea has led to the formation of mini silt islands (Isles) in the rivers, which now grow several weedy bushes and cause floods. Water hyacinth also dissiminates in larger places and causes severe disturbance in Vaigai River. Besides these two notorious waterweeds, the other waterweeds such as Pistia, Nelumbo, Nymph, Hydrilla, Vallisneria etc., causes some problems in Vaigai River.

A-31
Diseases
The important water borne diseases in the basin are caused acute diarrhoeal diseases, reproductive tract infection, Amoebiasis, Worm infestation, typhoid fever, Viral fevers Jaundice and Malaria Sub basins included in IAMWARM for the 1st year 1. Swedhanadhi sub basin Swedhanadhi originates from kolli hills in Rasipuram taluk of Salem district at an altitude of 1417 m above MSL. The sub basin is having 33 anicuts and 18 tanks. System deficiencies
1. Silting of supply channels 2. Anicuts are in dilapidated condition 3. Erosion of side banks
Proposed actions
1. Strengthening of head works and repairing the anicuts 2. Lining of supply channels and reconstruction of sluices 3. Construction of field channels upto 10 Ha 4. Desilting of sathaiyar dam and tanks
2. Varaganadhi sub basin Varaganadhi originates from western ghats and joins vaigai near Gullapuram. It has 11 anicuts and 31 tanks. The total area of the sub basin is 390.The total annual rainfall in the sub basin is 851 mm. The total ayacut is 3041.18 Ha. System deficiencies
1. Silting of supply channels 2. Anicuts are in dilapidated condition 3. Erosion of side banks 4. Water use efficiencies are minimum 5. Inadequate facilities of transportation and marketing
Proposed actions
1. Strengthening of head works and repairing the anicuts 2. Lining of supply channels and reconstruction of sluices 3. Construction of field channels upto 10 Ha 4. Desilting of sathaiyar dam and tanks

A-32
3. Sathaiyar sub basin Sathaiyar originates from sirumalai hills and flows southward and empties into Vaigai River. The basin covers an area of 819 sq.km. The total ayacut of the sub basin is 4279.89 Ha. System deficiencies
1. Silting of supply channels 2. Anicuts are in dilapidated condition 3. Erosion of side banks 4. Water use efficiencies are minimum 5. Inadequate facilities of transportation and marketing
Proposed actions
1. Strengthening of head works and repairing the anicuts 2. Lining of supply channels and reconstruction of sluices 3. Construction of field channels upto 10 Ha 4. Desilting of sathaiyar dam and tanks
4. Manjalar sub basin Manjalar originates from Palani hills and runs towards east and joins Vaigai River near Koottathu. There are 9 anicuta and 9 tanks in this sub basin. It receives an annual rainfall of 775 mm. The total sub basin area is 470 sq.km. The total ayacut of the sub basin is 2155.53 Ha. System deficiencies
1. Silting of supply channels 2. Anicuts are in dilapidated condition 3. Erosion of side banks
Proposed actions
1. Strengthening of head works and repairing the anicuts 2. Lining of supply channels and reconstruction of sluices 3. Construction of thrashing floor at every village

A-33
AGNIYAR RIVER BASIN
Demography
The total population of the basin based on 2001 census is 1021222. In this basin male population (505487) constitutes 49.50 % of the total population. The total female population (515735) of 2001 has an edge over male population constituting 50.5% over the total population of the basin for 2001. The total population density of the basin (Based on 2001 census) is 302.63 / Sqkm
Location
Agniyar River Basin is located in between latitudes 90º 55’ N to 100º 48’ N and Longitudes 78º 14’ E to 70º 30’ E. The total area of Agniyar basin is 4,566 km2 and lies entirely within Tamil Nadu. It has three minor river basin namely Agniyar, Ambuliyar and Southvellar. The western portion is 200m above sea level and tapers towards the east and reaches sea level. Tank irrigation plays an important role and there are about 40,00 irrigation tanks irrigating about 76,350 ha.
Hydrogeology
The bore wells drilled in the crystalline area are shallow ranging in depth between 30 and 60 m and the bore wells drilled in the sedimentary formation are medium to deep ranging from 150 to 350 m depth. The yield of the wells in the Archaean formation varies from 5 to 50 lpm, where as in the sedimentary formation yield of the wells various between 25 to 500 Ipm. In the cretaceous formations, the yield varies between 5 lpm to 60 Ipm. In the alluvium formation, the yield of the well varies between 100 to 1000 Ipm.Artesian conditions were encountered in Manalmelkudi and in Kattumavadi Villages. The maximum yield of well is found in Kuppaikudi and in Orathanadu area.
Ground Water Availability
The total ground water potential in this basin is 920 MCM
Surface Water Potential
This is a small river basin comparatively with lesser drainage area. The 75 % annual weighted rainfall of this basin is 652.93 mm the annual surface water potentials are assessed for 75 % dependable rainfall for Agniyar River Basin is 585 MCM. The total surface water potential is about 697.54 million cum. A further quantity of 499.81 million cum of water is receiving from Grand anaicut canal summing the total surface water potential of the basin to 1197.34 million cum.

A-34
Ground water potential
The average annual ground water potential is 984.89 Million cum.
Surface Water quality
The maximum value of salt concentration of 8,448 ppm is recorded at Sathankulam and Aranikulam tanks. The minimum value of 3,200 ppm is recorded at Keemakanmoi, Periyakulam Eri, Kothamangalam and Periyakulam.
Ground Water quality
The ground water quality study of Agniyar basin reveals that the water quality is found to vary from good to moderate in most parts of the basin. Electrical Conductivity (EC) in this basin is varying between 0.9 mhos/cm to 1.34 mhos/cm. Sodium Absorption Ration (SAR) ranges between 1.4 and 36.6. In places like Avudayarkoil Aranthangi and Annavasal etc of this basin SAR is found to be higher than that of the permissible value of 1.4. Hence in those places water is not suitable for irrigation. The geo-chemical type of this basin is sodium chloride. Generally a moderate ground water quality prevails in many parts of the basin.
Agriculture
The cropping pattern is slowly changing into other pattern depending upon the availability of water source. Rice is the major crop in Agniyar basin. Other important crops are Groundnut, Cotton, Pulses, Millets, Gingelly, Chillies and Sugarcane. Rice is grown in three seasons, namely Kuruvai, Samba and Thaladi. The major crop is Groundnut, which occupies 68.49 % of gross rain fed crops. Other important dry land crops like Millets and Cotton are raised in rotations with Groundnut.
Forest
The forest coverage in this basin is very low, about 5 % of the basin area.
Sand mining
Sand mining is a very common phenomenon in rural area and is being transported through bullock carts, mini tractors and lorries
Aquatic environment
There are about 30 fishing villages with a population of 0.18 Million. Inland fishing through tanks and ponds is 4,500 tones per annum. A few aquaculture industrial units are located in the coastal areas of this basin in Anadaikadu, Rajamadam, and Eripurakkai of Pattukottai Taluk of Thanjavur District and around Kattumavadi of Avudaiyarkoil Taluk in Pudukkottai District.

A-35
Solid waste
Solid waste management is one of the important factors to be taken care in respect of environment. Among the municipalities, pudukkottai is doing extensive solid waste management programmes and on the other hand in pattukottai it is being paid less importance than in pudukottai. A quantity of about 25 to 30 MT is generated per day and composted an aerobically.
Diseases
The types of diseases prevailing in the basin are Fever, Typhoid fever, Tuberculosis, Leprosy, Twakrogam, Verinam, Hypertensive diseases, Isehemic diseases, Sivogam, Nasrogam and others.
Water weeds
All ponds situated nearer to the habitations are the sources and the existence of waterweeds. The tanks affected by waterweeds are water hyacinth, salvania, water penywort, spirulina, giant brown kelp and red seaweed.
Sub Basins Ubder IAMWARM 1st year
Agniyar Sub Basin
The Agniyar river otherwise Known as “Agnanavimochana” originates from the surplus of Kulathur tank in Kulathur Village, Kulathur taluk of Pudukottai District at latitude of 10º 35 N and longitude of 78º 46 E and at a distance of 36km from Trichy along Trichy-Pudukkotai road. The river runs for a distance of about 80 km from its origin and joins the Bay of Bengal at about 5 km South of Rajamadam Village of Pattukkottai Taluk. Agniyar has three tributaries namely Nariar I, Nariar II, and Maharaja Samudram.
Ambuliyar Sub Basin
River Ambuliyar has its origin in the catchment area of Manjamviduthi tank of Alangudi Taluk, Pudukottai District. The River after traversing a total distance of 48 km empties into Bay of Bengal in Ammanichatram Village of Pattukottai Taluk in Thanjavur District. The total sub basin area of Ambuliyar is 759.70 km2. In the Upper Ambuliyar basin there are no tributaries, but two tributaries join in the lower Ambuliyar Basin.

A-36
South Vellar Sub Basin
The South Vellar River originates as a stream in Kumarikatti reserve forest area near Manjinampatti Village, 20 km Northwest of Thuvarankurichi in Manapparai Taluk of Tiruchi District. The total length of South Vellar River from its origin to its confluence with sea is about 137 km. The total basin area of Vellar River is 1931.51 km2. The main tributaries of South Vellar River are Nerunjiludiar and Gundar.
System deficiencies
1. Most of the anicuts, sluices and weirs are in damaged condition 2. Water use efficiencies are minimum due to old irrigation practices 3. Inadequate facilities of marketing, storing and transportation
Proposed actions
1. Providing equitable distribution of irrigated water by better water management 2. Rehabilitation of anicuts, tanks and lining of supply channels, desilting of
tanks. 3. Alternate crop pattern 4. Adopting sprinkler and drip irrigation 5. Creating awareness among farmers, public and local bodies.

A-37
PAMBAR RIVER BASIN
Demography
The total population of the basin based on 2001 census is 1021222. In this basin male population (505487) constitutes 49.50 % of the total population. The total female population (515735) of 2001 has an edge over male population constituting 50.5% over the total population of the basin for 2001. The total population density of the basin (Based on 2001 census ) is 302.63 / Sqkm. Location
The Pambar basin is bounded by the longitudes 7807’20” E to 7907’9” E and latitudes 9044’19”N to 10025’32”N. It is spread over the districts of Pudukkottai, Sivagangai, Trichy, Dindigul, Madurai and Ramnad. Hydrology The main river Pambar (one of the minor rivers in Tamil Nadu) originates in left side Callingullah of Thamaraikanmoi which is the tail end tank of Thamaraikanmoi group, in Thirumayam village and taluk in Pudukkottai district and traverse through Pudukkottai district & Ramanathapuram district and gets divided into three courses and finally falls into the Bay of Bengal .The rivers Kottakariyar, Thenar and Virusuliar alias Manimuthar are the three tributaries joining the main river Pambar. Geology
The area is comprised of Archaean complex on the northwest and overlain by upper Gondwana, Tertiary and recent to sub recent formations on the east. Cretaceous formations occur in the sub surface.
Hydrogeology
The thickness of weathered zone varies from 20-40m BGL. In Crystalline formations the depth of bore wells range from 14-82m BGL. The Yield of the bore wells range from 50 lpm to 200 lpm. In the sedimentary formations, the thickness of sandstone varies from 70-100m BGL. The depth of the bore well ranges from 27m to 429m BGL. The yield of the bore wells ranges from 50-500 lpm.
Surface water potential
Rainfall is the only source that contributes to this potential. Isohyetal method was used to arrive at the average rainfall using Isohyets for all the 3 different seasons. The surface water potential of the basin is 508.8 Mcum
A-38
Ground water potential The ground water potential of the basin is 1085.14 Mcum.
Surface Water Quality
The quality of surface water at Pambar basin is found to be contaminated but the contamination level has to be considered low which is good both for human consumption and irrigation use. Ground Water Quality
Areas of Pudukottai and Ranmad Districts the TDS in water exceeds 2000 ppm which limits its use for internal consumption In Pambar basin the following areas are having high nitrate content namely Keelasevalpatti, Kattukudipatti, Kottaiyur & Sambanur.The EC in the lower reaches are found to vary much from the permissible limits. Pulipatti and Kottampatti of Melur taluk are the areas posing potential danger of fluoride.
Agriculture
Of the total cultivable area of 112510 ha, 75293 ha of area is covered under wet agriculture and the remaining 37217 ha under dry crops. There are only a few wells in the command area and in dry crop area for supplementation. Mostly rainfed dry crops are raised in the dry lands and only in areas where well irrigation facility is available, irrigated dry crops are raised, Some farmers, raise irrigated dry crops even in the absence of wells in their lands, by purchasing water from adjacent wells.
Sand mining
At present sand mining is not being done any where in the basin area due to non-availability of sand.
Water weeds
Of the waterweeds generally found in waterway, Ipomoea and water hyacinth are the two plants that are common. While Ipomoea is commonly found in many tanks in the basin, water hyacinth grows prolifically in Ooranies.
Seismic zones
The basin area is falling under the Zone II. The basic seismic coefficient for Pambar is taken as 0.02 and the value of importance factor of all types of dams is considered as 3. And being designed based on the specifications specified in IS 1893 – 1984.

A-39
Solid waste
Water bodies of the nearby areas are invariably used for disposal. Six such cases have been noticed in Pambar basin, which are Tiruppathur where All the solid waste produced by the town population is disposed off in the foreshore of Panikkanendal tank, Singanpunari is yet another town that deposits its solid waste of 5 tonnes, in the Palar river which flows very near to the town, Thirumayam and Ponnamaravathi the waste is dumped in dumped at foreshore of Vengai kanmoi and Thirumukkani tank. Diseases Acute diarrhoeal disease, cholera, Typhoid, Jaundice, Malaria, Measles and chicken pox are the diseases common in all areas of the basin.
Salinity
The taluks affected by salinity in this basin are Devakkotai, Thirupattur and Thiruvadanai. The range of percentage of area affected in the basin is 30-100%
Literacy
The literates of the basin are 620820, which constitute 60.79% of the total population. The no. of male literates is 367341 constituting 59.17 % and the female literates (253479) constitute 40.83 %. System deficiencies
1. Low level of tank bunds and deep bed sluices reduce the storage capacity of the tank
2. Dilapidated conditions of sluices and weirs resulting in uncontrolled water delivery
3. Lack of adequate control of regulating structures like anicuts Proposed actions
1. Improving the overall irrigation efficiencies by rehabilitation of conveyance and storage system
2. Conjunctive use of surface and ground water by giving awareness to farmers 3. Lining of field channels to the required extent 4. Rehabilitation of system and non system tanks and anicuts

A-40
GUNDAR BASIN Demography
Gundar Basin is having a total population of 2,289,876 of which 1,149,875 is male population and 1,140,001 is female population. Within the basin Madurai South Taluk area is having highest population 944,663 of which male 478,419 and female 466,244.
Location
Gundar river basin is one of the major river basins of Tamil Nadu with a drainage area of 5912 Sq. km. It is located between the geographic co-ordinates Latitude 90 05’N– 100 03’N and Longitude 770 35’ E – 780 35’ E. It is situated in between Vaigai basin in the North and Vaippar basin in the south. The basin covers part of Madurai, Sivagangai, Virudhunagar, Ramanathapuram and Thuthukudi Districts
Hydrology
The Gundar River takes its rise from the Eastern slope of Varusanadu hills at an altitude of 500 m and about 60 km westward of Madurai city. Gundar basin includes Vembar, Palar and Kottakudiar (Uthirakosamangaiar) sub basins. Vembar sub basin is located in the southern side of Gundar Basin. Palar and Kottakudiar (Uthirakosamangaiar) sub basins are located on the northern side of Gundar Basin Geology
Gundar river basin comprises crystalline rocks of Achaean age on the Northwest and sedimentary rocks of tertiary and quaternary age on the southeastern coastal area. Archaean and sedimentary formations are more or less equally distributed in this area. Hydrogeology
The thickness of withered zone in crystalline areas is from 15 to 40 m and highly sheared and jointed zone is from 10 to 60m below ground level. Depth to bedrock varies from 10 to 60m in the crystalline formation and is in the increasing trend in the coastal sedimentary. The depth of the boreholes drilled in the crystalline formations ranges from 24 to 50m in general. The reported yield of bore wells in the crystalline formations range from 18 to 836 liters per minute (lpm). The specific capacity values varying from 0.001 to 0.09 m3/min/m indicate that the hard rock in the basin is generally poor aquifers. Transmissivity varies from 16 to 168 m2 / day. About 40 % of the basin area is occupied by sedimentary formation. Specific capacity of bore wells in the sedimentary formations range from 0.00018 m3/min/m to 0.226 m3/min/m.

A-41
Surface water quality
There is no surface flow in the basin due to failure of monsoon, hence surface water quality as on date could not be assessed and reported. However the past experience shows that the surface water in the basin is generally good and fit for irrigation and other purposes. Ground Water quality
Ground water quality is generally good in small patches within the basin in
Thirumanglam, Vilathikulam, Thiruchuli, Madurai and Ramanathapuram taluks with total dissolved solids ranging between 31 - 499 mg/l. Except a few patches in major portion of Ramanathapuram, Kadaladi, Mudukulathur, Kamudi and Paramakudi Taluks the quality of groundwater is poor with total dissolved solids above 2000 mg/l. Almost 75% of the basin area the quality is moderate with TDS ranges between 501 to 1999 mg/l. Fluoride concentration in drinking warer is high in Narikudi,T. Meenakshipuram,P.Pudupatti, Ramanujapuram villages of Madurai district.The nitrate concentarion is also high in Utthappanaickanur, Chinnakattlai and Elaiarpathi villages. Industries
In this basin there are 1293 small, medium and large-scale industries with various kinds of activities. Most of the industries are small and medium scale industries and there is only a few large scale industries. Out of 1293 industries 1037 are located in Madurai South and Thirumangalam Taluk and 256 are in rural area. Concentration of industries is high only in urban areas – Madurai and Thirumangalam Taluk. In rural areas the numbers of industries are thin.
Waterweeds There is lush growth of Juliflora on the Kattanur tank bund of Virudhunagar district. In Girudhumal river within Madurai city limit in the stretches wherever sewage water from the adjoining habitats let into the river there is abundant growth of water Hyacinth. Near Ellies Nagar growth of water Hyacinth choked the Girudhumal River. Valaiveesi Teppakulam near Ellis Nagar and Virahanur Tank are fully infested with water Hyacinth.Ipomoea is present in majority of tanks in Gundar basin.
Encroachments
The Gudumal River has been encroached and the solid wastes and Garbage collected from the houses situated in the vicinity are being dumped in Girudamal. The encroachments in other channels, which are flowing across Madurai city, cause much damage to the life and property of people during floods.

A-42
Solid Waste The Major Source Of Solid Wastes Dumped in water bodies is the Madurai
city lying in the South of river Vaigai. Various locations of water bodies namely Gridhumal River, supply channels passing through Madurai city and tanks. Agriculture The main occupation of people living in Gundar Basin is only agriculture and Cattle rearing. 80 % of the population is having their livelihood by means of these two sectors only. Most of the lands are rain fed used for cultivation of dry crops like Ground nut, Millets, Cotton and Pulses. The area under tanks is cultivated with crops like Paddy, Cotton, Millets and Pulses according to the availability of water in the tanks. Perennial crops like Sugarcane, Banana and Flowers are cultivated in the tank fed areas supplemented by wells. Literacy
Total literate population in the basin is 1,611,937 of which male literate 907,124 and female literate 704,813. In the basin 70.39% people are literate. Within the basin Madurai south taluk having highest population is also having highest male literates 498,495 and female literates 423,250.
Sub basins under IAMWARM for the 1st year Therkkar sub basin Therkkar River originates from the northern end of Doddappanaicken hill ranges near Usilampatti in Madurai District. There are 271 tanks situated within the Therkkar minor basin chatchment area. The total ayacut under these tanks is 9736.09 ha.
Paralaiyar sub basin The river Paralaiyar is a tributary of Gundar River. It starts about 11 Kms west of Manamadurai that is from the surplus of Keelapasalai Tank and is fed by surplus of many Vaigai fed tanks in Manamadurai taluk of Sivagangai District. The river runs into two arms up to Mosukudi where it joins together and runs through Manamadurai, Pramakudi, Kamuthi, and Mudukulathur Taluks. The total area of sub basin is about 670 sq.km.The total No of tanks benefited under this basin is 41. The total ayacut under this basin is about 1586.00 Hec.

A-43
The cropping pattern of this system
1st crop is paddy and the 2nd crops are chilly, groundnut, pulses, vegetables and cotton. System deficiencies
1. The system is one of the old system existing for more than hundred years, as such requires rehabilitation.
2. Heavy accumulation of silt due to hilly region and contour nature of canal system.
3. No scheme works were done during the passt years. Results non-effective irrigation.
4. Lack of adequate control of regulating structures like anicut etc., 5. This sub basins totally consistes of Non system tanks. Hence this non-system
tank requires rehabilitation. Proposed actions
1. Improving the supply channels to improve and assure the irrigation efficiency of the conveyance system by rehabilitation of the supply channels in the way of desilting and lining the supply channel.
2. Rehabilitation of non-system tanks and its components like sluices, weirs etc., 3. Rehabilitate the Anicut by Repairs and Reconstruction of Anicuts. 4. Improve the River system and channel by River Training works. 5. To improve the facilities by agriculture by providing Thrashing floor, 6. Construction of open wells, etc., 7. To improve the Basic Activities of the WUA by constructing Buildings for
water users Associations.

A-44
KALLAR RIVER BASIN Demography
The river basin covers three taluks i.e, Kovilpatti, Ottapidaram and a small part of Vilathikulam. Under Kovilpatti it comes around 23 panchayats, under Ottapidaram it comes around 24 panchayats and under Vilathikulam taluk 9 panchayats. Thus there are 56 panchayats with a population of 52517 in Kovilpatt. 71158 in Ottapidaram 29795 in Vilathikulam. Location
The river basin Kallar including Korampallamaru is situated entirely in
Tuticorin district between the latitudes 8 º 45' N and 9 º 09' N and longitudes 77 º 45' E and 78 º 13' E. 40.66% of the total area of Tuticorin district (4621 km2), which accounts to about 1878.80 km2 is covered by the Kallar river basin area. There are two rivers in this river basin. They are the Kallar River in the northern side and Korampallam River in southern side. This basin is surrounded by Vaippar basin in the north, Tambiraparani basin in west and south and the Gulf of Mannar in the east. Hydrology
The Malattar is the main tributary of river Kallar. The catchment area of the basin is 465.7358 sq. km. There are eight anicuts in the Kallar river basin.
Geology The basin is covered by geological formation of Archaean, tertiary and recent to sub-recent periods. The Archaean sets up of rocks are identified at Ottapidaram and Vilathikulam taluks which are found to have crystalline metamorphic complex exposed in many areas. Tertiary rock sandstones are recorded in the coastal village of Pattinamarudur. Hydrogeology
The quaternary sediments occurring in this basin are represented by laterites, older alluvium, recent alluvium and teri sands. In this alluvial formation, the depth of the bore wells drilled varies from 18m to 302.4m BGL.
Seismicity The north east part of Tamil Nadu including Chennai is included in zone III according to the revised seismic zoning map. The remaining areas come under the zone II. Kallar river basin including Korampallamaru is included in zone II where the seismic activities are comparatively less.

A-45
Surface water potential
Total surface water potential of this basin is 203 MCM, which is roughly 0.8% of the available surface water potential of the state.
Ground water potential
The ground water details for the Kallar river basin are observed from seven stations, namely Eppodumvendran, Idaiseval, Keelakarai, Kadumbur, Kulathur, Pasuvandanai and T.Duraiyoor. The ground water levels in all the seven stations were declining gradually in the past few years
Surface Water Quality
High TDS is observed in wells near the coastal tracks. High nitrate concentration is noticed in Vilatikulam, Kovilpatti, Kayathar, Pasuran thanai, Puthiamputur and Eppodum ventran. Domestic sewages of wayside villages are directly discharged into the river. The industrial effluents allowed into the river cause water pollution in several areas. Major industries located in Thoothukudi in Kallar basin spoil marine eco system. Sterilite industry also located in this basin is causing water pollution.
Ground Water Quality
Kallar basin is not having enough water resources and the rural population depends on ground water for drinking purposes. For fresh water the EC ranges from 10 to 1000 micromhos/cm. In kallar basin area the EC ranges from 600 to 9000 micromhos/cm which is an indication of water pollution.pH is also high on the alkaline side, ranging from 7.10 to 9.0. The total hardness and total dissolved solids are also high in all the places. The average concentration of sulphates and chlorides are very high. Nitrate exceeds the drinking limit of 45 ppm. Ground water of kallar basin is generally hard to very hard in nature, with high sulphates, bicarbonates and high concentration of nitrates. The ground water quality is poor in most of the area of Kallar basin.
Forest
The forest cover area that is found around the river basin is 2341.01 hectares. The forest area cover under the RF (reserve forest area) was noticed only at two places in kallar river basin. 1. Kurumalai - 1258.24 hectares - this comes under the Kovilpatty taluk and 2. Salikulam - 1082.77 hectares - present in the Ottapidaram taluk. There are 5 Reserve Forests in the basin. Agriculture
In the Kovilpatti taluk, which comes under the Kallar basin area, constitutes of 73.57% of dry lands and 26.43% of wetlands. The Ottapidaram taluk area, which

A-46
comes under the Kallar basin area, consists of 82.05% of dry lands and 17.95% of wetlands. As in the case of Vilathikulam taluk under the basin area the dry land percentage was as high as 96.11% while the wetland percentage was a low 3.89%. In average, the kallar basin area consists of 83.91% of dry land and 16.09% of wetlands. Among cereals, paddy, cumbu and cholam occupy greater proportion of the area. Green gram and black gram are the major pulses cultivated. Among spices, coriander and chillies accounts for greater proportion of the area. In the non-food category cotton occupies the major area. Sand mining
Among the villages covered the river basin, illegal sand mining is carried out in Mullur. Water flows through the Kallar and Korampallam only during the rainy seasons. Due to the sand mining the free flow of water is interrupted and much water doesn’t reach the end region of the river. Industries
A total of 57 match industries and the waste are dumped in a pit and finally burnt. The effluents are discharged in to the open drains. So far, there has been no pollution problem in the activity of these small-scale industries. Calcium factories/ bone mill at Chozhapuram village sends out foul smell in the area. There are 12 salt pans and 6 match factories.
Solid waste
Ottapidaram block has this consistent problem where the solid wastes are dumped into water bodies. Soil Erosion Erosion is witnessed near Tharuvaikulam and Vellapatti in a slow and steady pace. The Pattinamarudur coast has remains of rocks on the shore that clearly portrays the action on waves on the rocks leaving behind ruptured marks. In the river basin the dry lands occupy the major share compared to wetlands
Waterweeds
Eppodhumvendran tank has sometimes the infestation of Eichornia sp., Lemna major and L. minor. Other than that there is no major water infestation for this basin area.
Water logging and salinity
Water logging is a phenomenon when the soil is clay in nature. These types of lands avoid the percolation of water and water is easily retained. As for salinity this occurs in almost all the coastal villages of Ottapidaram and Vilathikulam taluks. The villages that face salinity problem in the coastal area include Veppalodai, Vadakkukalmedu, Therkukalmedu, Tharuvaikulam, Pattinamarudur and

A-47
Sakkammalpuram. The salinity problem occurs throughout the year. Sea Water Intrusion
The seawater intrusion is found to be a major problem in some of the villages
in both Kallar and Korampallam river basins. Irrational exploitation of the groundwater by digging bore wells has paved way for the intrusion of the seawater into the ground water table. The effect of seawater is felt up to a distance of 9 Km towards the villages in Ottapidaram and Vilathikulam taluks.
Diseases
Most of the villages in both the river basins were devoid of any proper drainage system or sanitation system. The water borne diseases in both the basin areas are found to be caused by bacteria and viruses. The major bacterial diseases are Cholera, Typhoid, Paratyphoid, Dysentery, Diarrhea, Leptospirosis and Tuberculosis.
System deficiencies
1) This system is a good old system existing for more than thousand years, as such requires rehabilitation.
2) Heavy accumulation of silt due to hilly region and contour nature of canal system.
3) The deteriorated condition of the conveyor system resulting in heavy seepage, leakage, especially in the left out portions of WRCP Phase I.
4) Lack of adequate control of regulating structures like anicut etc., 5) Deteriorated canal with low efficiency and their inspection roads. 6) Rehabilitation of system and non system tanks. 7) Lack of awareness among the farmers for effective utilization of water. 8) Lack of modern communication system for effective water regulation
Proposed actions
1. Improving the overall efficiency of the conveyor systems. 2. Rehabilitation of system and non system tanks. 3. Conjunctive use of surface and ground water in all sources by giving
awareness among farmers. 4. Providing micro irrigation wherever possible in consultation with line
departments. 5. Introducing horticultural crops requiring less water consumption. 6. Introducing modern techniques in crop cultivation like SRI, Vermi compost,
coir pith etc., by giving awareness among farmers using demo plots. 7. Providing check dams, gully plugging etc., so as to increase the ground water
recharge and reduction in soil erosion. 8. Providing adoptive research trials and publicity, seminar etc, among the
farmers of the sub basin with the help of TNAU. 9. Providing modern communication system for effective water regulation.

A-48
KODAIYAR RIVER BASIN
Demography
Kothaiyar basin has an area of 1523 Km2 and it covers almost the entire Kanyakumari District. There are four Municipalities, five urban town Panchayats, sixty-one rural town Panchayats and one Panchayat Township. The population density of this basin is 994 people per Km2 as against state population density of 428 people per Km2 Location
Kodaiyar river basin is located between latitude 08o05 N and 08o35 N and longitude 77o05 E and 77o35 E. This basin lies at the southern most tip of Indian Peninsular. This is a small basin having an area of 1533 Sq.Km and hilly area of 607 Sq. Km, which is more than 1/3rd of basin area. The entire basin in the north and Nambiyar basin in the east and Neyyar basin of Kerala state in the west. Out of four taulk of Kanniyakumari districts it covers the full extent of Villavancode, Kalkulam and Agastheeswaram taulk and most of Thovalai taulk.
Hydrology
The river Kodaiyar originates in the western slope of Western Ghats and falls into Arabian Sea near Thengapattinam in the name of Tambaraparani. The river has got two main tributaries – Kodaiyar and Paralayar.The river Kodaiyar is the major tributary of river Kuzhithuraiar and it originates on the western slopes of Agasthia hills at an altitude of 1500m M.S.L. and has many tributaries of which Chittar I and Chittar II are major ones.
Geology
The geological formations met within the Kothaiyar river basin belong to the Archaean, Tertiary and Quarternary ages. The Archaean formations include garnetiferous sillimanite gneiss, garnetiferous biotite gneiss, felspathic gneiss and charnockite. The tertiary formations include thin bands of shell limestone, sandstone and variegated clay, which are overlain by recent to sub recent kankar, laterite, terisands coastal alluvium and soils. Hydrogeology
Groundwater in this basin occurs under water table conditions in the weathered zones of gneiss and charnockites. The depth of well extends upto 40m below ground level (bgl). The water level varies from 19 to 25m in summer and in winter it reaches to ground level to 3m below ground level. Weathered and partially weathered zone underlying the topsoil varies from 8m to 65m bgl.
A-49
Water Potential The surface and groundwater potential of Kodayar basin is 925 MCM, 342.1 MCM and Pazhayar Sub Basin is 95.5 MCM, 117.09 MCM respectively. Surface Water Quality
The entire sewage coming from the Municipal limits of Nagercoil is let into Pazhayar River and its branch Parakkaikal. This poses considerable pollution. Surface water quality is affected due to coir retting along the coast of Kanyakumari district.
Ground Water Quality
The chloride contents in the well near Mylady exceeds the permissible limit of 1000 mg/lit, the content being 1175 and 1283 mg/lit for pre and post-monsoon period respectively. However in well Aralvoimozhi increased sulphate content is noted over certain periods. In Mylaudy and Aralvoimozhi nitrate content is found to be high. In general water quality is found to be good in most areas. Agriculture
Kothaiyar basin has a total cultivated area of 106559 ha. The net area sown on an average is 80944 ha and area sown more than once is about 19816 ha. The major crop is paddy. The oil seeds crop like gingelly, groundnut, castor, millets like cholam, cumbu, ragi, pulse crops like green gram, red gram, balck gram, and sugar cane occupies the remaining area.
Forest
The Forests in Kanyakumari District are verdant and virgin and are said to be 75 million years old. Of the total district area of 167130 ha. Government Forests occupy an area of 50486 ha which comes to about 30.2 % of the total District geographic area. The forest area is 30.2 % of total district geographical area, which is next to Nilgiris district with 59 % and Dharmapuri District with 38 % in the State. The District is having 52% of its forests as dense forests coming only second to Dharmapuri District with 58 %.
Sand mining
Sand mining is severe in the places of Chitharai, Mancaud, Themanoor and Kuzhithurai of the basin area.

A-50
Soil Erosion
There is the specific catchment degradation problem in the watershed of this basin. The areas severely affected by this basin are Kanyakumari and Thengaipattinam.
Encroachment
The river basin is degraded and damaged due to different types of encroachments. The waterspread area of most of the ponds reduced and increased siltation. The encroachment of the channels and their banks reduced or totally obstructed the flow of water.
Weeds Waterweeds are a major problem in most of the ponds in Kanyakumari district. The blocks affected by waterweeds are Rajakkamangalam, Agasthesswaram, Kallakulam and Vilavancode. The dominant weeds are Eichhornia, Ottelia, Lotus, Lilly, Ipomoea, Salvinia, Pistia, Trapa, Typha and Neptunia.
Sea Water Intrusion
Kanniyakumari Districts covers a long coastline running for about 65km. Length. Cystaline rocks comprising granite occupy most of the 6 miles area from sea cost and gneiss acts as a barrier to seawater intrusion. The coastal area of the basin is affected by this saline water intrusion. Sea Water intrusion is recorded in many coastal villages, particularly in Anjugramam, Manakudy, Puthalam, Pallam, Eathamozhy, Rajakkamangalam, Kadiyapattinam, Colachel, Midalam, Enayam, and in many others particularly during summer.
Diseases
The common water borne diseases prevalent in the basin are malaria, diarrhea, Jaundice, Japanese encephalitis and cholera. Solid waste Some of the ponds in Municipal; and Town Panchayat areas were filled up with solid wastes and now converted into play grounds, stadiums; and for construction of buildings.
Seismic Zones
The basin area is falling under the Zone II. The basic seismic coefficient for Kodaiyar is taken as 0.02 and the value of importance factor of all types of dams is considered as 3. And being designed based on the specifications specified in IS 1893 – 1984.

A-51
Literacy
The literacy rate is 85.7% for males and 78.39% for females as against the state literacy rate of 74.83% for males and 52.29% for females. Pazhayar sub basin
Pazhayar is one of the sub basins of Kodayar basin considered for treatment under IAMWARM Project. The river Pazhayar actually originates in the Northern slope of Western ghats from Kurathimalai at an altitude of 550m above M.S.L. Thadavaiyar, Ulakkaruviar, Koya Odai, Alanthuraiyar and Poigaiyar are the tributaries of Pazhayar.The river Pazhayar, a medium size river originating near Surulacode, drains the Pazhayar basin and finally enters the Arabian Sea near Manakudy after traveling a distance of 35km. The Pazhayar sub basin area is 476 sq.km.
System deficiencies
1. This system is a good old system existing for more than thousand years, as such requires rehabilitation.
2. Heavy accumulation of silt due to hilly region and contour nature of canal system.
3. The deteriorated condition of the conveyor system resulting in heavy seepage, leakage, especially in the left out portions of WRCP Phase I.
4. Lack of adequate control of regulating structures like anicut etc., 5. Deteriorated canal with low efficiency and their inspection roads. 6. Rehabilitation of system and non-system tanks. 7. Lack of awareness among the farmers for effective utilization of water. 8. Lack of modern communication system for effective water regulation
Proposed actions
1. Improving the overall efficiency of the conveyor systems. 2. Rehabilitation of system and non-system tanks. 3. Conjunctive use of surface and ground water in all sources by giving
awareness among farmers. 4. Providing micro irrigation wherever possible in consultation with line
departments. 5. Introducing horticultural crops requiring less water consumption. 6. Introducing modern techniques in crop cultivation like SRI, Vermi
compost, coir pith etc., by giving awareness among farmers using demo plots.
7. Providing check dams, gully plugging etc., so as to increase the ground water recharge and reduction in soil erosion.
8. Providing adoptive research trials and publicity, seminar etc, among the farmers of the sub basin with the help of TNAU.
9. Providing modern communication system for effective water regulation.

A-52
KOTTAKARIYAR RIVER BASIN
Demography
The basin has a total population of 5,12,046. Out of this male population is 250061 accounts for 48.84% and the female population is 261985 accounts for 51.16%. The average population density of the basin is 229.41 persons/sq.km. The percentage of male literacy of the total male population is 73.78% where as the percentage of female literacy is 55.34.
Location
The Kottakaraiyar basin lies in between 78023’42” E to 7901’12. 5” E longitude and 9029’20” N to 1002’56” N latitudes. The basin extends over a total area of 2232.06 Km2 in the districts of Madurai, Sivagangai and Ramnad.
Hydrology
Kottakaraiyar River is a jungle stream formed by the surplus of many tanks in Sivaganga and Thiruvadanai taluks. The river originates from Kottakaraiyar anicut constructed just below the link channel in Suryankottai River.
Geology
The area is comprised of Archaean Complex on the north west and overlain by Upper Gondwana, Tertiary and recent to sub recent formations on the east. Creataceous formations occur in the Sub-surface. Overlying the Archaeans, upper gondwana formations, known as Sivaganga beds of upper Jurassic age crop out over cretaceous formations of lower cretaceous formations consist of top forming marker limestone bed and the bottom forming the clay sandstone with shale formations. Hydrogeology
The basin is built up of Archean rocks comprising of Gneisses and Charnockites on Western part and sedimentary rocks comprising of Tertiary sandstone and laterite in the Eastern portion. The thickness of weathered zone varies from 20-40m BGL. In Crystalline formations the depth of bore wells range from 14-82m BGL. The Yield of the bore wells range from 50 lpm to 200 lpm. In the sedimentary formations, the thickness of sandstone varies from 70-100m BGL. The depth of the bore well ranges from 27m to 429m BGL. The yield of the bore wells ranges from 50-500 lpm.

A-53
Surface Water Potential
The total surface water potential of the basin is 310.92 Mcum.15% of rainfall recorded is available in the form of surface flow in any season.
Ground Water Potential
The total ground water potential of the basin is 304.69 Mcum Surface Water Quality Sewage disposal is a daily phenomenon, the sewage ponds up in low pockets and gets diluted only when the tank receives water. This amounts to large-scale contamination and affects soil crop and, ground water, as also the health of humans and cattle and aquatic life. Ground Water Quality In Kalaiyarkovil, Thondi, Thiruvadani, Devakottai, Sivangangai areas, the ground water quality is found to be saline and unsafe for human consumption and the chloride values exceed the permissible limits. In Ilayangudy, Sivagangai and Semburam of Karaikudy taluk the ground water wells are found to have excessive nitrates causing nitrate contamination. In some areas of Manamadurai, and Paramakudy taluks, fluoride in ground water is below the lower tolerable limit of 0.4-ppm .In Thondi of Tiruvadanai Taluk and in RS Mangalam the TDS exceeds 5000 ppm. Potable water is available in areas near the coast only at very shallow depth of 6m. Industries Except for a few textile industries, there are no major industries in this basin. Small-scale industries are needed to be established in order to generate employment in the villages. Agriculture
Agriculture is the main occupation of the basin population besides Cattle and sheep-goat keeping and poultry. Of the total cultivable area of 82038 ha, 57715 ha of area is covered under wet agriculture and the remaining 24323 ha under dry crops. Mostly rainfed dry crops are raised in the dry lands and only in areas where well irrigation facility is available, irrigated dry crops are raised. Some farmers, raise irrigated dry crops even in the absence of wells in their lands, by purchasing water from adjacent wells.
Seismic Zones
The basin area is falling under the Zone II. The basic seismic coefficient for Kottakariyar is taken as 0.02 and the value of importance factor of all types of dams is considered as 3. And being designed based on the specifications specified in IS 1893 – 1984.
A-54
Water weeds The weed growth is the major issue of concern in this basin. Most of the water-spread area is covered with ipomea, water hyacinth. Ipomoea is commonly found in many tanks in the basin. Water hyacinth grows prolifically in Ooranies. An average of about 15% of the basin area is estimated to have been covered by these pest plants. The problems encountered in the basin due to the prolific growth of these plants are Water logging
In low-lying areas near the coast water logging conditions prevail. Theseeas are located between Tondi and Devipattinam. The average width of the area affected is about 1.2 km.
Sea Water Intrusion Seawater intrusion is a problem near coastal areas. In R.S.Mangalam, and other coastal areas, potable water is available only in depths up to 6m. In R.S.Mangalam, the TDS exceeds 7000mg/litre. Diseases
Acute diarrheal disease (A.D.D), cholera, Typhoid, Jaundice and Malaria are the diseases that affect the basin population generally. Respiratory disorders and TB are common in Vellalore and areas where stone quarrying is doneLeprosy is prevalent in all areas although the prevalence rate is small.
Sub basins under IAMWARM for 1st year Kottakariyar sub basin Kottakariyar sub basin originated from RS Mangalam tank and confluences at Palk Strait near Puthukadu. Nattarkal and Nattar are the tributaries of the basin. The total area of the sub basin is 1427.20 sq.km. Saruguniar sub basin Saruganiar river is the first river of the basin originating from Alavaikottai tank of Sivagangai Taluk and confluences at R.S. Mangalam big tank and a part of this falls in Kottakariyar.The Surplus of this tank empties into the Palk Strait near Puthukadu. The total area of the sub basin is 557.56 sq.km

A-55
System deficiencies
1. Low level of tank bunds and deep bed sluices reduce the storage capacity of the tank
2. Dilapidated conditions of sluices and weirs resulting in uncontrolled water delivery
3. Lack of adequate control of regulating structures like anicuts Proposed actions
1. Improving the overall irrigation efficiencies by rehabilitation of conveyance and storage system
2. Conjunctive use of surface and ground water by giving awareness to farmers
3. Lining of field channels to the required extent 4. Rehabilitation of system and non system tanks and anicuts

A-56
NAMBIYAR RIVER BASIN Demography
The total population of Nambiyar basin as per 2001 census is 155926 and the male population is 74491 and that of females is 81435. Location Nambiyar River Basin is located in the Southern most part of South India and situated between 8 °33’ N and 8° 33’ N altitude and the longitude 77° 28 E and 78° 6 E. The total area of the basin is 2084 Sq.Km. This basin is bounded by Tambaraparani basin in the North, Pazhayar and Valliyoor basin on the West, Bay of Bengal on the East and Indian Ocean on the South. Hydrogeology
Water level in winter reaches ground level and in summer it lowers down to 10m. Draw down in the ayacut is 2m and recuperation requires 15 hrs. Nearly 2736 wells are located and each well irrigates an area of 1.7 hectares. The non-ayacut area of the sub-basin is 67930.3 hectares. The weathered thickness in the non-ayacut extends up to 17m. Average depth of the well is 11m. Water level in summer lowers down to 9m and reach 4m in winter. Draw down in the non-ayacut is 1.5m and the recuperation requires 15hrs. Seismicity In the seismic Zoning Map of India published by Bureau of Indian Standards, the basin lie in Z one II, which corresponds to seismic intensity VI on M.M. scale. However, the western part of the basin is close to zone III that corresponds to seismic intensity VII. Surface water potential The annual surface water potential for 75% dependability is 203.87MCM Ground water potential The ground water potential of the Nambiyar basin can be taken as 274.74 MCM/year Industries Palmyra industry is in many places. The cottage industries include be-keeping, artificial flowers making, cane furniture, wood turning industry, tailoring etc. Safety matches are done in many places. Handloom weaving, beedi rolling and net weaving are predominant in some places. Cotton and yarn and textile are the main items produced by the large-scale industries.

A-57
Agriculture
Wet crops like paddy, banana, fruits and vegetables, groundnut pulses, millets, cotton are grown and irrigated dry crops like groundnut, pulses, and millets are grown in the basin
Forest
The forest area is only 12.7%, which is very much low compared to national standards, dense forest occurs only in the high altitude ranges of Mahindragiri and surrounding areas. In the plains medium and low dense forest and scrub forest developed.
Water Weeds
Most of the Basin area is covered with waterweeds like Eichornia crassipes, (Mart.) Solms. Lamb, Ipomea carnea Jacq, Prosopis cineraria (L.) Druce. Due to the encroachment of these weeds the flow of water and ground water potential are severely affected. Besides these weeds there are other minor weeds are also seen in the basin.
Diseases
The incidence of water borne diseases is high. Malaria is in high order in Tirunelveli district.
System Deficiencies
1. As the irrigation network is age old, the existing conveyance distribution systems are functioning with moderate / less efficiencies.
2. Due bto outdated old traditional method of irrigation practices, the water use effieciencies are also minimum.
3. The income of the farmers are mainly from agricultural outputs and thereby the living standards of the farmers and their dependant are not enriched.
4. Due to inadequate facilities of transporting, storing and marketing, the full bebefit of the hard works are not rewarded. This in turn reflects in the growth of the Nation.
Proposed actions
1. Improving the over all irrigation efficiency of the existing irrigation system.
2. Saving surface water to possible extent and planning for rain water harvesting.
3. Rehabilitation and modernization of the irrigation structures. 4. Improving the overall conveyance efficiency and in also providing
equitable distribution of irrigation water.

A-58
5. Improve the system tanks and Non system tanks. 6. Adopting Sprinkler and drip irrigation. 7. Conjunctive use of surface and Ground water in all sectors. 8. Awareness and participation of women in WUA.

A-59
PARAMBIKULAM ALIYAR RIVER BASIN
Demography
The total basin population is 14, 61,744.There is a significant growth rate in this basin. Valparai taluk is less thickly populated and there has been a reduction in its growth rate by 4%. The literacy percentage is 65.44 in the basin.
Location
Parambikulam Aliyar Project (PAP) basin is one of the inter-state project of Kerala and Tamil Nadu lies between latitude 10010’N and 100 30’N and Longitude between 760 and 77013E. The total catchment area of PAP is 841 km2. The PAP command area is located in parts of Pollachi, Udumalpet, Palladam and Triuppur taluks in Coimbatore district. A little part of the areas extends into Kangeyam and Dharapuram taluks of Erode district.
Hydrology
Parambikulam River has its origin in Ramakrishna hills and confluence with Challakudi River, the catchment of this dam lies in both Tamilnadu and Kerala state areas, which is dense forest. The total catchment area of PAP is 841 sq.km. The PAP successfully accomplished the diversion of integration of 8 west flowing rivers of which 6 in the Annamalai hills and 2 in the plains for the benefit of drought prone areas of Coimbatore and Erode districts of TamilNadu and stabilizing the existing irrigation system in Chittorpuzha of Kerala.The important tributaries of PAP river basin are Upper Nirar, Thunakadavu, Sholayar and Thirumoorthy.
Geology
The basin area of PAP consists of metamorphic igneous rocks.
Hydrogeology
The potential hard rock aquifers are found in Coimbatore district. The existences of deeply weathered and fractured zones are noticed along certain lineaments, which are capable of yielding potential supplies.
Surface Water Quality
In Thunakadavu dam, the TDS concentration is high. The impounded surface water from Upper Aliar is also very soft with low mineral matter content but however shows somewhat higher figures compare to other dam sources. Surface water is getting contaminated due to coconut fibre soaking. The units of textile industry are contributing most of the contamination and pollution.
Ground Water Quality
A-60
The ground water quality is generally alkaline with pH values ranging from 7.2 to 9. The quality of water in the major part of the area is moderate. Ground water of moderate salinity (less than 200 micromhos/cm) occurs in areas adjoining the various 2000 micromhos/cm has been observed in areas around Palladam and Udumalpet. The poor quality of water is noted in Unjavelampatti, Chinnapoolanginar, Dhali, Udumalpet and Poosaripatti villages. The highest value of EC of >8000 microsiemens/cm is observed in Chinnapoolanginar.
Nitrate concentration is reaching as high as 1200 mg/l. Excessive concentration of nitrate in ground water is found in udumalpet pollachi, negamam, annamalai and kottur. In Anamalai, there is a large fluctuation in the nitrate concentration in ground water over a period of time. Some of the areas with excess fluoride in groundwater are Eachanari, Vadachiittoor, Sangampalayam, Vedasandur, Unjavelampatti, Kolarppatti, Devanurpudur, Erisanampatti, and Karamadaiyur. The occurrence of fluoride is attributed to appetite rich granties gnesis.
Agriculture
The total cropped area is about 190907 Ha which is about 39% of the total basin area. Main crops are cereals, pulses, oil seeds and fibre .Tea plantations are conspicuous in hilly reasons. Paddy is cultivated in the some low-lying pockets. Coconut farmers are suffering for need of water in Pollachi, Udumalai and Palladam areas.
Forest Indira Gandhi wild life sanctuary is one of the important catchment area of the PAP. There are about 320 bird species in the sanctuary. Anamalai wild life sanctuary is the largest sanctuary in Tamil Nadu with a wide variety of flora and fauna including many endemics. Catchment degradation There is excessive deforestation in Western Ghats. Cattle growing are polluting the river system. Due to cattle washing in the water bodies, there is a spread of leptospirosis disease in vk pudur, anaimalai, kothur and samathur. Seismic Zones
The basin area is falling under the Zone II. The basic seismic coefficient for PAP is taken as 0.02 and the value of importance factor of all types of dams is considered as 3. And being designed based on the specifications specified in IS 1893 – 1984.
Salinity
Ground water of moderate salinity (less than 200 micromhos/cm) occurs in areas adjoining the various 2000 micromhos/cm has been observed in areas around

A-61
Palladam and Udumalpet. Such poor quality, areas are generally covered by black cotton soil with poor drainage. The urban areas of Palladam, Udumalpet and Tiruppur have contributed to higer salinities due to human activities and also due to textile industry to some extent.
Sand mining
Sand mining is done in water-spread areas of Aliyar and Thirumurty dam. This has lead to ground water depletion in the riverbed. Water logging Water logging is found in certain places like Poosaripatti and Anamalai in Pollachi taluk, Ammapatti in Gudimangalam block, Kongalnagar, salayur and C.P.Kinar in Udumalpet block. Water Weeds
Waterweeds are a major problem in the PAP basin. The waterweeds like Pistia and Eichornia cover larger area of water body in Anamalai, Kottur and Samathur. Diseases
Water borne bacteria are responsible for causing cholera, dysentery and gastro enteritis. Diseases like Malaria, Yellow fever, filariasis are distinctly seen in Anamalai, Kottur, Somanur, Dhali of the basin.
Tribals
A total of 4600 tribals with 6 major tribal communities in 35 settlements in PAP basin. Tribals play a criucal role in preserving forest and wild animals and primitive agricultural practices. Natural organic farming and bio control of pests are practiced. Palar sub basin
Palar is one of the sub basins of PAP basin. The average rainfall in this sub basin is 90 cm.
System deficiencies 1. 40% of the conveyance system has been rehabilitated under wrcp phase 1 2. Conveyance efficiency gets reduced to greater extent 3. Tail end areas are not getting equitable supply of water Proposed actions 1. Increasing application efficiency from 65 -85%

A-62
2. Rain water harvesting 3. Replacement of inefficient agricultural pumpsets 4. Construction of godowns, drying yards and supply of tarpaulins 5. Reduce the conveyance and distribution losses and improve it to 70-80% by field
channel lining

A-63
TAMBRAPARANI RIVER BASIN
Demography
This is the largest basin, 212 revenue villages are included in this area. It starts with Tirunelveli taluk and ends with Tiruchendur taluk of Tuticorin district. The total area of this river basin is 1,57,090.7 hectare. Total population of this area is 4,83,632. The total female population (2,49,938) is larger than the male population (2,33,694). The overall literacy rate of Tamiraparani river basin is 57%. In this area 66% of the male population and 53% of the female population are literates
Location
The River Tamiraparani is located in the world map, between 08o 8’ and 09o 23’ N latitude and 77o 09’ and 77o 54’ E longitude. The total area of the district is 6,823 sq. km. The river basin of the district includes Shenkottai, Tenkasi, Sankarankovil (Part) Veerakeralampudur, Ambasamudram, Nanguneri (Part), Tirunelveli and Palayamkottai taluks. In the Thoothukudi district Srivaikuntam and Tiruchendur Taluks (Part), are in the river basin. The total area of the basin constitutes 5942 sq km the whole basin lies fully in the boundaries of Tamilnadu.
Hydrology
The river Tambraparani originates at Agastya-Malai (Pothigai Hills) on the Eastern slopes of Western Ghats at an altitude of 200 OM and it confluences with the bay of Bengal at Gulf of Mannar. The total length of river is 120 K.M. (80 K.M. in Tirunelveli District and 40 K.M. inThoothukudi District approximately. Kariyar, Servalar, Pambar, Manimuthar, JambuNathi, Ramanathi, GadanaNathi, Patchaiyar, Chittar are the tributaries of Tambraparani. The river drains with its tributaries an area of about 4500 sq. km.
Hydrogeology
The aquifer thickness in the sedimentary area ranges between 5.0 to 40.0 m underlain by clay, Sand stone, shale or weathered rock, water table in aquifer varies from 10m to 18.0m bgl.
Surface water and ground water potential
The annual water potential of the state including surface and ground water is assessed as 46,540 Mm3 (1643 TMC) where as the estimated demand is 54,395 Mm3 (1921 TMC) as of now and is likely to shoot up to 57,725 Mm3 (2038 TMC) by the year 2050.
Surface Water Quality
The Calcium Carbonated hardness varies from 20 – 125 mg/l. Though the hardness of water in Tambraparani basins was not very high, even that the level was found to be ecologically effective. The amount of Chloride ion was ranges from 7 –

A-64
28 mg/l, this moderate level of Chlorides cause sufficient water pollution. The values of TDS ranges from 20 – 201 mg/l. BOD ranges between 1.0 – 5.0 mg/l. and COD ranges between 8.0 – 200 mg/l.
Ground water quality
The ground water is fit for domestic and industrial purpose in inland area while in coastal areas, there is Saline water intrusion results in high concentration of TDS and minerals like chlorides and renders the ground water unsuitable for the purpose for which they were serving.
Industries The industries located within 5 km from the banks of Tamiraparani River are Tamil Nadu State Transport Corporation Workshop, Papanasam, Coats Vyolla Limited, Vickramasingapuram, Sun Paper Mills, Cheranmadevi and TamilNadu State Corporation Workshop Tirunelveli. In addition to that many small-scale industries are also located along the banks of the river. There are 26 industries in the basin area. Agriculture Paddy, Banana, Sugarcane, Groundnut, Chillies, cotton, Sorghum, Cumbu, Ragi, Vegetables and Pulses are the various crops raised in Tamiraparani basin area. In dry regions, diversified cropping patterns exist and no single crop claims a large share of the gross cropped area. Millets are cultivated in dry lands as rainfed crops. The dominant crops cultivated in the Tamiraparani are paddy, banana, groundnut, chillies, cholam, cumbu, ragi and maize. In this basin, the major crop is paddy as it occupies 60.7% of the gross cropped area.
Forest
The reserve forest is comprised of two adjacent wildlife sanctuaries viz. Kalakkad wild life sanctuaries and Mundanthurai Wild life Sanctuaries. Both in Tirunelveli district and also part of Veerapuli and Kilamalai reserve forest in Kanyakumari district. The total area of the reserve is 895 sq. km The total catchments area of this basin is 4500 sq. km. of which hilly catchments area (western ghats) is 688 sq. km. The papanasam reserve forest, part of kalakad- Mundanthurai tiger reserve is included in this catchment.
Catchment Degradation The total catchment area of this basin is 4500 km2 of which hilly catchment area is 688 km2. The Papanasam reserve forest and a part of Kalakad - Mundanthurai tiger reserve constitute the catchment area. In the Upstream areas of Thamiraparani River, removal of vegetation, erosion of bank materials, absence of canopy cover are the common features. Soil Degradation

A-65
Tamiraparani river basin with tropical climate typically faces the problem of
soil degradation to a higher degree during summer, as vegetation dries up and the ground is loosend, topsoil-developing cracks. Subsequently heavy rains carry huge quantum of silt in to the river.
Waterlogging
Water logging is found in the taluks of Palyamkottai, Ambasamudram, Tirunelveli and Srivaikuntham of Tirunelveli District in Tambraparani Basin Water logging in Tirunelveli district is not permanent in nature.
Salinity
In the areas like Punnakayal and Athur in Thoothukudi district, the backwater flows in to Tambraparani River. Due to this the ground water in the adjoining places has been contaminated. In sawyerpuram area, where the ground water extraction is little bit larger scale, high salinity is noticed in ground water due to presence of calcareous materials
Encroachment
Encroachment is intensive in plains of the river, channel and ponds. Encroachments occur in Chittar Water Basin in 27 villages, in Gundar 2, in Hanumannadhi 14, in Karuppanadhi 5, in Tambraparani 49 and in Manimuttar 1village.
Water Weeds
The invasion of waterweeds is more pronounced in this basin. Eichhornia and Ipomoea are the most dominant weeds in this basin. The infestation ranges from 10 to 100% in the tanks in this area. In Melathiruvenkatanathapuram tank Nymphaea Stellata (Lily), Melumbium Speciosum (Lotus) are seen. Pistia is seen in tanks in Muneerpallam, Kilanatham, vagaikulam, Udaiarkulam, etc. The infestation of waterweeds is estimated to be 3200 ha in this sub-basin
Solid Waste
Out of the 21 local bodies, which are letting untreated raw sewage in to the river, only the Tirunelveli municipality is provided with a sewerage scheme for part of the town. This scheme covers the main town and palaya pettai area. The total length of the sewers is about 40km. Pumping station is located to the east of Nainarkulam. Diseases
When the water is released from the Papanasam reservoir, bad odur is felt. Impounded water in the reservoir contains ova of mosquitoes and other virus germs causing malaria, Typhoid, Cholera etc.

A-66
Seismic Zones
The basin area is falling under the Zone II. The basic seismic coefficient for Tambraparani is taken as 0.02 and the value of importance factor of all types of dams is considered as 3. And being designed based on the specifications specified in IS 1893 – 1984
Sub basins under IAMWARM for the 1st year Manimuthar sub basin
The river Manimuthar is a major tributary of the Tamiraparani. It arises from
the dense forest atop Senkutheri in Ambasamudram taluk at the height of about 1300 m. above MSL. The tributaries of the Manimuthar are the Keezha Manimuthar (lower or eastern Manimuthar) and the Varattar. The river runs from its source for a distance of 9 km. and confluences with the Tamiraparani near Kallidaikurichi. The catchment area of the river is 100.55 km2. The total area of the Manimuthar sub basin is 199.5 sq km. The total area of this sub basin is 4,204.47 hectare and total population is 20,459. Among this female population is 10,304 and male population is 10,155. In manimuthar sub – basin 72% male population is literate and 54% of female population is literate. Though the female population is higher than the male population the literacy rate of female population is low. System Deficiencies
1. Heavy silt accumulation due to hilly region 2. Deteriorated condition of conveyor system resulting in heavy seepage, leakage
especially in the left out portions of WRCP phase-1 3. Lack of adequate control of regulating structures like anicuts, sluices
Proposed actions Improving the overall irrigation efficiency of conveyor system by
rehabilitation of channels, tanks and anicuts 1. Conjunctive use of surface and ground water 2. Adoption of latest technology in agriculture
Chittar sub basin
Chittar sub – basin is the second largest area in the Tamiraparani river sub –
basin. 127 revenue villages are come under Chittar sub – basin. The total area of this sub – basin is 1,51,547.8 hectare. Total population of this area is 4,68,577. Male population is 2,31,790 and female population is 2,36,787. In chittar sub – basin the total literacy rate is 47%. The male literacy rate is 58% and female literacy rate is 35%.
There are 17 anaicuts in Chittar irrigation system. Total ayacut is 9646 ha. Of this 2074 ha is irrigated directly and 7,570 ha is irrigated indirectly. Total number of villages benefited is 120 and there are 4,294 wells in this area. Tank irrigation is the major source in this sub basin.

A-67
System Deficiencies
1. Heavy silt accumulation due to hilly region 2. Crop failure 3. Traditional methods of irrigation practices 4. Difficulty in transportation 5. Damages due to wild animals
Proposed actions Improving the overall irrigation efficiency of conveyor system by
rehabilitation of channels, tanks and anicuts. 1. Providing drip and sprinkler irrigation systems to conserve ground water 2. Constriction of rain water harvesting structures such as farm ponds 3. Adoption of latest technology in agriculture 4. Construction of Gabion structures across the waterways to arrest siltation in
the downstream tanks Lower Tamiraparani sub basin System Deficiencies
1. Heavy silt accumulation due to hilly region 2. Deteriorated condition of conveyor system resulting in heavy seepage, leakage
especially in the left out portions of WRCP phase-1 3. Lack of adequate control of regulating structures like anicuts, sluices
Proposed actions
1. Conjunctive use of surface and ground water 2. Adoption of latest technology in agriculture 3. Providing thrashing floors, farm roads for easy conveyance and to get quality
farm products 4. Training the farmers in hitech irrigation systems 5. Improving the overall irrigation efficiency of conveyor system by
rehabilitation of channels, tanks and anicuts

A-68
VAIPPAR BASIN Demography
Vaippar basin area further covers 14 taluks and 17 panchayat unions. The taluks covering fully within the basin are Srivilliputhur, Rajapalayam, Sattur, Virudhunagar, Sivakasi and Sivagiri while covering part of taluks of Peraiyur, Thirumangalam, Aruppukottai, Kariapatti, Kovilpatti, Ettayapuram and Vilathikulam and Sankaran kovil. Location
Vaippar river basin is located in the southern most part of South India and situated between latitude 8° 59’N to 9° 49’N and longitude 77° 15 E to 78° 23’ E. This basin is bounded by Vaigai basin and Western Ghats on the western side, Tambaraparani and Kallar river basin on the southern side and Gundar river basin on the northern side and the Gulf of Mannar on the east. The basin area of 5423sq.km covers the administrative districts of Virudhunagar (68%) Madurai (7%) Tirunelveli (5%) and Thoothukudi (20%). There are 9 municipalities, 6 town panchayats and 13 rural town panchayats. Hydrology
The river Vaippar is known as Nichabandhi in the upper reaches. Only after the confluence of Deviar with Nichabandhi the river is called as Vaippar.The River originates at an altitude of 1,651 m above MSL in the Vasudevanallur reserve forests on the Eastern slopes of the Western Ghats at Neduntheri Mottai in Sivagiri Taluk of Tirunelveli district.
Hydrogeology
The occurrence and movement of groundwater in the hard rocks are controlled by the secondary porosity developed in them. Since the greater part of Virudhunagar District is underlain by crystalline metamorphic rocks of Archaean age, weaker zones like joints, fractures and fault zones and the pore spaces in the weathered zone play a dominant role in determining the water bearing and yield characteristics of these rocks. The weathered thickness in this formation varies from 4-30 mt and depth to basement varies from 10-63 mt. The maximum and minimum water levels are observed as 1 mt and 25 mt below ground level.
Ground Water Potential
The ground water potential is 1167 MCM, which is roughly 4.9% of the available total ground water potential of the state. There are at about 148 observation wells in the basin covering an area of 18.3 sqkm.

A-69
Surface water potential The total storage capacity of this basin as created now is 638.86 mcm (104.46mcm + 559.40 mcm). Surface Water Quality The surface water quality is generally good in all sub basins, low in TDS (<0.5 gms/cm), chloride medium to hard (temporary) alkaline in nature. All streams and tanks complied with drinking and irrigation quality standards. The surface water is low in T.D.S. and Chlorides, medium to hard (temporary), alkaline in nature and complies with drinking and irrigation water quality standards. The E.C. value varies from 0.13 ms/cm to 1.46 ms/cm. Nitrogen concentrations are less than 5 ppm.
Ground Water Quality
Water samples show that certain parts in Virudhunagar and Sivakasi are having less fluoride content (<0.4 mg/l) while in Aruppukottai, Kariapatti, Sathur and Rajapalayam area, the content is above 1.5 mg/l. In Vaippar basin, Srivilliputhur, Alangulam, Sathur, Naduvakurichi and Vellankulam are areas of high concentration of nitrate. The industrial effluents discharged by the textile and dying units contaminate the ground water.
Industries
In the Vaippar basin about 76 major and medium industries and 9000 minor industries are located mostly concentrated in Sivakasi, Srivilliputhur, Sattur, Rajapalayam and Virudhunagar taluks of Virudhunagar district, Kovilpatti in Thoothukudi district and Vasudevanallur in Tirunelveli district. Textile, cement, chemical industries, match and fireworks industries are prominent in the area. Sattur, Sivakasi and Rajapalayam are the leading industrial towns in this basin.
Agriculture
In Vaippar basin, major area is under black soils viz., Vertisols and less area red soils and other types of soils. Paddy, sugarcane, cotton, Chillies, Vegetables, Pulses, Millet, Groundnut and Sunflower are the crops raised in Vaippar basin area. Paddy is the principal crop extensively cultivated in the state. Paddy is grown in all the districts in the state. It accounted for 32.8% of the total cropped area in the state during 2000-01.
Seismic Zones
The basin area is falling under the Zone II. The basic seismic coefficient for Vaippar is taken as 0.02 and the value of importance factor of all types of dams is considered as 3. And being designed based on the specifications specified in IS 1893 – 1984.

A-70
Forest
The total area of this basin is 5423 km2 of which plain area is 4841 km2 and hilly area is 582 km2. The Vasudevanallur reserve forest, Rajapalayam reserve forest and Srivilliputtur reserve forest of Western Ghats are included in the hilly catchment area.
Water Logging
Water logging temporarily occurs during rainy season in Virudhunagar and Thoothukudi Districts. It is understood that we can expect a possible drainage problem if the E.C value of the soil exceeds due to the salinity of soil.
Water Weeds
The common waterweeds present in the river basin are water hyacinth, Ipomea, Nymphaea Typha and water lettuce. Water hyacinth and Ipomea Carnia are common everywhere. These are present in Vilathikulam, Rajapalayam and Sivagiri taluks. Sand mining
Sand has been removed to a depth of about 1.80 m in the Nagariyar River near
Kallanai anicut in Seithur village, Rajapalayam taluk. As a result, there is no flow of water on the left side of the river through Kallanai anicut to the lower down tanks. Sand mining is noticed on the upstream side of the Rajapalayam – Kalingapatti Road bridge near Vadakarai Village in the Sevalperiar river to a depth of about 1.20 m. Sand mining was found to be severe on the down stream side of the road bridge leading to Shenbagathoppu, in the head reach of Anathalaiyar river which joins Kayalkudiyar river near the origin. Sand mining is alarming on the upstream and down stream of the check dam as well as in the vicinity of the infiltration well for a depth of about 1.20m and 2.50m respectively.
Solid waste In Vaippar basin there are 9 Municipalities, 6 urban town Panchayats and 13 rural town Panchayats.
Rural town Panchayats Solid waste generated/day (1) T.Kallupatti 2.4 MT (2) Pudur 2.2 MT (3) Sethur 5.5 MT (4) S .Kodkulam 3.5 MT (5) Kariapatti 3.8 MT (6) W.Pudupatti 2.4 MT (7) Sundarapandian 2.5 MT (8) Mamsapuram 5.5 MT (9) Rayagiri 3.1 MT (10) S.Pudur 3.6 MT (11) Thiruvengadam 1.9 MT (12) Sivagiri 6.4 MT

A-71
(13) Vasudevanallur 6.4 MT
Seawater intrusion
Seawater intrusion is experienced in Vilathikulam taluk of Vaippar basin. The river Uppodai is an estuarine complex area having the influence of the tidal seawater that can be felt to a distance of 5-6 km. inland. At Keelzhavaippar village, where the Vaippar river joins the sea, sea water intrudes upto Vaippar bridge and extends upto Subramanyapuram making ground water and drinking water saline.
Diseases
Acute Diahhoreal disease, Respiratory tract infection, whooping cough, Arthritis and Viral fevers are more prevalent than other diseases in Virudunagar district while Malarial cases numbering about 194 were reported in Kil Vaippar, Vaippar and Vembar villages in Thoothukudi district. Respiratory tract infection, Anaemia, Typhoid and Viral fevers are common in Sankarankovil taluk of Tirunelveli district. In Kovilpatti area, gastro-enteritis, dysentery, cholera, jaundice and meningitis are reported. Sandaiyur hamlet in T.kallupatti block, Madurai District has old leprosy cases and in M.Puliampatti few people are affected by hydrosol and filaria. Goiter is found in T.Kunnathur while corneal ulcer (eye problem) in Peraiyur block.
Sub basins under IAMWARM for the 1st year
Nichabanadhi Sub basin
Vaippar is called as Nichabanadhi in the head reach. It originates in Vasudevanallur reserve forest on the eastern slopes of Western Ghats in Sivagiri Taluk of Tirunelveli District. Ullatrumottai and Pudumalai Kavu are the other two hills on the other side of Kerala State. This sub basin area is 565 sq.km out of which the hilly area is 62 sq.km. There are 18 anicuts, 15 system tanks, and 151 non-system tanks in this sub basin. The command area is 5683.71 ha. Kalingalar sub basin
The river Kalingalar, a tributary of Nichabanadhi, originates in the Vasudevanallur reserve forest area, just north of the origin of Nichabanadhi at an altitude of about 1325 m. The total drainage area of this sub basin is 111 sq.km. There are five anicuts across Kalingalar. There are 31 tanks under this sub basin. The total registered ayacut including system and non-system ayacut is 2451.22 ha. Sinkottaiyar sub basin Sinkottaiyar originates near Aruppukottai area at about 100 m above MSL. Sinkottaiar starts in the plains with a catchment area of 487 sq.km. Aruppukottai and Nagalapuram towns lie in this sub basin. The command area under this sub basin comes under non-system ayacut. 37 tanks feed an extent of 2105.82 ha.
A-72
Sindapalli uppodai sub basin
Sindapalli Uppodai is a tributary to Arjunanadhi and it is a small sub basin. It originates at an altitude of about 120m above MSL near Duraisamypuram village of Sivakasi taluk. Sindapalli uppodai has a plain catchment area of 177 sq.km. There is no anicut across Uppodai. There are 25 non-system tanks in this sub basin and the total registered ayacut is 842.60 ha. Arjuna nadhi sub basin Arjunanadhi is a major tributary to Vaippar River Periyar reservoir was constructed in the year 1976 across the river Periyar with a capacity of 5.452 mcm to benefit 388.5 ha. System deficiencies
1. The system is a good old system existing for more than hundred years, as such requires rehabilitation.
2. Heavy accumulation of silt due to hilly region and contour nature of canal system.
3. Lack of adequate control of regulating structures like anicut etc., 4. Deteriorated canal with low efficiency and their inspection roads. 5. The system and Non-system tanks are to be rabilitated.
Proposed actions
1. Rehabilitation of system and non-system tanks, Anicuts. 2. Introducing hitech irrigation methods including drip and sprinkler
irrigation. 3. Laying of pipelines for water conveyance. 4. Water harvesting structures for ground water recharge. 5. Sinking of new bore wells and electrification. 6. Thrashing floors and farm road in necessary places. 7. Providing modern agriculture machineries. 8. Providing retaining structures where erosion is high. 9. Conjunctive use of surface and ground water in all sources by giving
awareness among farmers. 10. On farm development works. 11. Replacement of old pumps sets. 12. Desiliting of existing inflow / outflow and drainage channels. 13. Farm pond 14. Community Wells. 15. WUA Buildings. 16. Training and exposure visits for farmers and project staff.

A-73
STATISTICAL DATA CHENNAI BASIN
1. Districts and Coverage of area
S.No District Districts area in Sq.Km.
District areas falling in the basin (Sq.Km)
% of area in the basin
1 Chennai 174 174 100
2 Tiruvallur 7857 4275 54.4
3 Vellore 6077 1093 17.98 Source: IWS, Tharamani
2. Details of Sub basin area
S.No. Name of the Basin Area of the Basin (Sq.Km)
1 Araniyar 763
2 Kusaithaliyar 3240
3 Cooum 682
4 Adayar 857
Total 5542
Source: IWS, Tharamani
3. Geographical Spread– Taluk and Blocks
S.No Name of River Basin
District Taluk Block
1 Chennai Chennai
2 Thiruvallur Gummidipoondi
Gummidipoondi
Ponneri Sholavaram
Minjur
Uttukottai Ellapuram
Tiruttani Tiruttani
Thiruvelankadu
Pallipattu Pallipattu
RKPet
Thiruvallur Poondi

A-74
Kadambattur
Tiruvallur
Poonamalle Poonamele
3 Kanchepuram Sriperumbudur Kunnathur
4 Vellore
Arakkonam Kaveripakkam
Nemili
Arakkonam
Sholigar
Walajapet Walajapet
4. Details of Major Reservoirs
Capacity (MCM) S No Name of the Dam/Reservoir Before
Raising FRL After
Raising FRL
Command Area (ha)
1 Poondi 77.96 97.98 NIL
2 Red Hills 80.71 93.46 NIL
3 Cholavaram 25.63 25.30 NIL
4 Chembarabakkam 88.36 103.23 5, 452
5. Water Potential of Sub-basins
S.No Name of Sub-basin
Utilisable ground water recharge in MCM
Net ground water in MCM
Balance potential in MCM
Percentage of development
1 Araniyar 140.49 69.10 71.39 49.18
2 Kuasithalaiyar 549.99 448.66 101.33 81.57
3 Cooum 206.70 148.28 58.42 71.34
4 Adayar 222.21 102.82 119.39 46.27
Total 1119.39 768.86 350.53 68.69

A-75
6. Water exploitation areas
Basin Overexploited > 100 % Exploited
Critical 90- 100 % Exploited
Semi-Critical 70%- 90%
Safe < 70%
Tiruvallur Ellapuram Minjur Pallipattu RKPet Thiruttani Tiruvelankadu
Kadambatthur Poonamalle
Gummidipoondi Madhavaram Pooneri Sholavaram Thiruvallur
Villivakkam
Vellore Sholingur Nemili Arakkonam
Walaja
Kaveripakkam
Kanchepuram Kunnathur
7. Water Demand and Water Balance
S No Purpose 1999 2004 2019 2044
1 Domestic uses 230.88 253.32 320.62 432.79
2 Agriculture 3655.57 3655.57 3033.69 2619.11
3 Industries 129.35 172.46 301.81 517.38
4 Livestock 38 38 38 38
5 Power 22.4 23 25 30
6 Environment 28 28 28 28
7 Total 4104.2 4170.35 3747.12 3665.28
8 Water Balance (MCM)
-2078.2 -1739.35 -1316.12 -1234.28
(Source: State framework resources Plan of Tamil Nadu) 8. Land use / Land cover
S. No Description Area (ha)
1 Geographical area 5,54,200
2 Forest 28,264

A-76
3 Barren and uncultivable waste 17,734
4 Land under non - agricultural use 1,45,755
5 Cultivable waste 12,192
6 Permanent pastures and other crazing land 12,192
7 Current fallows 74,817
8 Other fallows 52,649
9 Land under Misc. use 15,518
10 Net area sown 1,95,078
(Source: State Framework resources plan PWD/WRO)
9. Crops and extent of cultivation
S No
Crop Season Area (ha)
Gross Irrigated Area (%)
79,390
29,205
23,070
60.3
22.2
17.5 1
Paddy
Sub Total
Samba
Navarai
Soranavari
1,31,665 100
2 Ground Nut Dec-April 37,622 19.8
3 Sugar cane Jan-Nov 8,546 4.5
4
5
6
Cholam
Cumbu
Ragi
Mar-Jun 5,395 2.8
7 Vegetables Feb-July 3,545 1.9
8
Pulses
Black gram
Green gram
Feb-April 3,545 0.7
9 Gingelly Jan-May 1,039 0.5
10 Chillies Feb-July 1,019 0.5
(Source: Environmental Status report of Chennai Basin, 2001)

A-77
10. List of tanks with weeds S.No Location Name of Tank Type of Weed 1 Kakkalur Kakkalur Tank Ipomea
2 Kadambattur Kadambattur Prosopis
3 Pandur Pandur Prosopis
4 Panambakkam Panambakkam Big and Small Tank
Ipomea
5 Senji Senji Big tank Ipomea
6 Valliyur Valliyur tank Ipomea
7 Pattaraiperumpudur Pattaraiperumpudur Manjakuppam
Prosopis
8 Misrakandapuram Misrakandapuram Prosopis
9 Mylerwada Mylerwada Prosopis
10 Athimanjari Athimanjari Ipomea
11 Janakarajakuppam Janakarajakuppam Padmapuram
Prosopis
12 Peddanaganpudi Peddanaganpudi Prosopis
13 Silambu Silambu tank Ipomea
14 Vediyankadu Vediyankadu Prosopis
15 Veeramangalam Veeramangalam Ipomea
16 Medur Medur Large Prosopis
17 Guduvanjeri Guduvanjeri Tank Prosopis
18 Andavoyal Andavoyal Ipomea
19 Aladu Aladu ex zamin tank
Prosopis
20 Vembedu Vembedu ex zamin tank
Ipomea
21 Tatamanji Tatamanji system tank
Prosopis
22 Kattur Kattur system tank Prosopis
23 Pralayambakkam Pralayambakkam PWD tank
Ipomea
24 Nallur Nallur Tank Prosopis
25 Gnayar Gnayar tank Ipomea
26 Perungavoor Perungavoor tank Prosopis
27 Amoor Amoor tank Prosopis
28 Nerkundrum Nerkundrum tank Ipomea

A-78
29 Athipattu Athipattu Thangal PWD tank
Prosopis
30 Arani Arani PWD Tank Ipomea
31 Puduvoyal Puduvoyal ex zamin tank
Ipomea
11. List of Red Category industries in Kosasthalaiyar Basin
No.of Industries Disposal of Effluent
S.No. Name of Industry
Total no in the basin
Generating Trade effluent
Using with in their premises
Using with in their premises
Letting out in open ditches/storm water drains
1 Chemical 40 21 15 15 6
2 Rubber 2 2 1 1 1
3 Steel plant 4 1 1
4 Elector Planting 1 1 1
5 Oil&Refinery 3 3 2 3
6 Paper&pulp 1 1 1 1
7 Engineering 8 2 1 1 1
8 Foundry 6 2 2 2
9 Cement 1 1 1 1
10 Tannery 4 3 3 1 2
11 Fertilizer 4 3 3 1 2
12 Thermal Plant 3
13 Pesticide 1
14 Petrochemical 2 2 2 1 1
15 Non-ferrous 1
16 Miscellaneous 15 8 7 8
Total 96 50 38 33 17

A-79
12. Prevalent Diseases Reported Cases
Year Acute Diarrhea Dysentery Cholera Jaundice Malaria 2002 7098 2678 435 324 45
2003 7247 2455 345 267 43
13. Population details
Population Districts Region
Persons Male Female
Vellore Total 30,26,432 15,29,944 14,96,488
Rural 20,66,718 10,48,055 10,18,663
Urban 9,59,714 4,81,889 4,77,825
Kanchipuram Total 24,42,179 12,44,756 11,97,423
Rural 14,29,610 7,24,502 7,05,108
Urban 10,12,572 5,20,257 4,92,315
Tiruvallur Total 27,38,866 13,90,292 13,48,574
Rural 12,46,832 6,25,817 6,21,015
Urban 14,92,034 7,64,475 7,27,559
Chennai Total 42,16,268 21,61,605 20,54,663
Rural 0 0 0
Urban 42,16,268 21,61,605 20,54,663

A-80
14. Literacy level
Literate Districts
Persons Male Female
Vellore 1572292 950943 621349
Kanchipuram 1980898 1096992 883906
Tiruvallur 1857231 1041183 816048
Chennai 3079004 1670094 1408910
(Source: Statistical handbook of Tamil Nadu, 2002)
15. Tourist attractions
S No
District Tourist Place/Pilgrim center
1 Chennai Fort St. George, Santhome, AnnaSquare, Deer Park, Snake Park, Marina, Kapileswar Temple, Besant nagar temple
2 Vellore Vellore Fort, Elagiri,Rathinagiri and Sholingur
3 Kancheepuram Anna zoological park, Mammallapuram,VGP golden beach, MGM, Kishkintha and Kancheepuram temple
4 Tiruvallur Poondi reservoir, Sriperumbudur, Thiruverukadu and Thiruttani
(Source: Statistical Handbook of Tamil Nadu, 2002)

Annexure-I
A-81
16. Sewage generation
Nature of disposal and
quantity Open (C/P)
Water Body
Population 2001
Estimated Sewage
Generation
(MLD)
Existence of Sewerage
Under Ground (C/P)
Upto Primary
Upto Secondary
Upto Teritiary
No Treatment
River
Reservoir Land
A) Corporation
Chennai
4,216,268 112 yes yes No 112 B) Municipalities Thiruvallur 45,517 12.60 - P - - - Yes 3.50 - 9.10 Avadi 230,913 55.00 - P - - - Yes - - 55.00 Ambathur 302,492 54.00 - P - - - Yes - 2.00 52.00 Kathivakkam 32,556 14.70 - P - - - Yes - - 14.70 Madhavaram 76,793 16.50 - P - - - Yes - - 16.50 Thiruvottiyur 211,768 49.62 7.6 Km.(p) P - - - Yes 40.00 - 9.62 Alandur 146,154 43.50 - P - - - Yes - - 43.50 Thambaram 137,609 27.30 - P - - - Yes - - 27.30 Pallavaram 143,984 28.65 - P - - - Yes - - 28.65 C Town Panchayats (Urban) Thruverkadu 30,734 9.00 P P - - - Yes 7.00 - 2.00 Thiruthani 38,502 12.00 - C - - - Yes - - 12.00 Poonamallee 42,522 8.50 - C - - - Yes - - 8.50

Annexure-I
A-82
Manali 28,174 - - P - - - Yes - - -
Porur 28,782 2.80 - P - - - Yes 2.80 - - Nature of
disposal and quantity
Open (C/P)
Upto Teritiary
Water Body
Towns
Population 2001
Estimated Sewage
Generation
(MLD)
Existence of Sewerage
Under Ground (C/P)
Upto Primary
Upto Secondary
No Treatment
River
Reservoir Land
Ponneri 24,205 5.40 - P - - - Yes - - 5.40
Naravarikuppam 18,327 - - P - - - Yes - - -
Minjur 18,327 2.50 - P - - - Yes - - 2.50 Puzhal 20,297 1.00 - P - - - Yes - 1.00 -
Chinnasekkadu 9,744 - - P - - - Yes - - -
Thirunindravur 29,395 - - P - - - Yes - - -
Uthukottai 10,639 - - P - - - Yes - - -
Maduravayal 44,127 7.00 P P - - - Yes 7.00 - - Thirumazhisai 15,271 4.80 - P - - - Yes - - 4.80 Gumudipoondi 16,116 3.30 - P - - - Yes - - 3.30
Pallipat 8,904 - - P - - - Yes - - -
Pammal 49,744 10.75 - C - - - Yes - - 10.75 Anakaputhur 31,733 5.20 - P - - - Yes - - 5.20 Chitlapakkam 25,292 4.75 - P - - - Yes - - 4.75

Annexure-I
A-83
Kundrathur 25,028 9.85 - P - - - Yes - - 9.85 Nandhampakkam 9,093 6.55 - P - - - Yes - - 6.55 N.Guduvancherry 27,386 6.43 - P - - - Yes - - 6.43 Perungalathur 27,386 5.30 - P - - - Yes - - 5.30
Nature of disposal and
quantity Open (C/P)
Upto Teritiary
Water Body
Population 2001
Estimated Sewage
Generation
(MLD)
Existence of Sewerage
Under Ground (C/P)
Upto Primary
Upto Secondary
No Treatment
River
Reservoir Land
Puzhudivakkam 29,086 6.90 - P - - - Yes - - 6.90 Sriperumpudur 16,085 4.75 - P - - - Yes - - 4.75 Sholinganallur 15,519 3.85 - P - - - Yes - - 3.85 Pallikaranai 22,503 3.80 - P - - - Yes - - 3.80 Thiruneermalai 29,086 6.85 - P - - - Yes - - 6.85 Total 6,236,061 545.15 369.85
17. Status of solid waste management
waste management
Population 2001
Solid Waste Management
(Tonnes)
Workers for solid waste anagement
Total No.
No./1000
Population
Availability Of Compost
Yard
Recycling as
Manure Yes/No
If yes annual
Production
Minjur 18,327 4.5 4 90 15

Annexure-I
A-84
Puzhal 20,297 2.85 Chinnasekkadu 9,744 NA Thirunindravur 29,395 3.5 3 98 18 Uthukottai 10,639 NA Maduravayal 44,127 2.5 0.5 20 10 Thirumazhisai 15,271 NA Gumudipoondi 16,116 NA Pallipat 8,904 5.50 5.00 90.91 28 0.70 Nil No - Pammal 49,744 5.50 4.50 81.82 6 0.31 Nil No - Anakaputhur 31,733 3.80 3.50 92.11 10 0.58 Nil No - Chitlapakkam 25,292 4.20 4.00 95.24 14 0.56 Nil No - Kundrathur 25,028 2.50 2.25 90.00 8 0.72 Nil No - Nandhampakkam 9,093 - - - - - Nil No - N.Guduvancherry 27,386 - - - - - Nil No - Perungalathur 27,386 3.50 3.25 92.86 13 0.68 Nil No - Puzhudivakkam 29,086 - Nil No - Sriperumpudur 16,085 1.76 1.50 85.23 21 2.33 Nil No - Sholinganallur 15,519 1.25 1.00 80.00 3 0.13 Nil No - Pallikaranai 22,503 2.50 2.00 80.00 6 0.60 Nil No - Thiruneermalai 29,086 1.25 1.00 80.00 3 0.13 Nil No -
Total
6,236,061

Annexure-I
A -85
PALAR BASIN
1. Geographical Area and Coverage
S.No. Districts Area (sq.km.)
1 Vellore 4710.58
2 Kanchepuram 2187.90
3 Thiruvanamalai 4012.19
Total 10,910.67 Source: IWS Report, Tharamani
2. Geographical Spread– Taluks and Blocks
S.No District Taluk Block 1 Vellore Walajapet Sholinghur(part)
Walajapet (part)
Arcot Arcot
Timiri
Gudiyatham Gudiyatham
Pernampet
Katpadi KVKuppam
Katpadi
Tirupattur Tirupattur (part)
Natrampalli (part)
Vaniyambadi Madhanur
Jolarpett(part)
Alangayam (part)
Vellore Anicut
Vellore
Kaniyambadi
Arakkonam Kaveripakkam (part)
Nemili (part)
Kanchepuram Kanchepuram Kanchepuram (part)

Annexure-I
A -86
Walajabad (part)
Chengalpattu Kattankaolathur (part)
Thiruporur (part)
Thirukazhukundrum
Thirukazhukundrum
Sriperumbudur Sriperumbudur (part)
Uthiramerur Uthiramerur
Maduranthagam Achrapakkam(part)
Madhurantagam(part)
Cheyyar Lathur (part)
Chittamur(part)
Thiruvanamalai Cheyyar Vembakkam
Cheyyar
Annakavur
Vandavasi Pernamallur (part)
Thellar (part)
Vandavasi(part)
Polur Polur
Kalasapakkam
Chetput
Thiruvanamalai Thurijinapuram(part)
Chengam Jawadhi Hills
Pudupalayam
Chengam(part)
Thandrampet(part)
Arni Arani
West Arani

Annexure-I
A -87
3. Zone wise surface water potential
Source: State Frame Work Report, IWS, Tharamani
4. Ground Water exploitation areas - 2003
District Over exploited- Greater than 100%
Critical- 90% to 100%
Semi Critical- 70% to 90%
Safe – less than 70%*
Kanchepuram Tiruporur Thirukalikundrum Chittamoor Acharapakkam
Kattankalathur Uthiramerur
Walajabad
Kanchepuram
Madurantagam
Lathur
Sriperumpudur
Vellore Kaniyambadi Nemili Walaja
Anaicut Kaveripakkam
Madanur
Peranampet
Gudiyatham
KVKuppam
Katpadi
Thirupattur
S.No. Name of zone 75% Dependable Surface Water Resource in MCM
South West North East Annual
1. Upper Palar 147.46 162.44 409.52
2. Lower Palar 81.25 117.46 245.57
3. Kavundanilya Naganadhi
45.94 50.57 137.55
4. Upper Cheyyar 113.53 135.99 315.09
5. Lower Cheyyar 90.22 112.54 261.52
6. Kiliyar Palar 121.54 207.48 388.75
Total for Palar River Basin 599.94 786.48 1758.0
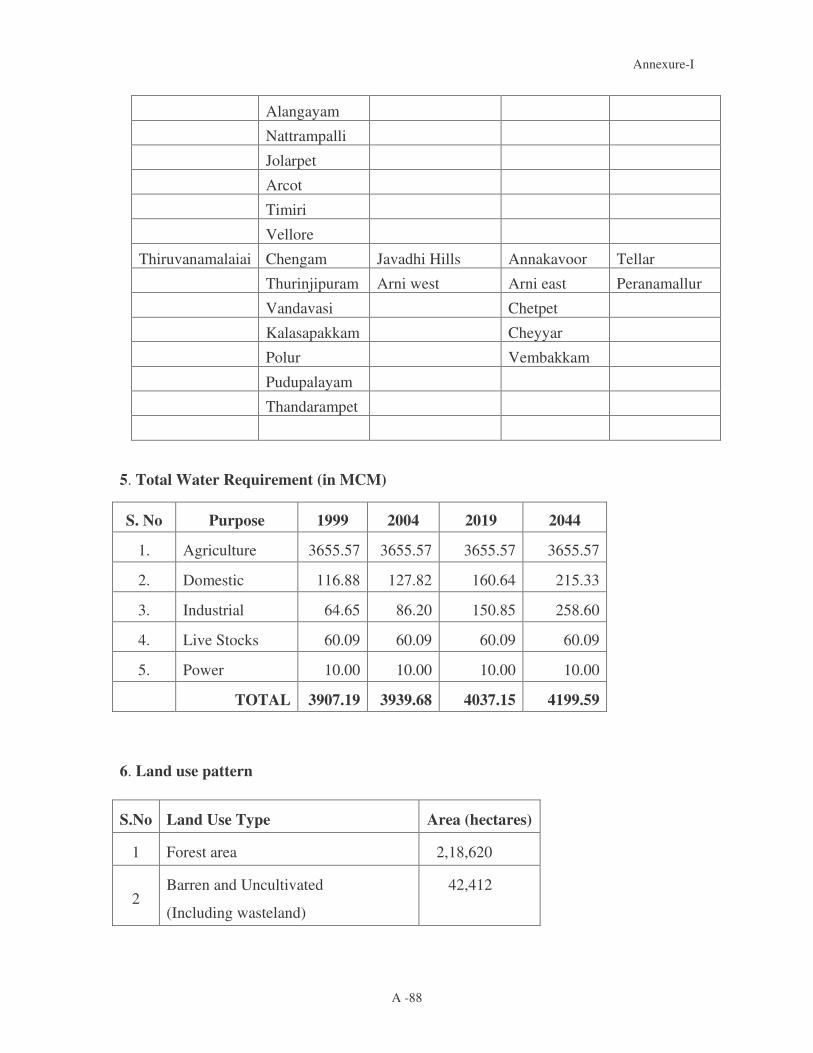
Annexure-I
A -88
Alangayam
Nattrampalli
Jolarpet
Arcot
Timiri
Vellore
Thiruvanamalaiai Chengam Javadhi Hills Annakavoor Tellar
Thurinjipuram Arni west Arni east Peranamallur
Vandavasi Chetpet
Kalasapakkam Cheyyar
Polur Vembakkam
Pudupalayam
Thandarampet
5. Total Water Requirement (in MCM)
S. No Purpose 1999 2004 2019 2044
1. Agriculture 3655.57 3655.57 3655.57 3655.57
2. Domestic 116.88 127.82 160.64 215.33
3. Industrial 64.65 86.20 150.85 258.60
4. Live Stocks 60.09 60.09 60.09 60.09
5. Power 10.00 10.00 10.00 10.00
TOTAL 3907.19 3939.68 4037.15 4199.59
6. Land use pattern
S.No Land Use Type Area (hectares)
1 Forest area 2,18,620
2 Barren and Uncultivated
(Including wasteland)
42,412

Annexure-I
A -89
3 Non agricultural 1,72,042
4 Cultivated wasteland 18,804
5 Permanent pastures and grazing land 15,219
6 Current Fallows 93,128
7 Other Fallows 46,244
8 Miscellaneous Use 10,762
9 Net area sown 4,76,836
(Source: Status report of the Palar basin, 2003)
7. Population
Districts Region Population Male Female
Vellore Total 34,82,970 17,43,871 17,39,099
Rural 21,64,654 10,85,192 10,79,462
Urban 13,18,316 6,58,679 6,59,637
Kanchipuram Total 28,69,920 14,55,302 14,14,618
Rural 13,35,189 6,73,387 6,61,802
Urban 15,34,731 7,81,915 7,52,816
Tirvanamalai Total 21,81,853 10,93,191 10,88,662
Rural 17,81,304 8,93,132 8,88,172
Urban 4,00,549 2,00,059 2,00,490
(Source: Statistical handbook of Tamil Nadu, 2002)
8. District wise literacy level
Districts Literates Male Female
Vellore 22,46,052 12,66,981 9,79,071
Kanchipuram 19,80,898 10,96,992 8,83,906

Annexure-I
A -90
Tiruvannamalai 13,17,651 7,73,367 5,44,284
(Source: Statistical handbook of Tamil Nadu, 2002)
9. District wise Tourist attractions
S.no District Tourist Place/Pilgrim center
1 Vellore Vellore Fort, Elagiri,Rathinagiri and Sholingur
2 Kancheepuram Anna zoological park, Mammallapuram,VGP golden beach, MGM, Kishkintha and Kancheepuram temple
3 Tirvannamalai Sattanur, Javvadu Hills and Tiruvanmalai temple

Annexure-I
A -91
10. Environmental Status of Domestic sector – Sewerage Condition-Towns in Palar River Basin
Existence of Sewerage
Nature of disposal
and quantity
Water Body Name of the town
Population
2001
Estimated
Sewage Generat
ion (Lakh Lit)
Under
Ground
(C/P)
Open (C/P)
Upto Prima
ry
Upto Seconda
ry
Upto Teritiary
No Treatm
ent River
Reservoir Land
Dharapadavedu (TP) 30070 12.00 Yes 12.00
Kalinjur (TP) 16853 7.20 Yes 7.20
Kangeyanallur (CT) 12669 6.00 Yes 6.00
Gandhinagar (Katpadi Extn) (TP) 9487 4.00 Yes 4.00
Pallikonda (TP) 20771 10.40 Yes 10.40
Shenbakkam (TP) 13390 7.20 Yes 7.20
Sathuvachari (TP) 44942 20.00 Yes 20.00
Konavattam (CT) 9359 4.00 Yes 4.00
Allapuram (TP) 26948 12.00 Yes 12.00
Thorapadi (TP) 13924 6.40 Yes 6.40
Palavansathu (CT) 16962 8.00 Yes 8.00
Odugathur (TP) 8148 4.00 Yes 4.00

Annexure-I
A -92
Virupakshipuram (CT) 12885 5.60 Yes 5.60
Thuthipattu (CT) 6984 2.40 Yes 2.40
Uthayendram (TP) 11567 5.60 Yes 5.60
Jaffrabad (CT) 6631 2.40 2.40
Tiruvanamalai
Polur (TP) 25505 11.20 No Yes - - - Yes - - 11.20
Arani (M) 60815 21.00 No Yes - - - Yes - - 21.00
Kannamangalam (TP) 7316 2.10 No Yes - - - Yes - - 2.10
Peranamallur (TP) 5557 1.75 No Yes - - - Yes - - 1.75
Tiruvethipuram (M) 35201 14.14 No Yes - - - Yes - - 14.14
Pudupalayam (TP) 10005 7.00 No Yes - - - Yes - - 7.00
Kalambur (TP) 13291 4.20 No Yes - - - Yes - - 4.20
1512565 529.708 497.54
8
12. Water Quality Analysis – Palar River (Selected Locations, Wells and Parameters)
District Block Village Well No
Date of collection
EC_GEN pH_GEN Ca SO4
Palar River
Kancheepuram Thirukazhukkuntram Vayalur U23091 1/24/03 860 8.2
Kancheepuram Thirukazhukkuntram Vayalur U23091 4/24/03 920 7.8
Kancheepuram Thirukazhukkuntram Vayalur U23091 7/27/03 790 7.5 48 5

Annexure-I
A -93
Kancheepuram Thirukazhukkuntram Sadras U23089 7/21/03 1060 8.4 54 77
Kancheepuram Thirukazhukkuntram P. V. Kalathur 02001 7/21/03 670 8 44 29
Kancheepuram Kattankolathur Patravakkam 02026 7/30/03 810 8.4 40 65
Kancheepuram Kattankolathur Karunilam 02012 7/21/03 1380 8.1 86 86
Kancheepuram Kancheepuram Orikkai Water Works 2403 7/31/03 370 8.5 24 19
Kancheepuram Kancheepuram Kailasanatharkoil U23005 7/31/03 1520 8.1 36 44
Kancheepuram Walajabad Walajabad 02037 7/31/03 1620 8.3 52 144
Vellore Kaveripakkam Karivedu U23029 7/17/03 1420 8 40 81
Vellore Kaveripakkam Karivedu U23029 1/9/03 1600 8.6
Vellore Arcot Pudupadi 21527 7/18/03 6300 7.5 20 350
Vellore KV Kuppam Latteri 21541 7/24/03 1430 8.1 68 115
Vellore Gudiyatham Gundalapalli 21547 7/24/03 2560 7.7 40 226
Vellore Gudiyatham Arumbaruthi 21511 7/25/03 2640 8.2 72 211
Vellore Natrampalli Kothur 21542 7/29/03 1410 8.4 22 72
Vellore Vaniyambadi Vaniyambadi 23023 1/6/03 3550 8.3
Vellore Vaniyambadi Vaniyambadi 23023 4/11/03 3680 8.2
Vellore Vaniyambadi Vaniyambadi 23023 7/28/03 3800 8.5 48 211
Vellore Vaniyambadi Natrampalli 21543 7/29/03 1270 8.3 24 91
Vellore Vaniyambadi Vengili 21512 7/28/03 1430 8.2 58 106
Vellore Vaniyambadi Thekkupattu 21544 7/28/03 1260 8.2 16 71
Vellore Madhanur Kommeswaram 21550 7/28/03 3430 8 120 274
Vellore Anaicut Perumugai 23071 7/25/03 950 8.2 20 62

Annexure-I
A -94
Vellore Vellore Poigai sathyamangalam
23078 1/10/03 1740 8
Vellore Vellore Poigai sathyamangalam
23078 4/8/03 2450 7.9
Vellore Walajahpet Sengalnatham 21556 7/19/03 6600 7.6 40 523
Vellore Walaja Sathambakkam U23042 7/19/03 760 7.7 30 35
Vellore Walajahpet Gudimallur 21529 7/19/03 900 8.4 34 45
Tiruvannamalai Cheyyar Natteri 21578 8/12/03 2970 7.5 168 149
Tiruvannamalai Cheyyar Dusi 21577 8/19/03 1410 7.8 36 61
Kancheepuram Thirukazhukkuntram Vayalur U23091 1/24/03 78 4
Kancheepuram Thirukazhukkuntram Vayalur U23091 4/24/03 113 4
Kancheepuram Thirukazhukkuntram Vayalur U23091 7/27/03 106 5 463 200
Kancheepuram Thirukazhukkuntram Sadras U23089 7/21/03 138 3 646 265
Kancheepuram Thirukazhukkuntram P. V. Kalathur 02001 7/21/03 74 3 404 170
Kancheepuram Kattankolathur Patravakkam 02026 7/30/03 149 4 461 295
Kancheepuram Kattankolathur Karunilam 02012 7/21/03 213 11 824 380
Kancheepuram Kancheepuram Orikkai Water Works 2403 7/31/03 50 2 236 125
Kancheepuram Kancheepuram Kailasanatharkoil U23005 7/31/03 277 8 993 120
Kancheepuram Walajabad Walajabad 02037 7/31/03 213 5 1005 190
Vellore Kaveripakkam Karivedu U23029 7/17/03 269 3 781 300
Vellore Kaveripakkam Karivedu U23029 1/9/03 383 2

Annexure-I
A -95
Vellore Arcot Pudupadi 21527 7/18/03 1914 5 3571 1800
Vellore KV Kuppam Latteri 21541 7/24/03 149 19 917 325
Vellore Gudiyatham Gundalapalli 21547 7/24/03 468 41 1634 410
Vellore Gudiyatham Arumbaruthi 21511 7/25/03 447 23 1591 300
Vellore Natrampalli Kothur 21542 7/29/03 163 17 859 305
Vellore Vaniyambadi Vaniyambadi 23023 1/6/03 865 22
Vellore Vaniyambadi Vaniyambadi 23023 4/11/03 822 21
Vellore Vaniyambadi Vaniyambadi 23023 7/28/03 978 17 2342 900
Vellore Vaniyambadi Natrampalli 21543 7/29/03 199 7 680 355
Vellore Vaniyambadi Vengili 21512 7/28/03 213 13 848 500
Vellore Vaniyambadi Thekkupattu 21544 7/28/03 128 8 755 265

Annexure-I
A-96
PENNAIYAR BASIN
1. Basin Area District Wise
S. No.
Name of the District
Total Area of
the District
Area of the basin falling in
the District
% Area of the District falling
in the basic
% Area of basin falling in
the District
1. Dharmapuri 9622 6744.03 70 59.91
2. Vellore 6077 460.35 7.57 4.09
3. Thiruvannamalai 6312 1761.00 13.54 7.59
4. Villupuram 7222 2195.22 30.4 19.5
5. Cuddalore 3678 1002.44 27.25 8.91
11257.00 100.00
2. List of Blocks
S.No. Block Name Taluk Name District Name 1. Papireddipettai Harur Dharmapuri
2. Harur Harur Dharmapuri
3. Morapur Harur Dharmapuri
4. Uttangarai Uttangarai Dharmapuri
5. Dharmapuri Dharmapuri Dharmapuri
6. Nallamapalli Dharmapuri Dharmapuri
7. Palacode Palacode Dharmapuri
8. Kaveripattanam Pochampalli Dharmapuri
9. Bargur Krishnagiri Dharmapuri
10. Krishnagiri Krishnagiri Dharmapuri
11. Kelamangalam Dhenkanikottai Dharmapuri
12. Veppanapalli Krishnagiri Dharmapuri
13. Sholagiri Hosur Dharmapuri
14. Hosur Hosur Dharmapuri

Annexure-I
A-97
S.No. Block Name Taluk Name District Name 15. Karimangalam Palacode Dharmapuri
16. Mathur Uttangarai Dharmapuri
17. Pennagaram Pennagaram Dharmapuri
18. Thally Dhenkanikottai Dharmapuri
19. Alangayam Vaniyambadi Vellore
20. Thirupattur Thirupattur Vellore
21. Kandili Thirupattur Vellore
22. Nattarampalli Thirupattur Vellore
23. Jolarpet Thirupattur Vellore
24. Yercaud Yercaud Salem
25. Ayodhyapattinam Valapadi Salem
26. Peddanayakkampalayam Attur Salem
27. Thiruvannamalai Thiruvannamalai Thiruvannamalai
28. Thandrampattu Chengam Thiruvannamalai
29. Chengam Chengam Thiruvannamalai
30. Pudupalayam Chengam Thiruvannamalai
31. Thurinjapuram Thiruvannamalai Thiruvannamalai
32. Kilpennatur Thiruvannamalai Thiruvannamalai
33. Kandamangalam Villupuram Villupuram
34. Kolianur Villupuram Villupuram
35. Kanai Villupuram Villupuram
36. Thiruvennainallur Ulundurpettai Villupuram
37. Thirukovillur Thirukovillur Villupuram
38. Mugaiyur Thirukovillur Villupuram
39. Rishivandiyam Kallakurichi Villupuram
40. Sankarapuram Kallakurichi Villupuram
41. Kalarayan Hills Kallakurichi Villupuram
42. Ulundurpet Ulundurpet Villupuram
43. Tiyagaidurgam Kallakurichi Villupuram
44. Gingee Chenji Villupuram
45. Thirunavalur Ulundurpettai Villupuram
46. Annagraman Panruti Cuddalore
47. Panruti Panruti Cuddalore
48. Cuddalore Cuddalore Cuddalore
49. Vridachalam Vridachalam Cuddalore
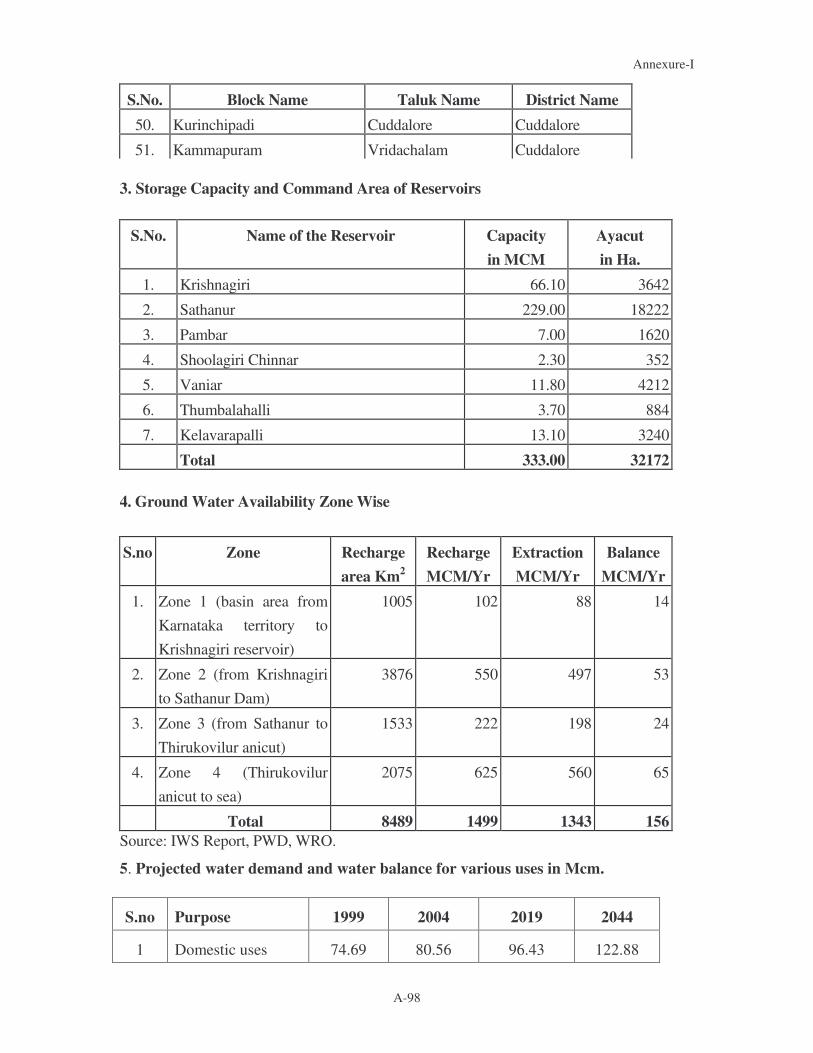
Annexure-I
A-98
S.No. Block Name Taluk Name District Name 50. Kurinchipadi Cuddalore Cuddalore
51. Kammapuram Vridachalam Cuddalore 3. Storage Capacity and Command Area of Reservoirs
S.No. Name of the Reservoir Capacity in MCM
Ayacut in Ha.
1. Krishnagiri 66.10 3642
2. Sathanur 229.00 18222
3. Pambar 7.00 1620
4. Shoolagiri Chinnar 2.30 352
5. Vaniar 11.80 4212
6. Thumbalahalli 3.70 884
7. Kelavarapalli 13.10 3240
Total 333.00 32172 4. Ground Water Availability Zone Wise
S.no Zone Recharge area Km2
Recharge MCM/Yr
Extraction MCM/Yr
Balance MCM/Yr
1. Zone 1 (basin area from Karnataka territory to Krishnagiri reservoir)
1005 102 88 14
2. Zone 2 (from Krishnagiri to Sathanur Dam)
3876 550 497 53
3. Zone 3 (from Sathanur to Thirukovilur anicut)
1533 222 198 24
4. Zone 4 (Thirukovilur anicut to sea)
2075 625 560 65
Total 8489 1499 1343 156 Source: IWS Report, PWD, WRO.
5. Projected water demand and water balance for various uses in Mcm.
S.no Purpose 1999 2004 2019 2044
1 Domestic uses 74.69 80.56 96.43 122.88

Annexure-I
A-99
2 Agriculture 2668.8 2668.8 2321.4 2089.78
3 Industries 104.39 139.18 243.57 417.54
4 Livestock 53.84 53.84 53.84 53.84
7 Total 2901.72 2942.38 2715.24 2684.04
8 Water Balance -31.72 -72.38 154.76 185.96
Source: State framework resources Plan of Tamilnadu 6. Water Requirement for Irrigation Purpose
Crop Area in Ha. Net Crop Water Requirement Mm3
SYSTEM AREA
Paddy 23973 6020
206.80 51.93
Groundnut 13981 63.45
Ragi 12433 50.45
Sugarcane 5820 75.66
Total 62227 448.29
NON-SYSTEM AREA
Paddy (tanks) 28579 246.54
Paddy (Others) 41166 355.12
Sugarcane 26436 343.68
Total 412106 945.34 Source: IWS Report, PWD, WRO

Annexure-I
A-100
7. Classification of Ground Water Exploitation
S.no Block Name Classification as on January 2003
1. Papireddipatti Over Exploited
2. Harur Over Exploited
3. Morapur Over Exploited
4. Uthangarai Over Exploited
5. Dharmapuri Over Exploited
6. Nallamapalli Over Exploited
7. Palacode Over Exploited
8. Kaveripattanam Semi Critical
9. Bargur Over Exploited
10. Krishnagiri Semi Critical
11. Kelamangalam Safe
12. Veppanapalli Over Exploited
13. Sholagiri Semi Critical
14. Hosur Semi Critical
15. Karimangalam Over Exploited
16. Mathur Over Exploited
17. Pennagaram Critical
18. Thally Safe
19. Alangayam Over Exploited
20. Thirupattur Over Exploited
21. Kandili Over Exploited
22. Nattarampalli Over Exploited
23. Jolarpet Over Exploited
24. Yercaud Safe
25. Ayodhyapattinam Over Exploited
26. Peddanayakkampalayam Over Exploited
27. Thiruvannamalai Over Exploited
28. Thandrampatty Over Exploited
29. Chengam Over Exploited
30. Pudupalayam Over Exploited
31. Thurinjiapuram Over Exploited
32. Kilpennatur Over Exploited

Annexure-I
A-101
S.no Block Name Classification as on January 2003
33. Kandamangalam Over Exploited
34. Kolianur Over Exploited
35. Kanai Semi Critical
36. Thiruvennainallur Over Exploited
37. Thirukovillur Semi Critical
38. Mugaiyur Over Exploited
39. Rishivandiyam Over Exploited
40. Sankarapuram Over Exploited
41. Kalarayan Hills Safe
42. Ulundurpet Over Exploited
43. Thilyagaidurgam Semi Critical
44. Gingee Over Exploited
45. Thirunavalur Critical
46. Annagranam Semi Critical
47. Panruti Semi Critical
48. Cuddalore Semi Critical
49. Vridachalam Semi Critical
50. Kurinchipadi Semi Critical
51. Kammapuram Semi Critical
Source: GW, PWD, WRO, Taramani.
8. Land use/ Land cover
S.no Description Area (ha)
1 Geographical area 125700
2 Forest 8500
3 Barren and uncultivable waste ---
4 Land under non - agricultural use 3700
5 Cultivable waste ---
6 Permanent pastures and other crazing land ---
7 Current fallows 29750

Annexure-I
A-102
8 Other fallows 722300
9 Land under Misc. use 28700
10 Net area sown 65000
Source: State Framework resources plan PWD/WRO 9. Cropping Pattern and Crop Calendar
Ist Crop IInd Crop IIIrd Crop Paddy (Aug.-Jan.) Ragi, Millet, Bajra & Pulses
(Jan to April) Paddy (Oct.-Feb.) Paddy (Feb.-Jun.) Groundnut (Nov.-Feb.) Paddy (Dec.-Apr.) Groundnut (Jul.-Oct.) Banana (Jan.-Dec.) Sugarcane (Jan.-Dec.) Sorghum (Jan.-Apr) 10. Disease Prevalence A. Diarrhoea (In Nos.) S.no District Year
1999 2000 2001 2002 2003 Cs Ds Cs Ds Cs Ds Cs Ds Cs Ds
1. Dharmapuri 2258 24 1386 10 1876 31 1433 17 1797 7 2. T.V.Malai 8891 15 5733 3 7441 2 8909 7 8167 1 3. Vellore 9675 20 7706 26 6014 23 5781 20 5884 16 4. Villupuram 3940 33 2498 8 1601 8 2620 7 2121 0 5. Cuddalore 4733 4 5359 17 3724 12 3862 11 3176 5
B. Cholera (In Nos.) S.no District Year
1999 2000 2001 2002 2003 Cs Ds Cs Ds Cs Ds Cs Ds Cs Ds
1. Dharmapuri 14 0 4 0 12 0 18 2 30 1 2. T.V.Malai 8 0 11 0 6 0 11 0 3 0 3. Vellore 37 0 33 0 20 0 13 0 8 0 4. Villupuram 20 0 8 0 15 0 10 0 5 0 5. Cuddalore 6 0 6 0 7 0 4 0 1 0

Annexure-I
A-103
C. Dysentery (In Nos.) S.no District Year
1999 2000 2001 2002 2003 Cs Ds Cs Ds Cs Ds Cs Ds Cs Ds
1. Dharmapuri 5457 0 3869 0 4016 0 4016 0 4691 0 2. T.V.Malai 3888 0 1678 0 1200 0 1636 0 2024 0 3. Vellore 4293 0 4723 0 6202 0 3598 0 3476 0 4. Villupuram 4439 1 1742 0 0 0 0 0 0 0 5. Cuddalore 3343 0 310 0 1790 0 834 0 314 0
D. Typhoid (In Nos.)
S.no District Year
1999 2000 2001 2002 2003
Cs Ds Cs Ds Cs Ds Cs Ds Cs Ds
1. Dharmapuri 126 0 46 0 83 0 349 0 201 0
2. T.V.Malai 149 0 82 0 272 0 229 0 169 0
3. Vellore 66 0 143 0 279 0 305 0 122 0
4. Villupuram 1 0 0 0 0 0 0 0 0 0
5. Cuddalore 23 0 0 0 0 0 0 0 0 0
E. Jaundice (In Nos.)
S.no District Year
1999 2000 2001 2002 2003
Cs Ds Cs Ds Cs Ds Cs Ds Cs Ds
1. Dharmapuri 14 0 36 0 0 0 11 0 10 0
2. T.V.Malai 55 0 10 0 17 0 65 0 13 0
3. Vellore 16 0 2 0 85 0 25 0 104 0
4. Villupuram 11 0 2 0 0 0 0 0 0 0
5. Cuddalore 56 0 0 0 0 0 0 0 0 0
Source: DMS, Chennai.

Annexure-I
A-104
11. Population Details
Population Districts Region
Persons Male Female
Vellore Total 3026432 1529944 1496488
Rural 2066718 1048055 1018663
Urban 959714 481889 477825
Dharmapuri Total 2442179 1244756 1197423
Rural 1429610 724502 705108
Urban 1012572 520257 492315
Tirvanamalai Total 2042979 1030052 1012927
Rural 1800051 907424 892627
Urban 242928 122628 120300
Cuddalore Total 2280530 1148729 1131801
Rural 1527936 770160 757776
Urban 752594 378569 374025
Villupuram Total 2943917 1484573 1459344
Rural 2517447 1269889 1247558
Urban 426470 214684 211786
Source: Statistical handbook of Tamilnadu 2002
12. Literacy level
Literate Districts
Persons Male Female
Vellore 1572292 950943 621349
Dharmapuri 1376328 - -
Tirvanamalai 917548 580423 337125
Cuddalore 1443851 834940 608911

Annexure-I
A-105
Villupuram 1675027 991886 683141
Source: Statistical handbook of Tamilnadu 2002, DES of TamilNadu 13 Tourist attractions
S.no District Tourist Place/Pilgrim center
1 Vellore Vellore fort, Elagiri, Rathinagiri and Sholingur
2 Dharmapuri Hogenakal, Krishnagiri dam, Vanniyar dam and Teerthamalai
3 Tiruvanamalai Sattanur, Javvadu Hills and Tiruvanmalai temple
4 Cuddalore Pitchavaram, Chidambaram and Vadalur
5 Villupuram Tiruvakkarai, Kalrayan Hills, Mylam Temple and Tirukoilur Temple
Source: Statistical handbook of Tamilnadu – 2002

Annexure-I
A-106
14. Industries
S. No.
Name & Location of Industry
Raw materials used Production capacity
Water consumption m3/day
Quantity of effluent m3/day
ETP/STP details
Solid waste details
1. Premier Mills Ltd. Lathur Village Hosur Taluk Dharmapuri Dist.
Cotton - 190 T/m Polyster fibre - 25 T/m Textile dyes - 5 T/m Acetic acid - 3.7 T/m Common salt - 18 T/m etc.
Yarn : 200 T/m Cotton, Synthetic and polyster Fabric : 25 lakhs mts/m
Domestic : 400 Process : 950 Cooling & Boiler Blow down : 250
Sewage : 300 KLD Effluent: 950 KLD
ETP constructed as per TNPCB norms
ETP sludge: 927 T/year
2. Lakshmi Ring Travellers Ltd. Peramdepalli Village Hosur Taluk Dharmapuri Dist.
Ammonia gas- 36 m3/day Nitrogen- 12 m3/day Methanol - 30 Lts/day LPG - 24 m3/day
Ring travellers Domestic : Not available Process : 28
Sewage : Not available Effluent : Not available
ETP constructed as per TNPCB norms.
Nil
3. Kallakurichi Cooperative Sugar Mills Ltd. Moongithuraipattu
Sugar cane - 7.5 lakh T/month Lime - 150 T/m Sulphur - 30 T/m
Sugar - 7500 T/m Molasses - 2700 T/m
Process : 650 Domestic : 100
Effluent : 650 Sewage : 50
ETP constructed as per TNPCB
Ash - 12 T/day dumped in low lying areas.

Annexure-I
A-107
S. No.
Name & Location of Industry
Raw materials used Production capacity
Water consumption m3/day
Quantity of effluent m3/day
ETP/STP details
Solid waste details
Kallakurichi Taluk Villupuram Dist.
Bagasee - 22500 T/m
norms.
4. Chemplast Sanmar Ltd. Marigampalli Village, Krishnagiri Taluk, Dharmapuri Dist.
Not available Not available Not available Not available ETP installed as per TNPCB norms
i) Yeast - 1.6 T/day used as manure
ii) ETP sludge 87/ day disposed as land fill
iii) Fly ash - IT/day disposed as land fill
5. Mira Textiles & Industries (India) Ltd. (Paper Division) Vadakkunemili Village, Thirukoilur Taluk Villupuram Dist.
Waste kraft - boxes & cuttings - 28 T/day Alum - 0.85 T/day Rosin - 0.08 T/day Starch powder - 0.1 T/day
Kraft paper - 750 T/m
Domestic : Not available Process : 200
Sewage : Not available Effluent : 200
ETP installed as per TNPCB norms.
Not available
6. Arunachala Milk Cow milk - 30000 Processed milk - Domestic : 1.5 Sewage : 1.2 ETP Not available

Annexure-I
A-108
S. No.
Name & Location of Industry
Raw materials used Production capacity
Water consumption m3/day
Quantity of effluent m3/day
ETP/STP details
Solid waste details
Product Nallavanpalayam Thiruvannamalai
lts/day 25000 lts/day Process : 50 Effluent : 50 installed as per TNPCB norms
7. K.C.V. Milk Firm Pudukoilur Village Chengam Taluk T.V.Malai Dist.
Milk - 5000 lts/day Processed milk - 4000 lts/day
Domestic : 2.0 Process : 15
Sewage : 1.5 Effluent : 15
ETP installed as per TNPCB norms
Not available
8. Arunal Milk Products Thiruvadal Street Thiruvannamalai
Milk - 12000 lts/day Processed milk - 10000 lts/day
Domestic : 2.0 Process : 25
Sewage : 1.5 Effluent : 25
ETP installed as per TNPCB norms
Not available
9. Heritage Foods India Ltd., Thirunamanallur Thiruvannmalai Dist.
Milk - 5000 lts/day Processed milk - 400 lts/day
Domestic : 2.5 Process : 30
Sewage : 2.0 Effluent : 30
ETP installed as per TNPCB norms
Not available

Annexure-I
A-109
S. No.
Name & Location of Industry
Raw materials used Production capacity
Water consumption m3/day
Quantity of effluent m3/day
ETP/STP details
Solid waste details
10. Arunachalam Sugars Ltd. Malapambadi Village T.V.Malai Taluk
Not available Not available Domestic : 10 Process : 610
Sewage : 9 Effluent : 610
ETP installed as per TNPCB norms
Not available
15. Solid Waste Details A. Dharmapuri District
S. No.
Name of urban local body
Popula- tion
Solids waste T/day
Collection efficiency
Workers for solid waste management
Availability of compost
yard Yes/No
Recycling as manure
Yes/No
If yes, quantity of
annual production
in T Genera-
tion Collect-
ion Total
No. No/1000
population
a. Municipalities 1. Dharmapuri 64696 45 38 84% 90 1.39 Yes Yes 48 2. Krishnagiri 64587 30 25 83% 68 1.03 No No - 3. Hosur 84394 12 9.5 79% 35 0.78 No No -

Annexure-I
A-110
Total 213677 87 72.5 82% 193 1.04 b. Town Panchayats 1. Harur 21523 3.5 3.4 100% 35 1.59 Yes Yes 4.5 2. Palacode 18667 4.5 4.5 100% 20 1.1 No No - 3. Karimangalam 12035 0.8 0.8 100% 25 1.35 Yes Yes 0.8 4. Pennagaram 15306 3 3 100% 20 1.18 No No - 5. Kaveripattanam 14378 4 4 100% 25 1.51 No No - 6. Kelamangalam 11052 3 3 100% 9 0.9 No No - 7. Uthangarai 15443 2.5 2.5 100% 19 1.31 No No - 8. Papireddipatti 8583 0.25 0.25 100% 6 0.7 No No - 9. Bargur 12582 1.8 1.8 100% 12 1.0 No No - 10. Mathur 15257 3 3 100% 7 0.69 No No -
Total 165437 30.35 30.35 100% 196 1.11 5.3 Source: District Environmental Profile, Dharmapuri District. B. Thiruvannamalai District
S. No.
Name of urban local body
Popula- tion
Solids waste T/day
Collection efficiency
%
Workers for solid waste management
Availability of compost
yard Yes/No
Recycling as manure
Yes/No
If yes, quantity of
annual production
in T Genera-
tion Collect-
ion Total
No. No/1000
population
a. Municipality
1. Thiruvannamalai 130567 18.0 15.0 83.3 4 0.03 Yes No -

Annexure-I
A-111
Total 130567 18.0 15.0 83.3 4 0.03 Yes No -
b. Town Panchayats
1. illpennathur 12468 1.0 1.0 100 7 0.56 Yes No -
2. Chengam 23223 5.0 5.0 100 25 1.29 Yes No -
3. Pudupalayam 10005 1.0 1.0 100 11 1.67 Yes No -
Total 45696 7.0 7.0 100% 43 1.17 - - - Source: District Environmental Profile, Thiruvannamalai District. C. Villupuram
S. No.
Name of urban local body
Popula- tion
Solids waste T/day
Collection efficiency
%
Workers for solid waste management
Availability of compost
yard Yes/No
Recycling as manure
Yes/No
If yes, quantity of
annual production
in T
Genera- tion
Collect-ion
Total No.
No/1000 population
a. Municipalities
1. Villupuram 95455 7.2 6.0 90 66 1.2 Yes No Nil
Total 95455 7.2 6.0 90 66 1.2 Yes No Nil
b. Town Panchayats
1. Kallakurichi 36793 4.8 4.0 83.3 34 1.11 No No Nil

Annexure-I
A-112
2. Thiyagadurgam 13633 2.4 2.0 83.3 18 1.26 No No Nil
3. Sangarapuram 12263 1.2 1.0 83.3 8 0.72 No No Nil
4. Thirukoilur 27197 3.6 3.0 83.3 36 1.26 No No Nil
5. Thiruvennainallur 8582 1.2 1.0 83.3 9 1.02 No No Nil
6. Ulundurpet 19258 3.6 3.0 83.3 15 0.8 Yes No Nil
Total 117726 16.8 14 83.3 120 1.03 - - -
16. Raw Water Quality Data of Kelavarapalli Dam for the year 2003 - 2004
S. No. Parameter April 2003
May 2003
June 2003
July 2003
Aug. 2003
Sep. 2003
Oct. 2003
Nov. 2003
Dec. 2003
Jan. 2004
Feb. 2004
1. Turbidity 27 31 27 22 21 16 20 21 21 19 25
2. Electric Conductivity 1026 1047 1041 993 916 824 843 872 995 1013 1044
3. Total Dissolved Solids (mg/l)
718 733 729 965 641 612 590 610 697 709 731
4. pH 7.7 7.9 7.9 7.9 7.6 7.8 7.8 7.5 7.8 7.6 7.7
5. Total Hardness (mg/l) 242 248 254 244 242 216 211 225 245 254 259
6. Iron (mg/l) 0.34 0.32 0.32 0.34 0.32 0.18 0.34 0.2 0.3 0.3 0.4
7. Nitrates (mg/l) 2 2 7 7 12 9 7 8 7 7 4

Annexure-I
A-113
8. Chlorides (mg/l) 134 149 152 145 130 124 120 120 126 128 144
9. Fluorides (mg/l) 0.45 0.45 0.45 0.5 0.45 0.45 0.45 0.4 0.35 0.4 0.5
10. Sulphates (mg/l) 7 6 9 33 15 12 8 8 10 10 12
11. Phosphates (mg/l) 6.2 7.9 5.0 5.9 8.7 10.6 7.8 6.3 7.6 9.6 8.5
12. COD (mg/l) 83 76 - 81 50 - - 41 - 50 -
13. Total coliform 9000 900 - 16000 1600 - - 1600 - 3000 -
14. Fec. Coliform 220 10 - 240 23 130 - 120 Source: TWAD Board, Krishnagiri
17. Treated Water Quality Data of Kelavarapalli Dam for the year 2003 - 2004
S. No.
Parameter April 2003
May 2003
June 2003
July 2003
Aug. 2003
Sep. 2003
Oct. 2003
Nov. 2003
Dec. 2003
Jan. 2004
Feb. 2004
1. Turbidity 4 4 4 4 5 5 4 4 4 4 5
2. Electric Conductivity 1067 1093 1084 1037 970 916 874 904 1031 1044 1074
3. Total Dissolved Solids (mg/l)
747 766 759 726 679 641 612 633 722 731 755
4. pH 7.7 7.7 7.7 7.7 7.6 7.7 7.7 7.6 7.7 7.7 7.7
5. Total Hardness (mg/l) 258 255 274 254 240 227 216 234 256 260 267
6. Iron (mg/l) 0.07 0.1 0.1 0.07 0.13 0.08 0.06 0.06 0.1 0.1 0.1
7. Nitrates (mg/l) 2 3 6 8 12 12 6 7 7 6 4
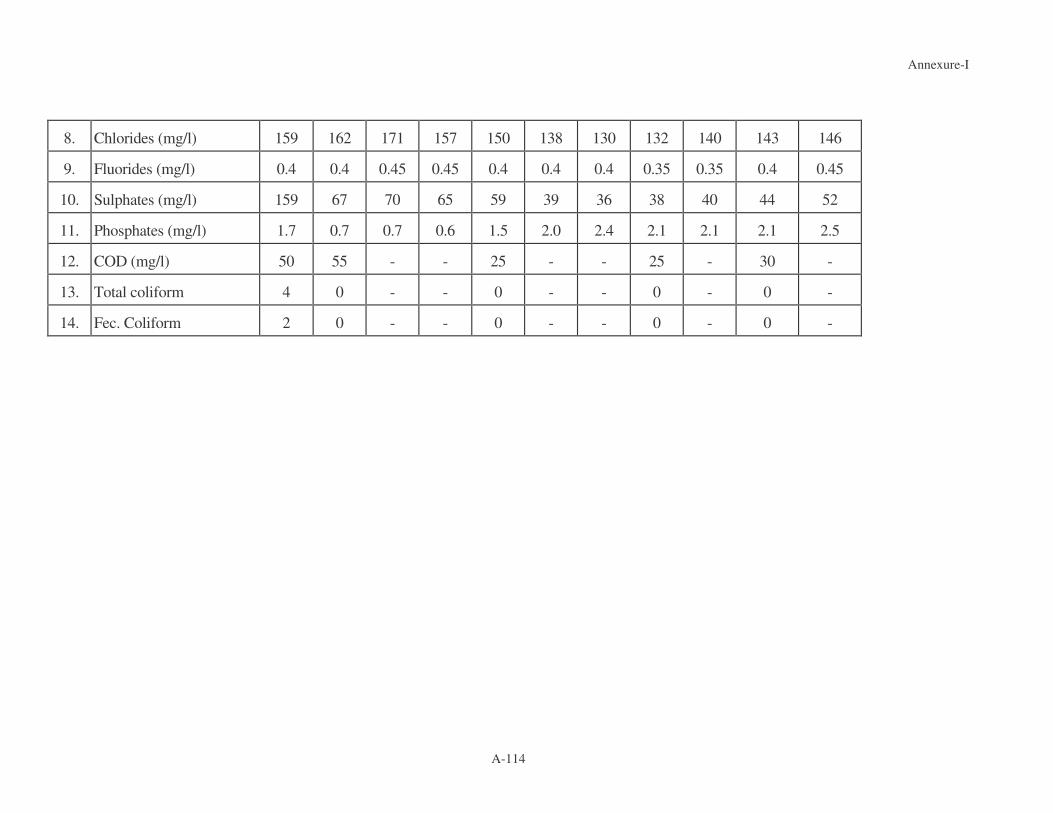
Annexure-I
A-114
8. Chlorides (mg/l) 159 162 171 157 150 138 130 132 140 143 146
9. Fluorides (mg/l) 0.4 0.4 0.45 0.45 0.4 0.4 0.4 0.35 0.35 0.4 0.45
10. Sulphates (mg/l) 159 67 70 65 59 39 36 38 40 44 52
11. Phosphates (mg/l) 1.7 0.7 0.7 0.6 1.5 2.0 2.4 2.1 2.1 2.1 2.5
12. COD (mg/l) 50 55 - - 25 - - 25 - 30 -
13. Total coliform 4 0 - - 0 - - 0 - 0 -
14. Fec. Coliform 2 0 - - 0 - - 0 - 0 -

A-115
VARAHANADHI BASIN 1. Geographical Area and Coverage S.No. Villupuram Thiruvanamalai Kanchepuram Total area of the districts (Sq.Km.)
7217 6191 4433
Basin area in the districts (Sq.Km.)
3138 306 770
Percentage areas of the districts
43.48 4.94 17.37
Percentage of areas of basin in each district
74.47 7.28 18.27
2. Geographical Spread– Taluks and Blocks
Name of River Basin
Area (Sq.Km.)
District Taluk Block
Varahanadhi 4214 Villupuram
Melmalayanaur Melmalayanur
Vallam
Gingee
Tindivanam Mailam
Marakkanam
Vanur Vanur
Villupuram Vikkravandi
Villpuram
Kandamangalam
Thiruvanamalai Thiruvanamalai Kilpenathaur
Kanchepuram Cheyyar Chittamur
Maduranthagam Achrapakkam

A-116
3. Projected water demand and water balance for various uses in Mcm.
S.No. Purpose 1999 2004 2019 2044 1 Domestic uses 43.1 47.13 59.22 79.38
2 Agriculture 1604 1604 1364 1204
3 Industries 30.15 40.2 70.35 120.6
4 Livestock 28.68 28.68 28.68 28.68
7 Total 1705.93 1720.01 1522.25 1432.66
8 Water Balance 192.07 177.99 375.75 465.34
Source: State framework resources Plan 4. Total Water Demand S.No. Purpose Total Water Demand
2004 2019 2044 2050
1 Agriculture 1604.00 1604.00 1604.00 1604.00
2 Domestic 127.82 160.64 215.33 228.37
3 Industrial 40.2 70.35 120.6 132.7
4 Livestocks 28.68 28.68 28.68 28.68
Total 1720.01 1762.25 1832.66 1849.59
Balance (potential is 1898)
177.99 135.75 65.34 48.41
5. Ground water exploitation in 2003
Over-Exploited (> 100 %)
Critical (90 and 100 %)
Semi Critical (70 and 90%)
Gingee Kandamangalam Villupuram Mailam Marakanam Melmalaiyanur Vallam
Vanur Vikravandi
None

A-117
6. Drought Prone Areas
S.No District Block Name of Habitation affected 1 Villpuram
Melmalaiyanur 1. Pinnalur 2. Porkunam
Vallam
1.Sengamedu 2. Melkalavai
Vikravandi Sivaperumalpalayam
Vannur
Elayandipattu Kadagampattu & Mettu Street
7. Waste Lands
District Block Waste Land % to total Land Villupuram Melmalaiyanur 3084.33 8.97
Gingee 526 1.42
Vallam 1991.9 7.10
Mailam 1038.27 3.64
Marakkanam 2790.25 6.57
Vannur 5322.18 11.83
Vikravandi 1787.67 7.48
Villupuram 504.06 2.55
Kandamangalam 364.04 1.81
Kilpenathaur 2501.59 9.22
Chitamur 5552.02 16.79
Achrapakkam 3663.61 10.69
3084.33 8.97
8. Catchments areas
S.No. Catchment Area District Taluk Block 1. Varahanadhi
Villupuram Gingee
Tindivanam Vanur Villupuram
Melmalayanur Gingee Vallam Mailam

A-118
Marakkanam Vanur Vikkravandi Kandamangalam Villupuram
9. Forest Coverage – Catchment Area
Classification
Extent in Ha.
Percentage to total Forest Area
Geographical area 4,21,700
Forests 32,757 7.70
Current fallow area 48,327 77.24
Other fallow area 15,168 15.06
Total 100.00
10. Major soil types
District Taluk Red soil
Sandy Loam
Clayey Loam
Brown clayey
Villupuram. Villupuram 15 40 45 -
Vanur 30 40 3
Gingee 60 40 - -
. Tindivanam 40 40 20 -
Tiruvanamalai Tiruvanamalai 55 42 3 -
Kancheepuram Cheyyur 10 - - 90
Madurantagam 10 - 25 65
11. Land use classification
S. No Description Area (ha) 1 Geographical area 421400
2 Forest 32757
3 Barren and uncultivable waste 29805
4 Land under non - agricultural use 66910

A-119
5 Cultivable waste 11200
6 Permanent pastures and other crazing land 4342
7 Current fallows 48327
8 Other fallows 15168
9 Land under Misc. use 13482
10 Net area sown 194409
12. Seasons of Cropping
S.N Ist Crop Season II nd Crop Season I. Irrigated Crop 1. Paddy-Samba Aug/Sep
to Dec/Jan Paddy-Navarai Jan/Feb to
Mar/Apr
2. Paddy-Samba Sep/Oct to Jan/Feb
Paddy-Somavari Mar/Apr to Jun/Jul
3. Paddy-Samba Jul/Aug to Nov/Dec
Groundnut/Millet/Pulses/Gingelly Dec/Jan to Mar/ Apr
4. Paddy-Samba Aug/Sep To Dec/Jan
Chillies/Cotton/Vegetables/Onion Feb/Mar to Jul/Aug
5. Sugarcane planted Jan to Nov
Sugarcane planted Nov to Oct
II. Un Irrigated Crop 6. Groundnut/Pulses Jun/Jul to
Sep/Oct Pulses/Gingelly/Ragi Oct/Nov
to Dec/Jan
7. Millet/ Pulses Jun/July to Sep/Oct
Pulses/Gingelly Oct/Nov to Dec/Jan
13. Area under Crop Cultivation
District Blocks Cropping pattern Area (hect.)
Villupuram. Melmalayanur 8.97
Gingee 1.42
Vallam
Paddy, Groundnut, Cumbu or ragi, sugarcane, Gingely, Cotton, Pulses
7.10
. Mailam Paddy, Groundnut, Cumbu or ragi, 3.64

A-120
Marakkanam
sugarcane, Gingely 6.57
Vannur
Paddy, Groundnut, Cumbu or ragi, sugarcane, Gingely 11.83
Vikkravandi 7.48
Kandamanaglam 2.55
Villupuram
Paddy, Groundnut, Cumbu or ragi, sugarcane, Gingely
1.81
14. Population details
Population Districts Region Persons Male Female
Tirvanamalai Total 2042979 1030052 1012927
Rural 1800051 907424 892627
Urban 242928 122628 120300
Villupuram Total 2943917 1484573 1459344
Rural 2517447 1269889 1247558
Urban 426470 214684 211786
Kanchipuram Total 2442179 1244756 1197423
Rural 1429610 724502 705108
15. Literacy level
Literate Districts Persons Male Female
Tirvanamalai 917548 580423 337125
Villupuram 1675027 991886 683141
Kanchipuram 1980898 1096992 883906

A-121
16. Tourist attractions S. No District Tourist Place/Pilgrim center 1 Dharmapuri Hogenakal, Krishnagiri dam, Vanniyar dam and
Teerthamalai
2 Cuddalore Pitchavaram, Chidambaram and Vadalur
3 Villupuram Tiruvakkarai, Kalrayan Hills, Mylam Temple and Tirukoilur Temple
4 Trichy Mukkombu Anicut, Puliyoncholai, Rock fort Temple and Sri Rangam
5 Salem Yercaud, Sangagiri, Kolli Hills, Tiruchengodu and Taramangalam
Source: Statistical handbook of Tamilnadu – 2002

Annexure-1
A-122
17.Water Quality Analysis -2003
District Tahsil / Taluk
Village Well No Date of collection
EC_GEN
PH_GEN
Ca Mg Na K HCO3
Villupuram Chenji Chinnanolambai 33002 1/6/03 1140 8.2
Villupuram Chenji Alampundi 33017 1/6/03 820 8.5
Villupuram Chenji Melmalayanur 33005 1/8/03 1410 8.4
Villupuram Chenji Melmalayanur 33005 7/7/03 2040 8 104 83 191 13 543
Villupuram Chenji Kilmampattu 31518 7/15/03 2300 8.1 48 83 258 28 470
Villupuram Chenji Alampoondi 31520 7/15/03 800 8.5 20 50 74 5 243
Villupuram Chenji Sathampadi 31526 7/15/03 2660 8.4 28 126 368 15 311
Villupuram Tindivanam Salai 33014 1/6/03 710 8.3
Villupuram Tindivanam Vadasiruvalur 33008 1/8/03 2230 8.3
Villupuram Tindivanam Kilsevur 33012 1/8/03 1300 8.3
Villupuram Tindivanam Omandur 31523 7/14/03 3640 7.9 164 173 322 8 177
Villupuram Tindivanam Vadasiruvalur 33008 7/14/03 2440 8.2 24 92 285 98 397
Villupuram Tindivanam Kilsevur 33012 7/14/03 1040 8.5 20 36 124 38 220
Villupuram Tindivanam Salai 33014 7/15/03 750 8.5 14 43 97 5 243
Villupuram Tindivanam Avanipur 31528 7/16/03 970 8.4 30 36 127 8 183
Villupuram Tindivanam Saram 31529 7/16/03 730 8.7 30 39 55 32 162
Villupuram Vanur Perumpakkam 33030 1/6/03 890 8.4
Villupuram Vanur Bommayapalayam 33045A 1/11/03 890 8.4

Annexure-1
A-123
Villupuram Vanur Bommayapalayam 31555 7/14/03 220 8.2 20 21 5 5 64
Villupuram Vanur Kiliyanur 31530 7/16/03 860 8.3 22 60 87 5 294
Villupuram Vanur Perumpakkam 33030 7/16/03 1030 8.6 14 43 131 98 275
Villupuram Vanur Bommayapalayam 33045A 7/16/03 990 7.7 32 21 104 149 189
Villupuram Villupuram Orathur 33042 1/8/03 1250 8.2
Villupuram Villupuram Kilperumpakkam 31532 7/7/03 1430 8.1 50 61 159 5 311
Villupuram Villupuram Orathur 33042 7/7/03 3190 8.1 312 83 225 196 482
Villupuram Villupuram Esalam 31531 7/10/03 2430 7.8 40 95 414 5 537
Villupuram Villupuram Athanurvinayagapuram
31533 7/10/03 1000 7.8 76 51 92 3 403
Tiruvannamalai
Tiruvannamalai
Thatchampattu 23038 1/4/03 1210 7
Tiruvannamalai
Tiruvannamalai
Kilpennathur 21515 1/7/03 1860 8
Tiruvannamalai
Tiruvannamalai
Polagunam 23112 1/7/03 1180 8.2
Tiruvannamalai
Tiruvannamalai
Kilpennathur 21515 4/21/03 1850 8
Tiruvannamalai
Tiruvannamalai
Thandarai 21516 7/10/03 590 8.5 32 16 69 6 116
Tiruvannamalai
Tiruvannamalai
Nachanendal 21559 7/10/03 450 8.4 20 22 53 4 122
Tiruvannamal Tiruvannamal Palayanur 21560 7/10/03 800 8.7 16 43 87 6 165

Annexure-1
A-124
ai ai
Tiruvannamalai
Tiruvannamalai
Thatchampattu 23038 7/10/03 2000 7.9 76 83 219 9 311
Tiruvannamalai
Tiruvannamalai
Thiruvannamalai 23005 7/11/03 1210 8.2 48 54 120 6 305
Tiruvannamalai
Tiruvannamalai
Kunnamurinji 21513 7/12/03 1040 8.1 10 26 189 9 433
Tiruvannamalai
Tiruvannamalai
Kolakkaravadi 21514 7/12/03 1650 8.6 40 22 288 22 214
Tiruvannamalai
Tiruvannamalai
Kilpennathur 21515 7/14/03 1780 8.4 20 75 235 9 195
Tiruvannamalai
Tiruvannamalai
Mangalam 21565 7/14/03 1030 7.8 50 39 101 10 268
Tiruvannamalai
Tiruvannamalai
Poyyanandal 21566 7/14/03 740 8.3 48 34 51 5 116
Tiruvannamalai
Tiruvannamalai
Keekalur 21568 7/14/03 1300 8.3 38 55 147 7 238
Tiruvannamalai
Tiruvannamalai
Keekkalur 23111 7/14/03 1340 8.3 20 69 143 7 195
Kancheepuram
Madurantagam
Acharapakkam 13244 1/23/03 1000 8.3
Kancheepuram
Madurantagam
Mugaiyur 13251 1/23/03 1050 8.3

Annexure-1
A-125
Kancheepuram
Madurantagam
Puthirankottai 13002 1/24/03 370 8.8
Kancheepuram
Madurantagam
Sitravadi 13005 1/24/03 900 8.3
Kancheepuram
Madurantagam
Sitravadi 13005 4/25/03 570 8.2
Kancheepuram
Madurantagam
Acharapakkam 13244 4/25/03 860 7.6
Kancheepuram
Madurantagam
Mugaiyur 13251 4/25/03 900 7.4
Kancheepuram
Madurantagam
Orathy 02036 7/21/03 580 8.4 58 13 48 9 98
Kancheepuram
Madurantagam
Salaiyur 02014 7/27/03 2920 7.4 240 66 334 3 336
Kancheepuram
Madurantagam
Chithamur 02015 7/27/03 4890 7.8 272 185 460 59 281
Kancheepuram
Madurantagam
Thennampattu 02035 7/27/03 1150 8.8 28 22 202 7 415
Kancheepuram
Madurantagam
Kadugupattu 13004 7/27/03 330 7.8 30 5 39 2 183
Kancheepuram
Madurantagam
Malaivaiyavur 13009 7/27/03 700 8.6 36 21 71 41 268
Kancheepura Madurantaga Vinayaganallur 13240 7/27/03 1500 7.2 124 29 150 23 342

Annexure-1
A-126
m m
Kancheepuram
Madurantagam
Ammanur 13242 7/27/03 380 7.6 32 13 37 3 171
Kancheepuram
Madurantagam
Acharapakkam 13244 7/27/03 800 7.4 62 29 74 3 183
Kancheepuram
Madurantagam
L.Endathur 13246 7/27/03 680 7.8 64 28 39 6 238

Annexure-I
A-127
VELLAR BASIN 1. District Wise River Basin Details
S.no. District Area of the District in
Km2
Area covered by
Vellar Basin Km2
%age area of the district
covered in the basin
%age area of the basin
covered by the district
a. Dharmapuri 9622 69 0.72 0.90
b. Salem 5205 2439 46.85 31.84
c. Perambalur 3691 1545 41.85 20.17
d. Trichy 4404 113 2.56 1.48
e. Villupuram 7222 1855 25.68 24.22
f. Cuddalore 3678 1638 44.53 21.39
Total 7659 100%
2. Revenue divisions and taluks of the basin
Name of the district Name of the revenue division Name of the taluks
Dharmapuri Dharmapuri Harur
Krishnagiri Hosur
Hosur Palacode
Pennagaram
Dharmapuri
Krishnagiri
Denkanikottai
Uthangarai
Villupuram Kallakurichi Villupuram
Thirukoilur Thirukoilur
Tindivanam Ulundurpet
Villupuram Vanur

Annexure-I
A-128
Cuddalore Chidambaram Cuddalore
Cuddalore Panruti
Virudhachalam Vridhachalam
Salem Salem Yercaud
Attur Salem
Mettur Attur
Sankari Gangavalli
Omalur
Edapadi
Trichy Trichy Trichy
Lalgudi Sri Rangam
Musiri Manaparrai
Musiri
Thottiyam
Manachennalur
3. Land use/ Land cover
S. No Description Extent in sq. km. 1 Total Geographical Area 7659.00
2 Forest 369.86
3 Barren and Uncultivable waste
4 Land put to non-agricultural use
5 Cultivable waste
1914.86
6 Pastures & Other Grazing lands 617.22
7 Land under tree and groves 28.29
8 Current fallow
9 Other fallow 638.29
10 Net area sown 4090.66
Total (2 to 10) 7659.00 11 Area sown more than once 1433.42
12 Gross area sown 5524.08

Annexure-I
A-129
13 Irrigated area 1427.64
4. Ground Water Assessment
S.no. Zone Recharge MCM
Discharge MCM
Balance MCM
1. Zone 1 (Swedanadhi, Kallar river subbasins upto Tholudur regulator)
308 274 34
2. Zone 2 (Manimuktha, Gomukhi subbasins upto Vridachalam)
435 370 65
3. Zone 3 (From Tholudur to Sethiathope anicut)
232 213 19
4. Zone 4 (below Sethiathope anicut to sea)
47 42 5
Total 1022 899 123
5. Population (In Millions)
Area 2004 2009 2014 2029 2054
Urban 1.123 1.325 1.563 2.411 3.259
Rural 3.519 3.828 4.164 5.517 6.87
Total 4.642 5.153 5.727 7.928 10.129
6. Crop Water Demand
S.no Crop Duration NIR in mm
Area cultivated in ha @ 40%
Area cultivated in ha @ 75%
Total area in ha
Water Demand MCM
1. Paddy Aug-Jan & Oct-Feb
790 81637.25 3483.75 85121 1559.02
2. Cholam Feb-May 408 2602 2602 14.15
3. Cumbu Feb-May 408 6474 6474 35.22
4. Ragi Feb-May 458 2257 2257 13.78
5. Greengram
Feb-May 300 113 113 0.45
6. Blackgra Feb-May 300 147 147 0.59
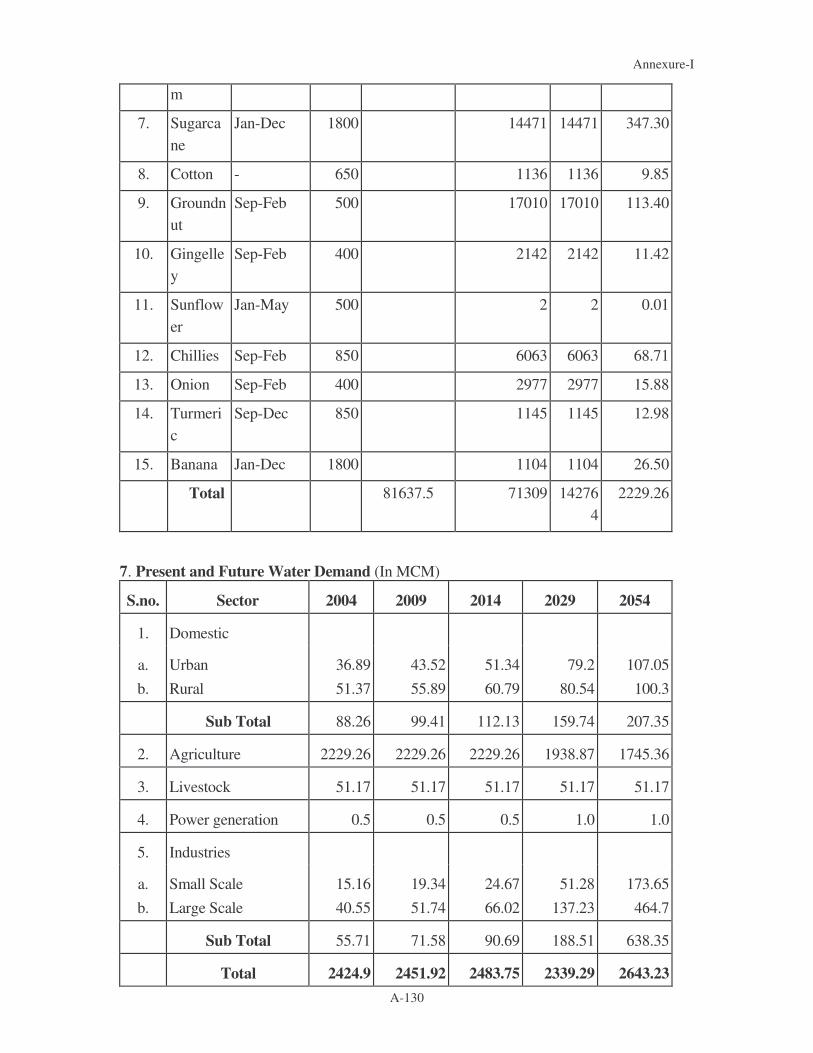
Annexure-I
A-130
m
7. Sugarcane
Jan-Dec 1800 14471 14471 347.30
8. Cotton - 650 1136 1136 9.85
9. Groundnut
Sep-Feb 500 17010 17010 113.40
10. Gingelley
Sep-Feb 400 2142 2142 11.42
11. Sunflower
Jan-May 500 2 2 0.01
12. Chillies Sep-Feb 850 6063 6063 68.71
13. Onion Sep-Feb 400 2977 2977 15.88
14. Turmeric
Sep-Dec 850 1145 1145 12.98
15. Banana Jan-Dec 1800 1104 1104 26.50
Total 81637.5 71309 142764
2229.26
7. Present and Future Water Demand (In MCM)
S.no. Sector 2004 2009 2014 2029 2054
1. Domestic
a. b.
Urban Rural
36.89 51.37
43.52 55.89
51.34 60.79
79.2 80.54
107.05 100.3
Sub Total 88.26 99.41 112.13 159.74 207.35
2. Agriculture 2229.26 2229.26 2229.26 1938.87 1745.36
3. Livestock 51.17 51.17 51.17 51.17 51.17
4. Power generation 0.5 0.5 0.5 1.0 1.0
5. Industries
a. b.
Small Scale Large Scale
15.16 40.55
19.34 51.74
24.67 66.02
51.28 137.23
173.65 464.7
Sub Total 55.71 71.58 90.69 188.51 638.35
Total 2424.9 2451.92 2483.75 2339.29 2643.23

Annexure-I
A-131
8. Ground Water Exploitation
S.No. Block Name Classification as on January 2003 1. Papireddipatti Over Exploited
2. Thalaivasal Over Exploited
3. Gangavalli Over Exploited
4. Attur Over Exploited
5. Pethanayakampalayam Over Exploited
6. Ayothipattinam Safe
7. Valapadi Over Exploited
8. Pammarathupatti Over Exploited
9. Namagiripettai Over Exploited
10. Kollimalai Safe
11. Vennandurai Over Exploited
12. Sendamangalam Over Exploited
13. Sendurai Safe
14. Veppur Over Exploited
15. Veppanthatti Over Exploited
16. Perambalur Over Exploited
17. Alathur Over Exploited
18. Ariyalur Semicritical
19. Thirumanur Safe
20. Andimadam Safe
21. Thuraiyur Over Exploited
22. Uppliyapuram Over Exploited
23. Thiyagadurgam Semi Critical
24. Sankarapuram Over Exploited
25. Rischivandhiyam Over Exploited
26. Kallakurichi Critical
27. Chinnasalem Semi Critical
28. Kalrayanmalai Safe
29. Ulundurpet Over Exploited
30. Parangipettai Semi Critical
31. Bhuvanagiri Semi Critical
32. Keerapalayam Safe
33. Kammapuram Semi Critical

Annexure-I
A-132
S.No. Block Name Classification as on January 2003 34. Vridachalam Semi Critical
35. Kurinjipadi Semi Critical
36. Nallur Semi Critical
37. Kattumannar Koil Semi Critical
38. Mangalur Semi Critical
39. Portonovo Safe Source : GW, PWD, WRO, Taramani 9. Fisheries
S. No.
District Total Coastal line in Kms
Total Inland Fresh Water Spread Area
in Ha
Estuaries and Brackish
Water Area in Ha
Inland Quantity in Ton/ Annum
Marine Quantity in Ton/ Annum
a. Dharmapuri Nil 1628 Nil 160 Nil
b. Salem Nil 15346 Nil 213 Nil
c. Perambalur Nil 10400 Nil 4637 Nil
d. Trichy Nil 10634 Nil 225T Nil
e. Villupuram 41 1881 Nil 68 1.1
f. Cuddalore 57.5 18866 9100 5240 28345

Annexure-I
A-133
10. Land Use Classification
S.No. Classification Area
1. Aquaculture 1.56
2. Barren Rocky / Stony waste 124.74
3. Coastal wet lands 0.33
4. Deciduous 375.16
5. Dry Crop 979.05
6. Ever Green / Semi Ever Green 129.78
7. Fallow 219.51
8. Forest - Blanks 18.36
9. Forest - Plantations 265.6
10. Gullied / Ravenous land 38.96
11. Industrial area 0.39
12. Land with scrub 207.9
13. Land without scrub 114.32
14. Marshy/Swampy land 2.13
15. Other Forest land 109.65
16. Plantation 1043.86
17. Reservoirs/Lakes/Tanks 253.82
18. River/Stream 100.64
19. Rural Settlements villages 223.92
20. Salt affected lands 57.39
21. Salt pans 0.18
22. Sandy area 5.52
23. Scrub forest 363.38
24. Town and cities 26.1
25. Unnotified forest area 299.12
26. Water logged 0.68

Annexure-I
A-134
27. Wet crop 2418.26
11. Live Stock Population
S.no. Block Plough Animals
Buffa loes
Cows Goat Sheep Pig Poul try
A. Salem District
1. Attur - 3742 14456 23653 6546 6914 48200
2. Ayodyapatinam - 1474 1552 569 925 2754 1139
3. Gangavalli - 7330 3669 37763 4709 4132 16065
4. Panamarathupatti 5901 - 5256 15438 4399 2476 89190
5. P.N.Palayam - 14795 23703 32149 8634 6798 133486
6. Talaivasal - 9860 18043 36072 10996 6734 234725
7. Valapadi - 7720 18852 21814 8597 4690 45714
B. Villupuram District
1. Chinnasalem 21298 17752 40313 22300 - 13315 36320
2. Kallakurichi 29089 9668 28384 32100 - 20398 35914
3. Kalavayan Hills 10683 2884 15102 6300 - 4143 88233
4. Rishivandiyam 4130 1086 7318 7200 - 1740 53430
5. Sankarapuram 30250 6342 18565 10500 - 1835 80300
6. Thigadurgam 18878 11332 22439 36000 - 5230 45340
7. Ulundurpet 28114 2937 35430 25300 - 10130 -
C. Cuddalore District
1. Bhuvanagiri 9650 4520 9725 6136 - 2100 23330
2. Kammapuram 14760 6468 32689 7340 - 4300 13713
3. K.M.Koil 63848 45060 40464 52000 - 15212 61926
4. Keerapalayam 7226 12343 12622 8302 - 3200 22661
5. Kumaratchi 6642 6807 7329 4401 - 2100 26600

Annexure-I
A-135
S.no. Block Plough Animals
Buffa loes
Cows Goat Sheep Pig Poul try
6. Mangalur 18630 7979 34984 12336 - 4500 8073
7. Nallur 16234 11822 40482 23229 - 5600 38388
8. Portonova 5732 2863 4397 2067 - 1200 28424
9. Vridachalam 14105 10893 42365 18124 - 8300 38636
Source : District Statistical Hand Book 12. Industries
S. No.
Name & Address of Industry
Category STP/ETP Status
APC Measures
Status
Distance from Water
Source
Mode of Disposal
1. India Cement Ltd. Alathiyur Senthurai Taluk Perambalur Dist. (Cement)
Red - Large
STP Installed
Installed Within 1 km from
Annaivari Odai
Treated effluent on their own
land
2. Madras Cement Ltd Alathiyur Senthurai Taluk Perambalur Dist. (Cement)
Red - Large
STP installed
Installed Within 1 km from
Annaivari Odai
Treated effluent on their own
land
3. Ambica Sugars Ltd. Perambalur Dist. (Sugar)
Red - Large
ETP Provided
Installed On the banks of Vellar
river
On land adjacent to
river
4. Supreme Renewal Energy Ltd. Perambalur Dist.
Red - Large
ETP Installed
Installed On the banks of Vellar
river
On land adjacent to
river
Source: TNPCB, Trichy.
13. Population details
Districts Region Population
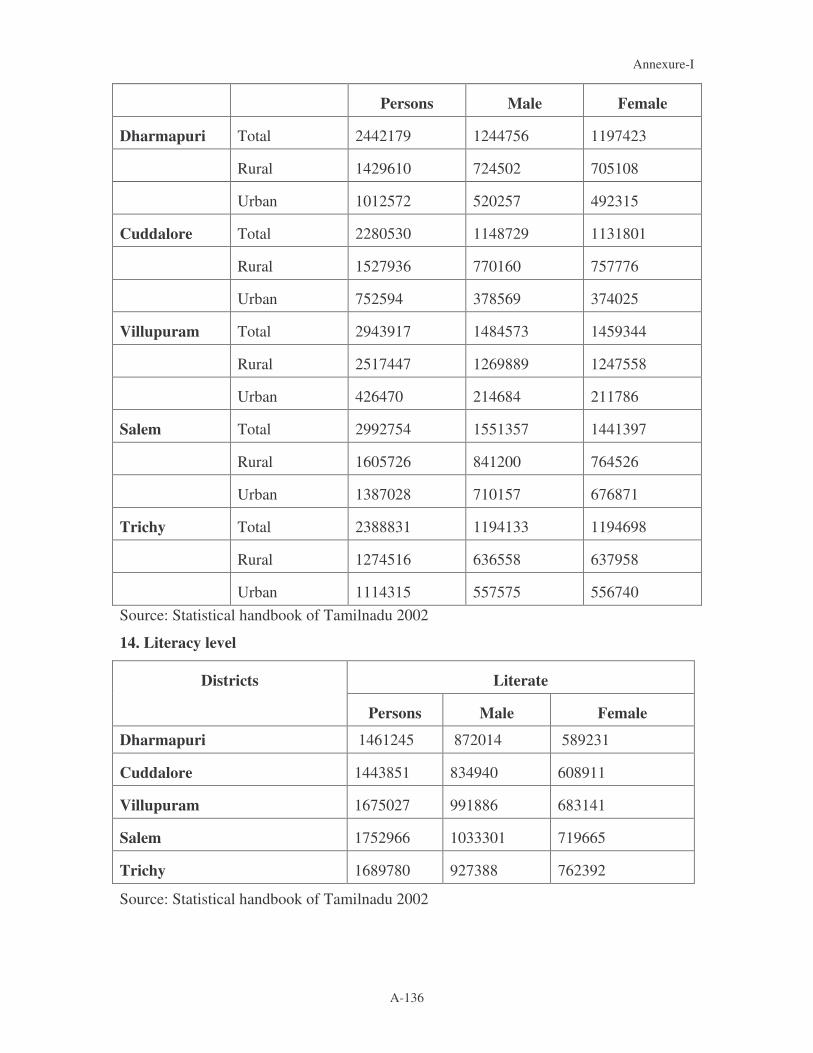
Annexure-I
A-136
Persons Male Female
Dharmapuri Total 2442179 1244756 1197423
Rural 1429610 724502 705108
Urban 1012572 520257 492315
Cuddalore Total 2280530 1148729 1131801
Rural 1527936 770160 757776
Urban 752594 378569 374025
Villupuram Total 2943917 1484573 1459344
Rural 2517447 1269889 1247558
Urban 426470 214684 211786
Salem Total 2992754 1551357 1441397
Rural 1605726 841200 764526
Urban 1387028 710157 676871
Trichy Total 2388831 1194133 1194698
Rural 1274516 636558 637958
Urban 1114315 557575 556740 Source: Statistical handbook of Tamilnadu 2002
14. Literacy level
Literate Districts
Persons Male Female
Dharmapuri 1461245 872014 589231
Cuddalore 1443851 834940 608911
Villupuram 1675027 991886 683141
Salem 1752966 1033301 719665
Trichy 1689780 927388 762392
Source: Statistical handbook of Tamilnadu 2002

Annexure-I
A-137
VAIGAI BASIN
1. The distribution of the basin area in different districts
S.no Name of the district. Area of the district in Sq. km.
Area covered by the basin in sq. km.
1. Madurai 6565 3913
2. Dindigul 6058 1587
3. Ramanathapuram 4232 770
4. Sivagangai 4086 761
Total 7031
2.List of blocks and taluks
Blocks Taluks Districts
Cumbum Uthamapalayam Chinnamanur Bodinayakanur Theni Periyakulam Andipatty Mayiladumparai
Uthamapalayam Bodinayakanur Theni Periyakulam Andipatty
Theni
Dindigul Athoor Battalagundu Nilakottai Natham Kodaikkanal
Dindigul Nilakottai Natham Kodaikkanal
Dindigul
Vadipatti Alanganallur Madurai East Madurai West Thirupparankundram
Vadipatti Madurai North Madurai South
Madurai

Annexure-I
A-138
Melur Kottampatti
Melur
Sivagangai Thiruppuvanam Manamadurai Ilaiyangudi
Sivagangai Manamadurai Ilaiyangudi
Sivagangai
Paramakudi Nayinarkovil Bogalur Ramanathapuram Thiruppullani Mandapam
Paramakudi Ramanathapuram Rameswaram
Ramanathapuram
3.List of sub basins and their areas
Area (Sq. Km.)
S.No Name of Sub-basin Plains Hills
Total area (Sq. Km.)
1 Upper Vaigai 244.02 532.75 776.77
2 Suriliar 564.92 151.54 716.46
3 Theniar 386.96 237.74 624.70
4 Varattar – Nagalar 512.78 122.92 635.70
5 Varahanathi 234.91 155.38 390.29
6 Manjalar 241.76 228.24 470.99
7 Sirumaliar 474.20 51.04 525.24
8 Sathiyar 667.27 151.73 819.00
9 Uppar 847.36 5.34 852.70
10 Lower Vaigai 1212.74 7.86 122.60
TOTAL 5386.92 1644.54 7031.46
3. Land Use / Land Cover
S.no Category Area Extent in sq. km. 1. Sparsely irrigated Crop land 1037
2. Dry crop land 1086
3. Intensively irrigated Crop land 2192
4. Semi Deciduous Forest 662

Annexure-I
A-139
5. Dry Deciduous Forest 481
6. Scrub Forest 855
7. Low Evergreen Forest 49
8. Urban built up land 27
9. Water spread area of Vaigai dam 26
10. Plantations 150
11. Coconut groves 61
12. Coastal plantations 39
13. Swamps 45
14. Barren rocky outcrop 107
15. Uncultivable waste 225
TOTAL 7042
4. Surface water potential
Dependability zone
50% 75% 90% Zone 1 993.75 814.89 729.41
Zone 2 266.37 192.30 170.50
Zone 3 279.86 224.22 184.24
Zone 4 112.34 86.56 79.38
Zone 5 373.50 261.04 209.19
5. Projected water demand for various uses in Mcm.
S. No. Purpose 1999 2004 2019 2044
1 Domestic uses 142.09 151.99 181.61 231.03
2 Agriculture 3840 3840 3966 3966
3 Industries 46.82 62.42 109.24 187.26
4 Livestock 28.08 28.08 28.08 28.08
5 Environment 12 12 12 12

Annexure-I
A-140
6 Total 4068.99 4094.49 4296.93 4424.37
7 Water Balance -1496.99 -1522.49 -1724.93 -1852.37
6. Classification of forest area
S.No Category Area
Extent Sq. Km.
Area %
1 Semi deciduous forest 662.36 9.42
2 Dry deciduous forest 480.94 6.84
3 Scrub forest 854.96 12.16
4 Low Evergreen forest 49.31 0.70
5 Plantations 149.88 2.13

Annexure-I
A-141
7. Solid Waste Collection In Major Towns
S.no Name of the Local Body Civic Status
Population Daily
Generated garbage (M.T)
1 2 3 4 5 1 Cumbum M 58713 23.400
2 Pudupatty T.P 9977 0.170
3 Kamayagoundanpatty T.P 12165 0.225
4 Highwavys T.P 7028 -
5 Gudalur T.P 35442 0.500
6 Hanumanthanpatty T.P 9436 0.045
7 Uthamapalayam T.P 22871 0.125
8 Kombai T.P 12820 0.400
9 Pannaipuram T.P 8924 0.110
10 Thevaram T.P 14501 0.665
11 Markayankottai T.P 5829 0.805
12 Kutchanur T.P 6118 0.088
13 Odaipatti T.P 13116 0.062
14 Chinnamanur M 38327 4.500
15 Bodinayakkanur M 73430 7.300
16 Melachokkanathapuram T.P 11661 0.110
17 B. Meenachipuram T.P 7207 0.076
18 Boothipuram T.P 9623 0.110
19 Theni M 85424 20.000
20 Palanichettipatti T.P 11750 0.551
21 Veerapandi T.P 14248 0.350
22 Periyakulam M 42039 7.300
23 Vadugapatti T.P 12353 0.455
24 Thamaraikulam T.P 10264 0.986
25 Thenkarai T.P 11616 1.085
26 Devathanapatti T.P 13772 0.135
27 Genguvarpatti T.P 10569 0.115
28 Andipatti T.P 22992 1.254
29 Vathalakundu T.P 20032 NA
30 Pattyveeranpatty T.P 7744 NA
31 Pannaikadu T.P 9396 NA

Annexure-I
A-142
32 Ayyampalayam T.P 21221 NA
33 Nilakottai T.P 19630 NA
34 Sevugampatty T.P 9521 NA
35 Vadipatty T.P 21750 0.480
36 Sholavandan T.P 21661 0.350
37 Alanganallur T.P 11064 0.445
38 Palamedu T.P 8187 1.180
39 Paravai T.P 16346 0.115
40 Vilangudi T.P 21073 0.790
41 Anaiyur T.P 38302 1.160
42 Madurai C 922913 350.000
43 Thirupparankundram T.P 39009 1.982
44 Melur M 33743 6.160
45 A. Vellalapatty T.P 7068 0.410
46 Thiruppuvanam T.P 21435 0.825
47 Manamadurai T.P 26284 0.950
48 Ilayankudi T.P 19100 0.850
49 Paramakudi M 84299 14.100
50 Ramanathapuram M 61974 11.800
51 Mandapam T.P 15779 1.000
52 Rameswaram T.P 7560 4.870
* NA – Not Availed M – Municipality TP – Town Panchayat C - Corporation 8. Industries
Industries - year 2005 Water requirement – mcm S. No
Sub basin Large Small Large Small Total
Growth rate/ per capita in cum
0.08 0.08 2500 2.50
1 Upper Vaigai 9 1264 8054 1.15 9.69
2 Suriliar 0 872 0.00 0.80 0.80
3 Theniyar 3 702 2.85 0.64 3.49
4 Varatar and Nagalar 14 1053 12.81 0.96 13.77
5 Varahanadhi 6 1064 5.69 0.97 6.66
6 Manjalar 12 1437 11.39 1.31 12.70
7 Sirumalaiar 20 3256 18.51 2.97 21.48

Annexure-I
A-143
8 Vaigai –Sathiar 37 7568 34.16 6.91 41.07
9 Vaigai – Uppar 33 7190 29.89 6.56 36.45
10 Lower Vaigai 5 2047 4.27 1.87 6.14
Total 140 26451 128.12 24.14 152.24
Industries - year 2020 Water requirement – mcm S. No
Sub basin Large Small Large Small Total
Growth rate/ per capita in cum
0.08 0.08 2500 2.50
1 Upper Vaigai 17 2236 15.11 2.04 17.15
2 Suriliar 0 1543 0.00 1.41 1.41
3 Theniyar 6 1242 5.04 1.13 6.17
4 Varatar and Nagalar 25 1863 22.67 1.70 24.37
5 Varahanadhi 11 1882 10.07 1.72 11.79
6 Manjalar 22 2542 20.15 2.32 22.47
7 Sirumalaiar 36 5760 32.74 5.26 38.00
8 Vaigai –Sathiar 66 13389 60.44 12.22 72.66
9 Vaigai – Uppar 58 12721 52.89 11.61 64.50
10 Lower Vaigai 8 3621 7.56 3.30 10.86
Total 248 46799 226.64 42.70 269.37 9. Land use pattern
S.no Category Area Extent Km2 Area %
1 Sparsely irrigated Crop land 1037 15
2 Dry crop land 1086 14
3 Semi Deciduous forest 662 9
4 Dry Deciduous forest 481 7
5 Scrub forest 855 12
6 Low evergreen forest 49 1
7 Intensively irrigated crop land 2192 31
8 Plantations 150 2

Annexure-I
A-144
9 Water spread area of Vaigai dam 26 1
10 Coconut groves 61 1
11 Barren/ rocky out crop 107 1
12 Urban built up land 27 1
13 Coastal plantations 39 1
14 Swamps 45 1
15 Uncultivable waste 225 3
10. Population Details
Population Districts Region
Persons Male Female
Theni Total 1094724 553118 5411606
Rural 502509 255241 247268
Urban 592215 297877 294338
Madurai Total 2562279 1295124 1267155
Rural 1129028 569988 559040
Urban 592215 297877 294338
Dindigul Total 1918960 966201 952759
Rural 1246956 627672 619284
Urban 672004 338529 333475
Ramnad Total 1183321 582068 601253
Rural 883508 433090 450418
Urban 299813 148978 150835
Sivagangai Total 1150753 565594 585159
Rural 826427 404561 421866
Urban 324326 161033 163293
Source: Statistical handbook of Tamilnadu 2002

Annexure-I
A-145
11. Literate Statement Name of the District
Name of the Block
Total Population
Literate Agricul- turist
Agricultural Labourers
No. of households
1 2 3 4 5 6 7 Theni Cumbum 101211 51573 3866 23209 16367
Uthamapalayam 111453 60784 5994 29834 20976
Chinnamanur 72660 34781 6144 29922 17120
Bodinayakkanur 167751 106392 7282 43809 NA
Theni 173985 121300 6405 28897 18125
Periyakulam 188318 120609 7496 43988 32453
Andipatty 103703 43110 12876 29393 20970
K.Myladumparai 69278 24310 9082 23231 16404
Dindigul Batlagundu 96346 4816 9462 21098 21860
Kodaikanal 98598 53006 5020 9932 23415
Athur 136099 72001 10174 34004 32813
Dindigul 302507 198007 10668 24029 65954
Nilakotai 196833 34705 16790 29568 26497
Natham 119222 48396 1441 2565 25488
Madurai Vadipatty 96807 56182 6069 31832 25300
Alanganallur 95934 36576 8493 30163 21593
Madurai west 127108 76484 6201 20353 27940
Madurai east 122235 65130 8280 27552 45104
Thirupparankundram 213399 124262 8769 21798 26852
Melur 115006 56712 21413 27121 26830
Kottampatti 98944 42324 19972 22630 22802
Sivagangai Thiruppuvanam 102005 52022 15178 15485 22279
Sivagangai 124879 62977 19496 11856 27620
Manamadurai 106866 34084 17368 13819 21018
Ilayankudi NA NA NA NA NA
Ramanathapuram Paramakudi 137700 103528 16139 7097 15348
Nainar kovil 49349 21602 19334 9805 9060
Bogalur 39107 18098 9597 4220 8791
Ramanathapuram 109609 62989 94430 5379 12722
Thiruppullani 102448 43418 12830 6415 21364
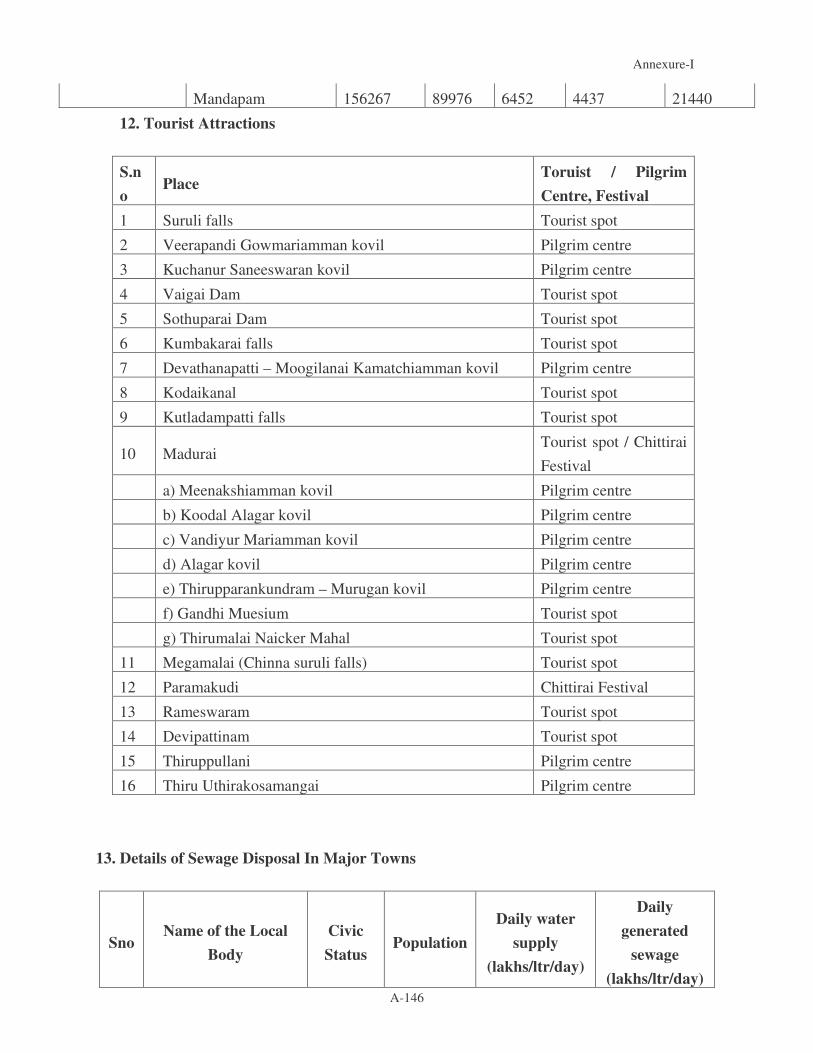
Annexure-I
A-146
Mandapam 156267 89976 6452 4437 21440
12. Tourist Attractions S.no
Place Toruist / Pilgrim Centre, Festival
1 Suruli falls Tourist spot
2 Veerapandi Gowmariamman kovil Pilgrim centre
3 Kuchanur Saneeswaran kovil Pilgrim centre
4 Vaigai Dam Tourist spot
5 Sothuparai Dam Tourist spot
6 Kumbakarai falls Tourist spot
7 Devathanapatti – Moogilanai Kamatchiamman kovil Pilgrim centre
8 Kodaikanal Tourist spot
9 Kutladampatti falls Tourist spot
10 Madurai Tourist spot / Chittirai Festival
a) Meenakshiamman kovil Pilgrim centre
b) Koodal Alagar kovil Pilgrim centre
c) Vandiyur Mariamman kovil Pilgrim centre
d) Alagar kovil Pilgrim centre
e) Thirupparankundram – Murugan kovil Pilgrim centre
f) Gandhi Muesium Tourist spot
g) Thirumalai Naicker Mahal Tourist spot
11 Megamalai (Chinna suruli falls) Tourist spot
12 Paramakudi Chittirai Festival
13 Rameswaram Tourist spot
14 Devipattinam Tourist spot
15 Thiruppullani Pilgrim centre
16 Thiru Uthirakosamangai Pilgrim centre
13. Details of Sewage Disposal In Major Towns
Sno Name of the Local
Body Civic Status
Population Daily water
supply (lakhs/ltr/day)
Daily generated
sewage (lakhs/ltr/day)

Annexure-I
A-147
1 Cumbum M 58713 39.00 31.20 2 Pudupatty T.P 9977 4.09 3.27 3 Kamayagoundanpatty T.P 12165 5.47 4.38 4 Highways T.P 7028 4.29 3.43 5 Gudalur T.P 35442 16.30 13.04 6 Hanumanthanpatty T.P 9436 3.30 2.64 7 Uthamapalayam T.P 22871 9.38 7.50 8 Kombai T.P 12820 5.13 4.10 9 Pannaipuram T.P 8924 4.19 3.35
10 Thevaram T.P 14501 6.24 5.00 11 Markayankottai T.P 5829 2.45 1.96 12 Kutchanur T.P 6118 3.01 2.41 13 Odaipatti T.P 13116 5.25 4.20 14 Chinnamanur M 38327 36.52 29.22 15 Bodinayakkanur M 73430 55.69 44.55 16 Melachokkanathapurm T.P 11661 4.66 3.73 17 B. Meenachipuram T.P 7207 3.60 2.88 18 Boothipuram T.P 9623 5.77 4.62 19 Theni M 85424 93.00 74.40 20 Palanichettipatti T.P 11750 4.23 3.38 21 Veerapandi T.P 14248 6.41 5.13 22 Periyakulam M 42039 38.00 30.40 23 Vadugapatti T.P 12353 3.71 2.97 24 Thamaraikulam T.P 10264 2.98 2.38 25 Thenkarai T.P 11616 3.95 3.16 26 Devathanapatti T.P 13772 6.20 4.96 27 Genguvarpatti T.P 10569 5.18 4.14 28 Andipatti T.P 22992 8.74 6.99 29 Vathalakundu T.P 20032 NA NA 30 Pattyveeranpatty T.P 7744 NA NA 31 Pannaikadu T.P 9396 NA NA 32 Ayyampalayam T.P 21221 NA NA 33 Nilakottai T.P 19630 NA NA 34 Sevugampatty T.P 9521 NA NA 35 Vadipatty T.P 21750 10.66 8.53 36 Sholavandan T.P 21661 14.06 11.25

Annexure-I
A-148
37 Alanganallur T.P 11064 6.74 5.39 38 Palamedu T.P 8187 5.28 4.22 39 Paravai T.P 16346 10.88 8.70 40 Vilangudi T.P 21073 9.27 7.42 41 Anaiyur T.P 38302 13.45 10.76 42 Thirupparankundram T.P 39009 15.60 12.48 43 Melur M 33743 10.43 8.34 44 A. Vellalapatty T.P 7068 4.73 3.78 45 Thiruppuvanam T.P 21435 13.00 10.40 46 Manamadurai T.P 26284 14.82 11.86 47 Ilayankudi T.P 19100 5.74 4.59 48 Paramakudi M 84299 16.71 13.37 49 Ramanathapuram M 61974 11.45 9.16 50 Mandapam T.P 15779 4.60 3.68 51 Rameswaram T.P 14.00 11.20
M – Municipality TP – Town Panchayat NA – Not Availed
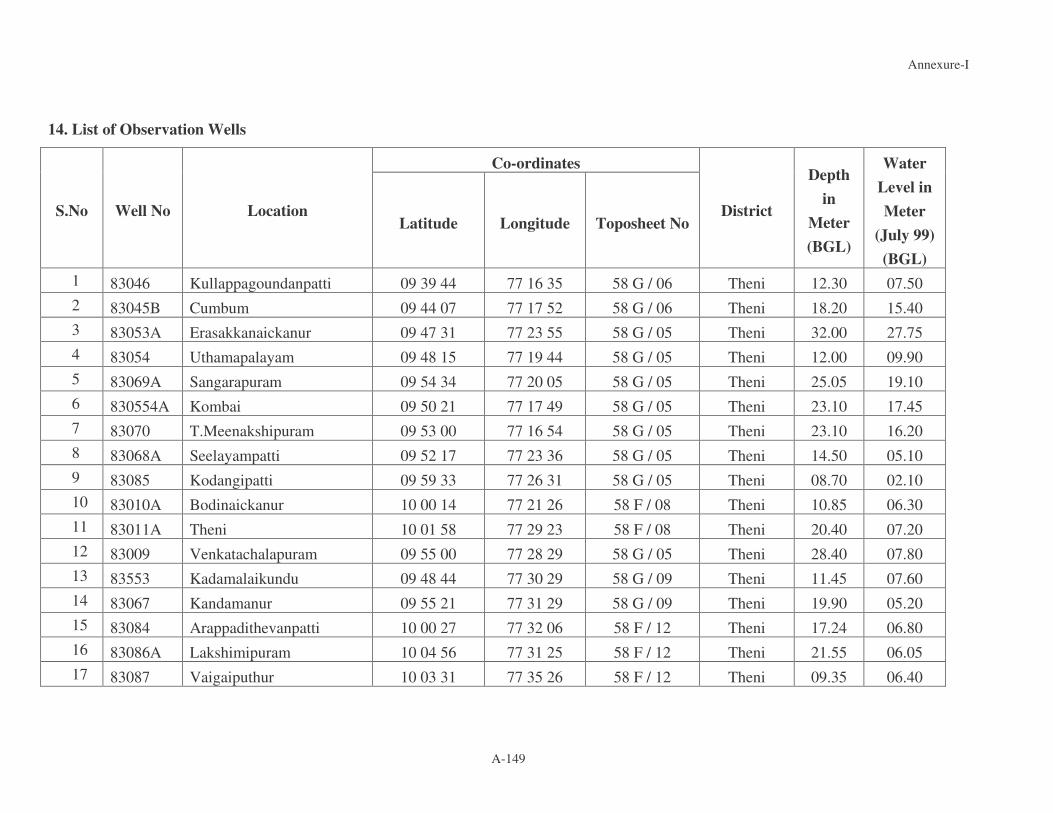
Annexure-I
A-149
14. List of Observation Wells
Co-ordinates
S.No Well No Location Latitude Longitude Toposheet No
District
Depth in
Meter (BGL)
Water Level in Meter
(July 99) (BGL)
1 83046 Kullappagoundanpatti 09 39 44 77 16 35 58 G / 06 Theni 12.30 07.50 2 83045B Cumbum 09 44 07 77 17 52 58 G / 06 Theni 18.20 15.40 3 83053A Erasakkanaickanur 09 47 31 77 23 55 58 G / 05 Theni 32.00 27.75 4 83054 Uthamapalayam 09 48 15 77 19 44 58 G / 05 Theni 12.00 09.90 5 83069A Sangarapuram 09 54 34 77 20 05 58 G / 05 Theni 25.05 19.10 6 830554A Kombai 09 50 21 77 17 49 58 G / 05 Theni 23.10 17.45 7 83070 T.Meenakshipuram 09 53 00 77 16 54 58 G / 05 Theni 23.10 16.20 8 83068A Seelayampatti 09 52 17 77 23 36 58 G / 05 Theni 14.50 05.10 9 83085 Kodangipatti 09 59 33 77 26 31 58 G / 05 Theni 08.70 02.10 10 83010A Bodinaickanur 10 00 14 77 21 26 58 F / 08 Theni 10.85 06.30 11 83011A Theni 10 01 58 77 29 23 58 F / 08 Theni 20.40 07.20 12 83009 Venkatachalapuram 09 55 00 77 28 29 58 G / 05 Theni 28.40 07.80 13 83553 Kadamalaikundu 09 48 44 77 30 29 58 G / 09 Theni 11.45 07.60 14 83067 Kandamanur 09 55 21 77 31 29 58 G / 09 Theni 19.90 05.20 15 83084 Arappadithevanpatti 10 00 27 77 32 06 58 F / 12 Theni 17.24 06.80 16 83086A Lakshimipuram 10 04 56 77 31 25 58 F / 12 Theni 21.55 06.05 17 83087 Vaigaiputhur 10 03 31 77 35 26 58 F / 12 Theni 09.35 06.40

Annexure-I
A-150
18 83501 Gandhipuram 10 07 40 77 33 17 58 F / 12 Theni 09.64 04.28 19 83500 Kottarapatti 10 08 17 77 42 04 58 F / 12 Theni 08.81 06.30 20 83088 Gullapuram 10 03 52 77 38 36 58 F / 12 Theni 09.55 04.52 21 83023 Devathanapatti 10 08 34 77 38 50 58 F / 12 Theni 11.01 02.62 22 83100 Vengadasastrikottai 10 09 13 77 47 23 58 F / 06 Dindigul 11.10 05.50 23 83021A Pallapatti 10 08 25 77 54 40 58 F / 16 Dindigul 15.43 04.82 24 83092A Neerathan 10 03 09 77 58 35 58 F / 16 Madurai 10.65 03.38 25 83014 Solavanthan 10 01 14 77 57 46 58 F / 16 Madurai 07.10 03.90 26 83080 Nagari 10 01 04 78 02 04 58 J / 04 Madurai 06.50 02.85 27 83094B Thavacheri 10 04 23 78 06 56 58 J / 04 Madurai 08.63 Dry 28 83020A Valayapatti 10 08 54 78 07 10 58 J / 04 Madurai 06.00 04.20 29 83079 Koolapandi 10 00 37 78 09 00 58 J / 04 Madurai 04.60 05.28 30 83027 Puliankulam 09 52 59 78 11 02 58 K / 04 Madurai 06.10 05.15 31 83076 Varichur 09 54 30 78 15 30 58 K / 05 Madurai 07.60 04.75 32 83075 Karuppayiurani 09 56 00 78 11 30 58 K / 01 Madurai 08.35 05.15 33 83019 Parali 10 08 54 78 11 05 58 J / 04 Didigul 06.80 04.72 34 83095 Pulipatti 10 05 04 78 17 20 58 J / 08 Madurai 07.00 05.30 35 83017 T.Palaiyur 09 57 08 78 18 32 58 K / 05 Madurai 09.65 06.85 36 83078 Melapathinettankudi 09 59 45 78 19 52 58 K / 05 Madurai 08.40 04.96 37 83077A Urankanpatti 09 59 50 78 25 44 58 K / 05 Madurai 09.65 05.45 38 83096 Thumbaipatti 10 05 06 78 21 34 58 J / 08 Madurai 05.34 01.70 39 83233 Thirumansolai 09 51 09 78 19 50 58 K / 05 Sivagangai 08.64 05.21 40 83236 Nallakulam 09 51 35 78 23 20 58 K / 05 Sivagangai 08.64 02.91

Annexure-I
A-151
41 83124B Rajakambeeram 09 43 05 78 25 10 58 K / 06 Sivagangai 09.80 07.85 42 83123B Manamadurai 09 42 00 78 27 00 58 K / 06 Sivagangai 08.60 05.50 43 83129B Ilaiyankudi 09 37 35 78 37 35 58 K / 10 Sivagangai 11.00 08.00 44 83128B Paramakudi 09 32 40 78 35 40 58 K / 10 Ramnad 05.70 02.47 45 83275 Bogalur 09 24 25 78 42 50 58 K / 11 Ramnad 11.66 05.63 46 83277 Vairavanendal 09 24 35 78 46 05 58 K / 15 Ramnad 03.50 02.06 47 83136A Devipattinam 09 28 00 78 54 00 58 K / 15 Ramnad 05.45 02.20 48 83279A Sathrakudi 09 25 40 78 54 00 58 K / 15 Ramnad 04.17 02.78 49 83134A Ramanathapuram 09 22 15 78 49 50 58 K / 15 Ramnad 09.35 06.70 50 83280 Valantharuvai 09 20 10 78 54 50 58 K / 15 Ramnad 08.64 05.73 51 83281 Chembadaiyarkulam 09 20 00 78 58 00 58 K / 15 Ramnad 04.98 03.34 52 83282 Uchipuli 09 18 20 79 01 10 58 O / 03 Ramnad 02.98 01.75 53 83132A Thiruppulani 09 17 00 78 49 50 58 K / 15 Ramnad 06.60 04.24

Annexure-I
A-152
AGNIYAR BASIN
1. Details of Taluks in the Basin S.No District Taluks 1 Pudukkottai Alangudi
2 Arathangi
3 Avudayarkoil
4 Gandarvakkottai
5 Kulathur
6 Pudukkottai
7 Thirumayam
8 Thanjavur Pattukottai
9 Peravurani
10 Tiruchirapalli Viralimalai
2. Anicuts present in the Sub Basins of Agniyar
Agniyar Sub Basin Ambuliyar Sub Basin South Vellar Sub Basin
Sinayakkudi
Andakulam
Agniyar (or) Pulavankadu
Maniyavayal
Madathukkadu
Poovanam
Kollukkadu Pumping scheme
Pallathividuthy
Kothamangalam
Senthangudi
Chithathikkadu
Nelhadikkadu
Adaikkathevan
Kilikudi
Pinnakudi
Visalue
Keemanakanmoi
Sundarapatti
Senthamangalam
Holdsworth
Sethukanmoi
Kothamangalam
Narpavalakudi
Veeramangalam
Avudayarkoil
Karunkadu
Manalur

Annexure-I
A-153
Keeranur
Manamelkudi
3. Land use / Land cover
Description Area (ha) Geographical area 4,56,600 Forest 2,3743 Barren and uncultivable waste 9,132 Land under non - agricultural use 1,09,584 Cultivable waste 14,155 Permanent pastures and other crazing land 4,109
Current fallows 64,381 Other fallows 27,853 Land under Misc. use 8,218 Net area sown 1,95,425
(Source: Environmental Status report of the Agniyar River Basin)
4. Projected water demand and water balance for various uses
S No Purpose 1999 2004 2019 2044
1 Domestic uses 29.55 31.48 37.29 46.98
2 Agriculture 2344 2344 1916.86 1631.81
3 Industries 25.64 34.18 59.82 102.54
4 Livestock 14.8 14.8 14.8 14.8
6 Total 2413.99 2424.46 2028.77 1796.13
7 Water Balance -409.99 -420.46 -24.77 207.87

Annexure-I
A-154
5. Crop Productivity
S.No Description of crop Area ( in hectares) Productivity in Kg/hec 1 Paddy 83500 3158
2 Cholam 326 1306
3 Cambu 30 2796
4 Ragi 278 2316
5 Maize 180 2068
6 Varagu 209 918
7 Green gram 37 543
8 Black gram 2140 518
9 Red gram 1390 505
10 Horse gram 210 0
11 Ground nut 27549 1448
12 Gingelly 1481 453
13 Chillies 181 569
6. Diseases prevailing in the basin S.No Name of the disease No. of patient treated 1 Fever 2458
2 Typhoid fever 410
3 Tuberculosis 1691
4 Leprosy 480
5 Twakrogam 0
6 Verinam 95
7 Vatham 15957
8 Hypertensive disease 414
9 Isehemic heart disease 857
10 Sivorogam 0
11 Nasrogam 234
12 Others 43744

Annexure-I
A-155
7. District wise area and population details
Population Districts Region
Persons Male Female
Trichy Total 23,88,831 11,94,133 11,94,698
Rural 12,74,516 6,36,558 6,37,958
Urban 11,14,315 5,57,575 5,56,740
Thanjavur Total 22,05,375 10,91,557 11,13,818
8. District wise literacy level
Literate Districts
Persons Male Female
Trichy 16,89,780 9,27,388 7,62,392
Thanjavur 14,90,568 8,25,006 6,65,562
Pudukottai 9,19,086 5,25,743 3,93,343
9. Tourist attractions
District Tourist Place / Pilgrim center
Trichy Mukkombu Anicut, Puliyoncholai, Rock fort Temple and Sri Rangam
Thanjavur Darasuram, Grand Anicut, Thanjavur Temple, Thiruvaiyaru, Thirukandiyur and Kumbakonam
Pudukottai Viralimalai, Avudayiarkoil, Kudumiammalai, Pudukottai, Sittanna vassal, Narthamalai

Annexure-I
A-156
PAMBAR BASIN 1. Taluk wise Basin Area Name of District Name of Taluk
of the Basin Area Sq.Kms
Tirumayam 385.39
Aranthangi 19.27
Pudukottai
Avadayarkoil 83.50
Trichy Manapparai 54.60
Tiruppathur 789.13
Devakottai 346.85
Karaikudi 452.83
Sivagangai
Sivagangai 35.33
Madurai Melur 356.49
Ramnad Tiruvadanai 353.28
Natham 475.32 Dindigul
Dindigul 22.48
Total 3374.47
2. Land use
S.No Description Area in ha
Area as a % of Total Area of the
basin 1 Total area of basin 337447 100
2 Forest 31864 9.44
3 Barren and Uncultivable land 10650 3.16
4 Land put to non-agriculutural use
53164 15.75
5 Cultivatable waste 14577 4.32
6 Permanent pasture and grazing land
1547 0.46
7 Land under miscellaneous trees groves not included in net sown area
6759 2.00
8 Current fallows 48688 14.43
9 Other fallow lands 57688 17.09

Annexure-I
A-157
10 Net Area sown 112510 33.35
3. Surface water potential
Season Calculation Yield Mcum SW Monsoon 0.15x3374.47x100x152.74/1000 152.74 NE Monsoon 0.15x3374.47x100x206.65/1000 206.65
Summer 0.15x3374.47x100x149.414/1000 149.414 Total 508.8
4. Ground water Potential
Ground Water
Potential for the whole
Block
ha-m
GW potential of the Basin
portion of the block
ha-m
Name of Taluk Name of Block Total Available
for
Irrigation
Basin
area in
the
block
ha
GW
Available
for
irrigation
GW
Available
for
industry
GW
Total
potential
available
ha-m
1) Sivagangai Dt.
Devakottai 4562 4481 Devakottai
Kannanur 3888 3833
34685 5043 83 5126
Sakkottai 4818 4706 Karaikudy
Kallal 6358 6185
45283 5972 157 6129
Tiruppathur 5501 5345
Singampunari 4180 4083
Tiruppathur
S.Pudur 2364 2267
78913 11695 350 12045
Sivagangai 9563 9364 Sivagangai
Kalayar koil 12298 12090
3533 689 13 702
2)Ramnad Dt.,
Tiruvadani 5874 5673 Tiruvadanai
RS Mangalam 1000 775
35328 2611 173 2784
3)Pudukottai Dt.,
Tirumayam 6221 6069
Arimalam 5251 5098
Tirumayam
Ponnamaravathi 5478 5296
38539 6635 196 6831

Annexure-I
A-158
Aranthangi Aranthangi 9745 9463 1927 456 13 469
Avadayarkoil Avadayarkoil 10462 10302 8350 2169 34 2203
4)Trichy Dt.
Manapssparai Marungapuri 9054 8825 5460 1059 27 1086
5)Madurai Dt.
Melur 12902 12609 Melur
Kottampatti 6607 6589
35649 9682 148 9830
6)Dindigul Dt.
Natham Natham 5936 5716 47532 4606 177 4783
Dindigul Sannarpatti 5193 4981 2248 285 12 297
337447 50902 1383 52285
(1 ha-m = 0.01Mcum) or 509.02 13.83 522.85Mcum 5. Projected water demand and water balance for various uses in MCM
S No. Purpose 1999 2004 2019 2044
1 Domestic uses 35.21 37.31 43.6 54.07
2 Agriculture 1960.73 1960.73 1815.28 1637.52
3 Industries 51.89 69.18 121.07 207.54
4 Livestock 24.98 24.98 24.98 24.98
6 Total 2072.81 2092.2 2004.93 1924.11
7 Water Balance -443.81 -463.2 -375.93 -295.11
Source: State framework resources Plan of Tamilnadu 6. Places of Fluoride contamination S.No Name of Taluk Name of Village Fluoride content
in ppm 1 Melur Pulipatti 2.0
Kottampatti 2.5
7. Places of Nitrate contamination S.No Name of Taluk Name of Village Nitrate content
in ppm 1 Melur Pulipatti 66

Annexure-I
A-159
2 Tiruvadanai Tondi 1302
3 Karaikudy Karaikudy 128
4 Vetriyur 177
8. Cropping Pattern
Name of District
Sl. No Name of Crop Pudukottai Dindigal Sivagangai Ramnad
Madurai
1 Rice Sep-January Aug-Dec
June-Oct Aug-Nov to Jan-March
Nov-March
June-Oct Aug-Dec
2 Groundnut (oil Seeds)
July-Sep Jan-May Throughout the year
Rice Oct-January
Cumbu or Ragi
Feb-May Jan-July to Aug-Sep
Mar-June June-Sep
3 Groundnut July-October June-Oct July-Nov
Chilles Oct-Feb
Maize March-June Jan-May Aug-Sep Feb-June Aug-Jan
4 Ragi July-Oct June-Oct
Rice ` Oct-Feb
Cotton Feb-June Aug-Sep to Jan-Feb
Feb-March to Sep-Oct
Feb-Aug Feb-Aug June-Dec
5 Groundnut June-Oct Dec-April
Black gram
Nov-Feb June-Aug Mar-May
Horse gram,Ragi
Aug-Nov
Gingelly Dec-March
6 Sugarcane Throughout the year
Jan-Dec

Annexure-I
A-160
9. Crop Yield
Yield in Kg/ha S.No
Name of Crop
Pudukotttai Sivagangai Dindigul Ramnad Madurai 1 Rice 2825 2680 3200 2552 3932samba
6100kuruvai
2 Millets 1201 1680 1000 1103 1039
3 Pulses 587 570 620 491 416
4 Groundnut 724 690 950 885 1505
5 Gingelly 370 610 - 404 -
6 Cotton 358 2720 2200 2.4 bales 848
7 Sugarcane 9700 - - 12400 8900
8 Chillies - - - 808 -
9 Sunflower - - - 351 -
10. Water Demand for agriculture
Sl.no Name of
crop
Area under tank
irrigation
Area under well
irrigation
Net CWR
cm
NIR Mcum
Field efficiency
GIR Mcum
1 Rice (1) 67764 86.05 583.11 0.441325.25
2 Rice (2) 7529 86.05 64.79 0.75 86.38
3 Irrigated dry 5582 31.85 17.78 0.75 23.70
Total1435.33
CWR – Crop Water Requirement, NIR – Net Irrigation Requirement GIR – Gross Irrigation Requirement.
11. Diseases in Sivagangai District during January-March 2004
S.No
Name of block ADD Malaria Chickenpox
Measles
TB Leprosy
1 Thirupathur 5 - - - - 1 2 Sakkottai 1 - 4 - 15 13 3 Devakottai 7 - - 2 7 1 4 Kannankudi 1 - - - 1 - 5 Kalayarkovil 6 1 1 - 4 2 6 Kallal 5 - - - 21 2 Total 25 1 7 - 48 19

Annexure-I
A-161
12. Abstract of district wise population
Population (2001 Census) Sl.No
Name of
Districts
Name of
Taluk
No of
Villages
situated in
the basin
Area of
the basin
Sq.km Male Female Total
1 Dindigul Dindigul 4 22.48 6074 6042 12116
Natham 43 475.32 74258 72486 146744
Total 47 497.80 80332 78528 158860
2 Madurai Melur 38 356.49 64878 65615 130493
3 Sivagangai Tiruppathur 96 789.13 118753 125942 244695
Sivagangai 5 35.33 2697 3241 5938
Karaikudy 70 452.83 67969 70094 138063
Devakottai 55 346.85 31523 29107 60630
Total 216 1624.14 220942 228384 449326
4 Trichy Manapparai 8 54.60 8677 8724 17401
5 Ramnad Tiruvadanai 43 353.28 41133 43094 84227
6 Pudukottai Tirumayam 73 385.39 74426 77719 152145
Aranthangi 8 19.27 5800 4252 10052
Avudayarkoil 22 83.50 9299 9419 18718
Total 104 488.16 89525 91390 180915
GRAND TOTAL 465 3374.47 505487 515735 1021222
13. Literacy Population
Literacy (2001 Census) S.No
Name of Districts
Name of Taluk Male Female Total
Dindigal 4207 3033 7240 1
Dindigal Natham 49792 32447 82239
2 Madurai Melur 45596 31758 77354
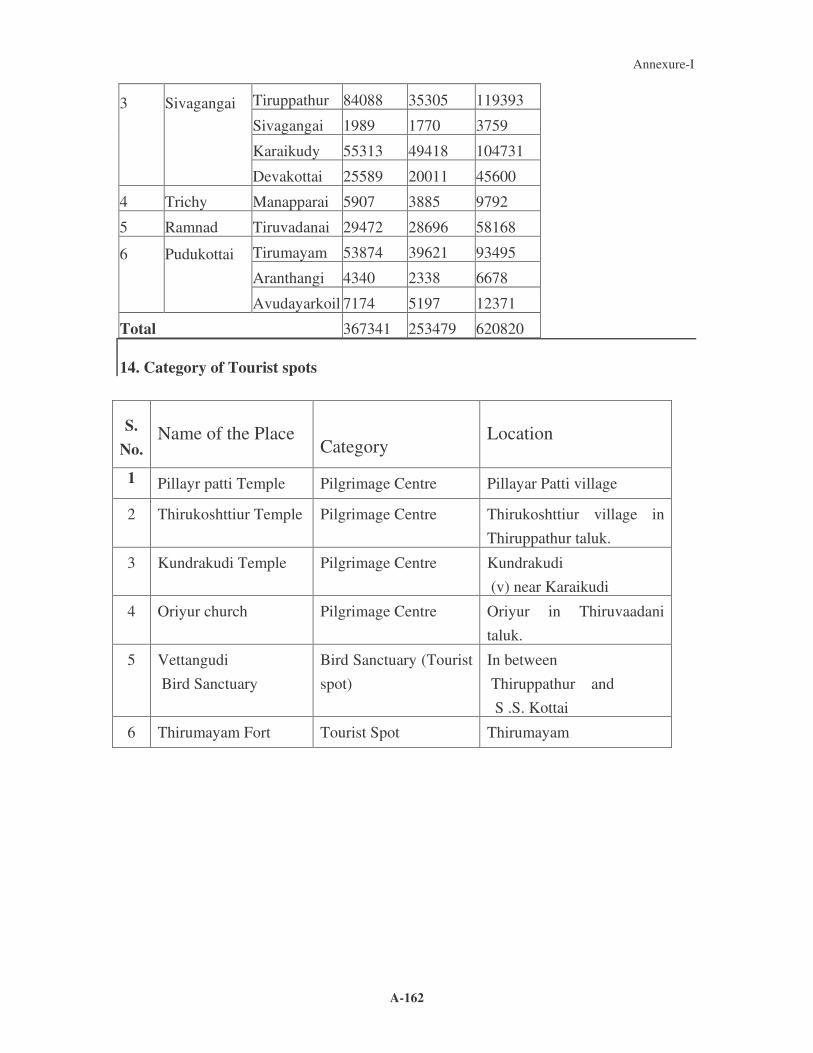
Annexure-I
A-162
Tiruppathur 84088 35305 119393
Sivagangai 1989 1770 3759
Karaikudy 55313 49418 104731
3
Sivagangai Devakottai 25589 20011 45600
4 Trichy Manapparai 5907 3885 9792
5 Ramnad Tiruvadanai 29472 28696 58168
Tirumayam 53874 39621 93495
Aranthangi 4340 2338 6678 6
Pudukottai Avudayarkoil 7174 5197 12371
Total 367341 253479 620820 14. Category of Tourist spots
S. No.
Name of the Place
Category
Location
1 Pillayr patti Temple Pilgrimage Centre Pillayar Patti village
2 Thirukoshttiur Temple Pilgrimage Centre Thirukoshttiur village in Thiruppathur taluk.
3 Kundrakudi Temple Pilgrimage Centre Kundrakudi (v) near Karaikudi
4 Oriyur church Pilgrimage Centre Oriyur in Thiruvaadani taluk.
5 Vettangudi Bird Sanctuary
Bird Sanctuary (Tourist spot)
In between Thiruppathur and S .S. Kottai
6 Thirumayam Fort Tourist Spot Thirumayam
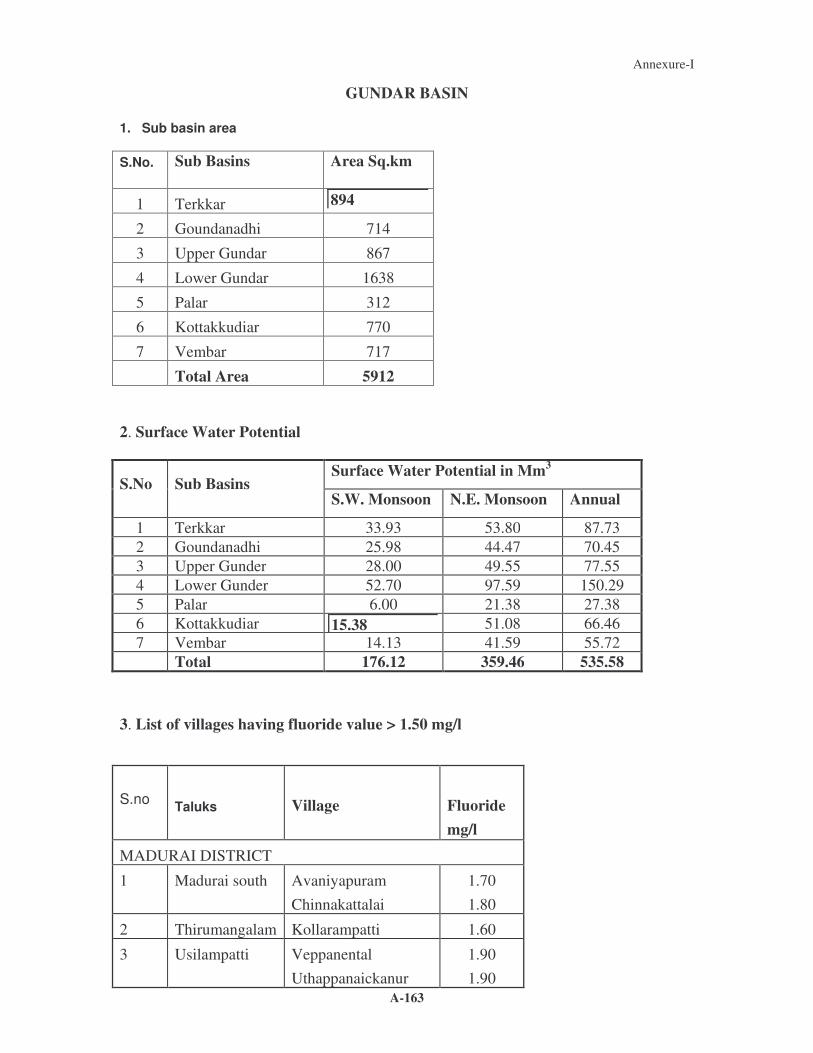
Annexure-I
A-163
GUNDAR BASIN
1. Sub basin area
S.No. Sub Basins Area Sq.km
1 Terkkar 894
2 Goundanadhi 714
3 Upper Gundar 867
4 Lower Gundar 1638
5 Palar 312
6 Kottakkudiar 770
7 Vembar 717
Total Area 5912
2. Surface Water Potential
Surface Water Potential in Mm3 S.No Sub Basins
S.W. Monsoon N.E. Monsoon Annual
1 Terkkar 33.93 53.80 87.73 2 Goundanadhi 25.98 44.47 70.45 3 Upper Gunder 28.00 49.55 77.55 4 Lower Gunder 52.70 97.59 150.29 5 Palar 6.00 21.38 27.38 6 Kottakkudiar 15.38 51.08 66.46 7 Vembar 14.13 41.59 55.72 Total 176.12 359.46 535.58
3. List of villages having fluoride value > 1.50 mg/l
S.no
Taluks
Village
Fluoride mg/l
MADURAI DISTRICT
1 Madurai south Avaniyapuram Chinnakattalai
1.70 1.80
2 Thirumangalam Kollarampatti 1.60
3 Usilampatti Veppanental Uthappanaickanur
1.90 1.90

Annexure-I
A-164
T.Meenakshipuram 2.80
4 Thiruchuli Narikudi 3.70
5 Aruppukkottai P. Pudupatti Ramanujapuram Kovilankulam
3.60 2.50 2.40
4. Industries
Type Taluk
G O R DO Total
VIRUDHUNAGAR DIST
Aruppukottai 0 15 8 0 23
Kariyapatti 0 2 2 0 4
Thiruchuli 0 1 1 0 2
0 18 11 0 29
MADURAI DIST
Madurai South 36 447 223 0 706
Usilampatti 0 41 1 0 42
Peraiyur 0 1 2 0 3
Thirumangalam 13 212 106 0 331
49 701 332 0 1082
SIVAGANGAI DIST
Manamadurai 1 86 11 4 102
1 86 11 4 102
RAMANAD DIST
Paramakudi 0 24 0 0 24
Mudukulathur 0 3 0 0 3
Kadaladi 0 6 1 0 7
Kamudhi 0 15 1 0 16
Ramnad 4 17 0 0 21
4 65 2 0 71
THOOTHUKUDI DIST
Vilathikulam 0 3 6 0 9
0 3 6 0 9
Total 54 873 362 4 1293

Annexure-I
A-165
5. Pilgrimage Centers, Tourist Spots And Sanctuaries
Location
Pilgrimage Centers/Tourist spots /
Sanctuaries
Festivals
Period
Pilgrimage centers & Temples Madurai SriMeenakshi
Sundareswarar Temple Chithirai festival Festival of cradle Navaratri festival
April April September
Madurai Koodal Azhargar temple Masi Magam Float Festival
February/March
Thirupparakundram Lord Subbramaiya Temple
Panguni Uthiram March – April
Madurai Mariamman teppakulam Mariamman Temple
Adi krithigai Float faestival
July – August January– February
Thiruchuli Thirumeninathan swami Temple Birth place of Sri Ramana Maharishi
Bhramotchavam festival
April – May
Uthirakosamangai Natarajar Temple Arudhra festival December Thiruppullani Adi Jegannatahaperumal
Temple
Erwadi Ibrahim syed Aulia Dargha
Annual festival
Tourist spots Madurai Mannar Thirumalai
Naikar Mahal - Through out the
year

Annexure-I
A-166
KALLAR BASIN 1. Taluk wise area S.No Taluk Area covered by basin
(Hectares) % of area of the basin covered by the Taluk
1. Kovilpatti 32227.375 40.77
2. Ottapidaram 36195.36 45.79
3. Vilathikulam 10619.265 13.44
2. Details of Anicuts S.No Name of the
Anicut Length of channel (m)
Channel fed tanks Ayacut (acres)
Kallar river basin 1. Ketchilapuram 780 Kilavipatti 112.02
2. Sivanthipatti 2750 Erachi 45.45
3. Thuraiyoor 2500 Semmaputhur 154.25
4. Athikinar 1900 Athikinar 318.00
5. Kattaboman (Left) 1000 Kalmedu (Therku and Vadaku)
443.80
6. Kattaboman (Right)
300 Pattinamaruthur, Tharuvaikulam (new)
700.22
7. Pattinamaruthur 4000 Pattinamaruthur 299.80
8. Melaarasaradi 1000 Tharuvaikulam (old) 388.00 3. Surface water potential of Kallar basin including Korampallamaru Period Surface water potential Southwest monsoon 12.96 MCM
Northeast monsoon 66.79 MCM
Annual 124.56 MCM
Diversion from Tambiraparani basin for irrigation 6.59 MCM

Annexure-I
A-167
4. Dominant crops
S. No Taluk Irrigation Predominant crops Irrigated Paddy, Cumbu, Coconut, cotton,
Vegetables, chilli and Onion 1. Vilathikulam
Unirrigated Cholam, Cumbu, Valli, Black gram, Green gram, Maize, Gingily, Sunflower, Caster, Cotton, Tamarind, Chenna, Coriander, Fodder cholam and Drychilli
Irrigated Paddy, Cumbu, Coconut, Vegetables, Chilli (Dry), Onion, Gerry leaves and Flowers
2. Ottapidaram
Unirrigated Cholam, Cumbu, Black gram, Maize, Green gram, Gingily, Sunflower, Cotton, Chenna, Coriander, Fodder Cholam, Chilli (Dry) and Onion
Irrigated Paddy, Maize, Coconut, Cotton, Vegetables, Dry chilli, Onion and Flowers
3. Kovilpatty
Unirrigated Cholam, Cumbu, Maize, Valli, Black gram, Green gram, Sunflower, Cotton, Coriander, Fodder cholam And Tamarind
5. Crop yields S.No Crops Average yield (kg/ ha)
Food grains
Cereals and Millets
1. Paddy 3990
2. Cholam 889
3. Cumbu 1434
4. Ragi 1930
5. Pulses
6. Black gram 288
I.
7. Green gram 440
Oil seeds
8. Cotton (in terms of lint) 131
9. Ground nut 1650
II
10. Gingily 182

Annexure-I
A-168
11. Sunflower 434
Other crops III
12. Chillies 434
6. List of Industrial units, their Category, Type and Size Sl. No Name of the Industrial unit Category Type and Size
1. Sahaya matha salt refinery, Kallurani Salt O/L 2. Kavin chemicals, Subramaniapuram Chemicals R/S 3. Sujana power limited (Gangai kondon),
Keelarasadi Power plant R/L
4. Arasan syntax limited, Ottapidaram Spinning O/L 5. South India Bromine & chemical (P)
limited, Veppalodai Chemical R/S
6. VPS Spinner, Eppodumvendran Spinning O/M 7. Krithiga spinning mill, Eppodumvendran Spinning O/M 8. Kalpage chemicals, Melarasadi Chemical R/S 9. Sona Chemicals, Nagampatti Chemical R/S 10. Sree Venkateswara carbides,
Pasuvanthanai Chemical R/S
11. Alex match works, Ottapidaram Match R/S 12. Sri Palani andavar match works,
Ottapidaram Match R/S
13. Pearl city spinning mills, Melarasadi Spinning O/S 14. Sri Murugan spinning, Eppodumvendran Spinning O/S 15. Sujana power limited (Thoothukudi),
Keelarasadi Power plant R/L
16. Loyal textiles mills limited, Koilpatti Spinning O/L 17. Lakshmi Mills Limited, Koilpatti Spinning O/L 18. Arasan Fertilizer’s (P) Limited,
Kadambur Fertilizer R/M
19. K.R. Exports (P) Ltd., Nalattinpudur Spinning O/M 20. Arasan Phosphates (P) Ltd., Kadambur Chemical R/S 21. Madurai Agro – Chemical And
Fertilizers, Koilpatti Pesticide R/S
22. Thangam Match Works, Keelaeral Match R/S 23. Appolo Match Company, Koilpatti Match R/S

Annexure-I
A-169
24. Perfect Match Company, Koppampatty Match R/S 25. Liberty Match Co. (P) Ltd., Kadambur Match R/S 26. Golden Chemical, Koilpatti Chemicals R/S 27. East India Match Factory, Kovilpatti Match R/S 28. Jayam Match Works, Kovilpatti Match R/S 29. Vennus Match Factory, Kovilpatti Match R/S 30. Maheswari Match Factory, Kovilpatti Match R/S 31. Victory Match Factory, Kovilpatti Match R/S 32. Antony Match Factory, Kovilpatti Match R/S 33. Meenatchi Match Factory, Kovilpatti Match R/S 34. The Hindu Match Factory, Kovilpatti Match R/S 35. Annamalai Match Factory, Kovilpatti Match R/S 36. Victory Steel Rolling Mill, Kovilpatti Steel rolling R/S 37. Kirasan Fire Works, Kovilpatti Match R/S 38. Ananth Match Industries, Kovilpatti Match R/S 39. Aruna Match Industries, Kovilpatti Match R/S 40. Alaguram Match Industries, Kovilpatti Match R/S 41. Baskaran Match Industries, Kovilpatti Match R/S 42. Country Match Industries, Kovilpatti Match R/S 43. Eswari Match Industries, Kovilpatti Match R/S 44. Jagath Match Industries, Kovilpatti Match R/S 45. Jaya Match Industries, Kovilpatti Match R/S 46. Kadalai Match Industries, Kovilpatti Match R/S 47. Kamatchi Match Industries, Kovilpatti Match R/S 48. Lakshmi Match Industries, Kovilpatti Match R/S 49. Yesesde Match Industries, Kovilpatti Match R/S 50. Mahalakshmi Match Industries,
Kovilpatti Match R/S
51. Liberty Match Industries, Kovilpatti Match R/S 52. Mahanath Match Industries, Kovilpatti Match R/S 53. Pope teaking Match Industries, Kovilpatti Match R/S 54. Prabhath (Ettayapuram) Match,
Kovilpatti Match R/S
55. Liberty Match Co. Pvt. Ltd, Pandavarmangalam, Kovilpatti
Match R/S
56. Ranganathan Match Works, Kovilpatti Match R/S

Annexure-I
A-170
57. Srilakshmi Match Industries, Kovilpatti Match R/S 58. Sri Palaniandavar Match Works,
Kadambur Match R/S
59. Sundaravel Match Industries Kovilpatti Match R/S 60. The Comerin Match Works, Kovilpatti Match R/S 61. The Kisan Match Works, Kovilpatti Match R/S 62. The Original Wax Industries, Kovilpatti Match R/S 63. Vishwanathan Match Industries,
Kovilpatti Match R/S
64. TNSTC, Kovilpatti Engineering O/S 65. Ponnay Cotton Willow Industries,
Kovilpatti Ginning O/S
66. K. Velayutham Chetty Farm, Kovilpatti Oil mill O/S 67. Industrial Chemicals, Kurukkuchalai Lime O/S 68. Vishala Knit - Wear (P) Limited,
Kovilpatti Garments G/S
69. Valli Garments (P) Limited, Kovilpatti Garments G/S 70. TVT And Sons, Keelaeral Ginning G/S
7. Taluk wise population details
S.no Taluk Population 1. Kovilpatti 54475
2. Ottapidaram 58732
3. Vilathikulam 12749
8. Literacy details S. No
Village Literacy rate %
Male %
Female %
Kovilpatty 1. Achankulam 90 70 30
2. Edaiseval 90 70 30
3. Kannakattai 25 50 50
4. Koppampatti 40 50 50
5. Manthitoppu 50 70 30
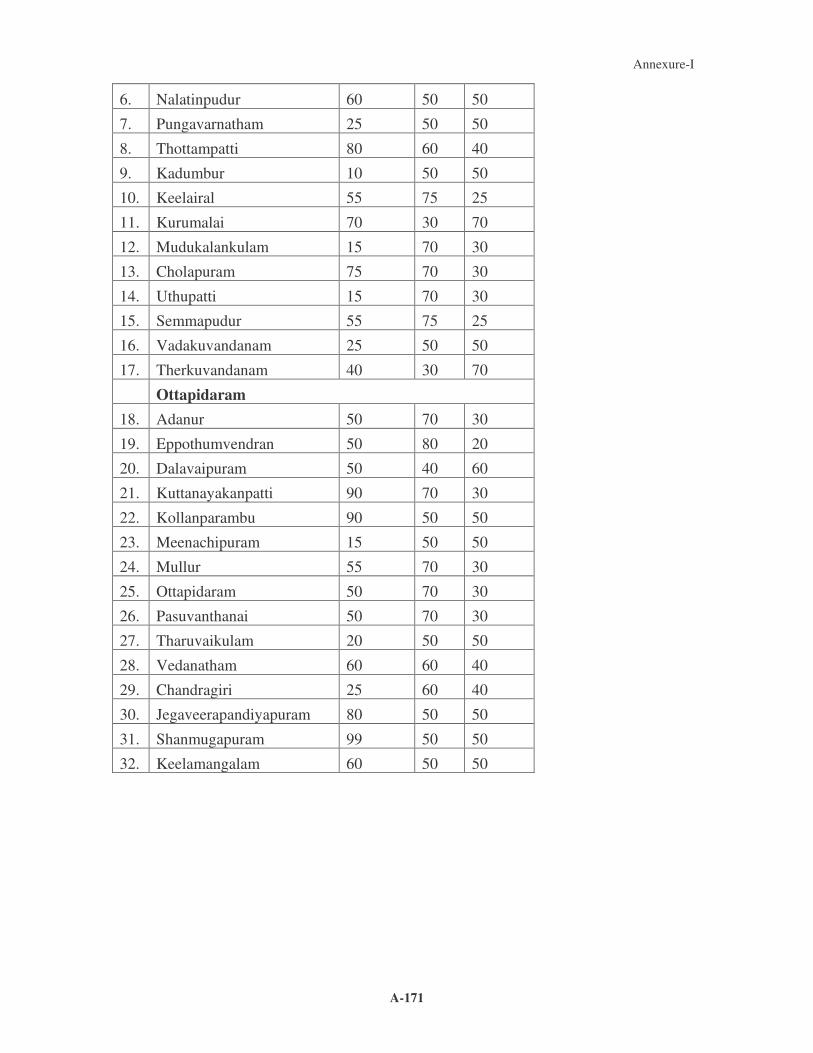
Annexure-I
A-171
6. Nalatinpudur 60 50 50
7. Pungavarnatham 25 50 50
8. Thottampatti 80 60 40
9. Kadumbur 10 50 50
10. Keelairal 55 75 25
11. Kurumalai 70 30 70
12. Mudukalankulam 15 70 30
13. Cholapuram 75 70 30
14. Uthupatti 15 70 30
15. Semmapudur 55 75 25
16. Vadakuvandanam 25 50 50
17. Therkuvandanam 40 30 70
Ottapidaram 18. Adanur 50 70 30
19. Eppothumvendran 50 80 20
20. Dalavaipuram 50 40 60
21. Kuttanayakanpatti 90 70 30
22. Kollanparambu 90 50 50
23. Meenachipuram 15 50 50
24. Mullur 55 70 30
25. Ottapidaram 50 70 30
26. Pasuvanthanai 50 70 30
27. Tharuvaikulam 20 50 50
28. Vedanatham 60 60 40
29. Chandragiri 25 60 40
30. Jegaveerapandiyapuram 80 50 50
31. Shanmugapuram 99 50 50
32. Keelamangalam 60 50 50

Annexure-I
A-172
9. Chemical Analysis of Water Samples (Ground Water)
KALLAR RIVER BASIN TALUK: KOVILPATTI VILLAGE:KADAMBUR
S. No
Date E.C pH Ca Mg Na K HCO3 CO3 SO4 Cl NO3 TDS TH RSC SAR SSL GCT
1. 1/91 6700 8.4 488 353 460 49 67 18 1512 1400 137 4451 2670 - 3.9 High CaCl
2. 7/91 No sample
3. 1/92 6400 8.3 464 335 437 47 61 18 1440 1333 180 4235 2535 - 3.8 High CaCl
4. 7/92 6600 8.2 380 389 368 39 110 0 1075 1453 161 3920 2550 - 3.2 High CaCl
5. 1/93 7000 7.9 480 450 575 39 67 0 1728 1595 291 5192 3050 - 4.5 High CaCl
6. 7/93 8900 9.2 620 353 828 55 146 0 1872 1843 242 5886 3000 - 6.6 High CaCl
7. 1/94 1400 8.8 60 69 69 117 244 24 86 216 124 987 435 - 1.4 C3S1 CaCl

Annexure-I
A-173
8. 7/94 500 8.5 30 28 23 26 79 24 6 89 32 298 190 - 0.7 C2S1 CaCl
9. 1/95 6600 8.1 464 399 529 47 177 0 1574 1446 236 4748 2800 - 4.3 High CaCl
10. 7/95 8000 7.9 220 693 437 59 92 0 1392 1879 298 5024 3400 - 3.3 High CaCl
11. 1/96 9000 8.4 440 369 920 90 122 30 1872 1773 254 5829 2700 - 7.7 High CaCl
12. 7/96 1000 8.0 40 51 78 47 214 0 149 145 2 619 310 - 1.9 C3S1 CaCl
13. 1/97 670 8.1 28 58 12 1 171 0 24 121 0 330 310 - 0.3 C2S1 CaCl
14. 7/97 3190 7.9 144 182 202 8 98 0 178 766 248 1777 1110 - 2.6 C4S1 CaCl
15. 1/98 7100 8.4 176 516 69 39 73 18 374 1432 112 2773 2560 - 0.6 High CaCl
16. 7/98 No sample

Annexure-I
A-174
KODAIYAR BASIN
1. Reservoirs
S No Name of Dam / Reservoir
Capacity (MCM)
Annual Storage (MCM)
Normal Opening of Reservoir
Ayacut area in (ha)
1 Pechiparai Dam 152.36 152.36 1st June
2 Perunchani Dam 81.84 81.84 1st June
3 Chittar Dam – I 17.28 17.28 1st June
4 Chittar Dam –II 28.55 28.55 1st June
5 Kodaiyar
(Upper Dam) I 118.50 118.50
-
Combined Ayacut of Kodaiyar system is 36836 Ha
6 Kodaiyar
(Lower Dam) II 0.883 0.883
- -
7 Kuttiyar Dam 0.227 0.227 - -
8 Chinna Kuttiyan Dam
2.776 2.776 - -
9 Poigaiyar
Reservoir 2.700 2.700
- 250
Total 405.116 37086
2. Land use / Land cover
S. No Description Area (ha)
1 Geographical area 153300
2 Forest 45543
3 Barren and uncultivable waste 2980
4 Land under non - agricultural use 22801

Annexure-I
A-175
5 Cultivable waste 128
6 Permanent pastures and other crazing land
63
7 Current fallows 762
8 Other fallows 1066
9 Net area sown 79699
3. Total Demand of Kodayar Basin & Pazhayar Sub Basin
Sector Kodaiyar Basin Pazhayar Sub Basin
Domestic 31.33 MCM 18.22 MCM
Irrigation 728.33 MCM 297.97 MCM
Live stock 3.40 MCM 1.56 MCM
Industries 2.31 MCM 10.58 MCM
TOTAL 765.37 MCM 328.33 MCM
OR 765 MCM 328 MCM
Water Budget 1267-765 = 502 MCM Net deficit 328-213= 115MCM
4. Surface water quality- February 2004
1 Station Code
KOD1
KOD2
KOD3
KOD4
KOD5
KOD6
KOD7
KOD8
KOD9
KOD10
2 Station Code No
170101
170102
170103
170104
170105
170106
170107
170108
170109
170110
3 Date of Collection
27.02.04
27.02.04
27.02.04
27.02.04
27.02.04
27.02.04
27.02.04
27.02.04
27.02.04
t e 4 PH - - - - - - - - -

Annexure-I
A-176
5 EC µmho/cm
- - - - - - - - -
6 Do mg/t
4.41 5.98 4.88 3.70 3.78 4.13 2.88 2.31 4.41
7 Temp. °C
27 27 28 28 27 29 28 29 28
8 Colour Code
7 7 7 7 7 7 7 7 7
9 Odour Code
1 1 1 1 1 1 1 1 1
10
PH 9.9 9.5 9.4 9.0 9.1 9.3 9.5 9.9 9.6
11
EC µmho/cm
5.77 8.34 16.37
5.45 23.75
4.49 14.44
7.38 10.91
12
TDS mg/l
0.036
0.052
0.102
0.034
0.148
0.028
0.090
0.048
0.068
Gen
eral
13
TSS mg/l
1.0 1.2 1.0 0.4 0.6 0.4 0.6 0.2 0.8
14
NH3 mgN/l
- - - - - - - - -
15
NO3=
mgN/l 0.46 0.52 0.69 0.92 0.52 1.33 0.99 0.57 0.55
utri
ents
16
Total P mg/l
- - - - - - - - -
17
BOD mg/l
0.85 0.56 1.13 2.86 1.86 1.96 2.31 1.96 0.86
Org
.msy
yrt
18
COD mg/l
6 6 12 18 20 20 24 18 14
Alk
alin
ity
19
Phen. Mg caco
3/l
0 0 0 0 0 0 0 0 0
No
Flow

Annexure-I
A-177
20
Total mg caco3/l
6 3 10 18 8 35 40 37 10
21
Total mg caco3/l
22 22 34 60 28 120 114 114 38
Har
dnes
s 22
Ca ++ mg cacor/l
- - - - - - - - -
23
Ca ++ mg/l
5.61 3.21 10.42
10.42
11.22
24.05
28.06
21.64
5.61
24
Mg ++mg/l
5.27 9.23 5.27 22.42
12.36
39.56
29.01
39.56
15.82
25
Na +
mg/l - - - - - - - - -
26
K + mg/l
- - - - - - - - -
27
Cl mg/l
15.82
8.52 9.94 12.78
14.21
44.02
35.50
45.44
18.46
28
So4 – mg/l
0.37 0.16 0.27 0.17 0.04 0.25 0.04 0.05 0.01
29
Co3-
mg/l - - - - - - - - -
Maj
or lo
ns
30
Hco 3-
mg/l 6 3 10 18 8 35 40 37 10
31
Sl mg/l
- - - - - - - - -
32
F mg/l - - - - - - - - -
Oth
er in
orga
nics
33
B mg/l - - - - - - - - -
Col
i for
ms
34
Total MPN/ 100ml
7 2 4 4 8 6 2 9 4

Annexure-I
A-178
35
Faccal MPN/100ml
2 <2 <2 2 4 2 2 6 2 E
.Col
i
36
Chlorophyll – A mg/l
- - - - - - - - -
Iron
37
Fe – mg/l
- - - - - - - - -
5. Industrial effluent contributors in Kanniyakumari District
S No
S.no
Name of Industry Nature Sewage
(KLD)
Trade effluent (KLD)
Solid Waste
(KLD)
1 Arasu Rubber Corporation, Mylar
Rubber 1.50 100 15
2 Indian Rare Earth Ltd, Manavalakurichi
Rare Earth
230 1170 5
3 Arasu Rubber Industries, Manalodai
Rubber 250.00 2400 15
4 Arasu Rubber Corporation, Keeriparai.
Rubber 5.00 70 50
5 Anusm Rubber Industries, Vellamadam
Rubber 0.75 100 Nil
6 Coromandal Proclorite Ltd. Kariakonam
Rubber 1.60 20 Nil
7 Cormarin Latex Products, Nagercoil.
Rubber 0.40 0.20 Nil
8 Kurian Abraham Ltd. Thucklay.
Rubber 0.10 5.00 Nil

Annexure-I
A-179
6. Crops grown
Crops Grown SNo Soil Series
Rainfed Irrigated 1 Thalakudi Pulses Banana
2. Kanyakumari, Thengaipattinam
Coconut Coconut
3. Kumarakovil, Muzhucode
Tapioca Banana
4. Kalkulam, Aramboly, thengampudur, Suchindram, Kottaram, Therur, Dharmapuram
Pulses Paddy, Banana
5. Thiruvattar, Navalkadu, Thuckalay
Pulses Paddy, Banana, Coconut
6. Marthandam Spices Paddy, Coconut Rubber, Spices
7. Thovalai, Colachal Cashew Orchard crops, Coconut
7. Normal area and productivity of major crops
S.No. Crop Area in hectare Normal yield in Kg/Ha.
1. Paddy 31000 (Both Crops)
6900 kgs. of paddy
2. Tapioca 9000 15000 kgs
3. Coconut 22586 10000 Nuts
4. Banana 5100 25000kgs
5. Pulses 3500 250kgs
6. Rubber 18327 1200kgs
7. Cashew 1800 2000kgs
8. Mango 1750 20000kgs.
9. Arecanut 750 500000 Nuts
10. Pepper 113 1500 kgs/ha

Annexure-I
A-180
11. Glove 518 1250-2500 kgs /ha
12. Pine apple 81 50 M.T. ha
13. Jack 754 30.40 M.T. /ha
14. Tamarind 1731 5.6 M.T. / ha
8. Main forest types
Main Types Extent (ha.) Tropical Wet evergreen –
Tropical Semi evergreen 35600
Tropical Moist evergreen 5233
Littoral & Swamp 215
Tropical dry deciduous 6385
Tropical dry thorn 548
Tropical dry evergreen 450
Sub-tropical broad leaved –
Montane Wet Temperate –
Others 805
Total 49236
9. Location and area affected by soil erosion
Level of Erosion
Slight Erosion (e1) Moderate Erosion (e2) Severe Erosion (e3)
Areas affected by erosion
Kalkulam, Aramboly, Thengampudur, Suchindram, Kottaram, Therur, Navalkadu, Thuckalay, Dharmapuram
Thalakudi, Kumarakovil, Marthandam, Thiruvattar, Thovalai, Colachal Mullucode
Kanniyakumari, Thengaipattinam.
Total Area affected by Erosion
Area (ha) 37,400
49,791 3,830

Annexure-I
A-181
10. Water logging
S No Taluk Village Extent (ha)
2.73
2.00
1 Agastheeswaram 1. Chettikulam
2. Melakulam
4.73
1. Pandiapuram
2. Melanadarkulam
3. Kelenadarkulam
4. Tamaraikuklam
2.54
3.58
3.45
5.47
2 Vilavancode
15.04
2.33
3.71
4.09
3 Thovalai 1. Aralvaimozhi
2. Kavalkinaru
3. Vadakankulam
10.13
2.17
1.09
4.40
3.96
4.01
4 Kalkulam 1. Thiruvettor
2. Vinadu
3. Pandiapuram
4. Alagiamandapam
5. Megamandapam
15.63

Annexure-I
A-182
11. Solid Waste Management in Municipalities
Municipality S.No Category Nagercoil Colachel Padmanabhapuram Kuzhithurai
Population 208751 23535 20051 20326 No. of
wards 51 24 21 21
Quantity of Municipal Solid Waste generated per day
62.5 M.T. 5.25 M.T. 4 M.T. 5.13 M.T.
Percentage of collection of Municipal Solid Waste
59.3 90% 100% 77% by Municipal 33% collected by market lease and others
Mode of disposal (whether disposed on land or roadside or water bodies etc)
At Compost Yard
Disposed on land
Disposed at Municipal Compost Yard
On land in compost yard
Whether Source segregation started and if so in how many wards
Yes 51 Wards Yes. 24 Wards Yes 21 Wards Yes 21 Wards
How the source segregated waste is being disposed at present?
Aerobic Heap method
Stored in bags By making compost at compost yard
The segregated Waste are being disposed by heaping method
Whether door to door collection has been started, if so in how may
Yes 51 wards Yes. 24 Wards
Yes 21 wards Yes 21 wards

Annexure-I
A-183
wards Whether site
has been identified for compost yard. If so whether NOC has been obtained from TNPCB
The Site has been identified for compost yard and also visited by A.E.E.T.N.P.C. Board, Nagercoil. NOC will be obtained.
Site has been identified and NOC yet to be obtained
Present compost yard is being maintained for the last 50 years
No. Suitable promboke site in and around 5 KM radius of the Municipal limit
Whether site for secure landfill has been identified? If so, whether NOC has been obtained from TNPCB
Site to be ascertained
No Proposed to one portion of existing compost yard may be convert as landfill site.
-do-
IF NOC has been obtained for compost yeard/secure landfill, what is the status of site? Whether any activity for composting is carried out? Or whether any dumping of waste is carried out in the new site
NOC will be obtained.
Site for land fill to be ascertained
At present dumping of waste is carried out in the existing compost yard.
No. The Joint Inspection of RDO, AEE of Pollution Control Board and Municipal Commissioner is in progress. The date to be fixed by RDO after the inspection of site. NOC proposals to be sent
Compost making is done as aerobic method.
Action is being taken to purchase new compost yard.

Annexure-I
A-184
Any remediation activity has been started for the old landfill site. If so furnish the details
There is no existing land fill site
No. Landfill site available for this Municipality
Proposed to improve the compost and with road, light water supply fence and watchman shed.
Nil
12. Population growth during the last century
Growth and Variation
Year Total population
Increase in numbers
Increase in %
1901 359248 - -
1911 422260 63102 17.56
1921 494125 71865 17.02
1931 581851 87726 17.75
1941 676975 95124 16.35
1951 826380 149405 22.07
1961 996915 170535 20.64
1971 1222549 225634 22.63
1981 1423399 200850 16.43
1991 1600349 176950 12.43
2001 1669763 69414 4.34
13. Area, Population, Literates:2001-2002
Population Literate Sl.
No Name of the Blocks/
Municipalities Area (km2) Persons Male Female Persons Male Female
1. Agastheswaram 143.35 115188 56778 58410 85970 44282 41688

Annexure-I
A-185
2 Rajakkamangalam 135.49 127325 63980 63345 92573 48516 44057
3. Thovalai 360.91 97802 49117 48685 71075 37722 33353
4. Kurunthancode 109.54 168810 85460 83350 119818 63016 56802
5 Thuckalay 127.41 162019 81739 80280 117437 61607 55830
6 Thiruvattar 88.37 159182 80261 78921 109262 57402 51860
7 Killiyoor 138.86 151034 76515 74519 105231 55695 49536
8. Munchiri 71.45 175454 88584 86870 116522 61656 54877
9 Melpuram 27.57 173426 86422 87004 120296 63380 56916
10. Nagercoil Municipality
19.37 190084 94834 95250 152274 78393 73881
11 Padmanabapuram 6.47 19269 9680 9589 14961 7875 7086
12 Colachel 5.18 24305 12320 11985 16822 8731 8091
13 Kuzhithurai 5.15 19226 9467 9759 14740 7513 7227
14. Tourist attractions
S.No District Tourist Place/Pilgrim center
1 Kanniyakumari Circular fort Vattakottai, Padmanabhapuram, Thiruparappu, Udayagiri, Muttam, Kanniyakumari, Suchindram

Annexure-I
A-186
15. Disease Prevalance S.No Name of Taluk Name of Disease No. of persons
affected in last 10 year 927 154 433 31 374
1 Agasthesewaram 1. Malaria 2. Diarrthoea 3. Jaundice 4.Japanese encephalitis 5. Chloera
1919 464 37 573 12 241
2 Kalkulam 1. Malaria 2. Diarrthoea 3. Jaundice 4.Japanese encephalitis 5. Chloera
1327 379 43 141 201 248
3 Thovalai 1. Malaria 2. Diarrthoea 3. Jaundice 4.Japanese encephalitis 5. Chloera
1012 4 Vilvancode 1. Malaria
2. Diarrthoea 3. Jaundice 4.Japanese encephalitis 5. Chloera
272 93 343 12 241
16. Soil erosion
S No Taluk Villages prone to Soil Erosion Quantum of Soil Eroded (ha)
4.33
2.96
4.42
3.01
1 Agastheeswaram 1. Rajakkamangalam
2. Suchindrum
3. Theroor
4. Dharapuram
15.72

Annexure-I
A-187
4.56
3.88
5.55
4.94
2 Kalkulam 1. Thuckalay
2. Thiruvattar
3. Padmanabapuram
4. Korthankode
18.93
5.45
2.65
3.10
3 Thovalai 1. Pothapandy
2. Manavalakurichi
3. Vattakottai
11.20
4 Vilvancode 1. Kuzhithurai
2. Killiyoor
3. Melpuram
4. Munchirai
2.96
5.01
5.66
11.33

Annexure-I
A-188
17. Quality of ground water (Selected wells from the Kodaiyar river basin during Jan-Feb-2004)
S. No.
Name of the Site pH EC CO3 HCO3 CL SO4 Total Ca Mg Na K Total RSC SAR Classi-fication
1. Nagercoil (047) 7.96 0.8 0.4 0.8 8.0 - 9.2 1.0 2.0 5.4 0.02 8.42 - 6.27 C1S1 2. Pothayari 8.09 0.32 0.4
1.2 0.2 1.5 - 2.1 1.6 .2 0.96 0.012 2.772 - 1.01 C1S1
3. Therekal-puthoor 8.66 2.62 2.8 4.0 21.0 - 26.2 0.8 .4 27.8 0.012 29.012 0.4 36.1 C3S3R1
4. Athithapuram 8.62 2.57 1.6 3.2 20.0 - 26.0 0.8 .2 25.2 0.07 26.27 5.0 35.6 C3S3R3
5. Kristhu Nagar 8.12 0.61 1.6 2.6 3.0 - 7.2 1.2 2.2 4.9 0.057 8.357 0.8 3.76 C1S1R1
6. Thovalai 8.27 2.02 0.8 1.2 18.0 - 20.8 1.8 7.8 13.9 0.95 24.45 - 8.96 C2S1 7. Thevasakayam 8.29 1.22 0.8 0.4 10.5 - 11.7 2.8 2.8 5.0 0.012 10.612 - 2.99 C2S1 8. Aralvaimozhi 8.39 1.18 0.8 1 10.5 - 12.3 3 2.8 5.08 0.0 11.88 - 2.98 C2S1 9. Mupanthal 8.09 0.76 1.2 0.8 6.5 - 8.1 3 2.0 2.52 0.58 8.1 - 1.59 C1S1 10. Aralvaimozhi 8.12 1.58 0.4 1.2 14.5 - 16.9 3.4 7.2 4.94 0.012 15.552 - 2.14 C2S1 11. Kavalkinaru 8.45 0.79 - 1.6 4.5 - 6.5 2 1.0 4.42 0.06 7.48 - 3.62 C1S1 12. Anjugramam 7.82 14.5 1.2 0.8 161 - 161.8 3.8 79.2 85.2 3.53 171.73 - 13.22 C5S3 13. Levanjipuram 8.05 1.1 1.2 2 10.5 - 13.7 2.2 4.8 4.59 0.08 11.67 - 2.45 C2S1 14. Azhahappapuram 8.48 0.66 0.8 1.2 4 - 6.4 1.8 2.2 4.13 0.04 8.17 - 2.92 C1S1 15. Myladi 8.26 1.82 1.2 1.0 16.0 - 17.8 4 3.0 14.9 0.05 21.95 - 7.96 C2S1 16. Suchindram 8.52 1.1 0.8 0.2 9.5 - 10.9 2.4 4.4 5.0 0.44 12.24 - 2.71 C1S1 17. Nesamony Nagar 8.66 0.45 0.8 0.2 3.5 - 4.5 1.6 1.2 1.59 0.26 4.65 - 1.34 C1S1 18. Asaripallam 8.47 0.35 1.6 0.2 2.5 - 3.5 0.4 0.8 2.48 - 3.68 - 3.22 C2S1

Annexure-I
A-189
19. Santhapuram 8.47 1.08 0.8 0.4 9 - 11.0 4.0 2.4 5.28 0.73 12.41 - 2.96 C1S1 20. Friday Market 8.51 0.8 0.4 0.2 7.5 - 8.5 3.0 1.2 4.64 0.33 9.17 - 3.22 C1S1 21. Mootharuni 8.44 0.22 0.8 0.2 2.0 - 2.6 0.8 0.8 1.0 0.03 2.603 - 1.12 C1S1 22. Monday Market 8.09 1.03 0.4 0.4 9.0 - 10.2 3 1.4 5.11 0.48 10.59 - 3.23 C2S1 23. Thickanamcode 8.04 0.28 0.2 0.2 2.5 - 3.1 1.0 0.8 1.65 0.05 3.5 - 1.75 C1S1 24. Karungal 8.3 1.12 0.6 1.6 10.0 - 11.8 5 1.4 4.69 0.19 11.28 - 2.62 C2S1 25. Paloor Kulakari 8.45 0.28 0.6 0.4 2 - 3.0 0.6 1.4 1.04 0.05 3.09 - 1.04 C1S1 26. Killiyoor 8.32 0.25 0.8 0.2 2 - 2.6 0.4 1.0 0.59 0.07 2.06 - 0.70 C1S1 27. Kaichoondi 7.95 1.73 0.8 0.8 18.0 - 19.6 3.6 1.4 13.9 0.14 19.04 - 8.79 C2S1 28. Nambali 7.76 0.53 - 0.6 5.0 - 5.6 1.6 1.2 2.52 0.14 5.46 - 2.14 C1S1 29. Venkanchi 7.88 0.38 - 0.4 3.5 - 3.9 1.2 .6 2.5 0.12 4.42 - 2.63 C1S1 30. Choozhal 7.92 0.11 - 0.4 1.0 - 1.4 0.4 .4 0.73 0.05 1.58 - 1.15 C1S1 31. Chengavilai 8.52 0.66 0.6 0.4 6.0 - 7.0 1.4 2.4 3.78 0.35 7.93 - 2.82 C1S1R1
32. AVM Canal East 8.03 26.5 0.4 1.0 329.5 6.0 336.9 16.6 65.0 240.43 8.15 330.18 51.59 - C5S3R1
33. Colachel 8.40 1.94 1.6 1.0 15.5 - 18.1 2.6 3.4 16.30 0.25 22.5 9.42 - C2S1R1
34. Kurumpanai 8.49 0.84 0.8 0.5 7.5 - 8.8 1.8 2.2 4.47 0.06 8.53 3.16 - C1S1R1
35. Inigo Nagar 8.40 0.68 0.8 0.4 6.0 - 7.2 1.2 0.8 4.62 0.05 6.67 4.62 - C1S1R1
36. Mel Midalam 8.34 0.51 0.4 0.6 4.5 - 5.5 0.6 0.6 4.17 0.14 5.37 6.97 - C1S1R1
37. 8.02 1.15 0.8 0.4 10.0 - 11.2 3.4 1.8 5.17 0.14 10.51 3.2 - C2S1R1
38. Keezhkulam 8.16 0.68 0.4 0.2 6.5 - 7.1 1.6 0.6 4.22 0.16 6.58 4.02 - C1S1R1
39. Thengapattanam 8.20 1.17 - 1.4 12.5 - 13.9 2.6 2.0 9.30 0.14 14.09 6.11 - C2S1R1
40. Virivilai 8.09 1.34 0.8 0.4 13.0 - 14.2 2.4 2.4 11.3 0.49 16.59 7.29 - C2S2R1
41. Thoothoor 8.16 0.48 0.8 0.2 4.0 - 5.0 1.8 1.4 1.96 0.35 5.51 1.55 - C1S1R1

Annexure-I
A-190
42. Kirathoor 7.95 1.31 0.8 0.4 15.0 - 16.2 2.8 0.4 13.04 0.54 16.78 10.35 - C2S2R1
43. Kannanagam 7.00 0.50 - 0.6 5.5 - 6.1 0.6 1.4 3.0 0.05 5.05 3.0 - C1S1R1
44. Kozhivilai 7.50 0.88 - 1.0 9.0 - 10.0 2.2 0.2 4.76 0.85 8.01 3.37 - C1S1R1
45. Kuzhithurai 7.58 0.57 - 0.8 5.5 - 6.3 2.4 0.4 3.48 0.19 6.47 2.95 - C1S1R1
46. Marthandam 7.63 0.43 - 0.4 4.0 - 4.4 0.2 1.6 2.61 0.107 4.51 2.75 - C1S1R1
47. Eraviputhoor Kadai 7.60 0.83 - 0.4 9.0 - 9.4 5.2 0.6 4.60 0.468 10.668 2.75 - C1S1R1
48. Mulagumoodu 7.80 0.42 - 0.8 3.5 - 4.3 0.6 1.6 1.96 0.12 4.28 1.88 - C1S1R1
49. Manali 7.95 0.32 - 0.2 3.0 - 3.2 1.4 0.2 1.96 0.16 3.72 2.20 - C1S1R1
50. Muttichanparai 7.89 0.14 - 0.6 2.0 - 2.6 0.5 1.5 0.59 0.05 2.65 0.59 - C1S1R1
51. Villukuri 6.30 0.69 - 0.8 7.0 - 7.8 1.2 1.2 4.61 0.58 7.57 4.23 - C1S1R1
52. Parvathipuram 8.84 1.65 9.6 1.6 8.5 1.6 21.3 12.0 2.0 19.56 0.012 23.572 19.56 8.5 C2S2R2
53. Chunkankadai 8.34 1.28 2.4 2.6 10.0 - 12.5 5.0 0.2 5.05 1.067 11.317 7.14 - C2S1R1
54. Thottiyode 8.36 1.02 1.2 2.0 8.0 - 11.2 3.6 2.8 5.21 0.04 11.65 2.92 - C2S1R1
55. Azhakiamandapam 8.22 0.67 1.2 0.6 6.0 - 7.8 3.0 2.2 2.91 0.176 8.286 1.82 - C2S1R1
56. Verkilambi 8.30 0.40 1.2 0.4 4.0 - 5.6 2.8 0.6 2.47 0.149 6.019 1.90 - C2S1R1
57. Thiruvattar 7.96 1.18 0.8 4.0 8.5 - 13.3 4.6 0.2 4.59 3.51 12.90 2.96 - C1S1R1
58. Cherupaloor 7.84 0.94 - 1.6 8.0 1.5 11.1 2.0 4.8 4.61 0.346 11.756 2.505 - C1S1R1
59. Kulasekaram 6.75 0.60 - 0.8 5.5 - 6.3 2.2 0.6 3.29 0.203 6.293 2.79 - C1S1R1
60. Thirparappu 6.18 1.28 - 0.8 11.5 - 12.3 3.4 0.2 8.08 0.67 12.35 6.03 - C2S1R1
61. Kalial 6.49 0.22 - 1.6 2.0 - 3.6 2.0 0.4 0.93 0.26 3.39 0.85 - C1S1R1
62. Melpuram 6.38 1.15 - 1.2 11.0 - 12.2 4.8 1.4 5.08 0.302 11.582 2.88 - C2S1R1

Annexure-I
A-191
KOTTAKARIYAR BASIN
1. Taluks in the basin
S.No Name of District Names of Taluks lying in the Basin 1 Madurai Melur
Total for the District
2
Sivagangai
Sivagangai, Devakottai, Karaikudy, Ilayangudy, Manamadurai,
Total for the district
3
Ramnad Thiruvadanai Paramakudi Ramnad Total for the district Grand Total for the basin
2. Ground Water Potential
Basin
area
Total Potential
available for the
taluk
GW Potential of the basin taluk ha.m
Name of Taluk
Area
ha
Total
ha m
For
irrigation
ha m
Total
Qty
Irrigation
Requirement
Industrial
Requirement
Sivagangai 73867 21861 21454 14682 14409 273
Devakottai 8671 8450 8314 1281 1261 20
Manamadurai 12204 6158 5542 1145 1030 115
Karaikudy 11883 11176 10891 1608 1567 41
Ilayangudy Full 6157 5985 172
Melur 4175 19509 19216 1151 1134 17
Tiruvadanai 56203 4090 3837 253
Paramagudy 16700 1158 1042 264 237 27
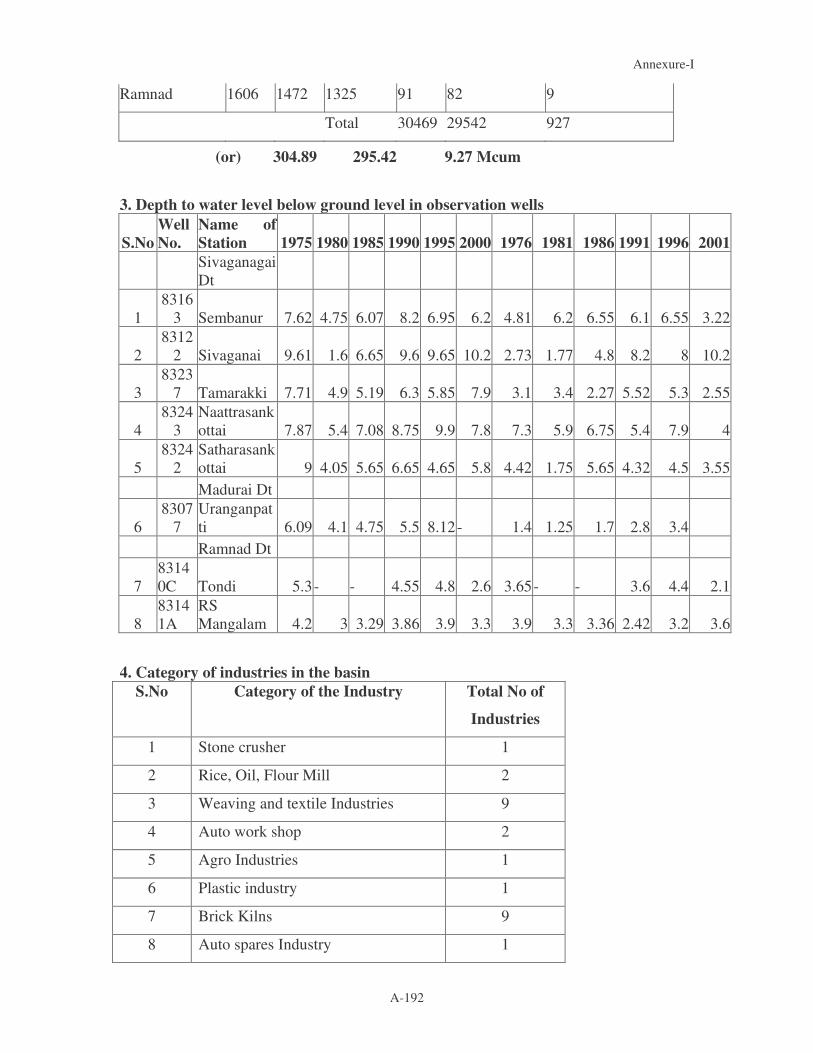
Annexure-I
A-192
Ramnad 1606 1472 1325 91 82 9
Total 30469 29542 927
(or) 304.89 295.42 9.27 Mcum
3. Depth to water level below ground level in observation wells
S.No Well No.
Name of Station 1975 1980 1985 1990 1995 2000 1976 1981 1986 1991 1996 2001
SivaganagaiDt
1 8316
3 Sembanur 7.62 4.75 6.07 8.2 6.95 6.2 4.81 6.2 6.55 6.1 6.55 3.22
2 8312
2 Sivaganai 9.61 1.6 6.65 9.6 9.65 10.2 2.73 1.77 4.8 8.2 8 10.2
3 8323
7 Tamarakki 7.71 4.9 5.19 6.3 5.85 7.9 3.1 3.4 2.27 5.52 5.3 2.55
4 8324
3 Naattrasankottai 7.87 5.4 7.08 8.75 9.9 7.8 7.3 5.9 6.75 5.4 7.9 4
5 8324
2 Satharasankottai 9 4.05 5.65 6.65 4.65 5.8 4.42 1.75 5.65 4.32 4.5 3.55
Madurai Dt
6 8307
7 Uranganpatti 6.09 4.1 4.75 5.5 8.12 - 1.4 1.25 1.7 2.8 3.4
Ramnad Dt
7 83140C Tondi 5.3 - - 4.55 4.8 2.6 3.65 - - 3.6 4.4 2.1
8 83141A
RS Mangalam 4.2 3 3.29 3.86 3.9 3.3 3.9 3.3 3.36 2.42 3.2 3.6
4. Category of industries in the basin
S.No Category of the Industry Total No of
Industries
1 Stone crusher 1
2 Rice, Oil, Flour Mill 2
3 Weaving and textile Industries 9
4 Auto work shop 2
5 Agro Industries 1
6 Plastic industry 1
7 Brick Kilns 9
8 Auto spares Industry 1

Annexure-I
A-193
9 Wood industry 1
10 Food and allied food products 2
11 Chemical industry 1
12 Others 5
Total 35
5. Details of Percolation Ponds Constructed
S.No Name of Taluk Name of Reserve
Forest
No Of Percolation
Ponds 1 Sivagangai Kollangudi (N) 1
Allur 1
2 Karaikudi Panagudi 1
Keelapoongudi 1
Ilandaikulam 1
6. Cropping Pattern
Name of District
S No Name of Crop Pudukottai Dindigal Sivagangai Ramnad
Madurai
1 Rice Sep-January Aug-Dec
June-Oct
Aug-Nov to
Jan-March
Nov-
March
June-Oct
Aug-Dec
2 Groundnut
(oil Seeds)
July-Sep Jan-May Throughout the
year
Rice Oct-January
Cumbu or
Ragi
Feb-May Jan-July to
Aug-Sep
Mar-June
June-Sep
3 Groundnut July-October June-Oct
July-Nov
Chilles Oct-Feb
Maize March-June Jan-May Aug-Sep Feb-June
Aug-Jan
4 Ragi July-Oct June-Oct
Rice ` Oct-Feb

Annexure-I
A-194
Cotton Feb-June Aug-Sep to
Jan-Feb
Feb-March to
Sep-Oct
Feb-Aug Feb-Aug
June-Dec
5 Groundnut June-Oct Dec-April
Black gram Nov-Feb June-Aug Mar-May
Horse
gram,Ragi
Aug-Nov
Gingelly Dec-March
6 Sugarcane Throughout
the year
Jan-Dec
7. Average Yield of the Crops
S. No. Crop Normal area Ha Average Production
M.T.
Average
Productivity
KG / Ha
1. Paddy 1,30,373 242101 1857
2. Cholam 2,118 1851 874
3. Cumbu 807 976 1210
4. Ragi 1,351 1140 844
5. Total Millets 4,893 4883 998
6. Minor millets 617 316 512
7. Pulses 3,623 1909 527
8. Cotton 2867 Bales 7282 Bales 2.54 Bales
9. Groundnut 6,039 5423 898
10. Sunflower 168 101 601
11. Gingeily 1,540 653 424
12. Chillies 16,163 15306 947

Annexure-I
A-195
8. Population Details
Population (2001 Census)
S.No Name of Districts
Name of Taluk
No of Villages
situated in the basin
Area of the basin
Km2 Male Female Total
1 Madurai Melur 4 41.75 12349 12463 24812
2 Sivagangai Sivagangai 96 738.67 77219 81708 158927
Manamadurai 13 122.04 7867 8085 15952
Karaikudy 12 18.83 8671 9178 17849
Devakkottai 34 86.71 18865 19847 38712
Ilayankudy 52 378.97 47656 51457 99113
Total 207 1445.22 160278 170275 330553
3 Ramnad Paramakudy 27 167.00 20033 21438 41471
Thiruvadanai 59 562.03 54951 55415 110366
Ramnad 6 16.06 2450 2394 4844
Total 92 745.09 77434 79247 156681
Grand Total 303 2232.06 250061 261985 512046
9. Disease prevalence- January to March 2004 S.no Name of
Block
Add Mal-
aria
Chicken
-pox
Measles TB Leprosy
1 Manamadurai
8 2 27 1 3 2
2 Ilayangudy 32 5 - - - 2
3 Kallal 5 - - - 21 2
4 Devakottai 7 - - - - 3
5 Sivagangai 49 1 - 4 2 4
6 Kalayarkovil 6 1 1 - 4 2
Total 137 9 28 5 30 15

Annexure-I
A-196
10. District wise literacy level
Literate Districts
Persons Male Female
Madurai 1795751 1003506 792245
Ramnad 760819 422992 337827
Sivagangai 745735 419480 325895
11. District wise Tourist attractions
1 Tuticorin Kattabomman Memorial Fort,Jain cave Temple, Thiruchendur temple
2 Tirunelveli Mundanthurai, Papanasam, Courtallam, Manimuthar, Uvari ,Kalakadu,
Ancient Shiva Temple an Vaishnava Temple Sculptures

Annexure-I
A-197
NAMBIYAR BASIN
1. Area of the sub basins
Area in Sq. Km S.No. Name of Sub –Basin
Plain Hill
Total
1. Hanumanadhi 316.61 61.39 378
2. Nambiyar 959.21 86.79 1046
3. Karumeniar 660.00 Nil 660
� Total 1935.82 148.18
2. Hydrology of the river Basin Origin Length Km Tributaries Reservoirs
Hanumanathi Marathan Odai 43.5 Kallandi Odai Sooravali Odai Kuthirapanchan Odai
Nil
Nambiyar Thirukarankudi 48.0 Thamaraiyar Parattaiyar
2
Karumaniyar Manimutharu Channel 46.5 Nil

Annexure-I
A-198
3. Block wise Ground water Potential (in MCM)
S.No Name of Blocks
Ground water Recharge
Utilizable Ground water Recharge
Net Ground water Recharge
Balance ground water draft
Wells feasible for devolvement
01 Nanguneri 88.02 74.82 18.29 56.33 3062
02 Radhapuram 43.81 37.24 27.26 9.98 541
03 Valliyur 64.09 54.47 27.61 26.86 1455
04 Kalakkadu 5.74 38.88 20.90 17.98 974
05 Sathankulam 41.65 34.56 24.45 18.91 523
06 Tiruchendur 43.23 32.43 22.76 16.67 521 4. Water Quality : - Radhapuram
Bicarbonate Name of the village
Electrical Conductivity
pH
Calcium Magnesium Sodium + Potta sium
Hco3 Co3
Sul phate
Chlorine Nitrate Total Soilids
Kavalkinaru 2000 8.3 20 6.3 327 140 36 125 447 81 1169
Radha puram 2350 8.4 48 44 404 92 18 106 496 298 1160
Valliyur
Bicarbonate Name of the Village
Electrical Conductivity
pH
Calcium Magnesium Sodium + Pottasium Hco3 Co3
Sulphate Chlo rine
NitrateTotal Soilids

Annexure-I
A-199
Nallur 690 8.1 18 33 85 214 0 24 110 7 384
Panagudi 4700 8.3 232 156 473 31 12 240 1007 589 2725
Valliyoor 5900 8.0 384 141 619 61 0 269 1319 806 3569
S No Location Ec NO3 Fe F 1 Valasaikinaru 1300 15.0 0.32 0.3
2 karungadal 950 15.0 0.48 0.1
3 Alakinaru 1060 11.0 0.16 0.2
4 Mudalur 2050 4.0 0.16 0.1
5 Periatalai 660 2.0 0.16 -
6 Tiruchendur 4050 3.0 0.16 0.8
7 Kayamozhi 330 4.0 0.16 0.2 8 Udankudi 1920 5.0 0.32 0.6
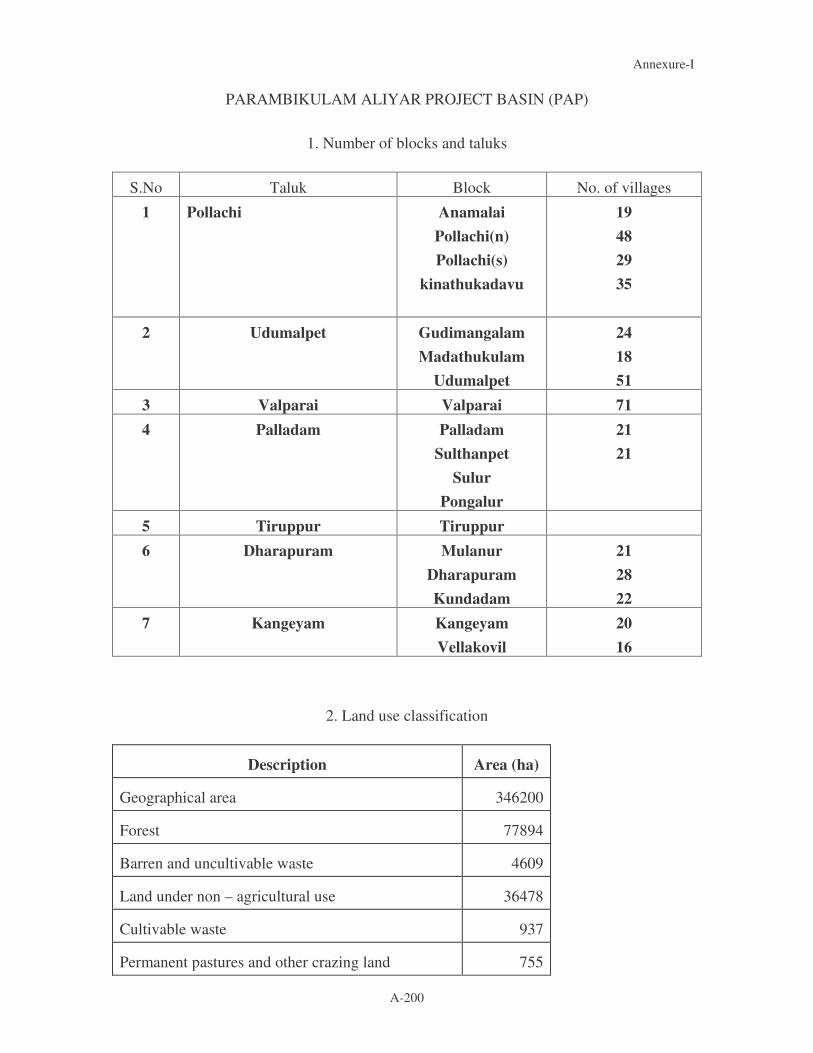
Annexure-I
A-200
PARAMBIKULAM ALIYAR PROJECT BASIN (PAP)
1. Number of blocks and taluks
S.No Taluk Block No. of villages
1 Pollachi Anamalai Pollachi(n) Pollachi(s)
kinathukadavu
19 48 29 35
2 Udumalpet Gudimangalam Madathukulam
Udumalpet
24 18 51
3 Valparai Valparai 71 4 Palladam Palladam
Sulthanpet Sulur
Pongalur
21 21
5 Tiruppur Tiruppur 6 Dharapuram Mulanur
Dharapuram Kundadam
21 28 22
7 Kangeyam Kangeyam Vellakovil
20 16
2. Land use classification
Description Area (ha)
Geographical area 346200
Forest 77894
Barren and uncultivable waste 4609
Land under non – agricultural use 36478
Cultivable waste 937
Permanent pastures and other crazing land 755

Annexure-I
A-201
Current fallows 59292
Other fallows 7333
Land under Misc. use 1623
Net area sown 157279
3. Salient Features of the dams
Name of Dam
River Catchment
(miles2)
Yield in
TMC
Height of Dam from
foundation( ft)
Active storage
depth (ft)
Capacity in
Tmct
Cost (Rs
Lakhs)
Upper Nirar Nirar 29 9.0 90 -- 0.039 178
Lower Nirar Nirar 39 2.5 165 45 0.274 547
Sholayar Nirar 47 2.5(TN
)
345 160 5.392 1125
Parambikulam Thunakada
vu
88.2 14.0 240 72 17.820 405.4
Thunakadavu Thunakada
vu
16.7 -- 85 22 0.557 60
Peruvaripallam Peruvaripal
lam
6.10 -- 111 -- 0.20 34.3
Aliyar Aliyar 76 9(upto
Manak
adavu)
145 120 3.864 294.9
Thirumoorthy Palar 31 1 122 60 1.935 237.80
4. Details of Canals and Ayacuts
S.No Name of Canal Length in km Ayacut in Acres
1 Pollachi Canal 48 23488
2 Vettaikaranpudur Canal 17.2 11181

Annexure-I
A-202
3 Aliyar Feeder Canal 13.15 4665
4 Udumalpet Canal 30.50 58292
5 Sethumadai Canal 8.20 5044
6 High Level Canal 2.00 2477
7 Old Aliyar Ayacut 5 Anicuts 6400
8 Parambikulam Main Canal 125.4 316383
9 Dhalai Channel River and Tank 2800
10 Indirect ayacut in three tanks Tanks 93.4
431664
Sub-Basin wise Ayacut
1 Aliyar dam old and new ayacut -- 51588
2 Thirumoorthy dam Old and new ayacut
-- 380106
4.32 Lakhs Acres
5. Projected water demand and water balance for various uses in Mcm.
Sl. No.
Purpose 1999 2004 2019 2044
1 Domestic uses 44.6 47.89 57.74 74.16
2 Agriculture 1558 1558 1558 1558
3 Industries 33.21 44.28 77.49 132.84
4 Livestock 11.81 11.81 11.81 11.81
6 Total 1647.62 1661.98 1705.04 1776.81
7 Water Balance -480.62 -494.98 -538.04 -609.81
6. Physico Chemical Characteristics
S.No Characteristics Kadamparai dam surface water
Upper Aliar dam surface water
Nirar dam surface water
Sholayar dam surface water
1 Electrical 20-40 60-85 16-55 25-55

Annexure-I
A-203
conductivity Reciprocal meg ohms per Cm 3@ 20ºC
2 Total Solid @ 105ºC mg/1
20-27 39-68 14-50 20-54
3 Total Hardness as CaCo3 mg/1
9-20 23-44 5-22 10-24
4 Total Alkalinity as CaCo3 mg/1
9-13 18-24 7-26 8-22
5 PH 7.2-7.8 6.8-7.8 6.2-8.6 6.4-8.5
6 Nitrate Nitrogen as N mg/1
0-0.3 0.2-1.0 0-0.3 0-1.0
7 Chloride as Cl mg1 3-5 4-8 2-10 4-8
8 Iron as Fe mg/1 0.05-0.30 0.15-0.70 0.05-0.35 0.05-1.40
7. District wise area and population details
Population Districts Region Persons Male Female
Coimbatore Total 4224107 2156280 2067827
Rural 1435036 727610 707426
Urban 2789071 1428670 1360401
Erode Total 2574067 1306039 1268028
Rural 1384746 704855 679891
Urban 1189321 601184 588137
8. District wise literacy level
Literate Districts Persons Male Female
Coimbatore 2916996 1621164 1295832
Erode 1532258 894339 637919
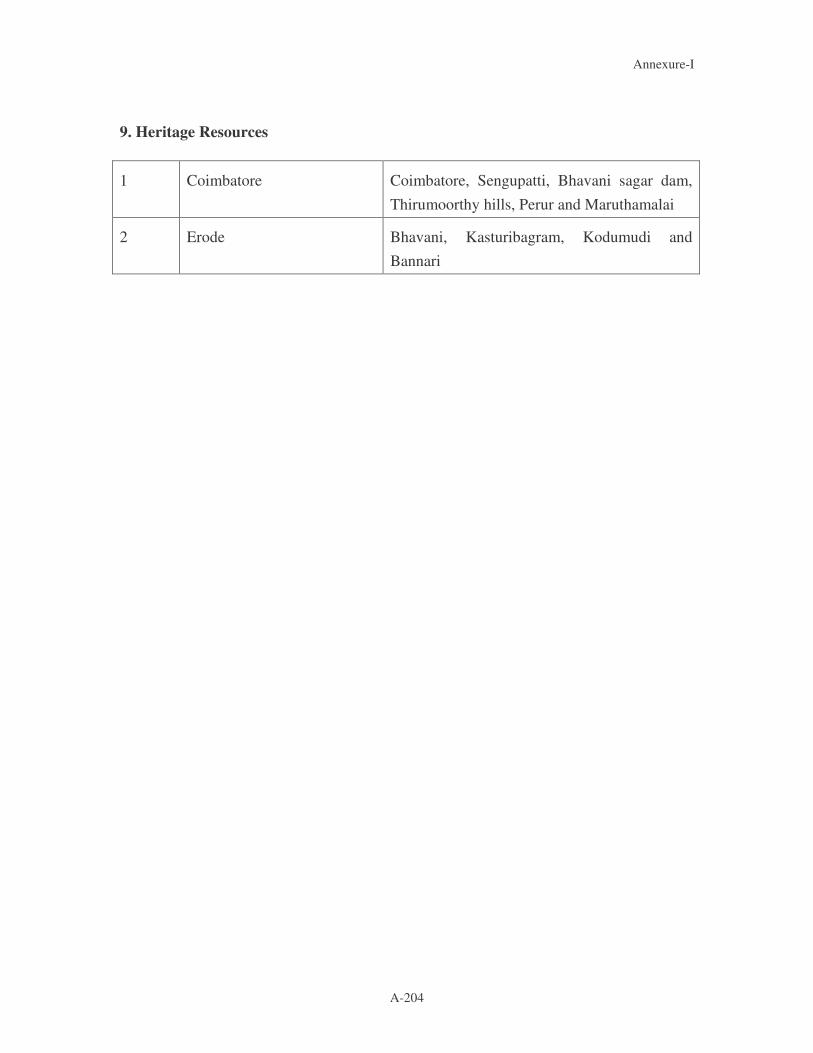
Annexure-I
A-204
9. Heritage Resources
1 Coimbatore Coimbatore, Sengupatti, Bhavani sagar dam, Thirumoorthy hills, Perur and Maruthamalai
2 Erode Bhavani, Kasturibagram, Kodumudi and Bannari

A-205
TAMBRAPARANI BASIN
1. The distribution of the basin area in different districts
S.No. Districts Area of the District (Sq. Km)
Area covered by the Basin (Sq. Km)
1. Tirunelveli 6780 5317
2. Thoothukudi 4649 625
2. Water balance statement
S. No. Purpose 1999 2004 2019 2044
1 Domestic uses 48.72 51.44 59.63 73.25
2 Agriculture 2645 2645 2645 2645
3 Industries 34.86 46.48 81.34 139.44
4 Livestock 21.32 21.32 21.32 21.32
6 Total 2749.9 2764.24 2807.29 2879.01
7 Water Balance -680.9 -695.24 -738.29 -810.01
3. Cropping Pattern
Crop
Kar
II Crops
Pishanam
Advance
Kar
Annual
Crop
Single Crop Crop Kar
Paddy
(Jun-Sep)
Paddy
(Oct-Feb)
Paddy
(Apr-July)
Banana
Sugarcane
Paddy
(Oct-Feb)
Sugarcane
(Annual)
Banana
(Annual)
Sorghum
Cumbu
Ragi
Maize
Millets
Groundnut
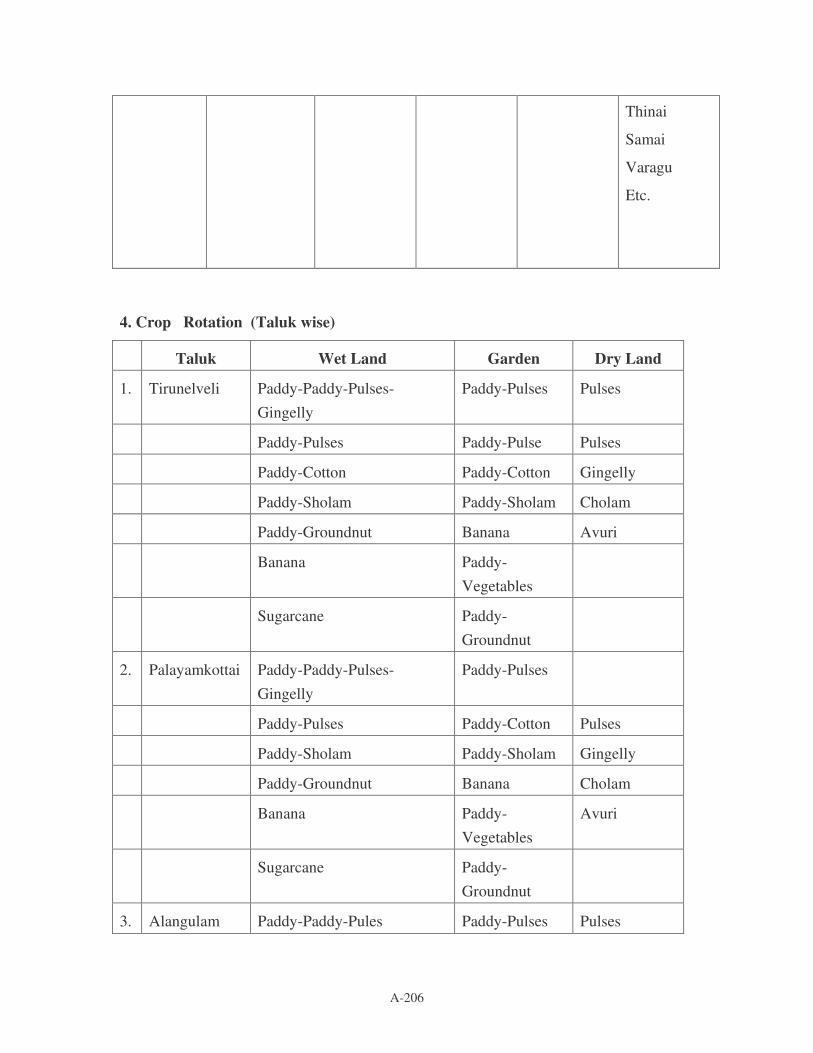
A-206
Thinai
Samai
Varagu
Etc.
4. Crop Rotation (Taluk wise)
Taluk Wet Land Garden Dry Land
1. Tirunelveli Paddy-Paddy-Pulses-Gingelly
Paddy-Pulses Pulses
Paddy-Pulses Paddy-Pulse Pulses
Paddy-Cotton Paddy-Cotton Gingelly
Paddy-Sholam Paddy-Sholam Cholam
Paddy-Groundnut Banana Avuri
Banana Paddy-Vegetables
Sugarcane Paddy-Groundnut
2. Palayamkottai Paddy-Paddy-Pulses-Gingelly
Paddy-Pulses
Paddy-Pulses Paddy-Cotton Pulses
Paddy-Sholam Paddy-Sholam Gingelly
Paddy-Groundnut Banana Cholam
Banana Paddy-Vegetables
Avuri
Sugarcane Paddy-Groundnut
3. Alangulam Paddy-Paddy-Pules Paddy-Pulses Pulses

A-207
Paddy-Pulses Paddy-Cotton Groundnut
Paddy-Cotton Paddy-Chilly Gingelly
Paddy-Chilly Paddy-Groundnut
Paddy-Vegetables Paddy-Vegetables
Banana Banana
4. Ambasamudram
Paddy-Paddy-Pulses Paddy-Pulses Pulses
Paddy-Pulses Paddy-Cotton Gingelly
Banana Paddy-Chilly Cholam
Sugarcane Banana
Vegetables
5. Tenkasi Paddy-Paddy-Pulses Paddy-Groundnut
Cholam-Pulses-Gingelly
Paddy-Paddy-Gingelly Paddy Cholam-Pulses
Paddy-Pulses-Banana Paddy-Cotton/ Chilly
Groundnut-Pulses
Paddy-Chilly-Cotton
Banana
Sugarcane
6. Shenkottai Paddy-Paddy-Pulses/Gingelly
Paddy-Pulses/Gingelly
Cholam-Pulses
Paddy-Pulses Paddy-Cotton/Chilly
Cholam
Paddy-Chilly/Cotton Groundnut-Paddy
Pulses
Sugarcane Banana

A-208
Paddy-Vegetables Sugarcane
7. Sankarankoil Cotton-Paddy Pules-Paddy Pulses
Chilly-Paddy Cotton-Paddy Cotton
Vegetables-Paddy Gingelly Cholam
Sugarcane Sugarcane Gingelly
Banana Banana Sunflower
Sunflower
5. List of Industries in Chittar sub basin
S.No Name of the Industry Location Category
1 Oil mills Alankulam Green
2 Modern Rice mills Alankulam Orange
3 Fibre industry Pattakurichi OR
4 Modern rice mill Tiruchitrambalam Orange
5 Vaigai Agro products Poolankulam Green
6 Yogambigai Chemicals Andipatti SR
7 Thatha soap company Andipatti Green
8 Saw mill Pettanadarpatti I Orange
9 Stone Crusher Pettanadarpatti I OR
10 Stone Crusher Thippanampatti OT
11 15 Nos. of Modern rice mill Keelapavoor Orange
12 Chunnambu powder Industry
Keelapavoor SR
13 Pot making Industry Keelapavoor Green 6. List of industries in Tambraparani river basin
S.No Name of the industry Location Category
1 Chamber Brick making Industry - 5 Nos.
Thirukkolure Orange
2 Attai Industry Angamangalam Green
3 Ricemill Angamangalam Orange
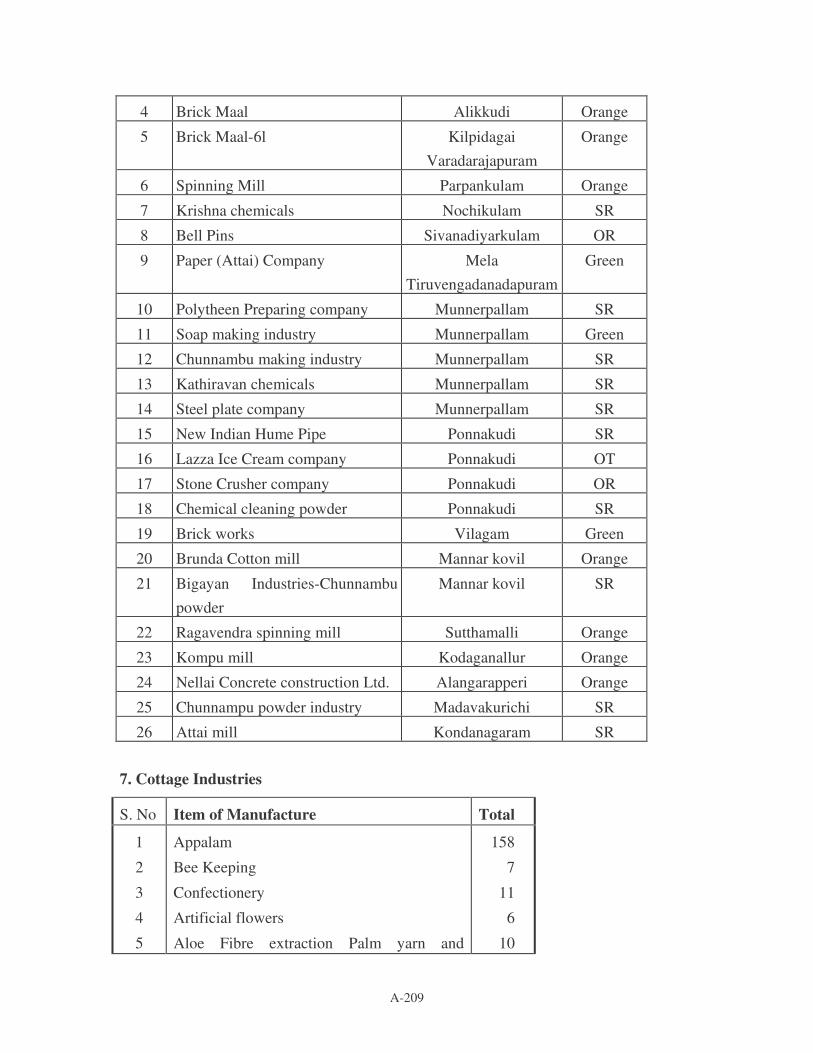
A-209
4 Brick Maal Alikkudi Orange
5 Brick Maal-6l Kilpidagai Varadarajapuram
Orange
6 Spinning Mill Parpankulam Orange
7 Krishna chemicals Nochikulam SR
8 Bell Pins Sivanadiyarkulam OR
9 Paper (Attai) Company Mela Tiruvengadanadapuram
Green
10 Polytheen Preparing company Munnerpallam SR
11 Soap making industry Munnerpallam Green
12 Chunnambu making industry Munnerpallam SR
13 Kathiravan chemicals Munnerpallam SR
14 Steel plate company Munnerpallam SR
15 New Indian Hume Pipe Ponnakudi SR
16 Lazza Ice Cream company Ponnakudi OT
17 Stone Crusher company Ponnakudi OR
18 Chemical cleaning powder Ponnakudi SR
19 Brick works Vilagam Green
20 Brunda Cotton mill Mannar kovil Orange
21 Bigayan Industries-Chunnambu powder
Mannar kovil SR
22 Ragavendra spinning mill Sutthamalli Orange
23 Kompu mill Kodaganallur Orange
24 Nellai Concrete construction Ltd. Alangarapperi Orange
25 Chunnampu powder industry Madavakurichi SR
26 Attai mill Kondanagaram SR
7. Cottage Industries
S. No Item of Manufacture Total
1
2
3
4
5
Appalam
Bee Keeping
Confectionery
Artificial flowers
Aloe Fibre extraction Palm yarn and
158
7
11
6
10

A-210
6
7
8
9
10
11
12
13
14
15
16
17
18
19
20
21
22
23
24
25
26
27
28
29
30
31
32
33
Coconut fibre
Laundry
Leather goods making
Ornamental and jewellary
Ornamental leather crafts
Weaving cotton wool textiles
Tailoring
Cane furniture
Agar bathis making
Korai mats, dates baskets, hand bags, window screens
Palmyra leaf-fancy utility articles
Palmyra rafters, stoma, furniture cots, etc.
Wood Turning Industry, other wood works
Winding of silk, thread, cotton thread and artificial yarn
Coconut leaf
Beads
Plastic wire knitting to furniture
Pickles and mixture making
Puffed Rice
Basket (Eathel-Kambu)
Brass, Copper Vessels
Country Bricks
Pottary
Blacksmithy
Wet Grain Pounding
Photo framing
Silk cotton pillow and mattress
Homemade snacks
64
45
63
6
197
329
11
11
269
276
10
89
57
69
45
52
34
19
147
131
65
129
23
19
6
1
12
24
Total 2395

A-211
8. Water Logging
S. No. Name of the Village Location
Period - Seasonal / throughout the
Year 1. Melapattam South of the Essakkiyamman
koil / Kalvettankuli All through the year
2. Parpankulam Kalvettankuli-2 All through the year 3. Krishnapuram West of the village
(kalvettankuli) All through the year
4. Paraikulam Near Paraikulam & South of Uthamapandiyakulam All through the year
5. Brammadesam Near main road (Upto 15-20m) Rainy Seasons only
6. Athalanallur Survey No. 94 Return flow water 7. Kabaliparan Near Urvalnthankulam Rainy Seasons only 8. Pappakudi Nanthan thattai Throughout the
year, Return flow water.
9. Menaparanallur Return flow water, 15-20 m
10. Suthamalli Near Veterinary Hospital Rainy Seasons only Near Palvoor bus stand Rainy Seasons only Pattankallur Rainy Seasons only
11. Mangalakurichi During rainy seasons
12. Karunkulam Way to Karunkulam, west side water weeds are in the
area.
During rainy seasons
9. Diseases
Authoor kasba Polia, Uterus Tumor
Avanpperi Fever Seasonal
Chettiyapatthu Jaundice,Dysentry Waterborne Seasonal
Kachinavilai Cholera,Jaundice, dysentery
Waterborne
Khansahipuram Typhoid fever Seasonal
Kilpattam Typhoid, fever Seasonal
Kilanattham Fever Seasonal
Kodarankulam Diarrhoea Waterborne Seasonal

A-212
Krishnapuram Elephanttiasis, Thyroid Deficiency & fever
Laksmipuram Jaundice,Dysentry, Waterborne Seasonal
Manapadaiveedu Fever Seasonal
Marudur Disease due to Climate only
Melapattam Fever Seasonal
Melaputhaeri Fever Seasonal
MelaTiruvengadanadapuram
Cholara,Jaundice, Seasonal
Mookuperi Typhoid,Jaundice, Cholera
Waterborne
Mutur Typhoid fever Seasonal
Nalumavadi Cholera,Jaundice, dysentery
Waterborne
Nangaimozhi Jaundice,Dysentry Waterborne
Nochikulam Chicken-Pox, Typhoid, Jaundice, fever
Water Born Seasonal
Palyamchettikulam Fever Seasonal
10. Population details
Population Districts Region
Persons Male Female
Tirunelveli Total 2801194 1372082 1429112
Rural 1499062 729830 769232
Urban 1302132 642252 659880
Thoothukudi Total 1565743 764087 801656
Rural 903811 437599 466212
Urban 661932 326488 335444
Source: statistical handbook of Tamilnadu 2002

A-213
11. Literacy level
Literate Districts
Persons Male Female
Tirunelveli 1917238 1041964 875274
Tuticorin 1140959 598669 542290
Source: statistical handbook of Tamilnadu 2002
12. Tourist attractions
1
Tuticorin Kattabomman Memorial Fort,Jain cave Temple, Thiruchendur temple
2 Tirunelveli Mundanthurai, Papanasam, Courtallam, Manimuthar, Uvari ,Kalakadu,
Ancient Shiva Temple an Vaishnava Temple Sculptures

A-214
13. Water Quality
Sl. No Quality/Paramater Mukkudal Keelasev
al
Ramanadhi-Pottal pudur
Gadana nadhi-
Dam site
Gopala samudram
Vellan kuli
Cheran madevi
Gopala samudram river
Aladiyur Mukku dal I
Mukku dal II
SR No.227/2004 ???
1 pH 6.8 6.7 6.7 7 6.6 6.5 7.7 7.9 7.9 7.7 8 7.8
2 Ec 0.13 0.15 0.74 0.07 0.13 0.09 0.15 0.13 0.1 0.32 1.46 1.45
3 Carbonate (dsm-1) 0 0 0 0 0 0 0 0 0 8.6 1 0
4 Bicarbonate (m eg/lit) 0.8 1 5 0.2 0.8 0.4 1 0.8 0.6 2.2 8.6 5.8
5 Chloride (m eg/lit) 0.5 0.5 2 0.5 0.5 0.5 0.5 0.5 0.5 1 3 6.5
6 Sulphate (m eg/lit) 0 0 0.4 0 0 0 0 0 0 0 2 2.2
7 Calcium (m eg/lit) 1 1.2 1.8 0.6 1 0.6 1 0.6 0.8 1.8 4 2.8
8 Magnecium (m eg/lit) 0 0 4 0 0 0 0.2 0.4 0 0.6 1 6.8
9 Sodium (m eg/lit) 0.3043 0.3478 1.652 0.1739 0.2391 0.2173 0.3043 0.3043 0.1956 0.8695 9.345 3.978
10 Pottasium (m eg/lit) 0.0128 0.0256 0.0256 0.0128 0.0128 0.0128 0.0128 0.0128 0.0128 0.0256 0.2051 0.9743
11 Sodium Absorption Ratio (m eg/lit) 0.3043 0.449 0.97 0.3174 0.2391 0.3967 0.3928 3043 0.3092 0.7937 5.91 1.815
12 Residual Sodium carbonate (m eg/lit) 0 0 0 0 0 0 0 0 0 0 0 0
13 Classification C1S1R1 C1S1R1 C1S1R1 C1S1R1 C1S1R1 C1S1R1 C1S1R1 C1S1R1 C1S1R1 C1S1R1 C2S1R1 C2S1R1
14 Major salt Calcium bicarbonat
e
Calcium bicarbona
te
Magnesium
bicarbonate
Calcium chloride
Calcium bicarbonat
e
Calcium
chloride
Calcium bicarbonat
e
Calcium bicarbona
te
Calcium bicarbonat
e
Calcium bicarbonat
e
Sodium bicarbona
te
Magnesium chloride

A-215
15. Water requirement for different uses
Water Requirement ( Quantity Kl3) S.No Uses
1997-98 2010 2025 2050 (a) Surface Water
1 Irrigation 318 339 366 463
2 2. Domestic 17 24 36 65
3 3. Industries 21 26 47 57
4 4. Power 7 15 26 56
5 5. Inland Navigation 7 10 15
6 Environment 5 100
7 Evaporation losses 36 42 50 76
Total 399 458 635 732
(b) Ground Water
1 Irrigation 206 218 245 344
2 Domestic and Municipal 13 19 26 46
3 Industries 9 11 20 24
4 Power 2 4 7 14
Total 230 252 298 428
Grand Total(a+b) 629 710 933 1160
16. Surface water and ground water potential
S No Description 2001 (TMC)
2010 (TMC)
2025 (TMC)
2050 (TMC)
% of the total in 2050
1 Domestic 2222 2438 2791 3460 6.00 2 Irrigation 49978 49978 49978 49978 86.58 3 Industries 1555 1633 1757 1985 3.44 4 Power 118 138 162 180 0.31 5 Live Stock 519 519 519 519 0.90 6 Aquaculture 2 2 2 2 - 7 Recreation 1 1 1 1 - 8 Navigation - - - - - 9 Minimum
Flows - - 800 1600 2.77
10 Total 54,395 54,709 56,725 57,725 100.00

A-216
17. List of reserve forests in the Tamirabarani
S.No Name of the Dist
Name of the Taluk Name of the District
Area in ha (as per register of
RF) 1 2 3.
Tirunelveli Thoothukudi Tirunelveli
Tirunelveli Palayamkottai Tiruchendur Srivaikuntam Shenkottai
TIRUNELVELI RANGE: Thalaiyuthu R.F Gangaikondan R.F 1. Sivalapperi R.F 2. Melapattam R.F 3. Muthur R.F 1.Kuthiraimozhi R.F 1. Vallanad R.F 2. Kaliyavoor R.F SHENKOTTAI RANGE: 1. Puliyarai R.F 2. Vellakal Teri R.F 3. Vadakarai Kilpidagai 3 (b) 4. Vadakarai Kilpidagai North 5. Vadagarai Kilpidagai 6. Achampudur Grazing BlockI 7. “ Block II 8. Ayikudi Grazing Block Kadayanallur Upper Slopes portion COURTALLAM RANGE: 1. Courtallam Upper slopes 2. Extension No.I & Lower
slopes 3. Extension No.II & Lower
slopes 4. Extension No.III & Lower
slopes 5. Vasudeva Estate 6. Panchanthangi Estate 7. Old Sy.No.1357 of Ilangi 8. Addition to CTM, RF , T.
Parvatham Estate 9. Hope Estate 10. Extn. IV to CTm RF 11. Kadayanallur Upper slopes 12. Chinnakadu R.F
585.11 441.16
87.87
404.86 343.37
5152.31
2054.85
68.45
4106.94 346.84 176.26
28.74 235.87
58.38 88.89 92.34
580.37
2974.43 687.96
93.87 58.20 65.61 29.48 12.76
10.78 74.26
2.52 1459.54
562.46 474.34
66.03 0.36
13.41

A-217
SankaranKovil Tenkasi Ambasamudram
13. Kadayanallur Upper 3 Cz Slopes
14. Alkondal Nethiyuthu, Shermadevi
15. Addition to Chinnakadu 16. Kadayanallur addition 9 bits 17. Krishnapuram Upper slopes 18. Krishnapuram Upper slopes
Extn. 19. “ Addition 20. Kottamalai reserve 21. ‘” addition 22. “ Extension 23. Kavalkattu parambu 24. Mayamankurichi 25. Chokkampatti 26. Vairavankulam 27. Uthumalai 28. Vellakal Parambu SANKARAN KOVIL RANGE: 1. Vasuduvanallur Upper
slopes 2. “ Lower slopes 3. Chinthamani block A+B 4. Narayanapuram 5. Addition to Vasudevanallur 6. Addition to Thirumalapuram 7. Addition to Mealpulaiangudi 8. ,, Melachinthimani 9. ,, Narayanapuram 10. Konamparambu 11. TN. Pudukudy 12. Sivagiri R.F. wise details available with W.W Mudanthurai Sanctuary TOTAL
1480.03 788.83
5.03 357.70
7.80 55.73
150.34 227.60 891.21
1598.21 1284.94
48.00
6495.55 4250.88
130.19 158.08
7.41 0.90 3.58 2.42 2.86
21.28 1157.35 6964.18
59115.00
106643.72

A-218
18. Land use
S No Taluk
Forest
(ha)
Barren un-
cultivable land
(ha)
Land but non -
agriculture
(ha)
Cultivable waste
(ha)
Grazing Land
(ha)
Land under mis-
cellaneous trees
(ha)
Current
fallows
(ha)
Other fallows
(ha)
Net area sown (ha)
Total area (ha)
1 Tirunelveli 1026 1337 12989 11490 3094 591 2189 13439 9924 56079
2 Palayamkottai
836 2193 7762 2861 388 593 806 9931 5056 30426
3 Nanguneri (Part)
22359 6873 14114 19892 2094 666 4588 11723 12044 94353
4 Ambasamudram
59153 3602 13051 13455 1288 1425 2061 5019 19412 118466
5 Tenkasi 6762 833 8285 640 155 155 2472 9350 17735 46327
6 Alangulam 3351 995 2923 2388 256 510 1501 14670 6576 33170
7 V.K. Pudur 38 409 3651 1035 30 510 1666 12183 6559 26081
8 Shenkottai 9045 251 3531 176 157 403 81 688 10997 25329
9 Sankarankoil
1018 15797 1392 106 370 12292
48176
28830 107981
10 Srivaikundam
2520
2023 12420 5289 5235 774 4667 4519 22058 59495
11 Thiruchendur
5554
977 8313 7896 3 - 2864 6055 15946 47608

A-219
VAIPPAR BASIN
1. Reservoirs, Anicuts, Channels, Tanks and Ooranies
System Non system Supply Channel
S.N
o.
Sub Basin A
nicu
ts
No.
Direct chann
el Ayacut in ha
No. Length in km
Tank
Ayacut in ha
Tank
Ayacut in ha. O
oran
ies
1. Nichabanadhi 18 -- 24 39.48 15 1709.81 151 3973.90 71
2. Kalingalar 5 77.41 9 14.00 6 1129.07 25 1244.74 3
3. Deviar 24 -- 27 44.14 26 3454.50 90 4423.53 31
4. Nagariar 15 92.38 11 14.83 16 1672.90 15 370.49 6
5. Sevalperiyar
(Mudangiyar) 6 -- 6 14.27 15 982.78 24 598.52 37
6. Kayalkudiar 9 42.10 8 15.30 8 559.62 34 968.91 24
7. Vallampatti
Odai 1 -- 1 3.80 1 27.04 17 652.23 45
8. Sindapalli
Uppodai -- -- -- -- -- -- 25 842.60 52
9. Arjunanadhi 32 532.15 65 124.24 62 4359.52 173 5564.27 327
10. Kousiganadhi 1 -- 1 4.5 1 122.07 121 3425.01 73
11. Sinkottaiyar -- -- -- -- 4 239.80 36 740.20 94
12. Uppathurar 4 -- 4 4.79 -- -- 37 2105.82 76
13. Vaippar **
3 -- 3 14.65 5 699.42 54 2741.17 377
Total
11
7 744.04 159 294.00 159
14956.5
3 802
27651.3
9 1216
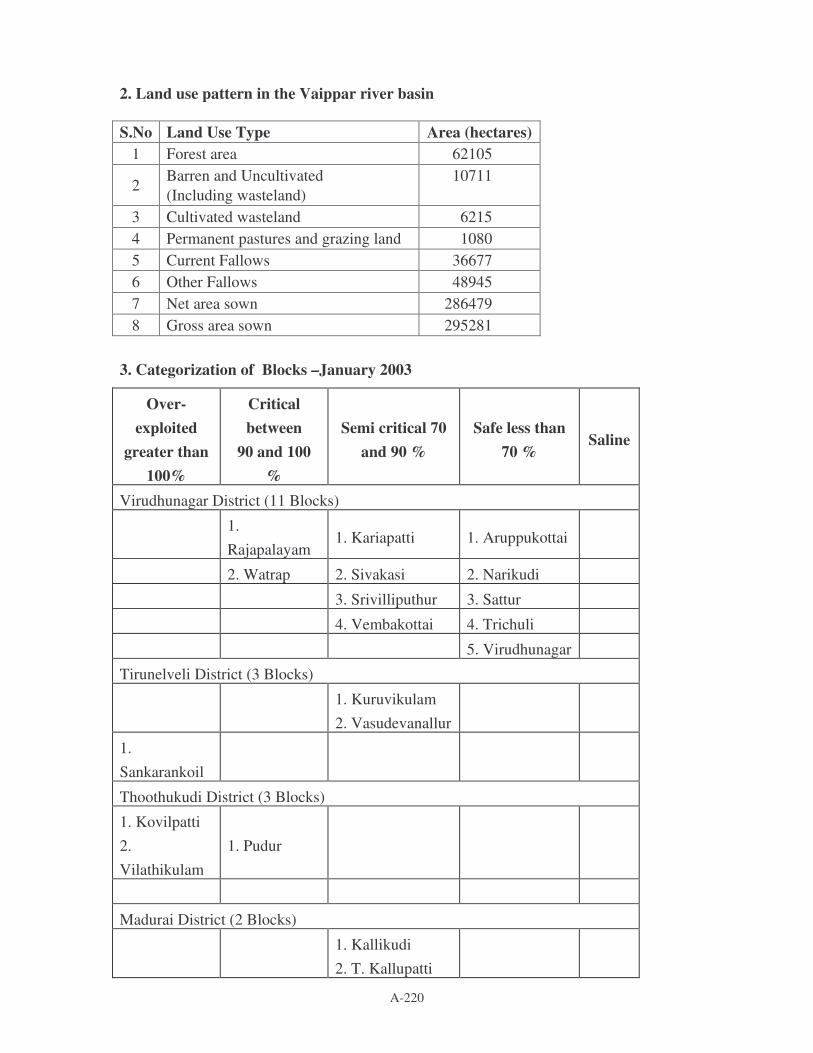
A-220
2. Land use pattern in the Vaippar river basin S.No Land Use Type Area (hectares)
1 Forest area 62105
2 Barren and Uncultivated (Including wasteland)
10711
3 Cultivated wasteland 6215 4 Permanent pastures and grazing land 1080 5 Current Fallows 36677 6 Other Fallows 48945 7 Net area sown 286479 8 Gross area sown 295281
3. Categorization of Blocks –January 2003
Over-exploited
greater than 100%
Critical between
90 and 100 %
Semi critical 70 and 90 %
Safe less than 70 %
Saline
Virudhunagar District (11 Blocks)
1. Rajapalayam
1. Kariapatti 1. Aruppukottai
2. Watrap 2. Sivakasi 2. Narikudi
3. Srivilliputhur 3. Sattur
4. Vembakottai 4. Trichuli
5. Virudhunagar
Tirunelveli District (3 Blocks)
1. Kuruvikulam 2. Vasudevanallur
1. Sankarankoil
Thoothukudi District (3 Blocks)
1. Kovilpatti 2. Vilathikulam
1. Pudur
Madurai District (2 Blocks)
1. Kallikudi 2. T. Kallupatti

A-221
4. Ground Water Development - January 2003
S. No. Category Total Number 1 Over exploited 138
2 Critical blocks 37
3 Semi critical blocks 105
4 Safe blocks 97
5 Saline blocks 8
Total 385
5. Total Water Requirement S. No Purpose 1999 2004 2019 2044
1. Agriculture 1457.51 1457.51 1373.49 1261.65
2. Domestic 55.01 66.02 98 152.01
3. Industrial 30.93 41.24 72.17 123.72
4. Live Stocks 13.76 13.76 13.76 13.76
5. Power - - - -
TOTAL 1557.21 1578.53 1557.42 1551.14
Water Balance 225.79 204.47 225.58 231.86
6. Cropping pattern S.No. Crop Season
1.
Paddy
Pishanam (September-October)
2. Paddy Samba (August)
3. Paddy Kar (May-June)
4.
Cotton
Irrigated (February-March).
5.
Cotton
Un-irrigated (September-October)
6.
Sugarcane
Mid Season (February-March)
7.
Groundnut
Un-irrigated (July-August)

A-222
8.
Pulses
Un-irrigated (October-November)
9.
Cumbu
Un-irrigated (September-October)
10.
Cholam
Un-irrigated (September-October)
11. Chillies Irrigated (February-August)
7. Cropping pattern
Cropping pattern S. No. Name of Taluk
Under irrigated condition Under rainfed
condition
I. Tirunelveli District
1. Sankarankovil (part) Paddy, Banana, Sugarcane, Chillies, Cotton, Vegetables
Millets, Pulses, Cotton, Sunflower
2. Sivagiri Paddy, Banana, chillies, Onion, Sugarcane, Vegetables
Cotton, Millets, Pulses,
II Virudhunagar District
1. Rajapalayam Paddy, Banana, Chillies Millets, Pulses, Cotton
2. Srivilliputhur Paddy, Sugarcane, Chillies, Banana
Pulses, Millets, groundnuts, Gingelly
3. Virudhunagar Paddy, Chillies, Cotton Millets, Pulses, Cotton
4. Sattur Paddy, Groundnut, Millets, Pulses, Chillies, Cotton
Cholam, Millets, Cotton, Coriander.
5. Aruppukottai (part) Paddy, Chillies, Groundnut, Cotton
Millets, Pulses, Groundnut, Cotton.
III. Thoothukudi District
1. Kovilpatti, Ettayapuram, Vilathikulam (part)
Paddy Cotton, Pulses, Millets
IV. Madurai District
1. Peraiyur (part) Sugarcane, (lesser extent) Cotton, Pulses,
Cholam
2. Tirumangalam Paddy, Cotton Cotton, Pulses,
Groundnut, Cholam

A-223
8. Water quality analysis
S.No
Parameter Vnr BW
CP u/s v17
V17 V15 VRP
Kondaneri Tank
VRP Periadhi
Tank 1. PH 7.4 7.1 7.0 7.0 7.2 6.7
2. Ec.umho/cm 3000 700 400 250 1200 1700
3. TDS, mg/l 1823 386 221 141 727 1015
4. TSS, mg/l 4.5 3.5 2.5 2 4.5 5
5. NH3, mg/l 0 0 0 0 0 0
6. NO3+NO2, as N mg/l
16 3 1 0 12 15
7. Total P, mg/l 0 1.06 0.64 0.84 0.73 2.3
8. BOD, mg/l 3.0 3.2 1.8 0.8 1.2 1.4
9. COD, mg/l 11 26 11 3 28 20
10 Phen, mg CaCo3/l 0 0 0 0 0 0
11 Total, mg CaCo3/l 630 205 145 105 315 400
12 Total, mg CaCo3/l 580 190 135 100 300 450
13 Ca mg CaCo3/l 160 75 50 50 125 200
14 Ca mg/l 64 30 20 20 50 80
15 Mg, mg/l 102 28 21 12 42 61
16 Na, mg/l 460 67 23 14 92 161
17 K, mg/l 5 20 14 7 90 68
18 Cl, mg/l 525 78 32 11 184 266
19 So42, mg/l 211 23 17 12 24 67
20 Co32, mg/l 0 0 0 0 0 0
21 HCO3, mg/l 769 250 177 128 384 488
22 Si,mg/l 85.4 4.6 23.5 13.9 25.7 66
23 F, mg/l 1.00 0.88 0.49 0.48 0.51 0.52
24 B, mg/l 0.47 0.11 0.13 0.02 0.12 0.14
25 Total MPN/100 ml 2800 900 800 2800 2800 800
26 Faecal, MPN/100ml 1100 500 260 2800 1100 260
27 SAR 11.7 2.98 1.22 0.85 3.27 4.67

A-224
9. Major and medium industries 76 No. Cement industries 3 nos. Sugar industry 1 no. Textiles / spinning 24 nos. Chemical and chemical products Including match industries 5 nos. Metal and metal powder industries 6 nos. Printing industries 31 nos. Rubber industry 1 no. Other industries manufacturing, Electronics, etc. 5 nos. Small Scale Industires 9486 Nos. 1. Food products 702 2. Tobacco products 47 3. Cotton Textile products 441 4. Wool, Silk, Fibre products 88 5. Jute, Henfo, Mesta textiles 5 6. Textile products 260 7. Wood products 822 8. Paper products 1143 9. Leather products 26 10. Petroleum, Rubber products 365 11. Chemical products 3966 12. Non metal, mineral products 191 13. Basin metal Alloys products 24 14. Metal products 458 15.Machine tool products 251 16. Electrical machinery products 173 17. Transport Equipment products 218 18. Other products 306
10. Weeds
S. No. Location Taluk Plant identified 1. Kondaneri tank Rajapalayam Water hyacinth
2. Periyathikulam tank Rajapalayam Water hyacinth
3. Valaikulam Srivilliputhur Ipomea carnea
4. Vasudeva nallur Periyakulam tank- left flank surplus course of Kalingalar river, a tributary of Nichabanadhi
Sivagiri taluk Vasudevanallur block
Ipomea carnea (Veli Kathan)
5. Melapannandhikulam tank fed by Rasingaperikal of Ullar river
“ “
6. South of Panaiyur village in Sankaran koil “

A-225
Nichabanadhi river taluk
7. South of Ammankulam village “ “
8. South of Thamarai anicut at Pandyan Nagar hamlet.
“ “
9. Chinthalakarai, Meenakshipuram Karuppur, Thalaikattupuram and Vilathikulam
Vilathikulam taluk
Water hyacinth, Water lilly and Ipomea carnea
11. Soil Alkalinity, Salinity and Acidity
Sl.No. Types of soil Taluks Covered Area in Hectare
1.
Alkaline
Rajapalayam & Srivilliputtur Sattur & Virudhunagar Aruppukkottai & Tiruchuli Kovilpatti Vilathikulam
610 1119 678 1270 440
Total 4117
2.
Saline
Rajapalayam & Srivilliputtur Sattur & Virudhunagar Aruppukkottai & Tiruchuli Kovilpatti Vilathikulam
1827 1224 155 1600 440
Total 5246
3. Acidi Rajapalayam & Srivilliputtur 290
12. Soil erosion S.No TALUK Water shed Name Extent Villages Covered
Solaiseri
High
Mettupatti, Solaiseri, Sundarajapuram.
Sundarajapuram High Sundarajapuram, Solaiseri
1.
Rajapalayam
Mettupatti High Mettupatti, reserve forest
2.
Srivilliputtur
Khansapuram
Very High
Khansapuram

A-226
S. Kodikulam Very High S. Kodikulam
Gangarkottai High Gangarkottai, Panduvarpatti
O. Reddiapatti
High
O. Reddiapatti, Muthandipuram, Elayirampannai Gangarakottai
Panayadipatti - I
High
Panayadipatti, Achankulam, Servaikkaranpatty, Elayirampannai, Gangarakottai.
3. Sattur
Panayadipatti - II
Very High Panayadipatti, Vijayakarisalkulam, Thayilpatti, Ehirkottai, Kangarseval, Vembakottai.
13. Population
Population Districts Region
Persons Male Female
Madurai Total 2562279 1295124 1267155
Rural 1129028 569988 559040
Urban 1433251 725136 708115
Virudhunagar Total 1751548 870820 880728
Rural 974186 482821 491365
Urban 777362 387999 389363
Tirunelveli Total 2801194 1372082 1429112
Rural 1499062 729830 769232
Urban 1302132 642252 659880
Thoothukudi Total 1565743 764087 801656
Rural 903811 437599 466212
Urban 661932 326488 335444

A-227
14. Literacy level
Literate Districts
Persons Male Female
Madurai 1795751 1003506 792245
Virudhunagar 1152516 650601 501915
Tirunelveli 1917238 1041964 875274
Thoothukudi 1140959 598669 542290

A-228
Population details of Tamil Nadu
District wise population of Tamil Nadu
Population
Total Rural Urban State/District Area (Sq. km) Total Male Female Total Male Female Total Male Female
Tamil Nadu 130058 62405679 31400909 31004770 34921681 17531494 17390187 27483998 13869415 13614583
Chennai 174 4343645 2219539 2124106 ---------- Not Arise ---------- 4343645 2219539 2124106
Kancheepuram 4433 2877468 1457242 1420226 1342502 676095 666407 1534966 781147 753919
Thiruvallur 3424 2754756 1397407 1357349 1244674 629052 625622 1500082 768355 731727
Cuddalore 3678 2285395 1150908 1134487 1531034 771786 759248 754361 379122 375239
Villupuram 7217 2960373 1492442 1467931 2533456 1277415 1256041 426917 215027 211890
Vellore 6077 3477317 1741083 1736234 2169319 1088090 1081229 1307998 652993 655005
Thiruvannamalai 6191 2186125 1095859 1090266 1785364 895738 889626 400761 200121 200640
Salem 5220 3016346 1563633 1452713 1626162 852453 773709 1390184 711180 679004
Namakkal 3429 1493462 759551 733911 948230 482365 465865 545232 277186 268046
Dharmapuri 9622 2856300 1473597 1382703 2400354 1240122 1160232 455946 233475 222471
Erode 8209 2581500 1309278 1272222 1387537 705436 682101 1193963 603842 590121
Coimbatore 7469 4271856 2176031 2095825 1451653 734699 716954 2820203 1441332 1378871

A-229
The Nilgiris 2549 762141 378351 383790 307532 151874 155658 454609 226477 228132
Tiruchirappalli 2418366 1208534 1209832 1279204 638617 640587 1139162 569917 569245
Karur 935686 465538 470148 624430 310922 313508 311256 154616 156640
Perambalur 493646 24614 247505 414426 206807 207619 79220 39334 39886
Ariyalur
11096
695524 346763 348761 616539 307670 308869 78985 39093 39892
Thanjavur 3397 2216138 1096638 1119500 1467577 726493 741084 748561 370145 378416
Nagapattinam 2716 1488839 739074 749765 1158557 576010 582547 330282 163064 167218
Thiruvarur 2161 1169474 580784 588690 932231 463502 468729 237243 117282 119961
Pudukottai 4651 1459601 724300 735301 1211217 600511 610706 248384 123789 124595
Madurai 6565 2578201 1303363 1274838 1134025 573036 560989 1444176 730327 713849
Theni 1093950 552986 540960 502109 255152 246957 591841 297834 294007
Dindigul 6058 1923014 968137 954877 1249762 629073 620689 673252 339064 334188
Ramanathapuram 4232 1187604 583376 604228 885210 433290 451920 302394 150086 152308
Virudhunagar 4288 1751301 870376 880925 973956 482626 491330 777345 387750 389595
Sivagangai 4086 1155356 566947 588409 829272 405093 427179 326084 161854 164230
Tirunelveli 6810 2723988 1333939 1390049 1415742 388797 726945 1308246 645142 663104
Thoothukudi 4621 1572273 766823 805450 907500 439254 468246 664773 327569 337204
Kanyakumari 1685 1676034 832269 843765 582107 289516 292591 1093927 542753 551174
Source: Statistical Handbook of Tamil Nadu 2005

A-230
District wise literates in Tamil Nadu
Literates
Total Rural Urban State/District
Total Male Female Total Male Female Total Male Female
Tamil Nadu 40524545 22809662 17714883 20319498 11835689 8483809 20205047 10973973 9231074
Chennai 3336695 1799981 1536714 ---------- Not Arise ---------- 3336695 1799981 1536714
Kancheepuram 1952198 1088943 863255 791700 457846 333854 1160498 631097 529401
Thiruvallur 1865707 1047763 817944 736374 427393 308981 1129333 620370 508963
Cuddalore 1420488 820726 599762 872343 521901 350442 548145 298825 249320
Villupuram 1650528 977374 673154 1347727 809944 537783 302801 167430 135371
Vellore 2203552 1245076 958476 1276373 741671 534702 927179 503405 423774
Thiruvannamalai 1297151 761403 535748 1014930 605600 409330 282221 155803 126418
Salem 1734442 1021772 712670 819312 506149 313163 915130 515623 399507
Namakkal 903802 526412 377390 538212 320242 217970 365590 206170 159420
Dharmapuri 1516221 906943 609278 1204910 733162 471748 311311 173781 137530
Erode 1521955 887907 634048 726792 440042 286750 795163 447865 347298
Coimbatore 2945278 1648814 1296464 847250 493911 353339 2098028 1154903 943125
The Nilgiris 541099 296573 244526 202668 113834 88834 338431 182739 155692

A-231
Tiruchirappalli 1673478 926354 747124 787843 455246 332597 885635 471108 414527
Karur 566728 328103 238625 345850 206907 138943 220878 121196 99682
Perambalur 286197 167406 118791 230818 137385 93433 55379 30021 25358
Ariyalur 388605 232385 156220 334760 202879 131881 53845 29506 24339
Thanjavur 1476256 814354 661902 912445 515621 396824 563811 298733 265078
Nagapattinam 996580 548142 448438 751618 418324 333294 244962 129818 115144
Thiruvarur 788302 435421 352881 608297 340202 268095 180005 95219 84786
Pudukottai 907376 520281 387095 719477 419697 299780 187899 100584 87315
Madurai 1776654 991010 785644 673502 397156 576346 1103152 593854 509298
Theni 692797 398150 294647 2932508 174522 118686 399589 223628 175961
Dindigul 1181746 681698 500048 710461 421948 288513 710461 421948 288513
Ramanathapuram 757344 421041 336303 534155 302194 231961 223189 118847 104342
Virudhunagar 1136574 641062 495512 586525 339594 246931 550049 301468 248581
Sivagangai 738000 414755 323245 491768 283769 207999 246232 130986 115246
Tirunelveli 1829064 997278 831786 891282 490721 400561 937782 506557 431225
Thoothukudi 1131406 593868 537538 622745 329518 293227 508661 264350 244311
Kanyakumari 1308322 668667 639655 446153 228311 217842 862169 440356 421813
Source: Statistical Handbook of Tamil Nadu 2005

A-232
District wise Scheduled Castes population
Scheduled Castes
Total Rural Urban State/District
Total Male Female Total Male Female Total Male Female
Tamil Nadu 11857504 5932925 5924579 8308890 4159182 4149708 3548614 1773743 1774871
Chennai 598110 301835 296275 ---------- Not Arise ---------- 598110 301835 296275
Kancheepuram 721989 362097 359892 496932 249258 247674 225057 112839 112218
Thiruvallur 600658 301316 299542 400496 200050 200446 200362 101266 99096
Cuddalore 634479 318713 315766 514729 359264 255465 119750 59449 60301
Villupuram 810931 408234 402697 740441 373085 367356 70490 35149 35341
Vellore 714054 354551 359503 505677 251749 253928 208377 102802 105575
Thiruvannamalai 467532 233572 233960 412993 206740 206253 54539 26832 27707
Salem 475738 244391 231347 288559 149374 139185 187179 95017 92162
Namakkal 280776 143014 137762 212849 108271 104578 67927 34743 33184
Dharmapuri 416951 212136 204815 363285 185061 178224 53666 27075 26591
Erode 422204 213312 208892 273677 138667 135010 148527 74645 73882
Coimbatore 630675 315869 314806 310714 156044 154670 319961 159825 160136
The Nilgiris 238014 117792 120222 85485 42423 43062 152529 75369 77160
Tiruchirappalli 399493 197917 201576 261417 129181 132236 138076 68736 69340
Karur 190260 94194 96066 144327 71518 72809 459933 22676 23257
Perambalur 149145 73866 75279 128590 63753 34837 20555 10113 10442
Ariyalur 151220 75326 75894 140236 69792 70444 10984 5534 5450
Thanjavur 399653 198820 200833 332385 165344 167041 67268 33476 33792
Nagapattinam 441231 219933 221298 399441 199346 200095 41790 20587 21203
Thiruvarur 378314 188682 189632 342530 171053 171477 35784 17629 18155
Pudukottai 249471 123701 125770 221161 109583 111578 28310 14118 14192
Madurai 323252 162595 160657 223475 112697 110778 99777 49898 49879
Theni 211800 107109 104691 116509 59274 57235 95291 47835 47456
Dindigul 376170 189066 187104 269809 135694 134115 106361 53372 52989
Ramanathapuram 216312 107381 108931 186059 92158 93901 30253 15223 15030

A-233
Virudhunagar 332297 164930 167367 239324 118805 120519 92973 46125 46848
Sivagangai 188857 92590 96267 159256 77886 81370 29601 14704 14897
Tirunelveli 481052 233605 247447 294885 142786 152099 186167 90819 95348
Thoothukudi 288954 143013 145941 216801 107116 109685 72153 35897 36256
Kanyakumari 67712 33365 34347 26848 13210 13638 40864 20155 20709
District wise Scheduled Tribes population
Scheduled Tribes
Total Rural Urban State/District
Total Male Female Total Male Female Total Male Female
Tamil Nadu 651321 328917 322404 551143 278746 272397 100178 50171 50007
Chennai 6728 3368 3360 ---------- Not Arise ---------- 6728 3368 3360
Kancheepuram 26508 13267 13241 18062 9066 8996 8446 4201 4245
Thiruvallur 37858 18880 18978 28885 14466 14419 8973 4414 4559
Cuddalore 11773 5920 5853 7241 3641 3600 4532 2279 2253
Villupuram 63920 32294 31626 61687 31149 30538 2233 1145 1088
Vellore 63040 31860 31180 58237 29455 28782 4803 2405 2398
Thiruvannamalai 72760 36928 35832 69198 35129 34069 3562 1799 1763
Salem 103921 52693 51228 98722 49988 48734 5199 2705 2494
Namakkal 51416 26039 25377 50454 25552 24902 962 487 475
Dharmapuri 59549 30520 29029 57763 29592 28171 1786 928 858
Erode 17693 8933 8760 15120 7573 7547 2573 1360 1213
Coimbatore 29103 14738 14365 19559 9880 9679 9544 4858 4686
The Nilgiris 28373 14017 14359 19600 9753 9847 8773 4261 4512
Tiruchirappalli 18912 9596 9316 14383 7324 7059 4529 2272 2257
Karur 1450 711 739 1075 533 542 375 178 197
Perambalur 3307 1708 1599 2768 1423 1345 539 285 254
Ariyalur 8529 4228 4301 7907 3926 3981 622 302 320
Thanjavur 3641 1773 1868 1302 649 653 2339 1124 1215
Nagapattinam 3420 1734 1686 1618 824 794 1802 910 892
Thiruvarur 2673 1310 1363 971 493 478 1702 817 855
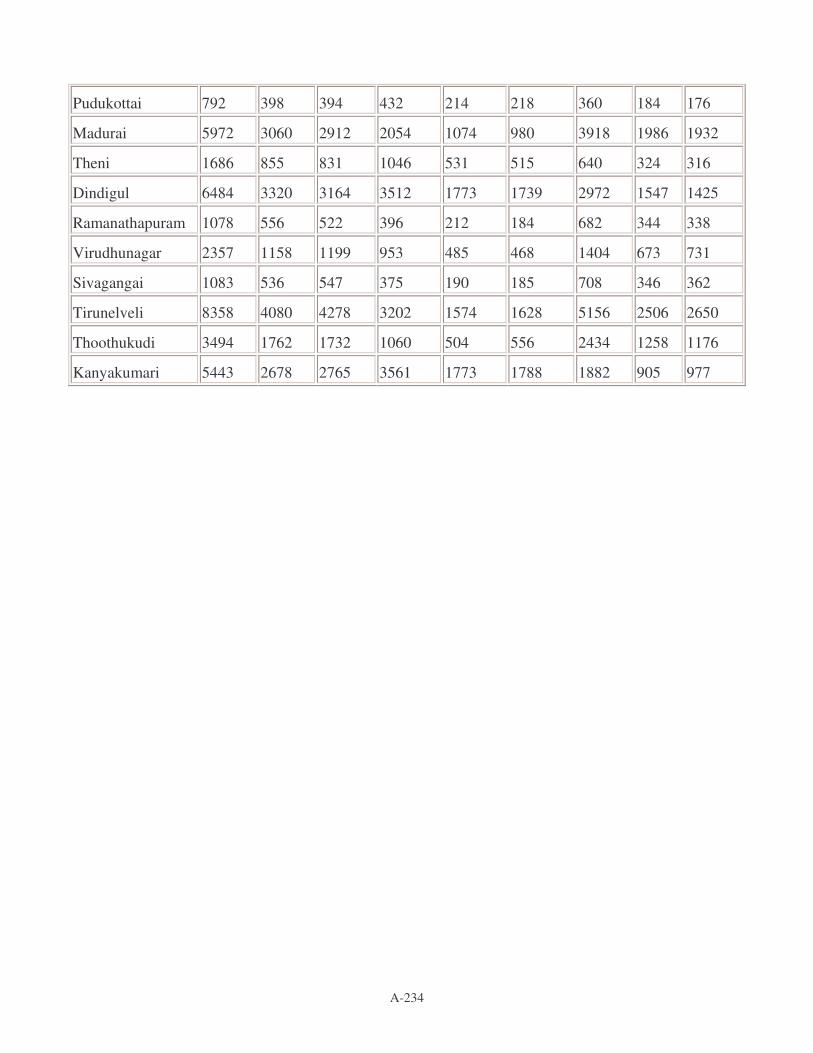
A-234
Pudukottai 792 398 394 432 214 218 360 184 176
Madurai 5972 3060 2912 2054 1074 980 3918 1986 1932
Theni 1686 855 831 1046 531 515 640 324 316
Dindigul 6484 3320 3164 3512 1773 1739 2972 1547 1425
Ramanathapuram 1078 556 522 396 212 184 682 344 338
Virudhunagar 2357 1158 1199 953 485 468 1404 673 731
Sivagangai 1083 536 547 375 190 185 708 346 362
Tirunelveli 8358 4080 4278 3202 1574 1628 5156 2506 2650
Thoothukudi 3494 1762 1732 1060 504 556 2434 1258 1176
Kanyakumari 5443 2678 2765 3561 1773 1788 1882 905 977

A-235
SUB BASIN MAPS
Agniyar Sub Basin (Drainage Map)
Arjunanadhi Sub Basin (Drainage Map)

A-236
Cheyyar Sub Basin (Drainage Map)
Chittar Sub Basin (Drainage Map)

A-237
Kiliyar Sub Basin (Drainage Map)
Kosathaliyar Sub Basin (Drainage Map)

A-238
Kottakaraiyar Sub Basin (Drainage Map)
Lower Tamiraparani Sub Basin (Drainage Map)

A-239
Manimukthanadhi Sub Basin (Drainage Map)
Nambiyar Sub Basin (Drainage Map)

A-240
Palar Sub Basin (Drainage Map)
Pambar Sub Basin (Drainage Map)
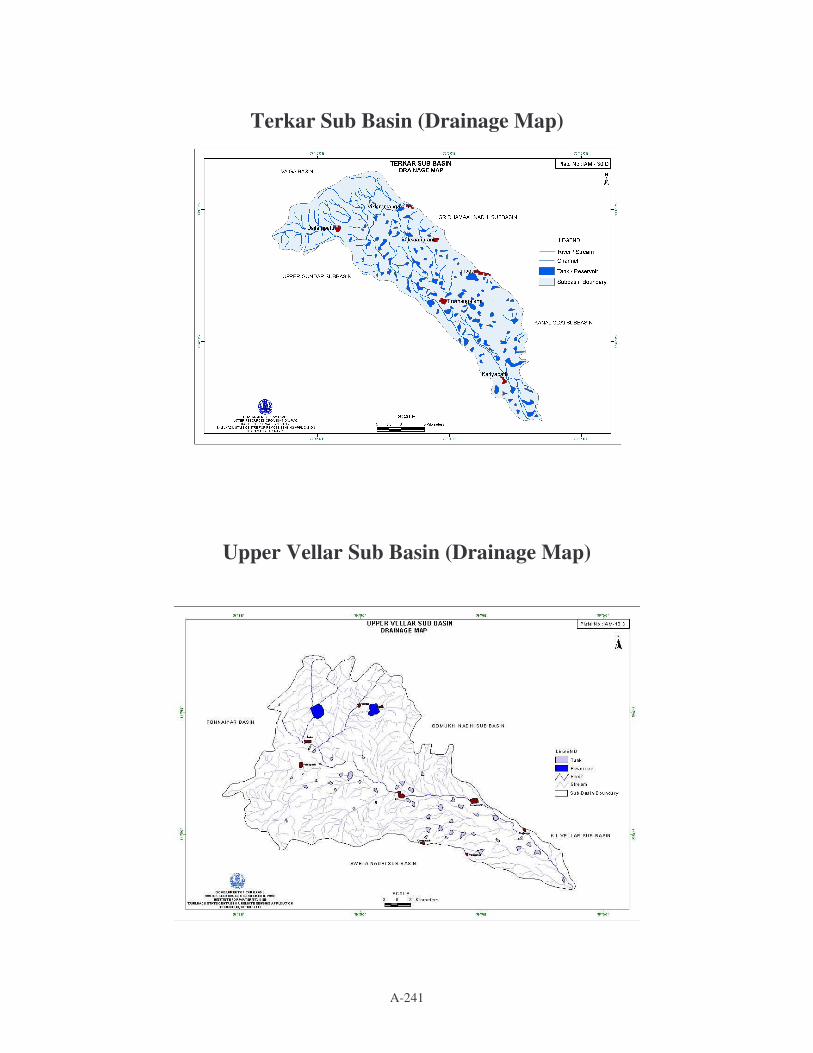
A-241
Terkar Sub Basin (Drainage Map)
Upper Vellar Sub Basin (Drainage Map)

A-242
ANNEXURE II STAKEHOLDER CONSULTATIVE WORKSHOPS AT RIVER
BASINS OF TAMIL NADU

A-243

A-244

A-245
ANNEXURE III DAM SAFETY
Introduction
In pursuance of the resolution of the first conference of State Ministers of Irrigation held at New Delhi during July 17-18. 1975, Dam Safety Organization was established in the Central Water Commission in June 1979 to assist the State Governments to identify causes affecting safety of dams and allied structures and to render advise in providing suitable remedial measures. After carrying out detailed studies the organization has issued guidelines for Safety Inspection of dams.
Rationale For Dam Safety Plan
Dams are major structures storing large quantities of water and any out right failure may cause serious damage to Jives and property on the downstream. Even a partial failure may gradually lead to destruction and loss of effectiveness of the structure to hold water and provide benefits for which it was built. It is therefore, essential that the Dams are designed and constructed with meticulous care and maintained as stipulated in the O & M Manuals. In spite of this, it is possible that they develop conditions of distress or failure due to factors such as excess flow and deformations and failures due to improper evaluation and consequent design of foundations or unprecedented seismic conditions. To meet the normal day-to-day operational conditions and to account for unexpected conditions of water flow, the geology and seismicity, institutional capacity, work procedure and plan are essential.
Tamil Nadu Dam Safety Directorate
Dam safety Directorate in Tamil Nadu was established in 1991 to carry out regular monitoring works of all large dams for both PWD & TNEB as per the guidelines of the CWC.
Dam Safety Assurance & Rehabilitation Project (Dam Safety Project – 1) funded by the World Bank was carried out during the years 1991-98. Some of the important works carried out by the Sam Safety Directorate are as :
1. Preparation of Health Status Report of PWD & EB dams for 106 nos. for 4 monsoon periods in a year viz Pre Monsoon, Monsoon-I, Monsoon-II and Post Monsoon periods and sending them to Government and all the Regional Chief Engineers of PWD & TNEB for carrying out remedial works to the deficiencies pointed out therein and follow up action
2. Carrying out Phase-I inspection of all dams in a cycle of five years, by a Dam Safety Panel of five members headed by the Director, Dam Safety Directorate. Atleast 25 dams are to be covered in a year and inspection reports are to be prepared for taking follow up action on them.

A-246
3. Carrying Phase-II detailed investigation by an independent panel of experts for the required distressed dams.
4. Form the Health Status Reports of the four monsoon periods, Annual Consolidated Health Status Report is prepared and sent to Central Water Commission every year.
Now the Dam Safety and Improvement Project (DRIP) is likely to be approved by the World Bank in March 2006. Tamil Nadu is also included in the project. The total project cost is USD 400 million and the project period is six years. The implementation of the project is to be monitored by Dam Safety Directorate.
Dam Rehabilitation & Improvement Project (DRIP)
The following works are proposed under this project which is to be implemented with the World Bank assistance.
1. Adopting modern design tools in the dam safety works. 2. Carrying out dam safety status inventory & updating on a GIS platform. 3. Conducting Dam Brake analysis, Emergency Action Plan & preparation of
inundation maps for few selected dams. 4. Organizing training in dam safety. 5. Arranging and accompanying with the Dam Safety Expert Committee inspection
and interacting with them. Arranging collection of field particulars called for by them, follow up action on their inspection reports etc are to be carried out by the Dam Safety Directorate.
6. Getting approval of the World Bank for the bids in time. 7. The project shall be carried out as per Central Water Commission guidelines and
their vetting are to be obtained them and there. 8. Consultancies are to be field for hydrology and review of for dams if not already
done. 9. Prompt monitoring of execution of works by the Regional Chief Engineers are to
be done by Dam Safety Directorate. 10. Any other dam safety works which will be taken in the course of the project. The following project proposals are included under the project. Project proposals under the Dam Rehabilitation and Improvement Project (DRIP)
Component – I: Institutional Strengthening Sl.No. Description Estimated Cost
Rs. in Million 1. Strengthening the Dam Safety Directorate with total staff strength of
34 nos. (staff salary for the project period of six years) 26.60
2. Organising Training on Dam Safety to the WRO personnel both National and International.
6.40
3. Cost of Dam Safety Expert Committee (National Expert Team) visits for the project.
11.00
Total 44.00

A-247
Component – II : Revised proposals for Dam Rehabilitation and Improvement Sl.No. Name of Dam and works proposed Amount
Rs. in Million Identified
rank 1. Pechiparai Dam
Providing upstream face treatment 90.00 1
2. Manimuthar Dam Providing upstream face treatment
81.70 2
3. Perunchani Dam i. Providing additional spillway. ii. Gates & hoists for additional spillway iii. Providing backing concrete.
200.00 3
4. Ponnaiar Dam Providing fuse plug
35.00 4
5. Manimukthanadhi Dam i. Standardization of earthern bund ii. Rehabilitation of stilling basin iii. Providing surplus regultor
39.00 5
6. Siddhamalli Dam Providing breaching section
25.00 6
7. Amaravathy Dam Rehabilitation of Amaravathy Dam with the following works: i. Special repairs to the Right side apron and revetments of
Amaravathy River bridge below Amaravathy Dam. ii. Special repairs to the left side ghat road and Dam top road
left flank of earth dam of Amaravathy Dam. iii. Special repairs to the right side ghat road and Dam top road
right flank of earth dam of Amaravathy Dam iv. Special repairs to approach road from (D/S side of Dam)
entrance gate to AMC culvert @ Amaravathy Nagar. v. Special repairs to approach road from AMC culvert (D/S side
of Dam) to Kallapuram Regulator at Amaravathy Nagar. vi. Construction of additional Generator room @ Amaravathy
Dam. vii. Providing lightening arrester and lighting arrangement in the
earth dam portion of Amaravathy Dam. viii. Providing Additional 70 KVA Generator set in Amaravathy
Dam. ix. Replacement of rubber seals in spillway, River sluice and
canal sluice etc. in Amaravathy Dam. x. Rehabilitation of Earth Dam of Amaravathy Dam (raising the
right flank bund, filling the cracks, reconstructing parapet wall, and forming black topped road etc.)
7.00 7
8. Vaigai Dam Rehabilitation and strengthening measures to masonry dam, earth dam pick up anicut and link canal
60.00 8
9. Parambikulam Dam Rehabilitation of Parambikulam Dam and earth saddle dam at Parambikulam in Palghat District
10.65 9
10. Aliyar Dam Rehabilitation and moderisation of Aliyar Dam and its appurtenant structures under PAP system.
13.625 10
11. Kodaganar Dam Rehabilitation of shutters of old regulator and stilling basin and leading channel of right and left main canal.
13.95 11
12. Karuppanadhi Dam 4.50 12

A-248
Rehabilitation to embankment, river sluice gate and parapet wall.
13. Gundar Dam Rehabilitation to embankment and access road
1.00 13
14. Gomukhi Dam Rehabilitation to stilling basin and providing flood bank
4.00 14
15. Thirumoorthy Dam Rehabilitation of earth dams
20.60 15
16. Kudhiraiyar Dam Rehabilitation of Kudhiraiyar Dam
11.00 16
17. Lower Nirar Dam and Upper Nirar Weir Rehabilitation of Lower Dam and Upper Nirar weir with the following works: Lower Nirar Dam i. Reaming of drainage shafts and uplift pressure holes. ii. Rehabilitation of spillway oghee portion, tunnel entry
revetment and downstream revetment iii. Rehabilitation of ghat road leading from lower Niar Dam to
Cinchona I.B. and road lead to left flank of lower Nirar Dam. Upper Nirar Dam i. Rehabilitation of oghee spillway portion entry revetment and
cone rap revetment at upper Nirar Weir. ii. Rehabilitation of revetment to the right flank of leading
channel to upper Nirar tunnel from 74 M to 110 M downstream left flank and right flank side revetment at Upper Nirar Weir.
6.80 17
18. Noyyal-Athupalayam Reservoir Rehabilitation of Noyyal-Athupalayam Reservoir
6.74 18
19. Thunnakkadavu & Peruvari Pallam Rehanilitation of Thunnakkadavu and Peruvari Pallam Dams with the following works. i. Special repairs to spillway pointing and construction of a
gauge weir at Thunnacadavu Dam. ii. Special repairs to roads of Thunacadavu Dam.
10.30 19
iii. Special repairs to Chutes and revetment of Thunacadavu Dam. iv. Construction of masonry retaining wall above rock level from
LS 1220 m to 3673 m (‘4000 to 12050’) of leading channel from Thunacadavu Reservoir to SPT entry.
v. Desilting the leading channel from Thunnacavadu Reservoir to SPT entry.
vi. Providing power supply arrangements @ 4000’ of leading channel from Thunacadavu Reservoir to Sarkarpathy Tunnel Entry.
vii. Supply of 12.5 KVA generator stand by to Thunacadavu Dam. viii. Special repairs to chutes, revetment and top drain of
Peruvaripallam Dam. ix. Special repairs to roads of Peruvaripallam Dam.
20. Ramanadhi Dam Rehabilitation to access road, revetment, sluice shutter and parapet wall
13.00 20
21. Gatana Dam Rehabilitation to access road, revetment and parapet wall
5.00 21
22. Polar Porundalar Dam 5.70 22
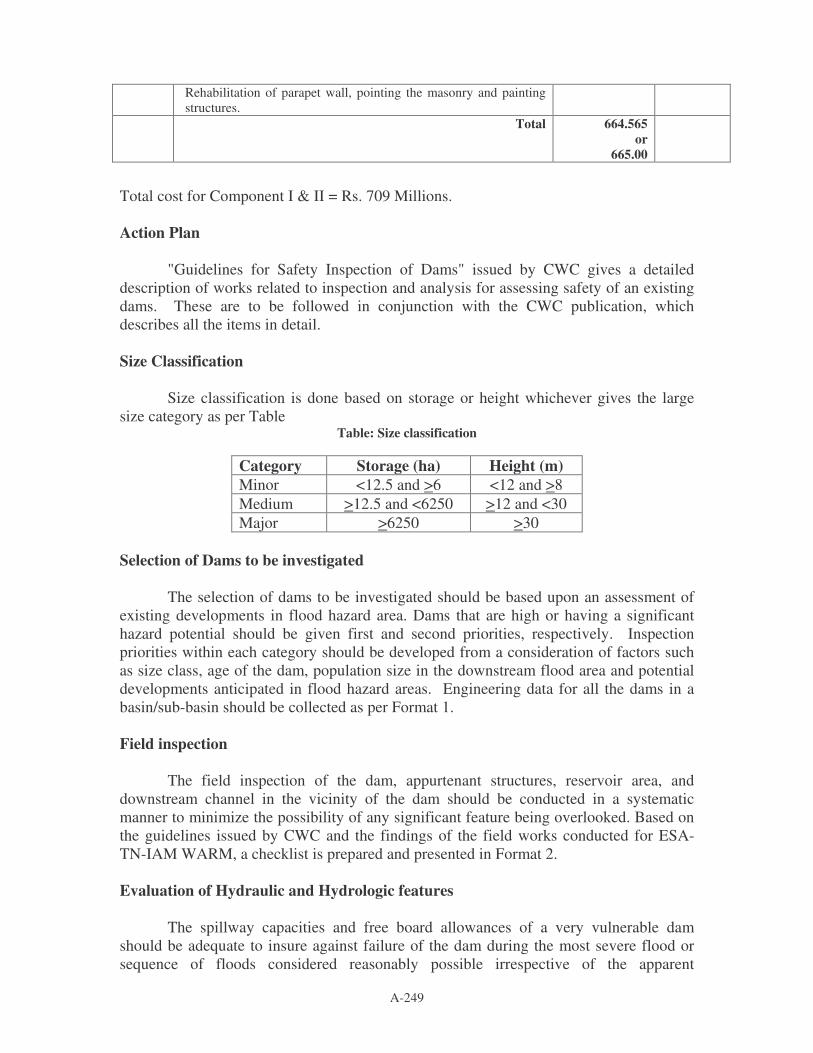
A-249
Rehabilitation of parapet wall, pointing the masonry and painting structures.
Total 664.565 or
665.00
Total cost for Component I & II = Rs. 709 Millions. Action Plan
"Guidelines for Safety Inspection of Dams" issued by CWC gives a detailed
description of works related to inspection and analysis for assessing safety of an existing dams. These are to be followed in conjunction with the CWC publication, which describes all the items in detail. Size Classification
Size classification is done based on storage or height whichever gives the large
size category as per Table Table: Size classification
Category Storage (ha) Height (m) Minor <12.5 and >6 <12 and >8 Medium >12.5 and <6250 >12 and <30 Major >6250 >30
Selection of Dams to be investigated
The selection of dams to be investigated should be based upon an assessment of existing developments in flood hazard area. Dams that are high or having a significant hazard potential should be given first and second priorities, respectively. Inspection priorities within each category should be developed from a consideration of factors such as size class, age of the dam, population size in the downstream flood area and potential developments anticipated in flood hazard areas. Engineering data for all the dams in a basin/sub-basin should be collected as per Format 1. Field inspection
The field inspection of the dam, appurtenant structures, reservoir area, and downstream channel in the vicinity of the dam should be conducted in a systematic manner to minimize the possibility of any significant feature being overlooked. Based on the guidelines issued by CWC and the findings of the field works conducted for ESA-TN-IAM WARM, a checklist is prepared and presented in Format 2. Evaluation of Hydraulic and Hydrologic features
The spillway capacities and free board allowances of a very vulnerable dam should be adequate to insure against failure of the dam during the most severe flood or sequence of floods considered reasonably possible irrespective of the apparent

A-250
infrequency of occurrence of controlling conditions Evaluation of Structural stability
This should be based on design and construction data, operating records post construction changes and seismic stability. If required more detailed investigation and analysis should be carried out as per “Phase II- Investigation" In addition, accessibility of the dam sites and control structures should be assessed. Proper public awareness programmes should be implemented for the population may be affected by any catastrophic condition or failure of dam. Representatives of population residing downstream of the dam should be involved in operation and maintenance of the dams.
Action plan for dam safety at different stages
Keeping in view the foregoing, a summary action plan is suggested as below:
(A) New Dams
New Dams shall be investigated, designed and constructed as per the guidelines, procedures, IS codes and the state-of-the art dam engineering. However, the designs can also be verified by the Dam Safety Organization of the state. It is necessary that a complete report giving all the details of hydrological evaluations, geological data and analysis, Construction material quality and construction details and all data and drawings be prepared along with the completion of the project. Work on this should be commenced by the Chief Engineer in-charge when 50% of the project work is completed. The report should contain all important drawings of the dam as constructed, including geological features, technical and quality control data that need to be kept for posterity. Preparation of design memorandum of all the aspects of design is a good practice, which should be applied to major and medium projects. It is desirable that all major and medium projects are guided by a panel of experts even from the stage of design, if not investigation, till the project is completed. Each project should have an operation and maintenance manual prepared in consultation with the design and construction engineers. In addition, for each project, a disaster preparedness plan is to be prepared.
(B) Old Dams (i) Pre- Planning Stage
All dams should have completion reports giving all requisite topographical, hydrological and geological details and construction drawings with details of foundations and superstructures and foundation treatment and other special provisions built in. These should be carefully preserved in the office of the Executive Engineer who should inspect once in a year all the dams above 30 m in height under his charge. The Assistant Engineers should inspect every year all the dams in their charge and prepare reports in Format 1 and also indicate, if in their opinion, any malfunction is observed so that the senior officer could look into the same. All inspection reports prepared by the Executive Engineer should be submitted to the Superintending Engineer who will examine these and forward the reports of those dams to the Chief Engineer. The Chief Engineer after considering the recommendations of Superintending Engineer and after making a detailed site visit may recommend these cases to the State Dam safety Organizations for their

A-251
opinion and further action.
(ii) Planning Stage
Before planning the remedial measures, the dam would be inspected in detail by the Chief Engineer and / or the Experts in the State Dam Safety organization who will suggest further surveys and investigations, if required. Based on the data of the surveys and investigations, the rehabilitation works will be designed under the supervision of Chief Engineer or the Dam Safety Organization. Thus the planning phase will cover both planning, designs as well as the preparation of specifications and Tender documents
(iii) Implementation Stage
Implementation may be under contract or by department itself depending on the
nature and quantum of work that will be executed according to the design. The work will be supervised by the officers In charge of the Dam. As far as major dams are concerned, the rehabilitation works would also be inspected by the Chief Engineer at as close intervals as he considers fit and by other junior officers at time intervals fixed by the Chief Engineer.
(iv) Post Implementation Stage
If the Rehabilitation works are done properly as per specifications under close
departmental supervision, the structure is expected to provide benefit for a long time. Still, regular annual inspection is required and minor problems if any, should be attended to immediately.
Knowledge base and Information disclosure
All details of dams shall be incorporated into the knowledge base and used for planning and allocation of investments related to dam safety. This information shall be supplied with simple easily identifiable indicators to the people at risk as a part of information disclosure. This information shall be maintained at the WUA and sub project WRO offices. The contents should include:
• General details and status of the Dam, in terms of safety • Indicators to identify safety hazards • The people responsible for the effective functioning, their addresses and phone
numbers • Emergency plan, in case of dam break.
Record Maintained at Site
Records that may be required for proper inspection and maintenance shall be available at site. These should be properly maintained and kept up to date by including latest information available. Data in respect of upstream gauging stations, flood warning system and communication channels, if installed should be properly maintained.

A-252
General 1. Final detailed Project Report and details of modifications done during
construction and a set of final drawing (as executed) 2. Index Plan of the area in which the dam is located showing important towns,
roads, rail routes and communication facilities 3. Index Plan of downstream area showing natural flood zone, flood zones
corresponding to spillway design, flood and dam break flood and all important towns/villages and properly laying in these flood zones
4. Contour map of dam site extending up to 200 m or 10 times the dam height (whichever is less) on upstream and downstream, showing all features of the dam like toe lines, fills, drains, relief wells, access roads etc.
5. Record drawings of longitudinal section of dam foundation or cut off trench showing details of foundation stratigraphy, stage wise construction of COT filling and raising of dam, section embankment, zoning details and foundation treatment.
6. Record drawings of cross-sections of dam showing details of foundation treatment, under seepage control, zoning, internal and external drainage all protective arrangements and stage-wise construction
7. Contour plan of dam site with foundation trench showing details of foundation treatment and foundation drainage
8. Contour plan of reservoir basin 9. Contour capacity and area capacity curve 10. Reservoir maps showing silted basin, if observed 11. Plan of the catchment area showing rain gauge stations and capacities of upstream
storages 12. Material properties adopted for design 13. Details of design criteria followed 14. Design report on flood studies and spillway design flood 15. Design reports of outlets, power outlets, river sluices, intake, conduit, energy
dissipation arrangements and details of gates of hoists 16. Geological data on the foundation and abutments 17. Copies of reports, details of special foundation and abutment treatment carried out 18. Record of tail channel geology and tail channel erosion 19. Instrumentation drawing with details 20. Instrumentation data and behavioural record 21. Details of communication systems such as telephones, wireless etc., directory of
important key officers, flood-warning procedures 22. Flood forecasting system 23. Photographs showing various phases of construction, pre-construction etc. Earth-Rock-fill Dams 1. Stage wise construction record of the dam showing volumes and heights achieved
in each season and rate of progress 2. Record of special compaction done near concrete/masonry structures, abutment
contracts and outlet locations, if available 3. Summarized records of compaction control, sampling and complete laboratory
and field-test results on all recorded samples 4. Foundation details and geology as observed 5. Data of water intake test

A-253
6. Detailed drawings and record of relief well observations 7. Design report for the earth dam, covering the under seepage control, stability of
embankments and junctions with masonry dam, instruments installed etc. 8. Drawings showing the typical cross sections including zoning, drainage
arrangements, and details of slope protections provided for etc., as per actual construction
9. Details and location of instruments embedded / installed in and around the structures
10. Record of corrective measures, repairs and treatment that have been done subsequent to construction
11. Details of design criteria followed 12. Photographs showing all phases of construction 13. Important inspection reports and reports of consultants Concrete/Masonry Dams 1. Details of construction history including stages of construction particularly in low
blocks where considerable time has elapsed prior to resumption of work 2. Summarized data on control tests carried out during construction in respect of
concrete, mortar and their constituent materials, if available 3. Reports on hydraulic model studies 4. Drawings showing the details of energy dissipation arrangements including
foundation levels of apron, wells and end weir. 5. Details and location of instruments embedded/installed in and around the
structure. 6. Summarized data collected by embedded/installed instruments 7. Detailed drawings of all service facilities like internal lighting, emergency
lighting, drainage etc. 8. Drawing showing the uplift measurements and pressure relief arrangements 9. Summarized data of uplift pressure observed 10. Summarized data of seepage, leaching in the drainage gallery downstream face of
the dam and their locations etc. 11. Record of corrective measures, repair treatment that have been done subsequent to
completion 12. Important inspection reports and reports of consultants 13. Details of design criteria followed 14. Photographs showing all phases of construction Operation and Maintenance 1. Gauge data of the river prior to and after completion of work 2. Detailed observations on flood discharges 3. Detailed observations of hydraulic performance of energy dissipation basins 4. Record of past performance stating briefly the defects developed and remedial
measures carried out 5. Drawings of outlets, maximum discharge capacity, maximum design operating
head 6. Standing orders regarding operation of the dam
a. Designers operating criteria

A-254
b. Standard operating procedure c. Flood forecasting procedures d. Gate operation procedures e. Emergency action plan
Format 1: Engineering Data Format
(A) General • Name of the Dam - Project • Location - River, Sub-basin, Basin, Village/Tehsil/District/State • Type of Dam • Year of completion • Height of Dam (Elevation, Deepest foundation, River bed, FRL, MWL. Top of Dam) • Impounding capacity at F.R.L., at M.W.L • Index map showing location of dam, catchment area, downstream area subject to
potential damage due to failure of dam or failure of operating equipment. • Nearest downstream city, town, village which can be located on the map. Its
distances from dam and population. • Extent of economic development in downstream area. (B) Project Features
• Salient features, • Construction drawings indicating plans, elevation and sections of the dam and
appurtenant structures including the details of the discharge facilities such as outlet works, spillways and operating equipment
• Emergency preparedness – Communications, Downstream Warning Systems Auxiliary power, Remote Operation and Security of the site
(C) Hydrology
• Description of Drainage basin-Drainage area and basin runoff characteristics • Design flood-design assumptions and analysis, storage of flood control zone • Spillway capacity and flood routing criteria • Area capacity curves • Elevation of crest, type, width, crest length, location of spillway. Number, size
and type of gates • Type, location, capacity, entrance and exit levels of other outlet works • Emergency draw down capacity • Type, location, observations and records of hydro meteorological data
(D) Geology and Foundation
• Rock types, logs of borings of geological maps, profiles and cross-section, location and special problems (fault. shear zones, solutions, channels, etc.)
• Effects of geology on design, • Adequacy of investigation.

A-255
• Foundation treatment, grouting, drainage, etc. • Cut-off
(E) Construction
• History-including diversion scheme, construction sequence, construction problems, alterations, repairs.
(F) Operation and regulation
• Plan under normal conditions and during floods and other emergency conditions Flood Warning Systems (G) Operation record
• Experience during past major floods. (H) Stability and stress analysis of the dam
• Spillway and appurtenant structures and features including the assumed properties of materials and all pertinent applied loads
(I) Instruments and records of performance observations
• Any known deficiency that may pose a threat to the safety of the dam or to human life and property

A-256
FORMAT 2
Proforma for Periodic Inspection of Dams with Ungated Waste Water
Name of Dam :
District :
Circle :
Basin :
SRLD No :
Division :
A. General Date of inspection
S No. Item Remarks 1. Name of Project
2 Purpose of project: water supply / power / multipurpose / irrigation
3 Name of Dam
(a) Latitude and longitude
(b) catchment area
4 Year of completion
5 First filling (year / levels)
6 A . Benefits assured:
(a) Irrigation (RABI / KHARIF)(Hect)
(b) Water supply (Cum)
© Other benefits
B. Benefits achieved preceding year
(a) Irrigation (RABI / KHARIF)(Hect)
(b) Water supply
© Other benefits
7. Important controlling levels (in meters)
(a) Top of dam
(b) Maximum
© Full reservoir level
(d) Sill level of irrigation sluice
(e) Spillway crest level

A-257
(f) Minimum draw down level
(g) Lowest river bed level
(h) Deepest foundation level
8. Salient Features
(a) Dead storage capacity
(b) Area of foreshore at FRL
© Design flood adopted (PMF/SPF/ any other)
(d) Design spillway discharge capacity. Type and length of spillway with location
(e) Location still level and capacity of low level outlets and scouring sluices
(f) Height of the dam Above deepest foundation Above lowest river bed
(g) Gross storage capacity At FRL At MWL
(h) Length of the dam (at crest) in meters
9 Name and designation of the inspecting officer
10 Date of inspection and the corresponding reservoir water level
11 Maximum and minimum water level reached during the fast season with dates
12 Maximum overflow during proceeding monsoon with dates
13 History of past distress, if any, and brief details of remedial measures carried out
14 Does the officer in charge of the operation and maintenance of dam possesses all the records as given in the guidelines by the Dam Safety Organisation
15 When and by whom was the dam inspected immediately preceding this inspection?
16 Are the items pointed out during the fast inspection properly attended to? If not, state deficiencies yet to be corrected
17 Whether catchment area has been verified on the basis of latest toposheet? If yes, state the out come
Proposed Dams for Rehabilitation and Improvement 1. Pechiparai Dam 2. Manimuthar Dam 3. Perunchani Dam 4. Ponnaniar Dam
A-258
5. Manimukthanadhi Dam 6. Siddhamalli Dam 7. Amaravathy Dam 8. Vaigai Dam 9. Parambikulam Dam 10. Aliyar Dam 11. Kodaganar Dam 12. Karuppanadhi Dam 13. Gundar Dam 14. Gomukhi Dam 15. Thirumoorthy Dam 16. Kudhiraiyar Dam 17. Lower Nirar Dam & Upper Nirar Weir 18. Noyyal – Athupalayam Reservoir 19. Thunnakkadavu & Peruvari Pallam 20. Ramanadhi Dam 21. Gatana Dam 22. Palar Porundalar Dam

A-259
ANNEXURE IV INTEGRATED PEST MANAGEMENT PLAN
Introduction Pests and diseases cause enormous loss to agricultural production all over the
world. Farmers use plant protection chemicals to control the insect / pests and disease to protect the crops. However, farmers use plant protection chemicals indiscriminately due to lack of knowledge and ignorance. Many a time, when the required chemicals are not available locally, the farmers have to manage with poor substitutes. Unwarranted and indiscriminate use of insecticides / pesticides results in developing resistance in the crop pests.
Although the use of pesticides is low in India as well as in the State of Tamil Nadu, the potential health hazards are enormous due to their widespread and persistent use and multiple exposures. Many a time, the residues of harmful pesticides are found in the food grains, fruits and vegetables beyond the permissible limits. It has been estimated that 20 per cent of all foodstuff in India contains pesticide residues above permissible limits compared to 2 per cent globally. The agro-chemicals / pesticides also serve as a source of non-point pollution of water sources. Pesticides also kill beneficial insects (predators), which are natural checks for many crop pests.
Rationale for Pest Management Plan Constitutional and Legal Provisions
The Government of India and the State Government are striving hard to
discourage the use of hazardous Plant Protection Chemicals (PPC) and to promote the use of environment friendly techniques under the Integrated Pest Management (IPM) programme. It encourages the use of botanicals, pheromones, bio-control agents and microbial pesticides, The “ Prevention of Food Adulteration (PFA) Act ” is the policy tool which regulates the quality of food products manufactured, sold and consumed in India.
Pesticides are noted contaminants and are defined as harmful to human health. Many of the formulations such as BenzeneHexaChloride (BHC), Carbofuran, Dimethoate, Endosulphan, Lindane, Monocrotophos, which are banned in the developed countries are still used as PPC in India and account for a sizable proportion of the PPC used. Thus, it is imperative to promote the awareness about the health impacts of these chemicals and the need to adopt more sustainable IPM techniques. Moreover, large quantities of spurious pesticides are sold in the market taking advantage of farmer’s ignorance and illiteracy. The Insecticide Act of 1968 has been suitably amended by the Parliament during 2000 to ensure supply of quality pesticides to farmers and to deal with offenders. Under the Insecticide Act 1968 and Rules 1971, there is a provision for analyzing farmers' samples free of cost to discourage dealers of spurious pesticides.
World Bank provisions The World Bank Safeguard Policy OP 4.09 on Pest Management aims to avoid
excessive use of pesticides and promote environmentally sound and sustainable pest management. The frameworks shall encompass IPM and integrated nutrient management

A-260
with the overarching purpose of developing the project areas as organic - based production model. The IPM technique promotes to manage pest populations through use of biological control, cultural practices, and the development and use of crop varieties that are resistant or tolerant to pests.
Pests, Diseases and Nutrient Deficiencies
Depending upon crops grown and farming practices adopted in the project basins, pest problems occur in a variety of forms. Pre-eminence of certain crops in specific river basins and agro-climatic zones imparts eco-specificity of the pest problems. Borer/cutworm caterpillar: Borer/cutworm caterpillar seriously affects Soybean and gram crops grown in most of the river basin areas. Leafhoppers, grasshoppers and bugs: All pulses and oilseed crops grown in various river basins are affected to a varying extent by the hoppers and bugs. Rats: They affect all kinds of field crops and storage products. Storage pests: There are varieties of storage pests that affect stored grains. Diseases: They occur in various forms and are caused through seed-borne/ soil-borne/ air-borne sources. Seed-borne diseases such as rusts and smuts affect mostly the wheat crop that is grown in most irrigated river basins. Soil-borne diseases such as wilts affect mostly pulses like gram. Air-borne diseases include powdery mildews, blasts and leaf spots, which affect both cereal and pulse crops. Weeds: They cause serious limitations to achieving optimum crop yields by offering competition to crop plants for water, nutrients and light and also by serving as hosts to several pests.
Weed pressure is greater and more serious in competition to direct seeded rice because of the preponderance of Carbon 4 cycle (C4) weed species, while rice plants are Carbon 3 cycle (C3). Weed pressure is not serious in transplanted rice. Direct seeding of rice is a more common crop establishment practice in the rice growing areas. More than native weeds, exotic weeds like Phalaris minor and Avena ludoviciana (Wild oats) are highly menacing to the wheat crop.
In many basins other exotic weeds such as Parthenium hysterophorus (Congress grass), Lantana crameri, Ipomea cornea, Water hyacinth. etc. have invaded uncultivated areas including grazing lands, irrigation and drainage channels and ponds causing ecological/environmental problems.
Nutrient disorder in soils and crops: Even under the present sub-optional agricultural development scenario, the crop uptake of nutrients (macro, secondary and micro) far exceeds the amounts supplied through application of fertilizers, which is grossly inadequate and unbalanced. The results are multiple nutrient deficiencies in soils amounting to degradation of the productivity potential associated with nutritional disorder in crop plants consequent to lack of supply of depleted nutrients. Generally, secondary and micronutrients become more growth limiting.
The incidence of insect pests and disease problems as well as other problem manifestations (weed pressure. nutrient disorder. etc.) are likely to intensify with increased agricultural intensification in terms of enhanced cropping intensity and crop

A-261
diversification with inclusion of fruits, vegetables and other high-value plants, requiring more stringent solution framework.
The existing remedial practices include, application of chemical pesticides, manual weeding techniques and application of chemical fertilizers to augment the productivity levels. The application levels are low as compared to the national average figures due to non-affordability in lieu of the marginal returns. This may well be considered as a potential for introducing sustainable pest management techniques.
Some of the experiences in the Tamil Nadu region in the use of appropriate pesticides and eco-friendly pest control are as below. These are concerned with paddy and grams.
• Paddy. The pests that infest paddy are stem borer, brown plant hopper (BPH), sheath blight and blast. Stem borer is effectively controlled by spraying chloropyriphos, and mixing carbofuran granules in the soil two weeks before transplantation. Brown plant hopper is effectively controlled by spraying thiomethaxame. Monocrotophos and imidacloprid are also found to be effective in pest control.
• Grams. The most common pest for grams is helicoverpa (Green Pod Borer). A spray of neem oil mixed with endosulfan or quinalphos is found to be effective in controlling this pest.
• Biological control. Use of bio-agents such as Nuclear Poly Hedrosis Virus (NPV) and Bacillus thuringensis (BT insecticides) is found to be quite effective in pest control.
• Non-insecticidal Pest Management. Spraying cow slurry (cow dung, cow urine and non-edible green leaves soaked together and fermented for three weeks) is one of the efficient methods for pest control for all crops. Further the residual cow slurry is also used as manure.
Support for lPM
As mentioned earlier improved access to water resources as a result of sub-project activities shall lead to intensification of agriculture, consequently leading to increased usage of plant nutrients and pesticides. The project proposes to increase farmers' awareness towards benefits of Integrated Pest Management (IPM) and Integrated Nutrient Management (INM) techniques through training in the sub-project region, and thus wean them away from excessive usage of chemical fertilizers and pesticides to environmentally benign organic substitutes and sound management measures.
Procedures for Preparation of IPM The proposed activities related to IPM and INM are to be taken up by an external
agency including monitoring and evaluation (facilitated by the MDPU and Agriculture Specialist). This team would evaluate the IPM component for effectiveness and scaling-up implications.
Integrated Pest Management (IPM) IPM involves carrying out management activities that result in the density of the

A-262
potential pest population being maintained below the problematic pest level, without endangering the productivity and profitability of the farming system, the health of humans and animals and the quality of the adjacent and downstream environments. The interventions underlying IPM address the following:
• Increasing biological diversity to disrupt pest habitat through periodic replacement of cultivated crop varieties, intercropping, crop rotation and crop diversification oriented to disruption of pest habitat and consequential minimization of pest incidence
• Adoption of farming practices to escape pest incidence through appropriate tillage practices, trash management and optimizing sowing date such that possibility of pest / disease occurrence is minimized
• Cultivating crop varieties resistant to pests and diseases
• Adoption of bio-control agents such as application of plant / bio-products (bio-pesticides) and augmenting insect pathogens or other natural enemies (including birds)
• Increasing the farmers' awareness levels on IPM through conduct of technical training courses at village level. The training should focus on philosophy and principle of IPM, identification of different insect pests and diseases, and application of different IPM strategies including selection and usage of chemical pesticides. Extension agencies and NGOs shall be involved in organizing the training courses.
• Extension agencies shall organize regular field demonstration activities pertaining to application of IPM technology.
• Mass Media such as TV and Vernacular Newspapers should transmit information and knowledge on IPM
• Pesticide retailers at village level should be provided with information materials to increase their knowledge on selection and usage of pesticides since farmers seek their advice on pesticide usage
Measures to Increase Farmers' Preference to IPM
• Making quality biocontrol agents/ bio pesticides available at village level through the involvement of local NGOs.
• Making available the seeds of improved pest/disease resistant HYVs (High Yeilding Varieties)
• Encouraging farmers to adopt IPM practices including use of chemical pesticides based on proper understanding of farmers resources, knowledge, attitudes and perceptions with respect to IPM
• Monitoring and forewarning farmers of pest and disease situations

A-263
• Providing subsidies to farmers for adopting IPM technology
• Allowing price premiums on agricultural produces based on IPM technology
• Facilitating certification and marketing of IPM - based products.
• Help create institutional arrangements for IPM enforcement
• Securing NGOs' involvement in persuading farmers to opt for adoption of IPM technology
Integrated Nutrient Management (INM)
Public consultations at various levels indicated that under the existing cropping systems, the nutrient outputs grossly exceed the nutrient inputs and the fertilizer use efficiency is sub-optimal The most appropriate strategy for reducing the scale of mining and for increasing fertilizer use efficiency is to practice INM. The basic principle of INM is the maintenance of soil fertility, sustaining agricultural productivity and improving farmers' profitability through judicious and efficient use of mineral fertilizers, organic manures and bio- fertilizers. The INM package has area-specific implications depending upon the availability and performance of the various components.
The interventions underlying INM shall: • Adopt soil-tests based optimum nutrient use levels, ensuring adequacy of
Phosphorus level to meet the competitive demands of crops and P-fixation capacity of soils
• Working model for integration of organic manures and NPK fertilizers for sustainable high yields/farmers' resource - based target yields
• Inoculation of soybean and other legume seeds • Inclusion of legumes in rotation • Adopt improved (modern) crop management practices to ensure cultivation of
HYV, timely sowing and adequate crop stand establishment, timely weed control and plant protection and proper water management.
• Accelerate the adoption of INM through:
o Technical training courses at village level for improving farmers’ knowledge base. The training shall focus on concept and contents of INM, integration of organic and inorganic resources in consideration of farmers' resource base for mobilizing various nutrient sources, improvement of quality and quantity of FYM making use of NADEP compost system. Including vermiculture and use of bio - fertilizers. (Extension agencies and NGOs shall be involved in organizing training courses).
• Involved in NGO's:
o Orienting farmers to organic and biodynamic farming approach involving the use of FYM, green manures, crop residues, vermicompost, biofertilizers and biopesticides while understanding their resources and targeted yields.

A-264
o Facilitating certification and marketing of certified organic produces with appropriate price premiums through Government Departments
• Create institutional mechanism for facilitating adoption of INM in general and organic farming in particular, and for monitoring of practices adopted in producing organic products, keeping full track of production processes and products from field to sale point as well as for arranging organic certification and marketing
In addition to the above-mentioned interventions, the implementing agency shall ensure that the Pest Management Plan shall:
• Document the list of all pest control products and confirm that they comply with the selection criteria in OP 4.09
• Under the existing practices and pest management concerns to ascertain that, the project planning and implementation stages address the issues.
• Ensure that main elements of the plan are reflected in the work contractor
The implementing agency shall review the same periodically for effective implementation including the post implementation monitoring after one year to appreciate the level of achievement.
Monitoring and Evaluation (M & E)
The M & E will involve establishing a base line on the current status to evaluate the impact of project interventions. The M & E of IPM will be based on pre-defined parameters such as adoption of companion cropping system, planting of trap crops, following crop rotation, adoption of biological and mechanical methods of pest control, use of parasites and predators, adoption of bio-pesticides.
IPM & INM Training Costs
As a part of the TN-IAM WARM, several programmes have been devised to generate awareness towards IPM and INM practices. The tentative costs of such programmes are given in following Table.
Table: Costs of IPM & INM programmes
Sl. No.
Item Institution Units Total quantity for 6 years
Unit cost (Rs. ‘000)
Total cost (Rs. ‘000)
1 Farming Demonstration (INM)
Agricultural Department
Hectare 5,700 4 22,800
2 IPM village Agricultural Department
No. of Villages
500 100 50,000

A-265
3 NADEP composting demonstrations
Agricultural Department
Numbers 40,000 15 60,000
4 Vermiculture demonstrations
Agricultural Department
Numbers 40,000 1 40,000
5 Demonstration for vegetable production clusters
Horticulture Department
Numbers 550 50 27,500
Total 2,00,300
Organic Farming
Organic farming means a process of developing a viable and sustainable agro-ecosystem. In general, farming practices in these areas are geared to mono crop (usually paddy) in river basins and alluvial tracts, and poly crop agriculture (grams, millets, oil seeds etc) in the up lands. Watershed management also leads to increase in ground water resources in the river basins and sub basins. As this should facilitate more assured irrigation, crop diversification and selecting suitable crops according to soil and agro climatic conditions would be beneficial in getting income from a variety of crops.
The other aspects related to increased crop production/diversification is greater use of pesticides, insecticides and fertilizers. Excessive use of this chemicals leads to the development of resistant pests. This can be counteracted by laying equal importance to bio-fertilizers and manures (refer Integrated Pest Management Plan, Annex – II).

A-266
ANNEXURE V CULTURAL PROPERTY MANAGEMENT PLAN
Introduction
Cultural properties of significance in the State of Tamil Nadu may consist of one or more of the following: Religious Centers, Cultural heritage sites, Archaeological monuments, Sacred groves etc. Cultural property could also include sites, structures, objects and natural landscapes with archaeological, pale ontological, historical, architectural, and religious or other cultural significance. There exists a strong linkage between religious cultural properties and water bodies, be it a pond, a lake, a dam, a stream or a river in India. Over the years religious and cultural values develop surrounding such cultural properties. Thus, the project should not only include provisions to protect and enhance such properties, if impacted by physical interventions, but also address the religious sentiments and values attached to any physical feature or structure of the irrigation infrastructure
Rationale for Cultural Property Management Legal Provisions
Certain Legal provisions exist with regard to the rehabilitation policy of the State of Tamil Nadu. The Archaeological Survey of India has its own guidelines regarding the development of any activity in vicinity of the monuments etc of archaeological importance. The plan for protection/relocation has to be made along with measures to deal with chance finds during project implementation according to the State and Central laws applicable to such finds. Requisite studies, investigations and consultations with local people have to be held. This may include study of available data and maps, carrying out of additional surveys as may be required, examination of possible alternatives and determination of mitigation measures which may be protective works around the site or relocation of the object in another location in similar surroundings as per local law in force. Specific consultations have to be held with project affected groups and local NGOs based on prior information of findings to be furnished to them.
Impacts on archaeological or other cultural sites of significance are remote in the proposed project. However, the centuries-old tanks mostly have associated cultural property that may be impacted during rehabilitation. This, and other potential cultural property issues should be further studied in detail with respect to the physical investments and an appropriate cultural Property Action Plan or a framework for such a plan should be developed that will include screening, mitigating and enhancing affected sites, as well as including chance finds and procedures for civil works contracts.
World Bank Provisions
The World Bank Policy on cultural property (OP/BP/GP4.11) aims to assist in the preservation of cultural property where part of a bank -financed operation, and to avoid its elimination. If any of the cultural properties are to be relocated or constructed afresh due to proposed additional works under the TN-IAM WARM, then an inventory of the properties of cultural significance have to be made and measures suggested for their

A-267
protection, enhancement or elimination after consulting the appropriate Authorities and the Stakeholders.
Cultural Property Management
The project procedures shall follow a consultative approach for the identification of cultural properties and religious and cultural values of the people in the sub-project region. Based on the intervention measures proposed, all concerned stakeholders should be consulted to adequately address any adverse impacts on cultural properties or on access to properties to which values are attached. In case of unavoidable relocation of such properties, agreement with relevant authorities shall be undertaken for replacement. Procedures
Procedures to be followed for identification of cultural properties and values of significance attached to irrigation schemes have been presented in the following table. A Cultural Property Expert shall be hired as per requirement for cultural property assessment in the sub-projects
. Table: Procedure and Indicators for Cultural Property Management
S.No. Stages Procedures Coordinator Process &
Outcome Indicators
1 Stakeholders Consultation for identification of values & possible impacts
MDPU with the help of Cultural Property Expert
Number of Consultations. List of Issues (MDPU)
Classification of cultural properties into:
• National Archaeological significance
• State Archaeological Significance
• Regional Cultural Significance
• Local Cultural Significance
MDPU with the help of Cultural Property Expert
List of Cultural Properties with associated significance (MDPU)
Inclusion of issues and impacts into the SC1 and SC2 screening Matrices of the SEMF
MDPU with the help Cultural Property Expert
Requirement of clearances or detailed consultations for Planning Stage (MDPU & Cultural Property Expert)
2 Planning Stage Stakeholders consultations for identification of impacts due to sub project
MDPU with the help of Cultural Property Expert
Inclusion list of agreed safeguard measures in the

A-268
interventions, agreement over mitigation, compensation and enhancement measures
draft plan (MDPU)
Approval of Stakeholders on the final plan proposals
MDPU with the help of Cultural Property Expert
Signed Minutes of Meeting (MDPU)
3 Implementation Stage
Implementation of compensation, relocation and impact mitigation measures before initiating physical sub-project activities
MDPU with the help of Cultural Property Expert
OK card on implementation of all listed safeguard measures (MDPU)
Monitoring for possible impacts during construction
MDPU with the help of Cultural Property Expert
Number of grievances (MDPU & Cultural Expert)
4 Post implementation Stage
Stakeholder Consultations to ensure proper implementation of safeguard measures for preparation of ICR
MDPU with the help of Cultural Property Expert
ICR (MDPU& Cultural Expert)
Criteria for selection of cultural properties – pre planning stage
The criteria for the selection of sites suitable for enhancement have to be based on four factors:
• The historical importance • Importance for the local people • The religious significance • Scope for enhancement, if any
The importance of the site for the local people as well as the historical significance has to be identified through extensive discussions with the local community and general observations of the sites and structures. The scope for enhancement includes the possibility of any further improvement, availability of space for enhancement and the likely benefits for the local community. Poor condition of some historical structures could be a constraint in selecting sites for enhancement. Such sites though having high historical values may exist in a very bad physical condition. At such places, enhancement measures have no meaning without restoring the main structure, which is beyond the scope of the enhancement works.
Categorization of Properties - Pre-planning Stage
In case of non-avoidance of negative impacts, consultation with the communities and the various stakeholders including the Governmental and Non-governmental organizations in the project area has to be conducted as an integral part of the project preparation. Further, the properties have also to be categorised into different types based on their usage, social importance and historical /regional / national significance.
The information gathered should include the age of the structure, importance for the local people, religious significance, historical importance, the size of the population

A-269
using it, suggestions for enhancements, willingness of people to participate, etc. The site observation also provides vital inputs in concept formulation. It provides the general information about the condition of the main structure and the surrounding, visibility of the enhancement site from the project area, the scenic beauty of the site as well as the surrounding area etc.
All relevant information like consultations, documentations, etc. of the Cultural Properties should be incorporated into the GIS Knowledge Base. Consultation Process - Planning Stage
Community consultation has to be undertaken to make explicit the social factors that remain behind the importance of the site for the local people. Also, it may be carried out to know the associated social/historical significance, in discussions with the local community and general observations of the sites and structures. The consultation process includes the socio-cultural analysis and specifically addressed issue of how the community can get best benefit out of it. The consultations are normally held at local (community) level. The objective of the consultation is to minimize the negative impacts in the project area and their involvement in the enhancement process. The process further has to try to identify and assess all major economic and sociological characteristics of the village to enable effective planning and implementation. During the process, efforts may be made to ascertain the views and preferences of the stakeholders. Suitable Questionnaire should include formats for documenting the community consultations carried out, especially at the enhancement/relocation sites bringing out the key concerns of the stakeholders and actions/modifications taken with regard to those suggestions. Valid reasons should be placed in the documentation if certain suggestions are not incorporated in the plan proposals.
The likely impacts at different stages have to be documented along with corresponding mitigation measures and the responsible agency for undertaking the implementation of mitigation measures. The WRO shall be responsible for the monitoring of the activities that are implemented as part of any sub-project by the works contractor. Proposed Actions / Mitigation Measures - Implementation Stage
Proposed actions refer to the positive actions to be undertaken during the implementation stage of the sub-project for the benefit of the stakeholders. The mitigation measures proposed for religious/cultural property/space shall be part of the project and will be solely finalized based on the concerns of the stakeholders.
In case of property having historical importance, wherein Archaeological Survey of India comes into picture, and procedures of the ASI along with World Bank requirements as mentioned earlier shall be complied. Post Implementation Stage
Reconnaissance visits after a year to the completed sub-project sites by WRO for assessment and rectifications of any long-term impacts due to sub project interventions should be carried out. The department shall also review the outcome of the interventions, as documented in the previous stage of the project implementation to be aware of the accomplishments.
A-270
ANNEXURE VI CULTURAL PROPERTY MANAGEMENT PLAN
Introduction
Cultural properties of significance in the State of Tamil Nadu may consist of one or more of the following: Religious Centers, Cultural heritage sites, Archaeological monuments, Sacred groves etc. Cultural property could also include sites, structures, objects and natural landscapes with archaeological, pale ontological, historical, architectural, and religious or other cultural significance. There exists a strong linkage between religious cultural properties and water bodies, be it a pond, a lake, a dam, a stream or a river in India. Over the years religious and cultural values develop surrounding such cultural properties. Thus, the project should not only include provisions to protect and enhance such properties, if impacted by physical interventions, but also address the religious sentiments and values attached to any physical feature or structure of the irrigation infrastructure
Rationale for Cultural Property Management Legal Provisions
Certain Legal provisions exist with regard to the rehabilitation policy of the State of Tamil Nadu. The Archaeological Survey of India has its own guidelines regarding the development of any activity in vicinity of the monuments etc of archaeological importance. The plan for protection/relocation has to be made along with measures to deal with chance finds during project implementation according to the State and Central laws applicable to such finds. Requisite studies, investigations and consultations with local people have to be held. This may include study of available data and maps, carrying out of additional surveys as may be required, examination of possible alternatives and determination of mitigation measures which may be protective works around the site or relocation of the object in another location in similar surroundings as per local law in force. Specific consultations have to be held with project affected groups and local NGOs based on prior information of findings to be furnished to them.
Impacts on archaeological or other cultural sites of significance are remote in the proposed project. However, the centuries-old tanks mostly have associated cultural property that may be impacted during rehabilitation. This, and other potential cultural property issues should be further studied in detail with respect to the physical investments and an appropriate cultural Property Action Plan or a framework for such a plan should be developed that will include screening, mitigating and enhancing affected sites, as well as including chance finds and procedures for civil works contracts.
World Bank Provisions
The World Bank Policy on cultural property (OP/BP/GP4.11) aims to assist in the preservation of cultural property where part of a bank -financed operation, and to avoid its elimination. If any of the cultural properties are to be relocated or constructed afresh due to proposed additional works under the TN-IAM WARM, then an inventory of the properties of cultural significance have to be made and measures suggested for their

A-271
protection, enhancement or elimination after consulting the appropriate Authorities and the Stakeholders.
Cultural Property Management
The project procedures shall follow a consultative approach for the identification of cultural properties and religious and cultural values of the people in the sub-project region. Based on the intervention measures proposed, all concerned stakeholders should be consulted to adequately address any adverse impacts on cultural properties or on access to properties to which values are attached. In case of unavoidable relocation of such properties, agreement with relevant authorities shall be undertaken for replacement. Procedures
Procedures to be followed for identification of cultural properties and values of significance attached to irrigation schemes have been presented in the following table. A Cultural Property Expert shall be hired as per requirement for cultural property assessment in the sub-projects
. Table: Procedure and Indicators for Cultural Property Management
S.No. Stages Procedures Coordinator Process &
Outcome
Indicators
1 Stakeholders Consultation
for identification of values &
possible impacts
MDPU with the
help of Cultural
Property Expert
Number of
Consultations.
List of Issues
(MDPU)
Classification of cultural
properties into: • National
Archaeological significance
• State Archaeological Significance
• Regional Cultural Significance
• Local Cultural Significance
MDPU with the
help of Cultural
Property Expert
List of Cultural
Properties with
associated
significance
(MDPU)
Inclusion of issues and
impacts into the SC1 and
SC2 screening Matrices of
the SEMF
MDPU with the
help Cultural
Property Expert
Requirement of
clearances or
detailed
consultations for
Planning Stage

A-272
(MDPU &
Cultural
Property Expert)
2 Planning Stage Stakeholders consultations
for identification of impacts
due to sub project
interventions, agreement
over mitigation,
compensation and
enhancement measures
MDPU with the
help of Cultural
Property Expert
Inclusion list of
agreed safeguard
measures in the
draft plan
(MDPU)
Approval of Stakeholders on
the final plan proposals
MDPU with the
help of Cultural
Property Expert
Signed Minutes
of Meeting
(MDPU)
3 Implementation
Stage
Implementation of
compensation, relocation and
impact mitigation measures
before initiating physical
sub-project activities
MDPU with the
help of Cultural
Property Expert
OK card on
implementation
of all listed
safeguard
measures
(MDPU)
Monitoring for possible
impacts during construction
MDPU with the
help of Cultural
Property Expert
Number of
grievances
(MDPU &
Cultural Expert)
4 Post
implementation
Stage
Stakeholder Consultations to
ensure proper
implementation of safeguard
measures for preparation of
ICR
MDPU with the
help of Cultural
Property Expert
ICR (MDPU&
Cultural Expert)
Criteria for selection of cultural properties – pre planning stage
The criteria for the selection of sites suitable for enhancement have to be based on four factors:
• The historical importance • Importance for the local people • The religious significance • Scope for enhancement, if any
The importance of the site for the local people as well as the historical significance has to be identified through extensive discussions with the local community

A-273
and general observations of the sites and structures. The scope for enhancement includes the possibility of any further improvement, availability of space for enhancement and the likely benefits for the local community. Poor condition of some historical structures could be a constraint in selecting sites for enhancement. Such sites though having high historical values may exist in a very bad physical condition. At such places, enhancement measures have no meaning without restoring the main structure, which is beyond the scope of the enhancement works.
Categorization of Properties - Pre-planning Stage
In case of non-avoidance of negative impacts, consultation with the communities and the various stakeholders including the Governmental and Non-governmental organizations in the project area has to be conducted as an integral part of the project preparation. Further, the properties have also to be categorised into different types based on their usage, social importance and historical /regional / national significance.
The information gathered should include the age of the structure, importance for the local people, religious significance, historical importance, the size of the population using it, suggestions for enhancements, willingness of people to participate, etc. The site observation also provides vital inputs in concept formulation. It provides the general information about the condition of the main structure and the surrounding, visibility of the enhancement site from the project area, the scenic beauty of the site as well as the surrounding area etc.
All relevant information like consultations, documentations, etc. of the Cultural Properties should be incorporated into the GIS Knowledge Base. Consultation Process - Planning Stage
Community consultation has to be undertaken to make explicit the social factors that remain behind the importance of the site for the local people. Also, it may be carried out to know the associated social/historical significance, in discussions with the local community and general observations of the sites and structures. The consultation process includes the socio-cultural analysis and specifically addressed issue of how the community can get best benefit out of it. The consultations are normally held at local (community) level. The objective of the consultation is to minimize the negative impacts in the project area and their involvement in the enhancement process. The process further has to try to identify and assess all major economic and sociological characteristics of the village to enable effective planning and implementation. During the process, efforts may be made to ascertain the views and preferences of the stakeholders. Suitable Questionnaire should include formats for documenting the community consultations carried out, especially at the enhancement/relocation sites bringing out the key concerns of the stakeholders and actions/modifications taken with regard to those suggestions. Valid reasons should be placed in the documentation if certain suggestions are not incorporated in the plan proposals.
The likely impacts at different stages have to be documented along with corresponding mitigation measures and the responsible agency for undertaking the implementation of mitigation measures. The WRO shall be responsible for the monitoring of the activities that are implemented as part of any sub-project by the works contractor.

A-274
Proposed Actions / Mitigation Measures - Implementation Stage
Proposed actions refer to the positive actions to be undertaken during the implementation stage of the sub-project for the benefit of the stakeholders. The mitigation measures proposed for religious/cultural property/space shall be part of the project and will be solely finalized based on the concerns of the stakeholders.
In case of property having historical importance, wherein Archaeological Survey of India comes into picture, and procedures of the ASI along with World Bank requirements as mentioned earlier shall be complied. Post Implementation Stage
Reconnaissance visits after a year to the completed sub-project sites by WRO for assessment and rectifications of any long-term impacts due to sub project interventions should be carried out. The department shall also review the outcome of the interventions, as documented in the previous stage of the project implementation to be aware of the accomplishments.

A-275
ANNEXURE VI RESETTLEMENT FRAMEWORK
Introduction
The Government of Tamil Nadu through the WRO has initiated the TN-IAM WARM with an aim to pilot reforms options for enhancing the productivity of water, through crop diversification and over all well being of the people. The project would seek to restructure the Water Sector to significantly improve performance in water resources planning, allocation and management for sustained multi-sectoral use by adopting a river basin approach.
Sub-Project interventions proposed under TN-IAM WARM are limited to rehabilitation of existing structures and introduction of other software measures like extension works related to agriculture, fisheries, livestock development, etc. Since no new schemes are being proposed, resettlement issue will not crop up. However, as a safeguard measure a Resettlement Framework has been prepared to address any displacement as a result of any sub-project activity. Tamil Nadu State Policy on Rehabilitation (SPOR), 2002 also recognizes the need for a special focus on the resettlement and rehabilitation of affected people in the water sector.
Rational For Resettlement Framework
The ESA study looks into the likely resettlement impacts due to the TN-IAM WARM that follows a Programmatic approach wherein various sub projects shall be identified and taken up for improvement in different years. In the absence of precise sub project intervention measures at the present stage a Resettlement Plan or an Abbreviated Resettlement Plan (if impacts are minor or displaced persons are <200 as per WB OP 4.12) is not feasible. It is proposed that as per the Screening Exercise sub projects requiring Resettlement / Abbreviated Resettlement Plans shall be identified and such plans shall be prepared in conformity to the Resettlement Policy Framework for the present study. The Resettlement Policy Framework is an amalgamation of the SPOR and World Bank Policy on Involuntary Resettlement (OP/BP)
Based on the study, it is concluded that activities that may result in involuntary resettlement are:
1. Relocation of structures
2. Up gradation / Additional physical for improving and expanding the water storage or supply coverage
3. New physical works (if found necessary)
4. The interventions may require displacement of persons depending on the scale of the work and level of encroachments. The probable impacts include:
5. Impact / Loss of land and other immovable assets
6. Impact / Loss of livelihood systems/income opportunity (due to loss of productive land, due to impact to structure where livelihood activity is being carried out; etc.)

A-276
7. Impact / Loss of Community Property Resources (religious structures, grazing land etc.)
8. Impact / Loss of Access (between settlements, to agriculture lands, to markets etc.)
Support for Project Affected Persons-Broad Principles & Objectives of R&R framework
Both the TN State Policy on Rehabilitation 2002 and the OP/BP 4.12 in combination shall form the guidelines for the Resettlement & Rehabilitation Framework for this project. Resettlement Plans shall be prepared in accordance with this R&R Framework.
Principles (State Policy on Rehabilitation 2002)
Given below are the major Principles for Rehabilitation as laid down in the State Policy on Rehabilitation 2002.
1. Improve or at least regain the standard of living the displaced families had been enjoying prior to their displacement.
2. Special attention will be paid to rehabilitation of the displaced families belonging to scheduled castes and schedules tribes as well as those of small and marginal farmers. There will be no discrimination between families displaced from revenue and from forest villages.
3. Compensation will be paid to land owners and lease holders within the specified time limit, as far as possible Allotment of land to them as per their eligibility under the policies of the Government will also be considered. Allotment of land to non-lease holders will also be considered, on availability of land, as per the policy of the Government.
4. The oustees will be paid, suitable compensation for their agricultural land, residential plot and other properties. If land is allotted to them at the new place, appropriate price will be taken thereof from them.
5. Adequate civic facilities will be provided in the new settlement. As for as possible, efforts would be made to provide necessary physical and social infrastructures at the time of settlement itself.
6. In the process of rehabilitation it will be ensured that the families who were living in social groups in the affected village, are settled, as for as possible, in the same manner. If possible oustees shall be rehabilitated within the command area or near about the submergence area. Efforts will be made to ensure that the rehabilitated families get mixed up with the families already living at the new place.
7. Priority will be given to members of displaced families in jobs in the project's construction works and other works, as per their skills. They will be the first claimants for allotment of any surplus land within the command area of the

A-277
ongoing projects. In view of their number, reservation of land for them may also be considered. A certain percent will be set aside for allotment / distribution of shops in the township developed for the project area.
8. A grant scheme will be chalked out for the rehabilitation of agricultural labourers and non-agricultural families at the new place, to help them start self-employment. After completion of an irrigation project, the work of fishing and its sale will be given to cooperative societies of the oustees, as far as possible.
9. The work of land acquisition and rehabilitation will go side by side to minimize the inconvenience to the oustees. Land acquisition will be done phase-wise and first those areas will be acquired that are needed the first. Land more than necessary should not be acquired in any case.
10. In case any building etc remains unaffected after completion of the irrigation project, these can be used for community purposes for the new settlements.
11. Availability of food grains will be ensured at both old and new places right from the time the process of re-settlement starts.
Procedure for Preparing Resettlement Plan
Resettlement Plan Process
Planning for Project Affected Persons (PAPs) should be initiated in the Pre-Planning stage through regular consultations with the affected persons. Voluntary relocation should be encouraged to the extent possible, as most of the relocation shall pertain to encroachers. If the likely impacts are more the Resettlement Plan should be prepared for the project. The activities that will guide the preparation of such a Resettlement Plan are presented in table below:

A-278
Table: Procedure & Indicators for Resettlement
Sub project stage
Procedure Coordinator Process & Outcome Indicators (Monitoring Agency)
Pre-Planning Identify locations in the sub-project that might lead to displacement of people affecting either private lands, encroached government lands, structures or assets linked to livelihood
MDPU helped by Resettlement Expert
List of issues that trigger Resettlement Plan (Resettlement Expert)
Stretches where land acquisition is likely to be transferred on to the land revenue maps and alternatives sought to minimize acquisition
MDPU helped by Resettlement Expert
Maps showing land acquisition locations (MDPU)
Consultations with the affected communities to arrive at agreeable solutions and encourage voluntary eviction from encroached areas
MDPU helped by Resettlement Expert
Video records, Photographs, Signed minutes of meeting (MDPU Resettlement Expert)
Revision of sub-project intervention activities incorporating the outcomes of consultations
MDPU helped by Resettlement Expert
List of modified sub-project activities (MDPU Resettlement Expert)
Inclusion of issues and unavoidable impacts identified into the SC1 and SC2 screening Matrices of the SEMF.
MDPU helped by Resettlement Expert
Requirement of Resettlement Plan (MDPU, Resettlement Expert)
Planning Super imposition of Total Station Drawings of Irrigation Schemes on Revenue Maps.
MDPU helped by Resettlement Expert
List of tribal villages on sub-project map (MDPU, Resettlement Expert)
Identification / location project interventions on the sub-project drawings and demarcating the area that would be required for implementing the interventions.
MDPU helped by Resettlement Expert
List of tribal villages on sub-project map (MDPU Resettlement Expert)
Identification of the plots to enlist the project-affected families.
MDPU helped by Resettlement Expert
Maps showing land acquisition locations (MDPU,

A-279
Resettlement Expert)
Baseline survey that consists of 100% census survey of the affected families and the types of loss shall be undertaken. The day of such survey shall be treated as the ‘cut off’ date.
MDPU helped by Resettlement Expert
Final List of PAPs (MDPU, Resettlement Expert)
Socio economic survey consisting of 20% sample of total affected families to establish the socio-economic status of the families affected.
MDPU helped by Resettlement Expert
List of key issues (MDPU, Resettlement Expert)
Formulating compensation and assistances that need to be provided to compensate the loss the affected families
MDPU helped by Resettlement Expert
Budget for compensation & assistance by type and numbers (MDPU, Resettlement Expert)
Preparation of the Land Acquisition Plan and Schedule required as per the Land Acquisition Act.
MDPU helped by Resettlement Expert
Number of households notified (MDPU, Resettlement Expert)
Implementation Disbursement of compensation and Assistance as per the Rehabilitation Plan/Framework
MDPU helped by Resettlement Expert
Number of households compensated & assisted (MDPU, Resettlement Expert)
Preference for jobs in the project as per RP
MDPU helped by Resettlement Expert
Number of persons offered jobs MDPU, Resettlement Expert)
Sub project stages
Procedure
Coordinator Process & Outcome Indicators (Monitoring Agency)
Training on agriculture and allied activities as a part of TN-IAM WARM
MDPU helped by Resettlement Expert
Number of persons trained (MDPU, Resettlement Expert)
Implementation of safeguards measures as per Resettlement Plan proposals
MDPU helped by Resettlement Expert
OK card of implemented measures (MDPU, Resettlement

A-280
Expert) Post Implementation
Evaluation of the success of programs & safeguard measures undertaken & Follow up activities based on lessons learnt
MDPU helped by Resettlement Expert
See Table 9.2
The following table lists the Impact Indicators to be monitored in the Planning (through Socio-economic surveys) and Post Implementation Stages of the sub-project cycle to monitor and evaluate the impacts of the project.
Table: Impact Indicators for evaluation of PAP’s
Item Impact Indicators Frequency Responsible
Agency
Economic Conditions
Income Project related & Independent means but assisted by the project Housing Changes in quality over a period of time. Changes in occupation Skill portfolio Migration profile
Planning Stage Post Implementation Stage
Independent agency/Internal monitoring by MDPU
Social Conditions
Verification of cases of voluntary donation of land, Representation in Community based institutions, Indicators of participation Empowerment, School enrolment Health and morbidity Household infrastructure, electricity, potable water, living space etc.
Planning Stage Post Implementation Stage
Independent agency/Internal monitoring by MDPU
Additional Details Related To Resettlement Plan
Resettlement Plan Contents
In accordance with the Social and Environmental Management Framework prepared to integrate Environmental and Social Safeguard measures in the main project, all sub projects should be screened for their likely adverse impacts, in the Pre-Planning Stage. If the issues related to resettlement are triggered, a Resettlement Plan or an Abbreviated Resettlement Plan has to be prepared for the concerned sub project. Such a plan should be prepared at the Planning and Design Stage of the project preparation, wherein physical intervention measures shall be planned and designed.

A-281
The contents of the Resettlement Plan to be prepared for individual sub projects consistent to the Resettlement Framework are as follows:
• Baseline census and socio-economic survey information
• Specific compensation rates and standards
• Policy entitlements related to any additional impacts identified through the census or survey
• Description of resettlement sites and programs for improvement or restoration of livelihoods and standards of living
• Implementation schedule for resettlement activities
• Detailed cost estimate
Approval of Resettlement Plan
The following Committees as per the scale of Resettlement (Major or Minor) may review and approve the Resettlement Plan.
• State Level Committee (in case of Major Projects- those which necessitate transfer of 100 acre or more land due to land acquisition or for any other reason)
• District / Division Level Committees for minor projects
Likely Categories of Displaced persons
Involuntary Resettlement is remote in TN-IAM WARM given nature of project interventions that pertain to mere up gradation and modernization of existing irrigation schemes and other small physical works like improvement of ponds for fisheries development, canal and dam, hydro etc. Additional submergence in reservoirs shall only be restricted to projects where possibilities of creating additional storage exist. Thus estimated population displacement shall be limited in the present project.
The likely categories of displaced persons based on eligibility for entitlements as per the framework are given in table below:

A-282
Table: Eligibility Criteria
Sl.
No.
Affected
Population
Category
Definition
SPOR Definitions
1 Project Affected Person (PAP) / Project Displaced Person (PDP)
A person who has been ordinarily living in the area, which is likely to be submerged temporarily or permanently due to a project or which is required for a project, for at least one year from the date of publication of the notification Under Section 4 of the Land Acquisition Act, and has been practicing a business or occupation for a living there or has been cultivating a land for at least three years.
Project Displaced Family (PDF)
A family comprising displaced persons as defined above includes the husband, wife and minor children and others such as window mother, widow sister, unmarried sister, unmarried daughter or aged father, depending on the head of family. Every major son/ daughter of a displaced family (who has become major on the date of notification Under Section 4 of the Land Acquisition Act, will be considered a separate family)
2 (a) Landless person / Agricultural laborer
A person who holds no agricultural land himself or a joint land with his family member or who has no other land for agriculture. Persons who work as agricultural laborers will also be placed under this category.
(b) Small farmer A person who owns 2 hectares un-irrigated or 1 hectare or less irrigated land.
(c) Marginal farmer A farmer who owns 1 hectare un-irrigated or 0.5 hectare or less irrigated land.
Additional Definitions
3 Urban Oustees Displaced families in urban areas (Areas identified as Urban by the Census of India, 2000)
4 Rural Oustees Displaced families in rural areas (Areas identified as Rural by the Census of India, 2000)
5 Encroacher A person who has trespassed into Government/ private/ community land to which he/ she is not entitled to
6 Squatters Person who has unauthorized by settled on the land or building for shelter or livelihood
7 Below Poverty Line (BPL)
The subsistence level of income is called the Poverty line. BPL is a sum fixed by the Planning Commission, Government of India and families that have an income below this sum fall within the vulnerable or poor or disadvantaged class

A-283
8 Vulnerable Persons / Groups
All category of people who are socially distressed or economically backward fall under this group. They may include, but not limited to the following: People living Below Poverty Line and or are earning 25% above the poverty line Members of the Schedule Caste/ Tribe community/ Other Backward Caste Women headed households Orphans and destitute Disabled and aged Land less person
9 Title holder This includes the persons who can establish their usufruct rights of the property they claim to be their own. Cut off for titleholder is the date of issuing notice under section 4(1) of the Land Acquisition Act (Amended) of 1984.
10 Non-title holder Any person unable to establish his/her right to the property he/she is occupying without a legitimate evidence for being the owner is called a non-title holder. Cut off Date for Non titleholder refers to the date of Census Survey which should be completed 2 years prior to the section 4 (1) notice under the L A Act.
The present policy framework is a combination of the State Policy on Rehabilitation, 2002 and the World Bank Policies on Involuntary Resettlement, OP/BP 4.12. The State Policy on Rehabilitation, 2002 is a model policy for the state, provisions of which are minimum and mandatory in the respective policies of different departments. The SPOR provisions are similar in spirit to the WB Policies though, at places, certain provisions and entitlements are not explicitly spelt out. The Summary Entitlement Framework adopted for the TN-IAM WARM is given in the following table. Any other unforeseen impacts shall be documented and mitigated based on the principles agreed upon in this policy framework.

A-284
Table: Summary Entitlement Framework
Entitlement as per SPOR Additional Entitlements conforming to WB Policies
Category of Impacts
Impacts and assistance criteria
Titleholders Non Titleholders
Titleholders
Non Titleholders
V* NV**
V NV V NV V NV
LAND Loss of Agricultural Land
Compensation for land at full replacement cost, free of fees or other charges
Yes Yes Yes (If revenue or forest land occupied for min. 3 years from date of project sanction)
Yes (If revenue or forest land occupied for min. 3 years from date of project sanction)
Agricultural Land
Land based resettlement options (if >25% and subject to availability)
Yes Yes No No
Loss of Residential Land (Rural / Urban)
Alternative Residential Plot
Yes Yes No No
Loss of Urban Land
Compensation for land at full replacement cost, free of fees or other charges
Yes Yes No No
OTHER IMMOVABLE ASSETS Loss of Structures
Replacement or compensation for structures and other non-land assets
Yes Yes Yes Yes
Loss of Compensation Yes Yes No No

A-285
trees for perennial crops and trees, calculating as annual net product value multiplied by number of years required for new crop to start producing
Loss of crops
Advance notice to harvest non-perennial crops, or compensation for lost standing crop
Yes Yes Yes Yes
Loss of reusable assets
Rights to salvage materials from existing structures, trees, and other assets
Yes Yes Yes Yes
PHYSICAL RELOCATION Uncertainty of resettlement site
Consultation, counseling regarding resettlement alternatives and assistance in identifying new sites and opportunities and option of housing in resettlement sites in cases of cluster relocation
Yes Yes Yes Yes
Hardships in immediate reestablishment
Grant for accessing housing schemes, or other support to assist poor and vulnerable
Yes Yes Yes No

A-286
tenants in reestablishing their homes
Shifting hardships
Shifting (transportation) assistance
Yes Yes Yes Yes
LIVELIHOOD Hardships during Transition period
Transition Assistance – agricultural extension services, cooperatives, Employment Assurance Scheme, Insurance Scheme, etc.
Yes Yes Yes Yes
Lack of financial support during transition
Rehabilitation Grant in aid for 1 year
Yes Yes Yes Yes
Loss or diminished livelihood
Special support (financial) for additional 3 years
Yes (only landless)
No Yes (only landless)
No
Loss of original livelihood
Additional support mechanisms for vulnerable groups in reestablishing livelihood
Yes No Yes No
COMMUNITY RESOURCES Loss of Community Resources
Re-establishment or development of Community Resources like grazing lands, religious structures, etc.
Yes Yes Yes Yes
ACCESS Loss of access to Facilities
Creation of new Civic Facilities and Transportation routes
Yes Yes Yes Yes

A-287
V* - Vulnerable
NV** - Non Vulnerable
Valuation of Assets
The Valuation of assets lost as a result of Involuntary Resettlement should be calculated on the following basis:
• Valuation of lands in private possession - possible market price will be paid to the concerning person
• Valuation for house – The amount of compensation for all other properties like house, will be equal to the expenditure that would have been incurred on restoring it to its original condition. The compensation for house will be equal to the cost of a house under any Housing Schemes
• Valuation for trees – The price of fruit bearing trees will be determined on the basis of the annual income from fruits of the tree and the value of its wood
Organizational procedures for RP Implementation
The organizational procedure for implementation of the Resettlement Plan after its approval by the concerning administrative department is as follows:
• The outline of the project along with the Resettlement Plan after its approval by
the concerning administrative department will be published in local dialect for public information in the project area and will also be presented before the gram sabhas and in case of urban areas before the urban units for their information. The same system will be followed in private schemes also
• Under section – 4 of the Land Acquisition Act, the process of primary notification may be started. During this process, and otherwise, too, people and their organizations will have the right to seek information about any aspect of the project. In case it is decided to retain the information for some reason, a notification to this effect should be issued giving the reason
• The resettlement sites will be selected in consultation with the affected as well as the host communities. For this, first the potential affected persons will be properly informed about the new area and their visits to the new areas will be organized to acquaint them with the families already living there. Any action for new settlement will be taken only as per the advice of the affected as well as the host communities
• Entitled persons, their eligibility and entitlements as identified in the RP shall be verified and the Project Authorities in co-ordination with the Revenue Department should disburse their entitlements
Grievance redress mechanism
A-288
The grievance redress mechanism as detailed in the SPOR is as follows: • In small plans, where one fourth of the concerning people, particularly members
of scheduled castes and schedule tribes do not agree to the plan presented for them, the cases will be considered by district / division level committee
• Such cases of major plans, too, will be first considered by district/ division level committee and in case the matter is not resolved, then alone these will be referred to the state level committee and its decision will be final
• Disputes pertaining to any matter within the ambit of the Resettlement Framework / SPOR and its implementation, such as identification of the beneficiaries, the benefits to them etc., will be, as far as possible, resolved by the district/ division level committee
• Special land acquisition courts will be established for disposal of cases pertaining to acquisition of lands, to avoid delay in their disposal through normal judicial process
Funding through Project
All resettlement funding shall be through the main project. Separate Resettlement Plans or Abbreviated Resettlement Plans shall be prepared for each sub project during the Planning & Design Stage. Detailed Cost Estimates based on intervention measures proposed shall be prepared and approved by the State or the District / Divisional Committees. The document shall then be submitted to the Bank for its approval and subsequent release of funds. Contingency Fund
A special fund with an initial amount of Rs.50 crores will be created to help those in distress due to displacement or related reasons that cannot be provided assistance under the general procedures. For this, a special cess will be levied on mineral, power and forest based industries and the industries with heavy investment. (Refer Section 27 of the SPOR). This fund can be used by the rehabilitation department, in consultation with the state level committee as a contingency measure. The Bank in the next disbursement shall replenish this additional amount. State Requirements of Consultations
As per the State Policy on Rehabilitation, the following consultations are pre-conditions for any development work (Refer Section 14 of the SPOR):
• Gram Sabha should be consulted for acquisition of land for public purpose like construction of any project or for any other work and / or alternative use of other resources
• All economic establishments will require presenting their stand in an open forum.
The State government in such a situation shall stand for the weaker sections and to protect their interests. In case of tribal societies it will be specially seen that any step

A-289
of the State or any action of the parties concerned does not create a rift in the society.
Guidelines for Implementation and Monitoring
The general features of implementation and monitoring mechanism includes the following:
Basic responsibility of R&R for these water resources projects is vested with the WRO. This should be carried in consultation and support from the concerned line departments. The project authorities shall constitute R&R cells within the department for timely preparation and effective implementation of the R&R program.
As the whole activity under R&R is multi-disciplinary in nature, it is an absolute necessity to have effective participation, cooperation and involvement of most of the basin level and project level officials to prepare and execute suitable rehabilitation plans. In case of any grievances regarding the rehabilitation, the project affected persons shall approach the R&R Cell that will be established at the head office level of the WRO.

A-290
ANNEXURE VII TRIBAL DEVELOPMENT STRATEGY
Introduction
Tribal communities represent a vulnerable section of the community who are prone to exploitation and marginalization in the process of development, due to low levels of literacy and awareness. They are intimately dependent on the forest for almost all-human activities. At times, these tribal population centers become central points for activities, damaging their eco-system. Fire, grazing, shifting cultivation, smuggling and poaching are such activities.
The Government of India has identified tribal populations in Trichi, South Arcot, North Arcot, Dharmapuri and Salem who requires Integrated Tribal Development Programme for their upliftment. In order to improve the economic conditions of the tribals living in the above districts, Hill Area Development Programme (HADP) and other schemes were implemented. They have helped create forest-based assets in tribal areas besides providing employment opportunities at their doorsteps.
The concentration of tribal population in various blocks varies considerably with most of the tribal area being concentrated in different pockets in the State of Tamil Nadu. The Directorate of Tribal Welfare, GoTN, have identified 36 Scheduled Tribe communities in 13 districts. Of these, 6 Tribal communities, i.e., Toda, Kota, Kurumbas, Irular, Panian and Kattunayakan have been identified as Primitive Tribal Groups.
Rationale for Tribal Development Strategy
Constitutional and Legal provisions
Several legal provisions have been provided in the Indian Constitution and legislative organs, to ensure protection and assistance to the tribal communities of the Country. The Constitution of India in its 244 (1) and (2) in part X has listed Scheduled Areas and Tribal Areas under the Fifth and Sixth Schedules envisaging special system of administration. The provisions are meant to assist tribal populations in utilizing their rights and to develop their economic, educational and social status.
The 73rd Constitutional Amendment Act, 1992 has made provisions for reservations for Vulnerable Groups such as SC, ST and women for effective participation and involvement in decentralized governance. The tribal population is given opportunity for participation through reservation at three levels of Panchayats. Panchayats (Extension to Scheduled Areas) Act (PESA), 1996 has given control of land, forests and water in the hands of tribal through Gram Sabha (Village Assembly). Land tenancy act, controls marginalization of tribal household through restriction of transfer of land from tribal to non-tribal persons.
The Applicability of PESA provisions in Tribal Areas is as follows.
A-291
• The Gram Sabha shall be involved during the identification and planning of land uptake and resettlement in view of the mandatory provisions under the act that includes:
• Approval of development plans and programmes
• Acquisition of land for development projects and rehabilitation of persons affected in consultation with Gram Sabha or Panchayat. At the planning and implementation stage it will be coordinated at state level
• Consensus for any legislation with customary laws and practices for management of resources
• Panchayat to manage water bodies
• Ownership of minor forest produce
• Prevention of alienation of land
World Bank Operational Policy, (OP 4.10) This policy contributes to the Bank’s mission of poverty reduction and sustainable development by ensuring that the development process fully respects dignity, human rights, economies and cultures of indigenous peoples. For all projects that are proposed for Bank financing and affect Indigenous Peoples, the Bank requires the borrower to engage in a process of free, prior and informed consultation. Such Bank financed projects include measures to (a) avoid potentially adverse effects on the Indigenous Peoples’ communities: or (b) when avoidance is not feasible, minimize, mitigate, or compensate for such effects. Bank financed projects are also designed to ensure that the Indigenous Peoples receive social and economic benefits that are culturally appropriate and gender intergenerationally inclusive.
• Because of the varied and changing contexts in which indigenous peoples live and
because there is no universally accepted definition of “indigenous Peoples’’, this policy does not define the term. Indigenous Peoples may be referred to in different countries by such terms as ``indigenous ethnic minorities,” ``aboriginals’’, “hill tribes”, ``minority nationalities, “scheduled tribes” or ``tribal groups’’.
For purposes of this policy, the term “Indigenous Peoples” is used in a generic sense to refer to a distinct, vulnerable, social and cultural group possessing the following characteristics in varying degrees:
(a) Self-identification as members of a distinct indigenous cultural group and recognition of this identity by others;

A-292
(b) Collective attachment to geographically distinct habitats or ancestral territories in the project area and to the natural resources in these habitats and territories;
(c) Customary cultural, economic, social, or political institutions that are separate from those of the dominant society and culture; and
(d) An indigenous language, often different from the official language of the country or region.
A group that has lost "collective attachment to geographically distinct habitats or ancestral territories in the project area"; (paragraph 4 (b)) because of forced severance remains eligible for coverage under this policy.8 Ascertaining whether a particular group is considered as “Indigenous Peoples” for the purpose of this policy may require a technical judgment (see paragraph 8, OP 4.10).
In addition to the provisions under constitutional and legal provisions, several entitlements have been provided as appropriate mitigation measures. These are based on participatory approaches envisaged by the Center and State Governments involving tribal population in addressing the social issues accruing from the projects.
Socio Economic Profile of Tribals Distribution of Tribals
Table: Tribal Population in Tamil Nadu
Sno Name of the District Name of the
Tribal Area
Area
(Sq.Km.)
Total
Population of
the area
Tribal
Population
Namakkal Kolli Hills 224.85 38,449 30,665
2 Salem Yercaud Hills 147.50 33,353 21,676
3 Salem Kalrayan Hills 319.21 21,395 20,665
4 Salem Arunuthumalai 29.02 11,879 6,604
5 Salem Pachamalai 109.92 24,161 6,583
6 Tiruvannamalai Jawadhu Hills 310.35 59,448 49,962
7 Villupuram Kalrayan Hills 600.00 32,756 29,991
8 Dharamapuri Sitheri Hills 188.00 29,890 14,353

A-293
9 Trichy Pachamalai 128.83 13,397 7,894
Source: Annual Tribal Sub-Plan, 2003 – 04, Commissionarate of Tribal Welfare, Go TN.
Out of 5.74 lakhs of Tribals, 2.78 lakhs are non-workers and the remaining 2.96 lakhs workers, 1.34 lakhs are cultivators, 0.93 lakhs are Agricultural Labourers, 0.04 lakhs are House – hold workers, 0.47 lakhs are other workers and 0.18 lakhs are Marginal workers.
Characteristics of Tribal areas Tribal people mostly live in hills and forests. The coverage of forest varies from
one area to the other, but it can be said that about half of the tribal area is covered with forests. In such a situation, any programme of economic development must rest on the use and exploitation of the forests. The terrain, which the tribal cultivate, is hilly and undulating. With the increasing pressure on land, undulating areas and steep slopes have been brought under cultivation with consequent loss of fertility and soil erosion. In addition to this, no irrigation facilities are available. Agriculture is carried out in tribal areas under these conditions and circumstances. Sparseness of population is another special feature of tribal areas. Communication facilities are scanty and difficult in tribal areas. Such a situation raises a real problem as to how the benefits of the development programmes should be extended to a majority of the tribals living in interior areas.
Even today, the social customs and way of living of the tribals remind us of their dependence on natural environment. The most distinct aspect is their community-centered way of life and their social customs (like marriages, dispute resolution or celebration of festivals). Though development in some forms has reached their settlements, it has not influenced their dependence on natural resources and occupation. They still maintain their distinct way of life with a majority of their household tasks and livelihood dependent on the existing natural resources.
The following activities represent the dependence of the tribals on the natural resources:
Livelihood: The main economic activity of the tribal population is agriculture on which they are completely dependent for their only source of income. The land is cultivated once or twice a year, depending on the terrain, soil and monsoon. Almost all the tribal populations depend on animal husbandry for their secondary source of income, if not primary.
Animal Rearing: Rearing of animals has been the oldest form of subsistence and prime activity of many of the tribal groups. It provides additional income to the tribal households. The natural forestland, wasteland and natural vegetated area have been the most easily accessible source for fodder and grass for their animals. Though there has been a shift from the nomadic life to a settled agriculture based life, the tribal population is dependent on the natural vegetation and land for animal rearing.
Minor Forest Produce: The tribal groups were chiefly engaged in hunting / gathering or in sustenance agriculture. Access to their traditional resources like forests, streams and animals has been severely restricted with the Government’s measures to reserve the

A-294
forests with an intention to protect them. For the household tasks and other activities, the tribal people are dependent on the forest and its produce. Gathering of forest wood is an important activity, engaging the women folk of the tribal village. The nearby forest area provides the fuel for cooking and heating purposes.
Water: The main source of water for the tribals has been the rivers and streams along with other water bodies in proximity to the settlement. These provide water for the household and agricultural activities. In many areas, these water bodies provide food for the tribal people. In some cases, ground water extracted through tube wells also provides drinking water to them.
Irrigation: Though the agricultural activities are rain fed, other main sources of irrigation are ponds, tanks and wells. The tribal farmer depends on these sources for irrigational purposes when monsoon fails.
Grazing lands used by tribal people should not be impacted due to the project. Every single case acquisition of forestland for the project has to be studied and requisite clearances from the concerned departments have to be sought. State departments under the Forest Conservation Act will be responsible for providing the clearances in such cases. Any take over of lands belonging to other Government Departments should be carried out through the requisite clearance procedures of the concerned departments.
Support for Tribal Groups
Special measures should be undertaken for upliftment of the tribal communities residing in each sub-project area. In the Sub-projects where the tribal people form a part of the beneficiaries, steps should be undertaken to include them in all the stages of the project. Where existing schemes of the government are operational, effective linkages with the programmes shall be established to maximize project benefits to the tribes.
Tribal groups if directly affected by the project should be compensated and assisted as per the entitlement provisions laid down in the Resettlement Framework of the project. The project should endeavor to mainstream people from the tribal households residing in the sub-project area. An early consultation with such groups should be undertaken to identify measures to provide benefits of the intervention measures to tribal communities.
Special Measures for Tribal upliftment can be taken up through the following programs:
• Designing the sub-projects on a participatory framework where consultation with stakeholders at every stage remains the main focus of project activity
• Separate Focus Group Discussions for identification of opportunities for the tribes through sub-project physical and institutional interventions
• Provision of access to local resources like ponds for fisheries, grazing grounds for livestock development, minor forest produce for economic returns, handicrafts, etc.

A-295
• Inclusion mechanisms for adequate representation into Local Decision making bodies like Panchayats, WUAs, etc.
Procedure for Preparing Tribal Development Plan
Involvement of Tribal groups in problem identification and design of solutions has to be ensured through the entire cycle of sub-project interventions. Table 7.9 presents the activities to be undertaken by the implementing agency to ensure inclusion of tribal issues in the main project.
Table: Activities and Indicators for inclusion of Tribal issues
Sub project stage Procedure Coordinator Process &
Outcome
Indicators
(Monitoring
Agency)
Pre planning Identify locations of State declared Tribal pockets and villages with Tribal population above 25% through GIS database
EE, WRO helped by Information Management cell
List of tribal villages on sub-project map (Tribal Expert)
Identification of Tribal community stakeholders at site
EE, WRO with Gram Sabhas
List of all Tribal community heads in the sub-project (Tribal Expert)
Sensitization and consul tation through PRA and Focus group discussions with Tribal groups.
EE, WRO helped by PR & Media Experts, MDPU, WRO.
No. of discussions and minutes of the meeting (Tribal Expert)
Identification of environmental and social issues of the tribals and possible impacts as a result of the project
EE, WRO helped by the Environmental, Social & Tribal experts, WRO
Documentation of the issues (Tribal Expert)
Inclusion of issues and impacts identified in the previous row into the SC1 and SC2 screening Matrices of the SEMF.
EE, WRO helped by the Environmental, Social & Tribal experts, WRO
Justifications for preparing, Tribal Development Plan (Tribal Expert)
Planning and Design
Joint walk through, Consultations and PRA techniques to establish existing concerns related to: � Land availability and
EE, WRO helped by the Environmental, Social Tribal experts, WRO & Gram Sabhas
List of Spatial & Non spatial issues (Tribal Expert)

A-296
Tenure � Access to irrigation � Representation in
WUA’s � Existing Government
schemes � Dependency on
Minor Forest Produce (MFP) and common property resources
Discussions on possible intervention measures through the project, their likely impacts and safeguard measures (mitigation and monitoring) to be incorporated into the project activities. � Loss of agricultural
& homestead land � Loss of structure &
immovable assets � Loss of livelihood � Loss of common
property resources
EE, WRO helped by the Environmental, Social & Tribal experts.
List of Safe guard measures (Tribal Expert)
Consultations with tribal groups on the Draft Plan & Tribal Development Plan Proposals for further suggestions.
EE, WRO helped by the Environmental, Social & Tribal experts.
List of safeguard measures into the Draft Plan.
Implementation Disbursement of Compensation and Assistance as per the Rehabilitation Plan/Framework. Preference for jobs in the project as per RP. Training on agriculture and allied activities as a part of MPWSRP
EE, WRO, Other line agencies helped by the State / District Level Committee & Tribal expert
Measures undertaken as per Checklist suggested in Tribal Plan (Environmental, Social & Tribal experts)
Implementation of safeguards measures as per Tribal Development Plan proposals
EE, WRO helped by the Environmental, Social & Tribal experts
Measures undertaken as per Checklist suggested in Tribal Plan (Environmental, Social & Tribal experts)

A-297
Post Implementation Stage
Evaluation of the success of programs & safeguard measures undertaken
EE, WRO helped by the Environmental, Social & Tribal experts
(See Relevant Table for Impact Indicators)
Follow up activities based on lessons learnt
EE, WRO, Other line agencies helped by the Environmental, Social & Tribal experts
List of modified Programs implemented (Tribal Expert)
The following table lists the Impact Indicators to be monitored throughout the sub-project cycle to monitor and evaluate the impacts of the project.
Table7.10 Indicators for evaluation
Items Impact Indicators Frequency Agency
Economic Conditions
Income Project related & Independent means but assisted by the project Housing Changes in quality over a period of time Food Security Changes in occupation Skill portfolio Migration profile
Planning Stage, Post Implementation Stage
Independent agency/Internal monitoring by MDPU
Social Conditions
Representation in Community based institutions: Indicators of participation Empowerment, School enrolment, Health and morbidity Household infrastructure: electricity, potable water, living space etc.
Planning Stage Post Implementation Stage
Independent agency/Internal monitoring by MDPU
Displacement of Tribes
Given below are some key aspects to be considered for tribal groups affected by displacement. While addressing key issues pertaining to compensation to the PAPs or group belonging to a tribal community the following are to be considered: Their socio-economic characteristics, type of land, land ownership, dependence of tribal population on such lands, tenure rights and access to various categories of lands. The following are key aspects to be addressed during the finalization of entitlement framework:

A-298
• Land has to be looked upon not only as source of livelihood but also as inevitable nexus for tribal identity.
• Special prerogative and rights of tribal communities associated with territories inhabited by them has to be considered.
• Recording of community rights on land has to be ensured.
• Failure of record of rights over land under cultivation or any other usage has to be eradicated.
• Faulty recording of chief as owner of land when he only manages community land has to be replaced by community ownership.
• Recording of actual usage of land has to be ensured.
The mitigation measures suggested for the various impacts identified during to the project should be in accordance with the various constitutional and legal provisions. These should have to be duly incorporated in preparation of entitlement framework for the PAP from tribal communities. The following part gives the options for entitlement framework for tribal population. The following are the options for entitlement framework:
• Compensation for Loss of Land
• Compensation for Loss of structures and assets
• Compensation for Loss of Livelihood
• Compensation for Loss of common property resources
• Compensation for Loss of Grazing/camping/passage/minor forest produce
• Compensation for Clearance of Encroachers / Squatters
At the project planning stage, approval of selected projects, assessment of land requirement, ascertaining land ownership, identification of affected population, tenurial rights, etc. should be undertaken and approved by the Gram Panchayat. This should be compulsory for the final selection of projects and prior to preparation of the DPR. Suitable administrative framework consistent with traditional practices to safeguard traditions and customs of tribal communities to protect the tenurial rights and access to the MFP should also be complied with. This should be as per the conferring rights of the MFP on Panchayats or Gram Sabhas considered under PESA. Grievance redress should be in conformity with that proposed in the Resettlement Plan.
Institutional Arrangements
The WRO is the main responsible agency for identification of the impacted persons belonging to the indigenous groups. The WRO is accountable in terms of incorporating the existing traditional systems of these groups for the effective
A-299
implementation of the projects. Involvement of Panchayats becomes important for incorporating and management of the impacts within the existing Joint Forest Management (JFM), approaches of rural decentralization and development. The Panchayats should also be engaged in carrying out the surveys and consultations with the tribal people.
The Gram Panchayat at the grassroots level may take care of land acquisition following PESA Act. At the District Level, an Assistant Engineer may look into aspects of land acquisition. Introduction a Social Cell within the WRO structure will strengthen it in taking care of redressing grievances and mitigating negative social impacts caused by the project, especially on indigenous peoples. The Cell should have staff fully aware of provisions of IPDP, adequate understanding on norms and customs of and respect to the indigenous peoples. Implementation Strategy
The main guiding principle of the IPDP should be finalized to provide compensation mechanisms and measures required for the project. The Social Cell of the MDPU, WRO should appraise the plan and ensure proper implementation including grievance redressal. The MoU among all stakeholders before implementation should ensure that interests of the tribal population within the sub-project region are duly addressed.
Information pertaining to the schedule of the IPDP activities shall be provided to the community in advance, following Land Acquisition Act adopted by the State and the WRO. The rehabilitation measures shall continue during the construction stage. Some of the key aspects to be incorporated within the sub-project activities include:
• Building a knowledge base within the WRO to effectively plan for Tribal development
• Preparing a sound Monitoring and Evaluation Framework to assess the project impacts
• Training Programs for Tribals towards capacity enhancement and awareness building • Effective implementation of the identified safeguard measures.

A-300
ANNEXURE VII GENDER ISSUES
Introduction
Gender is one of the central determinants of differential access to, use of, and control over economically productive resources (land, labor, technology, capital, training, information). This in turn has implications on the productivity, flexibility, responsiveness and dynamism of the economy. The gender imbalance as regards access to and control of economically productive resources leads to a lower response to economic incentives than would be the case if these differentials were reduced. Women are excluded or benefited in a limited way, or some times even negatively impacted by projects. Past experiences have revealed that the magnitude of impacts of development projects is significant on women if simultaneous efforts are not undertaken to mainstream them into the project. Thus, there is an urgent need for providing social justice and welfare measures for reducing such impacts on probable project affected women.
Rationale for Gender Action Plan
Constitutional & Legal Provisions
The principle of gender equality is enshrined in the Indian Constitution in its Preamble, Fundamental Rights, Fundamental Duties and Directive Principles. Accordingly, the Constitution not only grants equality to women but also empowers the State to adopt measures of positive discrimination in favor of women. The National Commission for Women was set up by an Act of Parliament in 1990 to safeguard the rights and legal entitlement of women and the 73rd and 74th Amendments (1993) to the Constitution of India require seats to be reserved for women in local bodies at Panchayat and Municipal levels, thereby laying a strong foundation for their participation in decision making at the local levels. The National policy for the Empowerment of Women (2001) is intended to create a positive environment for the overall development of women.
In line with the National Policy, the GoTN too has formulated a Women’s Policy, which aims at ensuring visibility to women in all spheres by strengthening their role, increasing self-confidence and empowering them. The policy has identified 14 major areas and concerns and defines concrete actions to address the issues related to the empowerment of women.
Support for Gender Issues
Special measures should be undertaken for the upliftment of the women in each sub-project area. In all Sub-Projects, conscious efforts shall be made to include the following provisions:
• Provision of equal voting rights to wives of farmers entitled to vote for WUAs.

A-301
• Parallel WUA Committees (of women members only) to manage supportive agricultural activities like vermin-compost, canal management, rights to turf on canal and dam embankments, etc.
• Support to Self Help Groups engaged in dairy, food processing, etc.
• Empowering women for sustainable income generation on their own
• Creating alternative livelihoods for women has to be integrated with project formulation
• Creating facilities for financing of women entrepreneurs
• Trainings on alternative livelihoods to women
• Encourage provision of inheritance rights to women
• Social justice to oppressed women members of rural societies
• Social protection measures have to for vulnerable women of the rural societies
• Encouragement of Women’s participation in developmental process
Procedure for Preparation of Gender Action Plan
Involvement of women groups in identification of impacts and opportunities through sub-project activities shall from the basis for preparation gender sensitive sub-project activities. The procedure to be followed and Process and Outcome Indicators for constant monitoring are presented in the following table:
Table: Activities and Indicators for Inclusion of Gender Issues
Sub-Project Stage
Procedure Process & Outcome Indicators
Pre-Planning Identify Gender likely Issues of the project region through GIS database.
List of issues (Gender Expert, MDPU)
Organize women stakeholders meeting to sensitize and discuss the preliminary findings
Number of consultations (Gender Expert, MDPU)
Identify key areas of constraints that may be improved through the project such as access to Food, Water, Fuel wood, Fodder, Physical & Social Infrastructure, Decision Making Bodies, etc.
Number of consultations & signed minutes (Gender Expert, MDPU)
Incorporate and highlight the issues in the Screening Formats SC1 & SC2
List of issues mentioned (Gender Expert, MDPU)
Planning Joint Walkthrough (if possible), Consultations and PRA exercises with
List of issues identified on sub-project map and their

A-302
women groups to identify possible impacts and opportunities for preparation of Sub-Project Gender Action Plan
inclusion in Sub-Project Gender Action Plan (Gender Expert, MDPU)
Consultations for fine tuning the proposals of Sub-Project Gender Action Plan
Number of meetings & signed minutes (Gender Expert, MDPU)
Implementation Implementation of safeguard measures and grievance redress mechanism on compensation, assistance and training, etc. of Project Affected Women Headed Households
Measures undertaken as per Checklist to be prepared under in the Sub-Project Gender Action Plan. (Gender Expert, MDPU)
Post Implementation
Implementation of Awareness Building, Training, Assistance in availing Credit facilities, etc. to create an enabling environment of equal opportunities to women
See Table 7.3 for Impact indicators
Table: Impact Indicators of Post Implementation Stage
Items Impact Indicators Frequency Agency Economic Conditions
Income Project related & Independent means but assisted by the project Housing Changes in quality over a period of time Food Security Changes in occupation Skill portfolio Migration profile Wages obtained
Planning Stage Post Implementation Stage
Independent agency/Internal monitoring by MDPU
Social Conditions
Representation in Community based institutions Indicators of participation Empowerment School enrolment Health and morbidity Household infrastructure electricity, potable water, living space, etc.
Planning Stage Post Implementation Stage
Independent agency/Internal monitoring by MDPU
Implementation Strategy
The implementation and monitoring mechanism should be designed to look into the benefit of women stakeholders through the following measures:
• Stakeholders’ consultation process has to be opted for all the stages of planning and implementation of the projects under consideration where women as an important stakeholder group should be consulted for finalizing strategies for their welfare.

A-303
• All the strategies related to gender development actions for the water resources projects are vested with the MDPU (WRO). This should be carried out in consultation and support from the concerned line departments. The project authorities should constitute Social Cells with gender experts within the department for timely preparation and effective implementation of the gender action programmes.
• Basic responsibility of gender development actions for the water resources projects is vested with the MDPU (WRO). This should be carried out in consultation and support from the concerned line departments. The project authorities should constitute Social Cells for timely preparation and effective implementation of the gender action programmes.
• Activities under gender action programme should necessarily have effective participation, cooperation and involvement of most of the basin level and project level officials to prepare and execute suitable action plans. In case of any grievances regarding the gender action plan the project-affected women may approach the Social Cell that will be established at the basin and head office of the WRO
• It is proposed that Gender Experts be nominated at the level of CE in all the project basins.
Development of Consultative Strategies
Introduction
Purpose of consultation is to increase participation in the project, especially of those who have not been traditionally excluded an active role. Women and vulnerable persons and families have to participate more effectively. Consequently, there would be higher participation of women and decreased gender disparity with respect to access, usage and fulfillment derived from water Increased participation would also help reduce poverty. Participation would generate awareness, enhance knowledge and allow for better income generating practices. Reorganized water sector would directly impact agricultural productivity that can be optimized by participative processes.
Purpose of participation is to increase productivity of water. Insufficient availability of water is only a part of the water problem. Water productivity does not stop at storage or conservation; it extends to its effective utilization. The utilization can be made more efficient by combining efforts of all those using or managing water. The conclave is fairly encompassing and includes a number of stakeholders. These stakeholders should be consulted to improve efficiency of usage and productivity.
Target Participants
Consultations should be held at different levels, starting from the community to key programme functionaries. Intermediary level would be Members of Water Users' Associations, NGOs, and elected representatives, especially those belonging to the Panchayati Raj Institutions, among others.

A-304
Time of Consultations
Consultations should be carried out at all stages of the project life cycle.
Process of Consultations
The process of consultations should be kept very simple and largely informal. The consultations should always be a two-way process between facilitators and the constituents of the consultative groups. The facilitators and the group members should not be pitched against each other and also not for cross purposes. Consultations should be carried out in a congenial environment at a venue, which is amenable to the participants. It is important to ensure that group composition is as per the purpose of consultations. For instance, an all male group is hardly likely to throw sufficient light on gender Issues or only-women group may not be able to come up with final solutions on water usage tariff. There is a need to debate the purpose of consultation before forming the group. These pre-consultative discussions should be carried out with key-informants of the area. It is important to familiarize with the group before the consultations. Usage of local language and phrases is highly recommended All group consultation facilitators must undergo training prior to initiating the process Consultations need to be recorded faithfully and analyzed without prejudices.
Forms of Consultations
There could be several forms that a consultation could take. The forms of consultations are tied to the purpose. Some possible examples are given in the following table.
Table: Consultative Type and Purpose
Consultation type Purpose Meetings (general , special) Information generation or
dissemination Group discussions/Focus group discussions
To arrive at consensus or debate merits of issues in a focused manner
In – depth interviews To prove concepts
Principles of Consultations
Consultations are norms of participatory management tools but it is essential to base project related consultations on some principles. Consultations for TN-IAM WARM was based on principles mentioned here and are proposed that these principles should serve as thumb rules for later phases of the project too.
• Water has infinite value (but finite potential/usage?)
• Women/Gender

A-305
• Poverty
Phase Wise Need of Consultations
The project life cycle has been divided several phases for effective management. Briefly the need for consultations through the phases is outlined here.
Preplanning Stage
The foremost requirement of this stage is Disclosure of Project Interventions to all concerned stakeholders in the sub-project area. This phase is for identification and prioritisation of the projects. Consultations here would be largely with the community and WUA to identify needs and concerns to identify appropriate projects and assign priorities. These consultations would be more to establish demand rather than what can be provided. Some official consultations could also be carried out to provide feedback from the community and also to fix priorities.
The foremost requirement of this stage is Disclosure of Project Interventions to all concerned stakeholders in the sub-project area.
Planning and Design Stage
It is necessary to develop a stakeholders' participation plan, eventually leading to consultations at this stage would be to develop physical plan for proposed projects. Some consultations here would be carried with the community but most should be with WUA, DC and PCs. If the project is to become more participatory then it is necessary to carry out extensive consultations during this phase. The design phase would require technical inputs and thus primary consultations would be with project functionaries and design consultants. However, here also people should be a part of the consultations as the project is going to affect them. Some situation requiring extensive consultations with the people would include: preparation of Dam Safety Plan, Pest Management Plan, Cultural Property Management plan, Resettlement Policy framework. Tribal Development Strategy & Action Plan and Gender Action Plan.
The foremost requirement of this stage is to undertake a Joint Walk through with all concerned stakeholders in the sub-project area.
Implementation and Operational Stages
At the implementation phase, primary tasks would be rehabilitation of structures and strengthening of structures. There would be a need to enhance stakeholders' involvement during these processes. This phase would ensure maximized participation of all stakeholders. Consequently, at the operational stages, participation would ensure improved project performance and equitable distribution of project benefits. Regular consultations would decrease possibilities of conflicts.
Post Implementation Stage
Once the project has been implemented and peoples' demands have been factored

A-306
in, occasional consultations would provide constant feedback as a project monitoring tool. There is need for consultations as a tool of agriculture extension. Consultations would help in agricultural diversification. A community monitoring system should be developed and implemented.
Village Immersions (an overnight stay in sub- project villages) to adequately record the success and shortfalls of the project should be undertaken as a lesson learning exercise.

A-307
ANNEXURE IX INSTITUTIONS WORKING ON WATER RELATED
ISSUES IN TAMIL NADU
Roles and Responsibilities of government organizations involved in utilization / management of Water Resources in Tamil Nadu
Table: Roles and Responsibilities of Government Organizations
Agency / Department Roles and Functions
WRO – PWD Water Resources Organization is in charge
of the water bodies, its maintenance and operation and regulation mainly on irrigation
Agricultural Engineering Department (AED)
It is responsible for Command Area on farm development activities including establishing Farmers’ Organizations, Catchment (water shed) Stabilization and Soil Conservation
Tamil Nadu Water Supply and Drainage Board
It is responsible for developing and implementing programmes for drinking water supplies and drainage facilities throughout Tamil Nadu except Chennai
Electricity Board It is responsible for developing
hydroelectric and other electric power and providing it to users
Pollution Control Board It is responsible for prevention and control
of water pollution and for restoring water quality to desirable levels
Agricultural Department It provides extension services to farmers,
soil testing, input on supply of seeds, fertilizers, pesticides and agricultural research
Revenue Department It collects levy and water charges from
farmers. The Collectors coordinate closely with PWD with respect to water deliveries
Forest Department Responsible for protection of forest and enhancing the watershed
Department of Municipal Administration
Look after supply of drinking water to several municipalities and provision of sewerage facilities. It also provides for sinking bore wells and maintenance of all systems
Rural Development Department
Responsible for some tanks having a command area of less than 100 acres, related to irrigation only
Chennai Metropolitan Water Supply and Sewerage Board
Responsible for planned development and operation and maintenance of water supply and sewerage systems for the city of Chennai. It also prepares long term plans to meet future water supply and sewerage disposal needs

A-308
Transport Department Takes care of transport facilities, mainly road transport and other inland water transport
Industries Department Takes care of development activity in the field of Industry and also increases the marketing facilities of the market produced
Fisheries Department
The activities involved exploration and exploitation of marine resources, inland and brackish water fish and fish production. Activities also cover preservation of fish produced, export and extension and education of fishermen community
Tourism Department Takes care of improving tourism facilities and development of Tourist Centers
Director of Animal Husbandry Looks after the Welfare of animals
Department of Environment Deals with the Environmental Management issues concerning the State
List of Universities/Educational Institutions
Alagappa Chettiar College of Engineering and Technology
Madural Kamaraj University
Anna Institute of Management, Chennai Madural Kamaraj University : Directorate of Distance Distance Education
Anna University Manonmaniam Sundaranar University
Annamalai University National Institute of Technology, Tiruchirappalli (Formerly REC, Trichy)
Bharathiar University Online Courses of Animal Sciences Academy
Bharathidasan Institute of Management Periyar University
Bharathidasan University Sarasvati Mahal Library, Thanjavur
Connemara Public Library Stanley Medical College
Dr. MGR Medical University Tamil Nadu Agricultural University
Gandhigram Rural Institute (Deemed University)
Tamil Nadu Dr. Ambedkar Law University
Indian Institute of Technology, Chennai (IIT, Madras)
Tamil Nadu Open University (TNOU)
Institute of Child Health and Hospital for Children
Tamil Nadu Science City
Institute of Community Medicine, Madras Medical College
Tamil Virtual University (TVU)

A-309
Institute of Mathematical Sciences, Chennai
University of Madras
Madras Medical College (MMC) Universities in TN
Madras Institute of Development Studies Veterinary & Animal Sciences University
List of NGOs
Thiruvallur 1 Integrated Rural Community
Development Society (IRCDS) Post Box No . 7 44/11, Thanthai Periyar Road, Rajajipuram Pin - 602 001
2 Integrated Women Development Institute (IWDI) 14/57, Thiru Nagar Villivakkam Pin - 600 049 6280970/6190489
3 Rural Institute Of Community
Education Trust 31, Mettu Street Periya Kuppam Thiruvallur - 602 001
4 Thirupani Trust Associaton No. 13-43/440, Cholan Street New Rajaji Puram, Periya Kuppam Thiruvallur - 602 001 04116-64416
Vellore 5 Village Education And
Development Society (VEDS) 7 B Pillaiyar Kovil Street, Sankaranpalayam, Vellore North Arcot – 632 001 Phone No- 0416-227102
6 Exnora Green Cross, 1/15 Keseav Pillai Street, I Cross, Dkm College Road, Vellore – 632001 Phone No. 0416-2263500 Web :- www.exnora.org Email. [email protected]
7 Centre For Environment
Friendly Technologies 8, Maligai Kandappa Chetty Street Ambur Pin - 635 802 04174-47962
8 Centre For Rural Education And Economic Development For Oppressed Mass Trust (CREEDM) 15/19, Shivsakthi Nagar Pudupet Road, Tirupattur Post Pin - 635 601 04179-21307

A-310
9 Gandhian Guild For Rural Education Employment And Nature (GREEN) Trust 9, Kangeyanellore Road Municipal Colony, Gandhi Nagar Pin - 632 006 0416-246838
10 Guru Samrat Trust (GST) No.4, New Street Chenguttai Katpadi - 632 007 0416 - 242494, 244763
11 Integrated Human Development
Society (IHDS) No.141, Kilvadugunkuttai Karasamangalam, Latteri, 0416 – 212301
12 Integrated Rural Development Society (IRDS) No.2, Tiruppur Kumaran Street Selavanpet 0416- 227019
13 Tribal Rural Urban Service
Society (TRUSS) 79, S.R.P. Nagar Karai Village And Post, Ranipet Via Pin - 632 404 04172-23174
14 Trust In The Area Of Social Activities No. 1, Polachi Amman Koil Ii Street Arakkonam Pin - 631 001 04177-30150
15 Victory Youth Association -
Vicya No. 8/1, Kanagadurgai Amman Koil Street Palanipet, Arakonam Pin - 631 002 04177-24346
16 Women's Awareness And Rural Development (Ward) Chinnapalampakkam Vellore Pin - 632 113 04173 – 41507
17 Women's Welfare Association For Rural Development Near Udayam Weigh Bridge, Anna Nagar Salem Road, Tirupattur Pin - 635 601
18 Radhakrishan Educational Fountion Trust 4/ 56 Vadokankuti Anna Nagar Archamagalam Post, Lithari-632202. 245354 / 245142
19 Neru Youth Welfare
Association Srigaravel Manikagar Street Viruthapitu Post – 632006. 16 Tribal Rural Arabian Severe Society 79, S.R.P,Kari Post, Via Ranipati-6032404.

A-311
Chennai 20 Aquaculture Foundation Of
India, Old No- 4, New No-40, Kapaleeswarar Nagar, Neelankarai, Chennai – 41 URL: www.Aquaculturefoundation.In
21 Eco Science Research Foundation, 98, Baaz Nagar, 3/621 East Coast Road, Chennai- 600 041 URL: www.Erfindia.Org
22 Madras Naturalist Society, No-8, Janaki Aveneue, Abirampuram, Chennai – 600 018 URL: www.Blackbuck.Org
23 Worldwide Fund For Nature India 123/5, New No.297, I St Floor, T.T.K. Road, Alwarpet, Chennai – 600 018 Phone No-044-24997107 Email: [email protected]
24 Trust For Restoration Of
Ecology And Environment 12, First Cross Street, V.P.Colony, Chennai – 600 023 Phone No – 044-24721444
25 Ryuan Foundation International (RYFO), 8, West Mada Street, Srinagar Colony, Chennai – 600 015 Phone No: 044-2351993 Email: [email protected]
26 National Water Harvesters
Network Tn Unit, 162 B, Greams Lane, Thousand Lights, Chennai -06 Phone No: 044-28290038 Email: [email protected]
27 Madras Naturalists Society (MNS) 8, Janaki Avenue, Abhiramapuram, Chennai – 600 015 Phone: 044-24347943
28 Group For Nature Preservation
And Education (GNAPE) New No.30, Block Ii Gandhi Mandapam Road, Kotturpuram, Chennai – 600 085 Phone No: 044-52016406 URL: www.Gnape.Org,
29 Citizen, Consumer And Civic Action Group (CAG) 6, Ii Cross Street, Karpagam Gardens, Adayar, Chennai – 600 020 Phone No- 044-24914358 Email: [email protected]
A-312
30 Toxics Links 8, Fourth Street, Venkateshwara Nagar, Adayar, Chennai – 600 020 URL: www. Toxicslink.Org
31 Centre For Indian Knowledge Systems, 30, Gandhi Mandapam Road, Kotturpuram Chennai – 600085 Phone No: 044- 24471085, 24475862 URL: www.cliks.org,
32 Madras Crocodile Bank Trust,
Post Bag No – 4, Mamallapuram – 633 104 Phone No: 04114-272958 URL: www.Madrascrocodilebank.Org
33 The Centre For Research On New International Economic Order, (CRENIEO), Muthukadu, Mahabalipuram, Chennai Email: [email protected]
34 Amm Murugappa Chettiyar
Research Centre, Tharamani, Chennai – 600 113 Phone No. 044-22430937 URL: www.amm.org
35 C.P.R. Environmental Education Centre, No. 1 Eldams Road, Alwarpet, Chennai – 600 018 Phone No: 044 – 24320756 URL: [email protected]
36 Green Peace
New No.47, 2nd Cross Street, Ellaiyamman Colony, Gopalapuram, Chennai – 600086 URL: www.Greenpeace.Org
37 Centre For Action Research On Environment, Science And Society - CARESS 160, Sivananda Road Gill Nagar Ext 2, Choolaimedu Chennai - 600 094 Phone No: 4727691, 4725870
38 Centre For Women's
Development And Research 5/359, Annai Indira Nagar Okkiyampet Thuraipakkam, Chennai - 600 096 Phone: 4482821,4963621
39 Ramanujam Foundation For Agriculture And Human Potential Development 8/4, I St Cross Street Logiah Colony, Saligramam Chennai - 600 093
40 M S Swaminathan Research
And Foundation 3rd Cross Street Tharamani Industrial Area Chennai -600 013 Phone. No.044-22541229,22541698, URL: www.mssrf.org
41 Society For Social Forest Research 9,East Bogar Road T.Nagar Chennai –17. 4343092.
A-313
42 Chennai Eco Club(CEC) 57,4th Street,Pathbanaba Nagar. Adyar, Chennai – 600020. Fax :4864095 / 4865938 Email: [email protected]
43 Pasumai Thaayagam Pasumai Thaayam, No: 9, Lathawood Anenue, Mahalingapuram, Chennai – 34.
Kanchipuram 44 Madras Crocodile Bank Trust,
Post Bag No – 4, Mamallapuram – 633 104 Phone No: - 04114-272958 Web: - www.Madrascrocodilebank.org, Email: - [email protected]
45 Humanitarian Organisation For Rural Development 6, G.S.T. Road, 1st Floor Madurantakam Pin - 603 306 04115-52835,52319
46 K-Nelvoy Womens
Development Society (KNWDS) Mudugarai Village New Mampakkam Post Madurantakam Taluk - 603 306
47 Rural Education Development Society (REDS) 1a, Brahmin Street Old Mampakkam Post Madurantakam Taluk - 603 306
48 The Rural Development Project
Post Bag. 3, Koman Nagar 46, Thaiyur Post Pin - 603 103
49 ‘C Aims’ 3,West Mada Street, Acharapakkam 603301. 04115-22019.
50 Rural Education And Economic Development Society (REDS) 16,Selvavinagar Temple Street, Mathuratham –603306.
51 Social Education Development Society (SETS) 56,La.Endathure. Post, Vuithramalur Via 603406.
Dharmapuri 52 Rural And Environemnt
Development Centre, 280, New Oddapatty Quarters, Valluvar Nagar, Collectorate Post, Dharmapuri – 636 705 Phone No – 04342-284868 EMAIL- [email protected]
53 Bommanur Society For Village Development Bommanur Post Palacode Taluk Pin - 636 805 Phone 04348 – 38288

A-314
54 Dharmapuri Rural Management And Advancement Society (DHARMAAS) No.H.11 Tnhb Colony Eranahalli Post Palacode - 636 808
55 Rural And Environment Development Centre ( REDC) 280, New Oddappatty Quarters Valluvar Nagar Pin - 636 705
56 Social Transformation
Economic Progress Society (STEPS) Nadupatty Village And Post Mathur(Via) Potchampalli Taluk - 635 203
57 Rural And Environmental Development Center 280,Puduothampati Quarters Vailvarnagar Dharmapuri – 636705. 04342- 30868 Fax : 04342- 61240
58 Thehamallai Environmental
Awareness Moment 5/96 Nellinagar, Pedamanarri Dharmapuri – 636703. 04342-63573, Fax : 04342-60459 pp
Salem
59 Social Education And Environmental Development, 101-A/10, Kalimammanpandel St, Annathanapatty, Salem – 636 002
60 Bureau Of Rural Environmental And Development Service Thumbal Post Attur Taluk Pin - 636 114
61 Karippatty Rural Organisation
for Peoples Education A.N. Mangalam Post Karippatty Via Pin - 636 106
62 Omalur Block Women Welfare And Uplift Organisation 11/9, Telephone Exchange Road Omalur Post Pin - 636 455 04290-20509
63 Poolavari Agaraharam Mahalir
Sangam Poolavari Post Pin - 636 010 0427-872253
64 Rural Education And Development Project (Read Project) 20, Opp Chitra Theatre Lane Attur Post, Pin - 636 141 04282-42847

A-315
65 Social Education And Environmental Development 10/4/10-Kaliamman Pandal Street Annathanapatty Pin - 636 002
66 Society For Development Of The Oppressed (Sdo) 40, Avaiyar Street Mullaivadi, Attur Taluk - 636 141
67 Society For Ecological
Development Nalukkalpalam Sakkarachesttypatty Post, Omalur Taluk Pin - 636 05
Erode
68 Agitation Committee Air And Water Pollution Vellankadu Post Thindal, Erode – 638 009 Phone No: - 0424-76246
69 Peoples Society For Rural Education And Environmental Development (PSREED) 1/24, North Street Gobipalayam, Alukuli Post Gobichettypalyam Taluk - 638 453 04285-54754
70 Swami Vivekananda Sevashram
(SVS) Kanakkampalayam Kallipatty Via Pin - 638 505. 04285-63431
71 Human Integrated Life And Learning Kadampur Post 638503 Sathiyamangalam Taluk
72 Sugam Gramiya Valrchi
Niruvanam Kadampur Post- 638503 Sathiyamangalam Taluk
73 Centre For Education And Environmental Development Puthovatalli Post Sathiyamangalam Via – 638401
74 Agar Social Service Centre
109, N G O Colony Tharapuram-638666 Phone:04258-20541
75 Womens Organisation In Rural Development 442, Thiruchengodu Road Pallipalayam, Erode-638006 Phone: 04288-40212
76 Rural Educational And
Environment Development Service Plot No 10 Sivasakathi Nagar, Tharapuram-638657, Phone 04258-24479
77 Rajendra Foundation For Agricultural Research And Rural Development Kasarimangalam Post Chitthur-638302 Phone:04256-39258

A-316
78 Environmental Production Centre Shikayanagar College Erode Phone: 0424-222271, 21348
Nilgiris
79 Save Nilgiris Society, Nilgiri Centre, Ootocamund, Nilgiris – 0423-442530 EMAIL – [email protected]
80 Nilgiri Wildlife And Environment Association , C/o District Forest Officer, Nilgiris North Division, Mount Stewart Hill, Ootacamund – 643 001 EMAIL – [email protected]
81 Keystone Foundation,
Kotagiri – 646 217 Phone – 04266-272277,2722977 Web : - www.keystone-foundation.org, Email:- [email protected]
82 Malayaha Makkal Maruvazhvu Manram No:14-56, Club Road Kotagiri Pin - 643 217
83 Network Of Education
Environment Development Society - NEEDS 23, Sterling Road Bishop Town, Ooty Pin - 643 001
84 Rural Development Society Nallakotta, 643225 Phone: 68217
85 Village Development Centre
Gramiya Bhavan Aruvangadu-643202 Nilgris 96285 12800 [email protected]
86 Gris Wild Life Environment Association District Forest Officer Mounts Start Hill Uthagamandalam
87 Rajendra Foundation For
Agriculture Research Rural Development Chettair-638302 Kesimangalam Post, Bhavani Taluk

A-317
Namakkal
88 India Vision Charitable Trust, Punjaipudhupalayam, Koothampoondi Post, Thiruchengode Tk, Namakkal – 637 202 Phone No – 04288-230833 Email – [email protected]
89 Foundation For Health Education And Economic Development - HEED 30, Subramaniapuram Mohanur Pin - 637 015 Off: 04286-55303 Res.: 04286-55603
90 Human Mirror Trust
Thuraiyur Main Road Alanganatham Village And Post Pin - 637 061 04286-20594,21309
91 Mahathma Gandhi Elainger Narpani Mandram 1a, Muniyan Shandu Rasipuram Taluk Pin - 637 408 04287-20895
92 Scientific Education And Art
Development Society 2/4, Selliyaee Palayam Village Oduvankurichi Post, Rasipuram Taluk Pin - 637 406
93 Women's Organisation For Rural Development (Word) Post Bag No. 1 Pandamangalam, P.Velur Taluk Pin - 637 208 7 Meras Poinusawmy Illam, West Kalvai Vatapari,Kumarpaliam
94 Women’s Village Deveploment
Organisation (World) Post Box No:1, Padamagalam, 637208. 04268 – 22960.
95 Rotary Community Caries For Environment 32 –L –2 ,V.K.S Complex , 2nd Mokanular Road , Namakal – 637002. 04286 – 26007
96 Womens Organisation In Rural
Development, 442, Tiruchengode Road, Pallipalayam, Namakal – 638 006 Phone No= 04288-240212
Ariyalur
97 Gandhi Gramodhaya Society Velayuthanagar, Jayankondam (Post) Pin - 621 802 04331 – 50183
98 Rural Education And Action Development - READ 1926, 8/58, Sakthi Vinayagar Street Viilandai- Andimadam Pin - 621 801 04331-42583, 42483
A-318
Nagapattinam 99 Nehru Social Education Centre
Ayakkaranpulam - 2 Sethi (P.O.) Pin - 614 707 04369-74431
100 Tamil Nadu Dalit Educational Development Trust (TANDET) Patthar Building Manalmedu & Post, Mayiladuthurai Taluk Pin - 609 202
101 Women's Association For Rural
Development No.39, Keelavadambokki Street(Upstair) Kilvelur Taluk Kilvelur - 611 104
Coimbatore
102 Zoo Outreach Organisation, 79, Bharathi Colony, Peelamedu, Coimbatore – 0422-2573629
103 Annamalai Environmental Society 15, Udumalai Road, Pollachi, Coimbatore – 642 001 Phone No- 04259-28872 Email- [email protected]
104 Salim Ali Centre For
Ornithology And Natural History, Anaikatty P.O, Coimbatore – 641 108 Phone No.0422-2657102, 2657088 URL: www.saconindia.org
105 Siruthuli, Iii Floor, Raheja Apartments, Avinashi Road, Coimbatore – 641018 URL: www.siruthuli.org
106 Centre For Environment
Education , Tamil Nadu State Office, 734, Presidents Hall, Avinashi Road, Coimbatore – 641018 Phone: 0422-2215885 URL: www.ceeindia.org
107 People's Education For Development Organisation (PEDO) 188, Elango Street, A.N. Palayam Kaniyur, Udumalapet Taluk Coimbatore - 642 203
108 Rural Health and Environment
Development Trust (RHEDT) 25, Main Vilas Street Karamadaai, Coimbatore - 641 104
109 Non Conventional Energy And Rural Development 78 A Cithi Vinagar Colony Vadavalli Coimbatore 641041

A-319
110 Nature Conservation
Foundation Field, Ropeway, Valparai – 642 127 Web:- www.ncf-foundation.org email:- [email protected]
111 Centre Of Environment Education 9 Valipalayam 2 Nd Street Thirupur-641602 Phone 702276 Fax: 01-0421-743543
112 Tamil Nadu Green Centre
5/1/338 Main Road Mettupalayam-641301 Phone 04254- 22166, 04266- 72247 E-Mail: [email protected]
113 Mettupalayam Wildlife Preservation Society 250, Main Road, Metuupalayam – 641 301
114 Wildlife Preservation Society
(WPS), 65, Velankani Temple, Opp. Petrol Bank, Karamadai Road, Mettupalayam – 641 301
Karur
115 Inba Seva Sanga, P.O Sevapur, Tharangampatti, Karur – 621 311
116 Gramium 38, M.B.S. Agraharam Gopal Mahal (Near) Kulithalai - 639 104 04323-22842,23709
117 Snekithi
V. Puthur,Sathiyamangalam Post Kulithalai Taluk Pin - 639 120 04323-45620
118 Social Welfare Organisation of Rural Development (SWORD) 13/25, South Street Mylampatty Post Kulithalai Taluk - 621 301 04551-73490
119 Society for Community
Organisation and Rural Education - SCORE Kosur Post Thogamalai Via Pin - 621 313 04323-52482
120 Society For Education And Environment Development - SEED Puthur Village And Post Thogamalai Via Pin - 621 313

A-320
121 Society For Education And Peoples Action For Development (SEPAD) Panchayat Union Office Road K.Paramathy Pin - 639 111 04324 - 383388
122 Society For Women Action And Rural Development (SWARD) Mahadanapuram Post Pin - 639 106 04323-42616
123 Village Improvement
Association (VIA) Post Box No. 14 Kulithalai Pin - 639 104
124 Village People's Education For Rural Development Association - VPERDA 16/A/2 East Mudaliyar Street Kadambarkovil, Kulithalai Pin - 639 104 04323-24739
125 Society For Community
Organisation And Rural Education Thondaman Sinam Post Thogaimalai Via-621313
126 Inba Seva Sangam Annai Genetic Garden Savapur Post Karur-621311 Phone: 04332- 79228, 79227, 79229
Thiruvarur
127 National Mother And Child Welfare Organisation 142/27, South Street Tiruturaipoondi Pin - 614 713 04369-20409
128 Pirabavathi Jeyapprakash Narayanan Women Welfare And Development Association (PIRAJEWEDA) Kudoor, Mangudi Post Tiruvarur Taluk Pin - 610 103
129 Society For Community
Organisation And Rural Development Alangottai Post Mannargudi Taluk Pin - 614 018 4367-70420
130 Jawarhalal Rural Centre For Economic Development Social Change Mettupalayam Post-614715 Phone: 04369-32423 Thanjavur
131 Rural Development Federation
(RDF), 1/52, South Street, Thirunageswaram, Thanjavur – 612 204 Phone No – 0435 -60352
132 Centre For Ecology And Research 538, Ranivaikkal Street, Thanjavur – 613009

A-321
133 Centre For Ecology And Research No.538, Ranivaikkal Street Pin - 613 009 04362 – 50410
134 Chackratees Educational Society 53, Attumanthai Anjalkara Street East Gate Pin - 613 001
135 Earth
4/108, Main Road Thippirajapuram, Kumbakonam Pin - 612 402
136 Guild For Integrated Development Education (GUIDE) 158, Parvathi Nagar Nanchikkottai Road Nanchikkottai Post
137 Margarat Social Development
Society 1345/4, New Vanakkara Street Manampuchavadi Pin - 613 001
138 Rural Institute For Community Health Trust (Rich Trust) Post Bog No.1, Pandanallur, Thiruvidaimaruthur (Tk) Pin - 609 807 0435-50781
139 Centre For Ecology And
Research 538, Rani Vaikkal St Thanjore-613001 Phone: 04362-21410, Fax: 40459, Email richisoft@gemini
Theni District
140 Vidiyal Kariyappan Post, Theni – 625 528 Phone No.04546-229215 Email. [email protected]
141 Thiyana Malai Trust 3/66 Devidrapuram Keezha Vadakarai Periyakulam-625601 Theni District
142 Society for Rural Development
and Protection Of Environment (SRDPE), 1588, periyakulam road, allinagaram, Theni – 625 531 phone no- 04546-74973 email- [email protected]
143 Association for Needy Growth and Environmental Liberation - ANGEL 8-7/16a, Agraharam Street Aundipatty Pin - 625 512 04546-42738

A-322
144 Community Development Centre (C.D.C.) Near Primary Health Centre Devadanapatti Pin - 625 602. 0456-35269
145 Kamala Nehru Mahalir Mandram Anaaimaalaianpatti Post Pin - 625 526
146 Literates Welfare Association
(Law) Main Road Kadamalaikundu Post Aundipatti Taluk - 625 579 04554-27324
147 Rural Education Environment Awareness and Development Society 5-3/5, Kumarapuram 2nd Street Aundipatty Pin - 625 512 04546-43948
148 Vidiyal (Centre For Social
Interaction) Kariyappanpatti Rasingapuram Post Pin - 625 58
149 Vinoba Rural Development Sevalaya - Vrds Karkkayankottai Chinnamanur Via Pin - 625 552
150 Ganthi Sava Samithi
19 B Rathakrishnan Ricemil St Cinnamannur-625515
151 Vaigai Natural Centre V. Nee. Govt. Hr. School Periyakulam-625601 Phone: 32968
152 Dhanam Trust
82 V O C Nagar Cinnamanur-625515 Phone: 04554-47497
Madurai
153 Sustainable Agriculture And Environemental Voluntary Action 43, T.P.M. Nagar, Virattipathu, Madurai – 625 010 Phone No- 0452-604082
154 Institute Of Environmental Education M-329 Ropw Type, Ellis Nagar, Madurai – 625 010
155 Environemnt Production And
Improvement Council (EPIC), Anbu Manai, Dr. Radhakrishnan Street, Bibikulam, Madurai – 625 002 Phone No- 0452-531545
156 Seva (Sustainable Agriculture and Environmental Voluntary Action ) 45, T. P.M. Nagar, Virattipathu, Madurai – 625 010. Phone No – 0452-2380082 Web : - www.seva-ngo.org, Email:- [email protected]

A-323
157 Development Of Humane Action Foundation, 18, Pilayar Kovil Street, S.S. Colony, Madurai – 625 016 Phone.No. 0452-2610794, 2610805 Web. www.dhan.org Email. [email protected]
158 Annai Mary Foundation - AMF A. Vethamuthu Illam Bharathi Nagar Pin - 625 018, Phone No- 69115
159 Association For
Gramarajyam and Rural Integrated Development - AGRID "Sarvodaya Illam", M.P. Nagar Vadipatti Taluk Pin - 625 218, Phone No-04543-54343
160 Centre For Rural Education And Development 3-1-309, Main Road T. Vadipatty Pin - 625 218 , 04543-54453
161 Institute Of Environmental
Education M-329, Row Type Ellis Nagar Madurai - 625 010 0452 – 608558
162 Integrated Rural People Development Society 23, Jj Street Thiruppalai Post Pin - 625 014
163 Madurai Institute Of Peace
Science Gandhi Museum Pin - 625 020 91-452-530291
164 National Institute Of Women Child and Rural Health Trust 1, North Street Mudhichiyam Pin - 625 020 0452-520821
165 Organisation For Rural
Development - ORD 5/22, Puliyagoundampatty Karumathur Post, Thirumangalam Taluk Pin - 625 514 20952 Pp
166 People Association For Growth And Education - Page No. 9, Sahayamatha Street Gnanaoliviipuram Pin - 625 016 0452-608805
167 People's Association For Rural
Women Development Trust (PARWD) Valayankulam (Village & Post) Via Postal Training Centre Pin - 625 022 0452-601713
168 People's Organisation For Rural Health, Education And Economic Development (PREED) 5/165, Gandhi Nagar Kappalur Post Pin - 625 008 04549-24365
A-324
169 Power Project 7-1-59, Kallar Street Cholavandan Pin - 625 214 04543-59236
170 Recard Society Gsms Illam, 33/50a21, Ochathevar Street Keelapudur, Usilampatti Pin - 625 532 04543-27409
171 Reform Trust
Oviya Campus Keeripatti, Usilampatti Taluk Pin - 625 532, Ph: 04552-41156
172 Rural Action for Cooperation and Economic Development Trust - Race Trust Valanadu Kaikatti, Pirampatti Post Kovilpatti Via, Manaparai Taluk Pin - 621 305, Ph: 04332-74330
173 Rural Development Society
6/126, Main Road, Kalligudi Post Tirumangalam Pin - 625 701
174 Rural Development Trust Plot No. 3/379a, Muneeswaran Nagar Thiruppalai Post Pin - 625 014, 682882
175 Shepherd (Society For Human
Equality People's Health Education And Rural Development) 97, Ayynar Colony Thanakkankulam Post Pin - 625 006 0452-882438,98431-12453
176 Social Development And Peace Trust - SDPT Vellaimalaipatti, Uthappanayakkanur Post Usilampatti Taluk Pin - 625 537
177 Society For Training, Education
And Motivation - Stream Sadiyandi Mooper Street Kallikudi Road, T. Kalluppatty Pin - 625 702
178 Society For Women's Education Economic Development 328-B, Pandian Nagar Melur Pin - 625 106, 0452 - 816294
179 Socio Economic And
Educational Trust - See Trust Post Box No. 8 Pin - 625 020 0452-538509
180 Socio Human Resource Development Centre 43, Nalliah Naicker Street Alanganallur Pin - 625 501
181 Voc Rural Development Centre
Katchaikatty Post Vadipatty Taluk Pin - 625 218 04543/54164
182 Women's Action For Rural Development - Ward 12, Nellaiappan Lane Tirumangalam Pin - 625 706 04549-20038/21219

A-325
183 Women's Emancipation And Development Trust Gandhinagar Usilampatti (Tk) Chellampatti - 625 566
184 Mother Thersa Jeen Rural Women Development Association Selva Vinayagam Kovil St Parasana Colony Avinapuram Madurai-625012
185 Sool Nilai Eyal Kulu
O G P M Girls Hr. Sec. School Thallakulam Madurai-625002 Phone 530031
186 Institute of Environmental Education M 329 Row Type Ellis Nagar Madurai-625010 Phone: 0452-608558
187 Mma Pengal Munatra Sangam
8/73 P G S M Avenue Solavanthan Main Road Thengalpatti-625514
188 Rural Education and Comprehensive Activities For Rural Devlopment Oothadevar Vedi Killaputhor Uchilampatti-626532
189 The Govanet Centre for
Development 2/43 Kottai St Nagamalai Puthokottai Madurai-625019 Phone 0452-85457
190 Sugam Social Service A Thotiyapatti Thi Puthupatti Post Madurai District-655704
191 Sathana Vigas
Kattachananthal Kathakinaru Oët Madurai-625107 Phone:0452-822846 Fax 0452 531451
192 Sarvathiya Trust 52 Rajive Steet Muniswara Nagar Thirupanai-625014
193 Peoples Association for Rural
Development Main Road Valayankulam Postal Trainning Centre Madurai-625022
194 Educational Trust of India Jeeva Streer Pethoniyapuram Madurai-625016 Phone: 0452-605927
195 Pandiyuor Ramasamy Pillai
Trust Kurungi Street Bharathiyar Nagar Main Road Krishnapuram Colony Madurai-14 Phone: 532905/46380
196 Youth And Rural Development Centre 24 B Kasthuribai Nagar Malur-625101 Phone: 0452-815947

A-326
197 Good Will Social Work Centre No.5 South Streer Extn Singarayar Colony Madurai-2
198 Society for Training and Rural Reconstruction 7-5 6 A Suthanthira Pavanam Podinakkanpatti Road Vadipatti-625 218
199 Volandury Social Service
Organisation Kachaikatti Post Vadipatti-625 218
200
Society for Education Action and Environment 12 Bharathi Nagar Sigganthar Savadi Madurai-625018
201 Integrated Rural People
Development Society 23, J J Street Thirupavai Post Madurai Phone: 682429
Virudhunagar
202 Annai Dr. Muthulakshmi Reddi Rural Women's and Child Development Society Kottaipatti Vembakottai Post, Sivakasi Taluk Pin - 626 131
203 Institute For Social Awareness And Rural Development (INSARD) 13, Shanmugavel Nagar Main Road Aruppukkottai Pin - 626 101
204 Rose Institute Of Development
Services (RIDS) 3/27, M.R. Pudur M.Reddiapatty Pin - 626 118 04566-84467
205 Sri Vivekananda Seva Sangam 1/1545, Pandian Nagar Rosalpatti Pin - 626 001 04562-365035
Ramanathapuram
206 Village Education for Action and Development Trust (VEAD) 21, P.O. Nagaram, Via Nainarkoil, Paramkudi Taluk, Ramanatahpuram – 623 705
207 Bharatha Matha Seva Sangam (BHAMA) Kottaiyour, Mandapasalai Kamuthi Via Pin - 626 118

A-327
208 Grama Makkal Munnetra Maiyam Kalloor Tiruvadanai Taluk Pin - 623 407 04561-379241
209 Nehru Ilaingar Mandram 4/224, St. Oriyur Road L.K. Nagar, Thiruvadanai Pin - 623 407 04561-54415
210 Reconstruction of Economic
Vision and Emancy Fashion of Women Trust 2/4 2 C3 Punnmadai Road R S Mangalam Post-623 525
211 Mayill Nature Club No 41, Theniyursaliyr St Vinayakar Colony Koranad Mailaduthurai
Tirunelveli
212 Tirunelveli Wild Life Association, Abcoy Gardens, Madurai Road N.H.7 Sankaranagar – 627 357 Phone No – 0462-300113 Email – [email protected]
213 Smart Environmental Science Cell, Ambai Road, Araikulam, Munnirpalam, Tirunelveli – 627 356
214 Action Group For Rural
Organisation (AGRO) 336,S.R.R Nagar Sethurayan Pudur Post Tirunelveli – 627 358 Email: [email protected]
215 Samaritans 2/133, Maruthakulam And Post Tirunelveli Pin - 627 151 04635-56332
216 Society for Women Education
and Economic Transformation (SWEET) 54, South Street Perumbathu, Nanguneri Pin - 627 108
217 Sri Manonmani Rural Development Society Main Road Alangulam Pin - 627 851 04633-70275
218 Women and Child Development
Society 26 Main Road Nanguneri Pin - 627 108
219 Womens' Renaissance Centre 9, Srinivasagam Nagar B Colony V.M. Arockianathapuram, Maharaja Nagar Post Pin - 627 011

A-328
220 Arumpugal Arakattlai H 109 Anbu Nagar Thirunelvali-627011 Phone: 0462-584373
221 Rural Association for Community Education Society Chettiyar St Rathapuram Post- 627111 Phone: 04637-35538
222 Thirunelvali Mavatta Exnora
International Mayatta Kilai 4 A Minnagar Thenkosi- 627818 Phone: 04633-24497
223 Indira Ganthi Educational Youth And Rural Development Society 1 T 3 Rd Street N G O Colony Mellagaram-627818 Phone: 04633-26274
224 Mahathama Ganthi Save
Mandram 4/69 Main Road Vannikonangal Post Sangaran Kovil T K-627957 Phone: 04636-86186
225 Ammar Rajive Ordesen Welfare Association 3/52 Main Road Mannuoor Thirunelveli-627201 Phone: 0462-85105
226 Integrated Development
Inciavatives And Alternatives Foundation 7 Perumal Kiol St Krishnapuram Kadayanullur-627759 Phone : 04633- 42026 Fax: 04366-4120
TUTICORIN
227 Programme For Rural Education And Social Service Trust (Press) Shanmugasigamani Nagar Koivilpatti Pin - 628 501
228 Society for Education, Action and Development (SEAD) 1, 2nd Floor, Vsr Compound Madurai Road, Vilathikulam Pin - 628 907
229 Society For Rural Development
Organisation 74/4, North Street Pannikulam (Via Kayathar) Pin - 628 952 04632-61738
230 Rural Economic Development Society 9 Dr Edison Compuntor Thiruchanduoor-628215 Phone: 04639-45612 Fax: 04639-45393

A-329
231 Suganthi Devathasan Marine Research Instuite 44 Katarkarai Salai Thothoogudi-628001 Phone: 0431-340350 Fax: 91- 461- 340550 WEB:- www.sdmri.org EMAIL:- [email protected]
232 Chevalier Roche Society, Derose Centre, Nehru Nagar, Old State Bank Colony, Thoothukudi – 628 002 WEB- www.chevaliar.org
233 Community Eco Balance
Construction Network Post Box No: Nazareth 628617 Phone: 91-4639-77553
KANYAKUMARI
234 Young Men’s Christian Association P.O Mullankinavilai, Kanniyakumari – 629 157 Phone No -04652-232700 Email – [email protected]
235 Natural Resources Development Project Vivekananda Puram, Kanniyakumari – 629 702 Phone No- 04652-246296 Email – [email protected]
236 Society for Environmental
Education and Development , 52, F, Nanjil Nagar, Nagercoil – 629 002 Phone No – 04652-203924
237 Conservation Of Nature Trust, 43-C, Lagrace Water Tank Road, Nagercoil – 629 001 Phone No- 04652-23527 Email- [email protected]
238 Vivekananda Kendra – Nardep,
Vivekanandapuram, Kanniyakumari – 629 702 Phone:- 04562-246296 Web: - www.vkendra.org Email. [email protected]
239 Action Group For Rural Organisation(AGRD) 1/239 Periyar Nagar Suthumalai, Thirunelveli-627604 04362-342302 Fax: 331035 [email protected]
CUDDALORE
240 Association for Integrated Rural Welfare 2/86, North Street C. Kotthangkudi Thopu, Chidambaram Pin - 608 002
241 Health Education Association For Rural And Tribals - Heart Annapoorna Illam 1-A, Indira Nagar, Vridhachalam Pin - 606 001 04143-63123

A-330
242 Manushe 49, Kottathangarai Street Parangipettai Pin - 608 502 04144-53247, 23326
243 Swami Ramakrishna Educational Society Omampuliyur Village And Post Via - Ayyangudi, Kattumannarkoil Taluk Pin - 608 306
244 Womens Education and
Economic Development Society - WEEDS No. 49/365, 4th North Cross Road Mariyappa Nagar, Chidambaram Pin - 608 002
245 Pace Organization Center Post Bag No: 54, Sethaparam – 608001
246 Trust run by D.Murugaiyan D.Murugaiyan, 3/261, Thirumalai Illam, Madappuram, Thiruthuraipoondi, Thiruvarur
247 Vairam Thelisis Education Centre K.Vairakannu, 32, Kannuthoppu street, Thiruthuraipoondi 614 713
248 Trust run by A.Ganesan A.Ganesan, Nalangattalai, Vishnupuram post, Iravancheri via, Thiruvarur-609506
249 Thiruvalluvar Uzhavar Mandram S.Balashanmugam, Sembangudi post, Thiruvarur-612603
Krisnnagiri
250 Jayabharathi educational trust M.Theerthagiri, Thiruvanapatti village, Uthangarai, Krishnagiri 635 304,
251 Trust run by K.Poongodi K.Poongodi, 308 Nethaji road, Pazhaiyapettai post, Krishnagiri-635001
Sivagangai
252 Viva Organic farm P.R.V. Varadharajan, Kamaleshvari Illam, Rajendra Prasad St., Paganeri, 630 558.
Virudhanagar
253 Action for Rural integration and social eduation(ARISE) A.Selvakumar, Sivalingapuram, Mudukkankulam post Kariyapatti via, Virudhunagar, 626 106
254 Rural Institute for community Health (RICH) P.Srinivasa raghavan, Krishnapuram, P.Thottiankulam (Po), Thiruchuli 626 129

A-331
255 Sun Bio tech, S.Mukesh, 2/181 A North street, Sethu Narayanapuram, Vathira irruppu via, Virruthunagar 626 132.
256 People's Organisation and Social institution of transformation Development POSITIVE TRUST No.16, TNHB Colony, Madurai road, Palayampatti 626 112
257 Rehoboth Agribusiness Consultancy R.Nakkeeran, 4/323 Thangam Nagar, Vathirayiruppu post, Virudunagar-626132
258 Trust run by S.Ramar, 34, Perumalpatti nadar, Ist East street, Srivilliputhur, Virudhunagar 626 125.
259 JEYPEE Biotechs R.Palaneeshwar, 25, Chinnaiah school street, Virudunagar-626001
260 VISION Trust Vision, 44, D.M.P. Kittangi street, Virudunagar
Namakkal
261 Women's organisation for Rural Development R.Sivakamavvalli,P.O.Box No.1. Pandamangalam Post,P.Velur Taluk, Namakkal District. 637 208
262 Radio Farmer's Association R.Thangamani, M.A. 36. Paraiyur Ayyampalayam, Kumarapalayam, Trichengode, 638 183
263 Heals Rural Training Centre, Opp. To Sugar Mills, Moganaur, 637 015
264 Vasantham Iyarkai Velan Pannai S. Manivannan, 3/116,Kannimarkadu,Samayasangili, Pallipalayam, Namakkal-638008
265 Sustainable life trust S.Prathapan, 19/20, S.B.M.Compound, Semmedu Village Post, Kolli hills, Namakkal 637 411
Coimbattore
266 Imayam Social Welfare Association S.Jayakumar,10/35 K.Sathya Nagar, Ganapathy, Coimbatore -6 41 006
267 Positive sign foundation 8A/12. 10th. Street cross, Anna Nagar, Peelamedu, Coimbatore 641 004

A-332
268 Sulabha Agriculture organisation Sulabha Agriculture Organisation, Oorupannadi nivas, Kottur, Malayandipattinam, Pollachi 642114,
269 National Agricultulral Development Trust. M.shanmugam, Lawyers Garden, Eripatti post, Pollachi 642 205.
270 Coimbatore Eco Farmers Association CEFA, 25 Periyannan Nagar, Thadagam road, Coimbatore -25.
271 Kalpaviruksha Dr. B.A. Uma, Thekupalayam, Coimbatore 641 020
272 Indian society for certification of organic products ISCOP, RASI building 162/163, Ponnaiah rajapuram Coimbatore 641 001
273 Green Kovai, AIM for Seva D.S.Raman, Arsha Vidya Gurukulam Anaikatti Coimbatore-641108
Erode
274 Eden Organic Farm creators 21, Arulagam Building, Udumalai Road, Dharapuram 638 656
275 Sri Amman Organic Farm, Vengiyampalayam, Pasur, Erode 638 154
276 Rajendra Foundation for Agrl. Research and Rural Development, Kesarimangalam P.O, Bhavani Taluk, Erode
277 Pasumai Angadi, Shop No. 65, Velayuthasami Complex, Muthur Road, Vellakovil 638 111
278 The Falcon Bio control (Selvi B. Vanathi) Tamil Nadu Vermi culture Hatcheries, Reliance Tower Road, Mettankattuvalasu, Erode 638 109
279 Trust run by C. Loganathan, 55, Nethaji street, Vairapalayam, Erode 638 003
280 Ever Agro Corporation, 122, Park Road, Vaiyapuri complex, Moolapattarai, Erode 3.
281 Trust run by A.S.Kumar, 44 Mariamman koil street, Iyyampalayam, Kavunthapadi, Bhavani taluk, Erode.
282 P.Dhanasekaran, Maniampalayam, Iyyampalayam post, Kavunthapadi via, Erode
283 Service unit for development activities in rural areas SUDAR, 435 A, Rangasamuthram, Murthy tyres building, Upstair, Sathyamangalam 638 402

A-333
284 Trust run by S.P. Ramalingam, Annur Gounder Thottam, Uthandiyur post, Sathyamangalam, Erode 638 402
285 Trust run by Elanchezhiyan S.Elanchezhiyan Athanikarar thottam Uthandiyur post, Sathyamangalam, Erode 638 402
286 Thalaimurai Organic farm M.Kumar, 69, Kenchanur post, Sathyamangalam, Erode 638 401
287 Iyarkai Organic farm M.V.Shanmugah raj 3/250 K.K.Thottam,Mangalapatti Post, Muthur via, Erode 638105
288 Iyarkai Agricultural Farmers Group Iyarkai Agricultural Farmers Group, 5/339, Ramapuram Thottam, Thalavadi, Erode-638461
Karur
289 R.N.Agro Farms Chinnadharapuram, Karur -639202
290 Centre for Human Resource Development Trust, (CHRD) N. Subramanyan, CHRD Trust, 8/139 B, Kumarapalayam, Chellandipatti post, Vellianai, Karur 639 118
291 Cherur trust E. Vellaichamy, Panikampatti, Kulithalai taluk, Karur
Madurai
292 Kokila Hospital and Herbal Training Centre Dr. J.Jeyavenkatesh, Kokila Hospital 27/1D -1, Jaihindpuram Ist Street, Madurai - 625 011
293 Indian Medicine and herbal promoters organisation Kokila hospital and Herbal training centre campus, 27/1D-1 Jaihindpuram 1st street, Madurai 625 011.
294 Association for rural development K. Joseph Binsant, 41 D, 7/800, Jawahar street, Melakuilkudi road, Nagamalai pudukottai, Madurai 625019
295 Annai mary Foundation Haven for positives V.Denes Amaladevi Vethamuthu Illam, Bharathi nagar, Madurai-625018

A-334
296 Rural Development Trust S.Chinnasamy, Agro Project Coordinator, Anaikaraipatti, Vandari post, Peraiyur taluk, Madurai 625 705
297 Sakthi Vermicompost unit K.Sivaswamy Sanampatti Pandiarasapuram post, Madurai-625209
298 SUMAREES Trust B.Rajagopal 66, Devarayan street, Thirumagal Nagar, Madurai-625009
Thiruvannamalai
299 Sugarcane grower Farmers Welfare Association, 17/A CC Road, Pollur 606 803.
300 Rural Health and Economic Development Society (RHEDS) Meyyur Village and Post, Vanapuram, Thiruvannamalai 606 753.
301 Rural Development Society, (RDS), Kanji. M.Kannabiran, Pillaiyar koil chetty street, Kanji village, Thiruvannamalai 606 702.
302 Trust run by P.Dhandapani, 3/520, Vaiyapuri chetty street, Melsozhankuppam, Adhamangalam via, Polur Taluk, Thiruvannamalai
303 Trust run by R.Krishnamoorthy R.Krishnamoorthy, North street, Veeranur post, Adhamangalam post, Polur Taluk, Thiruvannamalai
304 Sai Jothi Charitable trust Sai Jothi Charitable Trust,No. 3 Poomalai Sales Complex, Anna Salai, Thiruvannamalai 606 601
305 Voice of nature V. Ramakrishnan, HIG 507/75, TNHB, Tamarai Nagar, Thiruvannamalai
306 Association for Rural Tribes 582/3, Bharathiyar street, Mullipet, TNHB opposite, Thiruvannamalai-632316
307 Thiruvannamalai Taluk farmer's Exnora S.Natarajan, 62 A, Krishnan street, Thiruvannamalai
Trichy
308 Community Organisation and Rural Education (CORE) Secretary, CORE, 28 Thuraiyur Road, R.S.Complex, Musiri 621 211
309 Association For Human Integrated Massive Social Action (AHIMSA) 1-207 C, Sona Complex, Tiruchy Road, Vaiyampatti 621 315.

A-335
310 Srimath Andavan Arts and Science College, 108, Ganapathy Nagar, Thiruvanaikovil Trichy 5.
311 G.B. Food Oils private Ltd, 108, Ganapathy Nagar, Thiruvanaikoil, Trichy-5.
312 Mavalipatty Nanbargal Narpani Mandram & Youth Development Centre. K.Jeya Thirupathi, Mavalipatty (Po) Musiri, Trichy 621 205
313 Bringing Integration and Rural Development P.Ramasamy, 4/44. Nadupaty (Po), Vaiyampattu (via), Trichy, 621 315.
314 Awareness and Community transformation foundation. ACT, 144 Main road, Kovilpatti, Manaparai taluk, Trichy 621 305.
315 Sarvodhya Foundation B. Sathya. 158/1 13th cross. Anbu Nagar, Crawford, Trichy 620 012.
316 PENI-'EL' Educational trust S. Johnson, Peniel Nagar, Angarai post, Lalgudi taluk, Trichy 621 703
317 Tamil Nadu Agri Clinic N.Rajasekaran, 14 Premier Towers, Karur road, Trichy 620 002
318 Individual Development Foundation Nangil Vedha, Room No.2, 3rd floor, N.S. Building, Opp. To Premier towers, Trichy 620 002.
319 Rajiv Gandhi Social Service Trust, A.R.Velu, 58/1Kovilpatti road,Manapparai,Trichy 621 306
320 Integrated Rural Development Foundation S.R. Naveen Balaji 104, Raja colony, First cross, Cantonment, Trichy-620001
Thanjavur
321 KKM Bio tech C/o. Chitra Agency, 74 Abraham Pandithar Street, Thanjavur 613 001.
322 A. Veeraya Vandayar Memorial Sri Pushpam College Sri Pushpam College, Poondi 613 503 Thanjavur Dist.
323 Periyar Maniyammai College of Technology for Women Periyar Maniyammai College., Vallam, 613 403, Thanjavur
324 MENS Service trust S.G. Selvi, Padapannar Vayal, Sornakadu post, Peravurani taluk, Thanjavur 614 804
325 Integrated Women Development Centre K.Murugaiyan, 135 Main road, Ammanpettai, Vethiyapuram post, Thanjavur 613 205
326 Organic farming awareness association Thiruvenkadam, Irandingattalai post, Kumbakonam-612202

A-336
Dharmapuri
327 Development Education and environment protection society (DEEPS) M. Sankar, BDO OfficeRoad, Pennagaram 636 810
328 Council for Integrated Development, A.Pallipatti post, Pappireddypatti Taluk, Dharmapuri 636 905.
329 R. Dharmalingam, Rural Development Society, 4/9 A, Agraharam st., Kadathur, Pappireddypatti 635 303.
330 Heritage Herbs India 1/213 A1. Aisshwaryam Nest, Vivekananda colony, Near Silk Farm, Avalapalli Road, Hosur, 635 109
331 ARIMA Service trust V. Kirubanandham, FTC Convenor, Mookareddi patti, A Pallipatti, Pappiredi patti taluk, Dharmapuri 636 905
332 Tribal Health Initiative Dr. Lalitha Regi, Theerthamalai Post, Dharmapuri District 636 906.
333 Institute of Enterpreneurship Development(IED) IED 5/1358, T.A.M.S Colony,Elakkiampatti, Dharmapuri-636705
Nilgiri
334 Centre for tribals and rural development trust, Ealamanna, Mango range, The Nilgiris 643 220
335 The Earth Trust, 13/19 A6 Hema College, Bharathi Nagar, Kethi post, Nilgiris.
336 A.M.Agro Products A.M.Abibulla, Panthalur post, Panthalur taluk, Nilgiris 643 233
337 Jeyam Agrotech 6/440, Isaac lane, Aruvankadu, Nilgris-643202
338 Bacto Agro Culture care PVT Limited E. Radhakrishnan, Bharatha Nagar, Kolapally post, Nilgris-643253
Tuticorin

A-337
339 Kokulam Arakattalai, Jamin Kodankipatti, Kuruvarpatti post, Vilathikulam, Tuticorin dist.
340 Women's Education and Employment Development Society. S.Charles, Mudalur post, Tuticorin Dt. 628 702.
341 Centre for education social welfare and agricultural rural development L.Rajan, S.D.A. Church street, Muthugai nagar,Nalathinputhur, Tuticorin 628 716
342 Rural Agroservice and institute of Natural farming P.Rosari, 8/74, Rajapalayam, Arockiapuram post, Tuticorin-628002
343 Rural Service Trust V.Ganapathi raman,Masarpatti Nenmeni,Tuticorin 626 202
344 Paathai Trust V.Kennady 1/42. South Street, Kamanayakkanpatty Thoothukkudi Dist. 628 720
345 Vishwa export, 5/322, E.P. Colony, Alampatti, Kovilpatti 628 501.
Theni
346 Agent for Organic Fertiliser and Herbal pesticideT.Tamilselvan, Vinobaji nagar, Karuppasamy Koil street, Bodi
347 Malar social society, M.Shanthi 4/9Ramugowdar street, Kamayakoundanpatti, Theni
Pudukottai
348 Pasumai Thangam Arakattalai, 275, North street, Pokishakaranpatti, Vaithur post, 622 203
349 Indian Microbial Agricultural centre, Anandha solai Pisanathur village, Kandharvakottai 613 301
350 Rural Development Organisation, 45, Meenakshipuram road, Arimalam post, Pudukottai 622 201
351 Goshakthi Arakkattalai Bharathipuram,Vaithur post Pudukkottai 622203
352 Rights Trust A.Kanagavalli,1/81, Vamban Nal Road, Kalyanipuram, Kotthakottai post, Thiruvarangulam via, Pudukkottai dist-622303
Dindigul

A-338
353 Trust run by M.Jayaseelan. Sengulam post, Natham taluk, Dindigul
354 Trust run by K. Subrarayan, Chellakuttiyur, Kovilur post, Vedasanthur taluk 624706
355 Village Welfare trust, 5/199, Teachers Quarters, NGO Colony, Dindugal 624 005,
356 Serene Secular Social Service Society, S. James Victor, South Street, Kosavapatti post, Sanarpatti via Dindugal 624 304
357 Rural organization for social education trust. M.Palaniammala, West Street, Old Batlagundu, Dindigal Dist. 624 202
358 Sirumalai Evergreen Multipurpose community Development society G.F.Viswasam, 7-8, Little Flower Home, A.Vellodu, 624 307
359 Child Trust Chandra Saravanan, No.4-12-2 Arunaslapuram, Dindigul Road, Batlagundu, 624 202
360 The Health Wealth Social Service trust 17/3 /5 Aarthi Theatre road, YMR Patti. Dindigul 624 005
361 Jaya Bharath Agro Agencies S. Kandasamy, 246/9 B2 Balu complex, Gandhi Market, Ottanchatram 624 619
362 RELIEF Trust 23 NGO Colony, Dindigul 624 005
363 Rural social Education &WelfareCentre C.R.Tamilvanan 5/166 St.Marys Teachers Colony, N.G.O.Colony Post, Dindigal 624 005
364 Peace Trust, Thasaripatti, Kuttam post, Vedasanthur 624 711
365 Rural Integrated Development Organisation RIDO, 9-3-56, North street, Sithayankottai-624708
366 Peoples Welfare Trust T.Perumal 69, East car street Dindigul-624001
Chennai
367 Medi herbal nature and food products, 41/31, Manickam Nagar, Ajax, Thiruvotriyur, Chennai 600 019.
368 Bio track technology pvt. Ltd. 32, Ist floor, C 60, Anna Nagar Plaza, Iind Avenue, Anna Nagar, Chennai 600 040.
369 Service civil International 193/8 Asiad Colony, Anna Nagar West Exten, Chennai 600 101
370 Bharat Krishak Samaj 37, Lake view Road,Adambakkam, Chennai-600088

A-339
371 Madras social service society, Kolping tower, IInd floor, 329, T.T.K road, Alwarpet, Chennai-18
372 EVERGREENS Agency for Natural Resources N.K. Shanmugam, 36, 18 th Avenue Ashok Nagar, Chennai- 6000083
373 Chinu Exports Bio Products Division 26/636 27th.St.Korattur Chennai.80
Kanyakumari
374 Green mark Agro inputs Ltd.,No.3, Ist floor, Lakshmi Complex, Aralvoimozhi, Kanyakumari
375 Green land Organic manure, Bersil & Co., 78, New Assist building Muthamil Street, Nagercoil 1
376 Trust run by T. Glori bai, Kakavilaiparambu, Moovatrumugam post, Kanyakumari 629 177
377 Jayam united service trust, 13/15 A, Krishna Illam, Thamburan Koil street, Vadakur, Thovalai 629 302
378 Kumari Eco-Friendly Farming Services (P) Ltd., G.C.Prateep, Kumari Eco Friendly Farming Services (P) Ltd., Chankai, Kanjiracode Martandam 629 155
379 TSUNAMI Trust A.Dimon Arul Kodimunai post, Colachel via, Kanyakumari-629251
380 Rural Uplift Centre S.Chrishtopher Theepam Dhumpali Iranipuram Kanyakumari 629197
381 Victory Organic farm Dr.C.Thiruvaranganathan A.155, N.G.O Colony Kottar post Kanyakumari-629002
Cuddalore
382 Centre for Agricultural awarenss and rural development (CAARD) CAARD, S. Bharathi Raja,M.Sc.(Ag), CAARD, Vilathur, Thirupaniyapuram, Melavanniyur post, Cuddalore 608 302.
383 EID Parry Ltd., Nellikuppam Sugarcane factory, Cuddalore

A-340
384 Indo Europian Institute for Natural Medicine Indo Europian Institute for Natural Medicine, No. 5, Bharathithasan Street,Manjakuppam, Cuddalore 607 001.
385 V.V.V Club Nabard, district dev. Office, 223, nethaji road, manjakuppam, cuddalore
386 Basarass Biocon(India) PVT.Limited Basarass Biocon LTD 3/320, MainRoad, Eraiyur, Pennadam, Cuddalore-606111
387 RA Agro Traders JP Rajasekar, 7 first cross, Friends Nagar, Opp. To Employment Office, Cuddalore 607 001
388 Mega Agricultural Service Trust, 240 East street, Karmangudi post, Cuddalore 606 110
389 Biodyanamic trust V.R. Raaja Murugan Biodynamic Association, 19, south street, Vridachalam, Cuddalore-606110
390 Biodyanamic trust A.K.V.Raja Inthren, Biodynamic Association, 19, South street, Vridachalam, Cuddalore-606110
Salem
391 Trust run by R.Sivam, Virudhampatti P.O. Mecheri via, Mettur taluk, Salem
392 Mettur Nature Society, 83 A, Pudu Colony, Karumalaikudal, Metturdam, 636 402
393 Green Star Agri.consultancy K.Shanmugavel, B.Sc(Ag), Founder & Director, Green Star Agi consultancy, Muthampatti, Tholasampatti(via), Mettur (Tk) Salem, 636 503
394 Rural Education and Development Project READ, 37 A Avvaiyar street, Mullaivadi, Athur post, Salem 636141.
395 SAMRAT, 172/1, Sukkampatti, Salem-636122
396 Jai Agro Service, Opposite to Ponni Co- peratives, Middle Street,Thammampatty, Salem-636113

A-341
397 Rural awareness of Environment and social organization RAESO, 77-5/2-39-C9, 4th cross, Shivayanagar, Salem 636 004
398 Trust run by Manigandan,1/1, M.Perumapalayam, Salem-636111
399 Omalur block women welfare uplift organization K.Saroja, 11/9, Telephone exchange road, Omalur post, Salem-636455
400 Trust run by C.Nallathambi,4/11, New street, Kadaiyampatti post, Omalur taluk, Salem-636351
Kancheepuram
401 Rasi Agricultrual Consultancy Centre, 154/2, GST Road, (Rattinakinaru) Chengalpet 1
402 Foundation for organic agriculture, 348/166, Anna salai, Chengalpet 603 002.
403 Tamil Nadu Organic farming and Herbal farmers Association N.Dhayanidhi, 21 Devarajan street, Vedhachalam Nagar, Chengalpet, Kancheepuram
404 Natural Educational Environmental Agricultural Development Society. G.Gopalakrishnan, 66 B, Sengazhuneerodai Street, Kancheepuram 631 502.
Thirunelvelli
405 Organic farming association St. Fathima Annai Agricultural farm Organic farming association St. Fathima Annai Agricultural farm, South Kuniyur, Cheranmagadevi 627 426
406 "Ilayabharatha" (M) Guidance Centre, 1/271, Youth Club building, North St., Mannur 627 201.
407 Sri Parasakthi Trust, 226, LRS Palayam St., Tenkasi 627 811.
408 Viswa Export 5/322 EB Colony, Alampatti, Kovilpatti, 628 501
409 Health Trust 6-121. Esckiamman Koil St., Sanganapuram (Po), Tirunelveli, 627 114
410 Brindha Agro FarmService, 18, St. Xavier's Shopping Complex, St. Johna's College Road, Palayamkottai, Tirunelveli 627 002.

A-342
411 TANWA Self Help Group C. Ramathilagam, Shenbaga kal Oadai street, Vasudevanallur, Sivakiri Taluk, Tirunelveli 627 758
412 Sri Ganga Seva Sangam A. Ponnuvel, 49/3, Middle street, Duraisamiyapuram, Sivakiri taluk, Tirunelveli
413 ESR Chairtable trust, 82, Sanror North street, Chinthamani, Puliyangudi post, Sivakiri taluk, Nellai dist. 627 855
414 Iyarkai Velanmai Mempattu sangam,70/2, South street,Sanarpatty, Tirunelveli-627201
Villupuram
415 Village Development Society. F. Joseph, Village Development Society Nilayam, Karunanidhi Chettiyar Illam, Valathi Post, Villupuram 604 208
416 Pasumai Farmers Association, Thirukovilur Road, Devapandalam 606 402
417 Paasumai Thamilagam, 1 Nattarmangalam, Vallam post, Gingi, Villupuram 604 206
418 Sri Bio Natural India, KK Nagar, Salamedu, Villupuram 605 602
419 Udayam Trust, Kakanoor Post, Kedar Via, Villupuram 605 402
420 Greenworld Agri Clinic,10 Town panchayat vanigavalagam, Salem main Road, Chinnasalem-606201
Nagapattinam
421 Farm women discussion group Poornima Mary kanth, Farm Women discussion group, PUshpavanam 614820
422 Annai Indira Social Education centre. 1/249. Sumaykha Eazilaham, pushpavanam, Vedaranyam (TK) Nagapattinam Dist. 614 809
423 Trust run by V.Sadasivam V.Sadasivam, Elumichampatty, Kodangudy post, Mayiladuthurai, Nagapattinam-609314
424 K.P.T. Organic farm K.S. Ramiyan, Konari Rajapuram, Mailaduthurai taluk, Nagapattinam 612201
Vellore
425 Gramapura Magalir Muligai Vivasaya Mempattu Sangam Vadagarai , Minnur (P.O)-635807.
426 Velanmai Vithai Mayam.No.5, IELC Complex, MC Road, Ambur- 635 802
A-343
427 SOLAI PROGRAM, Dr. R.D.Rajan, Christian pet village, Post, Vellore - 632 059
428 Organic farming and Vermiculture Hatcheries CAH College.R.Yusuff Sheriff, Technical Section, CAH College, Melvisaram.
429 Rajiv Gandhi Educational and Charitable Trust. G.Anbalagan, 63/1 Maniyakara street, Arakonam, 631 001. Vellore District
430 REACH trust, 71/50 Chellaperumal street, Sholingar 631102.
431 Trust run by M.Ramamoorthy M.Ramamoorthy, Sokkalampatti, Vettapattu post, Nattrmpalli via, Vellore-635852
432 Guru Samrot Trust V.Dakshinamurthy, No. 4, New Street, Senguttai, Katpadi post, Vellore 632 007
433 Maha Organic Inputs private Ltd., M. Mahalingam, 1/367 Katpadi Road, Latteri, Katpadi Taluk. Vellore 632 202.632 509.

A-344
ANNEXURE X LIST OF OFFICIALS CONSULTED DURING THE STUDY
Sri. M.Palaniappan, Chief Engineer (PF)Retd WRO, PWD, Chennai
Sri Rajagopalan, World Bank Consultant, MDPU,Chennai
Sri Vibhu Nair, IAS Director, MDPU Chennai
Sri Muthaiah Chief Engineer,(O&M), Inter State Water Resources, PWD,WRO, Chennai-6
Er. Abrantham, Incharge Chief Engineer (PF) WRO, PWD, Chennai
Dr. K.Abranantham, Joint Chief Engineer(PF), WRO, PWD, Chennai
Dr. Paul.P.Appasamy, Professor, Madras School of Economics, Chennai
Sri.S.Janakarajan, Professor, Madras Institute of Developmental Studies, Adayar, Chennai.
Sri S. Rajasekharan Executive Engineer, WRO, PWD, Tiruvannamalai
Sri R.Goplakrishnan Executive Engineer, WRO, PWD, Kanchipuram
Sri A.P. Jaya Prakash Executive Engineer, WRO, PWD, Tindivanam
Sri V. Balasubramaniam Assistant Engineer WRO, PWD, Athur
Sri S. Sundara Murthy Assistant Executive Engineer WRO, PWD, Pudukottai
Sri R. Radhakrishnan Assistant Executive Engineer WRO, PWD, Pudukottai
Sri S. MohanRaj Assistant Executive Engineer WRO, PWD, Pudukottai
Sri S. Prabhakar Junior Engineer WRO, PWD, Pudukottai
Sri K.Gopalakrishnan Executive Engineer, WRO, PWD, Sivagangai
Sri S.Ayub Khan Assistant Executive Engineer WRO, PWD, Sivagangai
Sri Md. SalimBabu Assistant Executive Engineer WRO, PWD,
Sri V. PushpaRaj Assistant Executive Engineer WRO, PWD,
A-345
Sivagangai Madurai
Sri P.Nandakumar Assistant Executive Engineer WRO, PWD, Madurai
Sri A.T. Narasimhan Assistant Executive Engineer WRO, PWD, Paramakudi
Sri K.S. Abdul Rashid Assistant Executive Engineer WRO, PWD, Paramakudi
Sri R.Sampath JE, WRO,PWD Paramakudi
Sri M.Chinnappan P.A. to EE WRO, PWD, Paramakudi
Executive Engineer, WRO, PWD, Madurai
Sri V.Sugumaran Assistant Engineer WRO, PWD, Madurai
Sri R.Pandy Assistant Engineer WRO, PWD, Madurai
Sri Selvaraj Assistant Engineer WRO, PWD, Madurai
Sri Rustham Ali Executive Engineer, WRO, PWD, Srivalliputtur
Sri G.Rajesh Assistant Engineer WRO, PWD, Madurai
Sri C.Chelladurai Assistant Executive Engineer WRO, PWD, Srivalliputtur
Sri C.Ayyasamy Assistant Engineer WRO, PWD, Srivalliputtur
Sri M.Gnana Sekhar Assistant Executive Engineer WRO, PWD, Srivalliputtur
Sri Rajbandra Bose Assistant Executive Engineer WRO, PWD, Srivalliputtur
Sri R.M. Subramanian Assistant Executive Engineer WRO, PWD, Perambalur
Sri K.Chandrasekharan JE,PWD, Perambalur
Sri P.S. Rajamaniakam JE,PWD, Perambalur
Sri V.Anantham Assistant Engineer WRO, PWD, Perambalur
Sri V.Sundaram Assistant Engineer WRO, PWD, Perambalur
Sri Nirmalan Christudas Assistant Executive Engineer WRO, PWD, Tirunelveli
Sri A.Subramanian Assistant Executive Engineer WRO, PWD, Tirunelveli
Sri P.Siva Pragasam Section Officer WRO, PWD, Tirunelveli
Sri P. Pugalendhi Assistant Engineer WRO, PWD, Tirunelveli

A-346
Sri Narayana Murthy Executive Engineer WRO, PWD, Nagercoil
Sri A.MohanDas Assistant Engineer WRO, PWD, Nagercoil
Sri P.Sasikumar Assistant Engineer WRO, PWD, Nagercoil
Sri M.M.Layarasan Assistant Executive Engineer WRO, PWD, Nagercoil
Sri M.Subramaniam Executive Engineer WRO, PWD, Valliyoor
Sri R.Selvarajan Assistant Engineer WRO, PWD, Valliyoor
Sri N.Ganeshan Executive Engineer WRO, PWD, Tiruvallur
Sri K.Manickachari PA to EE WRO, PWD, Tiruvallur
Sri G.Kartikeyan Assistant Engineer WRO, PWD, Tiruvallur
Sri Khaleel Ahmed Assistant Executive Engineer WRO, PWD, Tiruvallur
Sri M.Venkateswarlu Assistant Engineer, AE dept Tiruvallur
Sri Oorkhavalan Assistant Executive Engineer WRO, PWD, Srivalliputtur
Mr.John, Assistant Executive Engineer, MDPU, Chennai
Sri. Ganesan Junior Engineer,Retd Plan Formulation,WRO, PWD, Chepauk, Chenai-6.
Sri Thirumalai Deputy Chief Engineer, WRO, PWD, Chennai
Sri Mahalingam, GIS Dept, IWS Tharamani, Chennai
Sri Pasumalaithavan, Consultant, Technical Secretariat, IWS, Taramani, Chennai.
Sri.Santhanam’ GIS, Consultant, Technical Secretariat, Taramani, Chennai
Sri Siva Subramaniam Assistant Executive Engineer Dam safety dept. PWD, Chennai
Ms. Seethalakshmi, Joint Coordinator,Marketing TN Women Development Corporation Chennai
Sri Subramanian Murugeshan HR & Admn
Dr. Raja Ram, IAS, Director,

A-347
TN Social welfare Dept TN Pudhu vazhvu Society Chennai
Department of Rural Development, Saidapet, Chennai
Sri Gandhi System Manager,CDD, Social welfare Dept Chennai
Sri Thyagi, Additional Director, Dept. of Environment, Saidapet, Chennai
Dr. Thomson Jacob Dept. of Environment Saidapet Chennai
Dr. Vidyasagar Consultant, Dept. of Agriculture MDPU, Chennai
Sri M.SeethaRaman Dept. of Agriculture MDPU, Chennai
Ms. Mangalam Balasubramanian Coordinator, Women SHG’s T.Nagar, Chennai
Ms. Mangala Agriculture Officer Dept. of Agriculture Chennai
Ms. Valarmati Agriculture Officer Dept. of Agriculture Chennai
Sri M.Kesavulu Assistant Executive Engineer MDPU, Chennai
Sri Vijay Anand Assistant Engineer WRO, PWD, Chennai
Sri Mariappan Assistant Executive Engineer MDPU, Chennai
Sri Chakravarthi Assistant Engineer WRO, PWD, Chennai
Sri Sakkarji Assistant Engineer WRO, PWD, Chennai
Ms K.Vani Assistant Engineer WRO, PWD, Chennai
Ms Vijayalakshmi Assistant Engineer WRO, PWD, Chennai
Ms. Susheela Assistant Engineer WRO, PWD, Chennai
Sri Arivelagan Assistant Engineer, ICRP dam WRO, PWD, Krishnagiri
Sri S. Ayyappan Assistant Engineer, ICRP dam WRO, PWD, Krishnagiri
A-348
Sri A.Rajendran JE, WRO, PWD Athur
Sri D. Shanthinathan JE, WRO, PWD Tindivanam
Sri N.Jayaraj JE, WRO, PWD Kanchipuram
Sri Elangovan Executive Engineer WRO, PWD, Coimbatore
Dr. SundaraRaj Rtd.Dean.Fisheries College, Tuticorin Chennai
Dr. Samuel Pal Raj Prof & HOD, Natural Resource and waste recycling dept. Madurai
Dr. Manimaran Associate Professor Fisheries Research Institute Tuticorin
Sri P. Anbazhagan IDA,Chennai
Sri M.Ramadasu IDA,Chennai
Sri.Edgar, Agricultural Engineer, Agriculture Engineering Department, Valliyoor, Chennai.
Sri.M.Mali Arasan, Assistant Executive Engineer, WRO/PWD, Nagercoil, Chennai.

A-349
ANNEXURE X1
SCHEMATIC PRESENTATIONS

A-350

A-351

A-352

A-353

A-354

A-355
ANNEXURE X11 REFERENCES
1. Burkart, A.1976. A monograph of the genus Prosopis (Leguminosae subfam,
Mimosoideae) J.Arn.Arb.57 (3/4).
2. CE (PF), MDPU Library Copy - Executive Summary for the Assessment of Micro
Level Environmental Status of River Basins of Tamil Nadu.
3. DANIDA – Government of Andhra Pradesh (1994) State Agricultural Policy
Frame Work in Andhra Pradesh.
4. DANIDA – Government of Andhra Pradesh (1995-96) Work and Training Needs
of Women in Agriculture, Role and Status of Women in Agriculture in Andhra
Pradesh.
5. DANIDA - Government of Tamil Nadu (2003-04) Social Welfare and Nutritious
Meal Programme Department Policy Note.
6. EPTRI, Hyderabad Report – Environmental and Social Assessment of River
Basins of Tamil Nadu, September, 2004.
7. Government of Andhra Pradesh (2004), Report of the Commission on Farmer’s
Welfare, Hyderabad.
8. Government of Tamil Nadu (2003-04), (2004-05) Report of Economic Appraisal,
Chennai.
9. Government of Tamil Nadu and DANIDA/TANWA (1986) Technical Manual for
Farm Women Training - Tamil Nadu Women in Agriculture – TANWA Phase II.
10. Government of Tamil Nadu and DANIDA/TANWA – TANWA Project – A
Profile, November, 1995.
11. Government of Tamil Nadu – Tamil Nadu Water Resources Consolidation Project
– Implementation Completion Report, May, 2005.
12. Micro Level Environmental Status Reports of 16 River basins of Tamil Nadu.
13. “Pudhu Vazhvu” a Manual by Tamil Nadu Pudhu Vazhvu Society, Chennai.
14. Information Technology Kiosks in Rural India (2002) by Satyam Mishra,
Chairman, Young Entrepreneurs.
15. SEMF Report, Madhya Pradesh Water Sector Restructuring Project, Volume 3,
April 2004.

A-356
16. Social and Environmental Assessment of Karnataka Community Based Tank
Improvement Project, Volume I, 2001.
17. Social and Environmental Assessment of Karnataka Community Based Tank
Improvement Project, Volume II, 2001.
18. Tenth Five Year Plan: Diversification needed in Agriculture by Dr. Rajasekharan,
Chief (Agriculture) Planning Board, Kerala, October 2003.
19. Tamil Nadu Corporation for Development of Women Limited, Report of DAWN
of New Hope, Chennai
20. Tamil Nadu Government Report (2003) Tamil Nadu’s approach to Participatory
Irrigation Management (PIM) and Farmer’s Organization and Turn Over (FOT),
Chennai.
21. www.envis.tn.nic.in
22. www.tn.gov.in
23. www.tn.nic.in
24. www.tnrsp.com
25. www.tnhealth.org
26. www.wetlands.org
27. www.indiastat.com
28. www.ppi-ppic.org
29. www.lenntech.com
30. www.eicinformation.com
31. www.chennaicorporation.org
32. www.hppcb.nic.in
33. www.irrigationscheduling.com
34. www3.grips.ac.gp
35. www.mapsofindia.com