Embed Size (px)
Citation preview
– 1 –
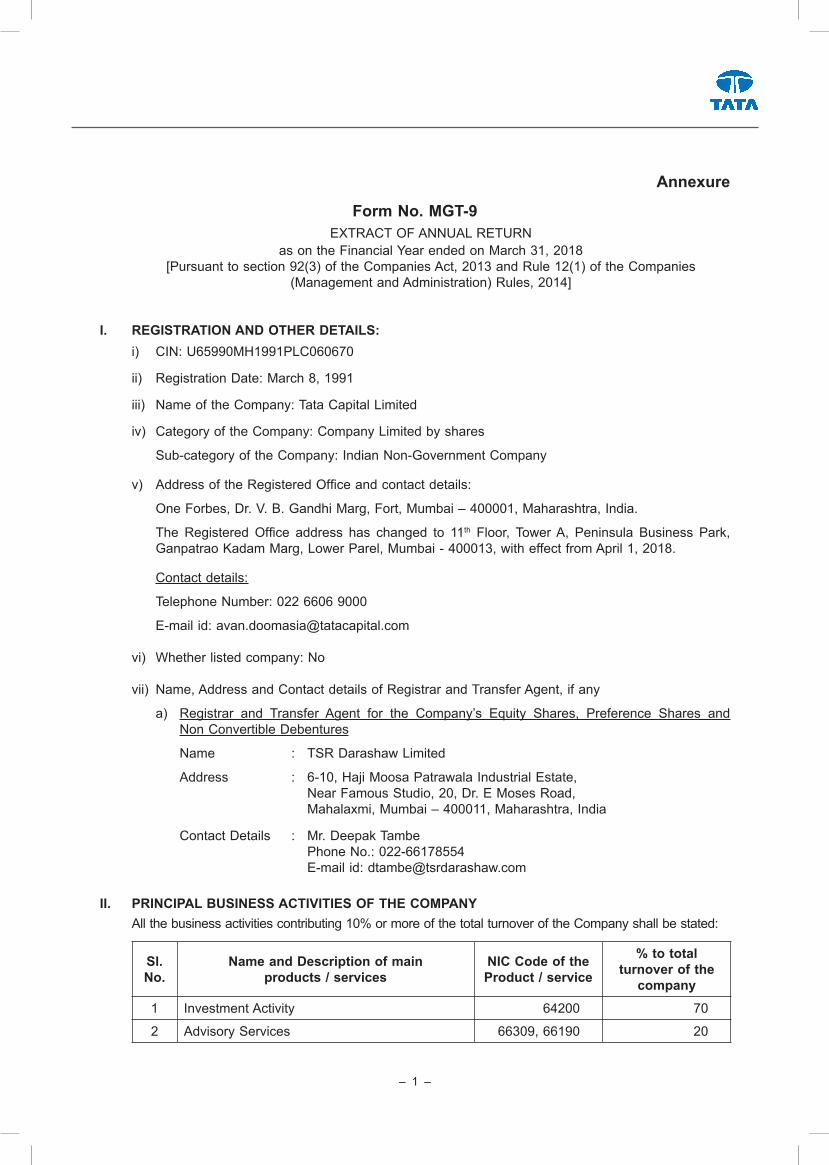
Annexure
Form No. MGT-9EXTRACT OF ANNUAL RETURN
as on the Financial Year ended on March 31, 2018 [Pursuant to section 92(3) of the Companies Act, 2013 and Rule 12(1) of the Companies
(Management and Administration) Rules, 2014]
I. REGISTRATION AND OTHER DETAILS:i) CIN: U65990MH1991PLC060670
ii) Registration Date: March 8, 1991
iii) Name of the Company: Tata Capital Limited
iv) Category of the Company: Company Limited by shares
Sub-category of the Company: Indian Non-Government Company
v) Address of the Registered Office and contact details:
One Forbes, Dr. V. B. Gandhi Marg, Fort, Mumbai – 400001, Maharashtra, India.
The Registered Office address has changed to 11th Floor, Tower A, Peninsula Business Park, Ganpatrao Kadam Marg, Lower Parel, Mumbai - 400013, with effect from April 1, 2018.
Contact details:
Telephone Number: 022 6606 9000
E-mail id: [email protected]
vi) Whether listed company: No
vii) Name, Address and Contact details of Registrar and Transfer Agent, if any
a) Registrar and Transfer Agent for the Company’s Equity Shares, Preference Shares and Non Convertible Debentures
Name : TSR Darashaw Limited
Address : 6-10, Haji Moosa Patrawala Industrial Estate, Near Famous Studio, 20, Dr. E Moses Road, Mahalaxmi, Mumbai – 400011, Maharashtra, India
Contact Details : Mr. Deepak Tambe Phone No.: 022-66178554 E-mail id: [email protected]
II. PRINCIPAL BUSINESS ACTIVITIES OF THE COMPANY All the business activities contributing 10% or more of the total turnover of the Company shall be stated:
Sl. No.
Name and Description of main products / services
NIC Code of the Product / service
% to total turnover of the
company 1 Investment Activity 64200 70
2 Advisory Services 66309, 66190 20
– 2 –
Annual Report 2017-18
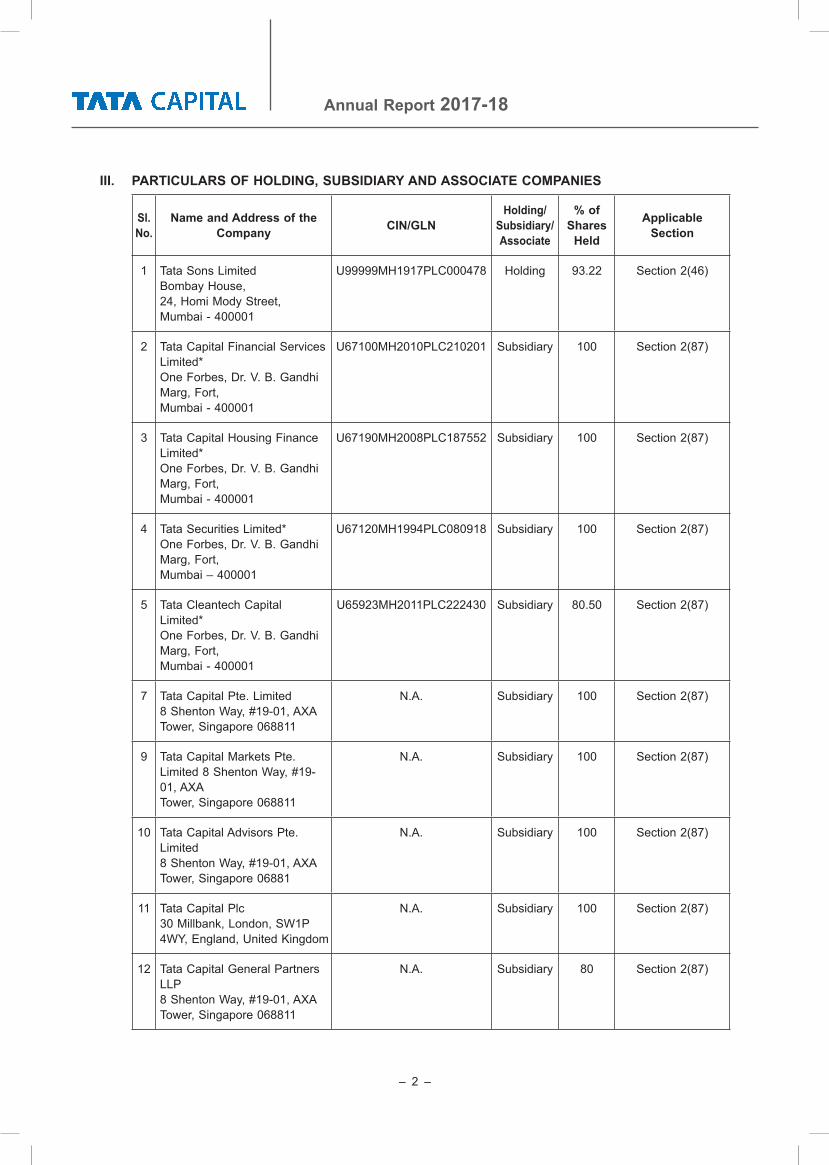
III. PARTICULARS OF HOLDING, SUBSIDIARY AND ASSOCIATE COMPANIES
Sl. No.
Name and Address of the Company CIN/GLN
Holding/ Subsidiary/ Associate
% of Shares
Held
Applicable Section
1 Tata Sons LimitedBombay House,24, Homi Mody Street,Mumbai - 400001
U99999MH1917PLC000478 Holding 93.22 Section 2(46)
2 Tata Capital Financial Services Limited*One Forbes, Dr. V. B. Gandhi Marg, Fort,Mumbai - 400001
U67100MH2010PLC210201 Subsidiary 100 Section 2(87)
3 Tata Capital Housing Finance Limited*One Forbes, Dr. V. B. Gandhi Marg, Fort,Mumbai - 400001
U67190MH2008PLC187552 Subsidiary 100 Section 2(87)
4 Tata Securities Limited*One Forbes, Dr. V. B. Gandhi Marg, Fort,Mumbai – 400001
U67120MH1994PLC080918 Subsidiary 100 Section 2(87)
5 Tata Cleantech Capital Limited*One Forbes, Dr. V. B. Gandhi Marg, Fort,Mumbai - 400001
U65923MH2011PLC222430 Subsidiary 80.50 Section 2(87)
7 Tata Capital Pte. Limited8 Shenton Way, #19-01, AXATower, Singapore 068811
N.A. Subsidiary 100 Section 2(87)
9 Tata Capital Markets Pte. Limited 8 Shenton Way, #19-01, AXATower, Singapore 068811
N.A. Subsidiary 100 Section 2(87)
10 Tata Capital Advisors Pte. Limited8 Shenton Way, #19-01, AXATower, Singapore 06881
N.A. Subsidiary 100 Section 2(87)
11 Tata Capital Plc30 Millbank, London, SW1P 4WY, England, United Kingdom
N.A. Subsidiary 100 Section 2(87)
12 Tata Capital General Partners LLP8 Shenton Way, #19-01, AXATower, Singapore 068811
N.A. Subsidiary 80 Section 2(87)
– 3 –
Sl. No.
Name and Address of the Company CIN/GLN
Holding/ Subsidiary/ Associate
% of Shares
Held
Applicable Section
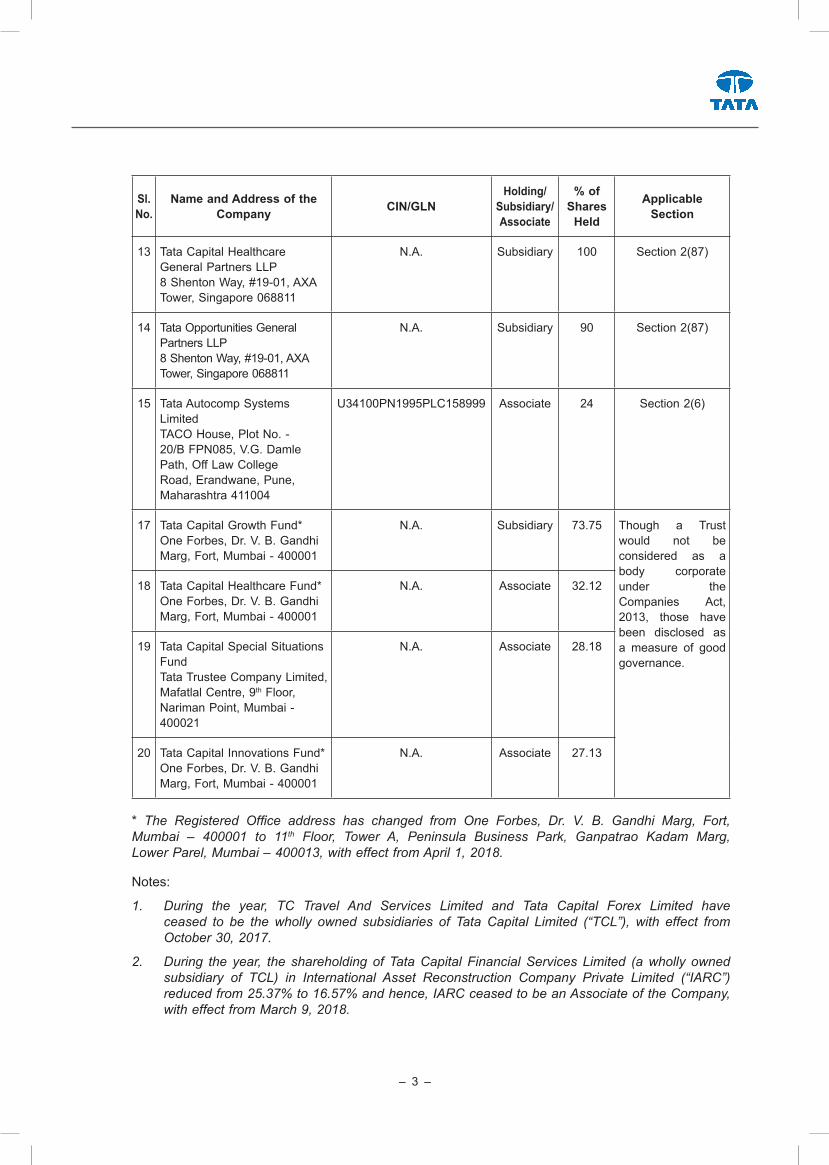
13 Tata Capital Healthcare General Partners LLP8 Shenton Way, #19-01, AXATower, Singapore 068811
N.A. Subsidiary 100 Section 2(87)
14 Tata Opportunities General Partners LLP8 Shenton Way, #19-01, AXATower, Singapore 068811
N.A. Subsidiary 90 Section 2(87)
15 Tata Autocomp Systems LimitedTACO House, Plot No. - 20/B FPN085, V.G. Damle Path, Off Law College Road, Erandwane, Pune, Maharashtra 411004
U34100PN1995PLC158999 Associate 24 Section 2(6)
17 Tata Capital Growth Fund*One Forbes, Dr. V. B. Gandhi Marg, Fort, Mumbai - 400001
N.A. Subsidiary 73.75 Though a Trust would not be considered as a body corporate under the Companies Act, 2013, those have been disclosed as a measure of good governance.
18 Tata Capital Healthcare Fund*One Forbes, Dr. V. B. Gandhi Marg, Fort, Mumbai - 400001
N.A. Associate 32.12
19 Tata Capital Special Situations FundTata Trustee Company Limited, Mafatlal Centre, 9th Floor, Nariman Point, Mumbai - 400021
N.A. Associate 28.18
20 Tata Capital Innovations Fund*One Forbes, Dr. V. B. Gandhi Marg, Fort, Mumbai - 400001
N.A. Associate 27.13
* The Registered Office address has changed from One Forbes, Dr. V. B. Gandhi Marg, Fort,Mumbai – 400001 to 11th Floor, Tower A, Peninsula Business Park, Ganpatrao Kadam Marg,LowerParel,Mumbai–400013,witheffectfromApril1,2018.
Notes:
1. During the year, TC Travel And Services Limited and Tata Capital Forex Limited haveceased to be the wholly owned subsidiaries of Tata Capital Limited (“TCL”), with effect fromOctober30,2017.
2. During the year, the shareholding of TataCapital FinancialServices Limited (awholly ownedsubsidiary of TCL) in International Asset Reconstruction Company Private Limited (“IARC”)reducedfrom25.37%to16.57%andhence,IARCceasedtobeanAssociateoftheCompany,witheffectfromMarch9,2018.
– 4 –
Annual Report 2017-18
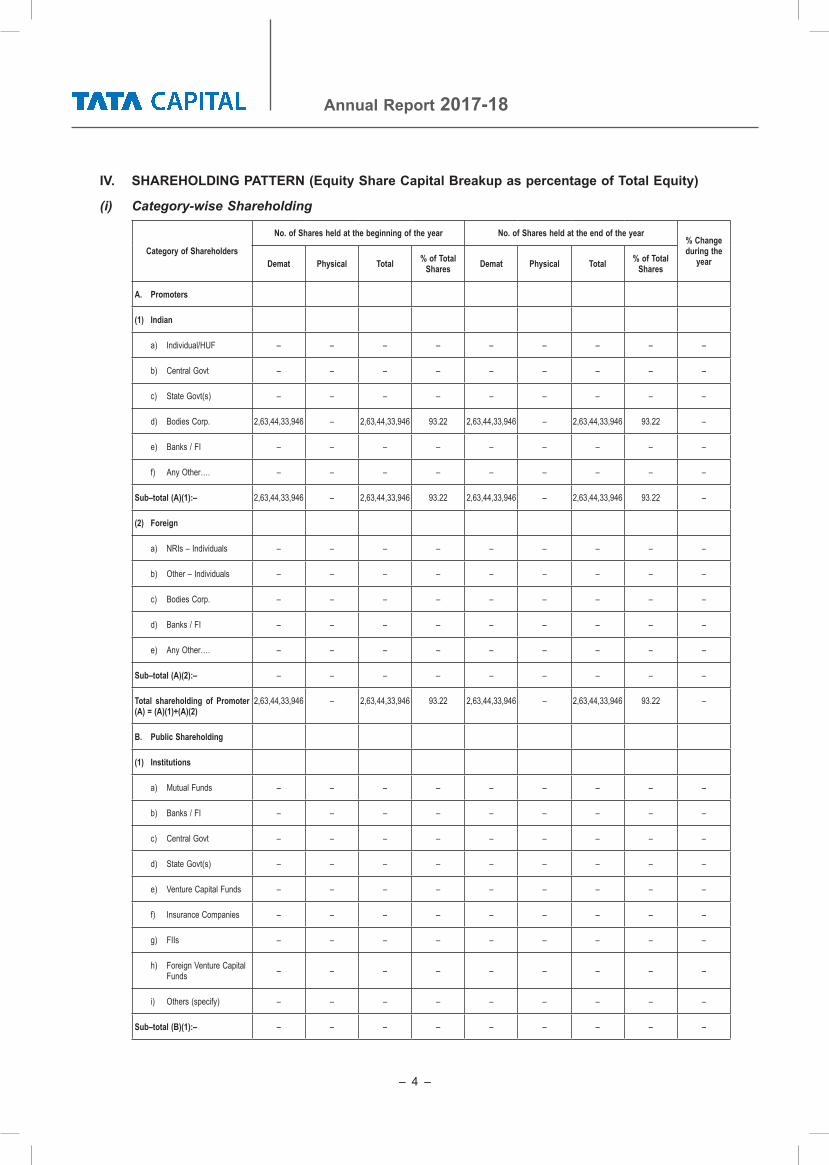
IV. SHAREHOLDING PATTERN (Equity Share Capital Breakup as percentage of Total Equity)
(i) Category-wise Shareholding
Category of Shareholders
No. of Shares held at the beginning of the year No. of Shares held at the end of the year% Change during the
yearDemat Physical Total % of Total Shares Demat Physical Total % of Total
Shares
A. Promoters
(1) Indian
a) Individual/HUF – – – – – – – – –
b) Central Govt – – – – – – – – –
c) State Govt(s) – – – – – – – – –
d) Bodies Corp. 2,63,44,33,946 – 2,63,44,33,946 93.22 2,63,44,33,946 – 2,63,44,33,946 93.22 –
e) Banks / FI – – – – – – – – –
f) Any Other…. – – – – – – – – –
Sub–total (A)(1):– 2,63,44,33,946 – 2,63,44,33,946 93.22 2,63,44,33,946 – 2,63,44,33,946 93.22 –
(2) Foreign
a) NRIs – Individuals – – – – – – – – –
b) Other – Individuals – – – – – – – – –
c) Bodies Corp. – – – – – – – – –
d) Banks / FI – – – – – – – – –
e) Any Other…. – – – – – – – – –
Sub–total (A)(2):– – – – – – – – – –
Total shareholding of Promoter (A) = (A)(1)+(A)(2)
2,63,44,33,946 – 2,63,44,33,946 93.22 2,63,44,33,946 – 2,63,44,33,946 93.22 –
B. Public Shareholding
(1) Institutions
a) Mutual Funds – – – – – – – – –
b) Banks / FI – – – – – – – – –
c) Central Govt – – – – – – – – –
d) State Govt(s) – – – – – – – – –
e) Venture Capital Funds – – – – – – – – –
f) Insurance Companies – – – – – – – – –
g) FIIs – – – – – – – – –
h) Foreign Venture Capital Funds – – – – – – – – –
i) Others (specify) – – – – – – – – –
Sub–total (B)(1):– – – – – – – – – –
– 5 –
Category of Shareholders
No. of Shares held at the beginning of the year No. of Shares held at the end of the year% Change during the
yearDemat Physical Total % of Total Shares Demat Physical Total % of Total
Shares
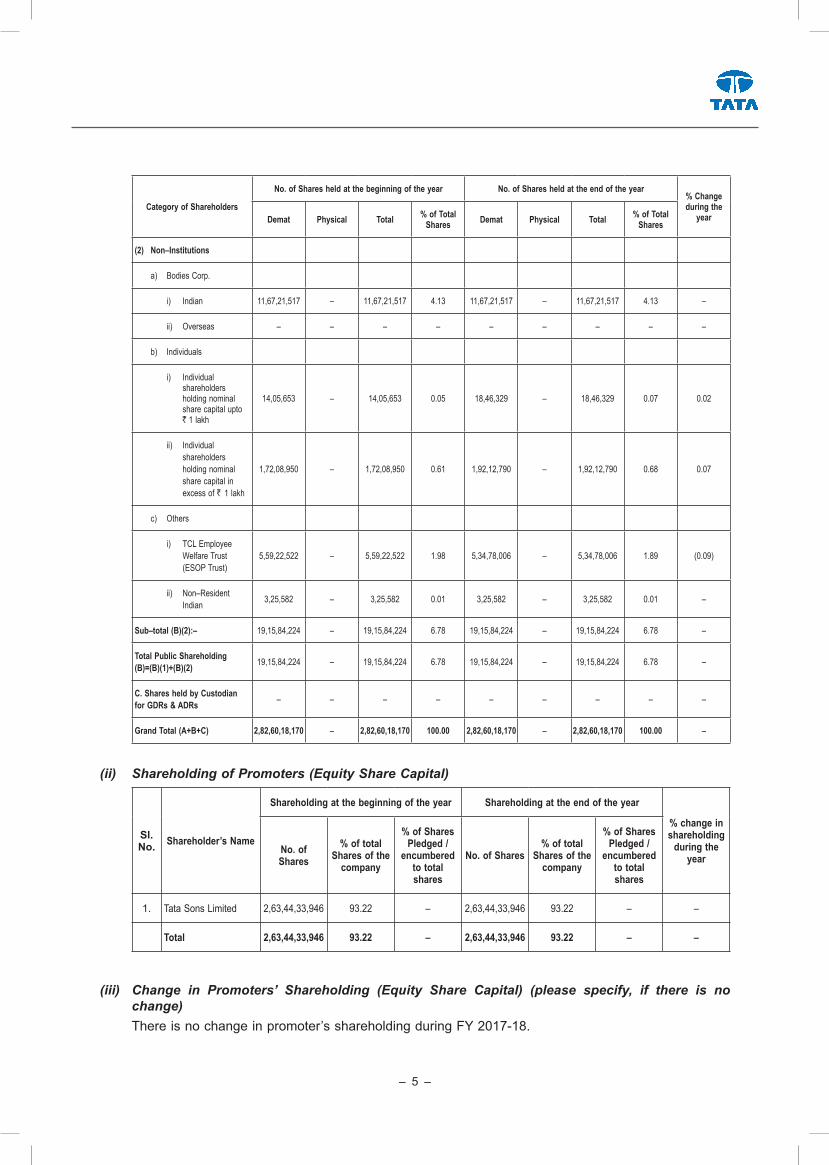
(2) Non–Institutions
a) Bodies Corp.
i) Indian 11,67,21,517 – 11,67,21,517 4.13 11,67,21,517 – 11,67,21,517 4.13 –
ii) Overseas – – – – – – – – –
b) Individuals
i) Individual shareholders holding nominal share capital upto ` 1 lakh
14,05,653 – 14,05,653 0.05 18,46,329 – 18,46,329 0.07 0.02
ii) Individual shareholders holding nominal share capital in excess of ` 1 lakh
1,72,08,950 – 1,72,08,950 0.61 1,92,12,790 – 1,92,12,790 0.68 0.07
c) Others
i) TCL Employee Welfare Trust (ESOP Trust)
5,59,22,522 – 5,59,22,522 1.98 5,34,78,006 – 5,34,78,006 1.89 (0.09)
ii) Non–Resident Indian 3,25,582 – 3,25,582 0.01 3,25,582 – 3,25,582 0.01 –
Sub–total (B)(2):– 19,15,84,224 – 19,15,84,224 6.78 19,15,84,224 – 19,15,84,224 6.78 –
Total Public Shareholding (B)=(B)(1)+(B)(2) 19,15,84,224 – 19,15,84,224 6.78 19,15,84,224 – 19,15,84,224 6.78 –
C. Shares held by Custodian for GDRs & ADRs – – – – – – – – –
Grand Total (A+B+C) 2,82,60,18,170 – 2,82,60,18,170 100.00 2,82,60,18,170 – 2,82,60,18,170 100.00 –
(ii) Shareholding of Promoters (Equity Share Capital)
Sl. No. Shareholder’s Name
Shareholding at the beginning of the year Shareholding at the end of the year
% change in shareholding
during the year
No. of Shares
% of total Shares of the
company
% of Shares Pledged /
encumbered to total shares
No. of Shares % of total
Shares of the company
% of Shares Pledged /
encumbered to total shares
1. Tata Sons Limited 2,63,44,33,946 93.22 – 2,63,44,33,946 93.22 – –
Total 2,63,44,33,946 93.22 – 2,63,44,33,946 93.22 – –
(iii) Change in Promoters’ Shareholding (Equity Share Capital) (please specify, if there is no change)
There is no change in promoter’s shareholding during FY 2017-18.
– 6 –
Annual Report 2017-18
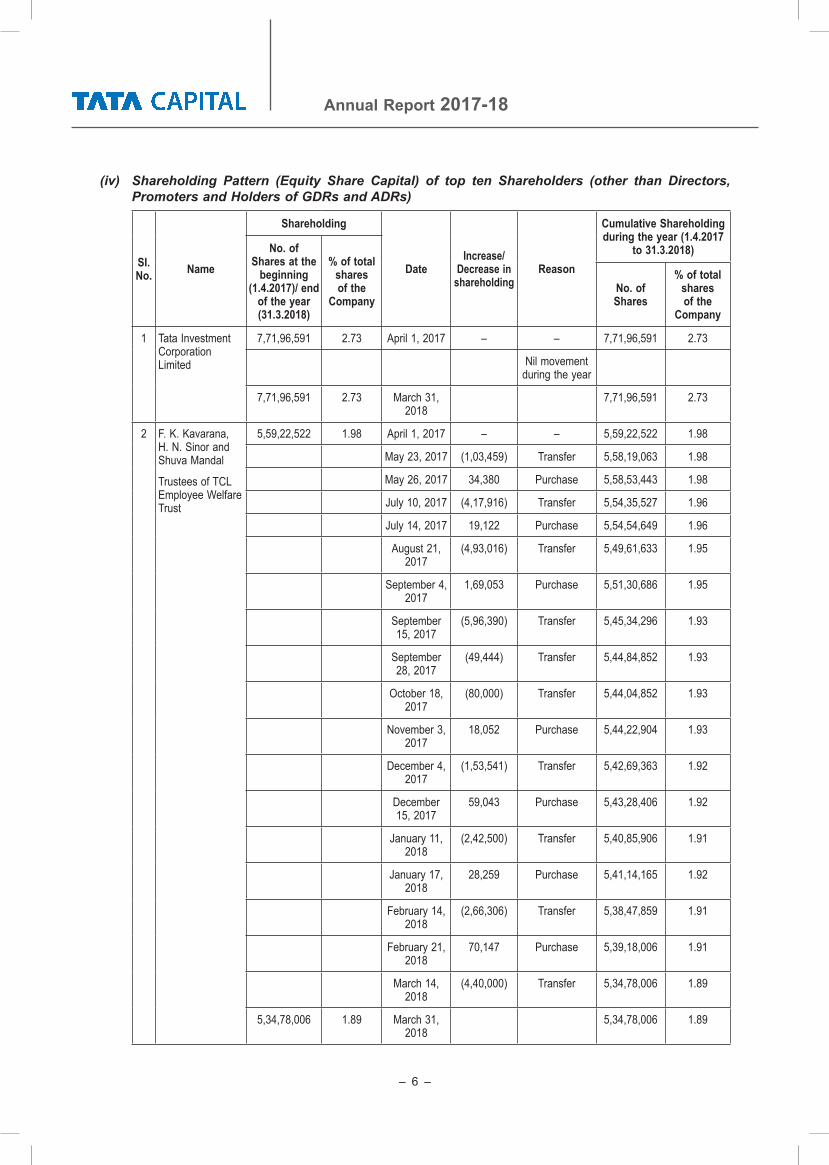
(iv) Shareholding Pattern (Equity Share Capital) of top ten Shareholders (other than Directors, Promoters and Holders of GDRs and ADRs)
SI. No. Name
Shareholding
DateIncrease/
Decrease in shareholding
Reason
Cumulative Shareholding during the year (1.4.2017
to 31.3.2018)No. of Shares at the
beginning (1.4.2017)/ end
of the year (31.3.2018)
% of total shares of the
CompanyNo. of Shares
% of total shares of the
Company
1 Tata Investment Corporation Limited
7,71,96,591 2.73 April 1, 2017 – – 7,71,96,591 2.73
Nil movement during the year
7,71,96,591 2.73 March 31, 2018
7,71,96,591 2.73
2 F. K. Kavarana, H. N. Sinor and Shuva Mandal
Trustees of TCL Employee Welfare Trust
5,59,22,522 1.98 April 1, 2017 – – 5,59,22,522 1.98
May 23, 2017 (1,03,459) Transfer 5,58,19,063 1.98
May 26, 2017 34,380 Purchase 5,58,53,443 1.98
July 10, 2017 (4,17,916) Transfer 5,54,35,527 1.96
July 14, 2017 19,122 Purchase 5,54,54,649 1.96
August 21, 2017
(4,93,016) Transfer 5,49,61,633 1.95
September 4, 2017
1,69,053 Purchase 5,51,30,686 1.95
September 15, 2017
(5,96,390) Transfer 5,45,34,296 1.93
September 28, 2017
(49,444) Transfer 5,44,84,852 1.93
October 18, 2017
(80,000) Transfer 5,44,04,852 1.93
November 3, 2017
18,052 Purchase 5,44,22,904 1.93
December 4, 2017
(1,53,541) Transfer 5,42,69,363 1.92
December 15, 2017
59,043 Purchase 5,43,28,406 1.92
January 11, 2018
(2,42,500) Transfer 5,40,85,906 1.91
January 17, 2018
28,259 Purchase 5,41,14,165 1.92
February 14, 2018
(2,66,306) Transfer 5,38,47,859 1.91
February 21, 2018
70,147 Purchase 5,39,18,006 1.91
March 14, 2018
(4,40,000) Transfer 5,34,78,006 1.89
5,34,78,006 1.89 March 31, 2018
5,34,78,006 1.89
– 7 –
SI. No. Name
Shareholding
DateIncrease/
Decrease in shareholding
Reason
Cumulative Shareholding during the year (1.4.2017
to 31.3.2018)No. of Shares at the
beginning (1.4.2017)/ end
of the year (31.3.2018)
% of total shares of the
CompanyNo. of Shares
% of total shares of the
Company
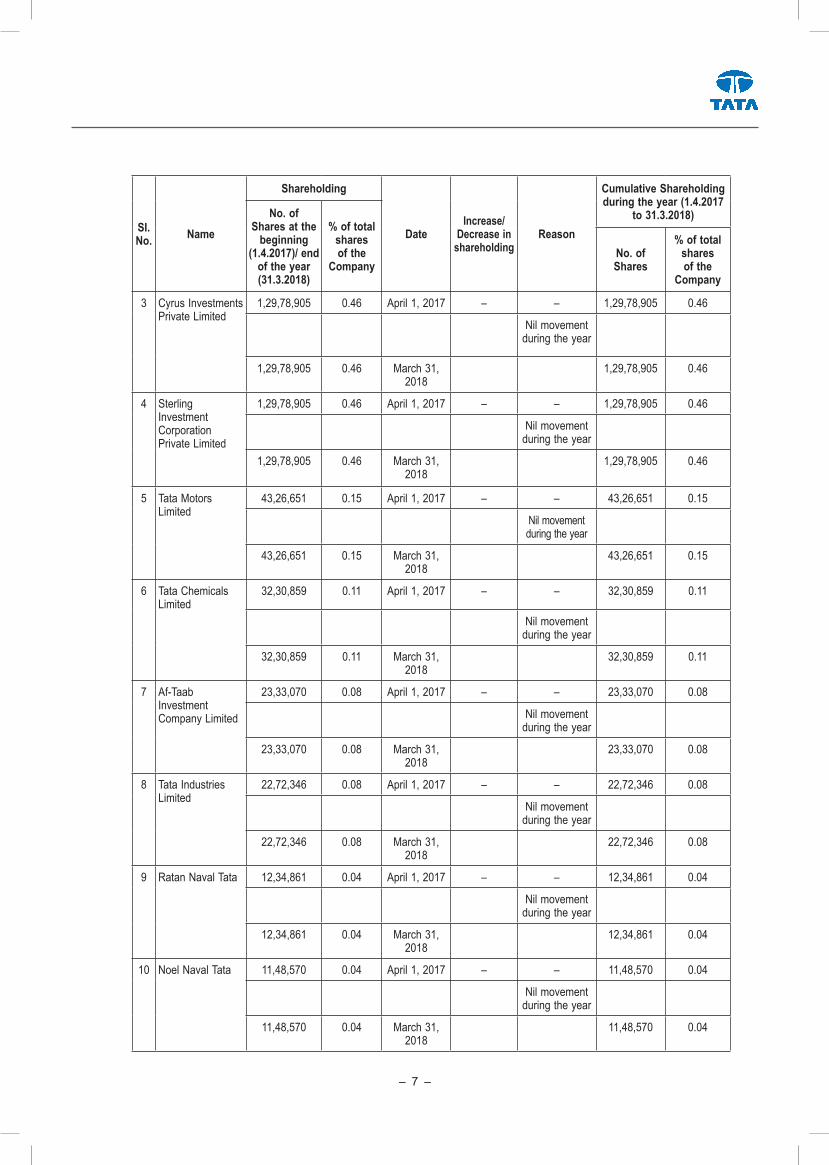
3 Cyrus Investments Private Limited
1,29,78,905 0.46 April 1, 2017 – – 1,29,78,905 0.46
Nil movement during the year
1,29,78,905 0.46 March 31, 2018
1,29,78,905 0.46
4 Sterling Investment Corporation Private Limited
1,29,78,905 0.46 April 1, 2017 – – 1,29,78,905 0.46
Nil movement during the year
1,29,78,905 0.46 March 31, 2018
1,29,78,905 0.46
5 Tata Motors Limited
43,26,651 0.15 April 1, 2017 – – 43,26,651 0.15
Nil movement during the year
43,26,651 0.15 March 31, 2018
43,26,651 0.15
6 Tata Chemicals Limited
32,30,859 0.11 April 1, 2017 – – 32,30,859 0.11
Nil movement during the year
32,30,859 0.11 March 31, 2018
32,30,859 0.11
7 Af-Taab Investment Company Limited
23,33,070 0.08 April 1, 2017 – – 23,33,070 0.08
Nil movement during the year
23,33,070 0.08 March 31, 2018
23,33,070 0.08
8 Tata Industries Limited
22,72,346 0.08 April 1, 2017 – – 22,72,346 0.08
Nil movement during the year
22,72,346 0.08 March 31, 2018
22,72,346 0.08
9 Ratan Naval Tata 12,34,861 0.04 April 1, 2017 – – 12,34,861 0.04
Nil movement during the year
12,34,861 0.04 March 31, 2018
12,34,861 0.04
10 Noel Naval Tata 11,48,570 0.04 April 1, 2017 – – 11,48,570 0.04
Nil movement during the year
11,48,570 0.04 March 31, 2018
11,48,570 0.04
– 8 –
Annual Report 2017-18
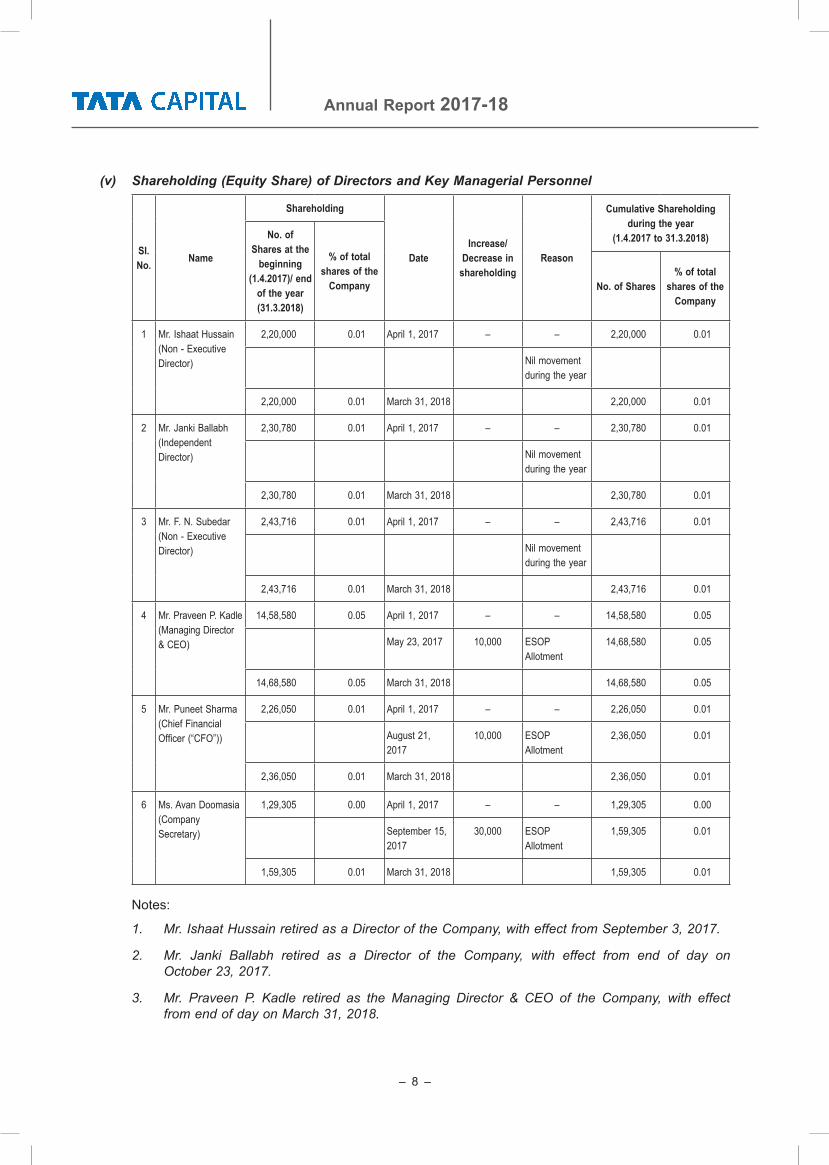
(v) Shareholding (Equity Share) of Directors and Key Managerial Personnel
SI. No. Name
Shareholding
DateIncrease/
Decrease in shareholding
Reason
Cumulative Shareholding during the year
(1.4.2017 to 31.3.2018)No. of Shares at the
beginning (1.4.2017)/ end
of the year (31.3.2018)
% of total shares of the
Company No. of Shares% of total
shares of the Company
1 Mr. Ishaat Hussain (Non - Executive Director)
2,20,000 0.01 April 1, 2017 – – 2,20,000 0.01
Nil movement during the year
2,20,000 0.01 March 31, 2018 2,20,000 0.01
2 Mr. Janki Ballabh (Independent Director)
2,30,780 0.01 April 1, 2017 – – 2,30,780 0.01
Nil movement during the year
2,30,780 0.01 March 31, 2018 2,30,780 0.01
3 Mr. F. N. Subedar (Non - Executive Director)
2,43,716 0.01 April 1, 2017 – – 2,43,716 0.01
Nil movement during the year
2,43,716 0.01 March 31, 2018 2,43,716 0.01
4 Mr. Praveen P. Kadle (Managing Director & CEO)
14,58,580 0.05 April 1, 2017 – – 14,58,580 0.05
May 23, 2017 10,000 ESOP Allotment
14,68,580 0.05
14,68,580 0.05 March 31, 2018 14,68,580 0.05
5 Mr. Puneet Sharma (Chief Financial Officer (“CFO”))
2,26,050 0.01 April 1, 2017 – – 2,26,050 0.01
August 21, 2017
10,000 ESOP Allotment
2,36,050 0.01
2,36,050 0.01 March 31, 2018 2,36,050 0.01
6 Ms. Avan Doomasia (Company Secretary)
1,29,305 0.00 April 1, 2017 – – 1,29,305 0.00
September 15, 2017
30,000 ESOP Allotment
1,59,305 0.01
1,59,305 0.01 March 31, 2018 1,59,305 0.01
Notes:
1. Mr.IshaatHussainretiredasaDirectoroftheCompany,witheffectfromSeptember3,2017.
2. Mr. Janki Ballabh retired as a Director of the Company, with effect from end of day on October23,2017.
3. Mr. Praveen P. Kadle retired as the Managing Director & CEO of the Company, with effectfromendofdayonMarch31,2018.
– 9 –
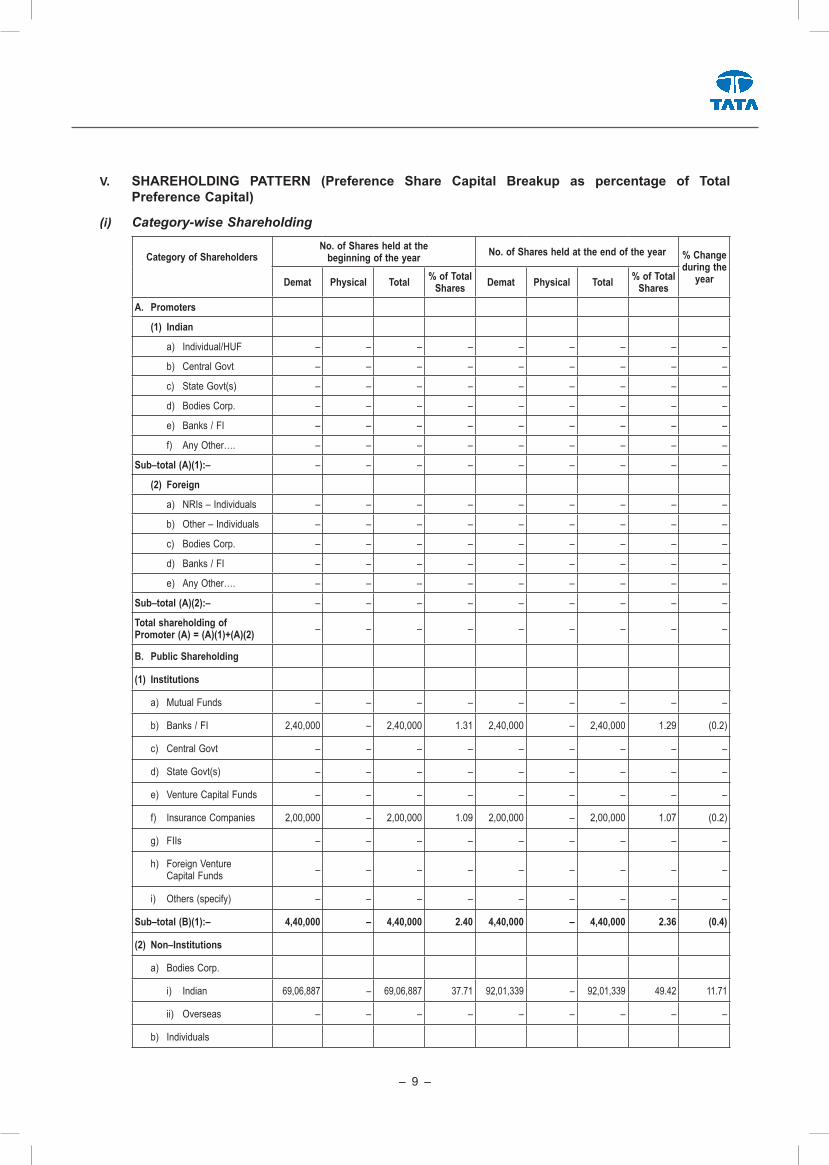
V. SHAREHOLDING PATTERN (Preference Share Capital Breakup as percentage of Total Preference Capital)
(i) Category-wise Shareholding
Category of Shareholders
No. of Shares held at the beginning of the year No. of Shares held at the end of the year % Change
during the yearDemat Physical Total % of Total
Shares Demat Physical Total % of Total Shares
A. Promoters
(1) Indian
a) Individual/HUF – – – – – – – – –
b) Central Govt – – – – – – – – –
c) State Govt(s) – – – – – – – – –
d) Bodies Corp. – – – – – – – – –
e) Banks / FI – – – – – – – – –
f) Any Other…. – – – – – – – – –
Sub–total (A)(1):– – – – – – – – – –
(2) Foreign
a) NRIs – Individuals – – – – – – – – –
b) Other – Individuals – – – – – – – – –
c) Bodies Corp. – – – – – – – – –
d) Banks / FI – – – – – – – – –
e) Any Other…. – – – – – – – – –
Sub–total (A)(2):– – – – – – – – – –
Total shareholding of Promoter (A) = (A)(1)+(A)(2) – – – – – – – – –
B. Public Shareholding
(1) Institutions
a) Mutual Funds – – – – – – – – –
b) Banks / FI 2,40,000 – 2,40,000 1.31 2,40,000 – 2,40,000 1.29 (0.2)
c) Central Govt – – – – – – – – –
d) State Govt(s) – – – – – – – – –
e) Venture Capital Funds – – – – – – – – –
f) Insurance Companies 2,00,000 – 2,00,000 1.09 2,00,000 – 2,00,000 1.07 (0.2)
g) FIIs – – – – – – – – –
h) Foreign Venture Capital Funds – – – – – – – – –
i) Others (specify) – – – – – – – – –
Sub–total (B)(1):– 4,40,000 – 4,40,000 2.40 4,40,000 – 4,40,000 2.36 (0.4)
(2) Non–Institutions
a) Bodies Corp.
i) Indian 69,06,887 – 69,06,887 37.71 92,01,339 – 92,01,339 49.42 11.71
ii) Overseas – – – – – – – – –
b) Individuals
– 10 –
Annual Report 2017-18
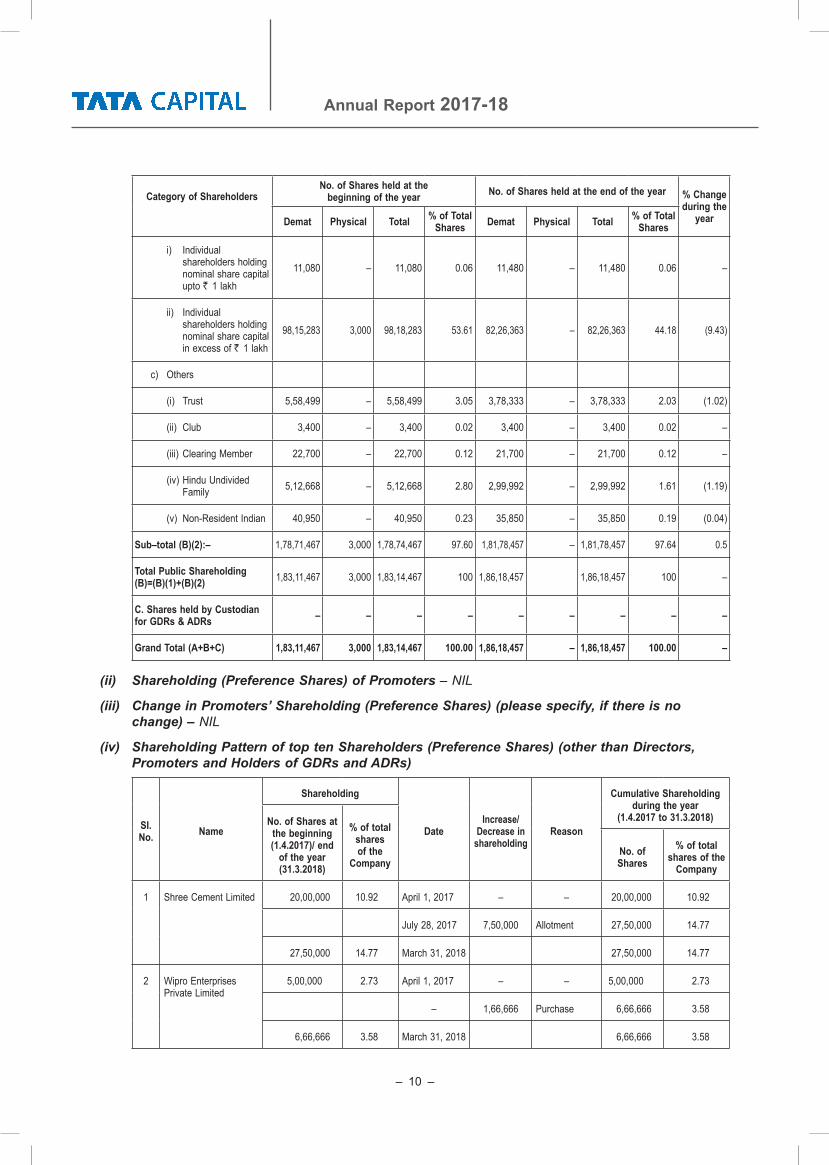
Category of Shareholders
No. of Shares held at the beginning of the year No. of Shares held at the end of the year % Change
during the yearDemat Physical Total % of Total
Shares Demat Physical Total % of Total Shares
i) Individual shareholders holding nominal share capital upto ` 1 lakh
11,080 – 11,080 0.06 11,480 – 11,480 0.06 –
ii) Individual shareholders holding nominal share capital in excess of ` 1 lakh
98,15,283 3,000 98,18,283 53.61 82,26,363 – 82,26,363 44.18 (9.43)
c) Others
(i) Trust 5,58,499 – 5,58,499 3.05 3,78,333 – 3,78,333 2.03 (1.02)
(ii) Club 3,400 – 3,400 0.02 3,400 – 3,400 0.02 –
(iii) Clearing Member 22,700 – 22,700 0.12 21,700 – 21,700 0.12 –
(iv) Hindu Undivided Family 5,12,668 – 5,12,668 2.80 2,99,992 – 2,99,992 1.61 (1.19)
(v) Non-Resident Indian 40,950 – 40,950 0.23 35,850 – 35,850 0.19 (0.04)
Sub–total (B)(2):– 1,78,71,467 3,000 1,78,74,467 97.60 1,81,78,457 – 1,81,78,457 97.64 0.5
Total Public Shareholding (B)=(B)(1)+(B)(2) 1,83,11,467 3,000 1,83,14,467 100 1,86,18,457 1,86,18,457 100 –
C. Shares held by Custodian for GDRs & ADRs – – – – – – – – –
Grand Total (A+B+C) 1,83,11,467 3,000 1,83,14,467 100.00 1,86,18,457 – 1,86,18,457 100.00 –
(ii) Shareholding (Preference Shares) of Promoters –NIL
(iii) Change in Promoters’ Shareholding (Preference Shares) (please specify, if there is no change) – NIL
(iv) Shareholding Pattern of top ten Shareholders (Preference Shares) (other than Directors, Promoters and Holders of GDRs and ADRs)
SI. No. Name
Shareholding
DateIncrease/
Decrease in shareholding
Reason
Cumulative Shareholding during the year
(1.4.2017 to 31.3.2018)No. of Shares at the beginning (1.4.2017)/ end
of the year (31.3.2018)
% of total shares of the
CompanyNo. of Shares
% of total shares of the
Company
1 Shree Cement Limited 20,00,000 10.92 April 1, 2017 – – 20,00,000 10.92
July 28, 2017 7,50,000 Allotment 27,50,000 14.77
27,50,000 14.77 March 31, 2018 27,50,000 14.77
2 Wipro Enterprises Private Limited
5,00,000 2.73 April 1, 2017 – – 5,00,000 2.73
– 1,66,666 Purchase 6,66,666 3.58
6,66,666 3.58 March 31, 2018 6,66,666 3.58
– 11 –
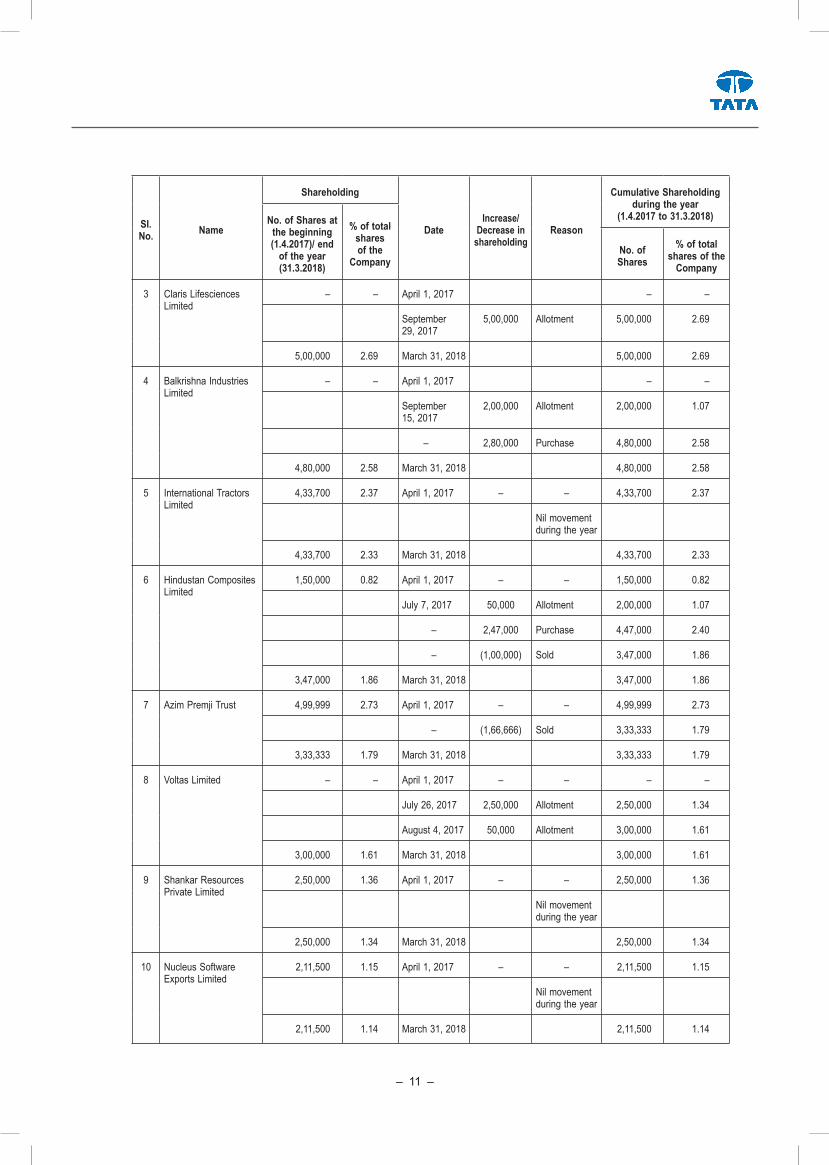
SI. No. Name
Shareholding
DateIncrease/
Decrease in shareholding
Reason
Cumulative Shareholding during the year
(1.4.2017 to 31.3.2018)No. of Shares at the beginning (1.4.2017)/ end
of the year (31.3.2018)
% of total shares of the
CompanyNo. of Shares
% of total shares of the
Company
3 Claris Lifesciences Limited
– – April 1, 2017 – –
September 29, 2017
5,00,000 Allotment 5,00,000 2.69
5,00,000 2.69 March 31, 2018 5,00,000 2.69
4 Balkrishna Industries Limited
– – April 1, 2017 – –
September 15, 2017
2,00,000 Allotment 2,00,000 1.07
– 2,80,000 Purchase 4,80,000 2.58
4,80,000 2.58 March 31, 2018 4,80,000 2.58
5 International Tractors Limited
4,33,700 2.37 April 1, 2017 – – 4,33,700 2.37
Nil movement during the year
4,33,700 2.33 March 31, 2018 4,33,700 2.33
6 Hindustan Composites Limited
1,50,000 0.82 April 1, 2017 – – 1,50,000 0.82
July 7, 2017 50,000 Allotment 2,00,000 1.07
– 2,47,000 Purchase 4,47,000 2.40
– (1,00,000) Sold 3,47,000 1.86
3,47,000 1.86 March 31, 2018 3,47,000 1.86
7 Azim Premji Trust 4,99,999 2.73 April 1, 2017 – – 4,99,999 2.73
– (1,66,666) Sold 3,33,333 1.79
3,33,333 1.79 March 31, 2018 3,33,333 1.79
8 Voltas Limited – – April 1, 2017 – – – –
July 26, 2017 2,50,000 Allotment 2,50,000 1.34
August 4, 2017 50,000 Allotment 3,00,000 1.61
3,00,000 1.61 March 31, 2018 3,00,000 1.61
9 Shankar Resources Private Limited
2,50,000 1.36 April 1, 2017 – – 2,50,000 1.36
Nil movement during the year
2,50,000 1.34 March 31, 2018 2,50,000 1.34
10 Nucleus Software Exports Limited
2,11,500 1.15 April 1, 2017 – – 2,11,500 1.15
Nil movement during the year
2,11,500 1.14 March 31, 2018 2,11,500 1.14
– 12 –
Annual Report 2017-18
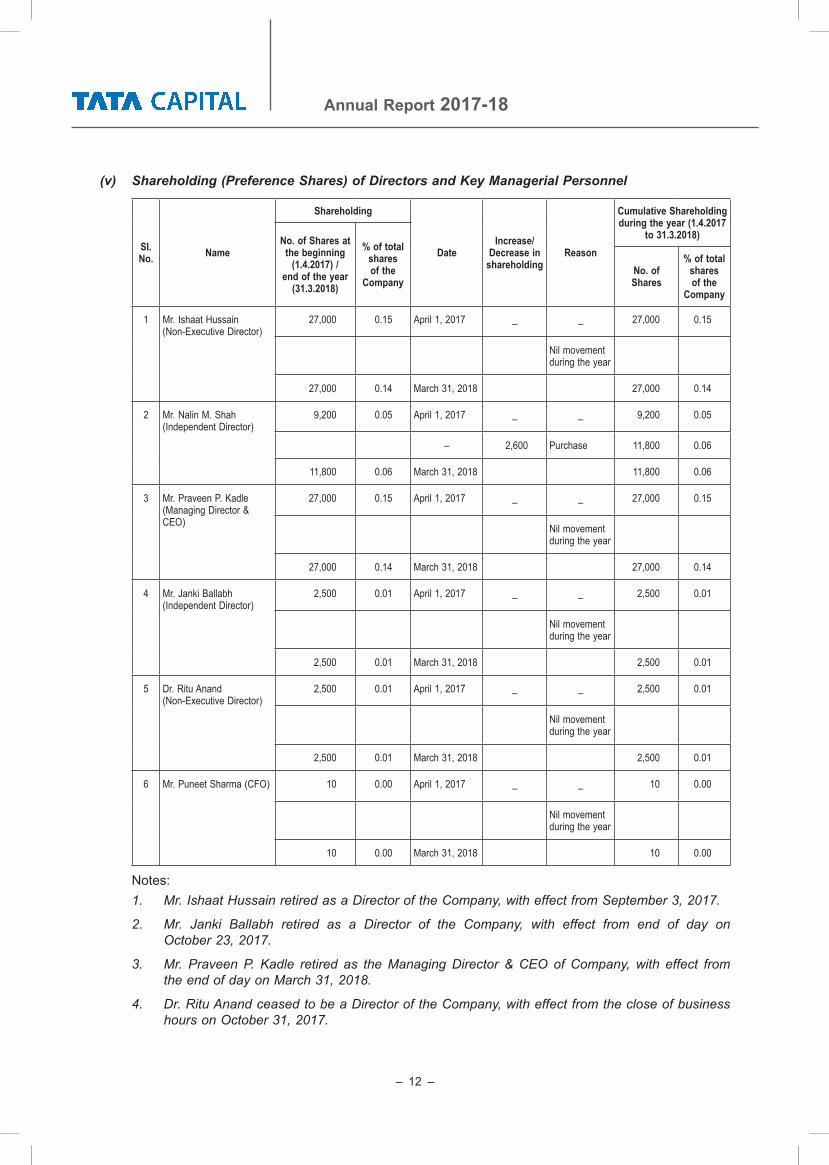
(v) Shareholding (Preference Shares) of Directors and Key Managerial Personnel
SI. No. Name
Shareholding
DateIncrease/
Decrease in shareholding
Reason
Cumulative Shareholding during the year (1.4.2017
to 31.3.2018)No. of Shares at the beginning
(1.4.2017) / end of the year
(31.3.2018)
% of total shares of the
CompanyNo. of Shares
% of total shares of the
Company
1 Mr. Ishaat Hussain (Non-Executive Director)
27,000 0.15 April 1, 2017 – – 27,000 0.15
Nil movement during the year
27,000 0.14 March 31, 2018 27,000 0.14
2 Mr. Nalin M. Shah (Independent Director)
9,200 0.05 April 1, 2017 – – 9,200 0.05
– 2,600 Purchase 11,800 0.06
11,800 0.06 March 31, 2018 11,800 0.06
3 Mr. Praveen P. Kadle (Managing Director & CEO)
27,000 0.15 April 1, 2017 – – 27,000 0.15
Nil movement during the year
27,000 0.14 March 31, 2018 27,000 0.14
4 Mr. Janki Ballabh (Independent Director)
2,500 0.01 April 1, 2017 – – 2,500 0.01
Nil movement during the year
2,500 0.01 March 31, 2018 2,500 0.01
5 Dr. Ritu Anand (Non-Executive Director)
2,500 0.01 April 1, 2017 – – 2,500 0.01
Nil movement during the year
2,500 0.01 March 31, 2018 2,500 0.01
6 Mr. Puneet Sharma (CFO) 10 0.00 April 1, 2017 – – 10 0.00
Nil movement during the year
10 0.00 March 31, 2018 10 0.00
Notes: 1. Mr.IshaatHussainretiredasaDirectoroftheCompany,witheffectfromSeptember3,2017.
2. Mr. Janki Ballabh retired as a Director of the Company, with effect from end of day on October23,2017.
3. Mr. PraveenP. Kadle retired as theManagingDirector &CEO ofCompany,with effect fromtheendofdayonMarch31,2018.
4. Dr.RituAnandceasedtobeaDirectoroftheCompany,witheffectfromthecloseofbusinesshoursonOctober31,2017.
– 13 –
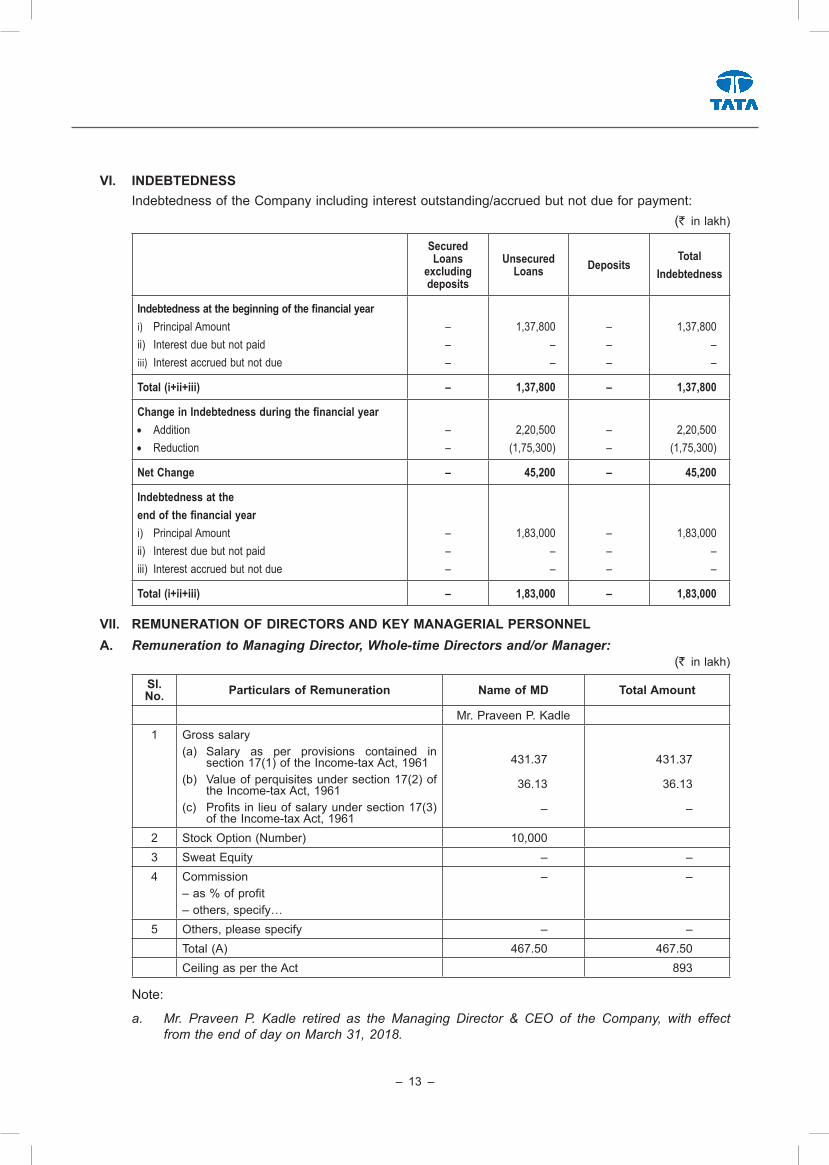
VI. INDEBTEDNESS Indebtedness of the Company including interest outstanding/accrued but not due for payment: (` in lakh)
Secured Loans
excluding deposits
Unsecured Loans Deposits
TotalIndebtedness
Indebtedness at the beginning of the financial yeari) Principal Amountii) Interest due but not paidiii) Interest accrued but not due
–––
1,37,800––
–––
1,37,800––
Total (i+ii+iii) – 1,37,800 – 1,37,800
Change in Indebtedness during the financial year• Addition• Reduction
––
2,20,500(1,75,300)
––
2,20,500(1,75,300)
Net Change – 45,200 – 45,200
Indebtedness at theend of the financial yeari) Principal Amountii) Interest due but not paidiii) Interest accrued but not due
–––
1,83,000––
–––
1,83,000––
Total (i+ii+iii) – 1,83,000 – 1,83,000
VII. REMUNERATION OF DIRECTORS AND KEY MANAGERIAL PERSONNELA. Remuneration to Managing Director, Whole-time Directors and/or Manager:
(` in lakh)
Sl. No. Particulars of Remuneration Name of MD Total Amount
Mr. Praveen P. Kadle1 Gross salary
(a) Salary as per provisions contained in section 17(1) of the Income-tax Act, 1961
(b) Value of perquisites under section 17(2) of the Income-tax Act, 1961
(c) Profits in lieu of salary under section 17(3) of the Income-tax Act, 1961
431.37
36.13
–
431.37
36.13
–
2 Stock Option (Number) 10,0003 Sweat Equity – –4 Commission
– as % of profit– others, specify…
– –
5 Others, please specify – –Total (A) 467.50 467.50Ceiling as per the Act 893
Note:
a. Mr. Praveen P. Kadle retired as the Managing Director & CEO of the Company, with effectfromtheendofdayonMarch31,2018.

– 14 –
Annual Report 2017-18
B. Remuneration to other directors:(` in lakh)
Sl. No.
Particulars of Remuneration Name of Directors Total
Amount
1 Independent Directors Mr. Janki Ballabh Mr. Nalin Shah Mr. Mehernosh B Kapadia
• Fee for attending board / committee meetings
6.90 14.10 8.40 29.40
• Commission 25.00 25.00 – 50.00
• Others, please specify – – – –
Total (1) 31.90 39.10 8.40 79.40
2 Other Non–Executive Directors
Mr. F. N. Subedar
Ms. Aarthi Subramanian
Mr. Saurabh Agrawal
Dr. Ritu Anand
Mr. Ishaat Hussain
• Fee for attending board / committee meetings
4.40 5.10 3.00 3.00 2.00 18.00
• Commission 20.00 – – 20.00 20.00 60.00
• Others, please specify – – – – – –
Total (2) 24.40 5.10 3.00 23.00 22.00 78.00
Total (B)=(1+2) 157.40
Total Managerial Remuneration 624.90
Overall Ceiling as per the Act 1,965
Notes:
a. The Remuneration details as mentioned above include Sitting fees paid in FY 2017-18 andCommissionpaidforFY2016-17inFY2017-18.
b. Mr.IshaatHussainretiredasaDirectoroftheCompany,witheffectfromSeptember3,2017.
c. Mr. Janki Ballabh retired as a Director of the Company, with effect from end of day on October23,2017.
d. Dr.RituAnandceasedtobeaDirectoroftheCompany,witheffectfromthecloseofbusinesshoursonOctober31,2017.
e. Mr. Saurabh Agrawal was appointed as a Director of the Company, with effect fromJuly28,2017.
f. Mr. Mehernosh B. Kapadia was appointed as a Director of the Company, with effect fromOctober24,2017.
g. Ms. Aarthi Subramanian was appointed as a Director of the Company, with effect from October30,2017.
– 15 –
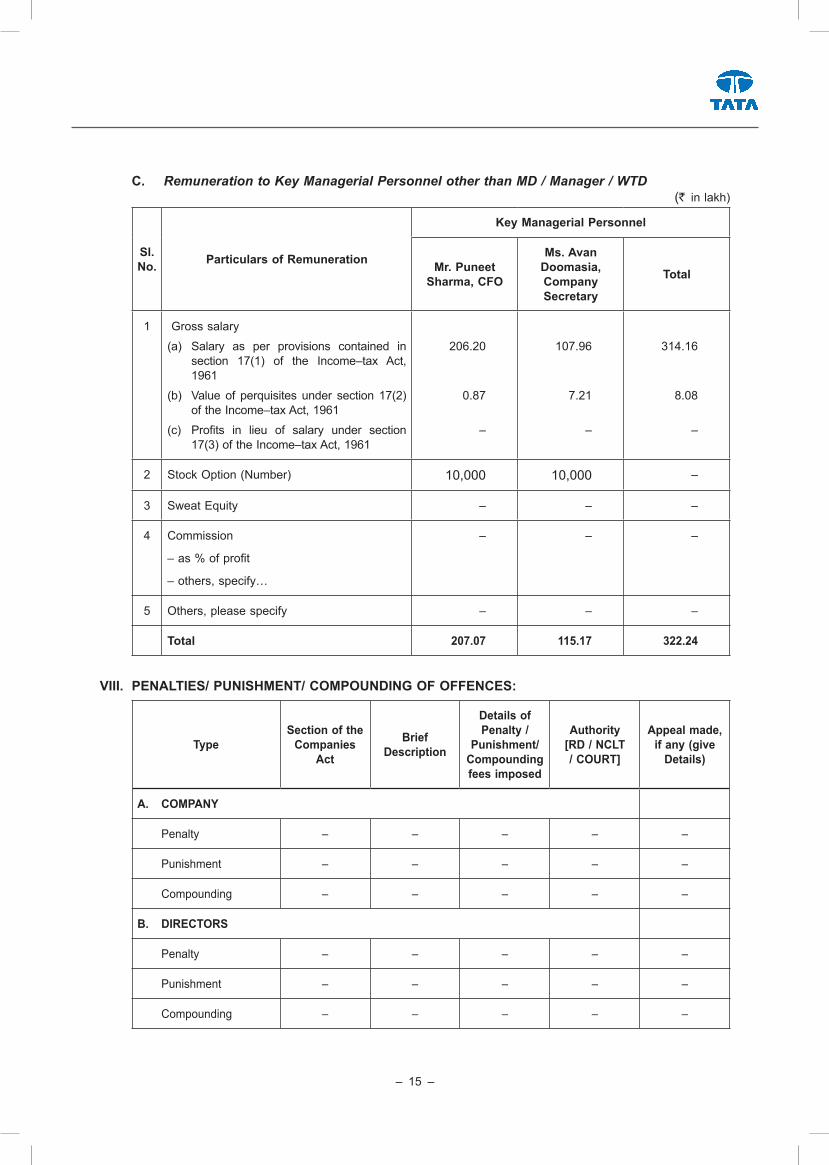
C. Remuneration to Key Managerial Personnel other than MD / Manager / WTD(` in lakh)
Sl. No. Particulars of Remuneration
Key Managerial Personnel
Mr. Puneet Sharma, CFO
Ms. Avan Doomasia, Company Secretary
Total
1 Gross salary
(a) Salary as per provisions contained in section 17(1) of the Income–tax Act, 1961
(b) Value of perquisites under section 17(2) of the Income–tax Act, 1961
(c) Profits in lieu of salary under section 17(3) of the Income–tax Act, 1961
206.20
0.87
–
107.96
7.21
–
314.16
8.08
–
2 Stock Option (Number) 10,000 10,000 –
3 Sweat Equity – – –
4 Commission
– as % of profit
– others, specify…
– – –
5 Others, please specify – – –
Total 207.07 115.17 322.24
VIII. PENALTIES/ PUNISHMENT/ COMPOUNDING OF OFFENCES:
Type Section of the
Companies Act
Brief Description
Details of Penalty /
Punishment/ Compounding fees imposed
Authority [RD / NCLT / COURT]
Appeal made, if any (give
Details)
A. COMPANY
Penalty – – – – –
Punishment – – – – –
Compounding – – – – –
B. DIRECTORS
Penalty – – – – –
Punishment – – – – –
Compounding – – – – –
– 16 –
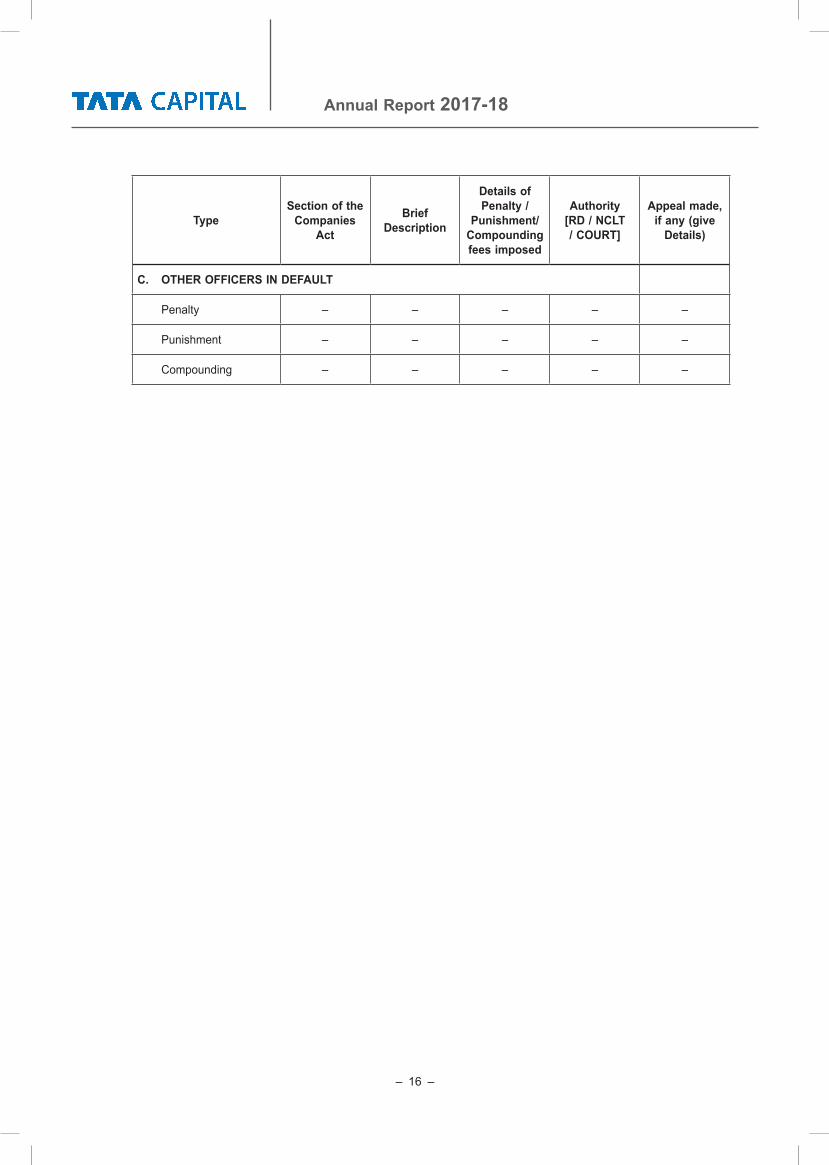
Annual Report 2017-18
Type Section of the
Companies Act
Brief Description
Details of Penalty /
Punishment/ Compounding fees imposed
Authority [RD / NCLT / COURT]
Appeal made, if any (give
Details)
C. OTHER OFFICERS IN DEFAULT
Penalty – – – – –
Punishment – – – – –
Compounding – – – – –


![[XLS]nsdl.co.in S-Z.xls · Web viewANKIT CONSULTANCY PVT LT IN200481 Annually on 30th July Annually on 06th February Annually on 10th March TSR DARASHAW LIMITED IN200125 1-500000](https://img.dokumen.tips/doc/110x75/5afee1ca7f8b9a814d8fac39/xlsnsdlcoin-s-zxlsweb-viewankit-consultancy-pvt-lt-in200481-annually-on-30th.jpg)