Embed Size (px)
Citation preview

ANNEXES 7-13 Technical coexistence issues for the
2.3 and 3.4 GHz award
Publication date: 19 February 2014
Closing Date for Responses: 15 May 2014

Technical coexistence issues for the 2.3 and 3.4 GHz award
1
Contents
Annex Page
7 Assessment of potential interference to Wi-Fi 2
8 Analysis of Licence Exempt uses 68
9 Video and audio measurements 103
10 The impact of spectrum release and sharing on spectrum for wireless cameras in the preferred band 2 to 4 GHz 119
11 Satellite services 142
12 Coordination procedure for MoD sites 159
13 Radar coordination 171

Technical coexistence issues for the 2.3 and 3.4 GHz award
2
Annex 7
7 Assessment of potential interference to Wi-Fi
A7.1 In this annex we set out in more detail the analysis summarised in section 6 of this consultation into the potential risk of interference from LTE-TDD deployments in the 2.3 GHz award band into Wi-Fi in the adjacent 2.4 GHz licence exempt band.
A7.2 In the earlier section we said that interference to Wi-Fi is a possibility, and that a number of networks – 17,400 million domestic networks, 1,270 public networks (1,000 indoor, 270 outdoor) and 8,000 enterprise networks - may be affected. This is likely to result in a reduction in connection speed for users connected to these networks.
A7.3 However, we showed that mitigations are likely to be available in all cases. This could involve a combination of moving devices; upgrading equipment with better filters; or moving to the 5 GHz band. Some of these mitigations may incur some cost.
A7.4 Given that we expect the total number of affected devices to be low, and that mitigations are available in all cases, we consider that the impact of interference to Wi-Fi is limited and that no intervention in the market is necessary, as this would be disproportionate. This annex presents the technical methodology and assessment that has led us to this proposed policy position.
A7.5 Wi-Fi is a popular technology for wireless networking which is used in the majority of households in the UK as the main method of accessing the internet via a DSL connection, as well as providing coverage to commercial and independent hotspots at a wide range of public locations. This annex focuses on standard Wi-Fi usage – other bespoke applications such as medical monitoring devices and transport tracking1 which make use of Wi-Fi are covered separately in section 7 and annex 8.
A7.6 In section 6 we set out our approach for assessing coexistence with users in adjacent bands. Due to the popularity and importance of Wi-Fi it is particularly important in this case to determine if there is any potential risk of interference from future users of the release band.
Possibility of interference
A7.7 Interference and congestion between various devices in the 2.4 GHz licence exempt band is an existing problem which is typically managed through the use of polite protocols. Wi-Fi uses Carrier Sense Multiple Access (CSMA) (sometimes referred to as Listen Before Talk (LBT)) to sense channel occupancy and avoid collisions on the same channel. Other technologies employ dynamic frequency selection and hopping to avoid congested channels and others have sufficiently low duty cycles to be classed as “polite”.
1 Market Study of the LE 2400 MHz band - LE Band Audit, commissioned by the MoD on behalf of Ofcom, February 2013: http://stakeholders.ofcom.org.uk/binaries/consultations/2400-mhz/annexes/market-study.pdf

Technical coexistence issues for the 2.3 and 3.4 GHz award
3
A7.8 However it is possible that Wi-Fi devices will be less resilient to interference from high power users in adjacent bands which have not been accounted for in existing standards and design, and which do not employ the same polite protocols as other lower power users within the 2.4 GHz band.
A7.9 Specifically, the use of CSMA by Wi-Fi gives equitable access to multiple Wi-Fi users due to the random nature of back-off, whereas LTE does not perform any form of channel sensing and may transmit at a high duty cycle. Therefore if the received interfering signal is higher than the Wi-Fi carrier sense threshold, the Wi-Fi devices may be unable to transmit at all, and may suffer from more severe congestion than from other Wi-Fi users.
A7.10 We have identified four categories of Wi-Fi usage which may be at risk of interference from LTE:
i) Domestic – 17.5 million in total
ii) Outdoor public – 4,000 in total
iii) Indoor public (e.g. cafés, pubs, hotels, shopping centres, train stations) – 78,000 in total
iv) Enterprise – 680,000 in total
A7.11 We believe that outdoor networks are the most likely to be affected by interference, if located close to a base station.
Approach for assessing the risk of interference
A7.12 We have assessed the risk of interference to Wi-Fi through a combination of lab and field measurements and theoretical analysis.
Lab measurements
A7.13 We commissioned MASS Consultants Ltd to test the impact of LTE-TDD at 2.3 GHz on a range of different Wi-Fi devices in the lab. 21 devices were tested including routers/access points, smartphones, tablets and laptops. The tests were performed in an anechoic chamber using a simulated LTE-TDD source.
A7.14 The results showed that interference is a possibility in the presence of high LTE signals, resulting in a drop in Wi-Fi throughput. Interference was found to be dominated by blocking rather than out-of-band emissions i.e. it is largely due to the lack of a band-pass filter on the Wi-Fi front end.
A7.15 We have derived blocking levels for each device at the point at which throughput starts to drop, the point at which it drops to 50% of the maximum level, and the point at which it drops below 1Mbps. These levels can vary significantly between different devices. In the worst cases blocking can occur at levels of -47 dBm, equal to the minimum requirement from the relevant IEEE 802.11 standard2. Other devices perform significantly better, with blocking occurring at -11 dBm for the best case device.
2 Derived from nonadjacent channel rejection specification in IEEE Std 802.11-2012, Table 18-15: http://standards.ieee.org/getieee802/download/802.11-2012.pdf

Technical coexistence issues for the 2.3 and 3.4 GHz award
4
A7.16 The blocking level based on the onset of degradation for the median device is used as the main metric for further analysis but we also present results for best and worst to show sensitivity. These are summarised in the following table:
Table A7.1: Blocking levels found in measurements
Device type Blocking level (dBm)
Worst case Median Best case Routers/access points -44 -39 -34
Client devices -47 -35 -11
Field measurements
A7.17 In order to validate the behaviour and results of interference to Wi-Fi devices found in the lab measurements, we have undertaken a range of field tests to understand the likely impacts under representative operating conditions. This has included:
a) Tests on routers in indoor and outdoor environments using a simulated LTE base station. This confirmed that blocking occurs at similar levels to those found in measurements. Interference was found to be highly sensitive to the geometry of the LTE base station – i.e. the received power levels are highly dependent on the position relative to the antenna pattern of the LTE base station. Indoor devices were found to be affected when positioned next to a window, but interference could be mitigated by moving the device deeper in the building.
b) Tests on a client device (a tablet) in an outdoor environment, close to a simulated interfering LTE base station. This showed that the throughput a user achieves can vary significantly depending on user position and device orientation, even without the LTE base station switched on. Thus the impact may be masked by normal variability experienced by the user in many cases, and can often be easily mitigated by moving the affected device.
c) Drive tests on an existing LTE network in 1800 MHz to determine the typical values of received power close to the base station in different environments and network loading conditions. This demonstrated that signal levels high enough to cause interference to Wi-Fi can occur in typical environments at close ranges to base stations, although as noted in the other field tests it is highly dependent on base station geometry and local clutter effects.
Theoretical analysis
A7.18 We have used the blocking levels derived from measurements above in a minimum coupling loss analysis to derive minimum separation distances from typical LTE devices, and in a detailed model to determine the impact of downlink interference on different categories of Wi-Fi usage across the UK.
A7.19 The results from the MCL analysis are presented below:

Technical coexistence issues for the 2.3 and 3.4 GHz award
5
Table A7.2: Minimum separation distances for different LTE deployments
LTE Interferer Wi-Fi Victim EIRP (dBm)
MCL (dB)
Required separation distance*
(m)
Macro cell 20 m Access point
67 106 220
Client 102 160
Small cell 5 m Access point
45 84 55
Client 80 45
Femto cell (max. power) Access point
20 59 9
Client 55 5
Femto cell (typical power) Access point
10 49 3
Client 45 2 Mobile device (max.
power) Access point
23 62 13
Client 58 8 Mobile device (typical
power) Access point
3 42 1
Client 38 1 * Based on Suburban Hata propagation for macro and small cells, free space loss assumed in other cases
A7.20 The macro and small cell ranges are based on suburban propagation; in urban or dense urban environments the required separation distances may be lower.
A7.21 The downlink interference model assumes a nationwide roll-out of 2.3 GHz macro-cell base stations, based on an existing 3G deployment at 2.1 GHz. This is believed to be representative of a pessimistic scenario. If in practice the 2.3 GHz is used for an urban small cell deployment the scale of impacts on a national level are expected to be significantly lower.
A7.22 The model includes known locations of Wi-Fi networks at a postcode level using data from Ofcom’s Infrastructure Report and postcode databases.
A7.23 The main results from the model for our central case of assumptions are presented below:
Table A7.3: Number of Wi-Fi networks predicted to be affected by LTE interference
Routers Client devices
Category Total no. of networks
% Locations affected
Total no. of impacts
% Locations affected
1) Domestic 17,500,000 0.1% 17,400 0.0% 2a) Outdoor public (median device)
4,000 6.8% 270 1.4%
2a) Outdoor public (best device) 4.2% 170 N/A 3) Indoor public 78,000 1.4% 1,100 0.1% 4) Enterprise 680,000 1.2% 8,000 0.1%
Technical coexistence issues for the 2.3 and 3.4 GHz award
6
A7.24 These results show that interference has the potential to affect several thousand networks, however this represents a small percentage of the overall number of Wi-Fi networks. These figures are based on the onset of degradation for routers, and a 50% drop in throughput for client devices. In some cases impacts may be less noticeable to the user.
A7.25 We note that while the numbers are low on a national basis, for networks which are affected interference may present a significant problem to all users of the networks. For example outdoor networks located close to an LTE base station e.g. in a dense urban area, may have a large proportion of their coverage area affected.
A7.26 These results rely on a range of assumptions and therefore contain some level of uncertainty. We have chosen assumptions which tend to be slightly pessimistic in cases of uncertainty. In practice impacts could be higher or lower, but we believe this analysis is reasonable to determine the scale of impact for use in our policy assessment.
A7.27 A sensitivity analysis is included in this annex to indicate the variations with certain assumptions.
Mitigations
A7.28 Interference can be mitigated through a range of options. The relative effectiveness of these depends on the scenario but include:
a) Moving devices
b) Upgrading equipment
c) Switching to 5 GHz spectrum
A7.29 We believe that the vast majority of interference cases can be mitigated through one or more of the above. In extreme cases of interference to legacy devices in domestic networks, a wired connection may be required to restore connectivity.
Document structure
A7.30 The remainder of this annex is structured as follows:
a) Wi-Fi technology – an overview of Wi-Fi standards and channelling arrangements;
b) Extent of Wi-Fi usage in the UK – an estimation of the total number of Wi-Fi networks in different categories of usage;
c) Possible interference scenarios – an outline of the interference problem and geometries where it may occur;
d) International experience - an overview of the status of the 2.3 GHz band in other countries;
e) Lab measurements – the results of our campaign of lab measurements to determine interference levels for a range of different devices;
Technical coexistence issues for the 2.3 and 3.4 GHz award
7
f) Field measurements – the results of three separate campaigns of field measurements to validate the behaviour seen in lab measurements, including investigations into the impacts to routers and client devices, and drive tests on a real LTE deployment;
g) Theoretical analysis of interference – a detailed assessment of the theoretical risk of interference including a calculation of minimum separation distances, methodology, assumptions and results from a model to calculate downlink interference across the UK;
h) Mitigation of interference – an assessment of the different options available to mitigate interference;
i) Conclusions – a brief summary of findings from this analysis.
Wi-Fi technology
A7.31 Wi-Fi (“Wireless Fidelity”) is a technology which uses the IEEE 802.11 family of WLAN standards. The Wi-Fi brand is maintained by the Wi-Fi Alliance whose aim is to ensure interoperability between all WLAN devices.
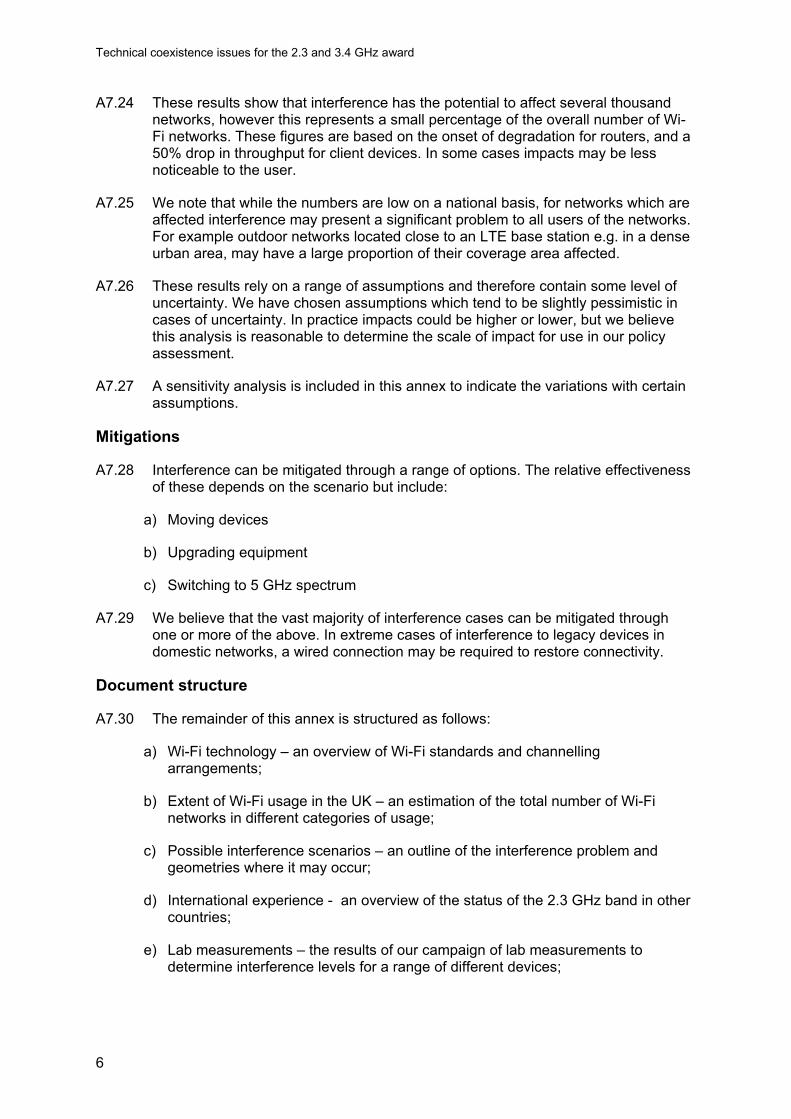
A7.32 Wi-Fi technology makes use of both the 2.4 GHz and 5 GHz licence exempt bands. The support for each band and the maximum data-rate depends on which version of the IEEE 802.11 standard is employed, as outlined in the following table:
Table A7.4: IEEE 802.11 standard versions
Standard version
Bands supported
(GHz)
Max. channel
bandwidth (MHz)
Max. PHY data-rate
(Mbps)
Approx. max.
throughput (Mbps) 3 4
Release date
UK usage
a 5 20 54 25 1997 High b 2.4 22 11 6 1999 Medium g 2.4 20 54 22 2003 High n 2.4 and 5 40 600 420 2009 Medium ac 5 160 6930 4900 2014 Low
A7.33 Most existing devices in the UK support both b and g modes and therefore 2.4 GHz is currently the most popular band5. 802.11n and the usage of 5 GHz have increased in popularity recently due to the higher data-rate and the problems of congestion in the 2.4 GHz band, as well as recent improvements in cost and battery efficiency of 5 GHz devices. The majority of new devices on the market now support
3 Capacity, Coverage and Deployment Considerations for IEEE 802.11g, Cisco, 2005: http://www.cisco.com/en/US/products/hw/wireless/ps430/products_white_paper09186a00801d61a3.shtml 4 802.11ac: The Fifth Generation of Wi-Fi - Technical White Paper, Cisco, January 2014: http://www.cisco.com/en/US/prod/collateral/wireless/ps5678/ps11983/white_paper_c11-713103.html#wp9000354 5 The future role of spectrum sharing for mobile and wireless data services - Licensed sharing, Wi-Fi, and dynamic spectrum access, Ofcom, August 2013, paragraph 3.13: http://stakeholders.ofcom.org.uk/consultations/spectrum-sharing/
Technical coexistence issues for the 2.3 and 3.4 GHz award
8
802.11n at 5 GHz6. The most recent version of the standard (802.11ac) only operates in 5 GHz spectrum7 (although devices are expected to be backward compatible with other versions) and is not yet widely deployed.
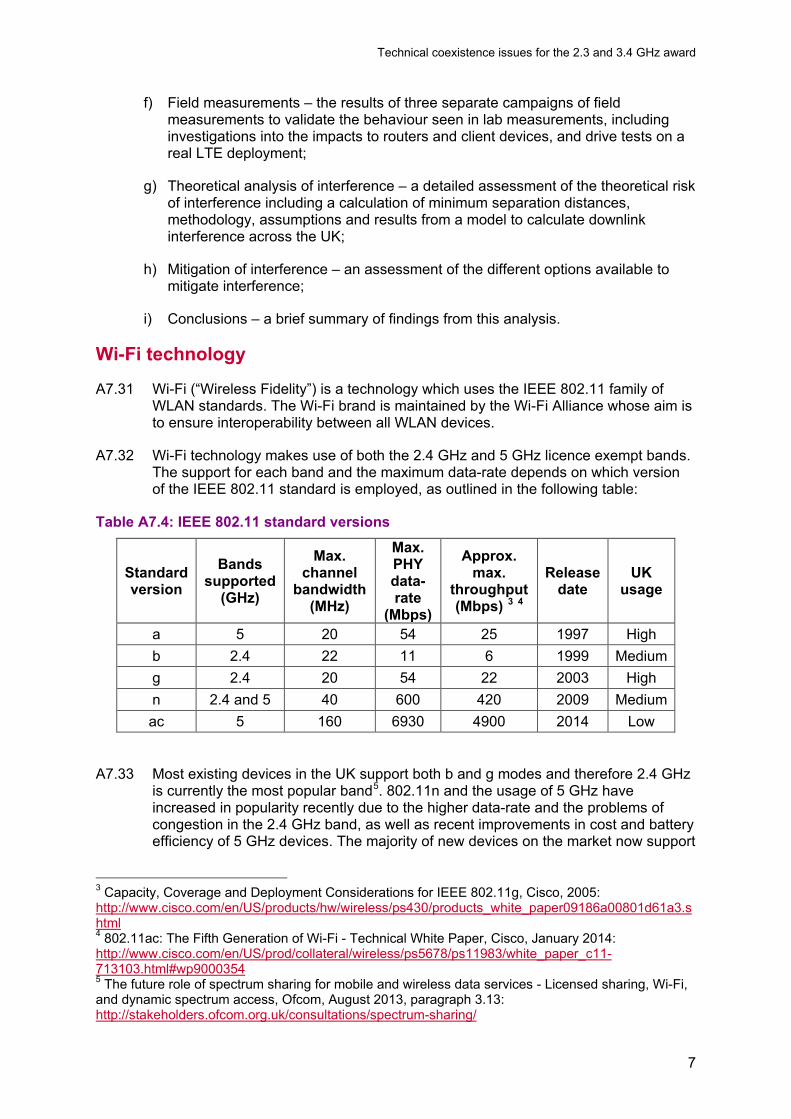
A7.34 The 2.4 GHz band has 13 overlapping channels of 5 MHz spacing within 2400 to 2483.5 MHz as set out below:
Figure A7.1: Wi-Fi channels in the 2.4 GHz band
22 MHz
5 MHz
12.412
22.417
32.422
42.427
52.432
62.437
72.442
82.447
92.452
102.457
112.462
122.467
132.472
Channel NumberCentre Frequency
(GHz)
A7.35 The occupied bandwidth for 802.11b is 22 MHz; therefore the three non-overlapping channels 1, 6 and 11 are most commonly used – as illustrated above. For 802.11g and 802.11n the occupied bandwidth is 20 MHz, which means four channels 1, 5, 9 and 13 can be used without overlap, however the 3 channel plan of 1, 6 and 11 is still more common in many locations due to the continued requirement to support 802.11b devices.
A7.36 A comparison of Wi-Fi usage in the 2.4 GHz and 5 GHz bands has been undertaken recently by MASS Consultants Ltd in a study commissioned by Ofcom8. The report shows the 2.4 GHz band is widely used for Wi-Fi and other services, while the 5 GHz band is currently much quieter. Wi-Fi usage in the 2.4 GHz band is higher in shopping centres and cafés than in apartments and houses. However the overall spectrum occupancy remains moderate in the 2.4 GHz band.
A7.37 The degradation of Wi-Fi network performance is mainly due to the interference from neighbouring Wi-Fi networks using overlapped Wi-Fi channels, rather than the interference from other in-band wireless services such as Bluetooth, analogue video senders etc. The report also suggests that the probability of interference from other Wi-Fi networks can be reduced either by only using non-overlapping channels within the 2.4 GHz band, or migrating to the 5 GHz band where overlapping channels are not allowed.
A7.38 Coexistence between different Wi-Fi devices on the same network is maintained through the use of carrier sensing, where if the channel is detected to be busy, devices are required to wait for a random back-off time before transmitting in order to avoid frame collisions.
6 ibid, paragraph 3.15. Supported by web research of popular smartphone and tablet devices. Additionally, ISPs are starting to supply 5 GHz capable routers 7 This is partly to avoid interference from other users in 2.4 GHz, and also because only a single 80 MHz channel would be available in 2.4 GHz – see footnote 4 8 Utilisation of key licence exempt bands and the effects on WLAN performance, MASS, June 2013: http://stakeholders.ofcom.org.uk/market-data-research/other/technology-research/2013/key-licence-exempt-bands/

Technical coexistence issues for the 2.3 and 3.4 GHz award
9
A7.39 Dynamic Channel Allocation (DCA) is implemented in many Wi-Fi access points to avoid congestion and improve performance. It enables the access point to select the best available channel at start-up.
Extent of Wi-Fi usage in the UK
Introduction
A7.40 We have categorised typical usage of Wi-Fi in the UK into four separate categories as set out below:
i) Domestic networks – mainly used to access a broadband connection. Routers are typically supplied and maintained by ISPs, although in some cases users may buy their own router;
ii) Outdoor public commercial networks – typically managed and maintained by commercial ISPs (e.g. outdoor coverage provided from lampposts and phone boxes);
iii) Indoor public networks (e.g. cafés, pubs, hotels, shopping centres, train stations). This includes networks installed and centrally managed by large ISPs and also networks which are independently installed and run by the business owner;
iv) Medium and large enterprise networks in offices – maintained by IT departments who will have control over both access points and client devices.
A7.41 It is useful to distinguish between categories 2 and 3 (outdoor and indoor commercial networks) as outdoor access points are likely to have a higher risk of interference. This is explored in detail in the following section.
A7.42 While in all cases there is some level of control over the router/access point by the ISP or an IT department, we note that with the possible exception of enterprise networks there is no centralised control over client devices.
A7.43 This list only considers usage of Wi-Fi for standard wireless networking. Our market study of the wider usage of the 2.4 GHz licence exempt band found that Wi-Fi technology is also used for some bespoke applications such as medical monitoring and transport tracking (see footnote 1). Additionally the Wi-Fi Alliance certified products list9 includes applications such as wireless mice and keyboards, wireless audio systems and smart energy devices. We believe that usage of these other applications is low in the context of overall Wi-Fi usage, as our market studies and Call for Inputs on the use of the 2.4 GHz band did not identify these as significant10.
A7.44 While we have not addressed these applications specifically the technical analysis and conclusions in this annex as well as the technical analysis for similar devices using other technologies outlined in annex 8 should still be considered relevant.
Number of networks in each category
A7.45 Due to their licence exempt nature, it is difficult to define accurately the number of Wi-Fi networks in each category. Our approach and estimates of this is outlined below.
9Wi-Fi Alliance certified products list: http://certifications.wi-fi.org/search_products.php 10 http://stakeholders.ofcom.org.uk/consultations/2.3-3.4-ghz/
Technical coexistence issues for the 2.3 and 3.4 GHz award
10
1) Domestic
A7.46 The most common usage of Wi-Fi is to access wirelessly a DSL or cable connection from anywhere within the home using a laptop, smartphone, PC or tablet. Other in-home networking applications such as media streaming between devices are becoming increasingly popular.
A7.47 Ofcom’s latest Communication Market Report 2013 states that 72% of households use broadband and 89% of these access it via a Wi-Fi connection11. Therefore we can assume that 64% of UK households, or 17.5 million in total, have a Wi-Fi network. This category also includes a significant number of domestic networks which provide public coverage (e.g. through BT Fon12) to outdoor users.
2) Outdoor public
A7.48 There are several ISPs providing outdoor Wi-Fi coverage in the UK. Based on discussions with a number of ISPs we estimate that there are approximately 4,000 postcode locations with outdoor hotspots in the UK. In many cases multiple access points will be in use in one postcode.
A7.49 However, this figure only considers access points which are located outdoors. In practice a significant number of networks in categories 1, 3 and 4 will also be providing outdoor coverage from an access point located indoors.
3) Indoor public
A7.50 Public Wi-Fi hotspots in locations such as cafés, pubs, hotels, shopping centres and airports are often managed by large ISPs, for example through a commercial agreement with a café chain owner. In most cases the network equipment will be installed and maintained by the ISP; however there are also some cases where the business owner maintains the equipment with the ISP running a public access layer on top of this via a web interface.
A7.51 Based on information in Ofcom’s Infrastructure Report 2013 Update13 and from discussions with ISPs, we estimate there are approximately 30,000 indoor public commercially run networks in the UK.
A7.52 There are also a significant number of public networks which are privately run by the business owner without involvement of a large ISP – e.g. an independently run café or pub providing free Wi-Fi access to their customers. Some of these are managed by a small commercial ISP running an over the top web interface.
A7.53 It is difficult to determine the total number of networks of this type due to the independent nature of the networks. Based on publicly available information of total number of cafes14, pubs15 and hotels in the UK16 and assumptions on likely
11 Ofcom Communications Market Report 2013, Figure 4.17: http://stakeholders.ofcom.org.uk/market-data-research/market-data/communications-market-reports/cmr13/uk/ 12 BT Wi-Fi claim to have over 5 million hotspots in the UK – the majority of these are domestic Wi-Fi networks providing public access through Fon: http://www.btwifi.com/find/uk/ 13 Ofcom Infrastructure Report – 2013 Update: http://stakeholders.ofcom.org.uk/binaries/research/telecoms-research/infrastructure-report/IRU_2013.pdf 14 Britain’s coffee love affair: by numbers, The Telegraph, March 2011: http://www.telegraph.co.uk/finance/newsbysector/retailandconsumer/8357456/Britains-coffee-love-affair-by-numbers.html

Technical coexistence issues for the 2.3 and 3.4 GHz award
11
proportions of each using Wi-Fi17, we assume a total of 48,000 indoor public independent networks.
A7.54 Combining the 30,000 commercial networks and the 48,000 independent networks, we assume there are 78,000 indoor public networks in the UK.
A7.55 This figure is based on the number of business premises where coverage is provided; for larger premises such as shopping centres and hotels multiple access points will be in use.
4) Enterprise
A7.56 Many offices and other businesses use Wi-Fi networks. According to data from the Office for National Statistics18 there are a total of 680,000 workplaces in the UK with 10 or more employees. We assume this figure is a reasonable proxy for the total number of medium and large enterprise Wi-Fi networks in the UK. The actual number may be lower as not all businesses use Wi-Fi.
A7.57 We have not considered the additional 1.6 million workplaces with less than 10 employees – as we note that there is less certainty in the likelihood of Wi-Fi being used here, and additionally there will be significant overlap with the other categories – in particular domestic networks which are likely to contain a significant number of home and small businesses.
Summary
A7.58 The total number of networks in each category is summarised in the following table:
Table A7.5: Total number of Wi-Fi networks in each category19
Category Description Total no. of networks 1 Domestic 17,500,000 2 Outdoor public 4,000 3 Indoor public 78,000 4 Enterprise 680,000
A7.59 As noted above, there is significant uncertainty in the figures for categories 3 and 4. Additionally in all cases roll-out of Wi-Fi is continuing to increase, so these figures can be expected to rise in the near future. However we believe these estimates are a reasonable guide for the purpose of this analysis.
15 British Beer And Pub Association statistics: http://www.beerandpub.com/statistics 16 Number of hotels and hotel rooms in the UK, Office of National Statistics, 2011: http://www.ons.gov.uk/ons/about-ons/business-transparency/freedom-of-information/what-can-i-request/previous-foi-requests/travel-and-transport/number-of-hotels-and-hotel-rooms/index.html 17 We have assumed Wi-Fi networks in 50% of cafés (6,000 of 12,000), 30% of pubs (12,000 of 41,000) and 80% of hotels (30,000 of 37,000). Locations known to have ISP managed networks have been removed from the totals (as these have already been accounted for). It is noted that there may be other types of business to consider here, but we believe this figure is a reasonable estimate. 18 Size of firms in London and UK by enterprise size, 2001-12, Office of National Statistics, July 2013: http://www.ons.gov.uk/ons/publications/re-reference-tables.html?edition=tcm%3A77-314221 19 All figures are for the UK. It should be noted that the 2.3 GHz band is not being awarded in Northern Ireland, and therefore Wi-Fi networks in Northern Ireland are not at risk of interference

Technical coexistence issues for the 2.3 and 3.4 GHz award
12
Possible interference scenarios
Introduction
A7.60 In this section we explore the possible scenarios where interference from LTE-TDD into Wi-Fi may occur based on the typical deployment geometries of each system. The possible mechanisms of interference are determined, and the effect this will have as experienced by the user of Wi-Fi.
Interference scenarios
A7.61 The use of TDD in the release band means that there is a risk of interference from both base stations (downlink) and user equipment (mobiles/uplink). That means the frequency separation from both uplink and downlink is the same, unlike coexistence issues at other LTE-FDD bands such as 800 MHz where either the uplink or the downlink usually dominates. Base stations could be assumed to be the worst case due to the higher maximum EIRP (64 dBm for a 10 MHz channel vs 23 dBm), however this can be offset by the fact that user devices are likely to be used in closer proximity to a Wi-Fi device.
A7.62 Interference could be experienced by either the Wi-Fi access point (router) or the client device (e.g. laptop, smartphone, tablet). Coexistence within the same device (e.g. a mobile handset with both 2.3 GHz LTE and Wi-Fi capabilities) is not considered in this annex, as it is assumed that this is accounted for in the design of the device and in relevant standards20.
A7.63 Wi-Fi usage is predominately indoors which means interfering signals may be attenuated by wall loss, however there are also a significant number of outdoor networks (Wi-Fi network category 2), and cases where a client may be outdoors connected to an indoor access point (e.g. BT Fon).
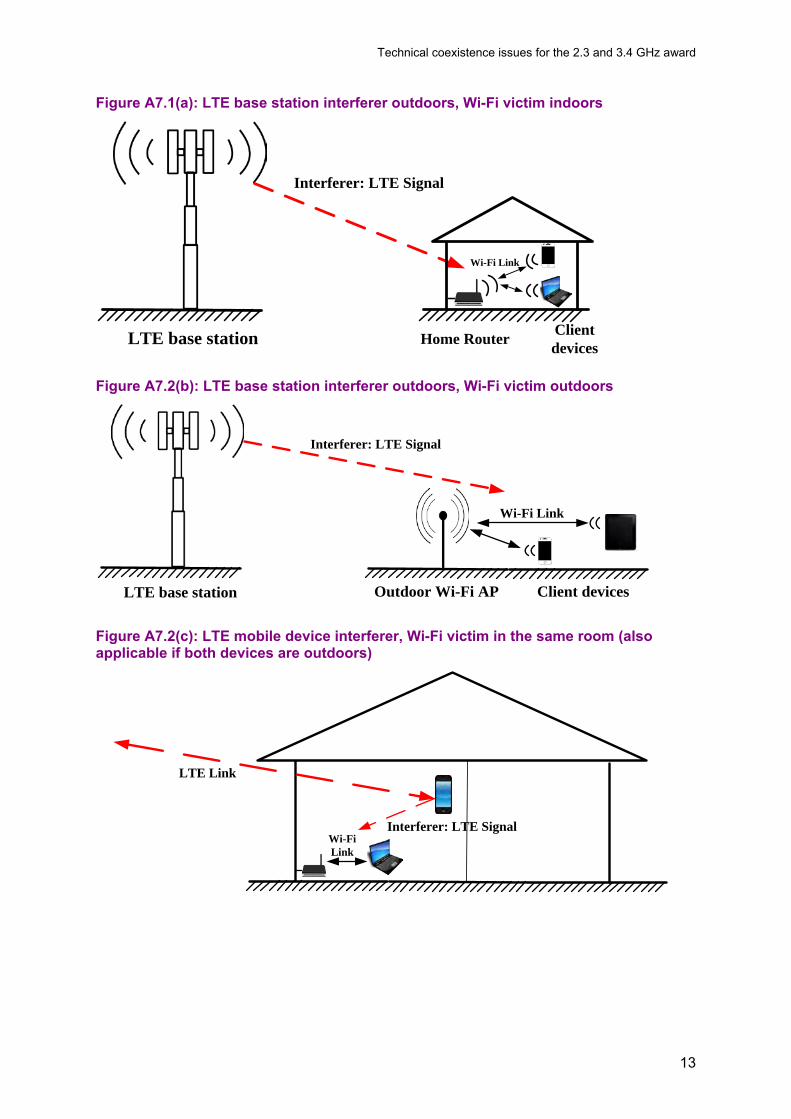
A7.64 Taking all of this into account, the following interference geometries are possible:
i) LTE base station interferer outdoors, Wi-Fi victim indoors
ii) LTE base station interferer outdoors, Wi-Fi victim outdoors
iii) LTE mobile device interferer, Wi-Fi victim in the same room (or both outdoors)
iv) LTE mobile device interferer, Wi-Fi victim in the adjacent room
v) LTE mobile device interferer outdoors, Wi-Fi victim indoors (also applies to interferer indoors, victim outdoors)
A7.65 These are illustrated in the following figures:
20 3GPP TR 36.816 v11.2.0, Evolved Universal Terrestrial Radio Access (E-UTRA); Study on signalling and procedure for interference avoidance for in-device coexistence: http://www.3gpp.org/DynaReport/36816.htm
Technical coexistence issues for the 2.3 and 3.4 GHz award
13
Figure A7.1(a): LTE base station interferer outdoors, Wi-Fi victim indoors
LTE base station Home Router Client devices
Wi-Fi Link
Interferer: LTE Signal
Figure A7.2(b): LTE base station interferer outdoors, Wi-Fi victim outdoors
LTE base station Outdoor Wi-Fi AP Client devices
Interferer: LTE Signal
Wi-Fi Link
Figure A7.2(c): LTE mobile device interferer, Wi-Fi victim in the same room (also applicable if both devices are outdoors)
Wi-Fi Link
LTE Link
Interferer: LTE Signal

Technical coexistence issues for the 2.3 and 3.4 GHz award
14
Figure A7.2(d): LTE mobile device interferer, Wi-Fi victim in the adjacent room
Wi-Fi Link
LTE Link
Interferer: LTE Signal
Figure A7.2(e): LTE mobile device interferer outdoors, Wi-Fi victim indoors (also applies to interferer indoors, victim outdoors)
Wi-Fi Link
LTE LinkInterferer: LTE Signal
A7.66 In each of the base station geometries the specific combination of base station height, antenna downtilt and vertical beamwidth will have a significant impact on the probability of interference, as there will be certain ranges where the Wi-Fi victim is not within the main beam of the base station’s antenna and thus the interfering signal strengths are much lower. This is illustrated in the following diagram:

Technical coexistence issues for the 2.3 and 3.4 GHz award
15
Figure A7.2: The effect of antenna discrimination on interference
LTE base station
Wi-Fi AP2
Wi-Fi AP1 1st 3dB
breakpoint2nd 3dB
breakpointBoresight
d3dB1
d3dB2
dboresight
A7.67 In Figure A7.3 the red dotted line represents the antenna boresight and the blue dotted lines represent the extents of the antenna’s main beam. In this scenario Wi-Fi AP2 can be expected to be more adversely affected by interference than Wi-Fi AP1, despite being located further from the interfering base station, due to the effect of antenna discrimination.
A7.68 Based on information of an actual deployment of UMTS at 2.1 GHz, which is close enough in frequency to be a representative suitable proxy for a 2.3 GHz deployment, we assume a typical antenna gain of 18 dBi with a vertical beamwidth of 8 degrees and a downtilt of 6 degrees as representative for a macro cell deployment. We also consider the case of a small cell with a lower EIRP of 45 dBm and antenna gain of 8 dBi.
A7.69 These are summarised in the following table. The distance to the boresight (dboresight) and 3dB breakpoints (d3dB1, d3dB2) of the antenna’s main beam for a receiver at a height of 1.5 metres are also shown.
Table A7.6: Base station deployment scenarios
Scenario Antenna height (m)
EIRP (dBm)
Antenna gain (dBi)
Vertical beamwidth (degrees)
Downtilt (degrees)
dboresight (m)
d3dB1 (m)
d3dB2 (m)
Macro cell 20 67 18 8 6 176 105 530 Small cell 5 45 8 60 0 N/A 6 N/A
A7.70 These geometries and base station reference scenarios will be considered in the
theoretical interference range calculations in later sections.
Interference mechanisms
A7.71 There are two main mechanisms that can cause interference to wireless systems – out of band emissions and receiver selectivity. These are illustrated in Figure A7.4 and explained in further detail below. Both of these mechanisms can contribute equally to the impact of interference, or one can dominate depending on the specific systems.

Technical coexistence issues for the 2.3 and 3.4 GHz award
16
Figure A7.3: Interference mechanisms: (a) receiver selectivity / blocking dominating; (b) out of band emissions dominating
A7.72 In the above figure the wanted Wi-Fi signal is indicated in blue, the unwanted LTE-TDD in orange and the receiver selectivity is indicated by the dashed lines. The red area is the power in the unwanted signal responsible for interference.
Out of band emissions
A7.73 Out of band emissions refer to interfering signal (LTE-TDD) which is received within the bandwidth of the victim receiver (Wi-Fi) and has the effect of reducing the received signal to interference plus noise ratio (SINR). It is determined by the adjacent channel leakage of the transmitter, and is limited by relevant equipment specifications and/or block edge mask requirements in a licence.
A7.74 In the case of LTE, the emission limits specified by the relevant 3GPP standards for base stations and mobiles into the Wi-Fi band are set out below21.
Table A7.7: Out of band emissions limits for LTE base stations at the top of the release band (2390 MHz) into 2.4 GHz22
Frequency (MHz) Frequency offset
from top LTE channel edge
(MHz)
Maximum power into antenna (dBm/MHz)
EIRP (dBm/MHz)
2400-2410 10-20 -15 3 >2410 >20 -30 -12
A7.75 In the above table EIRP values are calculated assuming an antenna gain of 18 dBi. Emission limits above 2410 MHz are based on spurious domain limits.
21 We focus on the 3GPP emissions here as they are more restrictive than the proposed technical licence conditions for the 2.3 GHz band. 22 3GPP TS 36.104, v12.2.0, Evolved Universal Terrestrial Radio Access (E-UTRA); Base Station (BS) radio transmission and reception, Table 6.6.3.2.1-6: http://www.3gpp.org/DynaReport/36104.htm
Power Power
Frequency Frequency
(a) Selectivity/blocking (b) Unwanted emissions

Technical coexistence issues for the 2.3 and 3.4 GHz award
17
Table A7.8: Out of band emissions limits for LTE mobile devices at the top of the release band (2390 MHz) into 2.4 GHz 23
Frequency (MHz)
Frequency Offset (MHz)
Maximum EIRP (dBm/MHz)
10 MHz 20 MHz 2390-2391 0-1 -3 -6 2391-2395 1-5 -10 -10 2395-2400 5-10 -13 -13 2400-2405 10-15 -25 -13 2405-2410 15-20 -30 -13 2410-2415 20-25 -30 -25
>2415 >25 -30 -30
A7.76 It should be noted that in practice most devices can be expected to out-perform the standards, particularly at larger frequency offsets. This is demonstrated in the measurements in the figure below for example mobile devices in the 2.3 GHz band and in our previous measurement work on LTE mobile devices at 800 MHz24 and base stations at 2.6 GHz25.
Figure A7.4: Typical out of band emissions of 2.3 GHz mobile devices
A7.77 As interference from out of band emissions results in degradation in SINR, interference may not have a noticeable impact if the wanted signal is sufficiently high. Where interference does have an impact it will effectively reduce the operating
23 3GPP TS 36.101, v12.2.0, Evolved Universal Terrestrial Radio Access (E-UTRA); User Equipment (UE) radio transmission and reception, Table 6.6.2.1.1-1: http://www.3gpp.org/DynaReport/36101.htm 24 LTE User Equipment Coexistence with 862 - 870MHz, Ofcom, September 2012: http://stakeholders.ofcom.org.uk/binaries/consultations/award-800mhz/statement/lte-coexistence.pdf 25 Communications signals in the 2.6 GHz band and maritime radar - Technical assessment of interference, Ofcom, 2011: http://stakeholders.ofcom.org.uk/binaries/spectrum/spectrum-awards/awards-in-preparation/2011/Maritime_technical_report.pdf

Technical coexistence issues for the 2.3 and 3.4 GHz award
18
range of the Wi-Fi network, and can be mitigated by moving the affected Wi-Fi device closer to the Wi-Fi transmitter.
A7.78 Increasing the frequency offset between the interfering and victim systems is another effective mitigation against interference due to out of band emissions. Due to the 10 MHz separation between the 2.3 GHz award band and Wi-Fi channel 1 there is already some inherent protection against the effects of out of band emissions.
A7.79 Therefore the risk of interference to Wi-Fi channel 1 is expected to be low, and to decrease further for higher channels.
Receiver selectivity/blocking
A7.80 Receiver blocking refers to interference due to the interfering power experienced by the victim receiver due to its adjacent channel selectivity (refer to Figure A7.4(b)). This can cause intermodulation due to non-linearity in the receiver’s power amplifier which has the effect of increasing the noise floor and thus degrades the SINR. At high power levels total distortion can occur due to the onset of amplifier overload. A similar effect may occur if the receiver’s automatic gain control (AGC) reduces its gain in response to a high level of interfering signal. In either of these cases an increased wanted signal will not help to mitigate against the effects of interference.
A7.81 Increased frequency separation may provide mitigation if the receiver filtering improves at higher offsets but if there is little front end filtering this may not make significant difference to a general front end overload. Existing Wi-Fi devices will contain filters sufficient to protect against other Wi-Fi transmissions and other low power users of the licence exempt band, but may not have been designed to account for possible high power users in the adjacent band. This may vary between devices, some may have better filtering due to design. Some devices may not employ any front end filtering due to design constraints (i.e. cost or physical size) and could therefore be more susceptible to blocking.
A7.82 The relevant ETSI standard for Wi-Fi specifies a receiver blocking test for signals outside of the operating channel or adjacent channels. This requires conformant receivers to maintain the data link in the presence of a -30 dBm continuous wave (CW) signal at 2395 MHz26. This may be optimistic, however, in the context of LTE signals which are wideband and may cause intermodulation distortion in the Wi-Fi receiver in addition to narrowband blocking effects.
A7.83 The relevant IEEE standard for Wi-Fi does not specify a blocking test for rejection of signals outside of the 2.4 GHz band. The closest approximation is the alternative adjacent channel rejection requirement which specifies the maximum interference power a receiver should be able to tolerate from another 2.4 GHz service which is not immediately adjacent. For all modulation schemes this blocking level is -47 dBm27. This may be pessimistic, however, in the context of 2.3 GHz LTE signals depending on the degree of filtering in the Wi-Fi receiver front-end.
A7.84 Both standards have fixed blocking levels for all modulation schemes and coding rates. Real devices can be expected to shift to lower order modulation modes which
26 ETSI EN 300 328 V1.8.1 (2012-06), 4.3.2.10 Receiver Blocking: http://www.etsi.org/deliver/etsi_en/300300_300399/300328/01.08.01_60/en_300328v010801p.pdf 27 IEEE Std 802.11-2012, 18.3.10.4 Nonadjacent channel rejection: http://standards.ieee.org/getieee802/download/802.11-2012.pdf

Technical coexistence issues for the 2.3 and 3.4 GHz award
19
are more tolerant to receiver distortion at the onset of blocking. Effectively this means that a reduction from the maximum data rate can be expected at the onset of blocking with total link failure only occurring at higher levels of interference power.
LTE frame configurations
A7.85 LTE-TDD can operate in 7 different configurations with different ratios between uplink (UL) and downlink (DL) traffic28. These are outlined in Table A7.9 below.
Table A7.9: TDD LTE frame configuration
DL/UL Configuration DL/UL ratio
Downlink-to-Uplink Switch-
point periodicity (ms)
Subframe number
0 1 2 3 4 5 6 7 8 9
0 1:3 5 D S U U U D S U U U 1 1:1 5 D S U U D D S U U D 2 3:1 5 D S U D D D S U D D 3 2:1 10 D S U U U D D D D D 4 7:2 10 D S U U D D D D D D 5 8:1 10 D S U D D D D D D D 6 3:5 5 D S U U U D S U U D
A7.86 The table shows the supported uplink-downlink frame configurations where:
a) "D" denotes a subframe reserved for downlink transmission.
b) "U" denotes a subframe reserved for uplink transmission.
c) "S" denotes a special subframe used for guard time to separate the uplink and downlink transmissions. The special subframe also contains some uplink and downlink traffic.29
A7.87 A network is typically set by the operator to a fixed configuration. This may be determined by synchronisation with adjacent channel operators. The chosen configuration will depend on the type of traffic the network is designed for e.g. if the network is mainly used for downloading large files or video streaming, a heavily loaded downlink configuration can be expected.
A7.88 Interference is logically most likely in the two extreme values – i.e. downlink interference is most likely in configuration 5 and uplink interference in configuration 0. However the ‘bursting’ nature of transmissions in low duty cycle configurations (e.g. DL configuration 0) could give rise to anomalous effects if Wi-Fi receivers employ AGC which responds to the interfering signal.
28 3GPP TS 36.211 - Evolved Universal Terrestrial Radio Access (E-UTRA); Physical channels and modulation, V12.0.0, Table 4.2.2: http://www.3gpp.org/DynaReport/36211.htm 29 The ratios in Table 9 ignore the special subframe. In practice the amount of downlink and uplink traffic within the special subframe is determined by the guard period which can vary by implementation.
Technical coexistence issues for the 2.3 and 3.4 GHz award
20
Effects of interference on Wi-Fi
A7.89 The interference mechanisms described above are likely to result in reduced throughput to the Wi-Fi link. It may be possible in some cases to mitigate this by moving the Wi-Fi access point and client device closer together.
A7.90 At the onset of interference, degradation in maximum available throughput may not be noticeable to the user, depending on the application involved. For example a user browsing the internet using a Wi-Fi link connected to a DSL router (as is typical in the majority of homes) may not experience any noticeable effect as their throughput is likely to be restricted by the DSL line speed in the first place. If the throughput were to drop below the line speed the impact would be more noticeable.
A7.91 For higher bandwidth applications such as in-home media streaming any drop in throughput may have a more noticeable impact.
A7.92 Public Wi-Fi networks may also experience a noticeable impact at the onset of degradation if they are serving multiple users simultaneously.
A7.93 As noted earlier, both routers/access points and client devices may be susceptible to interference. It is important to note that any impact to a router can have a resulting impact on any client device connected to the access point. Additionally, if one client in the network is affected it may have an indirect impact on the performance of other devices as a result of an increase in re-transmissions using the channel, thus limiting the available resources for other client devices.
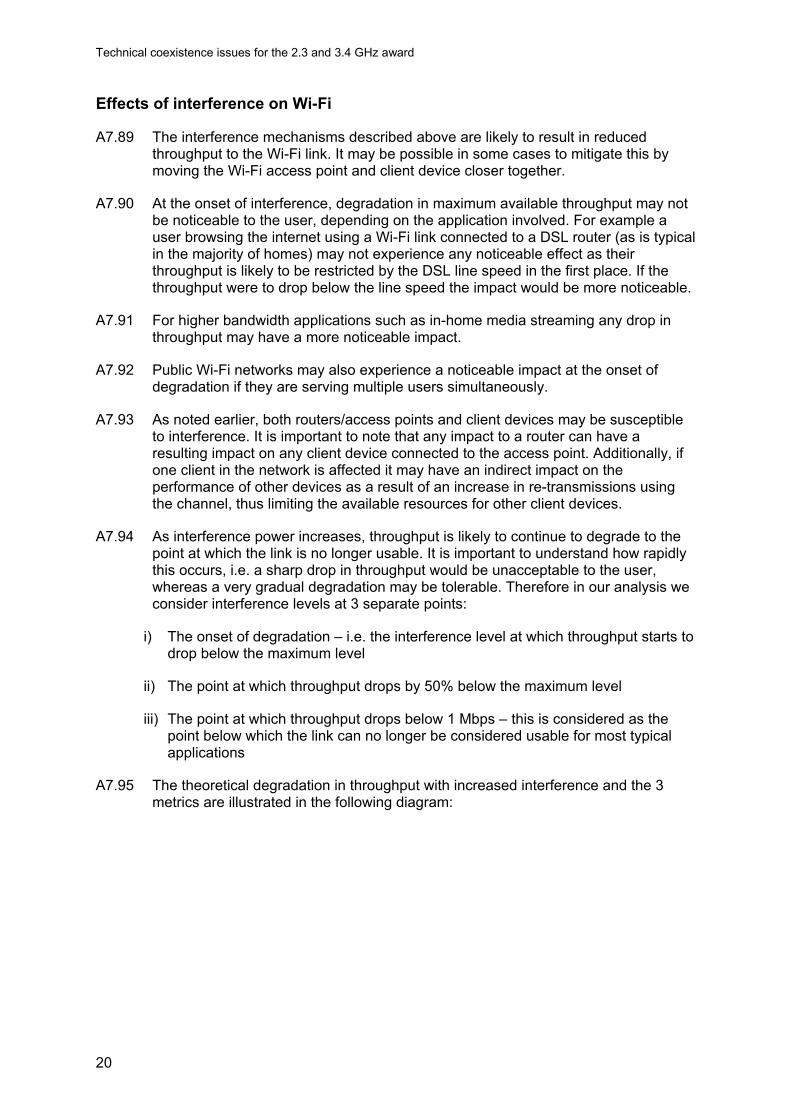
A7.94 As interference power increases, throughput is likely to continue to degrade to the point at which the link is no longer usable. It is important to understand how rapidly this occurs, i.e. a sharp drop in throughput would be unacceptable to the user, whereas a very gradual degradation may be tolerable. Therefore in our analysis we consider interference levels at 3 separate points:
i) The onset of degradation – i.e. the interference level at which throughput starts to drop below the maximum level
ii) The point at which throughput drops by 50% below the maximum level
iii) The point at which throughput drops below 1 Mbps – this is considered as the point below which the link can no longer be considered usable for most typical applications
A7.95 The theoretical degradation in throughput with increased interference and the 3 metrics are illustrated in the following diagram:

Technical coexistence issues for the 2.3 and 3.4 GHz award
21
Figure A7.5: Theoretical impact of interference on Wi-Fi throughput
Interference power
Wi-F
i Thr
ough
put
Tonset
T50%
T1Mbps
Ponset P50% P1Mbps
A7.96 The specific profile of degradation in throughput may vary between different devices. Some may exhibit a more gradual degradation (lower slope) and therefore a wide difference in the 3 metrics, whereas others may have a more sharp drop in throughput from the maximum.
International experience
A7.97 There are existing commercial LTE 2.3 GHz networks deployed in 10 countries, and a further 10 countries have planned deployments. There are also some existing or planned deployments of WiMAX30 in 2.3 GHz in 11 countries, although many we believe are discontinued small scale trials and are therefore unlikely to have experienced noticeable Wi-Fi interference issues. As Wi-Fi is used globally it is possible that some of these countries may have experienced interference issues.
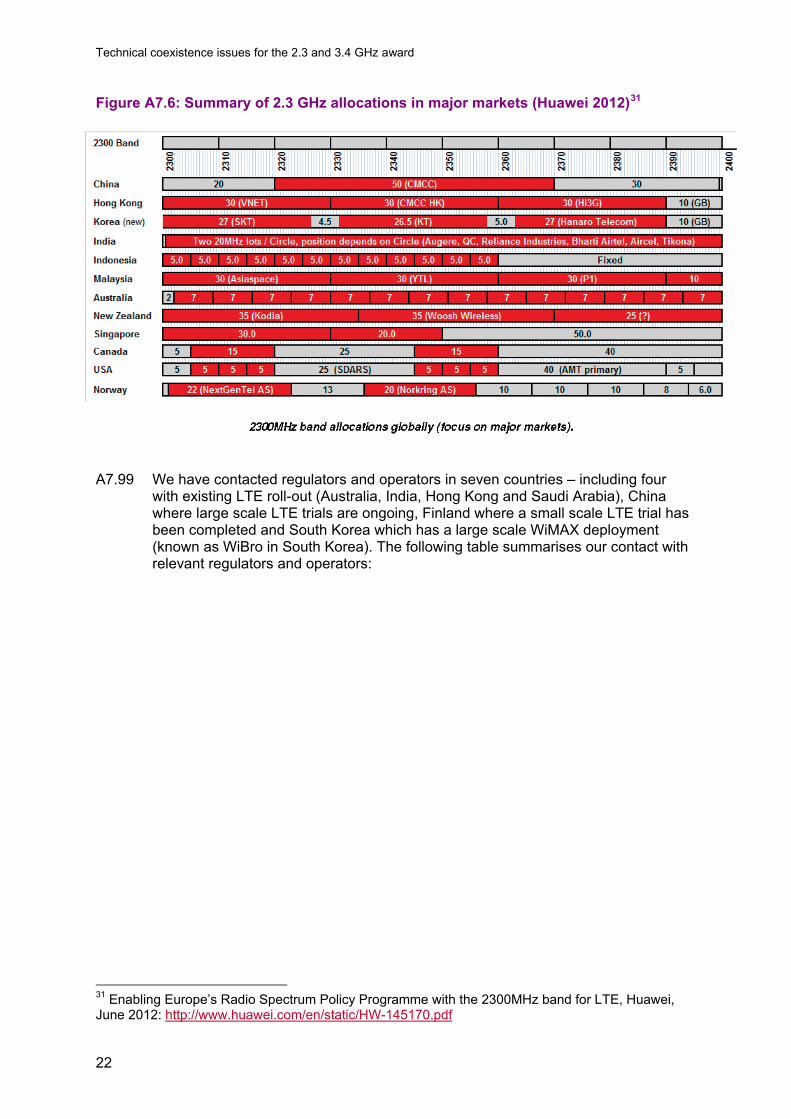
A7.98 Specific deployment scenarios vary between countries – in some cases frequencies up to 2400 MHz are allocated (i.e. no guard band between LTE and Wi-Fi) and in other cases only frequencies in the lower part of the 2300 MHz band are used. Additionally the scale of deployments varies widely. The following figure shows allocations in the 2.3 GHz band in red in major markets. It is notable that most countries have avoided allocating in the top of the band – this may be to avoid interference both to and from Wi-Fi.
30 WiMAX is likely to exhibit similar characteristics to LTE (i.e. the risk of interference is believed to apply to any mobile network technology)
Technical coexistence issues for the 2.3 and 3.4 GHz award
22
Figure A7.6: Summary of 2.3 GHz allocations in major markets (Huawei 2012)31
A7.99 We have contacted regulators and operators in seven countries – including four
with existing LTE roll-out (Australia, India, Hong Kong and Saudi Arabia), China where large scale LTE trials are ongoing, Finland where a small scale LTE trial has been completed and South Korea which has a large scale WiMAX deployment (known as WiBro in South Korea). The following table summarises our contact with relevant regulators and operators:
31 Enabling Europe’s Radio Spectrum Policy Programme with the 2300MHz band for LTE, Huawei, June 2012: http://www.huawei.com/en/static/HW-145170.pdf

Technical coexistence issues for the 2.3 and 3.4 GHz award
23
Table A7.10: List of contact with countries with existing or planned 2.3 GHz deployments
Country Frequencies used Notes
Australia 2300-2400MHz
3 operators with sites in urban, suburban and rural areas. No known interference issues. We understand that although licensed to 2400 MHz, neither Optus nor NBN use above 2382 MHz. However, AusGrid use the top part to 2400 MHz for low data rate smart grid telemetry networks while the site density, power levels and antennas are similar to a typical LTE deployment the traffic loading may be much lower based on the application.
China 2320-2370MHz
Large scale trials ongoing in several cities. Huawei and the regulator suggest that there have been a few cases of interference with Wi-Fi as the interferer, which have been easily mitigated.
India 2305-2400MHz
Regional licences in different parts of the band. 3 major cities have deployments, but in these areas licences only go up to ~2350MHz. No known interference issues
Hong Kong
2300-2400MHz
There is currently no deployment above 2360 MHz as the operator (Hutchison) has not yet set up trials or deployments. The concern of a major Wi-Fi operator, was in device coexistence as Hutchison has emission levels restrictions into the Wi-Fi band (they had not considered blocking in their analysis)
Finland 2300-2390MHz No interference issues were reported during small scale trial
South Korea
2300-2360MHz
Large scale urban deployment. Samsung (the vendor) were not aware of any interference issues. We note that this is the lower part of the band only. It is a WiBro (WiMax) network
A7.100 We have not had contact with any of the other countries with 2.3 GHz deployments.
Most of these are believed to be in the early stages of deployment but we note that Saudi Arabia has significant urban deployments up to 2380 MHz.
A7.101 Whilst we have not found any substantiated reports of interference to Wi-Fi, we note the differences in deployment scenarios and frequencies used in countries with existing roll-out with very few having deployed LTE up to 2390 MHz as we are proposing in the UK.
Lab measurements
Introduction
A7.102 In the previous section of this annex we have presented the minimum requirements set by the standards for the out of band emissions of LTE devices and also the selectivity of Wi-Fi receivers. We have noted that the performance of actual devices can be expected to out-perform the standards to some degree.
A7.103 To address this we have engaged in a programme of lab based testing of a sample of typical Wi-Fi devices to understand how they perform in the presence of LTE signals in the adjacent band. The full objectives of the lab measurements are as follows:
• Quantify the risk of interference from LTE base stations and mobile devices to typical Wi-Fi devices.

Technical coexistence issues for the 2.3 and 3.4 GHz award
24
• Determine if interference is dominated by out of band emissions or blocking, and thus whether changing the Wi-Fi channel is an effective form of mitigation
• Determine if different types of devices are affected differently, and quantify the range of performance.
• Determine if different LTE-TDD frame configurations have different impacts.
• Use the results to inform our further technical analysis.
• Demonstrate how interference manifests to Wi-Fi networks – i.e. how rapidly does throughput degrade in the presence of increasing levels of interference.
A7.104 The results from measurements are presented as C/I protection ratios (i.e. ratio of wanted signal level to interfering single level) versus achieved Wi-Fi application layer throughput. Results are also presented in terms of absolute interference levels to determine the effect of blocking.
A7.105 We commissioned MASS Consultants Ltd to test 21 devices covering a range of device types and manufacturers. The full details of the measurement campaign and all results are presented in a separate report published alongside this consultation32. In this section we present a high level summary of the methodology, results and conclusions.
Devices tested
A7.106 21 devices were tested covering six different types of device, as set out in the following table:
Table A7.11: Category of devices tested
Device category Number of devices tested
Home router 4 Commercial access point 5
All routers 9 Smartphone 6
Laptop 2 Tablet 3
Multimedia dongle 1 All client devices 12
A7.107 The choice of devices took into account market data33 as well as information from
discussions with large ISPs, therefore the chosen devices are believed to be representative of typical devices available in the market.
32 Please see Annex 5 for full details 33 This included a range of sources on market share of device manufacturers and chipsets (full details are provided in the MASS Report), as well as data from Ofcom’s Communications Market Report on percentage of UK population who own different types of device (see footnote 11)

Technical coexistence issues for the 2.3 and 3.4 GHz award
25
Methodology
A7.108 The measurements were performed using radiated LTE-TDD test signals in an anechoic chamber. An additional set of tests were performed using a continuous wave (CW) signal in order to confirm if interference is due to blocking. The following parameters were used in all tests:
Table A7.12: LTE parameters used in measurements
Parameter Values used Bandwidth (MHz) 20 Frequency (MHz) 2380, 2412 (co-channel test) Mode Uplink and downlink Filtering ‘clean’ and ‘typical’ ACLR profiles Frame configuration 0 (UL heavy) and 5 (DL heavy)
Table A7.13: Wi-Fi parameters used in measurements
Parameter Values used Wi-Fi channel 1,6,11 Wanted signal level above Minimum Usable Sensitivity (MUS) (dB)
10*,20,30
*MUS+10 dB results were found to be unreliable and were therefore discarded
A7.109 Certain devices were tested additionally using a wider set of parameter values.
A7.110 Throughput was measured using both Iperf34 and AirPcap35 software. AirPcap was used to validate the Iperf results. One device did not support the use of Iperf so the AirPcap results were used instead for this device.
Results
A7.111 As expected, a wide range of interference levels was observed between devices and for different test parameters. Blocking was shown to be the dominant mechanism, although for some devices out of band emissions were also seen to contribute to interference.
A7.112 In general results did not improve for higher Wi-Fi channels, and some anomalies were seen in the CW blocking tests where higher offsets were found to be more adversely affected for channels 11 and 13. The cause of this counter-intuitive effect is not clear.
A7.113 We have derived the following blocking levels from the measurements for all tested devices, for a 20 MHz downlink LTE signal in configuration 5 (highest duty cycle).36
34 Iperf is a network testing tool which creates TCP packets to measure application layer throughput 35 AirPCap uses a besoke network adaptor to capture packets on a Wi-Fi network 36 This scenario is expected to provide the worst case of all configurations tested. However, there were some exceptions found where lower duty cycle signals (e.g. configuration 0) caused blocking to occur at a lower signal level, suggesting worse performance. The cause of these anomalous effects in certain devices is unclear.
Technical coexistence issues for the 2.3 and 3.4 GHz award
26
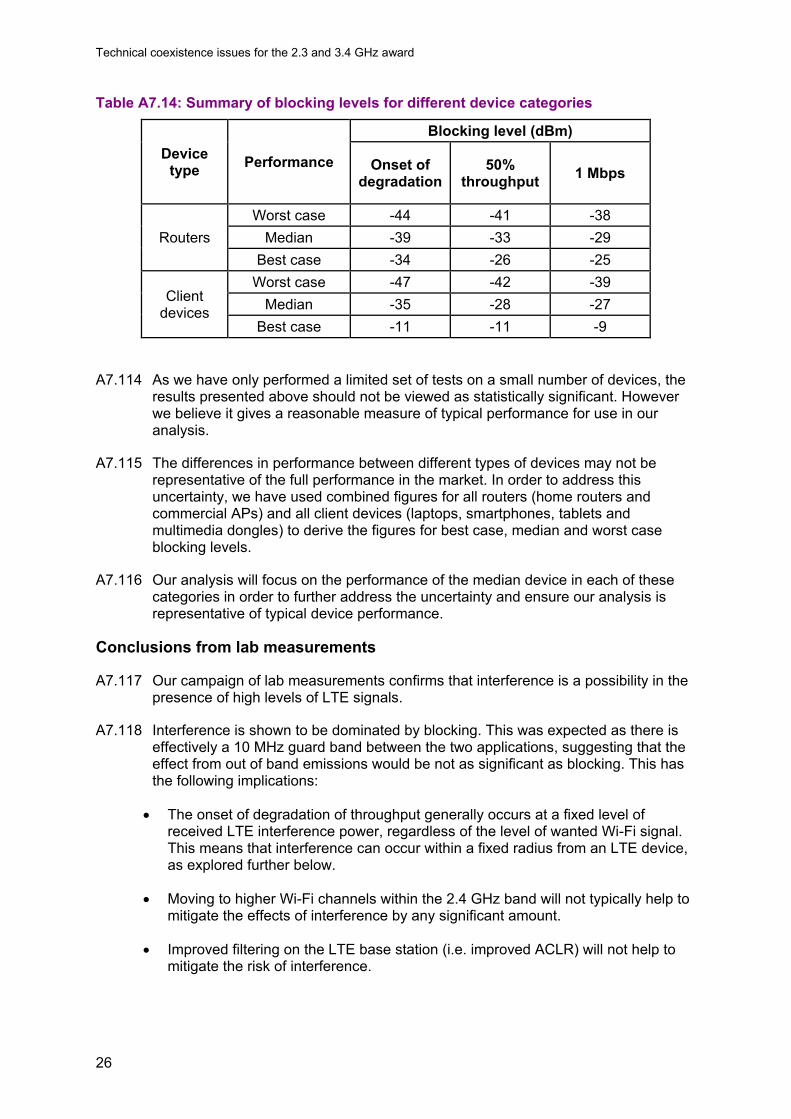
Table A7.14: Summary of blocking levels for different device categories
Device type Performance
Blocking level (dBm)
Onset of degradation
50% throughput 1 Mbps
Routers Worst case -44 -41 -38
Median -39 -33 -29 Best case -34 -26 -25
Client devices
Worst case -47 -42 -39 Median -35 -28 -27
Best case -11 -11 -9
A7.114 As we have only performed a limited set of tests on a small number of devices, the results presented above should not be viewed as statistically significant. However we believe it gives a reasonable measure of typical performance for use in our analysis.
A7.115 The differences in performance between different types of devices may not be representative of the full performance in the market. In order to address this uncertainty, we have used combined figures for all routers (home routers and commercial APs) and all client devices (laptops, smartphones, tablets and multimedia dongles) to derive the figures for best case, median and worst case blocking levels.
A7.116 Our analysis will focus on the performance of the median device in each of these categories in order to further address the uncertainty and ensure our analysis is representative of typical device performance.
Conclusions from lab measurements
A7.117 Our campaign of lab measurements confirms that interference is a possibility in the presence of high levels of LTE signals.
A7.118 Interference is shown to be dominated by blocking. This was expected as there is effectively a 10 MHz guard band between the two applications, suggesting that the effect from out of band emissions would be not as significant as blocking. This has the following implications:
• The onset of degradation of throughput generally occurs at a fixed level of received LTE interference power, regardless of the level of wanted Wi-Fi signal. This means that interference can occur within a fixed radius from an LTE device, as explored further below.
• Moving to higher Wi-Fi channels within the 2.4 GHz band will not typically help to mitigate the effects of interference by any significant amount.
• Improved filtering on the LTE base station (i.e. improved ACLR) will not help to mitigate the risk of interference.

Technical coexistence issues for the 2.3 and 3.4 GHz award
27
• Improved filtering on the Wi-Fi devices (i.e. improved receiver selectivity) would help to mitigate against the effects of blocking and thus reduce the interference radius around an LTE device
A7.119 A wide variation in performance is seen between devices and between different types of devices. We have derived blocking levels for the worst case, median and best case devices in each category.
A7.120 We focus on the performance of the median device in the results for our central case as this is believed to give the most accurate figure of impact on a national level, while noting that the performance of individual devices will vary.
A7.121 There is a significant amount of measurement uncertainty in these results and it is noted that a wider range of wanted signal levels than those used in the measurements may also have an impact on the blocking levels. Therefore when considering these results in further analysis it will be important to include a sensitivity analysis which shows the impact to a range of values.
A7.122 The worst case blocking levels of -47 dBm are consistent with those derived from the IEEE standards as set out above in A1.80, while noting that that the derivations of these levels are slightly different from the method set in the standard. The ETSI blocking level of -30 dBm is based on a CW interferer so is not relevant to compare with LTE signals.
Field measurements
A7.123 We have undertaken two sets of field testing which investigated the effects of interference from an LTE base station on the following scenarios:
i) Different router/access point devices in typical deployment configurations (indoors and outdoors)
ii) A client device used outdoors in a typical configuration. The effects of user mobility, positioning and device orientation were investigated
A7.124 We have additionally undertaken a short campaign of drive testing on an existing LTE network to determine the typical signal strengths received at short distances from base stations, and therefore confirm if blocking levels are likely to be exceeded in practice.
Field measurements on routers
Introduction
A7.125 Ofcom undertook a short set of field measurements in cooperation with a major Wi-Fi hotspot ISP. As part of this field trial, Ofcom developed and deployed a LTE-TDD base station simulator capable of replicating different base station deployment scenarios. The LTE simulator was used to assess the potential for interference into different types of new and legacy Wi-Fi equipment deployed at hotspot locations across the UK, in addition to popular wireless routers used in a large number of consumer premises.
A7.126 Three of the devices used in the field measurement were also included in the lab based measurement campaign described above in order to enable a comparison between the lab and field measurements. The devices tested, approximate number

Technical coexistence issues for the 2.3 and 3.4 GHz award
28
deployed in the UK and the relevant reference from the lab tests above are summarised in Table A7.15.
Table A7.15: Wi-Fi equipment under test and approximate numbers deployed by a single ISP in the UK
Device Under Test Type Approximate number
deployed in UK Device reference from
lab tests A Outdoor Hotspot 6,000 Commercial access point 1 B Wireless Router 2,000 Commercial access point 2 C Outdoor Hotspot N/A N/A D Wireless Router 1,000,000 Home router 2
Test Methodology
A7.127 To test the potential impact of future LTE base station emissions on Wi-Fi equipment Ofcom developed a base station simulator. The main components are shown in the figures below.
Figure A7.7: Test system configuration A
Technical coexistence issues for the 2.3 and 3.4 GHz award
29
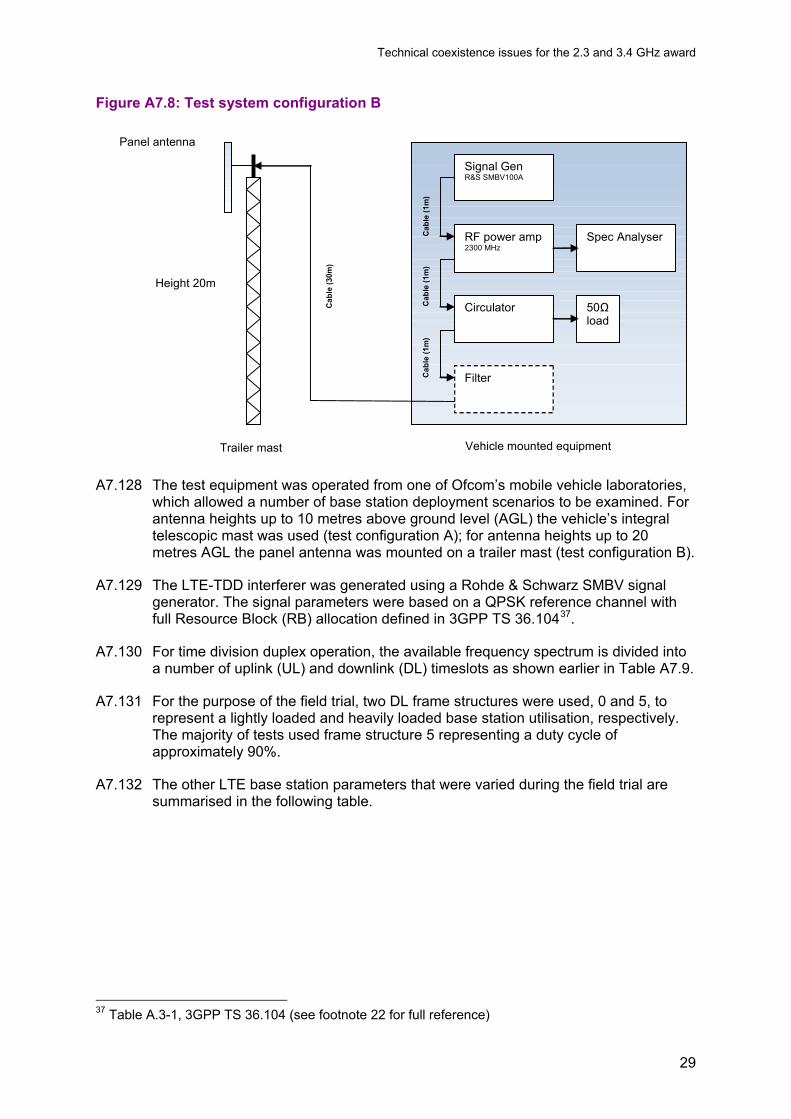
Figure A7.8: Test system configuration B
A7.128 The test equipment was operated from one of Ofcom’s mobile vehicle laboratories, which allowed a number of base station deployment scenarios to be examined. For antenna heights up to 10 metres above ground level (AGL) the vehicle’s integral telescopic mast was used (test configuration A); for antenna heights up to 20 metres AGL the panel antenna was mounted on a trailer mast (test configuration B).
A7.129 The LTE-TDD interferer was generated using a Rohde & Schwarz SMBV signal generator. The signal parameters were based on a QPSK reference channel with full Resource Block (RB) allocation defined in 3GPP TS 36.10437.
A7.130 For time division duplex operation, the available frequency spectrum is divided into a number of uplink (UL) and downlink (DL) timeslots as shown earlier in Table A7.9.
A7.131 For the purpose of the field trial, two DL frame structures were used, 0 and 5, to represent a lightly loaded and heavily loaded base station utilisation, respectively. The majority of tests used frame structure 5 representing a duty cycle of approximately 90%.
A7.132 The other LTE base station parameters that were varied during the field trial are summarised in the following table.
37 Table A.3-1, 3GPP TS 36.104 (see footnote 22 for full reference)
Trailer mast
Height 20m
Panel antenna
Signal Gen R&S SMBV100A
RF power amp 2300 MHz
Circulator
Filter
Spec Analyser
Cab
le (1
m)
Cab
le (1
m)
Cab
le (1
m)
50Ω load
Vehicle mounted equipment
Cab
le (3
0m)

Technical coexistence issues for the 2.3 and 3.4 GHz award
30
Table A7.16: LTE base station parameters varied during the field trial
Base station parameter Variations considered during field trial
Channel bandwidth 10 MHz, 20 MHz, 40 MHz
Transmit frequency
2385 MHz (for 10 MHz BW), 2380 MHz (for 20 MHz BW), 2370 MHz (for 40 MHz BW)
(equivalent to 2 adjacent 20 MHz carriers using the entire release
band) Antenna height (AGL) 5m, 10m, 20m
Antenna downtilt 3°, 6°, 10° Mean transmit EIRP38
(dBm / channel bandwidth) Variable up to 52.6 dBm
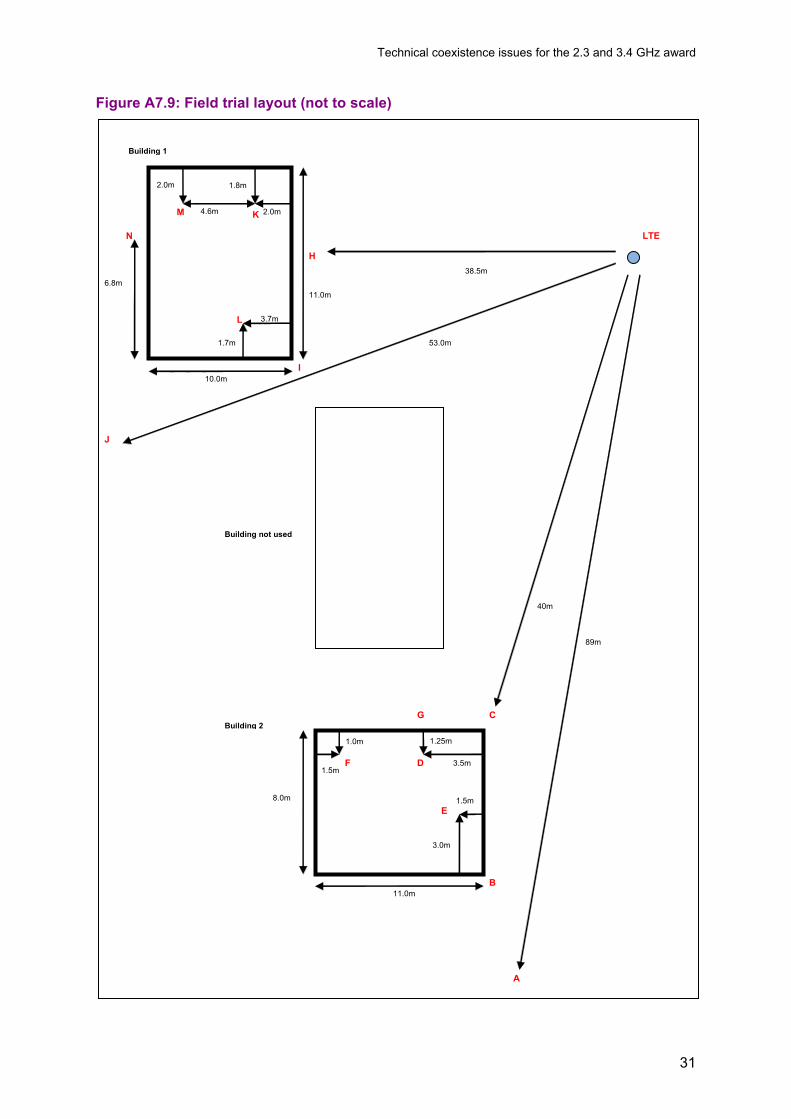
Field trial locations
A7.133 The field trial locations are shown in Figure A7.10 and Figure A7.11 below. Two different buildings were used to house the Wi-Fi equipment, with the LTE base station simulator located approximately equidistant between them.
A7.134 Measurements of the LTE field strength were taken at different locations inside and outside the buildings, denoted by the letters A to N in Figure A7.10.
38 Derived from the maximum mean output power of the amplifier, cable loss and antenna gain
Technical coexistence issues for the 2.3 and 3.4 GHz award
31
Figure A7.9: Field trial layout (not to scale)
LTE
Building 1
10.0m
11.0m
H
I
K
1.8m
2.0m
3.7m
1.7m
L
2.0m
4.6m M
N
6.8m 38.5m
J
53.0m
C
40m
Building not used
11.0m
8.0m
B
A
89m
1.0m
1.5m F
Building 2
3.5m
1.25m
D
G
E
3.0m
1.5m

Technical coexistence issues for the 2.3 and 3.4 GHz award
32
Figure A7.10: Overhead view of field trial locations
Test procedure
A7.135 Each test scenario consisted of a laptop (wireless client) and Access Point (the device under test), with the Access Point (AP) connected to a second laptop using a LAN cable (wired client).
Figure A7.11: Access point test configuration
A7.136 For each test:

Technical coexistence issues for the 2.3 and 3.4 GHz award
33
i) 250 ICMP pings39 were sent and the packet loss was recorded;
ii) Iperf software was used to send 4 Mbps of UDP traffic for 90 seconds from wireless client to wired client (to test the AP in the uplink direction);
iii) Iperf software was used to send 4 Mbps of UDP traffic for 90 seconds from wired client to wireless client (to test the AP in the downlink direction);
iv) Iperf software was used to send TCP traffic for 90 seconds from the wireless client to wired client;
v) Iperf software was used to send TCP traffic for 90 seconds from the wired client to the wireless client.
A7.137 Each test was repeated for the different LTE base station configurations shown in Table 16. If no impact was found in the worst case configuration the remaining tests were not performed.
Test results
A7.138 Device A was located outdoors at a height of around 1.6 metres above ground level (AGL) and 40 metres from the LTE base station simulator. The only LTE configuration that caused any noticeable drop in throughput was:
a) 10 m height, 10° downtilt, 10 MHz channel bandwidth, frame configuration 5
A7.139 With this configuration the recorded LTE signal strength close to the AP antenna was -24.1 dBm/(10 MHz). This level caused a throughput reduction of 58% in the downlink and 79.5% in the uplink direction, compared to the benchmark test with no interference. Adding an external filter to the LTE signal gave only a marginal improvement, suggesting that the main interference mechanism was due to receiver blocking caused by the high power of the LTE signal, rather than out-of-band emissions falling co-channel with the receiver.
A7.140 Moving the Wi-Fi to channel 6 from channel 1 restored the data throughput in both the downlink and uplink direction.
A7.141 Device B was located indoors on a table approximately 1.5 metres AGL with a single wall providing additional attenuation of the base station signal. The only noticeable reduction in data throughput occurred when we raised the AP height to 1.65 metres and moved it closer to a window. This had the effect of increasing LTE signal strength at the AP antenna (to -28.1 dBm/10MHz) giving rise to a reduction in throughput of 31.3% in the downlink and 48% in the uplink direction, compared to the benchmark values.
A7.142 Device C was located outdoors at a height of 5 metres AGL and approximately 50 metres from the base station simulator. Due to the elevated height compared to the other devices under test, Device C experienced the highest LTE signal levels. Device C also had the lowest wanted signal levels from the Wi-Fi client device, measured using the receiver’s Received Signal Strength Indicator (RSSI), of typically -82 dBm.
39 Internet Control Message Protocol (ICMP): Messages typical used for diagnostic or control purposes or generated in response to errors in Internet Protocol operations.

Technical coexistence issues for the 2.3 and 3.4 GHz award
34
A7.143 The following LTE base station configuration caused the wanted link to be dropped, with a data throughput of 0%:
i) 10m height, 10° downtilt, 10 MHz channel bandwidth, frame configuration 5
A7.144 With this configuration the recorded LTE signal strength close to the AP antenna was -22.5 dBm/(10MHz). The signal level had to be reduced by 20 dB in order to re-establish the Wi-Fi link (test 2).
A7.145 Increasing the frequency separation by moving the Wi-Fi channel to channel 6 or channel 11 did not give any improvement, suggesting that the main interference mechanism was due to blocking caused by the receiver’s adjacent channel selectivity performance.
A7.146 Neither the use of an external filter on the LTE signal, nor changing the base station antenna downtilit from 10 degrees to 3 degrees did anything to improve the throughput. Reducing the distance between the wireless client and the access point, to improve the wanted signal level by around 15 dB, only gave a marginal improvement in the results.
A7.147 Device D was located indoors on a table approximately 1.5 metres AGL. The worst case base station geometry caused a marginal reduction in data throughput, of 22% in the downlink and 3.9% in the uplink directions.
Conclusions from router field measurements
A7.148 These tests have confirmed the possibility of interference from LTE to Wi-Fi in real world conditions at similar levels of LTE interference power as seen in the lab measurements.
A7.149 Impacts are found to be significantly dependent on base station geometry – i.e. the position of the victim device with respect to the interfering base station, and whether or not it is located within the antenna boresight.
A7.150 Some indoor devices are only likely to be affected if located near a window, and this can be mitigated by moving the device deeper within the building.
Effect of the environment on outdoor Wi-Fi performance of a client device
Introduction
A7.151 In addition to the field trial described above we also examined the effect that the general environment can have on using a Wi-Fi enabled tablet outdoors. Random variations in signal propagation, the effect of holding a device close to the body and the device orientation with respect to the access point can all affect the data throughput, even before the impact of LTE is considered.
Test methodology
A7.152 To test these effects we connected a tablet to an outdoor access point (configuration shown in Table A7.17) via a Wi-Fi connection. The outdoor access point was mounted on the rear of the mobile test laboratory at a height of 2 metres, as shown in Figure A7.13. For the initial tests the tablet was mounted on a tripod in a portrait orientation at 1.5 metres AGL, to negate the effects of any loss from holding the device.

Technical coexistence issues for the 2.3 and 3.4 GHz award
35
A7.153 Using the Iperf software tool, we streamed TCP traffic for 30 seconds from the access point to the tablet, with a measurement laptop connected to the access point via Ethernet cable functioning as an Iperf client, and the Iperf server installed on the tablet. We repeated this test at 5 metre intervals from the access point out to a distance of 140 metres, and measured both the received Wi-Fi signal strength and average data throughput over the 30 second period using a spectrum analyser and Iperf software, respectively.
Table A7.17: Outdoor access point settings
AP parameter Values
Wi-Fi channel CH 1 ( 2412 MHz) Wi-Fi standard 802.11g
Channel bandwidth 20 MHz Antenna height (AGL) 2 m
Figure A7.12: Test setup for throughput against distance measurements
A7.154 We then selected a fixed location (45 metres away from the AP) and repeated the throughput tests with the tablet in different orientations with respect to the AP as shown in Figure A7.14, and whilst being held by two different test subjects to test the effect of body loss on the received signal level. These tests were performed twice, with the tablet held in in portrait and landscape mode respectively.
2 m
10 m
140 m
Vehicle mounted equipment - as in Figure A7.7
Panel antenna (6 ° downtilt)
AP
Tablet
Cab
le (2
0m)

Technical coexistence issues for the 2.3 and 3.4 GHz award
36
Figure A7.13: Test setup for throughput against orientation measurements
A7.155 Finally, we repeated both distance and orientation measurements in the presence of an LTE-TDD BS signal to determine the impact of BS emissions on Wi-Fi throughput in an outdoor scenario. The LTE signal was generated using the base station simulator described in the previous section. The BS parameters are shown in the table below. The isolation between the LTE BS antenna and the Wi-Fi access point was measured to be 98 dB, ensuring that the LTE signal only impacted tablet device and not the access point.
Table A7.18: LTE base station test parameters
Base station parameter Values
Channel bandwidth 20 MHz Transmit frequency 2380 MHz
Antenna height (AGL) 10 m Antenna downtilt 6 deg Transmit EIRP (dBm / 20 MHz) Variable up to 52.6 dBm
Allocated resource blocks 100 UL/DL configuration C5
A7.156 We repeated the tests at different times and on different days to take account of any
changes in environmental conditions. The results are presented as signal level or data throughput averaged across the number of tests undertaken.
Results: Throughput against distance
A7.157 The results of the distance against throughput measurements are shown in Figure A7.15, both with and without the LTE base station emissions. As the tablet was mounted on the tripod pointing to the outdoor access point, the effects introduced by orientation, body losses etc. were considered to be negligible for these results.

Technical coexistence issues for the 2.3 and 3.4 GHz award
37
Figure A7.14: Signal strength and throughput against distance
A7.158 Without the presence of the LTE signal, the Wi-Fi link was able to maintain a throughput above 10 Mbps at most locations up to 140 metres from the access point. Despite the received Wi-Fi signal strength dropping significantly within the first 45 metres (in line with free space propagation loss), from -46.8 dBm to -70.2 dBm, the Wi-Fi throughput remained almost unchanged at 12.3 Mbps. This suggests the adaptive modulation of the Wi-Fi system was able to maintain the Wi-Fi performance under weak received signal strength conditions.
A7.159 When the LTE base station was switched on, the Wi-Fi throughput kept at 12.3 Mbps for 30 metres then started to decrease. It can be seen from Figure A7.15 that the LTE signal strength started to increase gradually from 30 metres, which is where the 3 dB beam-width of the LTE antenna pattern starts to intersect with the ground. As the distance continues to increase, LTE signal strength increases and Wi-Fi signal strength decreases, resulting in a fall in the C/I ratio and corresponding drop in data throughput.
A7.160 From 30 metres onwards, in general the Wi-Fi throughput with LTE on appears to fluctuate in accordance with the variation of the C/I ratio. When C/I ratio increases, a better Wi-Fi throughput can be observed at the next test location and vice versa. This delayed correlation implies that the negotiation between access point and tablet regarding Wi-Fi modulation scheme and maximum throughput via protocol handshake is not able to keep up with the variation of C/I ratio in a short period of time.
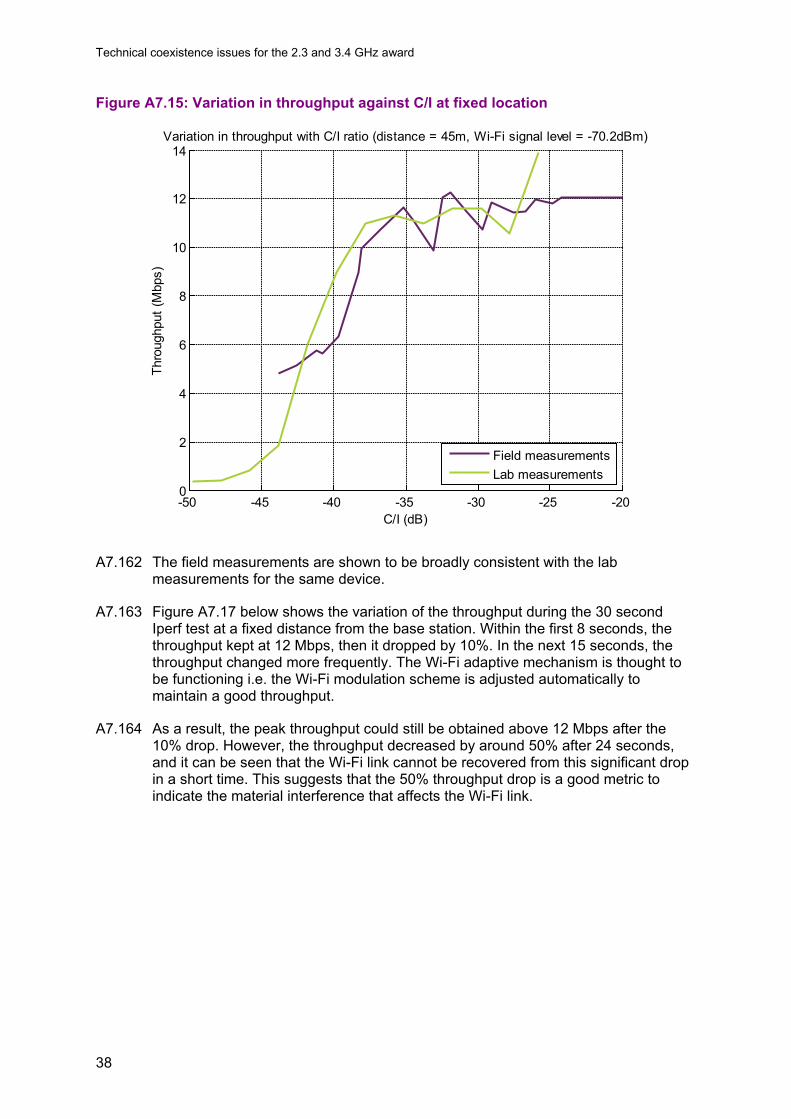
A7.161 Figure A7.16 shows the variation in data throughput against C/I ratio at a fixed distance of 45 metres from the access point.. The Wi-Fi signal strength at this location was -70.2 dBm. The C/I ratio was varied by increasing the LTE base station EIRP from 22.6 to 52.6 dBm. The lab measurements for the same device are also included in the figure for the purposes of comparison.
Technical coexistence issues for the 2.3 and 3.4 GHz award
38
Figure A7.15: Variation in throughput against C/I at fixed location
A7.162 The field measurements are shown to be broadly consistent with the lab measurements for the same device.
A7.163 Figure A7.17 below shows the variation of the throughput during the 30 second Iperf test at a fixed distance from the base station. Within the first 8 seconds, the throughput kept at 12 Mbps, then it dropped by 10%. In the next 15 seconds, the throughput changed more frequently. The Wi-Fi adaptive mechanism is thought to be functioning i.e. the Wi-Fi modulation scheme is adjusted automatically to maintain a good throughput.
A7.164 As a result, the peak throughput could still be obtained above 12 Mbps after the 10% drop. However, the throughput decreased by around 50% after 24 seconds, and it can be seen that the Wi-Fi link cannot be recovered from this significant drop in a short time. This suggests that the 50% throughput drop is a good metric to indicate the material interference that affects the Wi-Fi link.
-50 -45 -40 -35 -30 -25 -200
2
4
6
8
10
12
14
C/I (dB)
Thro
ughp
ut (M
bps)
Variation in throughput with C/I ratio (distance = 45m, Wi-Fi signal level = -70.2dBm)
Field measurementsLab measurements

Technical coexistence issues for the 2.3 and 3.4 GHz award
39
Figure A7.16: Iperf software screenshot for throughput vs time (fixed distance from AP = 45 m, LTE signal strength = -31.1 dBm/20 MHz, Wi-Fi signal strength = -70.2 dBm/20 MHz)
Results: Throughput against device orientation
A7.165 The variation in throughput against device orientation, with two different test subjects holding the tablet, is shown in Figure A7.18 and Figure A7.19 below.
A7.166 In general, the orientation measurement results for subject 1 show that many factors affect the Wi-Fi throughput performance. Without the presence of LTE, the data throughput was maintained at around 12 Mbps in landscape mode at four different orientations with respect to the access point.
A7.167 However, in portrait mode, the throughput dropped at different orientation angles, to a minimum of 4.14 Mbps at 270 degrees. This represents a 65% throughput drop compared to the baseline tests. When the LTE base station was switched on, the reduction in data throughput was observed in both portrait and landscape modes in most scenarios, although landscape mode continued to provide slightly better performance.
A7.168 Variations are seen between the two subjects although the effects are broadly similar. Variations are likely to be due to differences in body loss or the way the subject holds the device. The results are different from the tripod tests at the same distance (45 metres) as shown in Figure A7.15, which is also likely due to the impact of individual test subjects on throughput.
A7.169 The 180 degree orientation is found to give the worst throughput performance, most likely due to the additional body loss introduced in this scenario.

Technical coexistence issues for the 2.3 and 3.4 GHz award
40
Figure A7.17: Throughput against orientation for test subject 1
Figure A7.18: Throughput against orientation for test subject 2
0.00
2.00
4.00
6.00
8.00
10.00
12.00
14.00
0 deg 90 deg 180 deg 270 deg
Thro
ughp
ut (M
bps)
Subject orientation w.r.t. AP (deg)
Data throughput against device orientation for subject one
Portrait, without LTE Portrait, with LTE Landscape, without LTE Landscape, with LTE
0.00
2.00
4.00
6.00
8.00
10.00
12.00
14.00
0 deg 90 deg 180 deg 270 deg
Thro
ughp
ut (M
bps)
Subject orientation w.r.t. AP (deg)
Data throughput against device orientation for subject two
Portrait, without LTE Portrait, with LTE Landscape, without LTE Landscape, with LTE
Technical coexistence issues for the 2.3 and 3.4 GHz award
41
Conclusions from outdoor client device field measurements
A7.170 The outdoor Wi-Fi performance is susceptible to many factors. Without the presence of the LTE signal, the Wi-Fi throughput might drop by 65% due to the location, orientation, body loss and the way people use the Wi-Fi device.
A7.171 Moving the device to another location, changing the orientation and the way the device is held can all help to alleviate the impact of the LTE interference to some extent.
A7.172 The tests show that the 50% Wi-Fi throughput drop is a reasonable metric to indicate the condition of the Wi-Fi link when viewing the impact to client devices.
Drive testing to verify typical LTE received signal levels
Introduction
A7.173 The lab and field measurement campaigns described above have shown that interference to Wi-Fi is possible in the presence of high LTE signal levels. In practice LTE signal levels at a given location, and therefore the probability of interference, depend on a number of factors, including base station density, antenna geometry, EIRP, network loading and local clutter/terrain effects.
A7.174 We have therefore undertaken a short campaign of drive testing to confirm if typical received signal strengths at short distances are likely to exceed the blocking levels found in measurements.
Methodology
A7.175 Four test locations were identified with existing live LTE 1800 MHz base stations in typical suburban clutter. Tests were performed during mid-afternoon in locations 1 to 3. Tests at location 4 were repeated during morning and evening rush hour to maximise the likely network loading encountered during the tests and to determine if this has any effect on the results.
A7.176 Testing was performed using the Rohde & Schwarz ROMES equipment. The kit consists of an RF scanner (set to receive LTE signals on the identified carrier frequency), two roof mounted receiving antennas and a GPS receiver.
A7.177 Calibration tests were performed to determine the system losses which showed an average loss of 6 dB. Therefore all results presented here have a correction factor of 6 dB added.
A7.178 The test procedure at each location was as follows:
i) Once a base station location was established, the test vehicle was driven around the base station on all nearby accessible roads spiralling out from the base station while recording measurements at 200 millisecond intervals on a laptop. The recorded measurements included position, time, Cell ID, and wideband and narrowband variants of received power (RSSI) and reference signal received power and quality (RSRP and RSRQ)
ii) The tests were continued until the average signal dropped below -70 dBm.

Technical coexistence issues for the 2.3 and 3.4 GHz award
42
Results
A7.179 The details of the locations and base stations studied are summarised in the following table:
Table A7.19: Drive testing location details
Location Environment
BS approx. height
(m)
Min distance
(m)
Max distance
(km)
1 Suburban, tower blocks 40 40 1.1 2 Suburban/open 26 110 6.5 3 Industrial estate 15 2 6.7
4a Suburban, tower blocks 40 22 2.6 4b Suburban, tower blocks 40 22 6.3
A7.180 The following CDF plot shows the distribution in received wideband power at each location during the main tests. Location 1 was found to use a 20 MHz LTE bandwidth; all other locations used a 10 MHz bandwidth.
Figure A7.19: CDF of received power during drive testing
A7.181 The highest LTE signal levels are found at location 1. This may be expected as a 20
MHz LTE bandwidth is in use here.
A7.182 When viewing these distributions of received power it is helpful to obtain a view of the network loading of the base station to determine if the received powers are
-90 -80 -70 -60 -50 -40 -30 -200
0.1
0.2
0.3
0.4
0.5
0.6
0.7
0.8
0.9
1Drive test results: WB power
Power (dBm)
Pro
babi
lity
Loc 1 (20 MHz)Loc 2 (10 MHz)Loc 3 (10 MHz)Loc 4a (10 MHz)Loc 4b (10 MHz)

Technical coexistence issues for the 2.3 and 3.4 GHz award
43
representative of typical traffic conditions. We have derived network loading based on the relationship between total received power (RSSI), wideband RSRP and wideband RSRQ40.
A7.183 Location 2 was found to have the highest network loading (50-100%). This is despite not showing the highest received power levels, which can be explained by the fact that it was not possible to drive close to the base station at this location (the minimum distance from the base station was 110 metres).
A7.184 The high power levels found at location 1 correspond to loading values of approximately 30-50% for 95% of the measurements.
A7.185 Location 4 had loading of 30-80 for 95% of the measurements, with slightly higher loading found in the evening tests (4b) – although this did not translate into a noticeable difference in received power.
A7.186 Location 3 did not have significant traffic levels (loading of 5-15%), which is reflected in the lower typical values of received power, although the base station was at lower height and measurements were taken up to 2 metrtes away, so high maximum values were still achieved.
A7.187 The loading results show that the distributions in received power are representative of a range of traffic conditions and can therefore be viewed as applicable for possible future 2.3 GHz networks41.
Conclusions from drive testing
A7.188 The short campaign of drive testing has shown that interference to Wi-Fi may be possible under real-world network conditions. As expected, received power is heavily dependent on base station geometry, and also network loading to some extent. Therefore in practice the probability of interference can be expected to be low.
A7.189 When the distributions of received power are viewed in the context of the minimum blocking requirements from the IEEE standard of -47 dBm, as supported by the lab measurements described above, it is clear that interference is a possibility to outdoor users of Wi-Fi when in close range to these base stations.
A7.190 For indoor Wi-Fi scenarios an additional wall loss of 6.9 dB42 can be subtracted from the received power distributions to obtain the probability of interference. In this case interference is also possible, albeit with a lower probability.
A7.191 These results are provided for indicative purposes based on a small number of locations and are not statistically significant. More detailed analysis of probability of interference is explored in the following sections of this annex.
A7.192 It is noted that there is some uncertainty in the results as not all network parameters (i.e. base station EIRP and geometry) are known. Nonetheless the results are believed to give a reasonable indication of typical received LTE power levels for a range of different environments and traffic conditions.
40 LTE Drive Test – How to benefit from using a R&S TSMW – Application Note, Rohde & Schwarz, October 2012: http://www.rohde-schwarz.co.uk/file/1SP17_1e.pdf 41 Measurements were taken from an 1800 MHz FDD network. It is noted that a 2.3 GHz TDD network may give slightly different results, but differences are not expected to be significant. 42 The derivation of this assumption is explored further in A1.204 below
Technical coexistence issues for the 2.3 and 3.4 GHz award
44
A7.193 The frequency difference between the 1800 MHz and 2300 MHz bands may mean 2300 MHz power levels will be slightly lower in practice.
Theoretical analysis of interference
Introduction
A7.194 The results from our measurement campaign presented above have shown that interference is a possibility in certain scenarios. It is therefore necessary to translate the blocking levels derived from measurements into probability of interference in order to calculate the total number of affected networks in the UK.
A7.195 We have engaged in two separate sets of analysis to determine the likelihood of interference, as follows:
i) Derivation of maximum interference ranges from LTE devices (base stations and mobiles) using the measurement results and the blocking levels from the standards
ii) Detailed modelling of LTE downlink interference which takes into account actual location data and clutter and terrain effects. The measurement data can then be used to derive a total number of affected networks in the UK
A7.196 These figures will then be used to inform our policy decisions on the interference risk.
A7.197 The detailed downlink modelling will also consider a sensitivity analysis to ensure measurement and modelling uncertainty is accounted for.
Theoretical interference ranges
Introduction
A7.198 The minimum requirements on blocking levels from the relevant IEEE and ETSI standards, as introduced in A1.80 can be used to derive the worst case interference ranges from LTE base stations and mobiles based on a minimum coupling loss (MCL) calculation.
A7.199 Similarly we can use the measurement results presented in Table A7.14 to derive ranges based on the measured performance of typical and worst case devices. These can be expected to be lower than the worst case ranges from the standards.
Methodology and assumptions
A7.200 For base stations, the geometry effects described above are taken into account using the methods described in 3GPP TR 36.81443 to calculate antenna discrimination in the vertical plane.
A7.201 Discrimination in the horizontal plane is not taken into account – i.e. the ranges are based on the sector boresight so should not be interpreted as a circular exclusion zone around a base station. No antenna discrimination is assumed for mobile
43 3GPP TR 36.814 V9.0.0, Evolved Universal Terrestrial Radio Access (E-UTRA); Further advancements for E-UTRA physical layer aspects, March 2010, Table A.2.1.1-2: http://www.3gpp.org/ftp/specs/html-INFO/36814.htm

Technical coexistence issues for the 2.3 and 3.4 GHz award
45
devices, femtocells, or the Wi-Fi receiver. The discrimination is then combined with the relevant transmit power and blocking level to derive the required minimum coupling loss.
A7.202 This is then compared with a relevant propagation model in order to calculate the minimum separation distance:
• For base station interference we use the suburban variant of the Okumura Hata propagation model as modified in our 800 MHz and 2.6 GHz competition assessment analysis44.
• For mobile interference free space propagation is assumed.
Results
A7.203 The resulting interference ranges for the standards and different LTE deployments are presented in the following tables:
Table A7.20: Minimum separation distances based on standards
Standard Blocking
level (dBm) Base station separation
distance (m)
Mobile device separation
distance (m) ETSI (CW) -30 45 <1
IEEE (wideband) -47 300 3
Table A7.21: Minimum separation distances for different LTE deployments
LTE Interferer Wi-Fi Victim EIRP (dBm)
MCL (dB)
Required separation distance
(m)
Macro cell 20 m Access point
67 106 220
Client 102 160
Small cell 5 m Access point
45 84 55
Client 80 45
Femto cell (max. power) Access point
20 59 9
Client 55 5
Femto cell (typical power) Access point
10 49 3
Client 45 2 Mobile device (max.
power) Access point
23 62 13
Client 58 8 Mobile device (typical
power) Access point
3 42 1
Client 38 1
44 Assessment of future mobile competition and award of 800 MHz and 2.6 GHz, Ofcom, July 2012, A8.38: http://stakeholders.ofcom.org.uk/binaries/consultations/award-800mhz/statement/Annexes7-12.pdf

Technical coexistence issues for the 2.3 and 3.4 GHz award
46
A7.204 The ranges for macro and small cells are the maximum possible range of interference in a suburban environment. In practice the effects of additional clutter and terrain may provide improvements, particularly in urban and dense urban environments.
A7.205 Additionally, due to the effects of antenna geometry and discrimination there are cases where devices can be positioned close to an interfering LTE base station without interference occurring.
A7.206 Separation distances for femtocells and mobile devices are based on free space propagation. In practice the effects of wall loss are expected to reduce these further – i.e. interference issues are only likely to occur within the same room as the victim device, and can usually be mitigated by moving either the interfering or victim device.
A7.207 Femtocells are able to operate at a maximum of 20 dBm45, however in practice typical transmit powers are much lower in order to avoid self-interference with the wider macro-cell network46. Most devices have a maximum output capability of 10–20 dBm47, and can operate as low as -15 dBm (see footnote 46). Therefore we have assumed a typical transmit power of 10 dBm, which results in separation distances of 2 to 3 metres.
A7.208 In many cases femtocells operate in conjunction with a wired connection to a home router, which will also use Wi-Fi. In this case a long cable may be required to avoid interference. Femtocells may also be integrated with Wi-Fi in the same device, in which case we believe that interference should be avoided through design, as for mobile devices. However there is a risk of interference to client devices operating on other Wi-Fi networks.
A7.209 There is some evidence to suggest existing 3G femtocells operating at 2.1 GHz sometimes cause interference issues to Wi-Fi48,49. This can usually be mitigated by increasing the separation between the devices, by using a longer cable if required. The 2.3 GHz is band is located closer and so we would expect any interference to be slightly higher (depending on the design of the Wi-Fi receiver).
A7.210 The maximum transmit power of mobile devices is 23 dBm, but typical values are generally found to be significantly lower due to power control and to conserve battery life50,51. We have assumed a typical value of 3 dBm52, which results in a separation distance of less than 1 metre.
45 Assuming an omni-directional antenna and maximum output power from relevant 3GPP specs for Home BS - table 6.2-1 of 3GPP TS36.104 (footnote 22) 46 Femtocell and Beacon Transmit Power Self-Cailbration, Chirag Patel et al, Qualcomm, February 2010: http://www.qualcomm.com/media/documents/femtocell-and-beacon-transmit-power-self-calibration 47 Femtocells – Opportunities and Challenges for Business and Technology, Simon R Saunders et al, Wiley 2010. 48 Wi-Fi/Cellular radio co-existence in enterprise products, Small Cell Forum, December 2013: http://www.scf.io/en/documents/064_-_Wi-FiCellular_radio_co-existence.php 49 Vodafone eForum topic - Suresignal affecting Wifi internet connection: http://forum.vodafone.co.uk/t5/Vodafone-Sure-Signal/Suresignal-affecting-Wifi-internet-connection/td-p/737011 50 Figure 21, LTE User Equipment Coexistence with 862 – 870MHz, Ofcom, September 2012: http://stakeholders.ofcom.org.uk/binaries/consultations/award-800mhz/statement/lte-coexistence.pdf
Technical coexistence issues for the 2.3 and 3.4 GHz award
47
A7.211 MASS have also calculated minimum separation distances in their measurement report. These results broadly align with our own figures, while noting that they are based on slightly different EIRP and propagation assumptions.
Detailed modelling of downlink interference
Introduction
A7.212 We have developed a detailed model to calculate the distribution of LTE downlink signal strength across the UK. This takes into account actual locations of base stations and Wi-Fi networks.
A7.213 The resulting distribution of received LTE signal strength can then be compared against the blocking levels from the measurements to determine the total number of affected networks in the UK.
A7.214 This can be assumed to give a more realistic representation of interference than the theoretical ranges and probabilities calculated above. Full details of the methodology, assumptions and results are presented in the following sections.
Methodology
A7.215 In order to assess the potential interference introduced by LTE-TDD deployments in the 2.3 GHz release band, the received LTE power at known locations of Wi-Fi networks is calculated. The distribution of LTE signal strength across all locations can then be compared against the interference levels derived from the Wi-Fi device measurements outlined above to determine the probability of interference.
A7.216 The model is adapted from the model previously used by Ofcom on other projects to assess coverage53
A7.217 The main inputs to the model are as follows:
• Base station locations
• Receiver locations – in the original model this was residential postcode data, in this case assumed locations of Wi-Fi networks can be used
• Clutter data (fixed, see Assumptions below)
A7.218 A high level description of the calculation process is as follows:
i) Assumed Wi-Fi network location datasets at a postcode unit level are generated separately for the 4 categories introduced earlier:
51 ITU-R Document 5-6/146-E: Draft Report on sharing studies in the frequency band 790-862 MHz in Regions 1 and 3, Annex 3-3: Field study of UMTS system characteristics, April 2010: https://www.itu.int/md/dologin_md.asp?lang=en&id=R07-JTG5.6-C-0088!N14!MSW-E (account required) 52 In the Ofcom study at 800 MHz (footnote 50) median power varied from -5 dBm to +13 dBm depending on the usage. The Australian field trial (footnote 51) suggests that the mean power is +2 dBm in a rural cell and -9 dBm in an urban cell. Taking these studies into account and noting the frequency differences, we assume a typical EIRP of +3 dBm for mobile devices 53 Ofcom 3G Coverage Obligation Verification Methodology, May 2012: http://stakeholders.ofcom.org.uk/binaries/consultations/2100-MHz-Third-Generation-Mobile/annexes/methodology.pdf

Technical coexistence issues for the 2.3 and 3.4 GHz award
48
1) Domestic networks
2) Outdoor networks
3) Indoor public networks
4) Enterprise networks
The calculation is performed separately for each category.
ii) Northern Ireland is omitted from the simulation, as the 2.3 GHz band is not planned to be released in the Northern Ireland.
iii) A theoretical LTE-TDD base station deployment is set up, based on the parameters of an existing 3G 2.1 GHz deployment, with a carrier frequency of 2380 MHz and a 20 MHz LTE bandwidth.
iv) The median path loss from each base station, to each Wi-Fi postcode is calculated and the received LTE power is calculated for a hypothetical test terminal positioned at each Wi-Fi location. The height and the building penetration loss of the hypothetical test terminal are specified according to the relevant category of Wi-Fi network. The simulation method selects the highest received power from one of the base station sectors as the received LTE power at the Wi-Fi location.
v) A complementary cumulative distribution function (CCDF) of received LTE power at all Wi-Fi locations for each category of the Wi-Fi network is generated by aggregating the results over all postcode locations. This is combined with the interference levels derived from the measurement results introduced above to assess the impact of potential interference.
A7.219 An example of a CCDF curve generated by the model is shown in Figure A7.21. The median router blocking level is also shown.
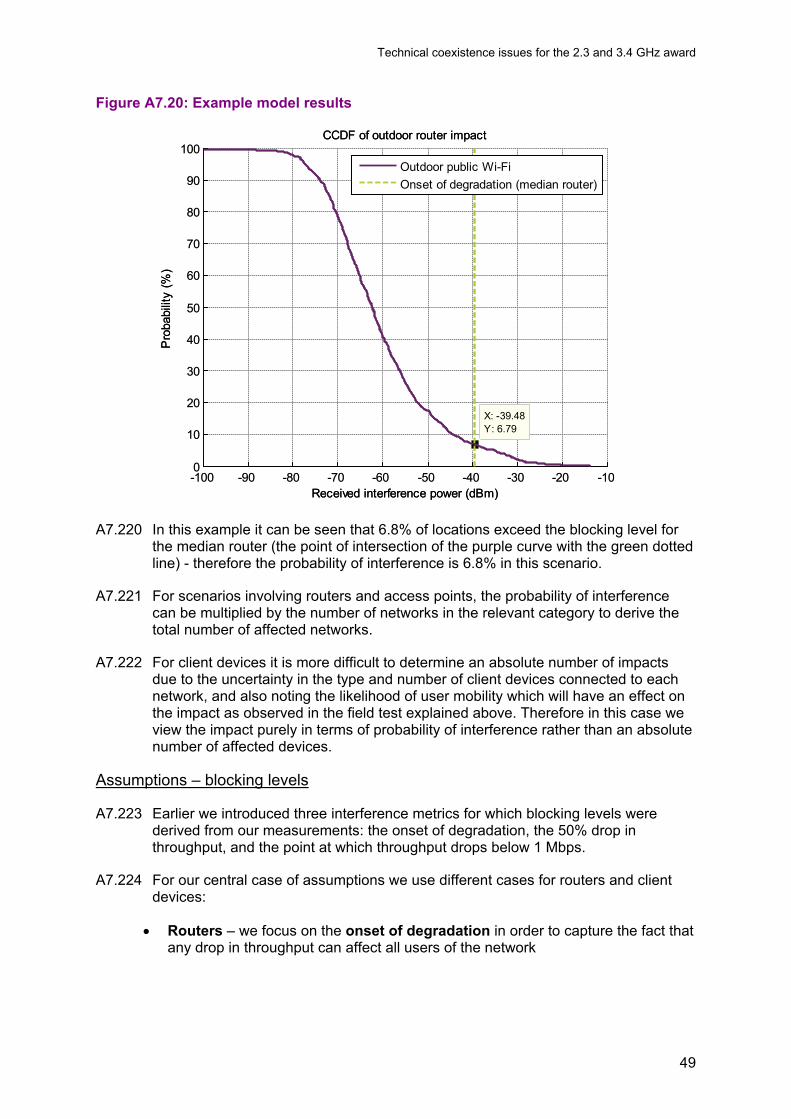
Technical coexistence issues for the 2.3 and 3.4 GHz award
49
Figure A7.20: Example model results
A7.220 In this example it can be seen that 6.8% of locations exceed the blocking level for the median router (the point of intersection of the purple curve with the green dotted line) - therefore the probability of interference is 6.8% in this scenario.
A7.221 For scenarios involving routers and access points, the probability of interference can be multiplied by the number of networks in the relevant category to derive the total number of affected networks.
A7.222 For client devices it is more difficult to determine an absolute number of impacts due to the uncertainty in the type and number of client devices connected to each network, and also noting the likelihood of user mobility which will have an effect on the impact as observed in the field test explained above. Therefore in this case we view the impact purely in terms of probability of interference rather than an absolute number of affected devices.
Assumptions – blocking levels
A7.223 Earlier we introduced three interference metrics for which blocking levels were derived from our measurements: the onset of degradation, the 50% drop in throughput, and the point at which throughput drops below 1 Mbps.
A7.224 For our central case of assumptions we use different cases for routers and client devices:
• Routers – we focus on the onset of degradation in order to capture the fact that any drop in throughput can affect all users of the network
-100 -90 -80 -70 -60 -50 -40 -30 -20 -100
10
20
30
40
50
60
70
80
90
100
X: -39.48Y: 6.79
Received interference power (dBm)
Pro
babi
lity
(%)
CCDF of outdoor router impact
-100 -90 -80 -70 -60 -50 -40 -30 -20 -100
10
20
30
40
50
60
70
80
90
100
Received interference power (dBm)
Pro
babi
lity
(%)
CCDF of outdoor router impact
Outdoor public Wi-FiOnset of degradation (median router)

Technical coexistence issues for the 2.3 and 3.4 GHz award
50
• Client devices – we focus on the 50% drop in throughput as we believe this reflects the variability seen by users in practice as supported by our field tests on client devices.
Assumptions – locations of base stations and Wi-Fi networks
A7.225 The LTE base station locations are derived from an existing 3G network at 2.1 GHz. As this is this the closest mobile frequency band to 2.3 GHz it is believed to represent a reasonable proxy for a national roll-out at 2.3 GHz. However it should be noted that it may be pessimistic to assume a full national roll-out at 2.3 GHz, as in practice this may take several years to achieve, and may not be desirable to ISPs if coverage and capacity in certain areas has already been sufficiently achieved using other bands. This, deployments may be more regional.
A7.226 We note that in practice 2.3 GHz may be used by small cells. We do not have a clear idea of the specifics of such a deployment, but we believe that the impact of a high power macro cell network will be similar to a denser network of small cells with lower power. This is illustrated in the minimum separation distances outlined earlier in Table A7.21, where the required separation distances for a typical macrocell and small cell are 220 metres and 55 metres respectively. This suggests that the density of a small cell network would have to be 16 times that of a macro-cell network to cause an equivalent risk of interference.
A7.227 All base stations are assumed to radiate at EIRP values based on the existing 3G powers, with a 2dB increase applied to account for the difference in maximum licensed powers (65 dBm for a 5 MHz 3G carrier at 2.1 GHz; 67 dBm proposed for a 20 MHz LTE signal in the release band54).
A7.228 The assumed locations of Wi-Fi networks for each of the four categories of interest are derived as follows:
i) Domestic networks: postcode data on domestic broadband connections from Ofcom’s Infrastructure Report55 is used as a reasonable proxy for locations of home Wi-Fi networks. A total of 17.6 million households are analysed (the dataset only includes 90% of all broadband properties). The affected proportion is then applied to the assumed total of 17.5 million Wi-Fi networks.
ii) Outdoor public networks: publically available postcode data on hotspot locations from BT Wi-Fi56 is used. This data splits hotspots into different categories, which allows us to distinguish between outdoor access points on lampposts, assumed to be at 5 metres height, and access points in phone boxes, assumed to be at 2 metres height. A total of 1,900 locations are analysed. The affected proportion is then applied to the assumed total of 4,000 outdoor networks.
iii) Indoor public networks: the BT data described above plus postcode data supplied by other ISPs for use in the Infrastructure Report is used. A total of 14,400 locations are analysed. The affected proportion is then applied to the assumed total of 78,000 public indoor networks.
54 We have proposed an EIRP limit of 61 dBm for a 5 MHz channels in the technical licence conditions in section 13. This is equivalent to 67 dBm in a 20 MHz channel 55 http://stakeholders.ofcom.org.uk/market-data-research/other/telecoms-research/broadband-speeds/infrastructure-report-2012/ 56 BT Wi-Fi hotspot locations: http://www.btwifi.com/find/directories.jsp

Technical coexistence issues for the 2.3 and 3.4 GHz award
51
iv) Medium and large enterprise networks in offices: data on number of non-residential properties from the GeoPoint Plus database is used. . A total of 1.4 million addresses are analysed. The affected proportion is then applied to the assumed total of 680,000 enterprise networks.
A7.229 It should be noted that the use of postcode data gives rise to a certain level of uncertainty – effectively we are assuming that all Wi-Fi networks are located at the location of the postcode centroid. While this may result in an under-estimate of the impact in certain locations, it also implies an over-estimate in other locations and therefore this effect can be assumed to normalise at the national level.
Assumptions – propagation of interfering signal
A7.230 The modelled received LTE signal strength at a given location, and therefore the probability of interference, depends significantly on the choice of propagation model used in the analysis. To ensure we are producing as accurate an estimate of the impact of interference as possible, we have considered a range of models and validation exercises.
A7.231 We have identified 2 main models as being potentially suitable for use in this analysis:
i) The Extended Hata model57, with the corrections introduced in the Ofcom 3G coverage obligation study58. We use the suburban variant of the model on the basis that the majority of the UK population reside in suburban areas.
ii) ITU-R P.181259 with a 50 metre clutter and terrain database. 50% time and locations are assumed, in order to give a reasonable average impact figure on a national basis
A7.232 Both these models have the benefit of being able to run nationally without significant computational complexity. However, as both models are designed to predict coverage at medium to long distances (i.e. greater than 1 km), their validity for predicting interference at short ranges of a few hundred metres is not clear.
A7.233 Specifically, the Hata model is expected to under-estimate loss (and therefore over-estimate interference) at short distances, where it reverts to free space loss - thus not taking into account the additional clutter loss that may be expected in many cases – particularly when considering the typical locations of Wi-Fi networks.
A7.234 Conversely, P.1812 may be expected to over-estimate loss (and under-estimate interference) as it always assumes receivers are located below the local clutter height - and therefore a fixed loss is always included, which may not be appropriate in some locations.
A7.235 Therefore some variation can be expected between these two models.
57 ERC Report 68 and ECO SEAMCAT user manual: http://www.erodocdb.dk/docs/doc98/official/pdf/Rep068.pdf http://tractool.seamcat.org/wiki/Manual/PropagationModels/ExtendedHata 58 Ofcom 3G Coverage Obligation Verification Methodology, May 2012: http://stakeholders.ofcom.org.uk/binaries/consultations/2100-MHz-Third-Generation-Mobile/annexes/methodology.pdf 59 ITU-R Recommendation P.1812-3 - A path-specific propagation prediction method for point-to-area terrestrial services in the VHF and UHF bands: http://www.itu.int/rec/R-REC-P.1812/en

Technical coexistence issues for the 2.3 and 3.4 GHz award
52
A7.236 To quantify the degree with which the Hata model may be over-estimating interference we have engaged Siradel S.A.S. to conduct more detailed modelling using ray tracing in conjunction with high resolution (3 metre) geographic data in approximately 300 square km of London and its suburbs, as outlined in the red polygon below:
Figure A7.21: London area included in ray tracing analysis
A7.237 Full details of the ray tracing analysis are outlined in a separate report60
A7.238 The following CCDF shows the results for locations of residential Wi-Fi networks within the analysis area, plus results from our model using Suburban Hata and P.1812 for the same area.
60 Full details and a link to the report are available in annex 5.
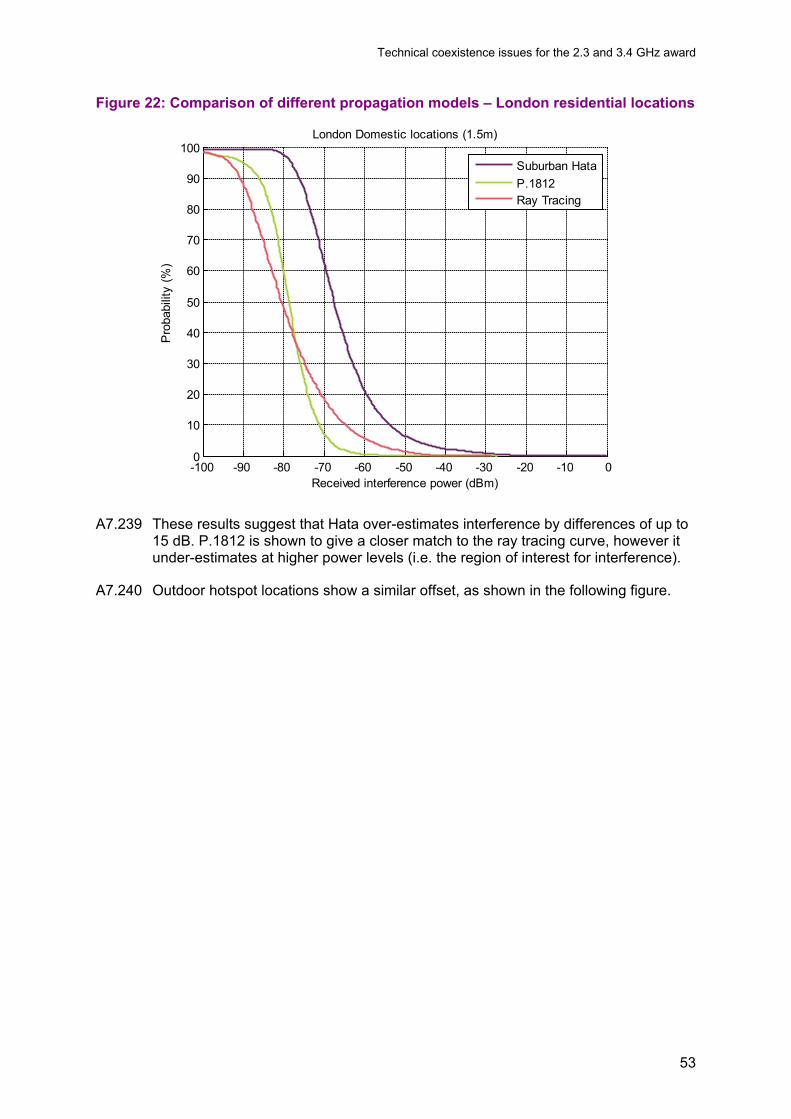
Technical coexistence issues for the 2.3 and 3.4 GHz award
53
Figure 22: Comparison of different propagation models – London residential locations
A7.239 These results suggest that Hata over-estimates interference by differences of up to 15 dB. P.1812 is shown to give a closer match to the ray tracing curve, however it under-estimates at higher power levels (i.e. the region of interest for interference).
A7.240 Outdoor hotspot locations show a similar offset, as shown in the following figure.
-100 -90 -80 -70 -60 -50 -40 -30 -20 -10 00
10
20
30
40
50
60
70
80
90
100
Received interference power (dBm)
Pro
babi
lity
(%)
London Domestic locations (1.5m)
Suburban HataP.1812Ray Tracing

Technical coexistence issues for the 2.3 and 3.4 GHz award
54
Figure A7.23: Comparison of different propagation models – London outdoor locations
A7.241 Outdoor distributions are shown for lamppost locations at 5 metres height (solid lines) and for client devices at all outdoor locations at 1.5 metres height (dotted lines). The difference between Hata and ray tracing is not as pronounced for 5 metres height.
A7.242 As Hata and ray tracing give a similar shape of distribution, we believe it is reasonable to continue to use the Hata model in order to produce impacts at a national level, but with a constant offset applied to account for the degree to which it is shown to over-estimate interference.
A7.243 We believe that the trend of this offset seen in the London area would be representative of propagation in typical Wi-Fi locations (i.e. suburban households, urban public hotspots) at a national level, although we are less confident as to whether the absolute difference is representative.
A7.244 Consequently we have applied only a 10 dB correction factor to the suburban Hata model in our central case. This is believed to be a slightly cautious assumption as we believe the actual offset could be slightly higher in practice, while recognising the uncertainty in applying the correction nationwide based on London data.
A7.245 We also consider an additional pessimistic case of results which uses suburban Hata with no correction applied to highlight the sensitivity in the results.
Assumptions – single vs. multiple interferers
A7.246 We have assumed that interference to Wi-Fi is dominated by a single LTE base station. This is justified in the following figure which presents a comparison where the power sum of the received power from the closest 20 base stations is also
-100 -90 -80 -70 -60 -50 -40 -30 -20 -10 00
10
20
30
40
50
60
70
80
90
100
Received interference power (dBm)
Pro
babi
lity
(%)
London outdoor locations
Suburban Hata - 5mP.1812 - 5mRay Tracing - 5mSuburban Hata - 1.5mP.1812 - 1.5mRay Tracing - 1.5m

Technical coexistence issues for the 2.3 and 3.4 GHz award
55
considered. The difference is shown to be negligible. In practice the interference contributions from multiple base stations will be uncorrelated and therefore it is reasonable to assume a single interferer is dominant.
Figure A7.24: Comparison of interference power from a single interferer and a power sum of multiple interferers
Assumptions – building penetration loss
A7.247 For scenarios with victim devices located indoors we have derived the following figures for building penetration loss from our previous work at 800 MHz and 2.6 GHz61:
Table A7.22: Assumed building penetration loss values (dB)
Device type Building
penetration loss (dB)
Source scenario
Home router facing towards base station 6.9 external wall loss
Home router facing away from base station 12.9 derived from ‘deep’ scenario
Enterprise and public indoor access point 6.9 external wall loss Client device 8.4 ‘shallow’ scenario
A7.248 We have assumed that routers are typically located near the external wall of the
building as is often the case in domestic networks due to the location of the phone line.
61 Assessment of future mobile competition and award of 800 MHz and 2.6 GHz, Ofcom, July 2012, A8.103 - A8.137: http://stakeholders.ofcom.org.uk/binaries/consultations/award-800mhz/statement/Annexes7-12.pdf
-120 -110 -100 -90 -80 -70 -60 -50 -40 -300
10
20
30
40
50
60
70
80
90
100
Received interference power (dBm)
Pro
babi
lity
(%)
Interfering signal comparison - all domestic locations
Single interfererMultiple interferers

Technical coexistence issues for the 2.3 and 3.4 GHz award
56
A7.249 However, using a fixed value of 6.9 dB would be effectively assuming all routers are located on the wall facing the interfering base station, while in practice it is statistically likely that they would be uniformly distributed between the nearest and the furthest wall to the base station. Those located at the furthest wall will have an increased building penetration loss, and are therefore less likely to be affected by interference.
A7.250 To account for this, we have assumed in the domestic networks scenario that half of routers have a building penetration loss of 6.9 dB, and the other half have an additional loss of 6 dB. This is consistent with our assumptions for a ‘deep’ in-building scenario in our previous work (footnote 61).
A7.251 We have not applied this additional loss factor to indoor public networks or enterprise networks. This is because in these networks it is common for multiple access points to be used across the building. Therefore it is likely that at least one access point will be located near the wall facing the base station. However, we note that this also means that any impact to the overall network will be less severe (if only one access point is affected), and impact figures for these scenarios should consider that the risk is to only a small portion of the network.
A7.252 Client devices are not typically used adjacent to the external wall. To account for this we have assumed an additional depth of 2.5 metres for client devices which results in an additional 1.5 dB of loss and is consistent with the “shallow” locations in our previous work (footnote 61). This is applied to all indoor scenarios.
Summary of assumptions
A7.253 All assumptions for our central case, their sources and an assessment of whether these tend towards optimistic or pessimistic (in the context of interference) are presented in the following table. Where neither are noted then the assumption is seen as neutral:

Technical coexistence issues for the 2.3 and 3.4 GHz award
57
Table A7.23: Summary of all parameters used in central case Parameter /Assumption Value(s) Comments Source
LTE base station locations
Based on existing 3G deployment
Pessimistic – 2.3 GHz rollout could be lower
3G operator data
LTE base station EIRP
Based on a 2 dB increase applied on 3G powers for a 20 MHz channel (based on EIRP differences)
3G operator data
LTE base station height Based on 3G heights 3G operator
data
Wi-Fi locations
Based on existing locations of domestic broadband connections, public data, ISP data on public hotspots, and non-residential addresses.
Ofcom Infrastructure Report data (footnote 11), BT public data (footnote 56), Geopoint Plus
Propagation model
Extended Hata model with 10 dB correction applied based on ray tracing results
SEAMCAT implementation (footnote 57) and Siradel analysis (Annex 5)
Clutter data Fixed as suburban
Suburban assumption based on locations of majority of domestic population. Likely to be slightly pessimistic for public and enterprise networks where urban may be more applicable
Assumption
Building penetration loss
Home routers: 6.9 dB for 50%of routers, 12.9 dB for 50% of routers Public and enterprise access points: 6.9 dB Client devices: 8.4 dB
Only applies to indoor victim scenarios. Split for home routers is to account for base station pointing Slightly pessimistic – higher loss may be experienced in some locations, particularly in enterprise and indoor public networks, and for client devices in all categories
footnote 61
Wi-Fi blocking levels
Based on measurements – median devices used. Routers: based on onset of degradation Client devices: based on 50% drop in throughput
Table A7.14 and MASS Report (Annex 5)
Wi-Fi receiver heights
Indoor APs/routers: 1.5 m Outdoor APs (lamppost): 5 m Outdoor APs (phone box): 2 m Client devices: 1.5 m Enterprise Networks: 1.5 m
Typical assumptions
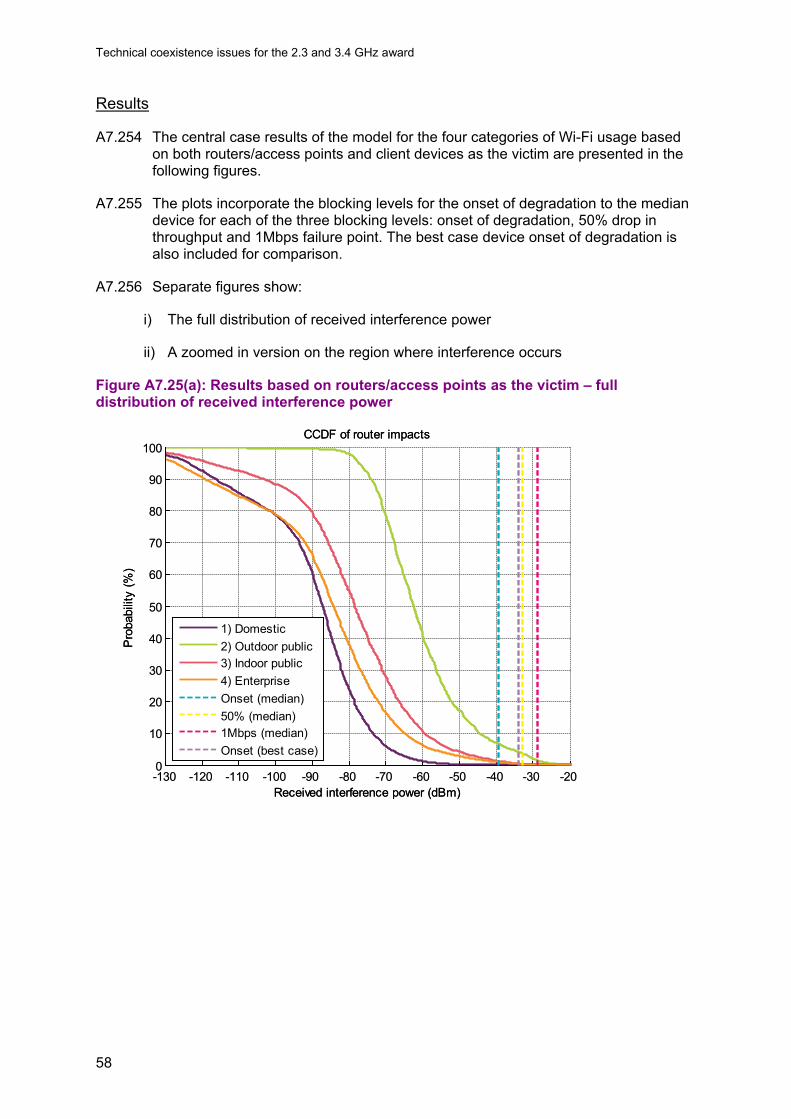
Technical coexistence issues for the 2.3 and 3.4 GHz award
58
Results
A7.254 The central case results of the model for the four categories of Wi-Fi usage based on both routers/access points and client devices as the victim are presented in the following figures.
A7.255 The plots incorporate the blocking levels for the onset of degradation to the median device for each of the three blocking levels: onset of degradation, 50% drop in throughput and 1Mbps failure point. The best case device onset of degradation is also included for comparison.
A7.256 Separate figures show:
i) The full distribution of received interference power
ii) A zoomed in version on the region where interference occurs
Figure A7.25(a): Results based on routers/access points as the victim – full distribution of received interference power
-130 -120 -110 -100 -90 -80 -70 -60 -50 -40 -30 -200
10
20
30
40
50
60
70
80
90
100
Received interference power (dBm)
Pro
babi
lity
(%)
CCDF of router impacts
-130 -120 -110 -100 -90 -80 -70 -60 -50 -40 -30 -200
10
20
30
40
50
60
70
80
90
100
Received interference power (dBm)
Pro
babi
lity
(%)
CCDF of router impacts
1) Domestic2) Outdoor public3) Indoor public4) EnterpriseOnset (median)50% (median)1Mbps (median)Onset (best case)
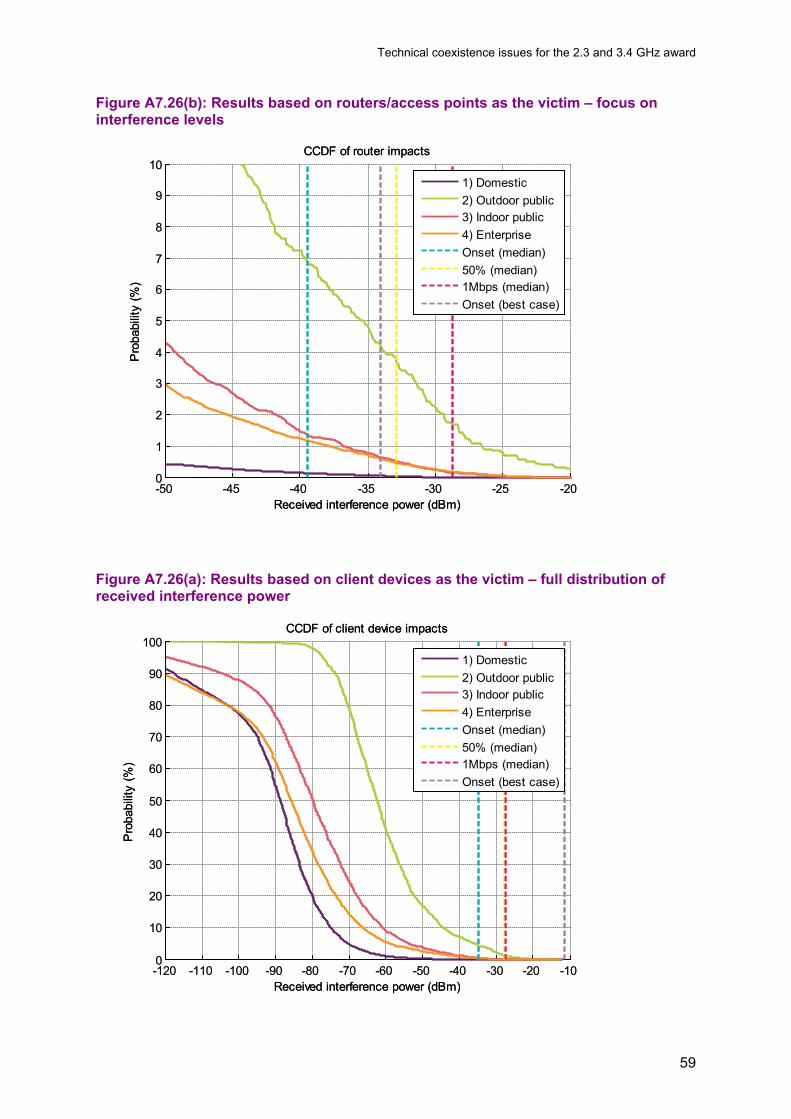
Technical coexistence issues for the 2.3 and 3.4 GHz award
59
Figure A7.26(b): Results based on routers/access points as the victim – focus on interference levels
Figure A7.26(a): Results based on client devices as the victim – full distribution of received interference power
-50 -45 -40 -35 -30 -25 -200
1
2
3
4
5
6
7
8
9
10
Received interference power (dBm)
Pro
babi
lity
(%)
CCDF of router impacts
-50 -45 -40 -35 -30 -25 -200
1
2
3
4
5
6
7
8
9
10
Received interference power (dBm)
Pro
babi
lity
(%)
CCDF of router impacts
1) Domestic2) Outdoor public3) Indoor public4) EnterpriseOnset (median)50% (median)1Mbps (median)Onset (best case)
-120 -110 -100 -90 -80 -70 -60 -50 -40 -30 -20 -100
10
20
30
40
50
60
70
80
90
100
Received interference power (dBm)
Pro
babi
lity
(%)
CCDF of client device impacts
-120 -110 -100 -90 -80 -70 -60 -50 -40 -30 -20 -100
10
20
30
40
50
60
70
80
90
100
Received interference power (dBm)
Pro
babi
lity
(%)
CCDF of client device impacts
1) Domestic2) Outdoor public3) Indoor public4) EnterpriseOnset (median)50% (median)1Mbps (median)Onset (best case)

Technical coexistence issues for the 2.3 and 3.4 GHz award
60
Figure A7.27(b): Results based on client devices as the victim – focus on interference levels
A7.257 The resulting interference probabilities for our central case, using the onset of degradation for routers, and the 50% throughput point for client devices, are shown below. These are based on the performance of the median device. For outdoor networks the results based on the best device are also included for comparison, as we believe this may closer reflect reality based on information from ISPs.
Table A7.24: Central case impact figures
Routers Client devices
Category Total no. of networks
% Locations affected
Total no. of impacts
% Locations affected
1) Domestic 17,500,000 0.1% 17,400 0.0% 2a) Outdoor public (median device)
4,000 6.8% 270 1.4%
2a) Outdoor public (best device) 4.2% 170 N/A 3) Indoor public 78,000 1.4% 1,100 0.1% 4) Enterprise 680,000 1.2% 8,000 0.1%
A7.258 The percentage impacts should be interpreted as follows:
• Routers/access points: % locations affected indicates the proportion of median performance router devices which are at risk of interference for the onset of
-130 -120 -110 -100 -90 -80 -70 -60 -50 -40 -30 -200
10
20
30
40
50
60
70
80
90
100
Received interference power (dBm)
Pro
babi
lity
(%)
CCDF of router impacts
-130 -120 -110 -100 -90 -80 -70 -60 -50 -40 -30 -200
10
20
30
40
50
60
70
80
90
100
Received interference power (dBm)
Pro
babi
lity
(%)
CCDF of router impacts
1) Domestic2) Outdoor public3) Indoor public4) EnterpriseOnset (median)50% (median)1Mbps (median)Onset (best case)

Technical coexistence issues for the 2.3 and 3.4 GHz award
61
degradation on a national basis, based on their geographical proximity to a 2.3 GHz base station. The percentage is translated into a total impact figure62.
• Client devices: % locations affected represents the UK proportion of a Wi-Fi coverage area where a client device (laptops, smartphones, tablets) with the median performance and connected to the network is affected based on a 50% drop in throughput. On an individual Wi-Fi cell by cell basis, most cells have no areas where client devices are impacted, a few may have impacts over 100% of the coverage area and others on a sliding scale in between such that the average per cell is the percentage shown. The distribution in impact between different cells is explored in further detail below. It is not possible to translate this into a total impact figure due to the use of multiple client devices at each location, and the transient nature of usage.
A7.259 For domestic networks interference is found to be negligible – the probability of interference is 0.1% for routers (~17,400 devices). The impact to client devices is also negligible.
A7.260 Outdoor networks are found to be the worst affected category, as expected. The probability of interference is 6.8% for access points (~270 hotspot locations). The impact to client devices is lower at 1.4%.
A7.261 For indoor public networks the probability of interference is 1.4% for access points (~1,000 hotspot locations) and 0.1% for clients. The impact in this case is worse than for indoor domestic networks. This can be explained by a likely higher correlation between base station locations and proximity to public Wi-Fi networks - which are typically in densely populated areas and in busy retail areas and therefore also likely to be close to mobile base stations. For domestic networks a wider distribution of distance to the nearest base station can be assumed.
A7.262 For enterprise networks the probability of interference is 1.2% for access points (~8,000 networks). The impact to client devices is lower at 0.1%.
A7.263 The results for the pessimistic case of suburban Hata propagation with no correction factor applied are presented in the following table:
Table A7.25: Pessimistic case impact figures
Routers Client devices
Category Total no. of networks % Affected Total no. of
impacts % Affected
1) Domestic 17,500,000 0.3% 53,300 0.1% 2) Outdoor public 4,000 16.1% 640 5.3% 3) Indoor public 78,000 3.9% 3,100 1.0% 4) Enterprise 680,000 2.8% 19,000 0.9%
A7.264 The following tables show sensitivity results for a wider range of scenarios,
including:
62 Impact figures greater than 1,000 are rounded to the nearest 100; impact figures less than 1,000 are rounded to the nearest 10. Therefore percentages and impacts may not exactly match.

Technical coexistence issues for the 2.3 and 3.4 GHz award
62
• Impacts to best and worst case devices (to supplement the central case of the median device);
• Impacts based on the full range of interference metrics – onset of degradation, 50% throughput and 1Mbps failure point metrics (to supplement the central case of the onset of degradation for routers and 50% for client devices)
Table A7.26: Impacts based on different devices
Routers Client devices
(% locations affected) (% locations affected)
Category Total no. of networks
Worst device
Median device
Best device
Worst Device
Median device
Best Device
1) Domestic 17,500,000 0.2% 0.1% 0.0% 0.2% 0.0% 0.0%
2) Outdoor public 4,000 9.7% 6.8% 4.2% 7.7% 1.4% 0.0%
3) Indoor public 78,000 2.4% 1.4% 0.6% 1.5% 0.1% 0.0%
4) Enterprise 680,000 1.8% 1.2% 0.6% 1.3% 0.1% 0.0%
Table A7.27: Impacts based on different throughput metrics
Routers Client devices
(% locations affected) (% locations affected)
Category Total no. of networks Onset 50%
drop Failure point Onset 50%
drop Failure point
1) Domestic 17,500,000 0.1% 0.0% 0.0% 0.1% 0.0% 0.0%
2) Outdoor public 4,000 6.8% 3.7% 1.7% 4.4% 1.4% 1.1%
3) Indoor public 78,000 1.4% 0.5% 0.2% 0.6% 0.1% 0.1%
4) Enterprise 680,000 1.2% 0.5% 0.2% 0.5% 0.1% 0.1%
A7.265 As noted above, the % locations affected for client devices represents the UK average proportion of a Wi-Fi coverage area (cell) where a client device is affected. The following plot shows the distribution in impact to individual outdoor cells across the country in the central case:

Technical coexistence issues for the 2.3 and 3.4 GHz award
63
Figure A7.27: Location variability of impact for outdoor client devices
A7.266 Location variability is calculated based on a standard deviation of 5.6 dB which is consistent with the assumptions in the ITU-R P.1546 propagation model.
A7.267 This shows that 65% of outdoor Wi-Fi cells have zero impact, 25% of cells have between zero and 50% of their coverage area affected, and the remaining 10% have more than 50% of their coverage area affected. A small proportion, 2.5%, (approx 100 cells), have the entire coverage area impacted.
A7.268 For example, an urban environment with a dense deployment of LTE base stations located close to Wi-Fi access points may align with the 2.5% of cases where the entire coverage area is affected.
Additional analysis
A7.269 In addition to our analysis presented above, the MoD has commissioned CGI to conduct Monte Carlo based statistical analysis to derive minimum separation distances and calculate the probability of interference, The full details and results are presented in a separate report alongside this document.63
A7.270 The Monte Carlo analysis takes into account antenna discrimination and random positioning of Wi-Fi devices within an LTE cell.
A7.271 A number of assumptions differ from our own analysis. In particular, interference probabilities are derived based on relative C/I levels rather than absolute interference levels and are therefore not directly equivalent for comparison - but are nevertheless useful to understand the possible range of interference probability within a single cell.
63 See Annex 5 for full details and a link
0 10 20 30 40 50 60 70 80 90 10065
70
75
80
85
90
95
100
% cell area affected
% o
f cel
lsCDF of location variability
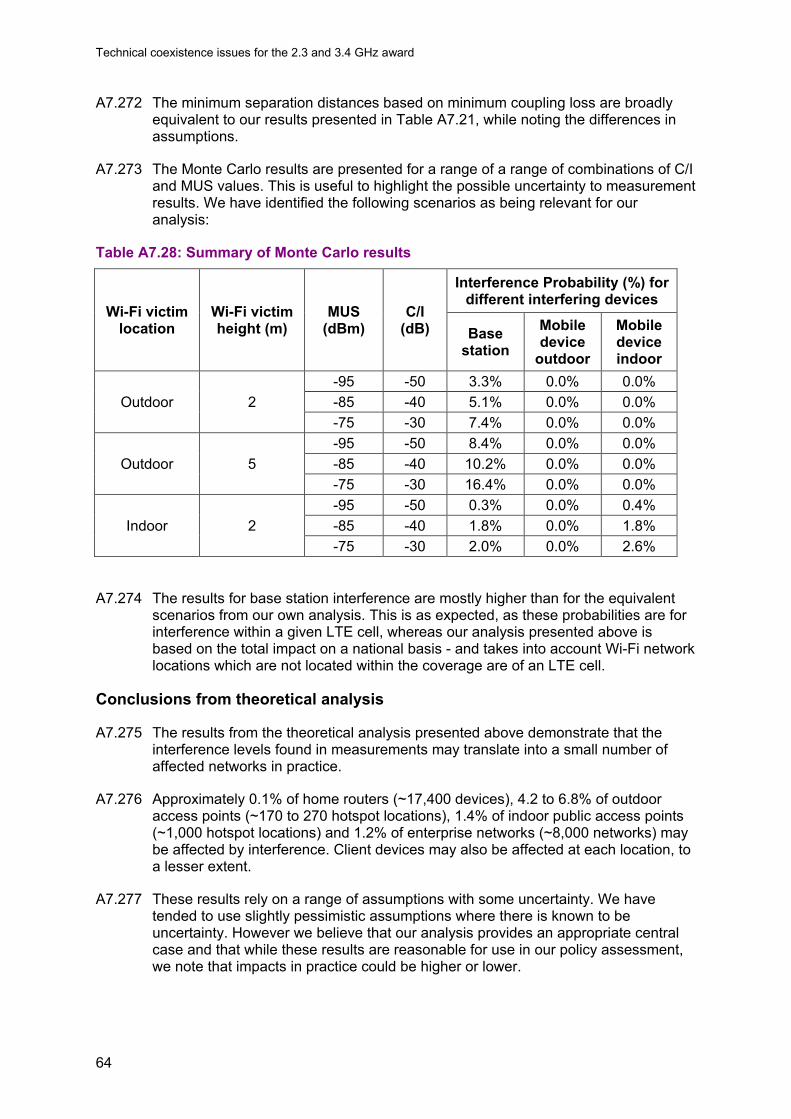
Technical coexistence issues for the 2.3 and 3.4 GHz award
64
A7.272 The minimum separation distances based on minimum coupling loss are broadly equivalent to our results presented in Table A7.21, while noting the differences in assumptions.
A7.273 The Monte Carlo results are presented for a range of a range of combinations of C/I and MUS values. This is useful to highlight the possible uncertainty to measurement results. We have identified the following scenarios as being relevant for our analysis:
Table A7.28: Summary of Monte Carlo results
Wi-Fi victim location
Wi-Fi victim height (m)
MUS (dBm)
C/I (dB)
Interference Probability (%) for different interfering devices
Base station
Mobile device
outdoor
Mobile device indoor
Outdoor 2 -95 -50 3.3% 0.0% 0.0% -85 -40 5.1% 0.0% 0.0% -75 -30 7.4% 0.0% 0.0%
Outdoor 5 -95 -50 8.4% 0.0% 0.0% -85 -40 10.2% 0.0% 0.0% -75 -30 16.4% 0.0% 0.0%
Indoor 2 -95 -50 0.3% 0.0% 0.4% -85 -40 1.8% 0.0% 1.8% -75 -30 2.0% 0.0% 2.6%
A7.274 The results for base station interference are mostly higher than for the equivalent scenarios from our own analysis. This is as expected, as these probabilities are for interference within a given LTE cell, whereas our analysis presented above is based on the total impact on a national basis - and takes into account Wi-Fi network locations which are not located within the coverage are of an LTE cell.
Conclusions from theoretical analysis
A7.275 The results from the theoretical analysis presented above demonstrate that the interference levels found in measurements may translate into a small number of affected networks in practice.
A7.276 Approximately 0.1% of home routers (~17,400 devices), 4.2 to 6.8% of outdoor access points (~170 to 270 hotspot locations), 1.4% of indoor public access points (~1,000 hotspot locations) and 1.2% of enterprise networks (~8,000 networks) may be affected by interference. Client devices may also be affected at each location, to a lesser extent.
A7.277 These results rely on a range of assumptions with some uncertainty. We have tended to use slightly pessimistic assumptions where there is known to be uncertainty. However we believe that our analysis provides an appropriate central case and that while these results are reasonable for use in our policy assessment, we note that impacts in practice could be higher or lower.

Technical coexistence issues for the 2.3 and 3.4 GHz award
65
Mitigation of interference
Introduction
A7.278 The analysis in the previous section shows that some Wi-Fi networks may potentially be affected by interference. In this section we outline the possible ways to mitigate the effects of interference, and assess whether each option is viable in practice.
Moving devices
A7.279 The simplest way to mitigate interference is to increase the separation distance between the interfering device and the victim. This may be difficult where the interferer is a base station but is easier if the interferer is a mobile device – although this does require the user to identify the cause of interference.
A7.280 Moving the victim device is possible for client devices but would generally be difficult for routers which typically need to be located near a phone line.
A7.281 Moving the client device closer to the access point will also help to mitigate the effects of interference. While improved signal strength does not mitigate the effects of blocking, the decreased separation can mean that throughput can be restored to the original level in the absence of interference, since Wi-Fi employs adaptive modulation and coding.
Upgrading equipment
A7.282 The measurements have shown a wide variation in susceptibility to interference between different devices. Therefore it will be possible to mitigate interference by upgrading the device.
A7.283 Specifically this would mean upgrading to a device which has a better band-pass filter to reject signals within the 2.3 GHz band. We note that some manufacturers are already employing such filters within current devices, and we expect these filters to be increasingly employed as global usage of the 2.3 GHz increases within the next few years.
External receiver filters
A7.284 In theory it would also be possible to design an external filter to attenuate the interfering LTE signal. Due to the 10 MHz separation between the two bands it is believed this could be achieved at low cost.
A7.285 We have engaged in discussions with a filter manufacturer and have confirmed that it would be possible to design such a device.
A7.286 However, a filter would only be able to be used for access points/routers which have a port for an external antenna, and would not be possible for use with access points with integrated antennas (which are reasonably common) or for client devices of any type. Therefore we think the above option of upgrading equipment with better internal filters is more viable.

Technical coexistence issues for the 2.3 and 3.4 GHz award
66
Use of 5 GHz instead of 2.4 GHz
A7.287 As noted earlier, Wi-Fi can make use of the 5 GHz band in addition to the 2.4 GHz band, and there are an increasing number of available devices which support the use of 5 GHz. Therefore where interference occurs at 2.4 GHz, in many cases the most viable mitigation would be to move to 5 GHz.
A7.288 This would require both the access point and client device to support 5 GHz which means it would not be possible for many older devices.
A7.289 Propagation loss is higher at 5 GHz (by approximately 6 dB), however this can be offset by the use of MIMO and higher channel bandwidths for 802.11n and ac to give higher throughputs, therefore 5 GHz can be expected to match coverage of 802.11b or g at 2.4 GHz64.
Use of wired networks
A7.290 For large consumer devices such as smart TVs and games consoles, which may not support 5 GHz; have long term replacement cycles; and cannot necessarily be easily moved within the home to mitigate interference, the only acceptable form of mitigation may be to use a wired network to restore connectivity if interference is significant.
A7.291 This could be achieved through either an Ethernet connection - if the device is sufficiently close to the router - or use of power line communications if the device is located in a different room from the router.
Restrictions on LTE
A7.292 Limiting the LTE EIRP may provide some mitigation. However, as this would have an impact on LTE coverage an operator may need to deploy more sites as a result, thus creating more potential sources of interference.
A7.293 This can be seen in the separation distances presented in Table A7.21, where small cells at lower power than macro-cells (45 dBm versus 67 dBm) are still shown to cause interference, albeit at a lower range.
A7.294 It would therefore be difficult to define a meaningful restriction on LTE EIRP which would provide effective mitigation against interference in practice.
A7.295 Filtering the out of band emissions of the LTE signal is unlikely to help as interference is found to be dominated by blocking.
Conclusions
A7.296 In this annex we have quantified the potential risk of interference from LTE in the 2.3 GHz release band into Wi-Fi in the 2.4 GHz band.
A7.297 Through a combination of lab measurements and field trials we have demonstrated that interference is a possibility in certain scenarios. A wide variation in performance is found between different devices. Interference is found to be dominated by
64 The future role of spectrum sharing for mobile and wireless data services - Licensed sharing, Wi-Fi, and dynamic spectrum access, Ofcom, August 2013, paragraphs 3.18 to 3.20: http://stakeholders.ofcom.org.uk/consultations/spectrum-sharing/

Technical coexistence issues for the 2.3 and 3.4 GHz award
67
blocking. Both routers/access points and client devices may be affected by interference.
A7.298 We have undertaken detailed modelling of LTE downlink interference and have calculated that several thousand Wi-Fi networks may be affected in practice. These results are highly sensitive to a range of assumptions, which we believe tend to be pessimistic where uncertainty exists. We note that in practice impacts could be either higher or lower, but nonetheless believe these results are suitable for use in our policy assessment.
A7.299 A range of mitigations are possible. Moving devices is the most practical and effective mitigation. Alternatively, upgrade of affected devices or switching to 5 GHz are possible options.
A7.300 Our policy assessment based on this analysis is outlined in detail in section 6.

Technical coexistence issues for the 2.3 and 3.4 GHz award
68
Annex 8
8 Analysis of Licence Exempt (LE) uses
A8.1 This annex sets out in more detail the analysis summarised in section 7 of the consultation document. This section considered the potential for interference from LTE-TDD in the 2.3 GHz band to licence exempt (LE) users of the 2.4 GHz spectrum other than Wi-Fi (which was addressed in the previous annex).
A8.2 As with Wi-Fi, our assessment is that the impact is limited and that it would be disproportionate to apply regulatory-led interventions in order to protect licence exempt devices. This is because we consider the level of potentially harmful interference to be low and because there are suitable mitigations available in most circumstances.
A8.3 This annex presents the technical methodology and analysis that has led us to this proposed policy position.
Introduction
A8.4 The 2.4 GHz LE band is heavily used for applications using a number of different technologies on a non-interference, non-protection basis.
A8.5 In addition to Wi-Fi, common technologies in this band include Bluetooth, ZigBee and other proprietary protocols for a range of different applications under the following categories:
• Wideband data transmission (entire band);
• Non-specific SRD (entire band);
• Wireless video cameras (non-broadcasting) (entire band);
• Wireless audio applications (entire band).
A8.6 In order to assess the potential risk of interference, we have modelled interference scenarios informed by standards and measurements of example devices. Our analysis covers Wi-Fi, Bluetooth and ZigBee plus some less widespread uses such as video senders (including baby monitors) and radio microphones. Some of these devices use Wi-Fi technology. The results for all of these are presented in this annex, with the exception of Wi-Fi which was addressed in annex 7.
A8.7 Devices in the LE band may be vulnerable to interference from LTE signals for two main reasons:
• Historical Uses: The 2.3 GHz award band is currently used by the military and this use is typically geographically separate from much of the LE band use and operates sporadically. This change of interference environment may mean that receivers previously designed to be “just good enough” may not be able to tolerate new high power wideband signals in adjacent channels.

Technical coexistence issues for the 2.3 and 3.4 GHz award
69
• Mass Market Devices: One of the great successes of the 2.4 GHz LE band is the low cost of entry and the proliferation of low cost devices. In order to achieve this, low cost receivers are often built only to the performance level required to meet the relevant standards - and have not traditionally considered a high power wideband neighbour (61dBm / 5MHz LTE signals compared with typical 20dBm LE devices). Thus receivers may not have the front-end filters necessary to protect them from these high power wideband signals in adjacent bands.
A8.8 This annex is structured using the following headings:
• Call for Inputs responses: We received nine responses to our Call for Inputs. None of these raised major concerns about standards and/or devices in widespread consumer use of which we were previously unaware.
• System Level Modelling: These paragraphs set out the overarching approach we took to assessing the potential impact of interference from 2.3 GHz LTE signals on systems operating in the 2.4 GHz LE band. Measurements, modelling and analysis are described with the aim of achieving a consistent methodology (where appropriate) across the large range of devices which use this band.
• Bluetooth: Bluetooth devices include both regular Bluetooth and Bluetooth Low Energy (or Bluetooth ‘Smart’) devices. Theoretical analysis based on the minimum out of band rejection set in the relevant standards is followed by further analysis based on measurements of a selection of real devices. This analysis assesses the risk of interference and the minimum separation distance required to prevent such interference between LTE and Bluetooth devices in a range of typical operating scenarios.
• ZigBee: ZigBee devices are low power devices intended for low data rate machine-to-machine (m2m) communications. Theoretical analysis based on the IEEE 802.15.4 standard and device measurements is used to assess the minimum separation distances required to prevent interference. We have worked with the Department for Energy and Climate Change (DECC) to help them understand any impact on the Government’s smart meter deployment plans.
• Video Devices: Video devices include video senders for re-transmitting TV signals within a home; door entry; and baby monitors. We investigate both analogue and digital devices, assessing the difference between the impact of interference in each case as well as the possible minimum separation distances required to prevent the onset of degradation.
• Audio Devices: We measured some radio microphones in different price ranges to assess their susceptibility to interference. Theoretical analysis and indoor and outdoor scenarios using measured devices were examined to assess the impact.
• Short Range Devices: SRDs represent a huge diversity of devices and we were unable to identify any particularly common equipment types. These paragraphs therefore assess the likelihood and impact of interference from a purely theoretical standpoint using ETSI EN 300 440 as a starting point.
• Summary of Assumptions: inevitably in modelling of this nature we have made a number of assumptions. We have attempted to make these as representative as possible where we can. We describe our approach, highlighting where they are a central case and where they may lead to an over or under-estimation of the likely
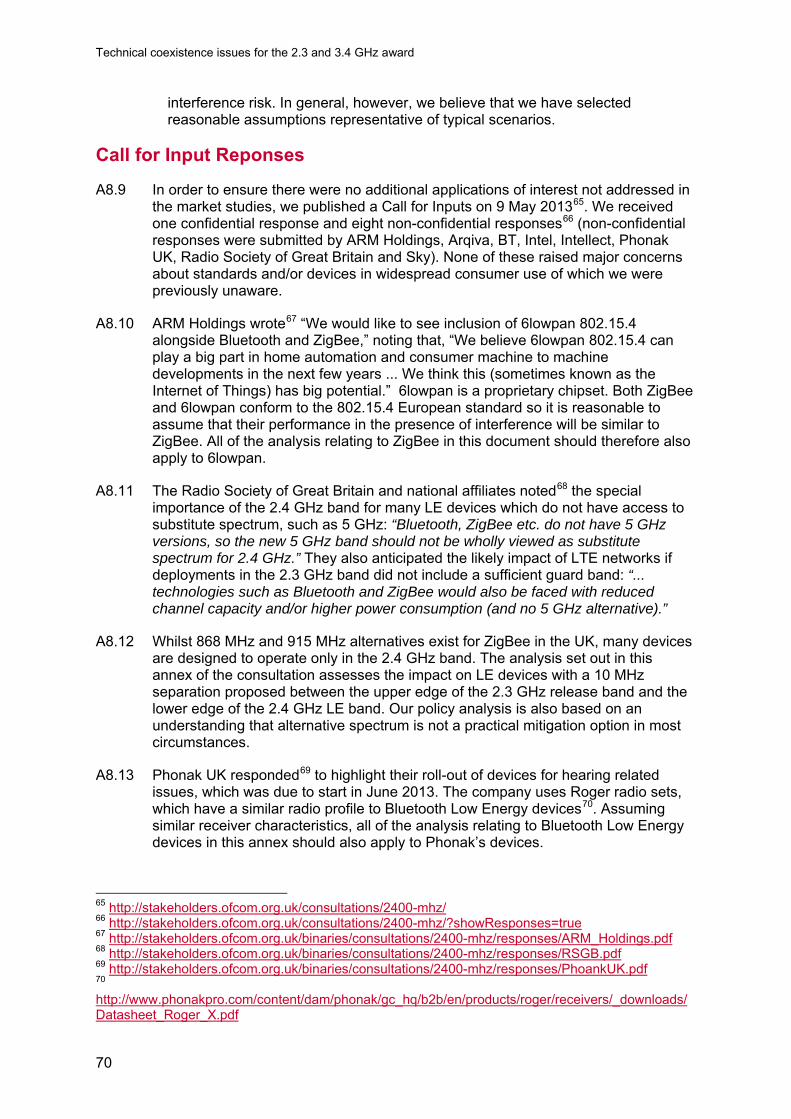
Technical coexistence issues for the 2.3 and 3.4 GHz award
70
interference risk. In general, however, we believe that we have selected reasonable assumptions representative of typical scenarios.
Call for Input Reponses
A8.9 In order to ensure there were no additional applications of interest not addressed in the market studies, we published a Call for Inputs on 9 May 201365. We received one confidential response and eight non-confidential responses66 (non-confidential responses were submitted by ARM Holdings, Arqiva, BT, Intel, Intellect, Phonak UK, Radio Society of Great Britain and Sky). None of these raised major concerns about standards and/or devices in widespread consumer use of which we were previously unaware.
A8.10 ARM Holdings wrote67 “We would like to see inclusion of 6lowpan 802.15.4 alongside Bluetooth and ZigBee,” noting that, “We believe 6lowpan 802.15.4 can play a big part in home automation and consumer machine to machine developments in the next few years ... We think this (sometimes known as the Internet of Things) has big potential.” 6lowpan is a proprietary chipset. Both ZigBee and 6lowpan conform to the 802.15.4 European standard so it is reasonable to assume that their performance in the presence of interference will be similar to ZigBee. All of the analysis relating to ZigBee in this document should therefore also apply to 6lowpan.
A8.11 The Radio Society of Great Britain and national affiliates noted68 the special importance of the 2.4 GHz band for many LE devices which do not have access to substitute spectrum, such as 5 GHz: “Bluetooth, ZigBee etc. do not have 5 GHz versions, so the new 5 GHz band should not be wholly viewed as substitute spectrum for 2.4 GHz.” They also anticipated the likely impact of LTE networks if deployments in the 2.3 GHz band did not include a sufficient guard band: “... technologies such as Bluetooth and ZigBee would also be faced with reduced channel capacity and/or higher power consumption (and no 5 GHz alternative).”
A8.12 Whilst 868 MHz and 915 MHz alternatives exist for ZigBee in the UK, many devices are designed to operate only in the 2.4 GHz band. The analysis set out in this annex of the consultation assesses the impact on LE devices with a 10 MHz separation proposed between the upper edge of the 2.3 GHz release band and the lower edge of the 2.4 GHz LE band. Our policy analysis is also based on an understanding that alternative spectrum is not a practical mitigation option in most circumstances.
A8.13 Phonak UK responded69 to highlight their roll-out of devices for hearing related issues, which was due to start in June 2013. The company uses Roger radio sets, which have a similar radio profile to Bluetooth Low Energy devices70. Assuming similar receiver characteristics, all of the analysis relating to Bluetooth Low Energy devices in this annex should also apply to Phonak’s devices.
65 http://stakeholders.ofcom.org.uk/consultations/2400-mhz/ 66 http://stakeholders.ofcom.org.uk/consultations/2400-mhz/?showResponses=true 67 http://stakeholders.ofcom.org.uk/binaries/consultations/2400-mhz/responses/ARM_Holdings.pdf 68 http://stakeholders.ofcom.org.uk/binaries/consultations/2400-mhz/responses/RSGB.pdf 69 http://stakeholders.ofcom.org.uk/binaries/consultations/2400-mhz/responses/PhoankUK.pdf 70 http://www.phonakpro.com/content/dam/phonak/gc_hq/b2b/en/products/roger/receivers/_downloads/Datasheet_Roger_X.pdf
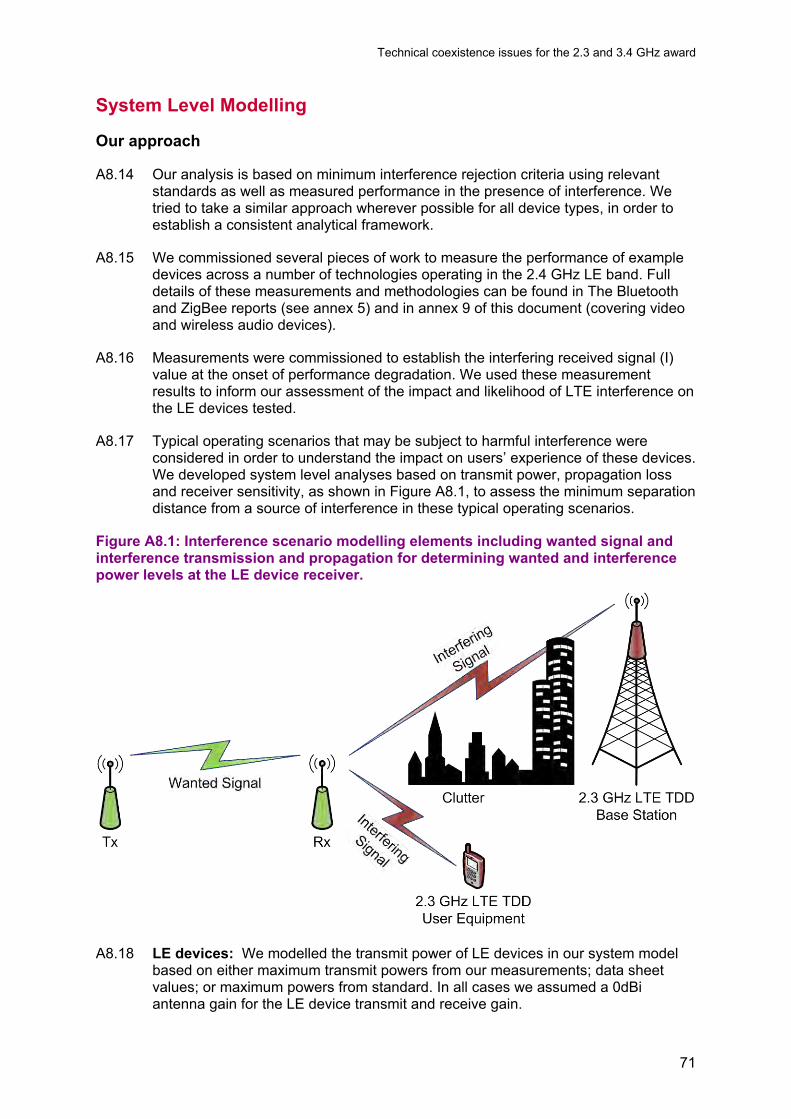
Technical coexistence issues for the 2.3 and 3.4 GHz award
71
System Level Modelling
Our approach
A8.14 Our analysis is based on minimum interference rejection criteria using relevant standards as well as measured performance in the presence of interference. We tried to take a similar approach wherever possible for all device types, in order to establish a consistent analytical framework.
A8.15 We commissioned several pieces of work to measure the performance of example devices across a number of technologies operating in the 2.4 GHz LE band. Full details of these measurements and methodologies can be found in The Bluetooth and ZigBee reports (see annex 5) and in annex 9 of this document (covering video and wireless audio devices).
A8.16 Measurements were commissioned to establish the interfering received signal (I) value at the onset of performance degradation. We used these measurement results to inform our assessment of the impact and likelihood of LTE interference on the LE devices tested.
A8.17 Typical operating scenarios that may be subject to harmful interference were considered in order to understand the impact on users’ experience of these devices. We developed system level analyses based on transmit power, propagation loss and receiver sensitivity, as shown in Figure A8.1, to assess the minimum separation distance from a source of interference in these typical operating scenarios.
Figure A8.1: Interference scenario modelling elements including wanted signal and interference transmission and propagation for determining wanted and interference power levels at the LE device receiver.
A8.18 LE devices: We modelled the transmit power of LE devices in our system model based on either maximum transmit powers from our measurements; data sheet values; or maximum powers from standard. In all cases we assumed a 0dBi antenna gain for the LE device transmit and receive gain.

Technical coexistence issues for the 2.3 and 3.4 GHz award
72
A8.19 LTE devices: For high power macro cells, we have assumed EIRP levels consistent with our proposed licence conditions (see section 13) or lower power micro cell assumptions described in annex 7.
A8.20 Previous work by Ofcom on LTE device usage (in an 800 MHz LTE network) has shown that transmit power is considerably lower than 23 dBm for the majority of the time71. Median power varied with resource block usage and varied from -5dBm to 13dBm depending on the usage. This view that full power is unlikely is supported by a recent study of LTE 800 MHz LTE networks in Australia72. This report suggests that the mean power of user equipment +2 dBm in a rural cell and -9 dBm in an urban cell.
A8.21 Taking these studies into account along with the frequency differences, we have therefore considered that the user equipment power will typically be +3 dBm EIRP (20dB less than the 3gpp maximum of 23dBm). In some cases, we have also considered a higher level of +13 dBm EIRP which may be more relevant when the device is very close to the cell edge, in areas with limited coverage or deep indoors.
A8.22 Propagation Modelling: In order to undertake our analysis, we have used propagation models to predict the likely wanted and unwanted signal levels in particular locations. Most of the devices using in the 2.4 GHz LE band are short range (<40m) for which it is reasonable to assume that radio links will be line-of-sight, and we have assumed will be attenuated by simple free space path loss. Where link distances are longer our scenarios which consider reduction in the wanted signal could be used.
A8.23 Similarly where our analysis focuses on LTE user equipment (mobile devices), we consider that these are also likely to be used within a short distance (<40m) of devices using the 2.4 GHz LE band and have used similar assumptions73. This may over-estimate the interference because LTE devices may not have line-of-sight of the victim device and may, for example, be in a pocket or bag which will typically attenuate signals further.
A8.24 2.4 GHz LE devices may be affected by LTE base stations over both long and short ranges. We have therefore used the SEAMCAT implementation of the suburban extended Hata model74 to model these paths. Consistent with our approach to Wi-Fi (annex 7), we have also considered the effects of the vertical LTE-TDD base station antenna pattern in our scenarios using 3GPP TR 36.81475
A8.25 Combining the suburban extended Hata model with the vertical pattern from a 20m height base station antenna gives a total path loss as a function of the distance between the LTE base station transmitter (interferer) and the victim receiver (LE
71 Figure 21 of “LTE User Equipment Coexistence with 862 – 870MHz”, Ofcom, 11th September 2012, http://stakeholders.ofcom.org.uk/binaries/consultations/award-800mhz/statement/lte-coexistence.pdf 72 “Studies on the use of the band 790-862 MHz by mobile applications and by primary services”, JTG 5-6, Document 5-6/88N14 73 We have not considered the case where 2.3 GHz LTE and 2.4GHz LE radios are located within the same device as we assume that bespoke engineering by the manufacturer will be included if necessary to stop in-device interference. 74 “SEAMCAT implementation of Extended Hata and Extended Hata SRD models”: http://tractool.seamcat.org/raw-attachment/wiki/Manual/PropagationModels/ExtendedHata/Hata-and-Hata-SRD-implementation_v2.pdf 75 3GPP TR 36.814 V9.0.0, “Evolved Universal Terrestrial Radio Access (E-UTRA); Further advancements for E-UTRA physical layer aspects”, March 2010, Table A.2.1.1-2, http://www.3gpp.org/ftp/specs/html-INFO/36814.htm
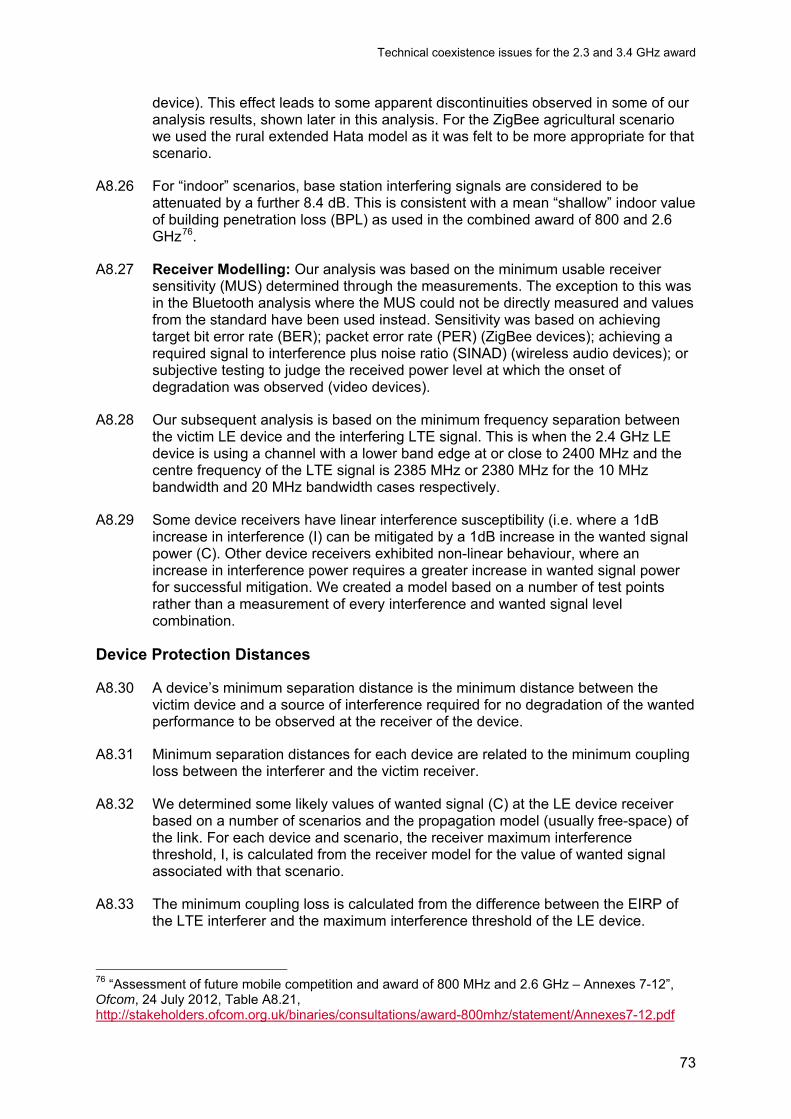
Technical coexistence issues for the 2.3 and 3.4 GHz award
73
device). This effect leads to some apparent discontinuities observed in some of our analysis results, shown later in this analysis. For the ZigBee agricultural scenario we used the rural extended Hata model as it was felt to be more appropriate for that scenario.
A8.26 For “indoor” scenarios, base station interfering signals are considered to be attenuated by a further 8.4 dB. This is consistent with a mean “shallow” indoor value of building penetration loss (BPL) as used in the combined award of 800 and 2.6 GHz76.
A8.27 Receiver Modelling: Our analysis was based on the minimum usable receiver sensitivity (MUS) determined through the measurements. The exception to this was in the Bluetooth analysis where the MUS could not be directly measured and values from the standard have been used instead. Sensitivity was based on achieving target bit error rate (BER); packet error rate (PER) (ZigBee devices); achieving a required signal to interference plus noise ratio (SINAD) (wireless audio devices); or subjective testing to judge the received power level at which the onset of degradation was observed (video devices).
A8.28 Our subsequent analysis is based on the minimum frequency separation between the victim LE device and the interfering LTE signal. This is when the 2.4 GHz LE device is using a channel with a lower band edge at or close to 2400 MHz and the centre frequency of the LTE signal is 2385 MHz or 2380 MHz for the 10 MHz bandwidth and 20 MHz bandwidth cases respectively.
A8.29 Some device receivers have linear interference susceptibility (i.e. where a 1dB increase in interference (I) can be mitigated by a 1dB increase in the wanted signal power (C). Other device receivers exhibited non-linear behaviour, where an increase in interference power requires a greater increase in wanted signal power for successful mitigation. We created a model based on a number of test points rather than a measurement of every interference and wanted signal level combination.
Device Protection Distances
A8.30 A device’s minimum separation distance is the minimum distance between the victim device and a source of interference required for no degradation of the wanted performance to be observed at the receiver of the device.
A8.31 Minimum separation distances for each device are related to the minimum coupling loss between the interferer and the victim receiver.
A8.32 We determined some likely values of wanted signal (C) at the LE device receiver based on a number of scenarios and the propagation model (usually free-space) of the link. For each device and scenario, the receiver maximum interference threshold, I, is calculated from the receiver model for the value of wanted signal associated with that scenario.
A8.33 The minimum coupling loss is calculated from the difference between the EIRP of the LTE interferer and the maximum interference threshold of the LE device.
76 “Assessment of future mobile competition and award of 800 MHz and 2.6 GHz – Annexes 7-12”, Ofcom, 24 July 2012, Table A8.21, http://stakeholders.ofcom.org.uk/binaries/consultations/award-800mhz/statement/Annexes7-12.pdf

Technical coexistence issues for the 2.3 and 3.4 GHz award
74
Bluetooth
Our approach
A8.34 We recognise that Bluetooth is a widespread technology with a multitude of different devices and applications. Typical examples include wireless headsets for mobile phones and car kits. In order to understand the relative performance of these devices we commissioned a study which was undertaken by MAC Ltd. Their report77, includes a market review in order to inform the selection of devices which would be representative of those most commonly in use.
A8.35 We included both regular Bluetooth devices as well as Bluetooth Low Energy (or Bluetooth “Smart”) devices. Bluetooth Low Energy devices are a minority but we expect an increase in popularity as the demand for m2m connectivity grows.
A8.36 Measurements carried out by MAC Ltd assess the susceptibility to interference of a number of different Bluetooth chipsets and thus devices. We modelled a number of usage scenarios in order to reflect typical device usage. For example, Bluetooth devices operate typically over quite short distances (i.e. headset to phone in pocket) but anecdotal evidence suggests these can operate over longer distances (i.e. mobile phones can sometimes maintain a connection to an in-car kit from outside the vehicle). This suggests that devices may not be operating close to their minimum sensitivity all of the time, and that a more typical analysis may be more appropriate.
Theoretical analysis
A8.37 The specification for the Bluetooth protocol is given by the 802.15.178 and Bluetooth79 standards.
A8.38 The low power of Bluetooth devices relative to LTE base stations in particular makes receiver blocking a potential interference mechanism. This occurs when signals from a neighbouring band overload the receiver preventing detection of the wanted signal.
A8.39 The Bluetooth standard requires receiver selectivity to be sufficient to reject carrier wave (CW) signals up to -27 dBm / 3 MHz below 2399 MHz in both basic rate (BR) and enhanced data rate (EDR) modes80 when the wanted signal is 3dB above MUS. This is relaxed to -35 dBm/3 MHz below 2399 MHz for low energy mode81.
77 further details in annex 5 78 “IEEE Standard for Local and metropolitan area networks — Part 15.1: Wireless medium access control (MAC) and physical layer (PHY) specifications for wireless personal area networks (WPANs )”, IEEE Std 802.15.1™-2005, 14th June 2005, http://standards.ieee.org/getieee802/download/802.15.1-2005.pdf 79 “Specification Adopted Documents”, https://www.Bluetooth.org/en-us/specification/adopted-specifications 80 “4.1.3 Out-Of-Band Blocking”, Core System Package [BR/EDR Controller volume], “Specification of the Bluetooth System”, Part A, Vol. 2, Version 4.0, 30 June 2010, https://www.Bluetooth.org/docman/handlers/downloaddoc.ashx?doc_id=229737 81 “4.3 Out-Of-Band Blocking”, Core System Package [Low Energy Controller volume] “Specification of the Bluetooth System”, Part A, Vol. 6, Version 4.0, 30 June 2010, https://www.Bluetooth.org/docman/handlers/downloaddoc.ashx?doc_id=229737

Technical coexistence issues for the 2.3 and 3.4 GHz award
75
A8.40 Our analysis is based on Bluetooth transmit and receive antennas of 0 dBi, as used in the specification82,83and the results in Figure A8.2 show that blocking by LTE signals is unlikely to affect Bluetooth devices as it will be unlikely in practice for separation distances from high power base stations to be below 6 metres (or 45 metres for a low energy device).
Figure A8.2: Minimum Theoretical out of band Blocking Protection Distance for Bluetooth Devices in the presence of LTE signals in line-of-sight and the reference Suburban base station geometry
LTE Max. Tx EIRP
(dBm / 3MHz)
Bluetooth Device Mode of Operation
Bluetooth Max.
Interfering Signal Power
(dBm / 3MHz)
Minimum Coupling Loss (dB)
Minimum Separation
Distance (m)
59 (BS)84 BR & EDR -27 86 6 Low Energy -35 94 45
3 (UE)21 BR & EDR -27 30 <1 Low Energy -35 38 <1
A8.41 This analysis based on the standards may not be a true reflection of the likely impact because: i) wideband LTE signals will have a greater effect blocking effect than narrowband CW signals specified; and ii) devices are expected to outperform the standard by some degree; iii) devices may perform better at the 10 MHz frequency separation point than the 1 MHz frequency separation point specified in the standard.
A8.42 Given these factors, we have considered further the likely impact based on the measurements undertaken by MAC. These are described in the following paragraphs.
Measurement Results
Method
A8.43 The MAC Ltd measurements assessed the impact of the two possible spectrum allocations (shown in Figure A8.3) examining the potential for interference caused by both 10 MHz and 20 MHz LTE-TDD to Bluetooth devices operating in channel 0.
82 “3 Transmitter Characteristics”, Core System Package [BR/EDR Controller volume], “Specification of the Bluetooth System”, Part A, Vol. 2, Version 4.0, 30 June 2010, https://www.Bluetooth.org/docman/handlers/downloaddoc.ashx?doc_id=229737 83 “3 Transmitter Characteristics”, Core System Package [Low Energy Controller volume] “Specification of the Bluetooth System”, Part A, Vol. 6, Version 4.0, 30 June 2010, https://www.Bluetooth.org/docman/handlers/downloaddoc.ashx?doc_id=229737 84 The base station power is equivalent to 67 dBm / 20 MHz as before. UEs may use resource blocks in only a part of the 20 MHz channel so normalisation to 3 MHz is not required.
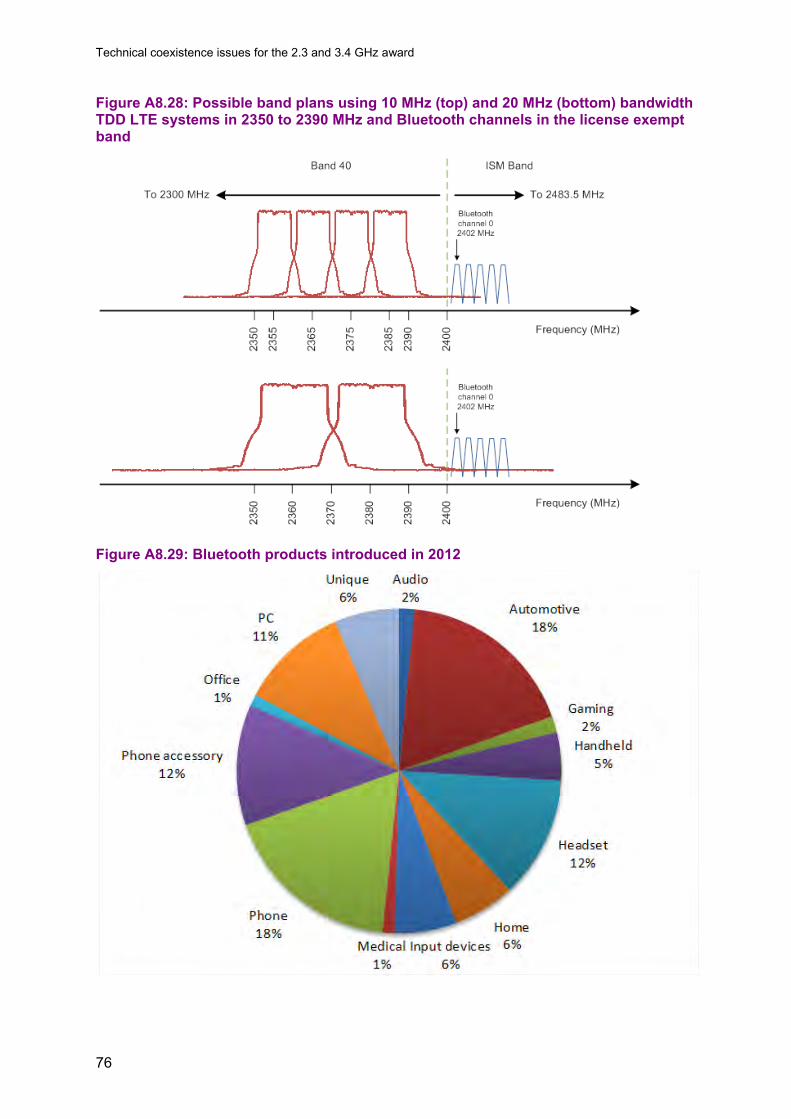
Technical coexistence issues for the 2.3 and 3.4 GHz award
76
Figure A8.28: Possible band plans using 10 MHz (top) and 20 MHz (bottom) bandwidth TDD LTE systems in 2350 to 2390 MHz and Bluetooth channels in the license exempt band
Figure A8.29: Bluetooth products introduced in 2012
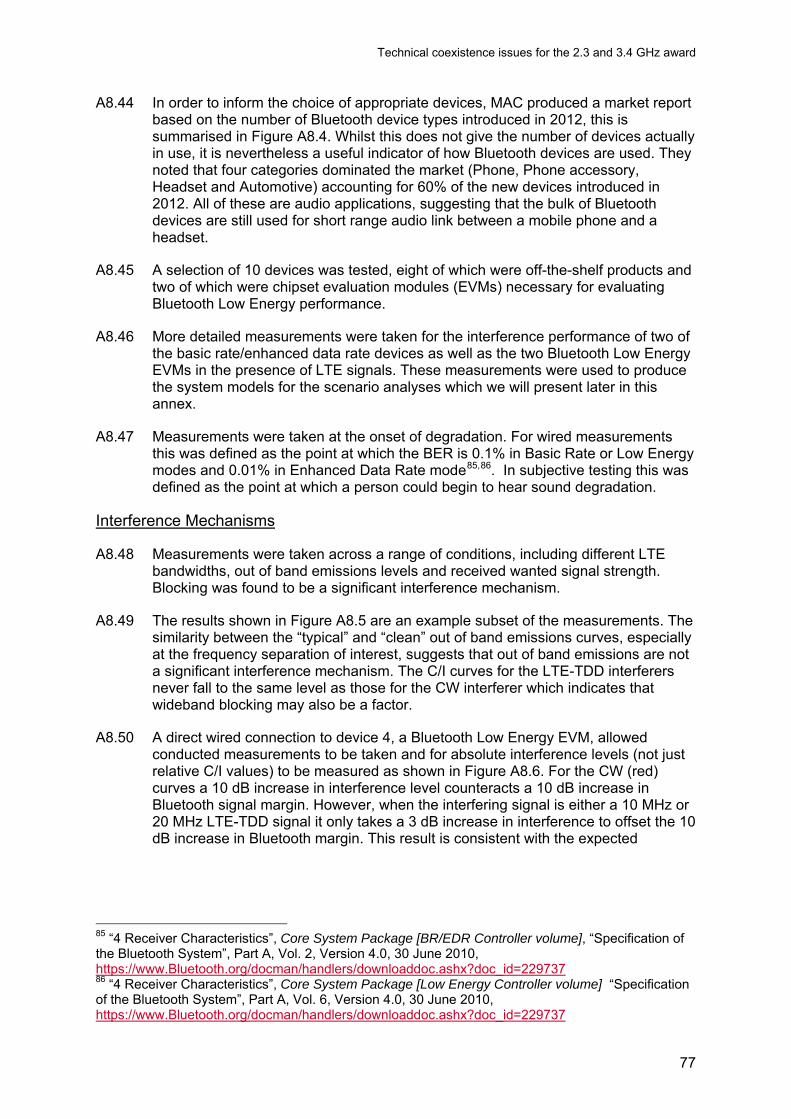
Technical coexistence issues for the 2.3 and 3.4 GHz award
77
A8.44 In order to inform the choice of appropriate devices, MAC produced a market report based on the number of Bluetooth device types introduced in 2012, this is summarised in Figure A8.4. Whilst this does not give the number of devices actually in use, it is nevertheless a useful indicator of how Bluetooth devices are used. They noted that four categories dominated the market (Phone, Phone accessory, Headset and Automotive) accounting for 60% of the new devices introduced in 2012. All of these are audio applications, suggesting that the bulk of Bluetooth devices are still used for short range audio link between a mobile phone and a headset.
A8.45 A selection of 10 devices was tested, eight of which were off-the-shelf products and two of which were chipset evaluation modules (EVMs) necessary for evaluating Bluetooth Low Energy performance.
A8.46 More detailed measurements were taken for the interference performance of two of the basic rate/enhanced data rate devices as well as the two Bluetooth Low Energy EVMs in the presence of LTE signals. These measurements were used to produce the system models for the scenario analyses which we will present later in this annex.
A8.47 Measurements were taken at the onset of degradation. For wired measurements this was defined as the point at which the BER is 0.1% in Basic Rate or Low Energy modes and 0.01% in Enhanced Data Rate mode85,86. In subjective testing this was defined as the point at which a person could begin to hear sound degradation.
Interference Mechanisms
A8.48 Measurements were taken across a range of conditions, including different LTE bandwidths, out of band emissions levels and received wanted signal strength. Blocking was found to be a significant interference mechanism.
A8.49 The results shown in Figure A8.5 are an example subset of the measurements. The similarity between the “typical” and “clean” out of band emissions curves, especially at the frequency separation of interest, suggests that out of band emissions are not a significant interference mechanism. The C/I curves for the LTE-TDD interferers never fall to the same level as those for the CW interferer which indicates that wideband blocking may also be a factor.
A8.50 A direct wired connection to device 4, a Bluetooth Low Energy EVM, allowed conducted measurements to be taken and for absolute interference levels (not just relative C/I values) to be measured as shown in Figure A8.6. For the CW (red) curves a 10 dB increase in interference level counteracts a 10 dB increase in Bluetooth signal margin. However, when the interfering signal is either a 10 MHz or 20 MHz LTE-TDD signal it only takes a 3 dB increase in interference to offset the 10 dB increase in Bluetooth margin. This result is consistent with the expected
85 “4 Receiver Characteristics”, Core System Package [BR/EDR Controller volume], “Specification of the Bluetooth System”, Part A, Vol. 2, Version 4.0, 30 June 2010, https://www.Bluetooth.org/docman/handlers/downloaddoc.ashx?doc_id=229737 86 “4 Receiver Characteristics”, Core System Package [Low Energy Controller volume] “Specification of the Bluetooth System”, Part A, Vol. 6, Version 4.0, 30 June 2010, https://www.Bluetooth.org/docman/handlers/downloaddoc.ashx?doc_id=229737

Technical coexistence issues for the 2.3 and 3.4 GHz award
78
behaviour of wideband blocking, where intermodulation products of the interfering signal appear as co-channel interference to Bluetooth87.
A8.51 In Figure A8.5, CW (red), low out-of-band emissions 10 MHz LTE (green) and typical out of band emissions 10 MHz LTE (blue) are shown. These are recorded when the wanted received signal is 3dB (dotted), 10dB (dashed) and 20dB (solid) above the minimum usable sensitivity (MUS). The black dotted line indicates the minimum frequency separation between the lowest Bluetooth channel and the highest proposed 2.3 GHz LTE channel.
Figure A8.30: Typical measured receiver C/I values at different frequency offsets
87 Third-order products grow by 3 dB for every 1 dB increase in the fundamental signal level and this explains why a 3 dB increase in out-of-band interference can counteract a 10 dB increase in Bluetooth signal margin

Technical coexistence issues for the 2.3 and 3.4 GHz award
79
Figure A8.31: Conducted measurement results for Device #4.
Other Key Findings
A8.52 LTE-TDD transmit-to-receive duty cycle had no noticeable impact on the interference suffered by Bluetooth devices.
A8.53 EDR mode is approximately 5 dB more sensitive to interference than BR, because of its use of higher order modulation, although there is approximately 10 dB variation in the susceptibility to interference across the measured devices.
A8.54 The adaptive frequency hopping mechanism employed by Bluetooth as a way of mitigating interference seemed to be very effective at combating interference on the lower Bluetooth channels.
A8.55 Qualitative listening tests were carried out on three of the test devices. Each headset device was paired with a mobile phone, the devices separated by a few metres and the phone set to stream audio to the headset. Whilst listening to the audio an LTE-TDD interfering signal was introduced through a radiated path in close proximity to the headset. With all three devices, only when the interfering signal level reached very high levels (+15 dBm into the antenna at a few centimetres separation from the headset) could any distortion of the audio be heard. Interference broke the Bluetooth link in only one case.
Summary
A8.56 Current Bluetooth device designs are dominated by headset-type audio applications, but new, Low Energy devices are likely to be important in future m2m communications.
A8.57 Out of band emissions are very unlikely cause interference, but narrowband blocking and receiver intermodulation are more likely to be interference mechanisms. In practical, subjective testing adaptive frequency hopping was found to be very effective in mitigating any interference on the lower Bluetooth channels.

Technical coexistence issues for the 2.3 and 3.4 GHz award
80
Usage Scenario Analysis
A8.58 Bluetooth devices rarely operate close to MUS. At a range of 1 metre the received signal will be around 40dB above MUS whilst at a range of 10 metre the received signal will be around 20dB above MUS. For Bluetooth devices the MUS is defined as the point at which the BER is 0.1% in Basic Rate or Low Energy modes and 0.01% in Enhanced Data Rate mode.
A8.59 Bluetooth devices were assumed to have an EIRP of 10 dBm (BR and EDR) or 4dBm (Low Energy) which was the maximum output power declared according to device datasheets (assuming a 0 dBi antenna gain). This is lower than the maximum 20 dBm or 10dBm EIRP respectively specified in the standard.
Receiver Model
A8.60 Bluetooth receivers were assumed to have the same minimum usable sensitivity (MUS) as in the Bluetooth standard37( -70dBm). Bluetooth Low Energy devices were assumed to have the same MUS as quoted on the device data sheets38 (-88dBm). Uncertain orientation of integrated antennas on the devices and uncertainty introduced by antenna coupling meant that relative values of wanted to interference level (C/I) were measured rather than absolute values. Results for 4 devices in the presence of 20 MHz LTE signals are given in Figure A8.7. The devices were locked to channel 1 (the minimum frequency separation from the 2.3 GHz release band) and frequency hopping was turned off. The results were generally 6 to 8 dB better when the bandwidth of the interfering LTE signal was reduced to 10 MHz except in the case of device #2 for which the two results were the same.
Figure A8.7: Device C/I Measurements
Device Measured C/I for
C = MUS + x dB (dB) x = 3 x = 10 x = 20
#1 BR -37 -37 -37 #1 EDR -31 -32 -32 #2 BR -50 -48 -44 #2 EDR -46.5 -44 -39 #3 LE - -43.8 -41.2 #4 LE - -34.7 -31
Device Minimum Separation Distances
A8.61 Minimum separation distances (as described in the general approach) for Bluetooth devices where the wanted signal link distances are up to 10 metres for a 20 MHz LTE user equipment case are almost all below 1 metre. For typical LTE user equipment power of +3 dBm, most have required separation at or below 0.1 metre. Where the interferer was an outdoor 20 MHz LTE base station BS all devices bar one had negligible separation distances less than 1 metre (our analysis suggests that Device 4 Low Energy might begin to suffer the effects of the onset of interference within 45m of the base station).
A8.62 Devices operating in Basic Rate mode are slightly more robust in the presence of an interfering signal than when they are operating in Enhanced Data Rate mode. The Low Energy devices are also more susceptible to interference.

Technical coexistence issues for the 2.3 and 3.4 GHz award
81
Table A8.8: Bluetooth Scenarios and Protection Distances from LTE transmitters
Blu
etoo
th S
cena
rio
Pro
porti
on o
f tot
al
Blu
etoo
th D
evic
e R
ange
s La
unch
ed in
th
e U
K in
201
2 (%
)
Con
trolle
r M
ode
Typi
cal L
ink
Dis
t. (m
)
C re
lativ
e to
MU
S
(dB
)
Inte
rfere
nce
Pro
paga
tion
Mod
el
20 M
Hz
BS
Min
. S
ep. D
ist.
(m)
20 M
Hz
UE
Min
. S
ep. D
ist.
(m)
Car 14 BR/EDR 2 34 Outdoor <1 <1 Car Kit 12 BR/EDR 2 34 Outdoor <1 <1 Game Controller 0 BR/EDR 5 26 Indoor <1 <1 Gaming Device 1 BR/EDR 10 20 Indoor <1 <1 GPS 0 BR/EDR 2 34 Outdoor <1 <1 Headset 3 BR/EDR 1 40 Outdoor <1 <1 Helmet 0 BR/EDR 1 40 Outdoor <1 <1 Home Entertainment 4 BR/EDR 5 26 Indoor <1 <1 Industrial 0 BR/EDR 10 20 Indoor <1 <1 Keyboard 6 BR/EDR 1 40 Outdoor <1 <1 Landline Phone 0 BR/EDR 10 20 Indoor <1 <1 Media Viewer 0 BR/EDR 10 20 Indoor <1 <1 Medical Monitoring 1 LE 2 46 Indoor <1 <1 Mobile Phone 18 BR/EDR 2 34 Outdoor <1 <1 Mouse 1 LE 1 52 Outdoor <1 <1 MP3 Player 0 BR/EDR 1 40 Outdoor <1 <1 Other 7 BR/EDR 10 20 Outdoor <1 <1 PDA 0 BR/EDR 1 40 Outdoor <1 <1 Personal Computer 10 BR/EDR 1 40 Indoor <1 <1 Printer 0 BR/EDR 1 40 Indoor <1 <1 Remote Control 0 LE 5 38 Indoor <1 <1 Garage Door 0 LE 5 38 Outdoor 30 <1 Scanner 0 LE 1 52 Indoor <1 <1 Sensor 0 LE 10 32 Outdoor 45 <1 Speakerphone 2 BR/EDR 10 20 Indoor <1 <1 Sports and Fitness 0 LE 2 46 Outdoor <1 <1 Stereo Adapter 1 BR/EDR 1 40 Outdoor <1 <1 Stereo Headphone 5 BR/EDR 1 40 Outdoor <1 <1 Stereo Speaker 11 BR/EDR 10 20 Indoor <1 <1 Television 0 BR/EDR 10 20 Indoor <1 <1 USB Dongle 0 BR/EDR 1 40 Outdoor <1 <1 Wearable Device 0 LE 1 52 Outdoor <1 <1 Access Point - Indoor 0 BR/EDR 10 20 Indoor <1 <1 Access Point - Outdoor 0 BR/EDR 10 20 Outdoor <1 <1 Camera 0 BR/EDR 10 20 Outdoor <1 <1
A8.63 A number of Bluetooth scenarios are given in Figure A8.8 based on reasonable assumptions about the typical link distance. The scenarios listed are informed by the Bluetooth Report which examines the number of Bluetooth device ranges launched in the UK in 2012. The analysis is based on Device #4 for the low Energy

Technical coexistence issues for the 2.3 and 3.4 GHz award
82
scenarios (informed by the Bluetooth Smart device list88) and Device #1 for the BR/EDR scenarios, as these represent the least robust device from each controller mode in our limited measurement set.
A8.64 The vast majority of scenarios were robust to interference, with no degradation in performance expected when more than one metre away from an LTE base station or LTE user equipment.
A8.65 The exceptions to this were Bluetooth Low Energy devices operating at longer ranges or outdoors. Both the “Garage Door” and “Sensor” scenarios could experience interference when within about 30 to 45 metres of an LTE base station.
A8.66 In the unlikely event that interference did occur to these Bluetooth devices, there is some mitigation available. Shortening the Bluetooth link will resolve any interference in all cases where this is practical. In the case of the garage door remote, interference ceases to be of concern when the link range is reduced from 10 metres to 2 metres, and in most scenarios less reduction in link range will be required. In some cases, providing extra path loss between the Bluetooth device and the LTE base station will also improve the situation. This may require locating outdoor sensors carefully which we note may not always be possible. In a scenario where a Bluetooth device is suffering wideband blocking, channels at the top of the Bluetooth frequency range may suffer from slightly less interference. This means that frequency hopping may automatically select these channels to maintain the communications link.
A8.67 Bluetooth sensors are likely to be used for low data-rate non-time-critical applications for which a combination of low transmission duty cycle and retransmissions may successfully transmit the data if the source of interference is non-persistent.
Reduced Wanted Signal Strength Scenarios
A8.68 Whilst in our main analysis we have considered the effects at typical operating distances for the Bluetooth link, we recognise that in certain circumstances that the Bluetooth link may have a lower received signal due to additional clutter in the path, longer paths, body loss or lower transmit powers. We have therefore considered the sensitivity of the results to these assumptions in the following paragraphs.
A8.69 Susceptibility of the Bluetooth BR/EDR devices to interference for difference levels of wanted signal strength is considered in Figure A8.9. Our original assumptions around operating signal strengths are shown. If lower values were chosen on the x-axis, the separation distances can be seen to increase. Unless Bluetooth devices are operated at very low signal strengths, there is little effect on susceptibility to interference.
88 “Bluetooth Smart products”, http://www.Bluetooth.com/Pages/Bluetooth-Smart-Devices-List.aspx#Smart

Technical coexistence issues for the 2.3 and 3.4 GHz award
83
Figure A8.9: Minimum separation distances from a 20 MHz LTE base station for two Bluetooth BR/EDR devices in an outdoor, suburban environment plotted against the strength of the wanted signal.
A8.70 Bluetooth Low Energy devices are considered in Figure A8.10. As these devices
are more susceptible to interference than Bluetooth BR/EDR devices, they require a greater minimum separation distance from LTE base stations (up to a few hundred metres) when operating at their lowest signal levels. Again, this is not representative of typical scenarios which have higher signal strengths and are indicated on the graph.
0
20
40
60
80
100
120
140
160
180
200
-70 -65 -60 -55 -50 -45 -40 -35 -30
Min
imum
Sep
arat
ion
Dis
tanc
e (m
)
Wanted Received Signal Strength (dBm)
Dev1 BR
Dev1 EDR
Dev2 BR
Dev2 EDR
Headset, Helmet, Keyboard, MP3 Player, PDA, Stereo Adapter, Stereo Headphone, USB dongle
Car, Car Kit, GPS, Mobile Phone
Access Point - Outdoor, Camera

Technical coexistence issues for the 2.3 and 3.4 GHz award
84
Figure A8.10: Minimum separation distances from a 20 MHz LTE base station for two Bluetooth Low Energy devices in an outdoor, suburban environment plotted against the strength of the wanted signal.
Summary
A8.71 Bluetooth devices are most commonly used over device separation distances of less than 10 metres, but the distance may be even shorter than this (i.e. headset to phone or pocket).
A8.72 The analysis of Bluetooth devices undertaken here shows that new LTE services are unlikely to cause harmful interference to Bluetooth devices. This is supported by both theoretical analysis and the measurements and subsequent analysis that we have undertaken.
A8.73 In certain circumstances when in close proximity, LTE base stations may interfere with Bluetooth Low Energy devices when the Bluetooth received signal strength is low (this is most likely with sensors and garage door remote control scenarios only. Neither of these are common uses).
A8.74 Interference to the garage door or remote control devices can be mitigated by shortening the Bluetooth link. Interference to the sensor device may require careful placing of the sensor in relation to an LTE base station, which may not always be practical.
A8.75 LTE mobile devices are unlikely to interfere with Bluetooth devices with minimum separation distances of much less than 1 metre being typical. If any interference were to occur in practice, a small increase in separation between the LE device and the LTE device would resolve this.
0
50
100
150
200
250
300
350
-90 -80 -70 -60 -50 -40 -30
Min
imum
Sep
arat
ion
Dis
tanc
e (m
)
Wanted Received Signal Strength (dBm)
Dev3 LE
Dev4 LE
Mouse, Wearable Device
Garage Door
Sensor
Sports and Fitness

Technical coexistence issues for the 2.3 and 3.4 GHz award
85
A8.76 In cases where LTE and Bluetooth are integrated into the same device it is expected that manufacturers will take the necessary engineering precautions to prevent interference.
ZigBee
Summary
A8.77 ZigBee is promoted as an important technology in the “internet of things”, intended to provide the final link in networks. Although ZigBee devices are not currently widely used, a number of pilot schemes and proposals exist which use the devices, and we expect use is likely to increase.
A8.78 ZigBee devices can operate over longer distances than Bluetooth devices and often transmit at lower powers in order to preserve battery life - which can be expected to stretch to several years in some cases. Typical applications include sensor and control systems. ZigBee transmissions are characteristically low throughput, low power, long distance and with very low transmission duty cycles.
A8.79 Such applications include smart meters - with a ZigBee communications hub used to collect data from gas and electricity meters and update an in-home display letting consumers know their energy usage.
A8.80 To compensate for the range and low transmit powers, ZigBee devices generally have very low sensitivity levels, better than -85dBm. Some devices may also have a bulk front-end filter to prevent receiver blocking by high-power signals in adjacent channels.
A8.81 The ZigBee protocol conforms to the 802.15.4 standard. 16 channels of 5 MHz each are specified in the 2.4 GHz band with a maximum in-band power of 20 dBm EIRP, though typical devices transmit 10 to 20 dB lower than this level in order to be more power efficient. The data rate is 250 Kbits/s encoded using direct-sequence spread spectrum (DSSS) in order to improve tolerance to interference. A carrier sense, multiple access - collision avoidance (CSMA-CA) mode is used to ensure that the channel is clear before attempting to transmit.
Our approach
A8.82 Measurements carried out by MAC Ltd are used to assess the susceptibility of a wide range of ZigBee devices to interference. The full results are presented in the ZigBee report89. All of the tested devices were development boards with the exception of Device #5 which had a USB-stick form factor.
A8.83 Analysis of these measurements is used to provide ranges and estimated link budgets. Finally, protection distances can be estimated in different scenarios to assess the impact on different users.
89 see annex 5 for link etc.

Technical coexistence issues for the 2.3 and 3.4 GHz award
86
Theoretical analysis
A8.84 The 802.15.4 standard for ZigBee gives the maximum sensitivity as -85dBm and is the minimum receiver power required for an average PER ≤1%90.
A8.85 The standard describes the required selectivity to reject out of channel but in band signals - but there is no requirement to reject out of band signals. For in band signals, the second adjacent channel rejection (ACR2) is 30 dB when the wanted signal is 3 dB above the MUS27 91.
A8.86 Analysis showed that out of band blocking by LTE poses a potential risk to ZigBee devices which conform to the minimum requirements set out in the standard. Base stations in a typical suburban environment may interfere with ZigBee devices within a 300 metre radius. LTE user equipment may interfere with ZigBee devices within the same room, less than 5 metres apart.
A8.87 This analysis is likely to be pessimistic because real devices are expected to attenuate out of band signals with some antenna and matching network discrimination at least. We have therefore considered further analysis using measurements of some example devices.
Measurement Results
Method
A8.88 We commissioned MAC Ltd to undertake a measurement study to establish if ZigBee devices are likely to be adversely affected by the presence of LTE-TDD signals from base stations or user equipment in the 2.3 GHz LTE band (the band plan is similar to the Bluetooth one shown in Figure A8.3). These measurements assessed the potential for interference by both 10 MHz and 20 MHz LTE-TDD to ZigBee devices operating on channel 1192, the lowest ZigBee channel in the 2.4 GHz license exempt band. Further protocol tests were carried out to examine how the ZigBee frequency selection and direct sequence spread spectrum (DSSS) protocols might help to mitigate the effects of any interference.
A8.89 As there is no mandatory test mode for objective radio link measurements it was necessary to use a number of development boards from leading chipset manufacturers instead of off-the-shelf devices. Chipset choice was informed by the 60 ZigBee Compliant Platforms listed by the ZigBee Alliance93.
A8.90 Five devices were tested, four of which were development kits and one of which was a USB “stick”. The performance of a ZigBee-based home automation systemwas also tested to understand the impact of introducing LTE-TDD interference to a typical off-the-shelf system.
90 “10.3 O-QPSK PHY RF requirements”, “IEEE Standard for Local and metropolitan area networks — Part 15.4: Low-Rate Wireless Personal Area Networks (LR-WPANs)”, IEEE Std 802.15.4™-2011, 16th June 2011, http://standards.ieee.org/getieee802/download/802.15.4-2011.pdf 91 ACR2 is more appropriate than the adjacent channel due to the 10 MHz gap between the upper edge of the 2.3 GHz release band and the lower edge of the first Zigbee channel. 92 Channel numbers 1 to 10 are reserved for ZigBee use in lower frequency bands 93 “Manufacturer Specific Certified Products”, ZigBee Alliance, checked 7th October 2013, http://www.zigbee.org/Products/ManufacturerSpecific.aspx

Technical coexistence issues for the 2.3 and 3.4 GHz award
87
A8.91 The minimum usable sensitivity (MUS) of the devices was measured by increasing the attenuation in the ZigBee signal path until the PER was reduced to the required 1% level.
A8.92 The ZigBee signal strength was then raised by 10 or 20 dB above the MUS and an interfering signal was introduced at the selected frequency offset and its power level increased until the PER was reduced to the 1% level. The C/I ratio was then measured at this point, defined as the onset of interference. This was repeated for a range of frequency offsets and interfering signal types.
Interference Mechanism
A8.93 Measurements were made for both LTE uplink and downlink signals. The uplink used a lower transmit duty cycle but higher out of band emissions whilst the downlink used a higher duty cycle but lower out of band emissions. No great differences between the interference caused by LTE uplink signal or downlink signals were observed suggesting that blocking effects are much more likely to be an interference mechanism than out of band emissions.
A8.94 The measurement results showed a variation in blocking response between the devices with both non-linear and linear responses observed. These can be seen in the MAC study of LTE/ZigBee coexistence in Figures A3 and A4 respectively.
A8.95 In the linear case, Figure A4 in the MAC ZigBee Report, the target C/I is unchanged when the ZigBee signal uplift level is changed from 10 dB to 20 dB above MUS. This suggests that the receiver response remains linear in the presence of high levels of interference and therefore intermodulation products are not the dominant mechanism of desensitisation.
A8.96 In the non-linear case, Figure A3 in the MAC ZigBee Report, the C/I value varies with the uplift of the wanted signal and this effect becoming more pronounced the wider the bandwidth of the interfering signal..
A8.97 Depending on the device measured, narrowband blocking or receiver intermodulation may be the primary mechanism by which LTE signals interfere with ZigBee receivers. Both of these effects are caused by low receiver selectivity and may be mitigated in future by improved filtering and receiver design.
Protocol testing
A8.98 MAC Ltd also examined packet reliability mechanisms such as packet acknowledgement and retransmissions which were enabled along with the carrier sense multiple access with collision avoidance (CSMA-CA) channel access mechanism. The ZigBee device tested could cope well with high levels of interference, but the net data rate dropped when the interfering signal strength was maintained and the wanted signal strength was reduced by only a few dB, at which point the wanted ZigBee link failed (as seen in A8.10).

Technical coexistence issues for the 2.3 and 3.4 GHz award
88
Figure A8.10: Net data rate as a function of C/I with frame retransmissions enabled in the presence of co-channel 10 MHz downlink TDD LTE interference. Also shown is the PER with retransmissions disabled.
A8.99 A ZigBee-based home automation system was also tested for interference in the presence of signals from LTE user equipment. The home automation system included a central control panel, a mains relay and a remote control. LTE interference transmitted at the maximum power permitted for user equipment had no measurable impact on the operation of these devices.
A8.100 MAC Ltd concluded that LTE-TDD equipment was unlikely to cause significant disruption to ZigBee devices in typical applications which are low data rate, non-real-time and with a significant link margin (>20 dB). The maximum throughput of a ZigBee link could be adversely affected but protocol mechanisms such as frame re-transmission and CSMA-CA made ZigBee devices a little more robust and unlikely to suffer complete link failure. System performance could be adversely affected, however, if ZigBee devices are used in particularly close proximity to an LTE base station.
Usage Scenario Analysis
A8.101 We have used the measurement results coupled with typical link distances for a number of scenarios to determine the wanted signal strength and the tolerated interfering signal strength.
A8.102 ZigBee devices can operate close to MUS, with re-transmission intended to mitigate interference as well as escalation to higher transmit powers. With a maximum EIRP of around 4dBm and a specified sensitivity of -85dBm, a 10 metres device

Technical coexistence issues for the 2.3 and 3.4 GHz award
89
separation will result in received signal strength 44dB above MUS, falling to 24dB above MUS at a device separation of 100 metres.
A8.103 Device #5 is a USB stick rather than a development board and so Device #4 was used as the transmitter for those measurements. Whilst having different form factors, both devices used the same chipset which made this a suitable pairing. All devices had between 3 and 5 dBm EIRP.
Propagation Model
A8.104 Three LTE base station interference scenarios are considered: outdoor, indoor and open. For the “open” scenario, the interfering signal is attenuated using the Cost231 open extended Hata model and is implemented as described in the SEAMCAT implementation (see footnote 57 above).
A8.105 The receiver sensitivity was measured for each device at the point where the PER was 1% for 20-byte packets. These values are recorded in Figure A8.11.
A8.106 As Device #5 is a USB-stick device, it was not possible to directly acquire a sensitivity measurement and so Device #5 is assumed to have the same sensitivity as Device #4 which uses to the same chipset.
A8.107 Measured values are shown for each device in Figure A8.11 with interference from a 20 MHz LTE signal. Devices could typically tolerate 5 to 6 dB more interference power from a 10 MHz LTE signal was applied.
Table A8.11: ZigBee Device Sensitivity and C/I Measurements
Device Measured Sensitivity
(dBm)
Measured C/I for C = MUS + x dB
(dB) x = 10 x = 20
#1 -92 -52.1 -46.5 #2 -95 -48.9 -47.6 #3 -91 - -46.0 #4 -100 - -46.7
#5 -100 (assumed) - -39.6
Device Minimum Separation Distances
A8.108 ZigBee device protection distances are calculated as already described in the general approach.
A8.109 The measured ZigBee devices were very robust in the presence of LTE device interferers. At short ranges, <40m, degradation in the signal may only occur when a 20 MHz LTE device moves within 1 metre of the ZigBee receiver. The measured ZigBee devices are fairly robust in the presence of LTE base station interferers, especially at short range. At longer ranges interference becomes more of a risk, especially as the receiver emerges into the boresight of the LTE antenna.
A8.110 Device #5 is the only non-development kit piece of equipment, having a USB stick form factor, and fairs the worst of all the devices in all scenarios. We are unclear as
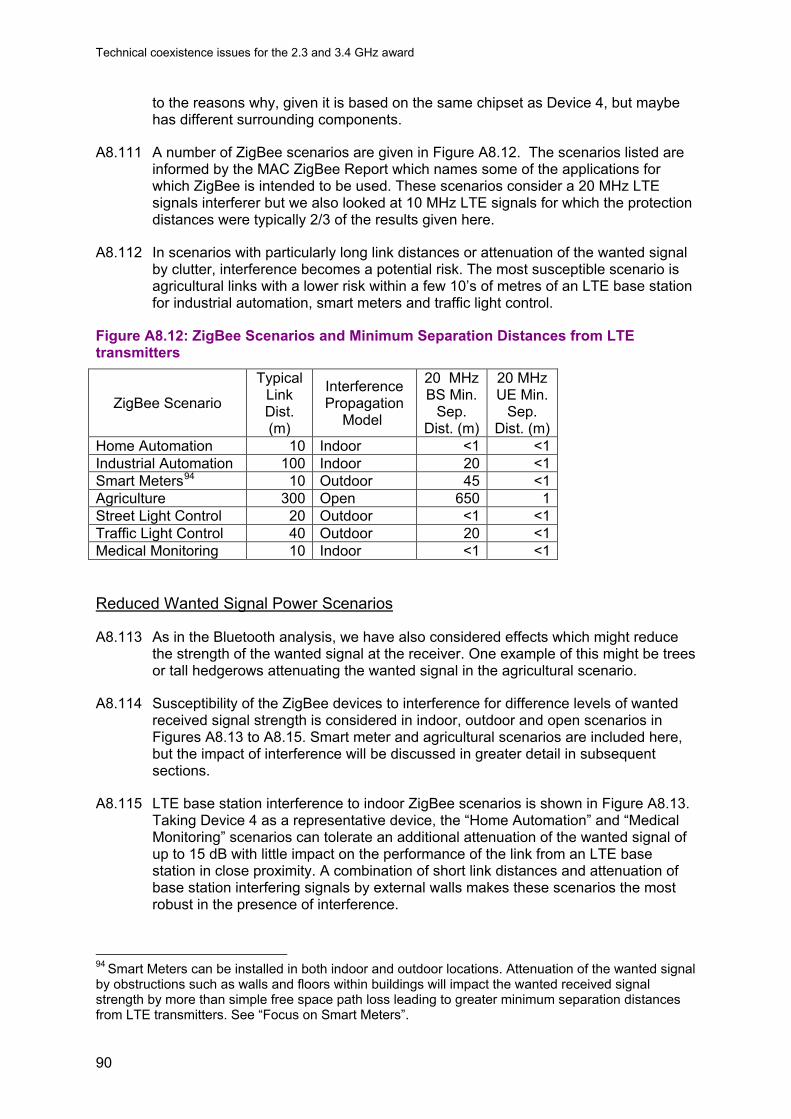
Technical coexistence issues for the 2.3 and 3.4 GHz award
90
to the reasons why, given it is based on the same chipset as Device 4, but maybe has different surrounding components.
A8.111 A number of ZigBee scenarios are given in Figure A8.12. The scenarios listed are informed by the MAC ZigBee Report which names some of the applications for which ZigBee is intended to be used. These scenarios consider a 20 MHz LTE signals interferer but we also looked at 10 MHz LTE signals for which the protection distances were typically 2/3 of the results given here.
A8.112 In scenarios with particularly long link distances or attenuation of the wanted signal by clutter, interference becomes a potential risk. The most susceptible scenario is agricultural links with a lower risk within a few 10’s of metres of an LTE base station for industrial automation, smart meters and traffic light control.
Figure A8.12: ZigBee Scenarios and Minimum Separation Distances from LTE transmitters
ZigBee Scenario
Typical Link Dist. (m)
Interference Propagation
Model
20 MHz BS Min.
Sep. Dist. (m)
20 MHz UE Min.
Sep. Dist. (m)
Home Automation 10 Indoor <1 <1 Industrial Automation 100 Indoor 20 <1 Smart Meters94 10 Outdoor 45 <1 Agriculture 300 Open 650 1 Street Light Control 20 Outdoor <1 <1 Traffic Light Control 40 Outdoor 20 <1 Medical Monitoring 10 Indoor <1 <1
Reduced Wanted Signal Power Scenarios
A8.113 As in the Bluetooth analysis, we have also considered effects which might reduce the strength of the wanted signal at the receiver. One example of this might be trees or tall hedgerows attenuating the wanted signal in the agricultural scenario.
A8.114 Susceptibility of the ZigBee devices to interference for difference levels of wanted received signal strength is considered in indoor, outdoor and open scenarios in Figures A8.13 to A8.15. Smart meter and agricultural scenarios are included here, but the impact of interference will be discussed in greater detail in subsequent sections.
A8.115 LTE base station interference to indoor ZigBee scenarios is shown in Figure A8.13. Taking Device 4 as a representative device, the “Home Automation” and “Medical Monitoring” scenarios can tolerate an additional attenuation of the wanted signal of up to 15 dB with little impact on the performance of the link from an LTE base station in close proximity. A combination of short link distances and attenuation of base station interfering signals by external walls makes these scenarios the most robust in the presence of interference.
94 Smart Meters can be installed in both indoor and outdoor locations. Attenuation of the wanted signal by obstructions such as walls and floors within buildings will impact the wanted received signal strength by more than simple free space path loss leading to greater minimum separation distances from LTE transmitters. See “Focus on Smart Meters”.
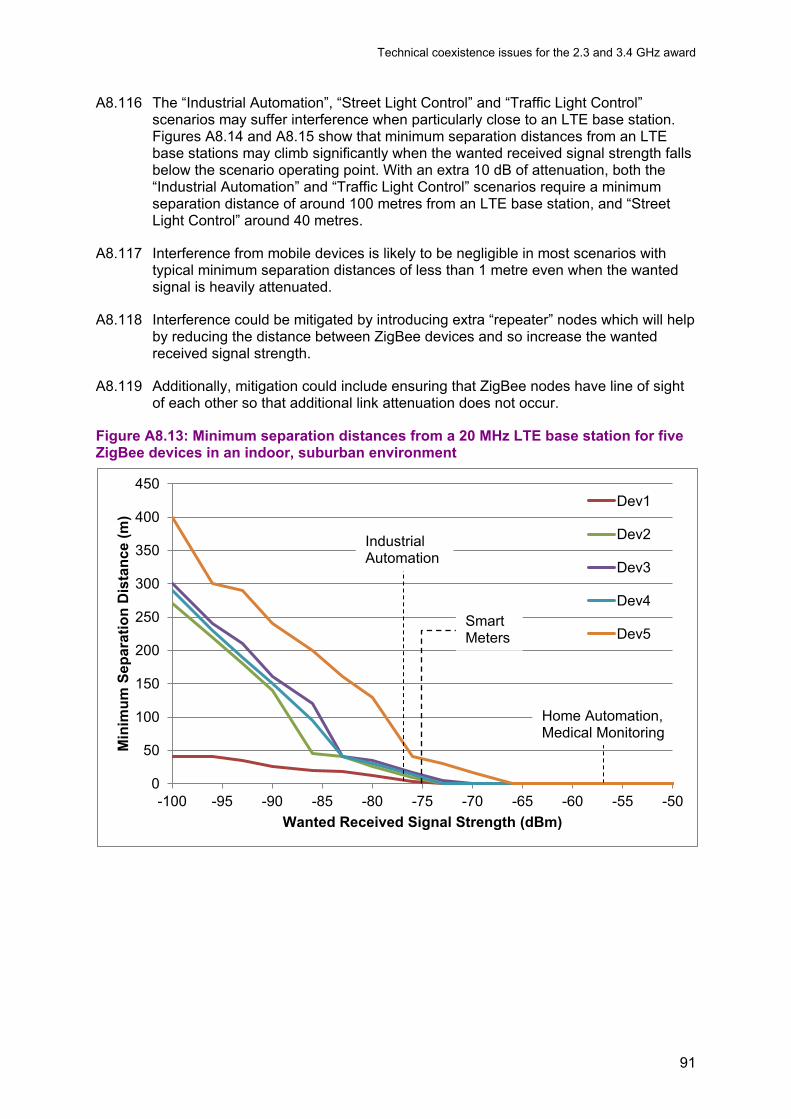
Technical coexistence issues for the 2.3 and 3.4 GHz award
91
A8.116 The “Industrial Automation”, “Street Light Control” and “Traffic Light Control” scenarios may suffer interference when particularly close to an LTE base station. Figures A8.14 and A8.15 show that minimum separation distances from an LTE base stations may climb significantly when the wanted received signal strength falls below the scenario operating point. With an extra 10 dB of attenuation, both the “Industrial Automation” and “Traffic Light Control” scenarios require a minimum separation distance of around 100 metres from an LTE base station, and “Street Light Control” around 40 metres.
A8.117 Interference from mobile devices is likely to be negligible in most scenarios with typical minimum separation distances of less than 1 metre even when the wanted signal is heavily attenuated.
A8.118 Interference could be mitigated by introducing extra “repeater” nodes which will help by reducing the distance between ZigBee devices and so increase the wanted received signal strength.
A8.119 Additionally, mitigation could include ensuring that ZigBee nodes have line of sight of each other so that additional link attenuation does not occur.
Figure A8.13: Minimum separation distances from a 20 MHz LTE base station for five ZigBee devices in an indoor, suburban environment
0
50
100
150
200
250
300
350
400
450
-100 -95 -90 -85 -80 -75 -70 -65 -60 -55 -50
Min
imum
Sep
arat
ion
Dis
tanc
e (m
)
Wanted Received Signal Strength (dBm)
Dev1
Dev2
Dev3
Dev4
Dev5
Home Automation, Medical Monitoring
Industrial Automation
Smart Meters
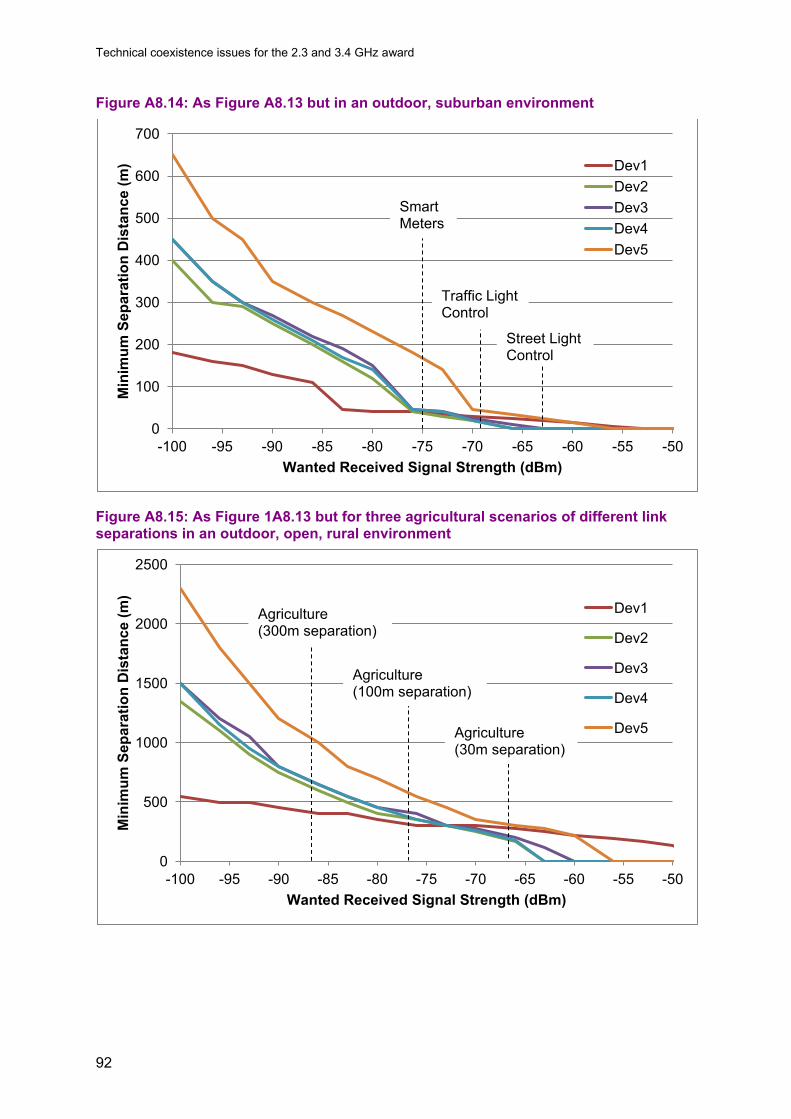
Technical coexistence issues for the 2.3 and 3.4 GHz award
92
Figure A8.14: As Figure A8.13 but in an outdoor, suburban environment
Figure A8.15: As Figure 1A8.13 but for three agricultural scenarios of different link separations in an outdoor, open, rural environment
0
100
200
300
400
500
600
700
-100 -95 -90 -85 -80 -75 -70 -65 -60 -55 -50
Min
imum
Sep
arat
ion
Dis
tanc
e (m
)
Wanted Received Signal Strength (dBm)
Dev1 Dev2 Dev3 Dev4 Dev5
Street Light Control
Smart Meters
Traffic Light Control
0
500
1000
1500
2000
2500
-100 -95 -90 -85 -80 -75 -70 -65 -60 -55 -50
Min
imum
Sep
arat
ion
Dis
tanc
e (m
)
Wanted Received Signal Strength (dBm)
Dev1
Dev2
Dev3
Dev4
Dev5
Agriculture (300m separation)
Agriculture (100m separation)
Agriculture (30m separation)

Technical coexistence issues for the 2.3 and 3.4 GHz award
93
Focus on Smart Meters
Figure A8.16: High level diagram for a typical smart meter network95. ZigBee communications links are indicated in green.
A8.120 Smart Meters are the next generation of gas and electricity meters, which improve
on the existing meters by using wireless technology to send consumption information to an in-home display and to send meter readings to energy companies96. Consumers can use this information to manage their energy use, manage their budgeting, save money and reduce emissions. ZigBee is the technology which will be used for links between the communications hub, the in-home display (IHD), electricity meter (EM) and gas meter (GM). Consumers may also use consumer access devices to interact with the smart meter HAN (adding smart appliances, for example) but these are optional.
A8.121 In nearly all circumstances the smart electricity meter will likely be co-located with the communications hub (less than 1 metre separation) whilst the gas meter and in-home display may typically be located elsewhere in the home. Smart Meter links are typically 10 metres (~60dB free space path loss at 2.4GHz) but propagation studies have shown that the link attenuation may typically be greater than this. This additional loss is accounted for by the clutter such as walls, floors and fittings common to most homes. This will vary between homes based on property size, construction materials and the thickness of those materials.
A8.122 Indoor and outdoor scenarios have been considered because meter boxes can be both exterior to, or deeper within, a property - with external boxes preferred for new build homes.
95 “The Smart Metering System”, Smart Metering Implementation Programme Leaflet, Department of Energy & Climate Change, 8th October 2013, https://www.gov.uk/government/publications/the-smart-metering-system-leaflet 96 “Smart Meters: a guide”, Department of Energy & Climate Change, 22 January 2013, https://www.gov.uk/smart-meters-how-they-work
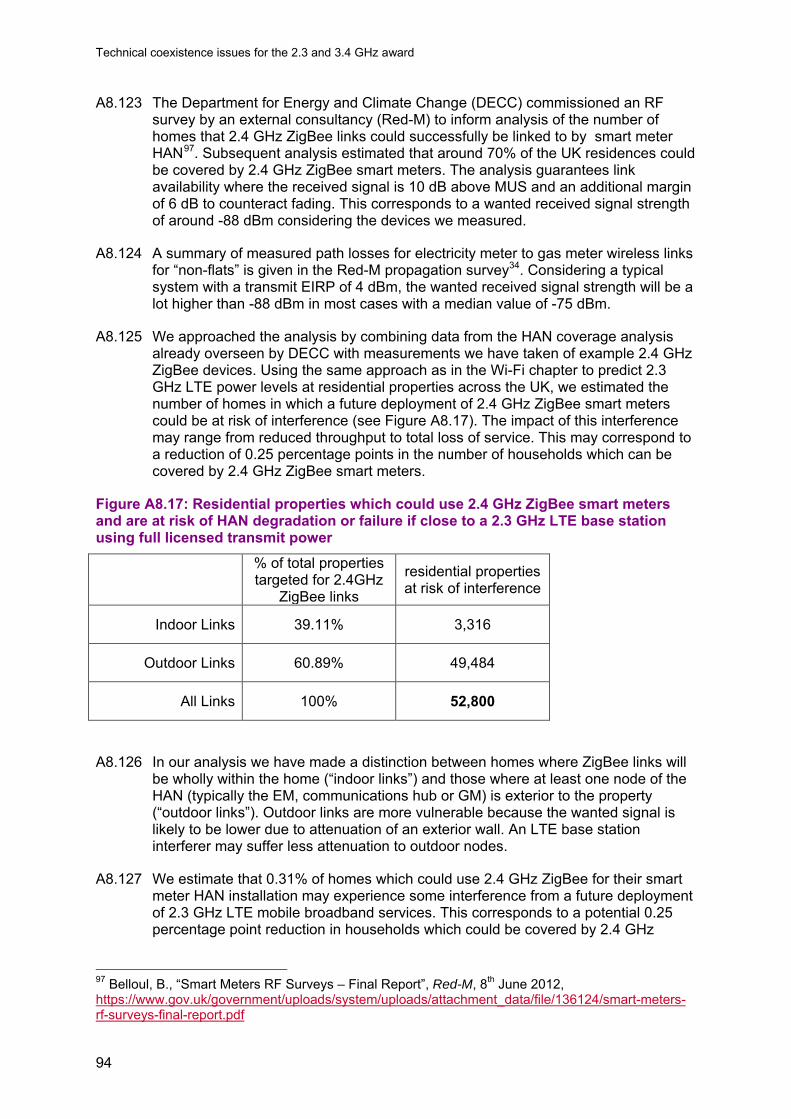
Technical coexistence issues for the 2.3 and 3.4 GHz award
94
A8.123 The Department for Energy and Climate Change (DECC) commissioned an RF survey by an external consultancy (Red-M) to inform analysis of the number of homes that 2.4 GHz ZigBee links could successfully be linked to by smart meter HAN97. Subsequent analysis estimated that around 70% of the UK residences could be covered by 2.4 GHz ZigBee smart meters. The analysis guarantees link availability where the received signal is 10 dB above MUS and an additional margin of 6 dB to counteract fading. This corresponds to a wanted received signal strength of around -88 dBm considering the devices we measured.
A8.124 A summary of measured path losses for electricity meter to gas meter wireless links for “non-flats” is given in the Red-M propagation survey34. Considering a typical system with a transmit EIRP of 4 dBm, the wanted received signal strength will be a lot higher than -88 dBm in most cases with a median value of -75 dBm.
A8.125 We approached the analysis by combining data from the HAN coverage analysis already overseen by DECC with measurements we have taken of example 2.4 GHz ZigBee devices. Using the same approach as in the Wi-Fi chapter to predict 2.3 GHz LTE power levels at residential properties across the UK, we estimated the number of homes in which a future deployment of 2.4 GHz ZigBee smart meters could be at risk of interference (see Figure A8.17). The impact of this interference may range from reduced throughput to total loss of service. This may correspond to a reduction of 0.25 percentage points in the number of households which can be covered by 2.4 GHz ZigBee smart meters.
Figure A8.17: Residential properties which could use 2.4 GHz ZigBee smart meters and are at risk of HAN degradation or failure if close to a 2.3 GHz LTE base station using full licensed transmit power % of total properties
targeted for 2.4GHz ZigBee links
residential properties at risk of interference
Indoor Links 39.11% 3,316
Outdoor Links 60.89% 49,484
All Links 100% 52,800
A8.126 In our analysis we have made a distinction between homes where ZigBee links will be wholly within the home (“indoor links”) and those where at least one node of the HAN (typically the EM, communications hub or GM) is exterior to the property (“outdoor links”). Outdoor links are more vulnerable because the wanted signal is likely to be lower due to attenuation of an exterior wall. An LTE base station interferer may suffer less attenuation to outdoor nodes.
A8.127 We estimate that 0.31% of homes which could use 2.4 GHz ZigBee for their smart meter HAN installation may experience some interference from a future deployment of 2.3 GHz LTE mobile broadband services. This corresponds to a potential 0.25 percentage point reduction in households which could be covered by 2.4 GHz
97 Belloul, B., “Smart Meters RF Surveys – Final Report”, Red-M, 8th June 2012, https://www.gov.uk/government/uploads/system/uploads/attachment_data/file/136124/smart-meters-rf-surveys-final-report.pdf

Technical coexistence issues for the 2.3 and 3.4 GHz award
95
ZigBee smart meters from 70% to 69.75% which DECC confirms is within the margin of error of their original estimates.
A8.128 Interference may cause a reduction in data throughput through to a total loss of service. In some cases there may be a reduction in throughput whilst in others there may be a total loss of service. As a low data rate, low duty cycle communications system, retransmissions may be useful in mitigating some of the impact of this interference so the reduction in coverage is likely to be less than the 0.25% suggested.
A8.129 The number of homes affected is small in the context of providing smart metering services to all homes in GB. Moreover DECC’s existing smart metering strategy has already adopted a flexible approach to deployments, in part to support arrangements for the 30% of homes where 2.4 GHz ZigBee was already expected to be inadequate for the smart meter HAN. These options include the use of alternative spectrum at 868 MHz which will not suffer interference from new 2.3 GHz LTE services.
A8.130 Our analysis considers the impact from a typical high power nationwide network; however it is possible that new 2.3 GHz LTE systems may be deployed for more regional or lower power smaller cells only, in which case the impact on 2.4 GHz ZigBee smart meters is likely to be significantly less.
Focus on Agriculture
A8.131 There are proposed uses in agriculture for sensors including for the measurement of ambient temperature/humidity; atmospheric pressure; rainfall; wind speed; ultraviolet and solar radiation; soil temperature; soil moisture and leaf wetness98. There are currently very limited deployments (if any) in the UK - but these systems use ZigBee to communicate between sensors and a local network interface.
A8.132 The agricultural scenario is potentially vulnerable to interference because the long link distances mean wanted signal strengths are low whilst the open environment means the interfering signal could interfere over a large area. Figure A8.18 suggests that minimum separation distances of several hundred meters may be required from base stations. Careful location of devices or shortening link ranges should mitigate any interference.
98 “Agriculture 2.0”, Libelium, v4.1 – 04/2013, Libelium Comunicaciones Distribuidas S.L., http://www.libelium.com/development/waspmote/documentation/agriculture-board-technical-guide/

Technical coexistence issues for the 2.3 and 3.4 GHz award
96
Figure A8.18: Illustration of an implementation of an in-field data acquisition network, based on a ZigBee network in a precision viticulture environment.99
Summary
A8.133 The ZigBee devices measured were more tolerant of interference than the Bluetooth devices when operating in the presence of LTE signals. However, the longer link distances typical for ZigBee applications can make them more vulnerable to interference. Interference begins to become an issue when ZigBee devices are separated by more than a few tens of meters or have significant clutter in the way and the receiver is very close to an LTE base station.
A8.134 Interference is likely to be caused by poor receiver selectivity with both narrowband and wideband blocking effects observed in the devices measured.
A8.135 ZigBee devices are not particularly widely used so early communication of the interference risk could avoid the problem of widespread legacy systems. ZigBee devices are often used for fixed applications and it should be clear when they are installed whether any interference mitigation technique from LTE base stations are required. 2.4 GHz smart meters are due to be rolled out in a similar timeframe to expected 2.3 GHz deployments.
A8.136 LTE mobile devices are unlikely to cause interference to ZigBee devices. When spikes in LTE mobile device transmit power occur a combination of channel sensing and retransmissions may help mitigate interference. Protocol testing demonstrated the effectiveness of these mechanisms in mitigating interference. This should be appropriate for ZigBee networks which are non-time-critical and have a low data rate with long periods between transmissions.
A8.137 LTE base stations are likely to cause some risk of interference to certain ZigBee devices in close proximity, particularly outdoor devices. The interference range may
99 Morais, R. et. al, “A ZigBee multi-powered wireless acquisition device for remote sensing applications in precision viticulture”, Computers and Electronics in Agriculture, Issue 62, 2008, pp 94–106 http://www.hicc.cs.kumamoto-u.ac.jp/lab_document/2011/zas-sot/dan/dan_zas_ron.pdf
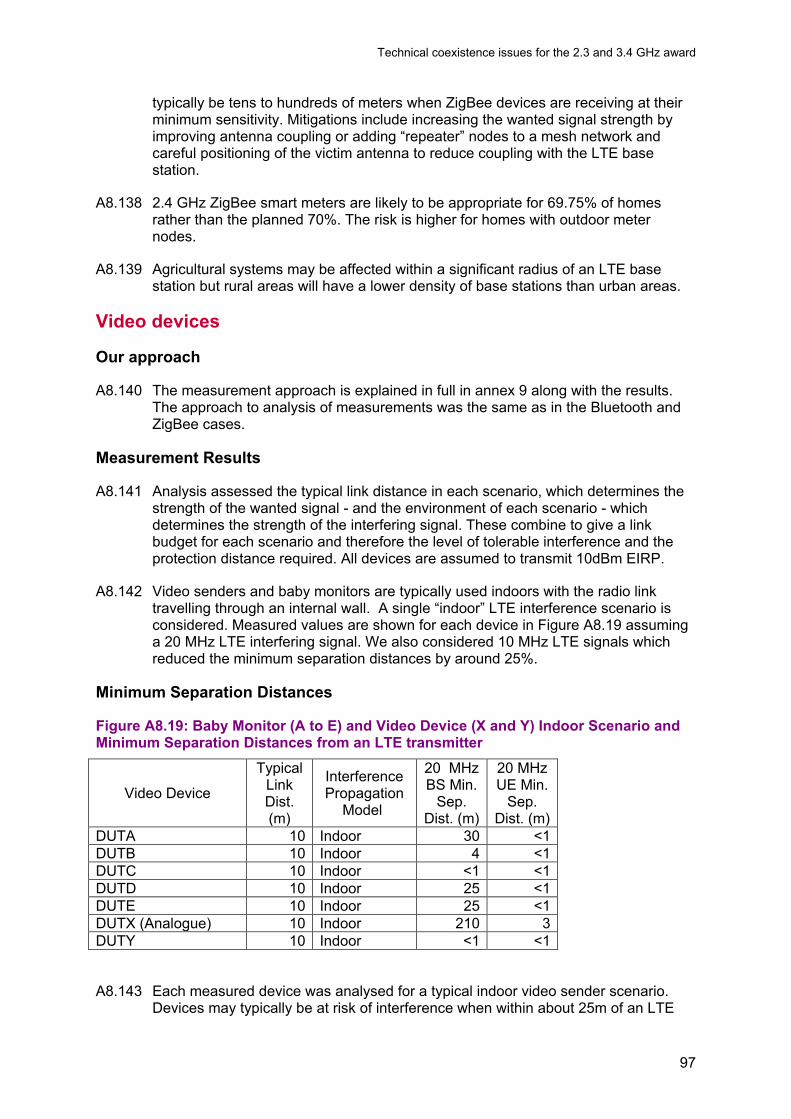
Technical coexistence issues for the 2.3 and 3.4 GHz award
97
typically be tens to hundreds of meters when ZigBee devices are receiving at their minimum sensitivity. Mitigations include increasing the wanted signal strength by improving antenna coupling or adding “repeater” nodes to a mesh network and careful positioning of the victim antenna to reduce coupling with the LTE base station.
A8.138 2.4 GHz ZigBee smart meters are likely to be appropriate for 69.75% of homes rather than the planned 70%. The risk is higher for homes with outdoor meter nodes.
A8.139 Agricultural systems may be affected within a significant radius of an LTE base station but rural areas will have a lower density of base stations than urban areas.
Video devices
Our approach
A8.140 The measurement approach is explained in full in annex 9 along with the results. The approach to analysis of measurements was the same as in the Bluetooth and ZigBee cases.
Measurement Results
A8.141 Analysis assessed the typical link distance in each scenario, which determines the strength of the wanted signal - and the environment of each scenario - which determines the strength of the interfering signal. These combine to give a link budget for each scenario and therefore the level of tolerable interference and the protection distance required. All devices are assumed to transmit 10dBm EIRP.
A8.142 Video senders and baby monitors are typically used indoors with the radio link travelling through an internal wall. A single “indoor” LTE interference scenario is considered. Measured values are shown for each device in Figure A8.19 assuming a 20 MHz LTE interfering signal. We also considered 10 MHz LTE signals which reduced the minimum separation distances by around 25%.
Minimum Separation Distances
Figure A8.19: Baby Monitor (A to E) and Video Device (X and Y) Indoor Scenario and Minimum Separation Distances from an LTE transmitter
Video Device
Typical Link Dist. (m)
Interference Propagation
Model
20 MHz BS Min.
Sep. Dist. (m)
20 MHz UE Min.
Sep. Dist. (m)
DUTA 10 Indoor 30 <1 DUTB 10 Indoor 4 <1 DUTC 10 Indoor <1 <1 DUTD 10 Indoor 25 <1 DUTE 10 Indoor 25 <1 DUTX (Analogue) 10 Indoor 210 3 DUTY 10 Indoor <1 <1
A8.143 Each measured device was analysed for a typical indoor video sender scenario. Devices may typically be at risk of interference when within about 25m of an LTE
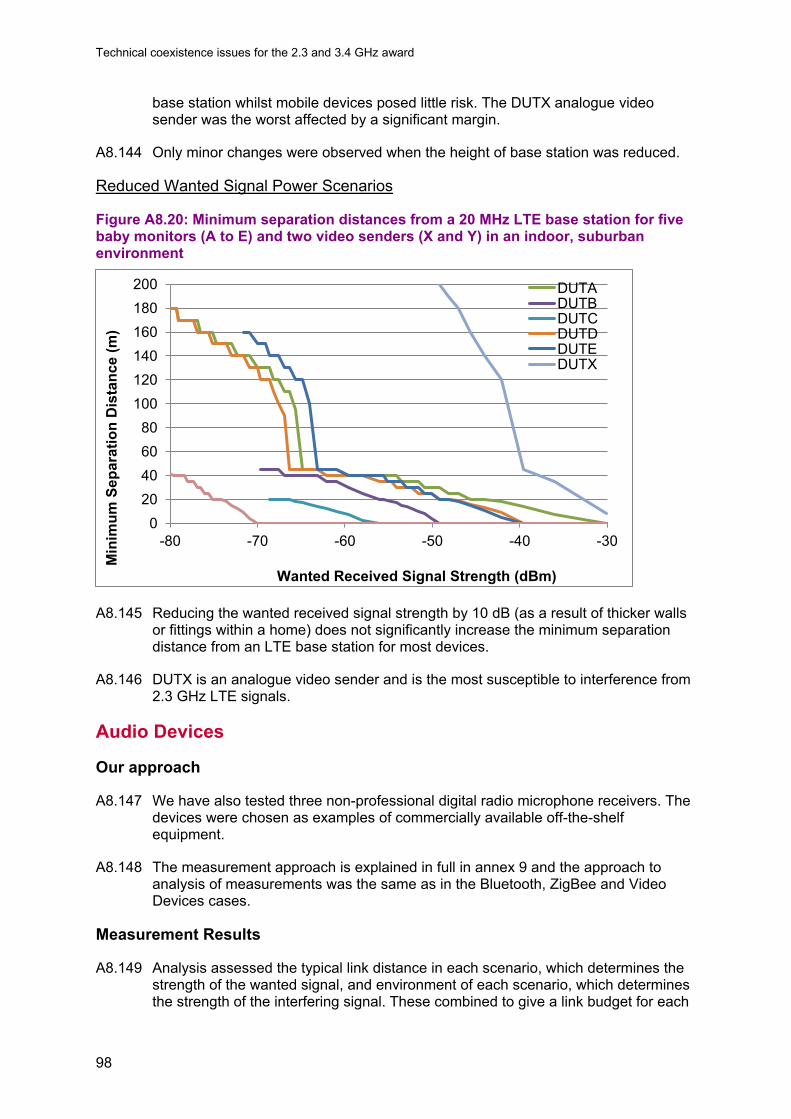
Technical coexistence issues for the 2.3 and 3.4 GHz award
98
base station whilst mobile devices posed little risk. The DUTX analogue video sender was the worst affected by a significant margin.
A8.144 Only minor changes were observed when the height of base station was reduced.
Reduced Wanted Signal Power Scenarios
Figure A8.20: Minimum separation distances from a 20 MHz LTE base station for five baby monitors (A to E) and two video senders (X and Y) in an indoor, suburban environment
A8.145 Reducing the wanted received signal strength by 10 dB (as a result of thicker walls or fittings within a home) does not significantly increase the minimum separation distance from an LTE base station for most devices.
A8.146 DUTX is an analogue video sender and is the most susceptible to interference from 2.3 GHz LTE signals.
Audio Devices
Our approach
A8.147 We have also tested three non-professional digital radio microphone receivers. The devices were chosen as examples of commercially available off-the-shelf equipment.
A8.148 The measurement approach is explained in full in annex 9 and the approach to analysis of measurements was the same as in the Bluetooth, ZigBee and Video Devices cases.
Measurement Results
A8.149 Analysis assessed the typical link distance in each scenario, which determines the strength of the wanted signal, and environment of each scenario, which determines the strength of the interfering signal. These combined to give a link budget for each
0 20 40 60 80
100 120 140 160 180 200
-80 -70 -60 -50 -40 -30
Min
imum
Sep
arat
ion
Dis
tanc
e (m
)
Wanted Received Signal Strength (dBm)
DUTA DUTB DUTC DUTD DUTE DUTX

Technical coexistence issues for the 2.3 and 3.4 GHz award
99
scenario and therefore the level of tolerable interference and the protection distance required.
A8.150 All devices are assumed to transmit 10dBm EIRP and a single “outdoor” LTE interference scenario is considered.
Minimum Separation Distances
Figure A8.21: Radio Microphone Outdoor and Indoor Scenarios and Minimum Separation Distances from LTE transmitters
Radio Microphone
Typical Link Dist. (m)
Interference Propagation
Model
20 MHz BS Min.
Sep. Dist. (m)
20 MHz UE Min.
Sep. Dist. (m)
DUT-A 30 Outdoor 15 <1 Indoor <1 <1
DUT-B 100 Outdoor 45 <1 Indoor 19 <1
DUT-C 30 Outdoor 40 <1 Indoor <1 <1
A8.151 Each measured device was analysed for a typical outdoor radio microphone scenario (Figure A8.21). The link distances are the maximum line-of-sight range quoted on the datasheet for each device. Results for a 10 MHz LTE interferer led to reduced minimum separation distances (by 2 to 4 times).
A8.152 All devices work up to their maximum specified range in the presence of interference from LTE user equipment.
A8.153 Minimum separation distances between the radio microphones and LTE base stations were broadly similar, with degradation in performance likely when within a few 10’s of metres of an LTE base station when outside. Separation to DUT-B may increase to around 100 metres when the link margin is reduced by 10dB.
A8.154 This scenario is extended to illustrate minimum separation distances from a 20 MHz bandwidth LTE transmitter for a range of device separation distances. Scenarios are modelled up to 100 metres separation over which all the devices would still receive a signal greater than the MUS.
A8.155 Interference can be mitigated by moving the radio microphone receiver away from an LTE BS or by reducing the link distance (range) between the radio microphone and its receiver. Both DUT-A and DUT-B are shown in Figure A8.22 to suffer no interference when the link distance is reduced below 20 metres.
A8.156 Indoor systems are able to coexist more closely with LTE base station with all three devices requiring no practical separation from an LTE base station to prevent the onset of degradation.

Technical coexistence issues for the 2.3 and 3.4 GHz award
100
Figure A8.22: Minimum separation distance from an LTE BS using 20MHz bandwidth for a number of radio microphone devices at separation distances up to 100 metres in an outdoor scenario
Summary of Assumptions
A8.157 Interference modelling of systems was designed to support policy decisions by being as realistic as possible, rather than a simple worst case analysis. The worst case has been acknowledged, where appropriate, but the emphasis in our modelling has been to assess the typical impact of LTE systems on license exempt devices.
A8.158 Assumptions are broadly similar to those made in the Wi-Fi chapter. Assumptions specific to the devices considered here are summarised below in Figure A8.23.
Figure A8.23: Summary of parameters used for license exempt devices
Parameter /Assumption Value(s) Comments Source
LE blocking levels
Based on measurements – median devices used. All: Considered at onset of degradation
LE receiver heights All: 1.5 metres Typical
assumptions
0.0
20.0
40.0
60.0
80.0
100.0
120.0
140.0
160.0
0 20 40 60 80 100
Min
imum
Sep
arat
ion
Dis
tanc
e (m
)
Radio Microphone Device Separation (m)
DUT-A
DUT-B
DUT-C

Technical coexistence issues for the 2.3 and 3.4 GHz award
101
Annex 9
9 Video and audio measurements Introduction
A9.1 In this annex we present the results of measurements to investigate the potential risk of interference into licence exempt video and audio applications operating in the 2.4 GHz LE band.
A9.2 We have considered two specific types of wireless video applications: video baby monitors and video senders. Baby monitors use remote cameras to transmit images to small portable monitors within the home; video senders are used to transmit television pictures between different rooms, or are used in Closed Circuit Television (CCTV) systems.
A9.3 We have also considered low power non-professional radio microphones which operate in this band. These are typically found in school, church and conference venue type environments. Radio microphones use battery powered transmitters to transmit an audio signal wirelessly from a microphone to a nearby receiver.
LTE Test Parameters
A9.4 As discussed elsewhere, the most likely use of the 2.3 GHz release band is for the provision of LTE-TDD mobile services. In this study we have considered the potential for interference from both LTE user equipment and base station emissions.
A9.5 At the time of the study we did not have access to LTE hardware capable of operating in the 2.3 GHz band. We therefore used a signal generator to produce the LTE signals, based on reference parameters taken from standards developed by the Third Generation Partnership Project (3gpp) and published by the ETSI.
A9.6 We have considered LTE signals with both 10 MHz and 20 MHz channel bandwidths and with different TDD frame configurations for the uplink and downlink directions, described further below. The spectral emissions of the test signals, and the frequency offsets from the edge of the LE band, are shown in Figure A9.1.
A9.7 The emissions from the generated signals are cleaner than the emissions that real LTE equipment might be expected to generate. However, with a 10 MHz guard band to the edge of the LE band, we expect the main interference mechanism to be the high power emissions falling within the receiver’s filter bandwidth (adjacent channel selectivity), rather than from out of band emissions falling within the LE band.

Technical coexistence issues for the 2.3 and 3.4 GHz award
102
Figure A9.1: Spectral emissions of LTE test signals
LTE technical parameters
A9.8 The LTE user equipment signal parameters were based on a QPSK reference channel with full resource block allocation defined in ETSI TS 136 101100, and the base station signal parameters were based on a QPSK reference channel with full resource block allocation defined in ETSI TS 136 104101.
A9.9 For this study we have used UL/DL configurations zero and five102, to represent both uplink heavy (configuration zero) and downlink heavy (configuration five) LTE traffic scenarios. To represent the operation of the user equipment only the uplink subframes were populated with traffic, while for the base station only the downlink subframes were populated.
A9.10 The frame configuration can be considered analogous to duty cycle with, for example, configuration five representing a duty cycle of approximately 10% in the uplink direction and 90% in the downlink direction.
100 ETSI TS 136 101: LTE; Evolved Universal Terrestrial Radio Access (E-UTRA); User Equipment radio transmission and reception (3GPP TS 36.101 version 11.2.0 Release 11). 101 ETSI TS 136 104: LTE; Evolved Universal Terrestrial Radio Access (E-UTRA); Base Station radio transmission and reception (3GPP TS 36.104 version 11.2.0 Release 11). 102 See annex 7 for further details on LTE-TDD frame configurations
-80
-70
-60
-50
-40
-30
-20
-10
0
2365 2370 2375 2380 2385 2390 2395 2400 2405 2410 2415
Norm
alis
ed le
vel (
dBm
)
Frequency (MHz)
LTE UE emissions10 MHz bandwidth, frame configuration 0
(Measurement bandwidth = 10 kHz)
Analyser noise floor
LE band edge
-80
-70
-60
-50
-40
-30
-20
-10
0
2365 2370 2375 2380 2385 2390 2395 2400 2405 2410 2415
Norm
alis
ed le
vel (
dBm
)
Frequency (MHz)
LTE UE emissions20 MHz bandwidth, frame configuration 0
(Measurement bandwidth = 10 kHz)
Analyser noise floor
LE band edge
-80
-70
-60
-50
-40
-30
-20
-10
0
2365 2370 2375 2380 2385 2390 2395 2400 2405 2410 2415
Norm
alis
ed le
vel (
dBm
)
Frequency (MHz)
LTE BS emissions10 MHz bandwidth, frame configuration 5
(Measurement bandwidth = 10 kHz)
Analyser noise floor
LE band edge
-80
-70
-60
-50
-40
-30
-20
-10
0
2365 2370 2375 2380 2385 2390 2395 2400 2405 2410 2415
Norm
alis
ed le
vel (
dBm
)
Frequency (MHz)
LTE BS emissions20 MHz bandwidth, frame configuration 5
(Measurement bandwidth = 10 kHz)
Analyser noise floor
LE band edge

Technical coexistence issues for the 2.3 and 3.4 GHz award
103
Baby Monitor and Video Sender Equipment
Our approach
A9.11 Baby monitor and video sender equipment operating in the 2400-2483.5 MHz band tend to use proprietary protocols and technology in order to coexist with other LE users of the band. Newer devices coming on to the market use digital modulation and frequency hopping technology to mitigate against interference and provide more robust security against video pictures being intercepted. We were not able to find any examples of analogue baby monitors legally available to purchase in the UK. We do not expect these types of devices to be widely in use in the future although we note that there may be some legacy equipment.
A9.12 In total we selected five baby monitors and two video senders for use in the measurements, six of which are digital devices, representing the general trend towards digital systems. The devices are summarised in the following table.
Table A9.1: Summary of video equipment under test
Description: Device-A Device-B Device-C Device-D Device-E
Type: Digital baby
monitor
Digital baby
monitor
Digital baby
monitor
Digital baby
monitor
Digital baby
monitor
Frequency: Frequency hopping
Frequency hopping
Frequency hopping
Frequency hopping
Frequency hopping
Receiver sensitivity
(measured):
-80 dBm -69.5 dBm -68.4 dBm -80 dBm -71.4 dBm
Description: Device-X Device-Y
Type: Analogue video sender
Digital video
sender
Frequency: 2414 MHz Frequency hopping
Receiver sensitivity
(measured):
-70 dBm -86 dBm
A9.13 The analogue video sender allowed one of four channels to be selected via switches on the back panel. We set this to Channel 1, operating at 2414 MHz. The digital baby monitors and digital video sender used frequency hopping spread spectrum technology operating over the entire 2400-2483.5 MHz frequency band.
A9.14 The receiver sensitivity in Table A9.1 refers to the minimum signal level at the input to the receiver required to produce a good quality picture with no visible defects. This level determines the maximum range over which the transmitter and receiver will reliably operate, before considering the impact of any interference.

Technical coexistence issues for the 2.3 and 3.4 GHz award
104
A9.15 We then increased the signal level at the receiver input by 10, 20 or 30 dB above the minimum usable sensitivity (MUS) for our interference measurements. This allowed us to examine receiver performance in the presence of a strong interfering signal, and removed any effects of operating with a wanted signal close to the receiver noise floor.
Test methodology
A9.16 Our results are based on the measurement of Carrier-to-Interference (C/I) ratio. This is a measure of coexistence performance, defining the permitted level of interference (I) for a given wanted signal level (C) and frequency offset, evaluated at the receiver input; the higher the C/I value the more sensitive the receiver is to interference. To measure this we used the test setup shown in Figure A9.2.
Figure A9.2: Example test setup for baby monitor and video sender measurements
A9.17 We used the following test procedure to find the C/I ratio:
i) The wanted signal level at the input to the receiver was set to a value 10, 20 or 30 dB above the minimum usable sensitivity and the signal level (C) at the receiver input was recorded;
ii) The unwanted LTE signal was introduced and set to the required frequency offset. The signal level was gradually increased to determine the maximum acceptable interfering signal level at the receiver input before the image degraded (I);
iii) The values measured for ‘C’ and ‘I’ were used to calculate the carrier-to-interference ratio at the chosen frequency offset103.
A9.18 The digital baby monitors were supplied with wireless cameras which were used to transmit a video test stream to the associated receivers. For the analogue and digital video senders, the test image was provided by an external source. The digital video sender image was provided by a set top box playing a digital test stream generated by a signal generator.
103 Both C and I are measured within their operational bandwidths at their operating frequencies and therefore the more negative the C/I ratio the greater the resilience to interference the device has.
Video image
Transmitter
Variable attenuator
Hybrid coupler
Receiver under test
Video monitor
LTE source
Spectrum analyser
Antenna
Screened Room

Technical coexistence issues for the 2.3 and 3.4 GHz award
105
A9.19 We assessed the onset of interference through subjective assessment of picture failure. For an analogue system the impact of interference increases gradually as the level of the unwanted signal increases. We compared the degradation in picture quality against interference free operation. We took picture failure as the point at which any noticeable interference was observed, even if it was still possible to watch the transmitted image. An example is shown in Figure A9.3.
Figure A9.3: Example of analogue test picture
Interference free With interference
A9.20 For digital systems the impact of interference is more abrupt (the digital “cliff edge” effect). We defined picture failure as the point at which there was noticeable degradation to the received picture or audio quality as a result of the unwanted signal. This may be manifested as either jumping in the video stream, pixilation of the image or complete picture breakup. An example is shown in Figure A9.4.
Figure A9.4: Example of interference on a digital test picture
Measurement results
A9.21 The C/I protection ratio results just before the point of failure are shown in Figure A9.5 to Figure A9.11.
A9.22 For analogue equipment results are shown as frequency offset from the wanted channel centre frequency (2414 MHz); for digital equipment, employing frequency hopping across the ISM band, results are shown for the LTE signal centred 10 MHz inside the LE band (at 2410 MHz), and then in 5 MHz frequency offsets from the band edge, 2400 MHz.

Technical coexistence issues for the 2.3 and 3.4 GHz award
106
A9.23 In practice LTE-TDD will not be able to operate co-channel with LE equipment. For a 10 MHz bandwidth LTE signal the closest centre frequency will be 2385 MHz, giving a frequency offset of 15 MHz from the 2400 MHz band edge. Therefore, the results of most interest lie to the left of the vertical red line shown in the figures.
Figure A9.5: C/I protection ratios for digital baby monitor (DUT-A)
Figure A9.6: C/I protection ratios for digital baby monitor (DUT-B)
-50
-40
-30
-20
-10
0
10
20
30
-100 -95 -90 -85 -80 -75 -70 -65 -60 -55 -50 -45 -40 -35 -30 -25 -20 -15 -10 -5 0
C/I (
dB)
Frequency Offset (MHz)
C/I protection ratio for LTE into DUT-B(Frequency hopping, MUS = -80 dBm)
MUS +10dB, UE 10 MHz, Frame 0
MUS +20dB, UE 10 MHz, Frame 0
MUS +30dB, UE 10 MHz, Frame 0
MUS +10dB, UE 20 MHz, Frame 0
MUS +20dB, UE 20 MHz, Frame 0
MUS +30dB, UE 20 MHz, Frame 0
MUS +10dB, BS 10 MHz, Frame 5
MUS +20dB, BS 10 MHz, Frame 5
MUS +30dB, BS 10 MHz, Frame 5
MUS +10dB, BS 20 MHz, Frame 5
MUS +20dB, BS 20 MHz, Frame 5
MUS +30dB, BS 20 MHz, Frame 5
LE band edge (2400 MHz)
Closest LTE centre frequency
-50
-40
-30
-20
-10
0
10
20
30
-100 -95 -90 -85 -80 -75 -70 -65 -60 -55 -50 -45 -40 -35 -30 -25 -20 -15 -10 -5 0
C/I (
dB)
Frequency Offset (MHz)
C/I protection ratio for LTE into DUT-C(Frequency hopping, MUS = -69 dBm)
MUS +10dB, UE 10 MHz, Frame 0
MUS +20dB, UE 10 MHz, Frame 0
MUS +30dB, UE 10 MHz, Frame 0
MUS +10dB, UE 20 MHz, Frame 0
MUS +20dB, UE 20 MHz, Frame 0
MUS +30dB, UE 20 MHz, Frame 0
MUS +10dB, BS 10 MHz, Frame 5
MUS +20dB, BS 10 MHz, Frame 5
MUS +30dB, BS 10 MHz, Frame 5
MUS +10dB, BS 20 MHz, Frame 5
MUS +20dB, BS 20 MHz, Frame 5
MUS +30dB, BS 20 MHz, Frame 5
LE band edge (2400 MHz)
Closest LTE centre frequency

Technical coexistence issues for the 2.3 and 3.4 GHz award
107
Figure A9.7: C/I protection ratios for digital baby monitor (DUT-C)
Figure A9.8: C/I protection ratios for digital baby monitor (DUT-D)
-50
-40
-30
-20
-10
0
10
20
30
-100 -95 -90 -85 -80 -75 -70 -65 -60 -55 -50 -45 -40 -35 -30 -25 -20 -15 -10 -5 0
C/I (
dB)
Frequency Offset (MHz)
C/I protection ratio for LTE into DUT-D(Frequency hopping, MUS = -68 dBm)
MUS +10dB, UE 10 MHz, Frame 0
MUS +20dB, UE 10 MHz, Frame 0
MUS +30dB, UE 10 MHz, Frame 0
MUS +10dB, UE 20 MHz, Frame 0
MUS +20dB, UE 20 MHz, Frame 0
MUS +30dB, UE 20 MHz, Frame 0
MUS +10dB, BS 10 MHz, Frame 5
MUS +20dB, BS 10 MHz, Frame 5
MUS +30dB, BS 10 MHz, Frame 5
MUS +10dB, BS 20 MHz, Frame 5
MUS +20dB, BS 20 MHz, Frame 5
MUS +30dB, BS 20 MHz, Frame 5
LE band edge (2400 MHz)
Closest LTE centre frequency
-50
-40
-30
-20
-10
0
10
20
30
-100 -95 -90 -85 -80 -75 -70 -65 -60 -55 -50 -45 -40 -35 -30 -25 -20 -15 -10 -5 0
C/I (
dB)
Frequency Offset (MHz)
C/I protection ratio for LTE into DUT-E(Frequency hopping, MUS = -80 dBm)
MUS +10dB, UE 10 MHz, Frame 0
MUS +20dB, UE 10 MHz, Frame 0
MUS +30dB, UE 10 MHz, Frame 0
MUS +10dB, UE 20 MHz, Frame 0
MUS +20dB, UE 20 MHz, Frame 0
MUS +30dB, UE 20 MHz, Frame 0
MUS +10dB, BS 10 MHz, Frame 5
MUS +20dB, BS 10 MHz, Frame 5
MUS +30dB, BS 10 MHz, Frame 5
MUS +10dB, BS 20 MHz, Frame 5
MUS +20dB, BS 20 MHz, Frame 5
MUS +30dB, BS 20 MHz, Frame 5
LE band edge (2400 MHz)
Closest LTE centre frequency

Technical coexistence issues for the 2.3 and 3.4 GHz award
108
Figure A9.9: C/I protection ratios for digital baby monitor (DUT-E)
Figure A9.10: C/I protection ratios for analogue video sender (DUT-X)
-50
-40
-30
-20
-10
0
10
20
30
-100 -95 -90 -85 -80 -75 -70 -65 -60 -55 -50 -45 -40 -35 -30 -25 -20 -15 -10 -5 0
C/I (
dB)
Frequency Offset (MHz)
C/I protection ratio for LTE into DUT-F(Frequency hopping, MUS = -71 dBm)
MUS +10dB, UE 10 MHz, Frame 0
MUS +20dB, UE 10 MHz, Frame 0
MUS +30dB, UE 10 MHz, Frame 0
MUS +10dB, UE 20 MHz, Frame 0
MUS +20dB, UE 20 MHz, Frame 0
MUS +30dB, UE 20 MHz, Frame 0
MUS +10dB, BS 10 MHz, Frame 5
MUS +20dB, BS 10 MHz, Frame 5
MUS +30dB, BS 10 MHz, Frame 5
MUS +10dB, BS 20 MHz, Frame 5
MUS +20dB, BS 20 MHz, Frame 5
MUS +30dB, BS 20 MHz, Frame 5
LE band edge (2400 MHz)
Closest LTE centre frequency
-50
-40
-30
-20
-10
0
10
20
30
40
-100 -95 -90 -85 -80 -75 -70 -65 -60 -55 -50 -45 -40 -35 -30 -25 -20 -15 -10 -5 0
C/I (
dB)
Frequency Offset (MHz)
C/I protection ratio for LTE into DUT-X(Frequency = 2414 MHz, MUS = -70 dBm)
MUS +20dB, UE 10 MHz, Frame 0
MUS +20dB, UE 20 MHz, Frame 0
MUS +20dB, BS 10MHz, Frame 5
MUS +20dB, BS 20 MHz, Frame 5
LE band edge (2400 MHz)
Closest LTE centre frequency

Technical coexistence issues for the 2.3 and 3.4 GHz award
109
Figure A9.11: C/I protection ratios for digital video sender (DUT-Y)
Summary of results
A9.24 For all digital systems, increasing the frequency offset between the LTE signal and the device under test has a negligible impact on the C/I ratios. This suggests that the main interference mechanism is due to receiver blocking, i.e. the total power of the LTE signal falling within the operating bandwidth of the receiver, due to the non-ideal shape of the receiver front end filter (adjacent channel selectivity). The exception to this is the analogue video sender, where the different filter characteristics provide some significant improvement as the frequency separation increases.
A9.25 Improving the strength of the wanted signal (e.g. to 20 dB or 30 dB above MUS) did not result in a corresponding linear improvement in the level of interference that could be tolerated. Further discussion on linear and non-linear receiver effects are provided in annex 8. This means that increasing the wanted signal level, for example by moving the transmitter closer to the receiver, will not always mitigate the impact of any LTE interference.
A9.26 All of the baby monitors appeared to be slightly more susceptible to Base Station emissions, possibly due to the higher duty cycle of the frame configuration we used for the downlink (90% duty cycle), compared to the uplink (60% duty cycle). We undertook some additional tests (not included in this Annex) with a much lower duty cycle (10%) in the uplink direction which gave a further improvement in the results. These findings are consistent with measurements commissioned by Ofcom on other LE devices, e.g. Wi-Fi, Bluetooth and ZigBee. In practice, since baby monitors can be expected to operate indoors, Base Station interference will be attenuated by one or more walls of the property.
-60
-50
-40
-30
-20
-10
0
10
20
30
40
-100 -95 -90 -85 -80 -75 -70 -65 -60 -55 -50 -45 -40 -35 -30 -25 -20 -15 -10 -5 0
C/I (
dB)
Frequency Offset (MHz)
C/I protection ratio for LTE into DUT-Y(Frequency hopping, MUS = -86 dBm)
MUS +20dB, UE 10 MHz, Frame 0
MUS +20dB, UE 20 MHz, Frame 0
MUS +20dB, BS 10MHz, Frame 5
MUS +20dB, BS 20 MHz, Frame 5
LE band edge (2400 MHz)
Closest LTE centre frequency

Technical coexistence issues for the 2.3 and 3.4 GHz award
110
A9.27 The digital receivers were able to tolerate slightly more interference than the analogue device, due to the frequency hopping techniques employed to mitigate against interference from other devices that share the LE band.
A9.28 Taking the results for a baby monitor or video sender scenario where the wanted signal level is 20 dB above the receiver sensitivity, the following minimum coupling loss (MCL) figures can be derived. These are used in the separation distance models presented in annex 8. The results assume that the radiated transmit power from LTE user equipment is +3 dBm, and from Base Station equipment is +67 dBm for 20 MHz.
Table A9.2: Minimum coupling loss calculations at 20 dB above MUS, 20 MHz LTE bandwidth
20 MHz LTE bandwidth MUS +20 dB
DUT-A
DUT-B
DUT-C
DUT-D
DUT-E
DUT-X
DUT-Y
LTE UE interference level (dBm) -29 -21 -16 -32 -25 -48 -22
Min. coupling loss (dB) for LTE UE at +3 dBm
32 24 19 35 28 51 25
LTE base station interference level (dBm) -37 -27 -22 -36 -32 -46 -20
Min. coupling loss (dB) for LTE base station at +67 dBmm
104 94 89 103 99 113 87
Radio Microphone Equipment
Our approach
A9.29 Radio microphone equipment operating in the LE band is used almost exclusively in consumer (rather than professional) environments such as church, school and conference centre venues. Due to the potential for interference from other LE equipment operating in the band, radio microphones use digital techniques such as frequency diversity, data coding and error correction to mitigate against interference.
A9.30 We selected three digital radio microphones for use in the measurements, representing low, middle and high end price points in the market. We refer to these as Devices A, B and C in the remainder of this section.

Technical coexistence issues for the 2.3 and 3.4 GHz award
111
Table A9.3: Summary of audio equipment under test
Description: Device-A Device-B Device-C
Type: Digital radio microphone
Digital radio microphone
Digital radio microphone
Frequency: 2406 MHz 2402 MHz 2404 MHz
Receiver sensitivity
(measured):
-75 dBm -90 dBm -78 dBm
A9.31 The receiver sensitivity in Table A9.3 refers to the minimum signal level at the input to the receiver required to produce a good quality audio signal with no audible defects. This determines the maximum operating range of the radio microphone before considering the impact of any interference. We measured the receivers’ minimum usable sensitivity using a SINAD meter.
A9.32 SINAD (Signal to Interference plus Noise and Distortion) is a measurement that approximates the audible background noise heard along with a continuous 1 kHz audio tone.
A9.33 We found that all three of the receivers were able to achieve a starting SINAD of between 35 dB and 42 dB. We recorded the receivers’ MUS as the point at which SINAD dropped below 20 dB. This is the minimum performance criterion given in ETSI TS 102 192104 for radio microphone equipment intended for domestic entertainment.
A9.34 We then increased the minimum signal level at the receiver input by 3, 10 or 20 dB above the MUS for our interference measurements. This allowed us to examine receiver performance under different operating conditions.
Test methodology
A9.35 Similarly to our measurements on video equipment, our results are based on the measurement of Carrier-to-Interference protection ratio, defining the permitted level of interference for a given wanted signal level, evaluated at the receiver input. To measure this we used the test setup shown in Figure A9.12.
104 ETSI TS 102 192-1 v1.1.1 (2004-8): Electromagnetic compatibility and radio spectrum matters (ERM); International Technical Characteristics and Test Methods; Part 1: Wireless/Radio Microphones in the 25 MHz to 3 GHz Frequency Range

Technical coexistence issues for the 2.3 and 3.4 GHz award
112
Figure A9.12: Test setup for audio equipment
A9.36 We used the following test procedure to find the C/I protection ratio:
i) The wanted signal level at the input to the receiver was set to a value of 3 dB, 10 dB or 20 dB above the minimum usable sensitivity and the signal level (C) at the receiver input was recorded;
ii) The unwanted LTE signal was introduced and set to the required frequency offset. The signal level was gradually increased to determine the maximum acceptable interfering signal level at the receiver input (I);
iii) The value measured for ‘C’ and ‘I’ were used to calculate the carrier-to-interference ratio at the chosen frequency offset105.
A9.37 The 1 kHz audio tone required to modulate the microphone transmitter was supplied via a tone generator and speakers. The microphone was operated inside a microwave screened room to isolate it from the receiver and from any unwanted external signals.
A9.38 We took the onset of interference to be the point at which SINAD dropped below 20 dB, measured using a SINAD meter. Listening tests revealed that audio quality can be impaired at SINAD levels higher than 20 dB. However, the point between the first perceptible interference and the SINAD reduction to 20 dB was often in the range of just one or two dB difference in interference. At SINAD levels below 20 dB the following effects were observed in the presence of interference:
105 Both C and I are measured within their operational bandwidths at their operating frequencies and therefore the more negative the C/I ratio the greater the resilience to interference the device has.
Radio microphone
Antenna Variable attenuator
Hybrid coupler
Receiver under test
SINAD meter
LTE source
Spectrum analyser
Speakers
Audio tone generator
Screened room
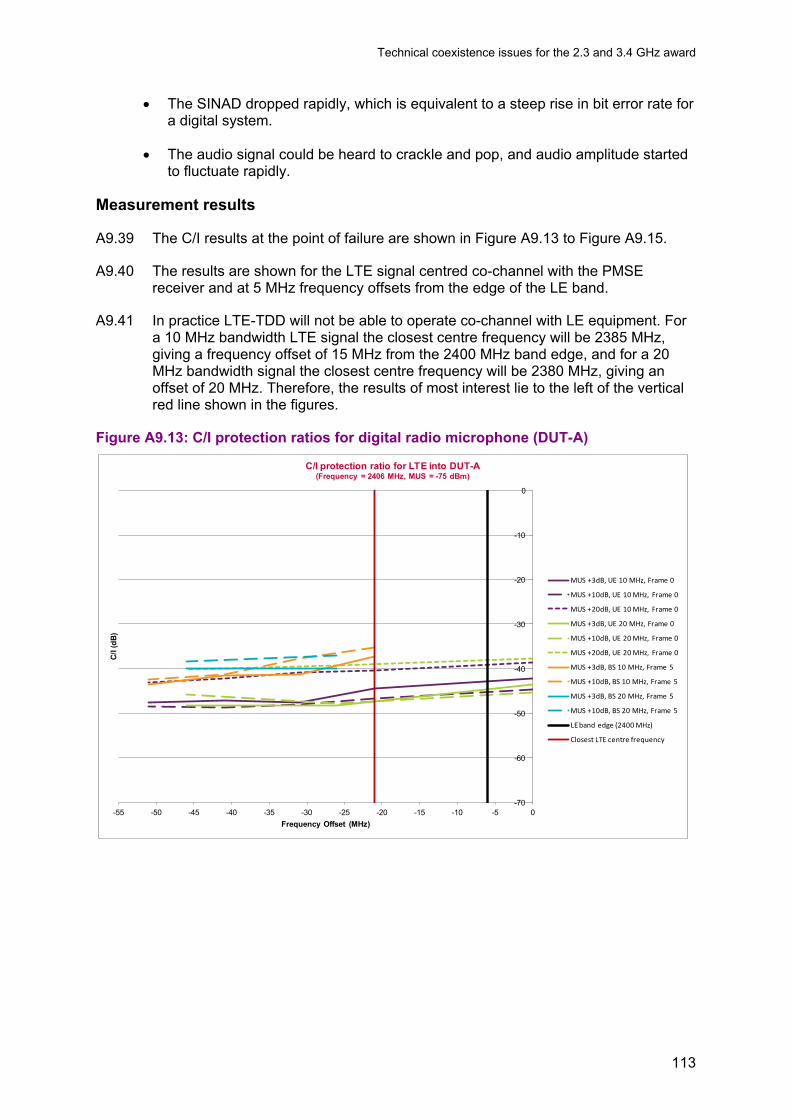
Technical coexistence issues for the 2.3 and 3.4 GHz award
113
• The SINAD dropped rapidly, which is equivalent to a steep rise in bit error rate for a digital system.
• The audio signal could be heard to crackle and pop, and audio amplitude started to fluctuate rapidly.
Measurement results
A9.39 The C/I results at the point of failure are shown in Figure A9.13 to Figure A9.15.
A9.40 The results are shown for the LTE signal centred co-channel with the PMSE receiver and at 5 MHz frequency offsets from the edge of the LE band.
A9.41 In practice LTE-TDD will not be able to operate co-channel with LE equipment. For a 10 MHz bandwidth LTE signal the closest centre frequency will be 2385 MHz, giving a frequency offset of 15 MHz from the 2400 MHz band edge, and for a 20 MHz bandwidth signal the closest centre frequency will be 2380 MHz, giving an offset of 20 MHz. Therefore, the results of most interest lie to the left of the vertical red line shown in the figures.
Figure A9.13: C/I protection ratios for digital radio microphone (DUT-A)
-70
-60
-50
-40
-30
-20
-10
0
-55 -50 -45 -40 -35 -30 -25 -20 -15 -10 -5 0
C/I (
dB)
Frequency Offset (MHz)
C/I protection ratio for LTE into DUT-A(Frequency = 2406 MHz, MUS = -75 dBm)
MUS +3dB, UE 10 MHz, Frame 0
MUS +10dB, UE 10 MHz, Frame 0
MUS +20dB, UE 10 MHz, Frame 0
MUS +3dB, UE 20 MHz, Frame 0
MUS +10dB, UE 20 MHz, Frame 0
MUS +20dB, UE 20 MHz, Frame 0
MUS +3dB, BS 10 MHz, Frame 5
MUS +10dB, BS 10 MHz, Frame 5
MUS +3dB, BS 20 MHz, Frame 5
MUS +10dB, BS 20 MHz, Frame 5
LE band edge (2400 MHz)
Closest LTE centre frequency
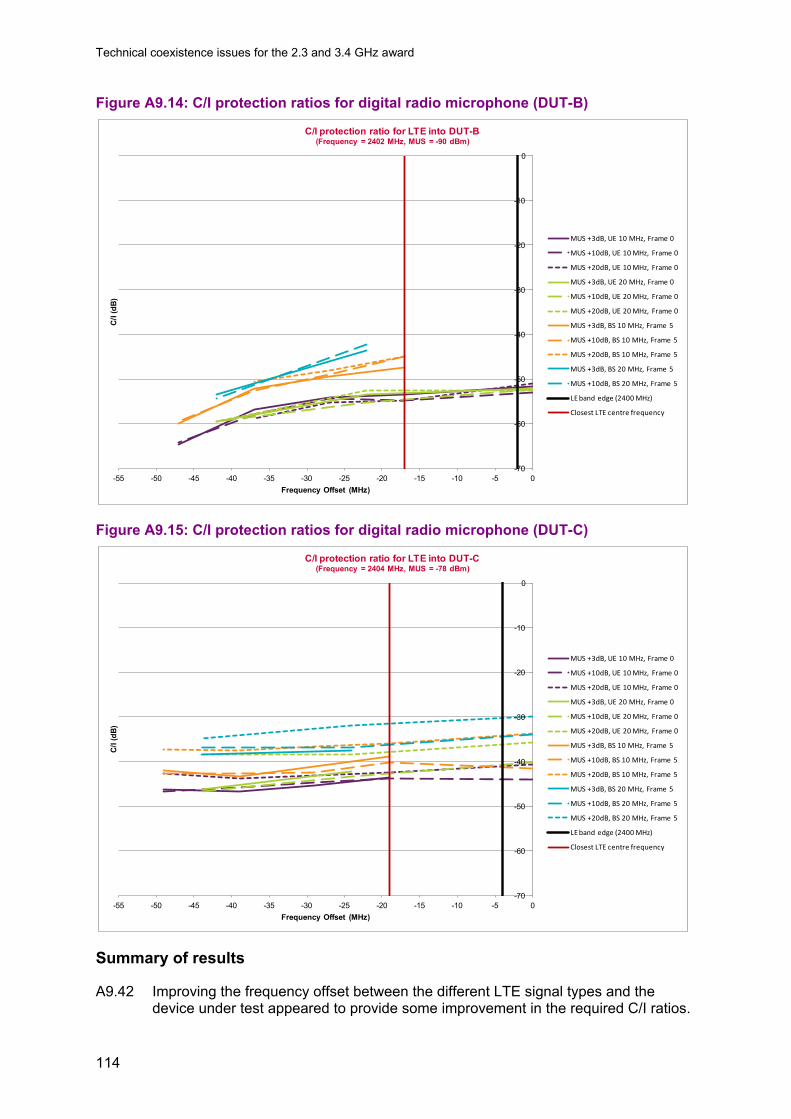
Technical coexistence issues for the 2.3 and 3.4 GHz award
114
Figure A9.14: C/I protection ratios for digital radio microphone (DUT-B)
Figure A9.15: C/I protection ratios for digital radio microphone (DUT-C)
Summary of results
A9.42 Improving the frequency offset between the different LTE signal types and the device under test appeared to provide some improvement in the required C/I ratios.
-70
-60
-50
-40
-30
-20
-10
0
-55 -50 -45 -40 -35 -30 -25 -20 -15 -10 -5 0
C/I (
dB)
Frequency Offset (MHz)
C/I protection ratio for LTE into DUT-B(Frequency = 2402 MHz, MUS = -90 dBm)
MUS +3dB, UE 10 MHz, Frame 0
MUS +10dB, UE 10 MHz, Frame 0
MUS +20dB, UE 10 MHz, Frame 0
MUS +3dB, UE 20 MHz, Frame 0
MUS +10dB, UE 20 MHz, Frame 0
MUS +20dB, UE 20 MHz, Frame 0
MUS +3dB, BS 10 MHz, Frame 5
MUS +10dB, BS 10 MHz, Frame 5
MUS +20dB, BS 10 MHz, Frame 5
MUS +3dB, BS 20 MHz, Frame 5
MUS +10dB, BS 20 MHz, Frame 5
LE band edge (2400 MHz)
Closest LTE centre frequency
-70
-60
-50
-40
-30
-20
-10
0
-55 -50 -45 -40 -35 -30 -25 -20 -15 -10 -5 0
C/I (
dB)
Frequency Offset (MHz)
C/I protection ratio for LTE into DUT-C(Frequency = 2404 MHz, MUS = -78 dBm)
MUS +3dB, UE 10 MHz, Frame 0
MUS +10dB, UE 10 MHz, Frame 0
MUS +20dB, UE 10 MHz, Frame 0
MUS +3dB, UE 20 MHz, Frame 0
MUS +10dB, UE 20 MHz, Frame 0
MUS +20dB, UE 20 MHz, Frame 0
MUS +3dB, BS 10 MHz, Frame 5
MUS +10dB, BS 10 MHz, Frame 5
MUS +20dB, BS 10 MHz, Frame 5
MUS +3dB, BS 20 MHz, Frame 5
MUS +10dB, BS 20 MHz, Frame 5
MUS +20dB, BS 20 MHz, Frame 5
LE band edge (2400 MHz)
Closest LTE centre frequency

Technical coexistence issues for the 2.3 and 3.4 GHz award
115
This is most noticeable for DUT-B, where the C/I improved by around 12 dB when frequency offset from the LE band was increased from 10 to 40 MHz. In practice the interference mechanism is likely to be some combination of the receivers’ adjacent channel selectivity and the LTE out of band emissions.
A9.43 Improving the signal strength of the wanted signal from 3 dB to 10 dB above MUS provided some improvement in the level of interference that could be tolerated. This suggests that reducing the range between the radio microphone transmitter and receiver can provide some mitigation against LTE interference. However strong levels of signal plus interference gave rise to a non-linear response in DUT-A and DUT-C suggesting receiver overload, as seen for the baby monitor and video sender equipment.
A9.44 In general, the LTE Base Station signals have more impact on the radio microphone receivers than the user equipment, most likely due to the higher duty cycle of the downlink compared to the uplink. Similarly to the baby monitor and video sender equipment, radio microphones are most likely to be used indoors so wall attenuation will help to mitigate against Base Station interference.
A9.45 All of the receivers tested appeared to be slightly more susceptible to wider bandwidth LTE signals (by up to 7 dB depending on the scenario and device). This is consistent with measurements commissioned by Ofcom on other LE devices.
A9.46 Assuming that the transmit power from user equipment is +3 dBm, and from base station equipment is +67 dBm for a 20 MHz channel, the following minimum coupling loss value can be derived for receivers operating at 3 dB and 20 dB above minimum usable sensitivity. The results are used in the separation distance models presented in annex 8.
Table A9.4: Minimum coupling loss calculations for 20 MHz LTE bandwidth
20 MHz LTE bandwidth MUS +3 dB
20 MHz LTE bandwidth
MUS +20 dB
DUT-A
DUT-B
DUT-C
DUT-A
DUT-B
DUT-C
LTE UE interference level (dBm) -24 -34 -33 -16 -18 -19
Min. coupling loss (dB) for LTE UE at +3 dBm
27 37 36 19 21 22
LTE base station interference level (dBm)
-29 -41 -35 -14 -28 -24
Min. coupling loss (dB) for LTE base station at +67 dBm
96 108 102 81 95 91

Technical coexistence issues for the 2.3 and 3.4 GHz award
116
Annex 10
10 The impact of spectrum release and sharing on spectrum for wireless cameras in the preferred band 2 to 4 GHz
A10.1 This annex provides more detail account of the analysis summarised in section 8 of the consultation about PMSE use of spectrum in and adjacent to the 2.3 and 3.4 GHz award bands.
A10.2 It is in two parts. The first part provides more detail about the effectiveness of mitigations for the loss of access to PMSE spectrum as a result of the award.
A10.3 The second part assesses the risks of on-going interference for both the main PMSE channels and for 'shoulder' channels. It includes consideration of our proposal to allow ongoing PMSE access to the 3.4 GHz band (and possibly the 2.3 GHz band) until the point at which new services are deployed.
Part 1 – Mitigation for PMSE
Mitigation opportunities and approach
A10.4 Our detailed analysis of the impact of a release of the 2.3 and 3.4 GHz bands on PMSE and the effectiveness of the mitigations outlined below has focussed on the 10 annual events with the greatest demand for spectrum. We have also assessed the effect of the release on a national event (the funeral of Baroness Margaret Thatcher). We note that from the pool of 19 × 10 MHz channels in the 2-4 GHz band 10 channels are available on a bookable basis and nine are allocated exclusively to news gathering. Therefore, any event requiring more than 10 bookable channels will need to employ some form of mitigation.
A10.5 We examined a range of potential mitigations to address the immediate impact of reduced access to PMSE spectrum. The aim is to provide continuity in the short term while recognising that these options need to be sustainable in the longer term. In summary, the mitigations examined are:
• More efficient use of PMSE channels assigned to news coverage, enabling more channels to be used for event coverage;
• Use of alternative PMSE bands, in particular 7 GHz spectrum;
• Temporary loan of non-PMSE spectrum;
• Validation of demand for frequencies against actual operational use.
A10.6 Each potential mitigating action has been assessed in isolation for its effectiveness in resolving the spectrum demand requirements of the event itself. For some events a single mitigation is sufficient to meet the demand. For the Grand Prix and London Marathon a combination of mitigations will be required in order to satisfy the
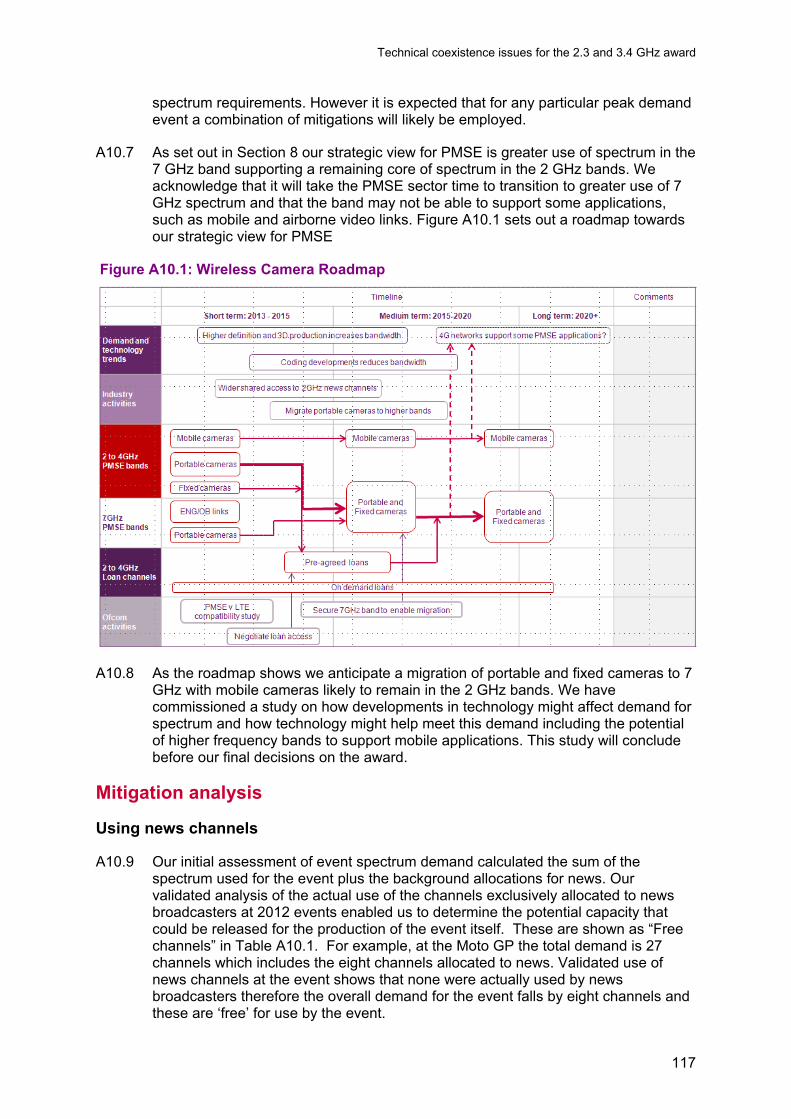
Technical coexistence issues for the 2.3 and 3.4 GHz award
117
spectrum requirements. However it is expected that for any particular peak demand event a combination of mitigations will likely be employed.
A10.7 As set out in Section 8 our strategic view for PMSE is greater use of spectrum in the 7 GHz band supporting a remaining core of spectrum in the 2 GHz bands. We acknowledge that it will take the PMSE sector time to transition to greater use of 7 GHz spectrum and that the band may not be able to support some applications, such as mobile and airborne video links. Figure A10.1 sets out a roadmap towards our strategic view for PMSE
Figure A10.1: Wireless Camera Roadmap
A10.8 As the roadmap shows we anticipate a migration of portable and fixed cameras to 7
GHz with mobile cameras likely to remain in the 2 GHz bands. We have commissioned a study on how developments in technology might affect demand for spectrum and how technology might help meet this demand including the potential of higher frequency bands to support mobile applications. This study will conclude before our final decisions on the award.
Mitigation analysis
Using news channels
A10.9 Our initial assessment of event spectrum demand calculated the sum of the spectrum used for the event plus the background allocations for news. Our validated analysis of the actual use of the channels exclusively allocated to news broadcasters at 2012 events enabled us to determine the potential capacity that could be released for the production of the event itself. These are shown as “Free channels” in Table A10.1. For example, at the Moto GP the total demand is 27 channels which includes the eight channels allocated to news. Validated use of news channels at the event shows that none were actually used by news broadcasters therefore the overall demand for the event falls by eight channels and these are ‘free’ for use by the event.

Technical coexistence issues for the 2.3 and 3.4 GHz award
118
A10.10 Our analysis took into account that some of these news channels were already released for use by others at the event. These are shown as “Released channels”. The remaining surplus (i.e. Free channels minus Released channels) is available for mitigation.
Table A10.1 Surplus news channels at annual events in 2012
Event Location Free channels (x 10MHz)
Released channels (x 10MHz)
Mitigation channels (x 10MHz)
F1 GP Silverstone 5 4 1 Moto GP Silverstone 8 0 8 London Marathon London 4 1 3 Open Championship Various 3 1 2 Boat Race London 5 0 5 Grand National Aintree 2 0 2 Great North Run South Shields 6 0 6 FA Cup Final Wembley 3 0 3 Cheltenham Festival Cheltenham 2 0 2 British Touring Cars Brands Hatch+ 8 0 8
A10.11 Applying this mitigation to the overall demand (including for news) for each event
we then determined a residual (or mitigated) demand and compared this with the 19 × 10 MHz channels available to determine the shortfall (Table A10.2).
Table A10.2: Mitigated demand v supply for annual events Event Location Demand
(x 10MHz) Mitigated demand (x10MHz)
Shortfall (x 10MHz)
F1 GP Silverstone 48 47 28 Moto GP Silverstone 27 19 0 London Marathon London 27 24 5 Open Championship Various 26 24 5 Boat Race London 26 21 2 Grand National Aintree 25 23 4 Great North Run South Shields 22 16 -3 FA Cup Final Wembley 22 19 0 Cheltenham Festival Cheltenham 20 18 -1 British Touring Cars Brands Hatch+ 16 8 -11
A10.12 For the case of a typical national occasion, as expected, we found full use of the channels allocated to news broadcasters and consequently there was no scope to mitigate the overall demand by releasing news channels. This is reflected in Table A10.3.
Table A10.3: Mitigated demand v supply for a national occasion Event Location Demand
(x 10MHz) Mitigated demand (x 10MHz)
Shortfall (x 10MHz)
Funeral of Lady Margaret Thatcher London 24 24 5

Technical coexistence issues for the 2.3 and 3.4 GHz award
119
Using 7 GHz band
A10.13 We reviewed opportunities to use alternative bands already allocated for PMSE. We discounted the legacy allocations at 5 GHz as, like 2.4 GHz, these are now well used by licence exempt applications and not considered suitable for the quality of service required for live broadcast cameras. The best available candidate bands are at 7 GHz. Up to 26 channels are readily available in the bands 7110-7250 MHz and 7300-7425 MHz.
A10.14 For the four events that we noted as having the greatest potential to benefit from migration to 7 GHz we have identified the total residual demand for wireless cameras in the band 2- 4 GHz. This residual (or mitigated) demand consists of three elements: firstly the requirements for mobile and airborne cameras; secondly the returned demand that could not be accommodated within the available capacity at 7 GHz; thirdly, the news demand at the event or locally.
A10.15 This mitigated total demand is then compared with the available spectrum supply of 19 x 10 MHz channels to determine the shortfall (Table A10.4).
Table A10.4: Mitigated demand v supply for annual events Event Location Mobile &
airborne (x 10MHz)
Returned demand (x 10MHz)
News demand (x10MHz)
Mitigated total
demand (x 10MHz)
Shortfall (x 10MHz)
F1 GP Silverstone 13 15 3 31 12 Moto GP Silverstone 14 0 8 22 3 London Marathon London 17 0 9 26 7
FA Cup Final Wembley 1 0 9 10 -9
A10.16 In the case of the typical national occasion, we found that there was scope to off-
load some of the deployed wireless cameras to higher bands. But with re-use of these same frequencies along the route for other purposes it is not straightforward to translate this into a quantitative analysis of a reduced demand as we have done for the annual events. To determine the reduced demand it would need the whole event to be re-planned in detail with the cooperation of multiple stakeholders. This major retrospective exercise has not been possible but planning for future national events will consider the option to use higher bands where possible.
Borrowing spectrum
A10.17 Within the 1950-2700 MHz range, we identified a total of nine 10 MHz channels that could potentially be available for loan to PMSE. Five of these channels are in the bands allocated to the Mobile Satellite Service 1980-2010 and 2170-2200 MHz and a further four are in Government spectrum neighbouring the band identified for release at 2.3 GHz
A10.18 Loan channels currently adjacent to mobile services - or channels that will be adjacent to new mobile services after the award - have been excluded from our analysis as these have been considered ‘unusable’ due to adjacent channel interference.
A10.19 The five channels in the mobile satellite bands were included in the spectrum available to PMSE for The London 2012 Games. They have also been successfully

Technical coexistence issues for the 2.3 and 3.4 GHz award
120
borrowed for use by PMSE in support of annual events such as the F1 British Grand Prix.
A10.20 The four channels identified at 2.3 GHz are currently used for various military and other Government uses. These channels have been previously loaned to PMSE to supplement the spectrum demand at events, but this band is also used at some events for non-PMSE uses. We therefore consider that it would be unrealistic to assume that all four channels could be sourced for PMSE. We believe that it is reasonable to assume that perhaps two of the four channels might typically be available for PMSE use.
A10.21 Overall, we conclude that up to seven channels could potentially be available for temporary loan to PMSE. Our analysis of mitigated demand versus supply is shown in Table A10.5.
Table A10.5: Mitigated demand v supply for annual events Event Location Demand
(x 10MHz) Loan
(x 10MHz) Mitigated demand (x10MHz)
Shortfall (x 10MHz)
F1 GP Silverstone 48 7 41 22 Moto GP Silverstone 27 7 20 1 London Marathon London 27 7 20 1 Open Championship Various 26 7 19 0 Boat Race London 26 7 19 0 Grand National Aintree 25 7 18 -1 Great North Run South Shields 22 6 16 -3 FA Cup Final Wembley 22 6 16 -3 Cheltenham Festival Cheltenham 20 4 16 -3 British Touring Cars Brands Hatch+ 16 0 16 -3
Validation of demand
A10.22 Our comparison of licensed demand at the F1 Grand Prix against the rights owner’s record of accredited wireless cameras for the 2012 event is shown in Table A10.6. This then determines the shortfall compared to the 19 channels available for PMSE.
Table A10.6: Validated demand v supply for F1 Grand Prix 2012 Event Location Demand
(x 10MHz) Validated demand (x 10MHz)
Shortfall (x 10MHz)
F1 Grand Prix Silverstone 48 42 23 A10.23 We were also able to monitor spectrum use at the 2013 F1 Grand Prix and compare
that against licence records.
Table A10.7: Monitored demand v supply for F1 Grand Prix 2013 Event Location Demand
(x 10MHz) Monitored occupancy
(x 10MHz)
Shortfall (x 10MHz)
F1 Grand Prix Silverstone 49 31 12

Technical coexistence issues for the 2.3 and 3.4 GHz award
121
Effectiveness of mitigations
Using news channels
A10.24 There is already some evidence of cooperative sharing of news channels being successfully brokered. These cases are formally captured in the licensing process as an additional assignment issued by the PMSE spectrum manager. There were also reports by news broadcasters of loans of their channels to sister sports organisations for event coverage. In these cases there is no formal record of the transaction as the spectrum was not released to Arqiva PMSE for re-licensing.
A10.25 Whilst our analysis indicates that there is spare capacity within the allocations to news broadcasters at all events, as illustrated above, it is not clear where this apparent spare capacity may actually be less than shown, due to informal loan transactions.
A10.26 It emerged from our work that the opportunity for more efficient use of the available PMSE pool of spectrum is perhaps less around formal release and re-licensing and more around detailed coordination and cooperation at events - including timesharing of news use with aspects of the event production; use of lower power; or careful siting of operations to enable coexistence.
A10.27 With a reduced overall pool of spectrum for PMSE, the current allocations to news broadcasters will take an even more significant share. We believe that it will be essential to make the best possible use of the available PMSE spectrum and that the current arrangements may not provide long term effective mitigation for the spectrum shortfall at high profile events. Ofcom plans to review the administrative arrangements for PMSE licensing as part of our forthcoming PMSE Review and will consider whether changes are needed to improve certainty in this area.
Using 7 GHz band
A10.28 It emerged from our stakeholder engagement that there is currently a very limited holding of wireless camera equipment at 7 GHz amongst UK programme makers and hirers, although there are 7 GHz options available from wireless camera manufacturers. Stakeholders indicated a lead time for the acquisition of 7 GHz equipment of between 6 weeks and 6 months.
A10.29 Whilst the host broadcaster for the F1 Grand Prix has adopted 7 GHz for some of its portable camera requirements there is significant uncertainty amongst some industry professionals that the 7 GHz band is an effective substitute for 2 GHz in many operational situations. Furthermore, stakeholders consistently observe that security of tenure at 7 GHz is vital to promote the necessary investment in new equipment. We believe that a period of at least 5 years would be required to allow for procurement and recovery of costs. PMSE use in 7 GHz is secure on the basis set out in our 2010 Statement106 i.e. a five year notice basis not to be triggered before 2016.
A10.30 In addition, the current spectrum availability within 7 GHz was geographically limited by legacy spectrum assignments to PMSE users intended for temporary point-to-point links to infrastructure. Users indicated that most of the infrastructure has now reached end-of-life and the spectrum assignments in key areas were voluntarily
106 http://stakeholders.ofcom.org.uk/consultations/bandmanager09/statement310810/

Technical coexistence issues for the 2.3 and 3.4 GHz award
122
surrendered in December 2013. These released channels are now available and have increased the amount of bookable spectrum in the 7 GHz band.
A10.31 Overall, it is clear that PMSE cannot immediately transition all their displaced demand to 7 GHz and that the timescale of the spectrum release could create a significant discontinuity. Other means of effective mitigation are needed to provide the necessary continuity for PMSE. Nevertheless the capacity at 7 GHz represents the expansion space needed by PMSE and we expect equipment suppliers and users to progressively migrate to it those PMSE applications for which it is suitable.
Borrowing spectrum
A10.32 The widespread availability of equipment operating within all or part of the band 1950-2700 GHz means that this spectrum can be readily used within the PMSE sector. Consequently, the temporary loan of additional spectrum within this band has the potential to be an effective mitigation at all of the events in our study. With 19 channels available to PMSE an additional loan of up to seven channels would enable the current demand to be met at all of the events (assuming the release of the news channels for the event) except for the F1 Grand Prix, Moto GP and London Marathon - although the remaining shortfall at Moto GP and London Marathon is just one channel.
A10.33 It is clear from our analysis that the immediate impact of a reduced pool of spectrum for PMSE may mean that the core broadcast requirement of high profile events may no longer be able to be supported from the permanent PMSE pool of spectrum alone. Consequently, more events will become dependent on borrowed spectrum in the medium term until other mitigations such as migrating to other bands are feasible.
A10.34 Future access to these loan channels cannot be guaranteed in the long term as there is potential for these bands to be reallocated to services with which PMSE will likely not be able to share e.g. to new broadband mobile services. However, we do not expect to see such changes within the medium term (3-5 years) and anticipate that current levels of access will continue until such time as any change of allocation is implemented. We therefore see these loan channels as providing a valuable interim mitigation for the release of the 2.3 and 3.4 GHz bands to allow users time to migrate to 7 GHz.
A10.35 PMSE users have told us that this uncertainty over spectrum availability is problematic for them in meeting their contractual commitments. We understand that assured access is important and, while we cannot ensure enduring access to these loan channels, we are exploring means to secure ongoing access for specific events while the loan opportunities remain.
Validation of demand
A10.36 Our analysis indicates that the spectrum demand for the 2012 F1 Grand Prix derived from licensing records appeared to exceed the actual operational requirement - according to the broadcast rights owner’s records of accredited wireless cameras and other accredited video links.
A10.37 Further, our spectrum monitoring at 2013 F1 Grand Prix also indicates that the spectrum demand based on licensing records appears to exceed the operational

Technical coexistence issues for the 2.3 and 3.4 GHz award
123
deployment. In this case the licensing excess was greater than we found from our administrative analysis for the 2012 Grand Prix. For practical reasons we cannot be certain that our monitoring captured all activity, but we are sufficiently confident in the results to believe that they support our earlier administrative analysis that the actual spectrum requirement is at least 10% less than the licensed demand.
Combined mitigation
A10.38 As set out in Section 8, for the four events with the highest total demand, we have found that a single mitigation approach is not sufficient to meet the spectrum requirement. In these cases, a combination of our suggested mitigation approaches is required.
A10.39 For the most PMSE demanding annual event, the F1 Grand Prix, the overall demand from the pool of permanent PMSE spectrum in the band 2–4 GHz is successively reduced as different mitigations are applied together - from 48 × 10 MHz to 16 × 10 MHz i.e. to below the figure of 19 channels available. The effectiveness of combined mitigation for MotoGP, London Marathon and the Open Golf championship are also illustrated in the Table A10.8. The table also summarises the effectiveness of combined mitigation and compares the mitigated demand against the future spectrum supply.
A10.40 Our analysis indicates that a combined mitigation approach is effective in meeting the current demand for those events where we determined that a single mitigation was not sufficient. If we exclude use of the seven loan channels identified under “borrowing spectrum” (as access to these channels cannot be guaranteed in the long term) the analysis shows that the mitigated demand for both F1 and the London Marathon exceeds the 19 channels available.
A10.41 Formula 1 Management say they are confident that they would be able to maintain the production levels of the Grand Prix in a more spectrum constrained environment, and indicated that it would be possible to implement operational changes in order to address potential reductions in spectrum availability. They suggested, for example, as some pit lane cameras are not used during the race, and not all on-board cameras need to be switched on before or after the race, it may be possible to share channels between pit lane and on-board cameras in order to reduce overall demand.
A10.42 In our discussion with SiS Live regarding the London Marathon, it was suggested that there could be potential for more use of the 7 GHz band than is currently factored in to our analysis but technical limitations may prove challenging.
A10.43 In addition our analysis does not consider use of any PMSE channels adjacent to mobile services. Our licensing data shows, however, that these shoulder channels have been used and our study of LTE-TDD interference into PMSE Wireless Camera System presented later in this annex concludes that these shoulder channels can be used in some circumstances, for example return video feeds.
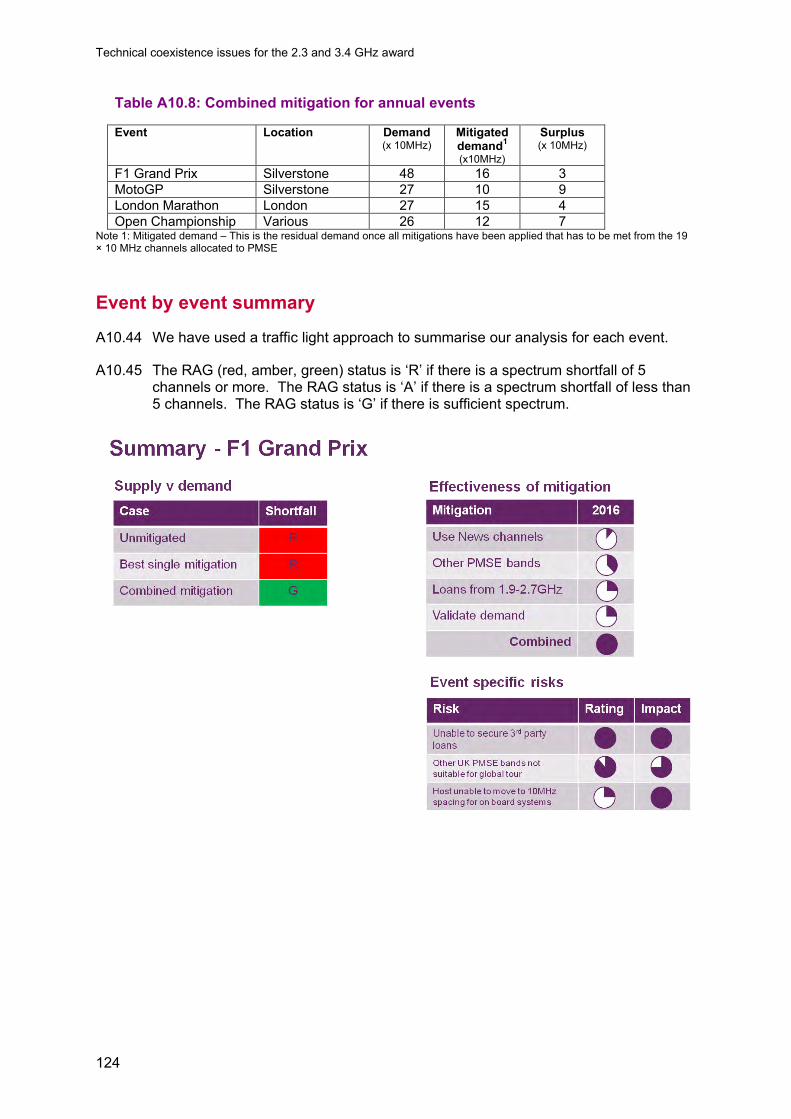
Technical coexistence issues for the 2.3 and 3.4 GHz award
124
Table A10.8: Combined mitigation for annual events Event Location Demand
(x 10MHz) Mitigated demand1
(x10MHz)
Surplus (x 10MHz)
F1 Grand Prix Silverstone 48 16 3 MotoGP Silverstone 27 10 9 London Marathon London 27 15 4 Open Championship Various 26 12 7
Note 1: Mitigated demand – This is the residual demand once all mitigations have been applied that has to be met from the 19 × 10 MHz channels allocated to PMSE
Event by event summary
A10.44 We have used a traffic light approach to summarise our analysis for each event.
A10.45 The RAG (red, amber, green) status is ‘R’ if there is a spectrum shortfall of 5 channels or more. The RAG status is ‘A’ if there is a spectrum shortfall of less than 5 channels. The RAG status is ‘G’ if there is sufficient spectrum.

Technical coexistence issues for the 2.3 and 3.4 GHz award
125

Technical coexistence issues for the 2.3 and 3.4 GHz award
126
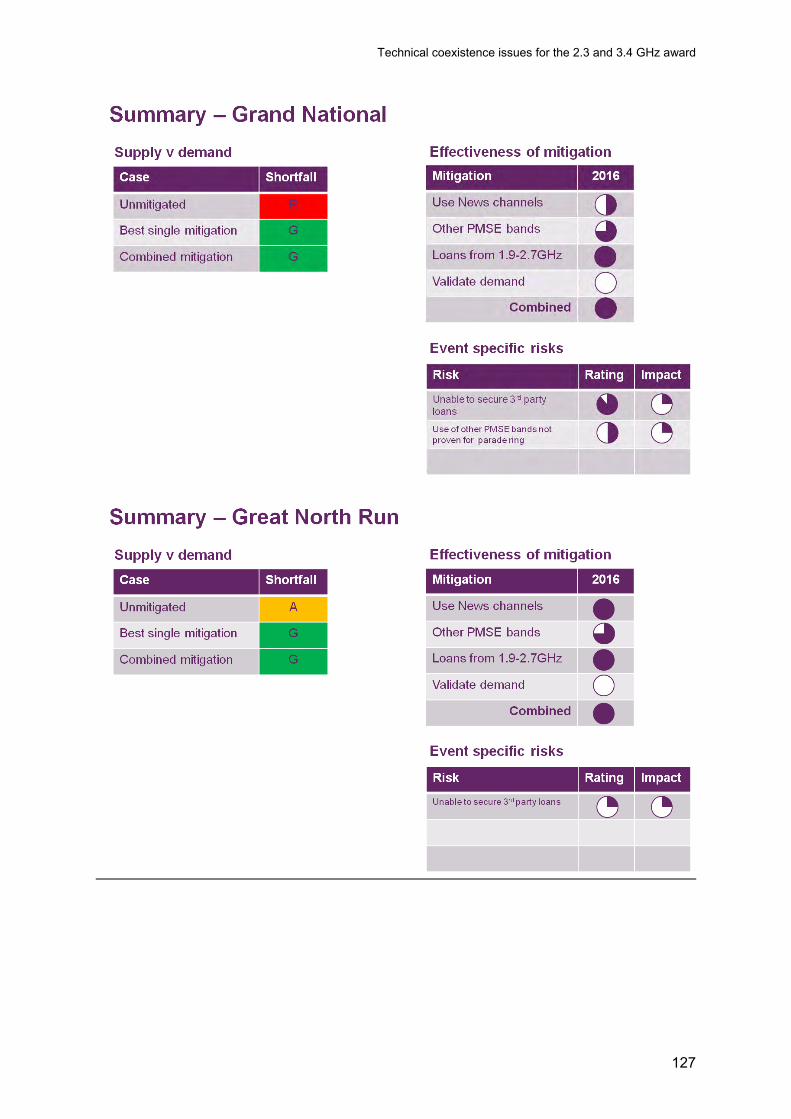
Technical coexistence issues for the 2.3 and 3.4 GHz award
127

Technical coexistence issues for the 2.3 and 3.4 GHz award
128

Technical coexistence issues for the 2.3 and 3.4 GHz award
129
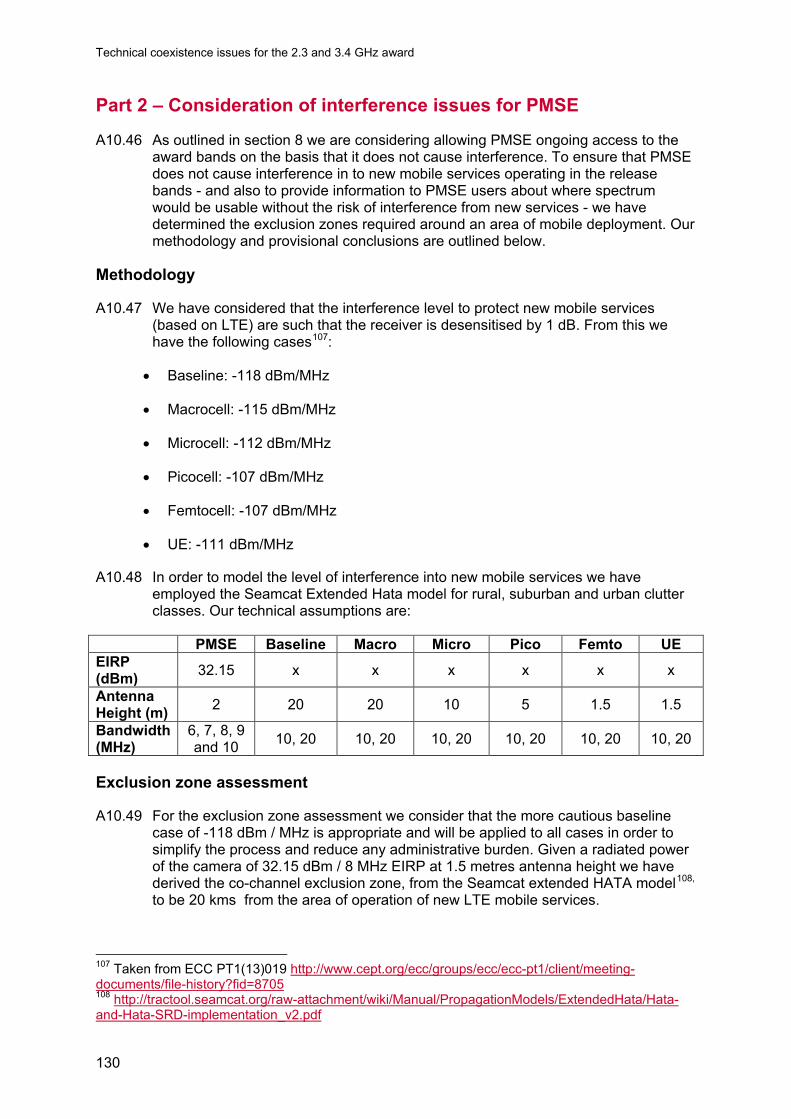
Technical coexistence issues for the 2.3 and 3.4 GHz award
130
Part 2 – Consideration of interference issues for PMSE
A10.46 As outlined in section 8 we are considering allowing PMSE ongoing access to the award bands on the basis that it does not cause interference. To ensure that PMSE does not cause interference in to new mobile services operating in the release bands - and also to provide information to PMSE users about where spectrum would be usable without the risk of interference from new services - we have determined the exclusion zones required around an area of mobile deployment. Our methodology and provisional conclusions are outlined below.
Methodology
A10.47 We have considered that the interference level to protect new mobile services (based on LTE) are such that the receiver is desensitised by 1 dB. From this we have the following cases107:
• Baseline: -118 dBm/MHz
• Macrocell: -115 dBm/MHz
• Microcell: -112 dBm/MHz
• Picocell: -107 dBm/MHz
• Femtocell: -107 dBm/MHz
• UE: -111 dBm/MHz
A10.48 In order to model the level of interference into new mobile services we have employed the Seamcat Extended Hata model for rural, suburban and urban clutter classes. Our technical assumptions are:
PMSE Baseline Macro Micro Pico Femto UE EIRP (dBm) 32.15 x x x x x x
Antenna Height (m) 2 20 20 10 5 1.5 1.5
Bandwidth (MHz)
6, 7, 8, 9 and 10 10, 20 10, 20 10, 20 10, 20 10, 20 10, 20
Exclusion zone assessment
A10.49 For the exclusion zone assessment we consider that the more cautious baseline case of -118 dBm / MHz is appropriate and will be applied to all cases in order to simplify the process and reduce any administrative burden. Given a radiated power of the camera of 32.15 dBm / 8 MHz EIRP at 1.5 metres antenna height we have derived the co-channel exclusion zone, from the Seamcat extended HATA model108, to be 20 kms from the area of operation of new LTE mobile services.
107 Taken from ECC PT1(13)019 http://www.cept.org/ecc/groups/ecc/ecc-pt1/client/meeting-documents/file-history?fid=8705 108 http://tractool.seamcat.org/raw-attachment/wiki/Manual/PropagationModels/ExtendedHata/Hata-and-Hata-SRD-implementation_v2.pdf

Technical coexistence issues for the 2.3 and 3.4 GHz award
131
A10.50 For the adjacent channel condition we considered the out of band power from the PMSE wireless camera in to new mobile services in the adjacent channel. Our analysis showed that small exclusion zones would be required to protect LTE services. However, given that our proposal to allow continued access to the release bands is dependent on location information on network roll out which is likely to be presented as general areas rather than detailed, accurate information we do not propose to implement restrictions on adjacent PMSE use.
LTE-TDD interference into PMSE Wireless Camera System
A10.51 In our analysis of spectrum availability and demand we have not considered the channels adjacent to, or which could potentially become adjacent to, mobile services as usable. This conclusion is based on the assumption that the utility of these ‘shoulder’ channels would be limited due to adjacent channel interference from new mobile services.
A10.52 The main candidate technology for the 2350-2390 MHz band and for the band above 3410 MHz is Time Division Duplex (TDD) Long Term Evolution (LTE) operating with 10 MHz or 20 MHz channel bandwidths. In order to inform our understanding of the potential for interference into PMSE we have undertaken a short measurement study to assess the potential for interference into typical wireless camera equipment available in the UK broadcasting industry. The outcome of this study is presented below.
Equipment under test
A10.53 This report presents the results of a short measurement study to evaluate the potential for interference from LTE-TDD LTE into a representative wireless camera device provided by a leading broadcasting manufacturer, based on equipment readily available on the UK market at the time of the study.
A10.54 The equipment selected for testing consists of three parts: a wireless standard-definition (SD)/high-definition (HD) transmitter, down-converters with diversity option, and a high performance receiver.
A10.55 The whole equipment has flexible settings for both the transmitter and receiver. Table A10.9 below summarises four different configurations adopted in our testing. To simplify the testing, the diversity function was disabled so that only a single down converter was available at the receiver end. In Table A10.9 the sensitivity level of the receiver is measured separately with and without a channel filter whose centre frequency is 2395 MHz109.
A10.56 For operational reasons, a wide block filter which may cover several channels (up to 100 MHz) is often deployed by PMSE users as an alternative to a single channel filter. A channel filter was used in these tests for practical reasons but is believed to be representative of the band-edge roll-off of a typical block filter. The filter provides additional rejection of out of band spectral emissions from devices operating in adjacent frequency bands. The filter response of the channel filter is depicted in Figure A10.2, which also illustrates the effectiveness of the channel filter by adding an LTE base station signal with 20 MHz bandwidth centred at 2380 MHz as the adjacent channel interference to the wireless camera system.
109 Whilst we tested at 2395 MHz we also consider that our results will be applicable to other ‘shoulder’ channels adjacent to 3G or 4G mobile transmissions.
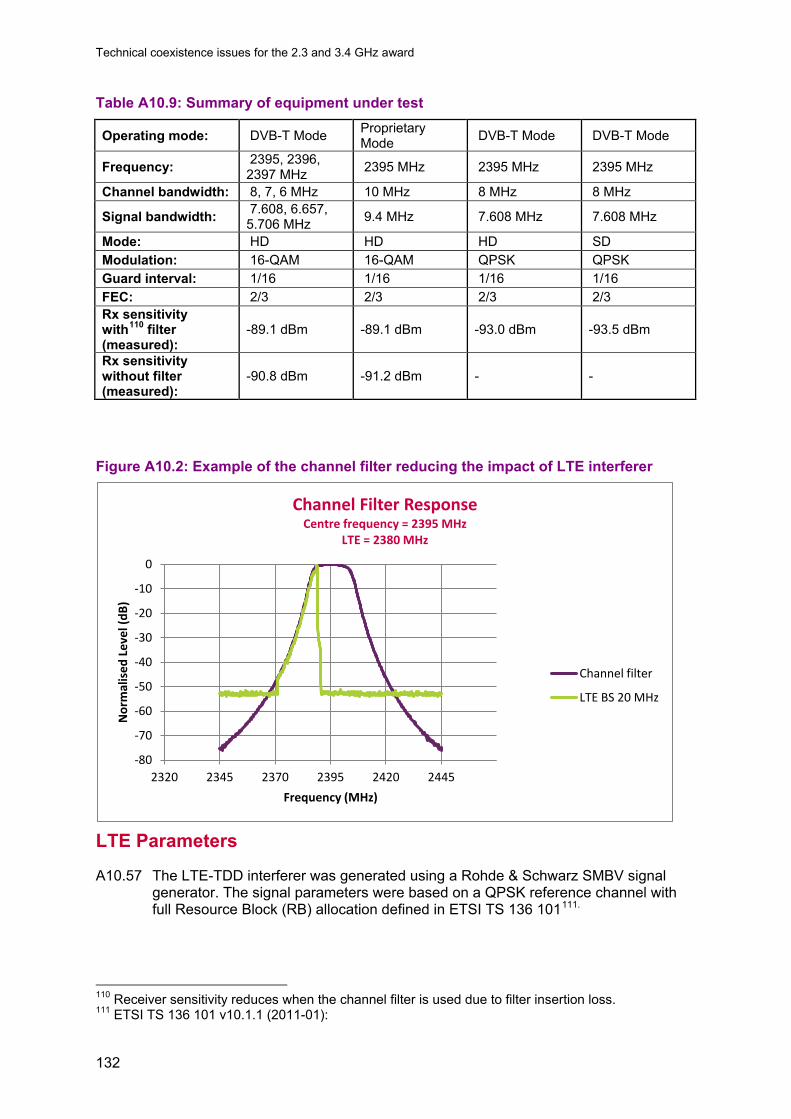
Technical coexistence issues for the 2.3 and 3.4 GHz award
132
Table A10.9: Summary of equipment under test
Operating mode: DVB-T Mode Proprietary Mode DVB-T Mode DVB-T Mode
Frequency: 2395, 2396, 2397 MHz 2395 MHz 2395 MHz 2395 MHz
Channel bandwidth: 8, 7, 6 MHz 10 MHz 8 MHz 8 MHz
Signal bandwidth: 7.608, 6.657, 5.706 MHz 9.4 MHz 7.608 MHz 7.608 MHz
Mode: HD HD HD SD Modulation: 16-QAM 16-QAM QPSK QPSK Guard interval: 1/16 1/16 1/16 1/16 FEC: 2/3 2/3 2/3 2/3 Rx sensitivity with110 filter (measured):
-89.1 dBm -89.1 dBm -93.0 dBm -93.5 dBm
Rx sensitivity without filter (measured):
-90.8 dBm -91.2 dBm - -
Figure A10.2: Example of the channel filter reducing the impact of LTE interferer
LTE Parameters
A10.57 The LTE-TDD interferer was generated using a Rohde & Schwarz SMBV signal generator. The signal parameters were based on a QPSK reference channel with full Resource Block (RB) allocation defined in ETSI TS 136 101111.
110 Receiver sensitivity reduces when the channel filter is used due to filter insertion loss. 111 ETSI TS 136 101 v10.1.1 (2011-01):
-80
-70
-60
-50
-40
-30
-20
-10
0
2320 2345 2370 2395 2420 2445
Nor
mal
ised
Lev
el (d
B)
Frequency (MHz)
Channel Filter Response Centre frequency = 2395 MHz
LTE = 2380 MHz
Channel filter
LTE BS 20 MHz

Technical coexistence issues for the 2.3 and 3.4 GHz award
133
Test Methodology
Test setup
A10.58 The generic test setup for conductive measurements is shown in the figure below.
Figure A10.3: Conductive test setup
A10.59 For simplicity, we used the test card generated by the transmitter (DUT Tx) rather
than a live camera picture so that the camera in Figure A10.3 was optional in this study. The wanted signal level at DUT Rx was controlled by a variable attenuator and the diversity function on the receiver was disabled.
A10.60 The channel filter is optional depending on the required testing scenario. To identify the failure criteria, an LED monitor was used to view the test pattern at the output of the receiver as well as a laptop connected to the receiver in order to view technical statistics such as modulation error ratio (MER), bit error rate (BER) or the number of packet errors.
Failure criteria
A10.61 Picture failure in a digital system is the point at which there is noticeable degradation to the received video stream that is an effect of the unwanted signal. This may either be: jumping in the video stream, pixilation of the image or complete picture breakup. For the purpose of this project the failure point was taken to be the point at which any interference was observed on the wanted video stream (it may still be possible to view the wanted image but a degradation to the video quality is observed). Within the study, the failure point was determined based on the following criteria:
i) Subjective criterion – the picture quality was degraded against interference free operation. An example of an interference free image and visible interference is shown in Figure A10.4;
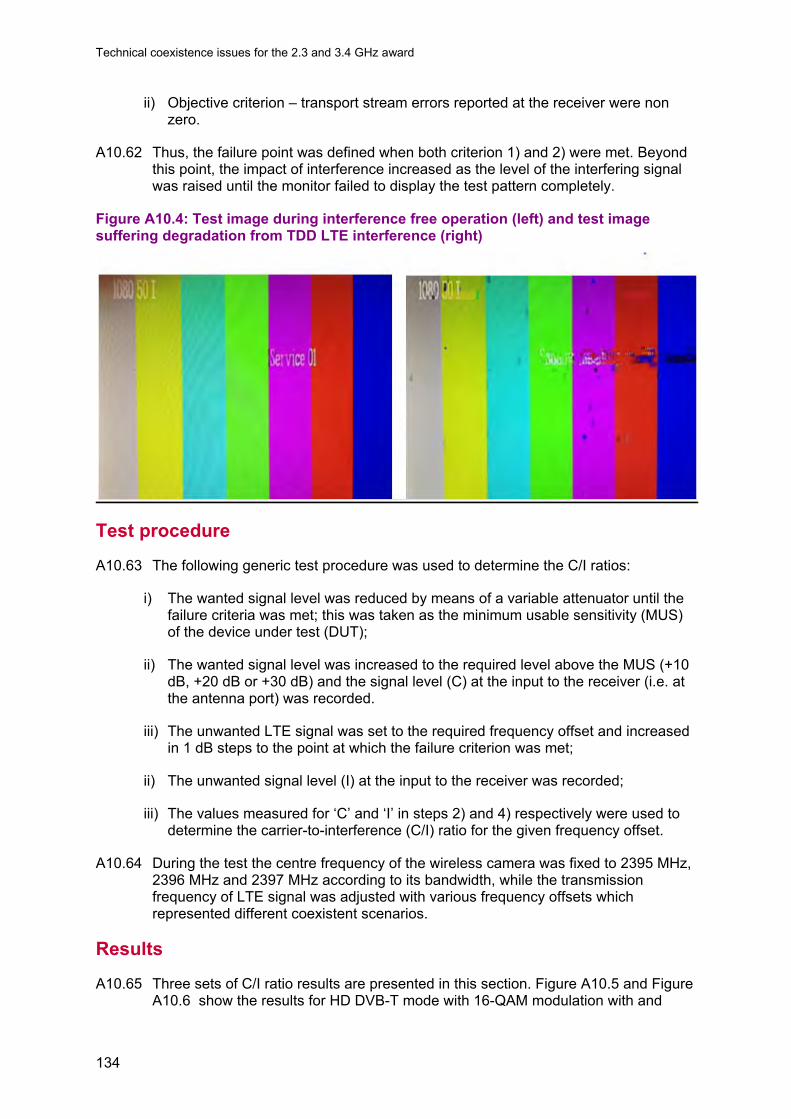
Technical coexistence issues for the 2.3 and 3.4 GHz award
134
ii) Objective criterion – transport stream errors reported at the receiver were non zero.
A10.62 Thus, the failure point was defined when both criterion 1) and 2) were met. Beyond this point, the impact of interference increased as the level of the interfering signal was raised until the monitor failed to display the test pattern completely.
Figure A10.4: Test image during interference free operation (left) and test image suffering degradation from TDD LTE interference (right)
Test procedure
A10.63 The following generic test procedure was used to determine the C/I ratios:
i) The wanted signal level was reduced by means of a variable attenuator until the failure criteria was met; this was taken as the minimum usable sensitivity (MUS) of the device under test (DUT);
ii) The wanted signal level was increased to the required level above the MUS (+10 dB, +20 dB or +30 dB) and the signal level (C) at the input to the receiver (i.e. at the antenna port) was recorded.
iii) The unwanted LTE signal was set to the required frequency offset and increased in 1 dB steps to the point at which the failure criterion was met;
ii) The unwanted signal level (I) at the input to the receiver was recorded;
iii) The values measured for ‘C’ and ‘I’ in steps 2) and 4) respectively were used to determine the carrier-to-interference (C/I) ratio for the given frequency offset.
A10.64 During the test the centre frequency of the wireless camera was fixed to 2395 MHz, 2396 MHz and 2397 MHz according to its bandwidth, while the transmission frequency of LTE signal was adjusted with various frequency offsets which represented different coexistent scenarios.
Results
A10.65 Three sets of C/I ratio results are presented in this section. Figure A10.5 and Figure A10.6 show the results for HD DVB-T mode with 16-QAM modulation with and

Technical coexistence issues for the 2.3 and 3.4 GHz award
135
without a channel filter. Results for 6 and 7 MHz PMSE channels and 8 MHz channels with QPSK modulation have slightly better protection (by a few dB). Figure A10.7 and Figure A10.8 give the result for the 10 MHz HD proprietary mode
A10.66 For each set of testing, the receiver operated at 10, 20 and 30 dB above the measured MUS. The LTE interferer was represented by either BS or UE signal with 10 and 20 MHz bandwidth, respectively. Note that in practice TDD LTE will not be able to operate co-channel with the wireless camera equipment. Thus, for a 10 MHz bandwidth LTE signal the closest centre frequency is 2385 MHz giving a frequency offset of 10 MHz.
A10.67 Based on the testing results, the use of a channel filter would significantly improve the C/I ratio for both DVB-T and proprietary modes. Degradation of picture quality and transmission efficiency can also help to tolerate more interference.
A10.68 We also varied the centre frequency of a 6 MHz channel relative to the LTE signal as described in Table A10.10 with a channel filter present. The results suggest that moving further away from the LTE signal within the 10 MHz PMSE channel can give approximately 11dB of benefit. This may allow for these shoulder channels to be used for smaller bandwidth (6 MHz) channels and could perhaps be useful for return video for example.
Table A10.10: C/I results from using narrower bandwidth (6 MHz) of wireless camera (MUS +20 dB, first adjacent scenario) with channel filter and the shoulder channel
Centre frequency
of wireless camera
20 MHz BS 20 MHz UE 10 MHz BS 10 MHz UE
Unwanted level
(dBm)
C/I (dB)
Unwanted level
(dBm)
C/I (dB)
Unwanted level
(dBm)
C/I (dB)
Unwanted level
(dBm)
C/I (dB)
2393 MHz -16.8 -54.4 -17.7 -53.5 -21.5 -49.7 -20.5 -50.7
2397 MHz -28.2 -43 -28.8 -42.4 -32.9 -38.3 -31.7 -39.5

Technical coexistence issues for the 2.3 and 3.4 GHz award
136
Figure A10.5: C/I ratios for wireless camera system operating with HD DVB-T, 16-QAM, 8 MHz bandwidth but without channel filter
Figure A10.6: C/I ratios for wireless camera system operating with HD DVB-T, 16-QAM, 8 MHz bandwidth and channel filter
-60
-50
-40
-30
-20
-10
0
10
-55 -50 -45 -40 -35 -30 -25 -20 -15 -10 -5 0
C/I (
dB)
Frequency Offset (MHz)
C/I Protection Ratio for LTE into DUT-A without channel filterDVB-T 8 MHz, HD 1080i, 16 QAM
Frequency = 2395 MHz, MUS = -91 dBm
MUS +10dB, BS 20 MHz, Frame 5
MUS +20dB, BS 20 MHz, Frame 5
MUS +30dB, BS 20 MHz, Frame 5
MUS +10dB, UE 20 MHz, Frame 0
MUS +20dB, UE 20 MHz, Frame 0
MUS +30dB, UE 20 MHz, Frame 0
MUS +10dB, BS 10 MHz, Frame 5
MUS +20dB, BS 10 MHz, Frame 5
MUS +30dB, BS 10 MHz, Frame 5
MUS +10dB, UE 10 MHz, Frame 0
MUS +20dB, UE 10 MHz, Frame 0
MUS +30dB, UE 10 MHz, Frame 0
-60
-50
-40
-30
-20
-10
0
10
-55 -50 -45 -40 -35 -30 -25 -20 -15 -10 -5 0
C/I (
dB)
Frequency Offset (MHz)
C/I Protection Ratio for LTE into DUT-A with channel filterDVB-T 8 MHz, HD 1080i, 16 QAM
Frequency = 2395 MHz, MUS = -89 dBm
MUS +10dB, BS 20 MHz, Frame 5
MUS +20dB, BS 20 MHz, Frame 5
MUS +30dB, BS 20 MHz, Frame 5
MUS +10dB, UE 20 MHz, Frame 0
MUS +20dB, UE 20 MHz, Frame 0
MUS +30dB, UE 20 MHz, Frame 0
MUS +10dB, BS 10 MHz, Frame 5
MUS +20dB, BS 10 MHz, Frame 5
MUS +30dB, BS 10 MHz, Frame 5
MUS +10dB, UE 10 MHz, Frame 0
MUS +20dB, UE 10 MHz, Frame 0
MUS +30dB, UE 10 MHz, Frame 0

Technical coexistence issues for the 2.3 and 3.4 GHz award
137
Figure A10.7: C/I protection ratios for wireless camera system operating with HD proprietary mode, 16-QAM, 10 MHz bandwidth but without channel filter
Figure A10.8: C/I protection ratios for wireless camera system operating with HD proprietary mode, 16-QAM, 10 MHz bandwidth and channel filter
-60
-50
-40
-30
-20
-10
0
10
-55 -50 -45 -40 -35 -30 -25 -20 -15 -10 -5 0
C/I
(dB
)
Frequency Offset (MHz)
C/I Protection Ratio for LTE into DUT-A without channel filter Proprietary mode 10 MHz, HD 1080i, 16 QAM
Frequency = 2395 MHz, MUS = -91 dBm
MUS +10dB, BS 20 MHz, Frame 5
MUS +20dB, BS 20 MHz, Frame 5
MUS +30dB, BS 20 MHz, Frame 5
MUS +10dB, UE 20 MHz, Frame 0
MUS +20dB, UE 20 MHz, Frame 0
MUS +30dB, UE 20 MHz, Frame 0
MUS +10dB, BS 10 MHz, Frame 5
-60
-50
-40
-30
-20
-10
0
10
-55 -50 -45 -40 -35 -30 -25 -20 -15 -10 -5 0
C/I
(dB
)
Frequency Offset (MHz)
C/I Protection Ratio for LTE into DUT-A with channel filter Proprietary mode 10 MHz, HD 1080i, 16 QAM
Frequency = 2395 MHz, MUS = -89 dBm
MUS +10dB, BS 20 MHz, Frame 5
MUS +20dB, BS 20 MHz, Frame 5
MUS +30dB, BS 20 MHz, Frame 5
MUS +10dB, UE 20 MHz, Frame 0
MUS +20dB, UE 20 MHz, Frame 0
MUS +30dB, UE 20 MHz, Frame 0
MUS +10dB, BS 10 MHz, Frame 5
Technical coexistence issues for the 2.3 and 3.4 GHz award
138
Summary
A10.69 From the results in above it can be seen that:
i) The channel filter plays an important role to mitigate the LTE interference in particular as the frequency offset increases above 10 MHz (the adjacent +1 channel). It can remove all the interference when the LTE signal resides in the second adjacent channel. But in the first adjacent scenario a non-linear improvement of receiver was observed as its power level increased from MUS plus 10 dB, 20 dB and 30 dB, which was due to the blocking effect of the down-converter and the filtering behaviour of the channel filter;
ii) Under the scenario of 20 dB above MUS, HD DVB-T mode, 16-QAM modulation and 8 MHz channel bandwidth, the wireless camera receiver was able to tolerate LTE signal levels of between -36 dBm and -45 dBm, measured at the input to the receiver;
iii) Based on the measured results, the use of narrow bandwidths (6 or 7 MHz) moved away from the LTE channel edge allows the wireless camera system to tolerate 11dB higher interference levels.
iv) Utilising the more robust proprietary mode improves the receiver’s ability of tolerating interference. Moreover, the similar improvement was found when switching to SD mode or QPSK modulation;

Technical coexistence issues for the 2.3 and 3.4 GHz award
139
Annex 11
11 Satellite services
Introduction
A11.1 In this annex, we describe our approach to assessing the impact of LTE type emissions on satellite signal reception. We considered the following systems :-
• SR and SO - space research and space operations (2200 to 2290 MHz);
• C-band PES - permanent earth stations (3600 to 4200 MHz).
Our approach
A11.2 We have considered the potential impact on the satellite systems noted above from base station emissions from LTE-TDD base stations. We have used emission masks proposed in section 13, the existing UK Broadband licence conditions and some examples of measured LTE equipment.
A11.3 We consider that due to the low height and low power of LTE terminal equipment and the size and nature of satellite permanent earth stations (PESs) that LTE user equipment will have a negligible interference risk and need not be considered.
A11.4 We assessed the impact to these satellite systems by using a commercial software interference assessment simulation tool (Transfinite Visualyse). The tool was configured to use the LTE base station emission mask, the satellite earth station (ES) receiver signal bandwidths, together with other ES information, such as the antenna gain, height and elevation angles; the LTE base station parameters including antenna gain patterns, down-tilt and base station heights. We assessed the impact on different ES locations.
Space Operations, Space Research and Earth Exploration systems 2200 to 2290 MHz
A11.5 Space research (SRS), space operation (SOS) and earth exploration satellite (EESS) services receive transmissions from both low-orbiting and geostationary satellites. They operate with varying high gain antennas and down to very low elevation angles. Earth stations are located at several locations in the UK.
A11.6 SRS, SOS, and EESS Earth stations operating from 2200 to 2290 MHz are separated from the 2350-2390 MHz release band by 60 MHz. The separation to widely deployed 3G (UMTS) networks operating below 2170 MHz is only 30 MHz.
A11.7 In both these cases the spurious emissions limit of -30 dBm / MHz applies112, and therefore the probability of interference from the release band can be expected to
112 This is the same for LTE and UMTS, and is specified for LTE in 3GPP TS 36.104, v12.2.0, Evolved Universal Terrestrial Radio Access (E-UTRA); Base Station (BS) radio transmission and reception, Table 6.6.4.1.2.1-1: http://www.3gpp.org/DynaReport/36104.htm ,

Technical coexistence issues for the 2.3 and 3.4 GHz award
140
be similar to that from existing 3G deployments, and in practice is likely to be lower given that the frequency separation is larger.
A11.8 However, we have considered in more detail the impact of LTE on satellite receivers in the band 2200-2290 MHz, as SRS and SOS earth stations have very high gain antenna and very low noise figure receivers and therefore spurious emissions from LTE equipment may affect these systems.
C-band Earth stations (PES)
C-band PES frequency assignment distribution
A11.9 In the UK, we have the following distribution of PES frequency assignments at C-band (3600-4200 MHz). However we consider that the 3600-3700 MHz portion of this band is more likely to suffer interference than those ESs operating above 3700 MHz due to the lower frequency separation.
Figure A11.1: UK Distribution of PES frequency assignments
A11.10 From the PES database held by Ofcom, there are 107 different sites having C-band
frequency assignments. Of these, there are 24 sites with frequency assignments of less than 3700 MHz with about 125 different frequency assignments spread across them.
A11.11 Of these 24 sites, there are five sites that have assignments overlaying the transition region of the LTE emissions. These are sites where the protected C-band PES receiver’s centre frequency and emission bandwidth overlay the higher levels of the LTE out of band limits up to 3610 MHz (see below for details of the emission masks). However we are unaware of any PES that are actually using the 3600–3610 MHz spectrum in practice.
A11.12 The frequency distribution above does not preclude any potential new C-band assignment from using frequencies below 3700 MHz at any time in the future.
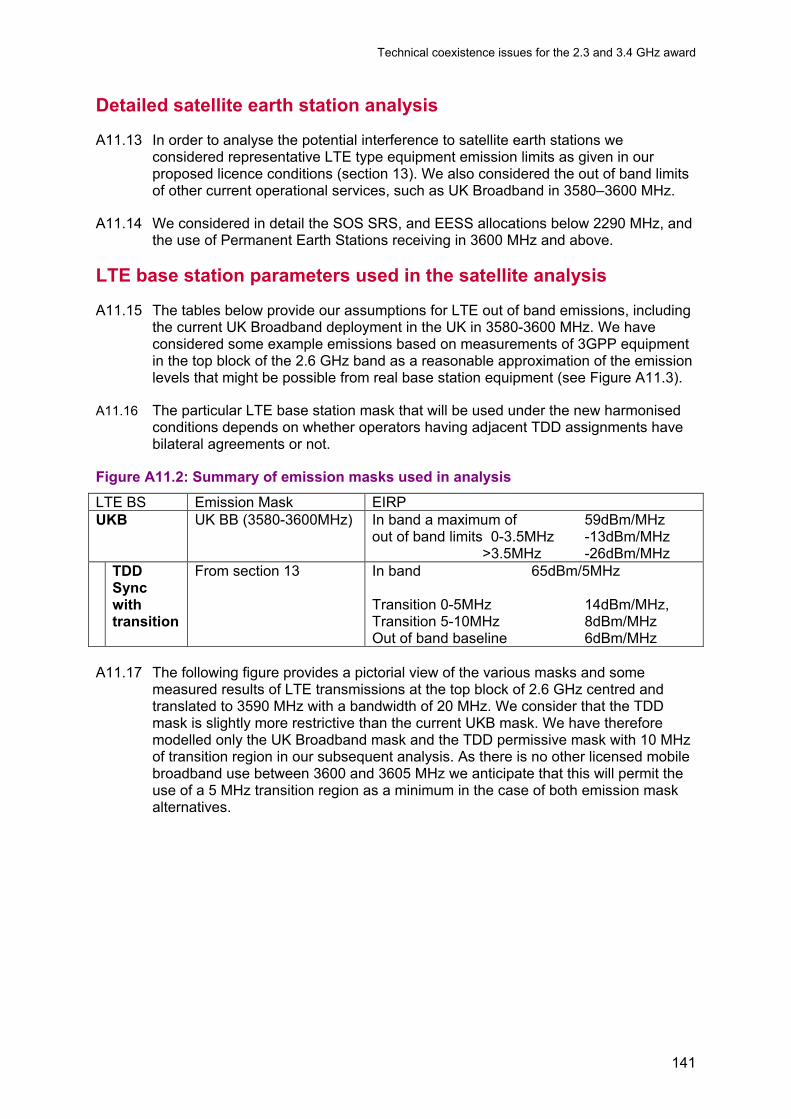
Technical coexistence issues for the 2.3 and 3.4 GHz award
141
Detailed satellite earth station analysis
A11.13 In order to analyse the potential interference to satellite earth stations we considered representative LTE type equipment emission limits as given in our proposed licence conditions (section 13). We also considered the out of band limits of other current operational services, such as UK Broadband in 3580–3600 MHz.
A11.14 We considered in detail the SOS SRS, and EESS allocations below 2290 MHz, and the use of Permanent Earth Stations receiving in 3600 MHz and above.
LTE base station parameters used in the satellite analysis
A11.15 The tables below provide our assumptions for LTE out of band emissions, including the current UK Broadband deployment in the UK in 3580-3600 MHz. We have considered some example emissions based on measurements of 3GPP equipment in the top block of the 2.6 GHz band as a reasonable approximation of the emission levels that might be possible from real base station equipment (see Figure A11.3).
A11.16 The particular LTE base station mask that will be used under the new harmonised conditions depends on whether operators having adjacent TDD assignments have bilateral agreements or not.
Figure A11.2: Summary of emission masks used in analysis LTE BS Emission Mask EIRP UKB UK BB (3580-3600MHz) In band a maximum of 59dBm/MHz
out of band limits 0-3.5MHz -13dBm/MHz >3.5MHz -26dBm/MHz
TDD Sync with transition
From section 13
In band 65dBm/5MHz Transition 0-5MHz 14dBm/MHz, Transition 5-10MHz 8dBm/MHz Out of band baseline 6dBm/MHz
A11.17 The following figure provides a pictorial view of the various masks and some
measured results of LTE transmissions at the top block of 2.6 GHz centred and translated to 3590 MHz with a bandwidth of 20 MHz. We consider that the TDD mask is slightly more restrictive than the current UKB mask. We have therefore modelled only the UK Broadband mask and the TDD permissive mask with 10 MHz of transition region in our subsequent analysis. As there is no other licensed mobile broadband use between 3600 and 3605 MHz we anticipate that this will permit the use of a 5 MHz transition region as a minimum in the case of both emission mask alternatives.

Technical coexistence issues for the 2.3 and 3.4 GHz award
142
Figure A11.3: UK Broadband mask and measured emissions
A11.18 The following table provides the remaining LTE base station parameters that we
consider in our analysis.
Figure A11.4: LTE base station parameters Parameter Value Unit Remarks
BS channel bandwidth 20 MHz
LTE Transmit power 61 (2.3 GHz band) 65 (3.5 GHz band)
dBm / 5 MHz
In any five MHz
BS antenna peak gain 18 dBi See antenna pattern described below
BS antenna down tilt -2 and -6 Degrees We used the off-axis gain variation for an 18dBi antenna of -2 and -6 degrees.
BS Height 20 & 30 Metres The mean base station height value for UK 3GPP systems is 20 metres.
A11.19 We based the antenna pattern on the theoretical radiation patterns taken from
3GPP TR 36.814113. In our analysis, we have modelled the LTE base station as having a sectorised antenna with 18 dBi gain. However we recognise that in practice there may be additional antenna discrimination achieved if the main beam is pointing away from the receiver or the transmit EIRP is lower than the maximum level we have modelled.
113 Ofcom 3G Coverage Obligation Verification Methodology, May 2012: http://stakeholders.ofcom.org.uk/binaries/consultations/2100-MHz-Third-Generation-Mobile/annexes/methodology.pdf
-80
-60
-40
-20
0
20
40
60
80
3560 3570 3580 3590 3600 3610 3620 3630 3640 3650
EIRP
, dBm
/ M
Hz
Frequency, MHz
Includes Antenna Gain of 18dBi 3GPP UKB and LTE measured data
UKB mask
3GPP
measured
EUTRA LTE 10MHz Transition
EUTRA LTE 5MHz Transition

Technical coexistence issues for the 2.3 and 3.4 GHz award
143
Figure A11.5: antenna modelling assumptions Parameter Assumption
Antenna pattern (horizontal)
Sectorised antenna were used (The following fixed antenna pattern was
used in the simulation)
Omni
( )
−= dBA
dBH 25,12min
2
3ϕϕϕ
dB3ϕ = 70 degrees Antenna pattern (vertical)
(For 3-sector cell sites with fixed antenna patterns)
3GPP TR36.814 ITU-R S.1336-2 (2.1 k=0.1)
( )
−−= dBA
dB
etiltV 20,12min
2
3θθθθ
dB3θ = 10 degrees
The parameter etiltθ is the electrical antenna down tilt.
Space Operations and Space Research systems
A11.20 For this scenario we used the combined values of the centre frequencies and the emission bandwidths of the listed SRS, SOS and EESS station characteristics and their protection limits in 2200 to 2290 MHz. We then considered two emission conditions: i) the characteristics of spurious emissions given in the standard for LTE ii) measurements taken at 2.6 GHz for LTE base stations. We translated these as a mask to assess the expected real practical effect at the 2290 MHz boundary.
A11.21 The LTE spurious emission limits are -12 dBm/MHz below 2290 MHz, including 18 dBi antenna gain). The practical and expected out of band/spurious emissions of LTE type equipment is significantly below the 3GPP limit in the band where SRS and SOS operate, due to the high frequency separation from the lower edge of the release band. The comparison enabled us to consider what will likely occur in practice.
Analysis
A11.22 We have the following examples of earth stations operating in the 2200-2290 MHz band taken from actual earth station parameters in the UK.

Technical coexistence issues for the 2.3 and 3.4 GHz award
144
Figure A11.6: Example site characteristics for six UK Space Operations, Space Research and Earth Exploration receive sites
SR1 SR2 and SR3 (Different locations)
SR 4
SR5 and SR6 out-of-band
Site Height (m) (AMSL) 59 86 125 Geostationary/Non Geostationary
Non Geostationary
Non Geostationary
Non Geostationary
Antenna Performance Pattern ITU-R Rec 465 ITU-R Rec 580 ITU-R Rec 465 Antenna Diameter (m) 3.7 5.5 12.2 Antenna Height (above ground level) (m)
4 4 14
Tx Antenna Gain, dBi 34.8 39 45.8 Tx Antenna beamwidth (deg) 3.46 1.84 0.9 Rx Antenna Gain, dBi 35.1 39 45.8 Rx Antenna Beamwidth (deg) 2.9 1.84 0.9 Antenna Azimuth (degrees) N/A N/A N/A Antenna Elevation (degrees) 4 4 4 Receiver System Noise Temperature, deg K 100 100 100
Centre Frequency of accessible bandwidth (MHz)
These range from 2225 to 2253 MHz;2207 to 2267 MHz and 2200 to 2290 MHz
Accessible bandwidth Emissions (kHz/MHz)
Ranges from 70 kHz to186 kHz and 5 to13 MHz
Criteria for Space Operations and Space Research assessment
A11.23 Recommends 2 of ITU-R Recommendation SA.1275 states that the following provisions are suitable to protect the SRS, SOS and EESS services from aggregate interference from emissions of mobile systems in the 2 200-2 290 MHz band:
• that the aggregate interference at the input terminals of the receiver in the earth station should not exceed −216 dB(W/Hz) for more than 0.1% of the time
A11.24 In ITU-R Recommendation SA 1154114 compatibility, the maximum interference levels at the earth station receivers depend on the service in operation and are in agreement with Appendix 7 to the Radio Regulations, Table 8b and Recommendation ITU-R SA.363115. These values and the corresponding minimum elevation angles Θr are as follows:
• Space operation: –184.0 dB(W/kHz), Θr >3°
• Space Research: –216.0 dB(W/Hz), Θr > 5°
114 ITU-R Recommendation SA.1154 - Provisions to protect the space research (SR), space operations (SO) and Earth exploration-satellite services (EESS) and to facilitate sharing with the mobile service in the 2025-2110 MHz and 2200-2290 MHz bands: http://www.itu.int/rec/R-REC-SA.1154/en 115 ITU-R Recommendation SA.363 - Space operation systems: http://www.itu.int/rec/R-REC-SA.363/en

Technical coexistence issues for the 2.3 and 3.4 GHz award
145
A11.25 These are for typical support of SOS and SRS missions, with antenna diameters between 5.5 metres and 15 metres in operation for general support up to and beyond the geostationary orbit.
A11.26 For earth stations with 100 K system noise temperature, we have a system noise level of or -208.6 dB(W/Hz). For I/N protection levels of -10 dB, we have system noise level of -218.6 dB(W/Hz). We use this value for the radio spectrum compatibility for long term interference at 2200-2290 MHz.
C-band earth stations (PES)
A11.27 In the following paragraphs we describe briefly the approach taken to assess the effect against earth stations closest in frequency to the band edge of 3600 MHz.
A11.28 We used the detailed characteristics of UK based PES and considered these against LTE emissions. We included in our assessment the local terrain profiles as this allowed an assessment of the size of any mitigation area required, and we used the actual elevation angle and antenna gains of those ES systems.
A11.29 We also considered two sensitivity options for C-band PES antenna elevation angle (around 6° and 30°) and base station heights of 20 and 30 metres.
A11.30 The PES station parameters for those assignments operating closest in frequency to 3600 MHz are given below. Five of these stations have the potential for LTE out of band signals to overlay their occupied bandwidth assuming that they operate over the entire bandwidth detailed in the relevant RSA or licence (which may not always be the case).
Figure A11.7: C-Band earth station parameters (frequencies < 3610 MHz)
PES ST1
ST2
ST3
ST4
ST6
ES Gain (dBi) , Beamwidth
51, 0.47
37.7, 2.4
37.7, 2.4
42.1, 1.09
49.6, 0.65
ES Antenna Diagram ITU-R S.580
ITU-R S.580
ITU-R S.580
ITU-R S.580
ITU-R RS.1813
ES Antenna Height (m) 10 1.5 1.5 4 5 Noise temperature (K) 90 90 90 90 90 Elevation angle (°) 9.7 31 7.6 5.8 29.6 Azimuth (°) 115 -178 111 114 167.5 Centre Frequency (MHz)
3610 3618 3618 3640 3625
Bandwidth (MHz) 5.63 36 36 80 50 A11.31 ST1-ST4 and ST6 were used for our main analysis.
A11.32 The analysis used emissions derived from the measured results of 2.6 GHz devices, translated to 3590 MHz centre frequency as shown in Figure 11.3.
Technical coexistence issues for the 2.3 and 3.4 GHz award
146
Criteria for C-band ES assessment
A11.33 The I/N criteria and methodology for the earth stations is taken from ITU-R SF.1006116 for I/N of -10 dB for 20% time for long term interference. For anomalous propagation conditions we used a short term interference value of 0.005% and an I/N of 0 dB. In both cases, the propagation model in ITU Recommendation P.452117 was used.
A11.34 We considered existing FSS ES based on those ES that are near adjacent in frequency to the release band for LTE base station, where there is the potential for out of band signals to locally exceed an I/N of -10dB. We consider the LTE base station emission masks as described above.
Scenario results
Space Operations and Space Research systems
A11.35 The results below are based on a 1 km grid for the terrain calculation, and the grid marker overlay is 0.2 degree latitude/longitude. The contour for I/N of -10 dB is outlined with the thick line (coloured red). The SRS and SOS stations operate to non-geostationary satellites and for these simulations we have chosen one azimuth direction to show the areas where I/N of -10 dB are exceeded. These ranges are essentially the required circular protection distances around those sites depending on the PES azimuth direction The line graph In Fig 11.8 indicates the emission mask used for the assessment of the LTE type of equipment and the receive mask of the Earth station receiver.
A11.36 In our assessment we considered two scenarios:
i) the proposed LTE licence conditions
ii) a scenario based on expected measured results of a LTE base station transmitter.
A11.37 For the first we have a range of 2 to 8 km for the distance for the -10 dB contour as the scenario considering the LTE spurious emissions. For the second we found no compatibility issues, when we considered the expected practical emission levels.
116 ITU-R Recommendation SF.1006 - Determination of the interference potential between earth stations of the fixed-satellite service and stations in the fixed service: http://www.itu.int/rec/R-REC-SF.1006/en 117 ITU-R Recommendation P.452 - Prediction procedure for the evaluation of interference between stations on the surface of the Earth at frequencies above about 0.1 GHz: http://www.itu.int/rec/R-REC-p.452/en

Technical coexistence issues for the 2.3 and 3.4 GHz award
147
Figure A11.8: Spurious Emission limits: -12 dBm per MHz assuming an 18 dBi antenna gain – Line ♦ = 10km range) 118
118 Grey vertical grid line are at 0.2 degrees separation

Technical coexistence issues for the 2.3 and 3.4 GHz award
148
Figure A11.9: Expected LTE practical emission levels13
Space Operations and Space Research Conclusions
A11.38 Filtering of the SOS earth station receiver against LTE spurious signals is not possible as these fall in-band for the SOS and SRS systems.
A11.39 If only considering the LTE spurious emissions limits from the standards - and not the practical situation of actual measurement from LTE type equipment - then interference to SRS and SOS earth station might occur within about 8 km of a base station.
A11.40 However, as the emissions from measured LTE type base station equipment are much lower than the levels set by the standard, we believe that there is a very low likelihood of LTE causing interference to SRS and SOS.
A11.41 There are very few SRS and SOS Earth stations in the UK, and if spurious signals from LTE did unexpectedly become an interference issue for SRS and SOS operation, Ofcom would in the first instance recommend that case by case resolution occurs between the SRS/SOS and the new 2.3 GHz licensees. The very limited number of Interfering LTE base stations may need some additional filtering if changes to antenna orientations and tilts were not practical.
A11.42 Our recommendations are therefore that there is not a sufficient risk of harmful interference to SRS SOS from LTE operating in the band 2350-2390 MHz to warrant formal co-ordination or restrictions.

Technical coexistence issues for the 2.3 and 3.4 GHz award
149
C-band earth stations results
A11.43 The results are based on a 1 km terrain calculation, and the grid marker overlay is 0.2 degree latitude/longitude and the single thick contour is for -10dB I/N (coloured red).
A11.44 The following figures show areas around existing PES locations that operate close to 3600 MHz. We give the separation distances required to protect the operational PES based on these areas, the sites are termed ST1 to ST4 and ST6 (as detailed in Figure A11.7 above) and listed in the table below. The distances and variations in size of the mitigation areas are listed in the table below. Examples are shown in Figure A11.11 below for ST1 and ST2: The distances given are the maximum range of the contour.
Figure A11.10: Summary of mitigation distances
Site Distance (km)
UKB Mask TDD permissive mask with transition regions
ST1 3 8.5 ST 2 1.5 5 ST 3 4 5 ST 4 1 7 ST 6 - <1
Note = TDD Unsynchronised is similar to UKB A11.45 In general, the I/N of -10dB contour for TDD Sync emission mask is approximately
three times the distance observed for the UKB emissions mask. This is due to the increased out of band emissions above the 3600 MHz boundary.
Figure A11.11: I/N = -10 dB contour for proposed permissive mask versus UKB existing mask (sites ST1 and ST2)
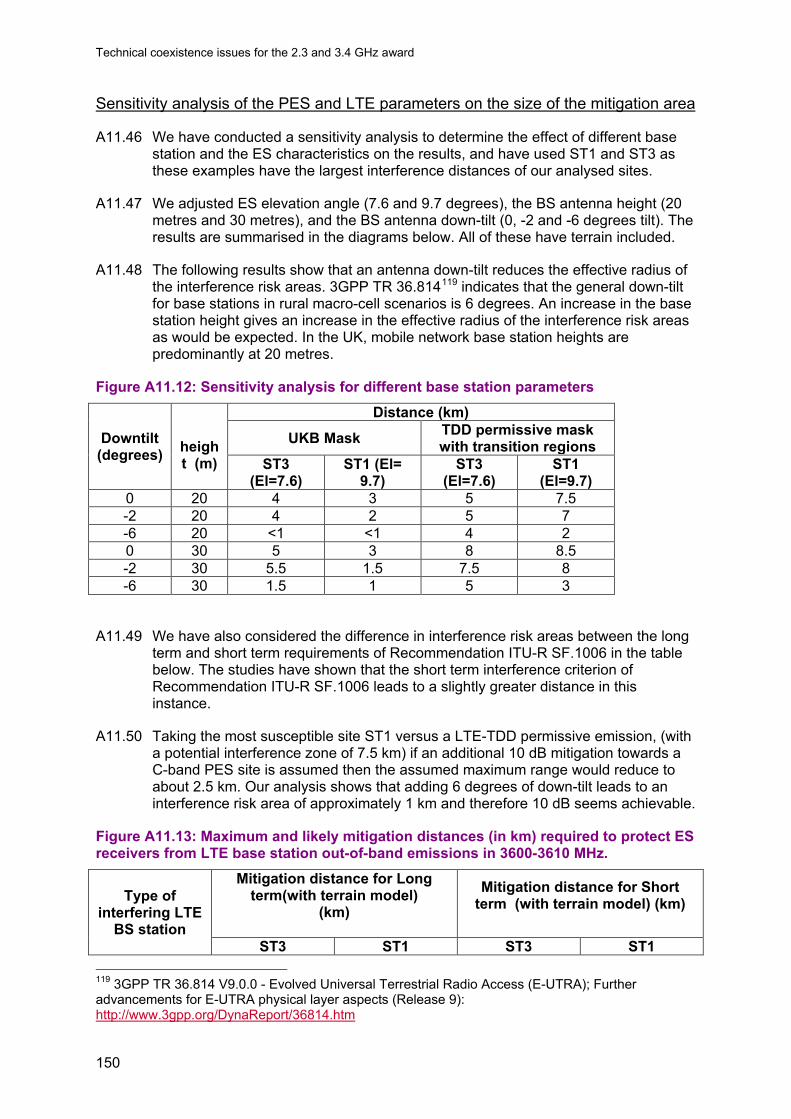
Technical coexistence issues for the 2.3 and 3.4 GHz award
150
Sensitivity analysis of the PES and LTE parameters on the size of the mitigation area
A11.46 We have conducted a sensitivity analysis to determine the effect of different base station and the ES characteristics on the results, and have used ST1 and ST3 as these examples have the largest interference distances of our analysed sites.
A11.47 We adjusted ES elevation angle (7.6 and 9.7 degrees), the BS antenna height (20 metres and 30 metres), and the BS antenna down-tilt (0, -2 and -6 degrees tilt). The results are summarised in the diagrams below. All of these have terrain included.
A11.48 The following results show that an antenna down-tilt reduces the effective radius of the interference risk areas. 3GPP TR 36.814119 indicates that the general down-tilt for base stations in rural macro-cell scenarios is 6 degrees. An increase in the base station height gives an increase in the effective radius of the interference risk areas as would be expected. In the UK, mobile network base station heights are predominantly at 20 metres.
Figure A11.12: Sensitivity analysis for different base station parameters
Downtilt (degrees)
height (m)
Distance (km)
UKB Mask TDD permissive mask with transition regions
ST3 (El=7.6)
ST1 (El= 9.7)
ST3 (El=7.6)
ST1 (El=9.7)
0 20 4 3 5 7.5 -2 20 4 2 5 7 -6 20 <1 <1 4 2 0 30 5 3 8 8.5 -2 30 5.5 1.5 7.5 8 -6 30 1.5 1 5 3
A11.49 We have also considered the difference in interference risk areas between the long term and short term requirements of Recommendation ITU-R SF.1006 in the table below. The studies have shown that the short term interference criterion of Recommendation ITU-R SF.1006 leads to a slightly greater distance in this instance.
A11.50 Taking the most susceptible site ST1 versus a LTE-TDD permissive emission, (with a potential interference zone of 7.5 km) if an additional 10 dB mitigation towards a C-band PES site is assumed then the assumed maximum range would reduce to about 2.5 km. Our analysis shows that adding 6 degrees of down-tilt leads to an interference risk area of approximately 1 km and therefore 10 dB seems achievable.
Figure A11.13: Maximum and likely mitigation distances (in km) required to protect ES receivers from LTE base station out-of-band emissions in 3600-3610 MHz.
Type of interfering LTE
BS station
Mitigation distance for Long term(with terrain model)
(km)
Mitigation distance for Short term (with terrain model) (km)
ST3 ST1 ST3 ST1 119 3GPP TR 36.814 V9.0.0 - Evolved Universal Terrestrial Radio Access (E-UTRA); Further advancements for E-UTRA physical layer aspects (Release 9): http://www.3gpp.org/DynaReport/36814.htm

Technical coexistence issues for the 2.3 and 3.4 GHz award
151
Assumed maximum (20 m, and 0 degree tilt angle) UKB 4 2 3 4
TDD Sync with transitions 5 7.5 4 9
Assumed likely (20 m, and 6 degree down tilt) UKB <1 <1 ~1 <~1
TDD Sync with transitions 4 ~1 ~4 ~1
C-band PES Recommendations
A11.51 We see that PESs having high elevation antenna angles have a lower risk of local interference. Correspondingly low elevation angles increase the size of the interference risk area for some azimuths.
A11.52 Terrain can impact the susceptibility of the earth stations to interference in a positive or negative way:
i) increased clutter between the interfering base station and the ES will lead to smaller interference risk zones;
ii) the increase of the line-of-sight area if one of the stations is located on a hill, for example, can lead to an increased area of potential interference.
A11.53 We found that terrain path-blocking was the main assistance in reducing the interference risk area.
A11.54 The size of the mitigation areas varies from 1 to 9 km depending on the considered azimuth angle the various ES and the different types of masks for the LTE base stations.
A11.55 In the studies, we only considered interference from a single LTE base station. Interference effects may become worse due to the aggregation of out of band emissions generated by several LTE base station transmitters. However we consider that with the antenna discrimination of the PES this aggregation effect would be limited.
Blocking and saturation of C-band PES due to LTE
A11.56 The following analysis considers the blocking effects of LTE on the front end amplifiers of the C-band PES receiver system and potential filtering and mitigation of those signals.
A11.57 As noted above, whilst our normal policy is not to consider adjacent channel blocking as part of the coordination and assignment process for satellite Earth stations, we have considered the blocking effects of LTE to the front end Low Noise blocks (LNB) of the C-band Receiver PES receivers and potential filtering and mitigation options for completeness. However, we are not actively considering adjacent channel coordination in line with our normal assignment process.
A11.58 PES satellite receiver low noise blocks (LNBs) have a very low noise figure value, to enable adequate reception of the satellite signals. They have a dynamic range designed accordingly.
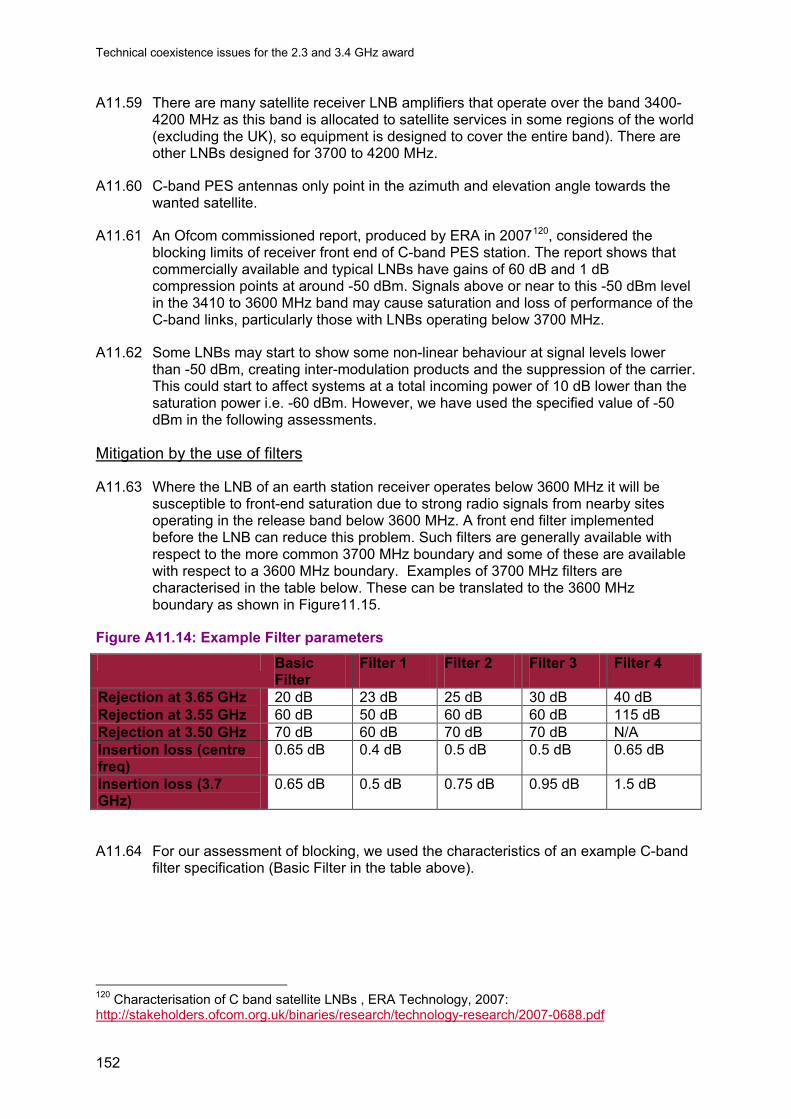
Technical coexistence issues for the 2.3 and 3.4 GHz award
152
A11.59 There are many satellite receiver LNB amplifiers that operate over the band 3400- 4200 MHz as this band is allocated to satellite services in some regions of the world (excluding the UK), so equipment is designed to cover the entire band). There are other LNBs designed for 3700 to 4200 MHz.
A11.60 C-band PES antennas only point in the azimuth and elevation angle towards the wanted satellite.
A11.61 An Ofcom commissioned report, produced by ERA in 2007120, considered the blocking limits of receiver front end of C-band PES station. The report shows that commercially available and typical LNBs have gains of 60 dB and 1 dB compression points at around -50 dBm. Signals above or near to this -50 dBm level in the 3410 to 3600 MHz band may cause saturation and loss of performance of the C-band links, particularly those with LNBs operating below 3700 MHz.
A11.62 Some LNBs may start to show some non-linear behaviour at signal levels lower than -50 dBm, creating inter-modulation products and the suppression of the carrier. This could start to affect systems at a total incoming power of 10 dB lower than the saturation power i.e. -60 dBm. However, we have used the specified value of -50 dBm in the following assessments.
Mitigation by the use of filters
A11.63 Where the LNB of an earth station receiver operates below 3600 MHz it will be susceptible to front-end saturation due to strong radio signals from nearby sites operating in the release band below 3600 MHz. A front end filter implemented before the LNB can reduce this problem. Such filters are generally available with respect to the more common 3700 MHz boundary and some of these are available with respect to a 3600 MHz boundary. Examples of 3700 MHz filters are characterised in the table below. These can be translated to the 3600 MHz boundary as shown in Figure11.15.
Figure A11.14: Example Filter parameters
Basic Filter
Filter 1
Filter 2
Filter 3
Filter 4
Rejection at 3.65 GHz 20 dB 23 dB 25 dB 30 dB 40 dB Rejection at 3.55 GHz 60 dB 50 dB 60 dB 60 dB 115 dB Rejection at 3.50 GHz 70 dB 60 dB 70 dB 70 dB N/A Insertion loss (centre freq)
0.65 dB 0.4 dB 0.5 dB 0.5 dB 0.65 dB
Insertion loss (3.7 GHz)
0.65 dB 0.5 dB 0.75 dB 0.95 dB 1.5 dB
A11.64 For our assessment of blocking, we used the characteristics of an example C-band filter specification (Basic Filter in the table above).
120 Characterisation of C band satellite LNBs , ERA Technology, 2007: http://stakeholders.ofcom.org.uk/binaries/research/technology-research/2007-0688.pdf

Technical coexistence issues for the 2.3 and 3.4 GHz award
153
Figure A11.15: Translated Example filter responses
A11.65 We note that installation of a pass band filter will increase the insertion loss of the
system. A 0.5 dB increase in loss before the LNB will give an overall Carrier/Noise loss of 1.2 dB loss in the antenna chain, which is potentially significant where the C/N link margin for the C-band PES satellite system is in the 2 to 6 dB range.
A11.66 The rejection of a 20 MHz LTE signal occupying 3580-3600 MHz ranges from 3.8 dB to 5.8 dB and is obtained by integrating the above curves over the LTE signal bandwidth (20 MHz). If the edge of the filter pass-band were to be raised from 3600 MHz to 3612 MHz then additional discrimination is provided ranging from 9.3 dB to 15.4 dB.
A11.67 The ERA report suggested exclusion distances near PES of around 300 metres to 2 km, depending on the amount of filtering.
A11.68 An alternative to using a wide band-pass filter (3600-4200MHz) to reject interference to C-band PES stations is to use a tuneable rejection filter at the LNB front end instead. An example cavity filter 121 centred at 3618 MHz, with 28MHz bandwidth, a stop band at 3550 MHz and 3680 MHz of 30 dBc is shown below.
121 K&L Microwave 3CS17-3618/E27.5-O/O data sheet: http://www.klfilterwizard.com/DetailsPF.aspx?pn=3CS17-3618%2fE27.5-O%2fO&sentby=1&graphtype=0&pf1=3535.5&pf2=3700.5&pf3=3576.75&pf4=3659.25&pf5=0&pf6=0

Technical coexistence issues for the 2.3 and 3.4 GHz award
154
Figure A11.16: C-band 3618 MHz ± 28MHz Tuneable filter
A11.69 We note that there is a limited attenuation of 7 dB at 3590 MHz, . The insertion loss
is approximately 1.1 dB.
Minimum coupling loss calculation and geographic separation
A11.70 The sites ST1 to ST4 and ST6 considered in this analysis have centre frequencies and occupied bandwidths that are very close to 3600 MHz.
A11.71 When considering blocking, we are interested in the interference power received at the LNB input.
A11.72 The criteria used for the MCL assessment, is a value of -50 dBm, into an LNB from the output of the associated C-band PES antenna. We assume a C-band PES antenna of 35 dBi gain at 10 degree elevation angle but with relative gain -31 dB in the direction of the LTE interferer, resulting in 4 dBi overall gain.
A11.73 We assume a value of 71 dBm across a 20 MHz carrier (65dBm / 5 MHz), centred at 3590 MHz, for the EIRP of the LTE base station, with no assessment of the out of band signals. We ignored any other signals below 3580 MHz, because these are more easily filtered by C-band PES operators and the closest channel will dominate the results when filters are fitted.
A11.74 A worst case assessment assumes that the LNB has little extra filtering performance just below 3600 MHz. Taking into account the link budget, we have a minimum coupling loss of 125 dB. Assuming free space path propagation without any attenuation due to terrain or LNB filtering this equates to about 11.8 km separation.
A11.75 In practice the path is unlikely to be free space at these distances as terrain and clutter are likely to attenuate the LTE signal. The LNB pass band filtering is similar to that of the 3600 to 4200 MHz filter.
Blocking results
A11.76 Example calculations for blocking at two sites (ST1 and ST2) show that:
• For ST1, with a 51 dBi antenna gain and 10 degree elevation, there is a required separation distance of about 8 km in the direction of the antenna azimuth. For
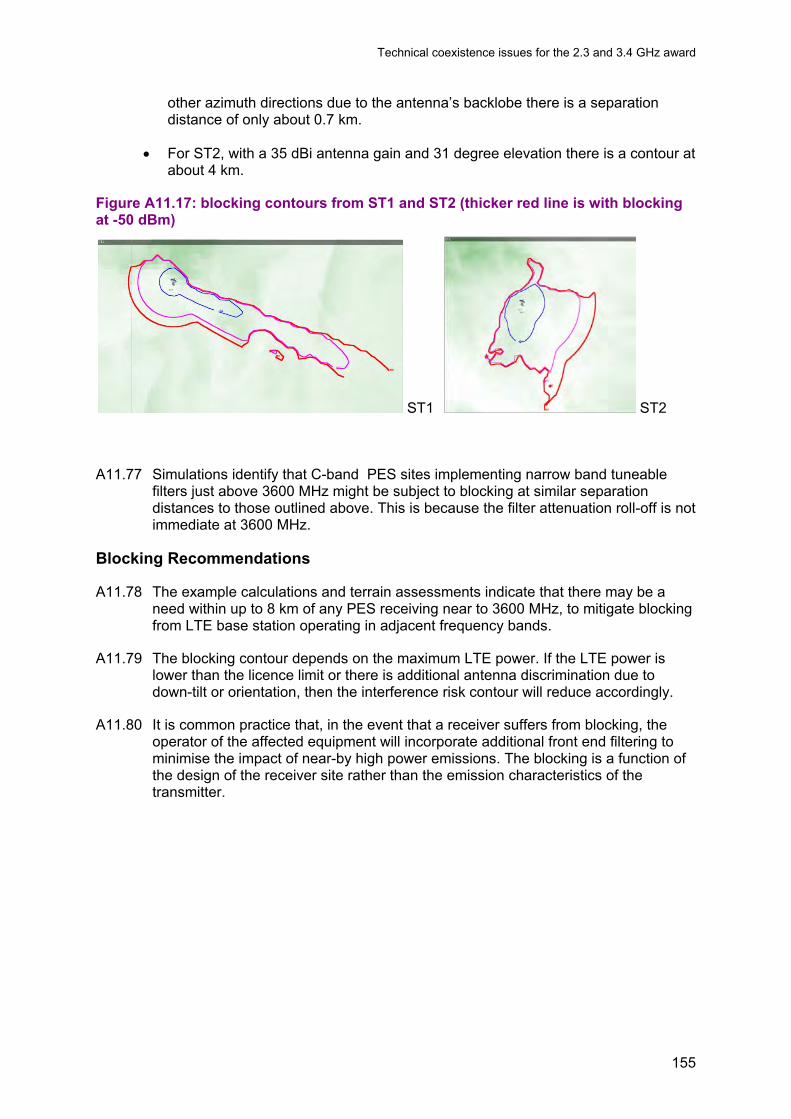
Technical coexistence issues for the 2.3 and 3.4 GHz award
155
other azimuth directions due to the antenna’s backlobe there is a separation distance of only about 0.7 km.
• For ST2, with a 35 dBi antenna gain and 31 degree elevation there is a contour at about 4 km.
Figure A11.17: blocking contours from ST1 and ST2 (thicker red line is with blocking at -50 dBm)
ST1 ST2
A11.77 Simulations identify that C-band PES sites implementing narrow band tuneable filters just above 3600 MHz might be subject to blocking at similar separation distances to those outlined above. This is because the filter attenuation roll-off is not immediate at 3600 MHz.
Blocking Recommendations
A11.78 The example calculations and terrain assessments indicate that there may be a need within up to 8 km of any PES receiving near to 3600 MHz, to mitigate blocking from LTE base station operating in adjacent frequency bands.
A11.79 The blocking contour depends on the maximum LTE power. If the LTE power is lower than the licence limit or there is additional antenna discrimination due to down-tilt or orientation, then the interference risk contour will reduce accordingly.
A11.80 It is common practice that, in the event that a receiver suffers from blocking, the operator of the affected equipment will incorporate additional front end filtering to minimise the impact of near-by high power emissions. The blocking is a function of the design of the receiver site rather than the emission characteristics of the transmitter.

Technical coexistence issues for the 2.3 and 3.4 GHz award
156
Annex 12
12 Coordination procedure for MoD sites
A12.1 This annex provides details of the coordination procedures that we propose should be applied to the 2.3 GHz and 3.4GHz licences in order to protect ongoing MoD uses at a number of key sites.
Notice of coordination procedure for MoD sites related to 2.3 GHz licences
A12.2 This Notice is notified to each 2.3 GHz licensee under their respective 2.3 GHz licences.
A12.3 MoD has a small amount of ongoing use within the band at two locations, one in the Outer Hebrides and one in West Wales. They have also directed us to provide protection around three fixed satellite sites.
A12.4 This Notice specifies the protection thresholds and coordination procedure that Ofcom considers are necessary to ensure the protection of existing and continuing MoD usage in the 2310–2360 MHz band from potential harmful interference from the deployment of networks in the 2.3 GHz band.
A12.5 In this Notice:
“2.3 GHz band” means the following frequencies: 2350 MHz to 2390 MHz;
“2.3 GHz base stations” means base stations which are licensed to transmit using frequencies in the 2.3 GHz band;
“2.3 GHz fixed or installed terminal stations” means fixed or installed terminal stations which are not exempt from licensing by the Wireless Telegraphy Act (Exemption) Regulations and which are licensed to transmit using frequencies in the 2.3 GHz band;
“2.3 GHz licensee” means the licensee under a licence authorising use in the United Kingdom of frequencies in the 2.3 GHz band;
“base station” means radio equipment that transmits to terminal stations;
“2.3 GHz deployments” means a 2.3 GHz base station or a 2.3 GHz fixed or installed terminal station deployed by a 2.3 GHz licensee;
“the in-band communications signal threshold” means the threshold that the 2.3 GHz licensee must comply with as specified in this Notice;
“MOD” means the Ministry of Defence;
“Protected Site” means the list of sites set out in this Notice;
“Signals” means the transmission in the 2350 to 2390 MHz band from the 2.3 GHz communications equipment

Technical coexistence issues for the 2.3 and 3.4 GHz award
157
“terminal station” means Radio Equipment that receives downlink transmissions from base stations.
Overview of coordination procedure
A12.6 When planning its network deployment, the 2.3 GHz licensee must check whether the protection thresholds set out in this document would be exceeded as a result of any proposed 2.3 GHz deployment. To do so, the 2.3 GHz licensee will need to calculate the communications signal at the relevant Protected Site location(s) (see Protection Thresholds section below). If these calculations show that the relevant threshold(s) will not be exceeded as a result of the planned deployment, then deployment can go ahead. If the calculations show that the relevant threshold(s) would be exceeded as a result of the planned deployment, the 2.3 GHz licensee may consider adjusting the deployment.
A12.7 If it is not possible to adjust the deployment so that the threshold(s) are not exceeded, the 2.3 GHz licensee may only proceed to deployment if agreement is reached with the operator(s) of the relevant site(s). In the first instance contact should be made via Ofcom who will facilitate a discussion between the licensee’s appropriately security cleared personnel and the operator of the Protected Site.
Figure A12.1: Flowchart illustrating coordination procedures for deployments within the coordination zone
List of sites to be protected
A12.8 The sites to which these coordination procedures apply are listed in the Table A12.1 below.
Calculate power at protected site
Threshold Exceeded?
Adjust deployment
Threshold Exceeded?
Seek local agreement with
MOD
Agreement reached?
Deploy
Do not deploy
No
No
No
Yes

Technical coexistence issues for the 2.3 and 3.4 GHz award
158
Table A12.1: 2.3 GHz band Protected Site Locations
Site Location
Aberpoth SN 247 518
St Kilda NF 094 987
Oakhanger SU 776 357
Colerne ST 808 717
Menwith Hill SE 209 561
Protection thresholds
A12.9 The 2.3 GHz licensee must ensure that emissions from each proposed 2.3 GHz deployment in its licensed 2.3 GHz band do not exceed the threshold for the in-band communications signal given in Table A12.2.
Table A12.2: Site protection thresholds
In-band communication signal Aberporth Site Protection thresholds
Threshold for Signals in the 2350 to 2360 MHz band [1]
-59dBm /5 MHz
Height 143m above mean sea level
Area where calculation is to be performed Within an area described by the following 10km grid squares (reference point is the lower left hand corner): SN15 (SN 1000 5000) SN25 (SN 2000 5000) SN35 (SN 3000 5000) SN36 (SN 3000 6000)
St Kilda Site Protection thresholds
Threshold for Signals in the 2350 to 2360 MHz band [1]
-149dBm / 5 MHz
Height 370m above mean sea level
Area where calculation is to be performed Up to 225km from St Kilda
Oakhanger, Colerne, Menwith Hill Site Protection thresholds
Threshold for Signals in the 2350 to 2390 MHz band [1]
-52dBm / 5 MHz
Height 14m above ground level
Area where calculation is to be performed Up to 5km from each site
Note [1]: The protection thresholds are defined during the ‘on’ period of the transmit signal and referenced to a 0dBi receive antenna
Technical coexistence issues for the 2.3 and 3.4 GHz award
159
Compliance with the thresholds
A12.10 Prior to deployment, the 2.3 GHz licensee must assess whether the protection thresholds specified in Table A12.2 will be exceeded as a result of its planned 2.3 GHz deployment for any Protected Site. There is no requirement to undertake an assessment outside of the calculation areas given in Table A12.2.
A12.11 In carrying out this assessment for deployments within the calculation areas described in Table A12.2 the 2.3 GHz licensee must use ITU-R Recommendation P.452-14 with the parameters given in Table A12.3.
A12.12 The 2.3 GHz licensee must ensure that the protection thresholds for each 2.3 GHz deployment are not exceeded at the Protected Site taking account of the relative horizontal antenna gain pattern described in Table A12.5. The horizontal polar diagram will be used to calculate additional antenna discrimination loss in the direction of the 2.3 GHz base station. The antenna peak gain is accounted for in the protection thresholds and antenna polar diagrams provided are referenced to the maximum Protected Site antenna gain.
A12.13 The 2.3 GHz licensee must maintain records of its calculations and assessments and make these available to Ofcom if required.
Exceeding the threshold
A12.14 The thresholds may only be exceeded in relation to a specific Protected Site if the 2.3 GHz licensee has reached an agreement with the operator of that Protected Site (Ofcom will facilitate the necessary introductions if necessary). Any such agreement must be recorded in writing in a form agreed by both the 2.3 GHz licensee and the site operator. The 2.3 GHz licensee must maintain a record of all such agreements, and make them available to Ofcom on request.
Propagation model
A12.15 The path loss will be calculated using ITU-R Recommendation P.452-14 “Prediction procedure for the evaluation of microwave interference between stations on the surface of the Earth at frequencies above 0.7 GHz”122.
A12.16 It predicts signal levels exceeded for a given percentage of time, the assessment will use a time percentage of 10% as included in Table A12.3 below.
A12.17 Predictions are based on the terrain profile and clutter along the path.
A12.18 Additional losses due to protection from local clutter shall be applied at both the transmitter and receiver where they are on land. This is based on a nominal clutter height and nominal obstacle distance assigned to each clutter category. The required values are given in Table A12.4.
Table A12.3: ITU-R P.452 parameters
Time percentage 10% Sea level surface refractivity, N0 (N-units)
Aberporth: 326 St Kilda: 321 Oakhanger, Colerne: 327
122 www.itu.int/rec/R-REC-P.452/en

Technical coexistence issues for the 2.3 and 3.4 GHz award
160
Menwith Hill: 324 The average radio-refractive index lapse-rate through the lowest 1 km of the atmosphere, ∆N (N-units/km)
Aberporth: 42 St Kilda: 41 Oakhanger, Colerne, Menwith Hill: 42
Dry air pressure (hPa) 1013 Temperature (°C) 15.0 Nominal path centre latitude ϕ (°) Aberporth: 52
St Kilda: 57 Oakhanger, Colerne: 51 Menwith Hill : 54
Clear-air propagation attenuation components included:
Line of sight/Diffraction - Diffraction - Multipath and focussing effects - Gaseous absorption Tropospheric scatter - Gaseous absorption Ducting/Layer reflection - Gaseous absorption
The path centre latitude ϕ may be selected on a case by case basis, in this case N0 and ∆N should be calculated using the following equations:
𝑁0 = 328 − (𝜑 − 50) ∆𝑁 = 42.5 − 0.25(𝜑 − 50)
Terrain database
A12.19 Ordnance Survey “Land-form Panorama®” 50 metres resolution digital terrain map data or other equivalent shall be used.
Clutter database
A12.20 The 50 metre resolution clutter dataset produced by Infoterra or other equivalent shall be used.
A12.21 The Infoterra dataset identifies 10 different clutter categories. For location variation these are mapped to the required clutter designations with nominal clutter heights and nominal obstacle distances.
A12.22 The default parameters, given in Table A12.4, for nominal clutter heights and nominal obstacle distances are as defined in ITU-R Recommendation P.452-14.
Table A12.4: Infoterra clutter code mapping
Infoterra Clutter Code
Description Nominal height (m) Nominal distance (km)
1 Open 4 0.1
2 Suburban 9 0.025

Technical coexistence issues for the 2.3 and 3.4 GHz award
161
3 Urban 20 0.02
4 Villages 5 0.07
5 Open in Urban 4 0.1
6 Forest 15 0.05
7 Water Not applicable Not applicable
8 Dense Urban 25 0.02
9 Park recreation 4 0.1
10 Industry 20 0.05 Horizontal antenna pattern
A12.23 The table below shows the horizontal antenna pattern that must be used for signal strength calculations
Table A12.5: Antenna pattern with reference to grid north
Angle from grid north (degrees)
Gain wrt to peak (dB) Aberporth
Gain wrt to peak (dB)
St Kilda, Oakhanger,
Colerne, Menwith Hill
0 0 0 60 0 0 65 -8.3 0 70 -24 0 75 -30 0 80 -31 0
240 -31 0 245 -30.3 0 250 -24 0 255 -12.5 0 260 0 0 355 0 0 360 0 0

Technical coexistence issues for the 2.3 and 3.4 GHz award
162
Notice of coordination procedure for MoD sites related to 3.4 GHz licences
A12.24 This Notice is notified to each 3.4 GHz licensee under their respective 3.4 GHz licences.
A12.25 MoD has a small amount of ongoing use within the band at one location in Cornwall
A12.26 This Notice specifies the protection thresholds and coordination procedure that Ofcom considers are necessary to ensure the protection of existing and continuing MoD usage in the 3.4 to 3.6 GHz band from potential harmful interference from the deployment of networks in the 3.4 GHz band.
A12.27 In this Notice:
“3.4 GHz band” means the following frequencies: 3410 MHz – 3600 MHz;
“3.4 GHz base stations” means base stations which are licensed to transmit using frequencies in the 3.4 GHz band;
“3.4 GHz fixed or installed terminal stations” means fixed or installed terminal stations which are not exempt from licensing by the Wireless Telegraphy Act (Exemption) Regulations and which are licensed to transmit using frequencies in the 3.4 GHz band;
“3.4 GHz licensee” means the licensee under a licence authorising use in the United Kingdom of frequencies in the 3.4 GHz band;
“base station” means radio equipment that transmits to terminal stations;
“3.4 GHz deployments” means a 3.4 GHz base station or a 3.4 GHz fixed or installed terminal station deployed by a 3.4 GHz licensee;
“the in-band communications signal threshold” means the threshold that the 3.4 GHz licensee must comply with as specified in this Notice;
“MOD” means the Ministry of Defence;
“Protected Site” means the list of sites set out in this Notice;
“Signals” means the transmission in the 3410 to 3600 MHz band from the 3.4 GHz communications equipment
“terminal station” means Radio Equipment that receives downlink transmissions from base stations.

Technical coexistence issues for the 2.3 and 3.4 GHz award
163
Overview of co-ordination procedure
A12.28 When planning its network deployment, the 3.4 GHz licensee must check whether the protection thresholds set out in this document would be exceeded as a result of any proposed 3.4 GHz deployment. To do so, the 3.4 GHz licensee will need to calculate the communications signal at the relevant Protected Site location (see below). If these calculations show that the relevant threshold will not be exceeded as a result of the planned deployment, then deployment can go ahead. If the calculations show that the relevant threshold would be exceeded as a result of the planned deployment, the 3.4 GHz licensee may consider adjusting the deployment.
A12.29 If it is not possible to adjust the deployment so that the threshold is not exceeded, the 3.4 GHz licensee may only proceed to deployment if agreement is reached with the operator(s) of the relevant site. In the first instance contact should be made via Ofcom who will facilitate a discussion between the licensee’s appropriately security cleared personnel and the operator of the Protected Site
Figure A12.1: Flowchart illustrating coordination procedures for deployments within the coordination zone
Calculate power at protected site
Threshold Exceeded?
Adjust deployment
Threshold Exceeded?
Seek local agreement with
MOD
Agreement reached?
Deploy
Do not deploy
No
No
No
Yes
Technical coexistence issues for the 2.3 and 3.4 GHz award
164
List of sites to be protected
A12.30 The sites to which these coordination procedures apply are listed in the table below.
Table A12.6: 3.4 GHz band Protected Site Locations
Site Location
Bude SS 208 126
Protection thresholds
A12.31 The 3.4 GHz licensee must ensure that emissions from each proposed 3.4 GHz deployment in its licensed 3.4 GHz band do not exceed the threshold for the in-band communications signal given in Table A12.5.
Table A12.7: Site protection thresholds
In-band communication signal Bude Site Protection thresholds
Threshold for Signals in the 3410 to 3600 MHz band [1]
-56dBm /5 MHz
Height 18m above ground level
Area where calculation is to be performed Up to 25km from Bude
Note [1]: The protection thresholds are defined during the ‘on’ period of the transmit signal and referenced to a 0dBi receive antenna
Compliance with the thresholds
A12.32 Prior to deployment, the 3.4 GHz licensee must assess whether the protection thresholds specified in Table A12.7 will be exceeded as a result of its planned 3.4 GHz deployment for any Protected Site.
A12.33 There is no requirement to undertake an assessment outside of the calculation areas given in Table A12.7.
A12.34 In carrying out this assessment for deployments within the calculation areas described in Table A12.7 the 2.3 GHz licensee must use ITU-R Recommendation P.452-14 with the parameters given in Table A12.8.
A12.35 The 3.4 GHz licensee must maintain records of its calculations and assessments and make these available to Ofcom if required.
Exceeding the threshold
A12.36 The thresholds may only be exceeded in relation to a specific Protected Site if the 3.4 GHz licensee has reached an agreement with the operator of that Protected Site (Ofcom will facilitate the necessary introductions if necessary). Any such agreement must be recorded in writing in a form agreed by both the 3.4 GHz licensee and the site operator. The 3.4 GHz licensee must maintain a record of all such agreements, and make them available to Ofcom on request.
Technical coexistence issues for the 2.3 and 3.4 GHz award
165
Propagation model
A12.37 The path loss will be calculated using ITU-R Recommendation P.452-14 “Prediction procedure for the evaluation of microwave interference between stations on the surface of the Earth at frequencies above 0.7 GHz”123.
A12.38 It predicts signal levels exceeded for a given percentage of time, the assessment will use a time percentage of 10% as included in table A12.8 below.
A12.39 Predictions are based on the terrain profile and clutter along the path.
A12.40 Additional losses due to protection from local clutter shall be applied at both the transmitter and receiver where they are on land. This is based on a nominal clutter height and nominal obstacle distance assigned to each clutter category. The required values are given in Table A12.9.
Table A2.8: ITU-R P.452 parameters
Time percentage 10% Sea level surface refractivity, N0 (N-units)
327
The average radio-refractive index lapse-rate through the lowest 1 km of the atmosphere, ∆N (N-units/km)
42
Dry air pressure (hPa) 1013 Temperature (°C) 15.0 Nominal path center latitude ϕ (°) 51.0 Clear-air propagation attenuation components included:
Line of sight/Diffraction - Diffraction - Multipath and focussing effects - Gaseous absorption Tropospheric scatter - Gaseous absorption Ducting/Layer reflection - Gaseous absorption
The path centre latitude ϕ may be selected on a case by case basis, in this case N0 and ∆N should be calculated using the following equations:
𝑁0 = 328 − (𝜑 − 50) ∆𝑁 = 42.5 − 0.25(𝜑 − 50)
Terrain database
A12.41 Ordnance Survey “Land-form Panorama®” 50 metres resolution digital terrain map data or other equivalent shall be used.
123 www.itu.int/rec/R-REC-P.452/en
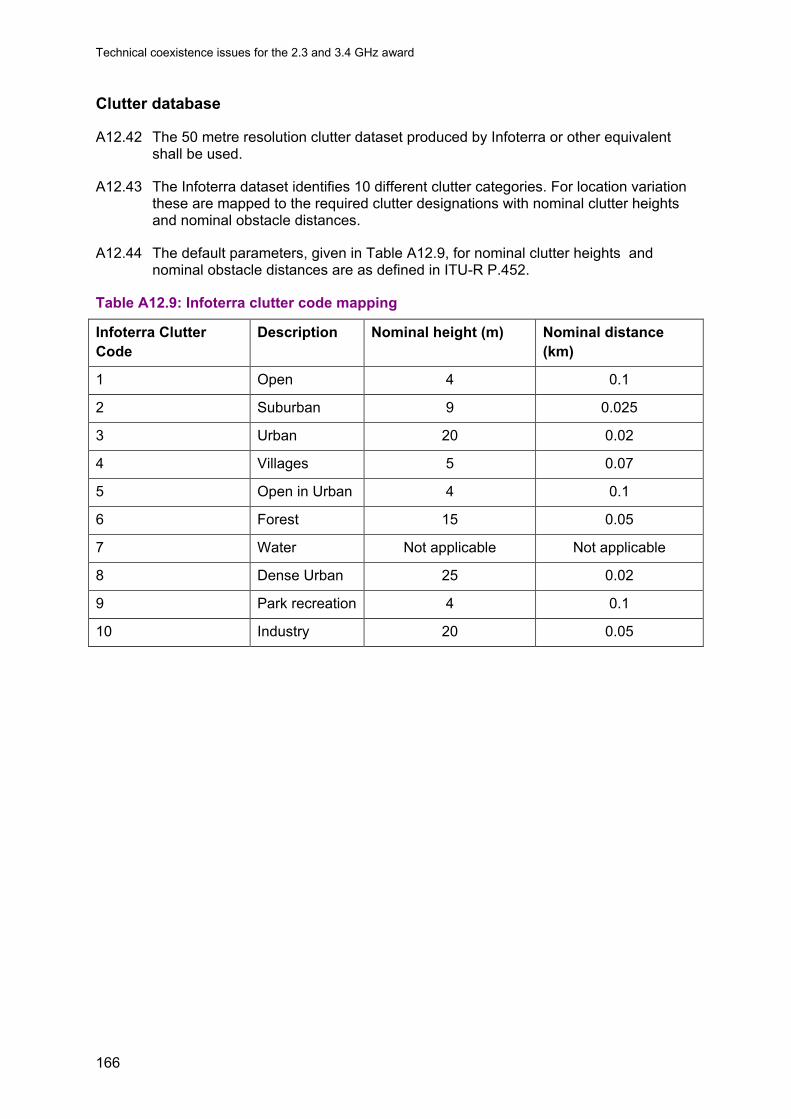
Technical coexistence issues for the 2.3 and 3.4 GHz award
166
Clutter database
A12.42 The 50 metre resolution clutter dataset produced by Infoterra or other equivalent shall be used.
A12.43 The Infoterra dataset identifies 10 different clutter categories. For location variation these are mapped to the required clutter designations with nominal clutter heights and nominal obstacle distances.
A12.44 The default parameters, given in Table A12.9, for nominal clutter heights and nominal obstacle distances are as defined in ITU-R P.452.
Table A12.9: Infoterra clutter code mapping
Infoterra Clutter Code
Description Nominal height (m) Nominal distance (km)
1 Open 4 0.1
2 Suburban 9 0.025
3 Urban 20 0.02
4 Villages 5 0.07
5 Open in Urban 4 0.1
6 Forest 15 0.05
7 Water Not applicable Not applicable
8 Dense Urban 25 0.02
9 Park recreation 4 0.1
10 Industry 20 0.05

Technical coexistence issues for the 2.3 and 3.4 GHz award
167
Annex 13
13 Radar coordination
A13.1 This annex provides more detail account of the analysis related to radar use adjacent to the 3.4 GHz award band.
A13.2 It is in two parts. The first part provides more detail about the technical measurements and subsequent analysis related to maritime radar use in the 2900–3100 MHz band. This analysis was summarised in section 10.
A13.3 The second part provides a coordination procedure that we propose is necessary in order to protect air traffic control (ATC) and air traffic management (ATM) from new proposed services in the 3.4 GHz band. This is based on the one implemented as part of the 2.6 GHz award.
Radar Analysis
Our technical analysis
Radar compression and mixer product effects
A13.4 As we discussed in section 10, it was considered appropriate by the Maritime and Coastguard Agency (MCA), supported by Ofcom, that a measurement on full maritime radar systems, subjected to clean communications transmissions, was made to allow an understanding of the selectivity susceptibility. This measurement does not consider OOB effects which are specifically excluded by filtering. The trial was witnessed by MCA, Ofcom and MoD representatives, and the data then analysed by the manufacturers themselves.
A13.5 This study was undertaken on 24-28 June 2013 with higher measurement resolution than in some similar test conducted previously as part of the 2.6 GHz award preparations. It included the use of wide band synchronised TDD transmissions with bandwidths up to 120 MHz provided by an Ofcom LTE test rig.
A13.6 The MCA and Ofcom sponsored a joint trial with two major UK maritime radar manufacturers, at the UK type testing range at Shoeburyness. The objective of the testing at Shoeburyness was to establish the level of resilience of those manufacturer’s maritime radars to 3.4 GHz LTE type transmission scenarios as identified below.
A13.7 The testing at Shoeburyness included:
• Allowing the antenna and rotating joint elements to be included in the radar system testing as opposed to a bench test where it would be difficult to test these elements fully
• Measurement of the baseline performance of the radar system under test;
• Test for LTE resilience via measurement of the radar performance in the presence of varying 3.4 GHz band LTE base station signals (i.e. to establish the

Technical coexistence issues for the 2.3 and 3.4 GHz award
168
change in performance of the maritime radars under simulated LTE signal illumination)
The LTE simulated signals received in the radar
A13.8 We used a 3.4 GHz LTE simulator (test rig) (see Figure A13.1 and Figure A13.2) to generate synchronised LTE-TDD type transmissions in various bandwidths of 10, 20, 60 and 120 MHz. The 60 MHz waveform was constructed from two independent 20 MHz waveforms and two independent 10 MHz waveforms. All the signals were synchronised in time. The 120 MHz waveform was constructed of two time synchronised 60 MHz transmissions, offset in frequency. To cover the 190 MHz of the 3.4 GHz award band, the test rig transmission was varied in centre frequency to test the full bandwidth in sections.
A13.9 The radars were illuminated with power flux densities (pfd) of up to +10dBm/m2 as measured at a calibrated horn (See Figure A13.1). However, due to site constraints the test rig was located within the near field. In addition, an external radar target generator was used to provide a test target in order to verify there was no loss of target signal over and above the any noise level effects in the radar receiver. One of the radars tested used an internal test target for the same purpose.
Figure A13.1: Block diagram of Ofcom test rig deployment and radars under illumination
A13.10 There were two types of radar considered. Two magnetron radars (on normal operating frequency) and one solid state radar with a number of frequencies tested to cover the whole operating range.

Technical coexistence issues for the 2.3 and 3.4 GHz award
169
Figure A13.2: Maritime radar testing at Shoeburyness – the S-band radar used, the antennas indicated by A and B
Trial observations
A13.11 On transmission of the 3.4 GHz simulated communications signals, one manufacturer reported that up to +10dBm/m2 pfd they observed no detrimental effects on the solid state radar (antenna B124 in Figure A13.2).
A13.12 On the magnetron radar connected to the same antenna, no effects were observed with the 10 and 20 MHz bandwidth communications signals with a pfd measured at the reference point of +10dBm/m2. However, for the 60 and 120 MHz signals the manufacturer observed a low level of increase in noise in their detection bandwidth. This degradation ceased when the transmitted pfd was reduced to +3dBm/m2.
A13.13 The increase in interference for this radar at pfd’s above +3dBm/m2, for 8 synchronised TDD waveforms in the 120 MHz measurements may be due to the increase in peak to average ratio for the multiple synchronised TDD transmissions.
A13.14 The other maritime magnetron radar antenna (A) was located slightly further from the Ofcom test rig and due to site effects125 the radar manufacturer reported they believed that the pfd may have been on occasions as low as 0dBm/m2 at the radar face.
A13.15 The pfd where there were no noticeable effects for the solid state (SS) and magenetron (MR) radars are set out in Figure A13.3.
124 Antenna B was located some 10m in front of the other antenna (A in Fig 10.2) and this may have been a ‘cleaner’ radio frequency environment with regard to signal direction and multipath 125 near field antenna response and multipath in the cluttered environment, amongst other possibilities
A
B
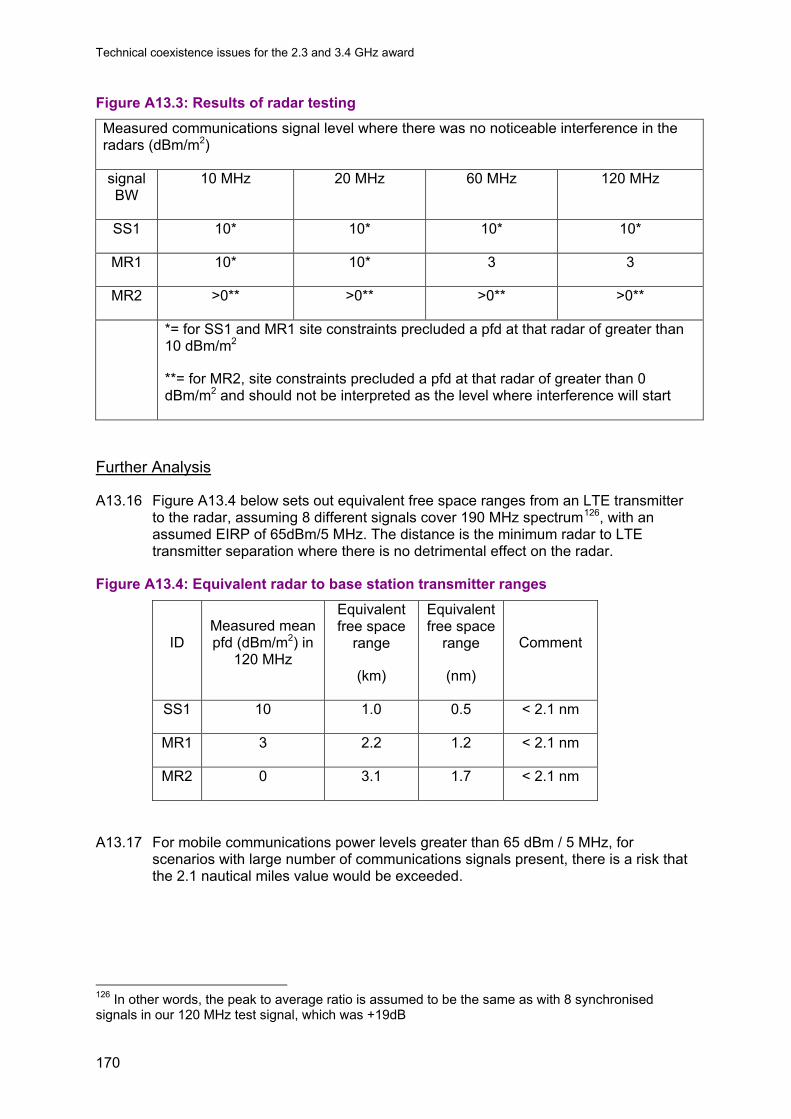
Technical coexistence issues for the 2.3 and 3.4 GHz award
170
Figure A13.3: Results of radar testing Measured communications signal level where there was no noticeable interference in the radars (dBm/m2)
signal BW
10 MHz 20 MHz 60 MHz 120 MHz
SS1 10* 10* 10* 10*
MR1 10* 10* 3 3
MR2 >0** >0** >0** >0**
*= for SS1 and MR1 site constraints precluded a pfd at that radar of greater than 10 dBm/m2
**= for MR2, site constraints precluded a pfd at that radar of greater than 0 dBm/m2 and should not be interpreted as the level where interference will start
Further Analysis
A13.16 Figure A13.4 below sets out equivalent free space ranges from an LTE transmitter to the radar, assuming 8 different signals cover 190 MHz spectrum126, with an assumed EIRP of 65dBm/5 MHz. The distance is the minimum radar to LTE transmitter separation where there is no detrimental effect on the radar.
Figure A13.4: Equivalent radar to base station transmitter ranges
ID Measured mean pfd (dBm/m2) in
120 MHz
Equivalent free space
range
(km)
Equivalent free space
range
(nm)
Comment
SS1 10 1.0 0.5 < 2.1 nm
MR1 3 2.2 1.2 < 2.1 nm
MR2 0 3.1 1.7 < 2.1 nm
A13.17 For mobile communications power levels greater than 65 dBm / 5 MHz, for scenarios with large number of communications signals present, there is a risk that the 2.1 nautical miles value would be exceeded.
126 In other words, the peak to average ratio is assumed to be the same as with 8 synchronised signals in our 120 MHz test signal, which was +19dB
Technical coexistence issues for the 2.3 and 3.4 GHz award
171
Summary of the technical analysis
A13.18 The manufacturer’s test results indicated a low level of susceptibility to the LTE signal power flux densities at the 3.4 GHz frequencies to which the radar was exposed.
A13.19 For the solid state radar there was no noticeable interference up to and including the maximum +10dBm/m2 signal level transmitted. For one magnetron radar, there was no interference for the 60 MHz and 120 MHz signal at a power flux density of +3dBm/m2. This increased to +10dBm/m2 for a 10 and 20 MHz LTE signal. The other magnetron radar showed no effects at the maximum power flux density transmitted of 0dBm/m2.
A13.20 In all cases the equivalent separation distances from LTE base stations covering the 190 MHz of spectrum were less than 2.1 nautical miles.
A13.21 It is improbable in practical LTE deployments that base stations covering 190 MHz spectrum will be geographically aligned to simultaneously aggregate into the narrow radar beam as it rotates.

Technical coexistence issues for the 2.3 and 3.4 GHz award
172
Co-ordination procedure for air traffic control radar – notice issued to 3.4 GHz licensees
A13.22 This Notice is notified to each 3.4 GHz licensee under their respective 3.4 GHz licences.
A13.23 There is a cross-Government radar remediation programme that has ensured that ATC radars in the 2.7 GHz band (2700-3100 MHz) are modified to become more resilient to interference from the 3.4 GHz band (3410 MHz to 3600 MHz). However, even after this programme has completed the radars will have some sensitivity to emissions from the 3.4 GHz band.
A13.24 This Notice specifies the protection thresholds and coordination procedure that Ofcom considers are necessary to ensure the protection of existing radars operating in the 2.7 GHz bands from potential harmful interference from the deployment of networks in the 3.4 GHz band.
A13.25 In this Notice:
“3.4 GHz band” means the following frequencies: 3410 MHz – 3600 MHz;
“3.4 GHz base stations” means base stations which are licensed to transmit using frequencies in the 3.4 GHz band;
“3.4 GHz fixed or installed terminal stations” means fixed or installed terminal stations which are not exempt from licensing by the Wireless Telegraphy Act (Exemption) Regulations and which are licensed to transmit using frequencies in the 3.4 GHz band;
“3.4 GHz licensee” means the licensee under a licence authorising use in the United Kingdom of frequencies in the 3.4 GHz band;
“2.7 GHz band” means the following frequencies: 2700 MHz – 3100 MHz;
“base station” means radio equipment that transmits to terminal stations;
“3.4 GHz deployments” means 3.4 GHz base stations and 3.4 GHz fixed or installed terminal stations deployed by a 3.4 GHz licensee;
“the CAA” means the Civil Aviation Authority;
“the in-band communications signal threshold” means the threshold that the 3.4 GHz licensee must comply with as specified in this Notice;
“MOD” means the Ministry of Defence;
“Noise” means the non-signal component of the communications transmissions;
“OOB emissions” means out of communications band emissions;
“Protected Radar” means the list of radars set out in this Notice;
“radar” means aeronautical radio-navigation radar;

Technical coexistence issues for the 2.3 and 3.4 GHz award
173
“Signals” means the transmission in the 3.41 to 3.6 GHz band from the 3.4 GHz communications equipment
“terminal station” means Radio Equipment that receives downlink transmissions from base stations.
Overview of co-ordination procedure
A13.26 When planning its network deployment, the 3.4 GHz licensee must check whether the protection thresholds set out in this document would be exceeded as a result of any proposed 3.4 GHz deployment. To do so, the 3.4 GHz licensee will need to calculate the communications signal and the out of band noise at the relevant Protected Radar location(s) (see section 4). If these calculations show that the relevant threshold(s) will not be exceeded as a result of the planned deployment, then deployment can go ahead. If the calculations show that the relevant threshold(s) would be exceeded as a result of the planned deployment, the 3.4 GHz licensee may consider adjusting the deployment.
A13.27 If it is not possible to adjust the deployment so that the threshold(s) are not exceeded, the 3.4 GHz licensee may only proceed to deployment if agreement is reached with the operator(s) of the relevant radar(s).
Figure A13. 5: Flowchart illustrating coordination procedures Calculate power flux density and noise spectral
power flux density
Threshold exceeded?
Adjust deployment
Threshold exceeded?
Seek local agreement with radar operator
Agreement reached?
Do not deploy Deploy
No
Yes
Yes
No
No
Yes
The Protected Radar list
A13.28 Details of the existing civil and military radars requiring protection are set out in the Protected Radar link referred to in paragraph A13.52 of this Notice. The area where the radar is protected is limited by the current position and within the airfield

Technical coexistence issues for the 2.3 and 3.4 GHz award
174
boundary. The 3.4 GHz licensee must ensure that its planned deployment is able to comply with the thresholds in relation to all of that area.
A13.29 The protection thresholds and coordination procedure apply to the protection of radars listed on the Protected Radar list at the time a new 3.4 GHz deployment is made.
A13.30 The protection thresholds and coordination procedure do not apply to the protection of any new radar from 3.4 GHz deployments in the 3.4 GHz band already in operation when the radar is deployed. However, where a radar operator does wish to deploy a new radar and there is a 3.4 GHz licensee with an existing 3.4 GHz deployment that may interfere with that new radar, it would be open to the parties to seek to resolve between themselves any coordination issues that would arise as a result of the intended radar deployment. Any such agreement must be recorded in writing in a form agreed by both the 3.4 GHz licensee and the radar operator. The 3.4 GHz licensee must maintain a record of all such agreements, and make them available to Ofcom on request.
A13.31 Should the parties be unable to agree a resolution to a coordination issue for a new radar at a particular airport, the parties may refer the matter to Ofcom and the CAA for assistance. Ofcom and the CAA, in consultation with the relevant parties, shall use their reasonable endeavours to agree between them and subsequently recommend a proportionate solution to the parties. Ofcom and the CAA recognise that radar operators and mobile operators are likely to have a shared interest in ensuring both aircraft safety through radar protection and availability of mobile coverage at airports. Should the parties be unwilling to accept any recommended solution Ofcom and the CAA would consider the extent to which statutory powers could be used to resolve the situation.
A13.32 The Protected Radar list will be updated and re-issued from time to time. It is the responsibility of the 3.4 GHz licensee to ensure that it uses the most recent version when planning its deployment.
Radar protection thresholds
A13.33 Protected ATC Radars have been subject to remediation work to make them less susceptible to interference from signals in the 3.4 GHz band. Table 1 contains values for the in-band communications signal threshold and one value for the threshold for communications out of band noise.
A13.34 Subject to paragraph A13.40, in relation to each Protected Radar:
• Before that Protected Radar has been remediated, the 3.4 GHz licensee must ensure that cumulative emissions from all deployment in the 3.4 GHz band do not exceed the pre-remediation threshold in Figure A13.6.
• After that Protected Radar has been remediated, the 3.4 GHz licensee must ensure that cumulative emissions from all deployment in the 3.4 GHz band do not exceed the post-remediation threshold in Figure A13.6.
A13.35 The Protected Radar list (as updated and re-issued from time to time) specifies which Protected Radars have been remediated.

Technical coexistence issues for the 2.3 and 3.4 GHz award
175
Figure A13.6: Radar protection thresholds
In-band communication signal Communications out of band noise
Pre-remediation Post-remediation Pre- and post-remediation
Power flux density threshold for Signals in the 3410 to 3600 MHz band (dBm/m2) [1,2]
Power flux density threshold for Signals in the 3410 to 3600 MHz band (dBm/m2) [1,2]
Noise spectral power flux density threshold at 2720 MHz to 3100 MHz (dBm/MHz/m2) [1,2]
Radar protection thresholds
-74+10*log10 (𝐵𝑊120
) 5+10*log10 ( 𝐵𝑊120
) -131 +10*log10 ( 𝐵𝑊120
)
Where: BW is the total 3.4 GHz bandwidth assigned to the licensee for downlink transmissions in the band 3410 to 3600 MHz in MHz Note [1]: The protection thresholds are defined at the peak of the main radar beam. Note [2]: The protection thresholds are defined during the ‘on’ period of the transmit signal.
Compliance with the thresholds A13.36 Prior to deployment, the 3.4 GHz licensee must assess whether the protection
thresholds specified in Figure A13. 6 will be exceeded as a result of its planned deployment in the 3.4 GHz band for any Protected Radar.
A13.37 In carrying out this assessment the 3.4 GHz licensee must use the appropriate propagation model as follows:
• For 3.4 GHz deployments further than 1.5 km from the Protected Radar, ITU-R P.452-14 with the parameters given in Figure A13. 7.
• For 3.4 GHz deployments at or within 1.5 km from the Protected Radar, ITU-R P.525-2 (Free Space Path Loss) + 6 dB additional margin127.
A13.38 The 3.4 GHz licensee must ensure that the protection thresholds are not exceeded in any pointing direction of the Protected Radar antenna using the relative horizontal antenna gain pattern described below. The horizontal radar polar diagram will be used to sum all the communications signals according to the radar antenna sensitivity in different horizontal directions. The radar antenna peak gain is accounted for in the protection thresholds and radar antenna polar diagrams provided are referenced to the maximum radar antenna gain, which is 34 dBi, i.e. an effective aperture of 2.678 dB/m2 in the main beam direction.
A13.39 The summed field strength is the value that must not exceed threshold limits. The 3.4 GHz licensee must take into account in its analysis the OOB emissions that would be generated in the presence of closely spaced 3.4 GHz deployments.
127 This margin accounts for multipath. It represents a single multipath base station signal reflection received coherently at the radar via a reflecting structure or surface (i.e. buildings, vehicles, pylons, reflective ground structures, etc.). This is assumed when a base station is located within 1.5 km range of the radar.

Technical coexistence issues for the 2.3 and 3.4 GHz award
176
A13.40 The 3.4 GHz licensee must maintain records of its calculations and assessments and make these available to Ofcom if required.
Exceeding the threshold
A13.41 The thresholds may only be exceeded in relation to a specific Protected Radar if the 3.4 GHz licensee has reached an agreement with the operator of that Protected Radar. However, any such agreement would be limited to that specific Protected Radar, and would not remove the obligation of the 3.4 GHz licensee to comply with the relevant thresholds in relation to other Protected Radars. Any such agreement must be recorded in writing in a form agreed by both the 3.4 GHz licensee and the radar operator. The 3.4 GHz licensee must maintain a record of all such agreements, and make them available to Ofcom on request.
Propagation model
A13.42 The path loss will be calculated using Recommendation ITU-R P.452 “Prediction procedure for the evaluation of microwave interference between stations on the surface of the Earth at frequencies above 0.7 GHz”128.
A13.43 It predicts signal levels exceeded for a given percentage of time, the assessment will use a time percentage of 0.1% as included in the table below.
A13.44 Predictions are based on the terrain profile and clutter along the path.
A13.45 A propagation correction due to clutter shall be applied. This is based on a representative clutter height assigned to each clutter category.
Figure A13.7: ITU-R P.452 parameters
Time percentage 0.100% Sea level surface refractivity N0 325 deltaN = [ N(0m) - N(1000m) ] 45 Dry air pressure (hPa) 1013 Temperature (°C) 15.0 Nominal path centre latitude (°) 51.0 Clear-air propagation attenuation components included:
Line of sight/Diffraction - Diffraction - Multipath and focussing effects - Gaseous absorption Tropospheric scatter - Gaseous absorption Ducting/Layer reflection - Gaseous absorption
The path centre latitude may be selected on a case by case basis.
128 www.itu.int/rec/R-REC-P.452/en

Technical coexistence issues for the 2.3 and 3.4 GHz award
177
Terrain database
A13.46 Ordnance Survey “Land-form Panorama®” 50 m resolution digital terrain map data or other equivalent shall be used.
Clutter database
A13.47 The 50 metre resolution clutter dataset produced by Infoterra or other equivalent shall be used.
A13.48 The Infoterra dataset identifies 10 different clutter categories. For location variation these are mapped to the required clutter designations with heights.
A13.49 The default parameters for representative clutter heights are as defined in ITU-R P.452.
Figure A13.8: Infoterra clutter code mapping
Infoterra Clutter Code Description Nominal height (m) 0 Open 4
1 Suburban 9
2 Urban 20
3 Villages 5
4 Open in Urban 4
5 Forest 15
6 Water 0
7 Dense Urban 25
8 Park recreation 4
10 Industry 20 Radar horizontal antenna pattern
A13.50 The table below shows the radar horizontal antenna pattern (symmetrical about 180 degrees) that must be used for power density calculations
A13.51 The gain of the radar beam at its peak response is 34 dBi.
Figure A13. 9: Antenna pattern with reference to the main beam peak
Angle from boresight (degrees) Gain wrt to peak (dB) At or greater than angle: Less than angle:
0 0.5 0 0.5 0.6 -1 0.6 0.7 -2 0.7 0.8 -3 0.8 0.9 -5 0.9 1 -7 1 2 -10

Technical coexistence issues for the 2.3 and 3.4 GHz award
178
2 3 -15 3 4 -30 4 15 -20
15 16 -25 16 30 -30 30 31 -35 31 60 -40 60 61 -35 61 120 -30
120 121 -35 121 180 -40
List of military and civil radars to be protected
A13.52 The radars to which these coordination procedures apply are listed in the table below. The area where the radar is protected is limited by the current position and within the airfield boundary129. This list will be periodically updated.
A13.53 The list can be found at: http://stakeholders.ofcom.org.uk/binaries/spectrum/clearance-coexistence/Protected_radar.pdf.
129 The CAA has records of airfield boundaries as part of its aerodrome licensing, available at http://www.caa.co.uk/default.aspx?catid=375&pagetype=90&pageid=5373.