Embed Size (px)
Citation preview

Page 1 of 31
Annex G: Design Basis for the Case Analysis
Mexico’s deepwater areas.
Cantarell is a oil and gas field located in Mexico. Once considered the second largest of the world, it drop dramatically its production in 2007 after reach its peak of production in the earliest 2000’s. With its fall the need of Exploratory works and field development increased considerably in basins that before were not considered to be commercially feasible.
PEMEX Exploración and Producción (PEP) is the only Operator allowed by the Mexican Laws to explode the hydrocarbon resources of Mexico. Carlos Morales, General Director of PEP in the Offshore Technology Conference (OTC) 2009 resumes on the deep water strategy of PEMEX (Morales, 2009):
Mexican petroleum basins Six main geological basins are the current focus of our exploration efforts. “Deep water” is our new basin and is subject to a structured and strategic program to discover new reserves.
New reserves distribution by basin. At the present time, Southeastern Basins have contributed with the largest volumes of fresh reserves, located in shallow water, and reservoirs of Mesozoic age. This basin mainly produces heavy and light oil. However, the exploration wells in deep water of the Mexican side of the Gulf of Mexico are showing promising results. Most of the reserves of crude oil, are concentrated in Cantarell, Ku‐Maloob‐Zaap (Southeastern Basins), Chicontepec, and Bermudez Complex (Tampico Misantla). Non associated gas is also present in Burgos, Veracruz, and Macuspana basins. Interestingly, a new non associated gas province prone has been discovered in deep water. Estimation of prospective resources
Basin
Principal hydrocarbon
Southeastern Basins Oil Tampico Misantla Oil Burgos GasVeracruz Gas Sabinas Gas Mexican deep water Oil ‐ Gas Table I: Hydrocarbon fluid characteristically found in the Mexican Basins
Figure I: Distribution map of the Basins in the Mexican territory.

Page 2 of 31
Mexico’s hydrocarbons potential has been calculated by PEMEX as 52.0 Billion barrels of oil equivalent (B.O.E.) Of that, 56% of the prospective resources are located in deep water of the Gulf of Mexico and 32% in the Southeastern of Mexico, where Pemex presently develops a large amount of its operations.
Table II: 3P Reserves discoveries in Millions of, prospective Resources in Billions of BOE. In 2003‐2005 the first comprehensive geological – geochemical modeling of the Gulf of Mexico was made. This modeling has allowed PEMEX to define and direct its exploratory strategy, classify exploratory leads by hydrocarbon type, and risk, and Model updating with drilled wells, and semiregional studies (See figure II). Nine areas were defined as the most important for Mexican deep water, considering economical value, prospective resource size, hydrocarbon type, geological risk, proximity to production facilities, and environmental restrictions, as the most relevant criteria. See Figure III and table III.
Area Risk Water depth (m) 1. Perdido folded belt Low‐Moderate >2,0002. Oreos Moderate‐High 800‐2,0003. Nancan High 500‐2,5004. Jaca‐Patini Moderate‐High 1000‐1,5005. Nox‐Hux Moderate 650‐1,8506. Temoa High 850‐1,9507. Han Moderate – High 450‐2,2508. Holok Low‐moderate (Western) 1,500‐2,000 High (Eastern) 600‐1,1009. Lipax Moderate 950‐2,000
Table III: Mexican deep water areas after PEMEX.
Basin 2003 2004 2005 2006 2007 2008 Prospective Resources (Bboe)
As a % of Total Prospective Resources
Mexican deep water 0 32.6 0 349.3 138.9 0 29.5 56.7
Southeastern 380.6 632.1 778.1 487.6 865.2 1,372.90 16.7 32.1
Tampico‐Misantla 91.4 105.5 29.6 0 0 0 3.1 6
Burgos 164.8 93 76.3 67.3 32.6 48.9 1.7 3.3
Sabinas 28.8 15.2 0 0 0 0 0.7 1.3
Veracruz 43.1 37.7 66.3 62 16.5 60.3 0.3 0.6
Total 708.7 916.1 950.3 966.2 1053.2 1482.1 52.0 100.0

Page 3 of 31
Figure II: Prospective hydrocarbon fluids in Mexican offshore areas
Figure III: Mexican deep water areas after PEMEX(See table III).
The integral business unit Holok‐Temoa was created by PEP in 2007 to develop and manage the fields Lakach, Lalail and Noxal all of them with non associated gas reservoirs (i.e. dry gas reservoirs). Below it is shown an extract from the published reserves in 2009, 2008 and 2007 for the Holok‐Temoa Integral Business Unit (PEMEX, 2009, 2008 and 2007), amounts in red were obtained by direct interpolation of the published amounts.
• Extra heavy oil (<12° API) • • Heavy oil (13‐22° API) • • Heavy oil (22‐27° API) • • Light oil (28‐37° API) • • Super light oil (38‐42° API) • • Dry gas / super light oil

Page 4 of 31
Reserves by Field
Original in place volume Hidrocarboons Reserves Gas Reserves Oil Natural
Gas Crude Oil Equivalent
Oil Condensate Plant liquids
Dry Gas Natural Gas
Dry Gas
MMB MMMCF MMBOE MMB MMB MMB MMBOE MMMCF MMMCF Proved 0 428.5 70.4 0 4.4 13.6 52.3 308.6 272.1Lakach 428.50 70.4 4.4 13.6 52.3 308.5 272.1 Lalail Noxal
Probable 0 910.4 130.1 0 6.8 20.4 102.9 606.9 535.2 Lakach 546.6 78.1 4.1 12.2 61.8 364.4 321.3Lalail 363.9 52.0 2.7 8.2 41.1 242.6 213.9 Noxal 2P 0 1,338.90 200.5 0 11.2 34 155.2 915.5 807.3
Lakach 975.1 148.5 8.5 25.8 114.1 672.9 593.4 Lalail 363.9 52.0 2.7 8.2 41.1 242.6 213.9Noxal
Possible 0 2,158.80 314.5 0 12 36.1 266.4 1,514.80 1,385.40Lakach 757.6 106.6 3.0 8.9 94.8 628.90 581.1 Lalail 817.4 121.9 5.1 15.5 101.3 466.2 425.6Noxal 583.6 85.9 3.9 11.7 70.3 420.2 379.1
Total (3P) 0 3,497.70 514.9 0 23.2 70.1 421.6 2,430.30 2,192.70 Lakach 1,732.70 255.1 11.5 34.7 208.9 1,301.80 1,174.5 Lalail 1,181.30 173.9 7.8 23.7 142.4 708.8 639.5Noxal 583.60 85.9 3.9 11.7 70.3 420.2 379.1
Table IV. Reserves in charge of the Integral Unit Business Holok-Temoa.

Page 5 of 31
1.0 Lakach Field The field Lakach from where it is expected to get a gas production of 398 million of cubic feet per day (MMCFD) by the 2013 with a production expected to reach a maximum of 439 MMCFD in 2017. (Secretaría de Energía, 2008). Production test running there have returned from 25 to 30 mmcfd in a vertical well, the estimates published by PEMEX have been set the proved, probable and possible reserves of non associated natural gas in 308.5, 364.4 and 1,301.80 Billions of Cubic feet (BCF) respectively.
Reserves Lakach Field
Original in place volumen Hidrocarboons Reserves Gas Reserves Oil Natural
Gas Crude Oil Equivalent
Oil Condensate Plant liquids
Dry Gas Natural Gas
Dry Gas
MMB MMMCF MMBOE MMB MMB MMB MMBOE MMMCF MMMCF Proven 0 428.5 70.4 0 4.4 13.6 52.3 308.6 272.1
Probables 546.6 78.1 4.1 12.2 61.8 364.4 321.32P 975.1 148.5 8.5 25.8 114.1 672.9 593.4
Possible 757.6 106.6 3.0 8.9 94.8 628.90 581.1Total (3P) 1,732.70 255.1 11.5 34.7 208.9 1,301.80 1,174.5
Table 1.1 Reserves considered in the Lakach development project.
Below it is shown a probabilistic model of the reserves according to table 1.1. It was obtained by running a Monte Carlo simulation in the program @RISK for Excel 5.5, Industrial Version, Palisade 2009, with 10,000 iterations; results obtained are shown in the next page. The model was designed to fulfill the requirements described in the document “Guidelines for the Evaluation of Petroleum Reserves and Resources” Pp. 45 (SPE, 2001).
Reserves are typically grouped in two fundamental ways: • As Proved (1P) Reserve entities alone, from which Proved Reserves are calculated. • On a cumulative basis, from which the Proved plus Probable (2P) or the Proved plus Probable plus Possible (3P) reserve is calculated… The definitions require that, when probabilistic methods are being used, there shall be at least a 90% probability (P90) that the quantity actually recovered will equal or exceed the estimate quoted. The definitions go on to state that there shall be at least a 50% probability that the quantities actually recovered will exceed the sum of the 2P reserves. Likewise, there shall be at least a 10% probability that the 3P reserves will be equalled or exceeded.
Reserves
Classification located in the Lakach Field from table 1.1
Base case MMBOE
MinimumMost Likely
Maximum MinimumMMBOE
Most Likely
MMBOE
MaximumMMBOE
Proven 70.4 0% 90% 360% 0 63 253Probable 78.1 0% 50% 238% 0 39 186Posible 106.6 0% 25% 100% 0 27 107
Total 255
Table 1.2 Parameters of the Monte Carlo model for simulation purposes.

Page 6 of 31
Figure 1.2 Results of simulation of the model of reserves located in the Lakach Field from table 1.2
Figure 1.3 Fit comparisons for the model of reserves in the Lakach Field from table 1.2
Statistics Percentile Minimum 22.11 5% 86.80 Maximum 402.79 10% 103.10Mean 177.03 15% 114.79Std Dev 59.08 20% 124.79Variance 3490.18159 25% 133.95

Page 7 of 31
Skewness 0.351521499 30% 143.07Kurtosis 2.946435815 35% 151.05Median 173.62 40% 158.92Mode 181.54 45% 166.27Left X 86.80 50% 173.62Left P 5% 55% 180.95Right X 280.90 60% 188.51Right P 95% 65% 196.77Diff X 194.11 70% 205.98Diff P 90% 75% 215.45#Errors 0 80% 226.01Filter Min Off 85% 238.86Filter Max Off 90% 255.92#Filtered 0 95% 280.90
Table 1.3 Summary statistics from the simulation of the model of reserves in the Lakach Field from table 1.2 The Lakach development project has a total budget of 14,575.8 million Mexican pesos (approximately 1,100 Millions of USD) along 5 years from 2007 according to the information provided by the Ministry of Energy of Mexico in its 2nd. Inform of Results (SENER, 2008). The resources for this project are to be used in activities of delimitation of the reservoir and the offshore field development.
2.0 DESIGN BASIS
2.1 Reservoir characteristics The following information has been taken from the document Hydrocarbon Reserves of Mexico Evaluation as of January 1, 2007. Pp 36‐41 (Pemex, 2007).
Structural Geology In the tectonic structure, the Lakach field is an anticline to the south of the Lakach‐Labay alignment in a northwest‐southeast direction. The alignment is located at the southeastern end of the Mexican Cordilleras, Figure 4.2. (See figure 2.1 in this document) Stratigraphy The stratigraphic column cut by the Lakach‐1 well, which consists of rock the range from the Recent‐Pleistocene to the Lower Miocene, is made up an interbedding of clay horizons with limolites and lithic sandstones. The rocks that form the Lower Miocene age reservoirs mostly consist of lithic sandstone and limolites, and correspond to turbiditic fans and submarine channels in a slope environment. Seal The rock seal of the upper and lower part of both reservoirs largely consists of shales more than 30 meters thick and with broad lateral distribution. It is a combined type: structurally it is confined by an asymmetric anticline with its own closing at a reservoir level, whose dimensions are 10 kilometers long and 2 kilometers wide for reservoir

Page 8 of 31
1 and 13 kilometers long by 2 kilometers wide for reservoir 2, where the structure has a normal fault with a low displacement in a northeast‐southwest direction as a result of the lithostatic charge. The seismic response of the reservoirs shows clear direct indicators of hydrocarbons; the limits of the anomalies are concordant with structural contours, as can be seen in Figure 4.3. (See figure 2.2 in this document) Bright spots were identified in the seismic interpretation, both at the crest of reservoir 1 (interval 3,174‐3,212 meters below rotary table) and in reservoir 2 (interval 3,035‐3,127 meters below rotary table), Figure 4.4. (See figure 2.3 in this document)
Trap
Source Rock The results of the isotopic analyses of the gas samples recovered from the Lakach‐1 well show an origin with an affinity to Upper Jurassic Kimmeridgian rocks that have high thermal maturity. Reservoirs Reservoir 1 is composed by lithic sandstone with fine to coarse granulometry, limestone‐clay matrix and calcareous cement with primary intergranular and secondary moldic porosity of 15 to 28 percent, measured in the laboratory based on the cores cut in this reservoir. The production tests yielded 25 million cubic feet of gas per day. Reservoir 2 is formed by fine to coarse grain lithic sandstone, limestone‐clay matrix and little calcareous cement, with interbedding of conglomerate sandstones and poligmithic conglomerates.
Figure 2.1 Structural contouring of the Lower Miocene top showing the struc‐ture’s normal internal faults. (Figure 4.2, PEMEX, 2007)
Figure 2.2 The amplitude anomaly of Lakach showing concordance with the structural contours. (Figure 4.3, PEMEX, 2007)

Page 9 of 31
The porosity is primary intergranular and secondary moldic of 15 to 25 percent and the water saturation is 31 percent, which means a net thickness of 38 meters. The production tests in reservoir 2 yielded 30 million cubic feet of gas per day.
Figure 2.3 Seismic line where bright spots can be observed in the top of reservoirs 1 and 2, as well as the top of production test 4, and the flat spot at the base of reservoir 2. (Figure 4.4, PEMEX 2007)
2.2 Field location, water depth and wells location Lakach‐1 appraisal well is located in Mexican territorial waters of the Gulf of Mexico, off the coast of Veracruz, 131 kilometers northwest of the Port of Coatzacoalcos, Veracruz, in a water depth of 988 meters. It is geologically located in the southeastern portion of the Mexican Cordilleras. According to the information released by Pegasus International on a concept study performed by the company on the Lakach field (Pegasus‐International, 2008‐2009), Six subsea wells are suggested to be located in water depths ranging from 942‐1145 meters. The Secretary of Environment and Natural Resources of México (Semarnat‐2009) mention on the Lakach project that 8 wells distributed in the seismic polygon denominated Holok Poniente will be drilled by semisubmersibles platforms. The eight wells will be interconnected to Pipeline end terminations (PLET´s) and those to two submarine pipelines to the Compresion Station No.5 of Lerdo. The well “Lakach‐2DL” (PEMEX, Licitación…, 2008) establishes the coordinates of the system as Latitude = 19° 04´ 17.14´´ N; Longitude = 95° 16´ 16.52´´ W; Water dept 1,210 m. Considering it as the well at deepest water of the references it will be assumed that it is a well for delimitation purposes.
Since the locations of the wells have not been released It will be assumed by interpretation of the figure No. 1.2; and by using the data base of the General Bathymetric Chart of the Oceans

Page 10 of 31
(GEBCO) (GEBCO, 2009) as a reference for a reasonable water depth assumptions the next locations and profundity of the wells. Name of the
well Purpose Water depth (m) Latitude Longitude
P1 Productive 942 95°16’ 32” W 19° 01´ 06” N P2 Productive 968 95°16’ 10” W 19° 01´ 27” N P3 Productive 1005 95°16’ 53” W 19° 02´ 03” N P4 Productive 1054 95°16’ 55” W 19° 02´ 50” NP5 Productive 1100 95°16’ 55” W 19° 02´ 20” N P6 Productive 1145 95°16’ 08” W 19° 03´ 26” N 2DL Delimitation 1210 95°16’ 32” W 19° 01´ 06” N
Table 2.1 Assumed location of wells of the lakach field.
2.3 Metocean characterization So far, there is no available information from PEMEX regarding to the metocean conditions in the region. The most proximate zone documented is limited by the coordinates N 19°, W 93°30’, N 18°26’ y W 92° in an area knew as “Litoral Tabasco” in shallow waters located to the south east of the Holok‐Temoa Area. The Reference Norms “NRF‐013‐PEMEX‐2005, Diseño de Líneas Submarinas en el Golfo de México (Design of submarine pipelines in the Gulf of Mexico)”, “NRF‐003‐PEMEX‐2007, Diseño y evaluación de plataformas marinas fijas en el golfo de México (Design and Evaluation of Fixed Marine Platforms in the Gulf of Mexico” give references in their contents and annexes on the oceanographical conditions and meteorological data in Litoral Tabasco up to 200 m of water depth.
Hurricanes and tropical storms are commonly present in the Gulf of Mexico usually in the second semester of the year. However the conditions in the Mexican site is usually mildest than the present in the north Gulf of Mexico due the paths of the hurricanes is often directed to the north and the shield effect that produces the Yucatan peninsula weakening the strength of the hurricanes as they passed on firm land. Consequently, the hurricane seasons in 2004‐2005 did not affected the activities of the Mexican offshore facilities as it did in the US territorial waters; nevertheless it is likely to expect this kind of phenomena strengthened in the future years due the climatic change. Safety in the design is the most relevant way to avoid disasters, hence this is the criteria to consider for the most extreme conditions for the Gulf of Mexico as considered relevant to the Central Gulf of Mexico according to API 2 INT–MET. The American Petroleum Institute, has released a document product of the re‐evaluation of the metocean conditions due the impact of the hurricanes where changes in the expected conditions observed since the API RP2A were last updated are being proposed. The document is available on the API web site with the code:
API BULL 2INT‐MET Revision / Edition: 07 Chg: Date: 05/00/07
INTERIM GUIDANCE ON HURRICANE CONDITIONS IN THE GULF OF MEXICO

Page 11 of 31
Based on this document at the OTC 2007 the paper “Development of Revised Gulf of Mexico Metocean Hurricane Conditions…” (Berek, 2007) was presented. From there, it is shown in the table 2.2 the Independent Extreme Values for Tropical Cyclone Winds, Waves, Currents and Surge, Central Gulf of Mexico. Table 2.3 shows the suggested combination factors for combining independent extremes into load cases where the water depth is ≥ 150 m. For the area Litoral Tabasco in NRF‐013‐PEMEX‐2005, Wave and currents will be considered in the direction toward S 11° 15’ E and the current will be parallel to the batimetric profile. Batimetric profile to be considered uniform and regular. Considering the proximity of that zone with the one in this study case, It will be assumed the same data.
Return Period (Years) 10 25 50 100 200 1000 2000 10000
Wind (10 m elevation)
1 hour mean wind speed (m/s) 33.0 40.1 44.4 48.0 51.0 60.0 62.4 67.2
10 min mean wind speed (m/s) 36.5 44.9 50.1 54.5 58.2 69.5 72.5 78.7
1 min mean wind speed (m/s) 41.0 51.1 57.4 62.8 67.4 81.6 85.6 93.5
3 sec gust (m/s) 46.9 59.2 66.9 73.7 79.4 97.5 102.5 112.8
Waves, Water Depth ≥ 1000 m
Significant Wave Height (m) 10.0 13.3 14.8 15.8 16.5 19.8 20.5 22.1
Maximum Wave Height (m) 17.7 23.5 26.1 27.9 29.1 34.9 36.3 39.1
Maximum Crest Elevation (m) 11.8 15.7 17.4 18.6 19.4 23.0 23.8 25.6
Peak Spectral Period (s) 13.0 14.4 15.0 15.4 15.7 17.2 17.5 18.2
Period of Maximum Wave (s) 11.7 13.0 13.5 13.9 14.1 15.5 15.8 16.4
Currents, Water Depth ≥ 150 m
Surface Speed (m/s) 1.65 2.00 2.22 2.40 2.55 3.00 3.12 3.36
Speed at Mid‐Depth (m/s) 1.24 1.50 1.67 1.80 1.91 2.25 2.34 2.52
0‐Speed Depth (m) 69.3 84.2 93.2 100.8 107.1 126.0 131.0 141.1
Water Level, Water Depth ≥ 500 m
Storm Surge (m) 0.32 0.52 0.66 0.80 0.93 1.13 1.22 1.41
Tidal Amplitude (m) 0.42 0.42 0.42 0.42 0.42 0.42 0.42 0.42
Table 2.2: Independent Extreme Values for Tropical Cyclone Winds, Waves, Currents and Surge, Central Gulf of Mexico, 89.5° W to 86.5° W, Draft for API RP Development, (Table 1, Berek, 2007)
2.4 Seafloor soil The seafloor soil characteristics should are not expected to present major challenges than in the sea floor of the North of the Gulf of Mexico, hence the soil will be considered suitable for pile foundation and drag anchor. This is another rough assumption for the case of study due the lack of official information but is based on the expected similitude of the sea floor in the area to the one presented in the deep water of the Bay of Campeche.

Page 12 of 31
In the Area of the Bay of Campeche (Heideman 1994) and (Martinez 1996) documented soil with similar characteristics to the one that is found in the Northern Gulf of Mexico.
… Seafloor Soils A study by Creager (1958) contains superficial soil information obtained from sampling stations all over the Bay of Campeche, including two stations near the area of interest. The soil samples were clay to silty clay, with kaolinite/illite/montmorillonite proportions of about 1.1/1/1.7 and calcium carbonate content of 14‐18 %. Fugro‐McCIeiiand conducted an extensive investigation in 1993, including the area of interest (Dutt and Kubena, 1994). They found that the soil is normally consolidated siliceous clay similar to what is typically found offshore Louisiana and Texas, with a shear strength profile that increases linearly with depth at about 8‐10 psf/ft. Consequently, pile foundation and drag anchor design are expected to be similar to those offshore Louisiana and Texas. (Heideman, 1994, P.p. 2) … 4) Geotechnical data. ‐ The typical soil in site basically is constituted for clay with a varying shear strength from 0.04 to 2.15 kg/cm2 between O to 80 meters, considering a constant value of 1.20 kg/cm2 up to the bottom of the hole. The consistency varies from low to high consolidation. (Martinez, 1996, P.p. 3)
Return Period (Years) 10 25 50 100 200 1000 2000 10000
Peak Wave Case:
Wind Speed 1.00 0.95 0.95 0.95 0.95 0.95 0.95 0.95
Wave Height 1.00 1.00 1.00 1.00 1.00 1.00 1.00 1.00
Current (both speed and depth level) 0.80 0.80 0.75 0.75 0.75 0.75 0.75 0.75
Surge 0.90 0.80 0.70 0.70 0.70 0.70 0.70 0.70
Wind Direction from Wave (deg) ‐15 ‐15 ‐15 ‐15 ‐15 ‐15 ‐15 ‐15
Current Direction from Wave (deg) +15 +15 +15 +15 +15 +15 +15 +15
Peak Wind Case:
Wind Speed 1.00 1.00 1.00 1.00 1.00 1.00 1.00 1.00
Wave Height 1.00 0.95 0.95 0.95 0.95 0.95 0.95 0.95
Current (both speed and depth level) 0.80 0.80 0.75 0.75 0.75 0.75 0.75 0.75
Surge 0.90 0.80 0.70 0.70 0.70 0.70 0.70 0.70
Wind Direction from Wave (deg) ‐15 ‐15 ‐15 ‐15 ‐15 ‐15 ‐15 ‐15
Current Direction from Wave (deg) +15 +15 +15 +15 +15 +15 +15 +15
Peak Current Case:
Wind Speed 0.75 0.70 0.70 0.70 0.70 0.70 0.70 0.70
Wave Height 0.75 0.70 0.70 0.70 0.70 0.70 0.70 0.70
Current (both speed and depth level) 1.00 1.00 1.00 1.00 1.00 1.00 1.00 1.00
Surge 0.90 0.80 0.70 0.70 0.70 0.70 0.70 0.70
Wind Direction from Wave (deg) 0 0 0 0 0 0 0 0
Current Direction from Wave (deg) +50 +50 +50 +50 +50 +50 +50 +50

Page 13 of 31
Table 2.3: Factors for Combining Independent Extremes into Load Cases, WD ≥150 m, Draft for API RP Development, (Table 6, Berek, 2007)
2.5 Seismic Activity The area of the development is typically active in comparison to the North of the Gulf of Mexico Region which is typically assumed as a Zone 0 region by API‐RP2A peak ground acceleration. (Heideman et. al., 1994) contribute to the discussion on the Bay of Campeche region by showing that apparently the most of the earthquakes have occurred onshore and relatively few near the area of the development. They stimate that the Bay of Campeche could be an API Zone 2 to 3 with peak ground acceleration of 0.1‐0.2 g. However is suggested in their work to perform detailed seismic studies. A study performed for the Minerals Management Service (MMS) in cooperation with the Offshore Technology Research Center Under (OTRC) (Brown et. al, 2003) shows that historically the North of the Gulf of Mexico is not subject to seismic activity as high and frequently as the south of the Gulf of Mexico. The figure 2.5 shows the epicenters of Earthquakes in GOM Region and Bay of Campeche Region 1974‐2003 (Latitude Range 18°‐ 32° and Longitude Range ‐98° to ‐82°). The data of the table 2.4 shows the lists the events that have occurred in the Bay of Campeche area from 1974 to 2003 contained within a rectangular area extending from 18° to 20° latitude and ‐98° to ‐90° longitude. The table gives information on the date, time, magnitude, and location of the seismic event. In the period covered by the study in the Mexican territorial waters there were eight seismic events with Richter magnitudes between 3.1 and 3.9 and 18 events with between 4.1 and 4.7. Most of these events were located close to the coastline in the Bay of Campeche with depths less than 33 km, although some of the epicenters of these events were as deep as 250 km.
Figure 2.5 Recorded epicenters of Earthquakes in GOM Region and Bay of Campeche Region 1974‐2003 (Latitude Range 18°‐ 32° and Longitude Range ‐98° to ‐82°)

Page 14 of 31
Year TIME UTC
(hhmmss.mm) Latitude (degrees)
Longitude (degrees)
Magnitude (Richter) Depth (km)
07/25/1974 95338.9 19.37 ‐96.25 4.5 76
09/20/1974 113326 18.91 ‐93.49 4.1 45
08/28/1977 235738.4 18.61 ‐94.39 3.8 33
12/31/1983 202132 18.77 ‐95.69 4.4 33
10/07/1985 195819.4 19.75 ‐96.17 N.A. 33
06/09/1986 214222.1 18.57 ‐95.46 N.A. 33
04/07/1987 20246.58 19.58 ‐92.09 4.7 10
08/14/1987 94032.46 19.01 ‐96.11 4.4 130
07/31/1990 73010.71 18.52 ‐94.51 4.7 33
11/23/1990 201737.9 18.5 ‐95.79 N.A. 10
11/27/1991 120033.3 19.22 ‐95.78 3.6 33
06/05/1992 34252.19 18.94 ‐95.82 4.4 39
04/12/1993 202034 18.74 ‐95.31 3.7 33
04/30/1993 114856.8 19.39 ‐96.06 N.A. 33
04/30/1993 150538.7 19.34 ‐96.08 3.4 33
11/10/1994 210315.7 19.31 ‐95.27 N.A. 33
04/11/1995 14231.51 18.77 ‐95.28 N.A. 33
03/14/1996 91211.94 19.53 ‐92 4.3 33
10/31/1996 21223.2 19.3 ‐95.33 3.6 10
03/18/1997 15944.66 19.64 ‐91.99 3.9 33
04/15/1997 11234.04 19.63 ‐95.76 3.8 250
07/11/1997 210830.7 19.39 ‐92.15 4.1 33
09/01/1997 105019.5 18.94 ‐95.84 4.3 33
09/23/1997 4716.77 19.66 ‐91.76 4.1 10
01/14/2000 222254.2 19.46 ‐92.01 4.3 10
03/24/2000 175830.8 18.91 ‐95.58 4.1 26
06/05/2000 115931.5 19.01 ‐95.68 4.4 20
08/11/2000 81955.3 19.55 ‐96.41 4.1 4
04/19/2001 214250.8 19.24 ‐95.9 4.1 16
07/09/2001 134642.8 19.24 ‐96.28 3.7 25
07/21/2001 951.19 19.42 ‐92.14 4.2 33
07/23/2001 65921.1 18.5 ‐95.47 4 26
Table 2.4 List of the seismic events that have occurred in the Bay of Campeche area, contained within a rectangular area extending from 18° to 20° latitude and ‐98° to ‐90° longitude.
2.6 Details of existing facilities and infrastructure.
2.6.1 Appraisal wells Vertical appraisal well Lakach‐1 discovered two reservoirs. Reservoir 1 production tests yielded 25 million cubic feet of gas per day. The production tests in reservoir 2 yielded 30 million cubic feet of gas per day.

Page 15 of 31
2.6.2 Compression Station onshore available to be connected to the development Compression Station “Lerdo de Tejada” is one of the 8 compression stations operated by PEMEX Gas and Petroquímica Básica “PEMEX Gas and Basic Petrochemical” (PGPB).
Figure 2.5 Location of Lerdo Compression Station and Lakach 2DL Location (Google Earth System @2009) Characteristics of the Compression Station (CRE, 2009), are given in Table 2.5 while figure 2.6 shows the performance of an impellor installed in a turbo compressor in the mentioned compression station.
Gases Generator General Electric LM‐2500‐PB Nominal power 20.5 MW (27,500 HP) Maximum speed 9,870 Number of installed units 2
Compressor centrifuge model Clark‐ Dresser Centrifugal ‐ 7.5Design pressure 86.2 bars (1250 psia)
Maximum operation temperature 467 K (380 °F)
Nominal capability 18,358 CFMSpecific Consumption (ft3/hp/hr) 6.78
Maximum power on site 14.9 MW (20,000 HP)Number of installed units 2
Table 2.4: Technical description of the Compression Station Lerdo, (CRE, 2009)

Page 16 of 31
Figure 2.6 Proven performance of an impellor installed in a turbo compressor LAN‐Clark model 75‐75P (CRE, 2009)
2.6 Dynamically positioned drillingvessel type. PEMEX currently does not own drilling facilities that are able to operate in the water depths of the Lakach field, however they will have the availability of the rigs mentioned in table 2.6 through leasing (Reyes Heroles, 2009). These rigs are emplaced for exploration drilling but could be used to drilling and completion for the project, considering that it could save the handling of the contractual commitments.
Rig Maximum water depth (feet)
Availability Cost (US$/day)
Voyager 3,280 Oct‐2007 335,000 Max Smith 7,000 Aug‐2008 484,000
SS Petro Rig III 7,000 Jan‐2010 495,000 SS Dragon 7,000 Jan‐2010 503,000 SS Muralla 10,000 Sep‐2010 530,000
Table 2.6 Availability of floating drilling units dynamically positioned, (Reyes Heroles, 2009)
Lerdo Operation 2000‐2003
Lerdo Operation
1999
MCFM; Gas Volume at the intake of the impellor in thousand of cubic feet per minute
Ha ; Adiabatic load in feet
Page 17 of 31
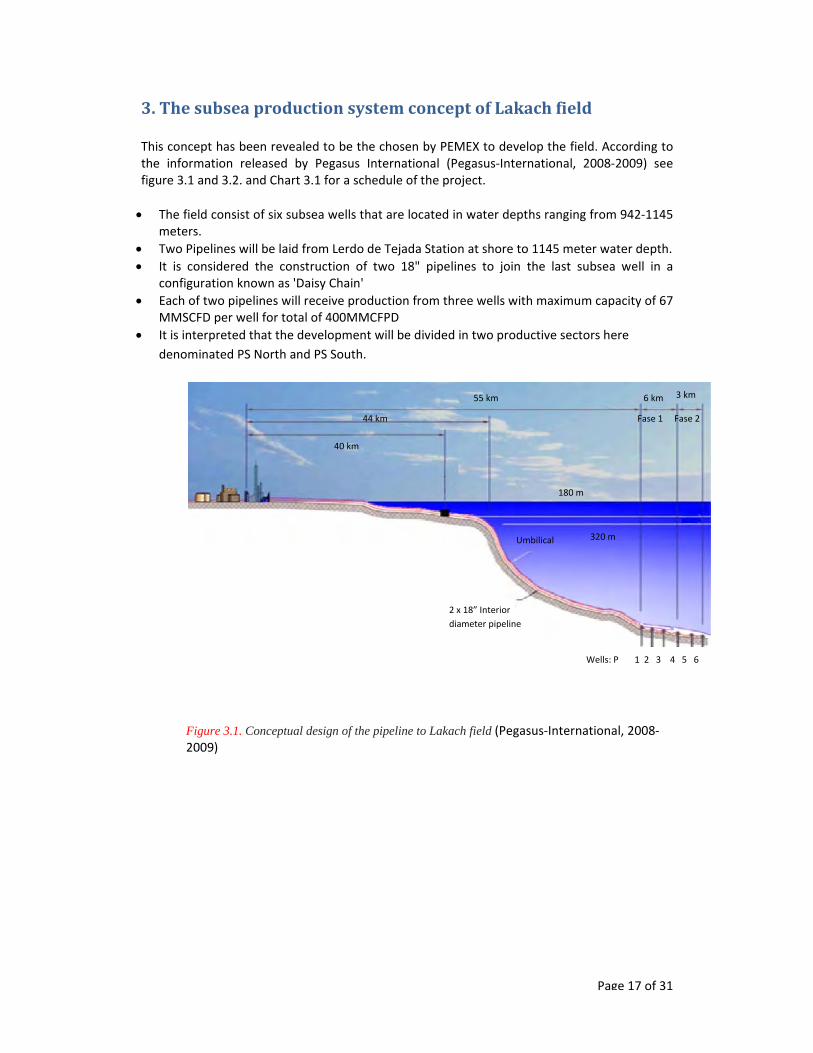
3. The subsea production system concept of Lakach field This concept has been revealed to be the chosen by PEMEX to develop the field. According to the information released by Pegasus International (Pegasus‐International, 2008‐2009) see figure 3.1 and 3.2. and Chart 3.1 for a schedule of the project. • The field consist of six subsea wells that are located in water depths ranging from 942‐1145
meters. • Two Pipelines will be laid from Lerdo de Tejada Station at shore to 1145 meter water depth. • It is considered the construction of two 18" pipelines to join the last subsea well in a
configuration known as 'Daisy Chain' • Each of two pipelines will receive production from three wells with maximum capacity of 67
MMSCFD per well for total of 400MMCFPD • It is interpreted that the development will be divided in two productive sectors here
denominated PS North and PS South.
Figure 3.1. Conceptual design of the pipeline to Lakach field (Pegasus‐International, 2008‐2009)
Umbilical 320 m
180 m
Fase 1 Fase 2
6 km 3 km
44 km
40 km
2 x 18” Interior diameter pipeline
55 km
Wells: P 1 2 3 4 5 6

Page 18 of 31
Figure 3.2. Path of the pipelines and illustration of the bathymetry in the area of the development, own interpretation from (GEBCO, 2009) and (PEMEX‐RMSO, 2008)
Chart 3.1. Schedule of the Lakach Development project with subsea production system according to own interpretation from (PEMEX-RMSO, 2008)
Compression Station Lerdo
Lakach Development area
PS South
PS North
95°10´ W 95°20´ W95°30´ W95°40´ W 95°50´ W
19°00´ N
18°50´ N Alvarado, Veracruz

Page 19 of 31
4. Lalail field (Extracted entirely from PEMEX Exploración y Producción, “Hydrocarbon
Reserves of Mexico Evaluation as of January 1, 2008” México, 2008.)
It is in the territorial waters of the Gulf of Mexico, off the coast of Veracruz, at 22 kilometers from the Tabscoob‐1 well and 93 kilometers Northwest of the Port of Coatzacoalcos, Veracruz, in a water depth of 806 meters, Figure 4.1.
It is geologically located on the Eastern edge of the Salina del Istmo sub‐basin in the Deep Gulf of Mexico Basin. The Lalail‐1 well continued with the discovery a series of non‐associated gas reservoirs in the deep waters of the Gulf of Mexico in Lower Miocene rocks.
Structural Geology
The field is on the Western edge of the Salina del Golfo Province, which like the Catemaco Folded Belt, has alignments in a Northeast to Southwest direction that are affected by saline bodies. The interpretation is that the salt in this area occurred mainly during the Pleistocene‐ Recent because there are signs of syntectonic folds and wedges derived from the Pliocene contraction.
The structure is an anticline that closes against reverse faults to the Northwest and Southeast and there is a fault to the Northeast of the well that divides the structure into two main blocks, Figure 4.2.
Figure 4.1 The Lalail‐1 well is in the Gulf of Mexico Deepwater Basin, in a water depth of 806 meters and 93 kilometers from the port of Coatzacoalcos, Veracruz.

Page 20 of 31
Stratigraphy
The geological column of the field covers siliclastic sedimentary rocks that range from the Lower Mioceneto the Recent Pleistocene. The chronostratigraphic crests were established through the analysis of planktonic foraminifer indexes in the channel and cores samples. The results of high‐resolution bio‐stratigraphic studies were used to illustratethat the deposit paleo‐environment of the reservoir rocks corresponds to a complex of submarine fans distributed in a bathymetry that ranges between external neritic to upper bathyal.
Seal
The rock type for the Oligocene and Miocene Plays corresponds to layers of basin shales. According to the Tabscoob‐1 well data, for the Oligocene, the thickness exceeds 100 meters, whereas in the sandy sequences of the Lower‐Middle Miocene, in addition to clay interspersing 30 to 50 meters thick, there is a package of shales more than 500 meters thick that correspond to the secondary transgression of the Lower Pliocene. The shaly sequence of the Pliocene thins out to the North, in the direction of the deep waters of the Gulf of Mexico.
Trap
It is a combined trap; structurally it is confided by an asymmetric anticline with its own closing at a reservoir level, whose dimensions are 6 kilometers long by 2 kilometers wide, Figure 4.3.
Source Rock
The results of the biomarkers make it possible to define these hydrocarbons as generated by Upper Jurassic Tithonian rocks, in a carbonated marine environment with a degree of siliclastic influence.
Reservoirs
Two reservoirs were discovered by drilling this well. Reservoir 1 is located at the 2,347.0‐2,431.5 meter interval, while reservoir 2 is between 2,257.0 and 2,333.5 meters. The storage rock of reservoir 1 consists of poorly sorted fine to coarse grain sands and lithic sandstones, almost without a matrix, the constituents are subrounded quartz grains, plagioclastic, muscovite, calcareous lithic fragments and abundant volcanic lithic fragments. The interangular primary and secondary moldic porosity ranges from 15 to 28 percent. A daily output of 18.1 million cubic feet of gas was obtained during the production tests.
Reservoir 2 is formed by fine to coarse grain lithic sandstone, limestone‐clay matrix and little calcareous cementing, with interspersing of conglomerate sandstones and poligmithic conglomerates. The interangular primary and secondary moldic porosity ranges from 15 to 25

Page 21 of 31
percent. A daily output of 3.2 million cubic feet of gas was obtained during the production tests in reservoir 2.
Figure 5.2 Structural maps showing the two reservoirs discovered in the Lalail field. It can be seen that the reservoirs are divided into two blocks.
Reserves
The original 3P volume of natural gas is 1,181.3 billion cubic feet. The estimated 3P reserves are 708.8 billion cubic feet of gas, which is equal to 138.9 million barrels of oil equivalent. The 2P reserves are estimated at 242.6 billion cubic feet of gas.
Figure 4.3 Seismic‐structural section showing well Lalail‐1 and the relationship between the structural and stratigraphic characteristics of the two reservoir blocks.

Page 22 of 31
5. Noxal Field (Extracted entirely from PEMEX Exploración y Producción, “Hydrocarbon
Reserves of Mexico Evaluation as of January 1, 2007” México, 2007.)
The Noxal‐1 well is in territorial waters of the Gulf of Mexico, off the coast of Veracruz, at 102 kilometers northwest of the Port of Coatzacoalcos, Veracruz, in a water depth of 935 meters, Figure 5.1.
It is geologically located in the Catemaco Folded Belt. The Noxal‐1 well found a new reservoir of non‐associated gas in deepwater bathymetries of the Gulf of Mexico in sandstone interbedded with limolite of the Lower Pliocene.
Figure 5.1 Location map of the Noxal‐1 well.
Structural Geology
Within the tectonic framework, the study area is in the northwestern portion of the Catemaco Folded Belt, Figure 5.2, which is bounded to the east by the Salina del Istmo Basin and to the west with the spurs of the Mexican Cordilleras. Noxal is in the southern portion of the Noxal‐Nen alignment and it is interpreted as a symmetrical anticline in a northwest‐southeast direction, generated by expulsion during the tectonic compression of the Lower to Middle Miocene, which produces a reverse fault, Figure 5.3.

Page 23 of 31
Stratigraphy
The stratigraphic column cut by the Noxal‐1 well consists of rocks that range from the Recent‐Pleistocene to the Lower Miocene, and it is made up of an interbedding of clay horizons with limolites and lithic sandstones. The chronostratigarphic crests were fixed by analyzing foraminifers in the channel and core samples cut by the well. The reservoir is at the Lower Pliocene level, which forms part of the turbiditic complexes and submarine channels deposited in a slope environment.
Figure 5.2 Structural contouring of the Lower Miocene top showing the location of the Noxal field within the Catemaco Folding Belt.
Figure 5.3 Structural contouring of the reservoir top with the amplitude anomaly superimposed. It is noted that the seismic amplitude anomaly is concordant with the structure

Page 24 of 31
Figure 5.4 The seismic line passing through the Noxal‐1 well showing the bright spots in the reservoir.
Trap
The trap is in an anticline with its own closing at the reservoir level and it is bounded by reverse faults on the northwestern and southeastern flanks. The dimensions are 9 kilometers long and 2 kilometers wide. According to the seismic interpretation, the reservoir horizon has bright spot anomalies, Figure 5.4. The limit of the width anomaly in the reservoir shows concordance with the structural contours.
Seal The rock seal of the upper and lower part of reservoir consists of shales more than 200 meters thick.
Source Rock The results of the isotopic analyses of the gas samples recovered from the Noxal‐1 well show an origin with an affinity to Upper Jurassic Kimmeridgian rocks that have high thermal maturity.
Reservoir The reservoir is composed by lithic sandstones with fine to very fine granulometry that graduates to limolite in the limestone‐clay matrix and calcareous cement with primary intergranular and secondary moldic porosity of 16 to 22 percent, and water saturation of 30 to

Page 25 of 31
50 percent. The Lower Pliocene reservoir produced 10 million cubic feet of gas per day and it is located at the 2,134‐2,202 meter interval.
Reserves
The 3P original volume of natural gas is 583.6 billion cubic feet. The 3P original reserves are estimated at 420.2 billion cubic feet of dry gas, which is equal to 80.8 million barrels of oil equivalent. All the reserves have been classified as possible.
6. Nab Field (Extracted entirely from PEMEX Exploración y Producción, “Hydrocarbon
Reserves of Mexico Evaluation as of January 1, 2005” México, 2005.)
Figure 6.1 Location of the Nab‐1 well in territorial waters of the Gulf of Mexico. The well was drilled in a 679‐meter bathymetry.
The offshore well was drilled in territorial waters of the Gulf of Mexico, at approximately 145 kilometers Northwest of Ciudad del Carmen, Campeche. It was drilled to a depth of 4,050 meters in a water depth of 679 meters, which makes it the well with the deepest water depth drilled to date in Mexico. The objective was to evaluate the potential of the Upper Jurassic Kimmeridgian and the Upper Cretaceous Breccia, and it became a heavy oil producer in the carbonate rock of the Upper Cretaceous Breccia. Figure 6.1 shows the location of this well within the Sonda de Campeche.

Page 26 of 31
Structural Geology
The structure of this field corresponds to a narrow block pushed out by compression. The block lies in a Northwest to Southeast direction and is bounded on both sides by reverse faults, Figures 6.2 and 6.3.
Figure 6.2 Structural configuration of the Upper Cretaceous Breccia crest. The reservoir is in an expelled structure caused by tectonic compression.
Figure 6.3 Deep seismic section showing the Nab field structure bounded by reverse faults.

Page 27 of 31
Stratigraphy
The geological column drilled consists of sediments from the Upper Jurassic Kimmeridgian to the Recent. The Upper Jurassic Kimmeridgian sediments that were deposited in a shallow water depth, consist of slightly shaly micro to mesocrystalline dolomite with microfractures; the Upper Jurassic Tithonian sediments are made up of shaly and bituminous mudstone partly sandy, showing a deeper environment and restricted circulation. The Lower Cretaceous is associated with dolomites with poor oil saturation in fractures. The Middle Cretaceous is characterized by microcrystalline dolomite with intercrystalline porosity and in fractures, with slight mobile oil saturation. This formation is interspersed with thin bentonitic shale horizons.
Figure 6.4 3D image of the Upper Cretaceous Breccia crest in the Nab field.
Mudstone to dolomitized and fractured wackestone were deposited in the Upper Cretaceous, with good heavy oil saturation. The Tertiary consists of interspersed shales with thin fine to medium grain sands alternations, while the Recent consists of poorly consolidated clays and sands.
Trap
At the Cretaceous and Upper Jurassic level, the trap is a structural type with a noticeable East‐West orientation and affected by reverse faulting to the North and South, Figure 6.4.

Page 28 of 31
Source Rock
The geochemical studies carried out in the area determined that the hydrocarbon source rock is of the Upper Jurassic Tithonian age and is made upof black bituminous shale and dark gray shaley limestone with abundant organic matter and broad regional distribution.
Seal
At a regional level, the seal is made up of plastic bentonitic shales partially calcareous of the Paleocene.
Figure 4.5 Petrophysical evaluation showing the intervals tested. Fractured dolomite can be seen in the thin lamina of the cores.

Page 29 of 31
Reservoir
The Upper Cretaceous reservoir is composed of slightly argillaceous limestones with a microcrystalline and breccia texture. The porosity is of the secondary, intercrystalline type in fractures and dissolution cavities, with average porosity values of 7 percent and water saturation of 17 percent.
Three production tests were carried out. The first in the Upper Jurassic Kimmeridgian in a hole discovered that did not reveal the presence of hydrocarbons. The second was carried out in the Middle Cretaceous without flow and only one sample of heavy oil was recovered.
The third test was carried out in the Upper Cretaceous Breccia with 8.8 degrees API extra‐heavy oil obtained and a production of 1,215 barrels per day and an initial pressure of 272 kg/cm2, using electorcentrifuge pumping. Figure 4.5 shows the processed well logs, indicating the oil and gas producer interval where the production test was made.
Reserves
The original volume of 3P oil reserves is 408.0 million barrels, while the original 3P oil equivalent reserves are estimated at 32.6 million barrels.

Page 30 of 31
REFERENCES:
• American Petroleum Institute (API), “Interim Guidance on Hurricane Conditions in the Gulf of Mexico”, Bulletin 2INT‐MET, USA, 2007.
• Brown L.A., M.S., Bracci J.M., Hueste M.B., Murff J.D. Texas A&M University, “Assessment of Seismic Risk for Subsea Production Systems in the Gulf of Mexico”, Final Project Report Prepared for the Minerals Management Service, Under the MMS/OTRC Cooperative Research Agreement 1435‐01‐99‐CA‐31003, Task Order 18204, Project Number 422, USA, December2003.
• Berek, E.P., ExxonMobil; Cooper, C.K. Chevron; Driver, D.B., BP; Heideman J. C. and Mitchell, D.A ExxonMobil, Stear, J.D., Chevron; and Vogel, M.J., Shell International EP “Development of Revised Gulf of Mexico Metocean Hurricane Conditions for Reference by API Recommended Practices”; Paper OTC 18903, Offshore Technology Conference, 2007.
• CRE (Comisión Reguladora de Energía), “Permiso de transporte de gas natural numero: G/061/TRA/99 Anexo 3 Características de tecnología, diseño, ingeniería y construcción Apéndice 3.1, Memoria técnico‐descriptiva del sistema de transporte. Consulted on internet at http://www.cre.gob.mx/registro/permisos/gas/Anexos/061tra99x/apn31.pdf, last visited August 28th 2009.
• GEBCO, “General Bathymetric Chart of the Oceans, The GEBCO_08 Grid, version 20090212,” http://www.gebco.net, 2009.
• Morales C. “Deep Water Exploration Strategy” Presentation of the Pemex Exploración y Producción General Director, Carlos A. Morales Gil in the Offshore Technology Conference, May 7th, 2009. Consulted in the web page
• Pegasus‐International, “Project description Lakach” consulted in the web page http://www.pegasus‐international.com/uploads/portfolio_letter_pdf_223.pdf, Pegasus International web site, August 13th, 2009.
• PEMEX Exploración y Producción, “Hydrocarbon Reserves of Mexico Evaluation as of January 1, 2005” México, 2005.
• PEMEX Exploración y Producción, “Hydrocarbon Reserves of Mexico Evaluation as of January 1, 2007” México, 2007.
• PEMEX Exploración y Producción, “Hydrocarbon Reserves of Mexico Evaluation as of January 1, 2008” México, 2008.
• PEMEX‐RMSO Exploración y Producción Región Marina Suroeste, “Resumen ejecutivo, Manifestación de impacto ambiental modalidad regional proyecto Lakach” México, 2008.
• PEMEX Exploración y Producción, “Licitación pública internacional TLC No. 18575088‐018‐08 anexo B‐1", México, 2008.
• PEMEX Exploración y Producción, “NRF‐013‐PEMEX‐2005, Diseño de Líneas Submarinas en el Golfo de México.” Comité de Normalización de Petróleos Mexicanos y Organismos Subsidiarios, México, 2005.
• PEMEX Exploración y Producción, “NRF‐003‐PEMEX‐2007 Diseño y evaluación de plataformas marinas fijas en el golfo de México.” Comité de Normalización de Petróleos Mexicanos y Organismos Subsidiarios, México, 2007.
• Reyes Heroles J.G.G., “Aspectos relevantes en materia de exploración y producción de hidrocarburos” Comparecencia del Director General de Petróleos Mexicanos, en la Comisión de Energía del Senado de la República, January 14th, 2009.
• SENER, Secretaría de Energía, “Prospectiva del mercado de gas natural 2008‐2017”, México, 2008.
Page 31 of 31
• SENER, Secretaría de Energía, “Segundo informe de labores”, México, 2008. • SEMARNAT, Secretaría de Medio Ambiente y Recursos Naturales, “Listado del ingreso
de proyectos y emisión de resolutivos derivados del procedimiento de evaluación de impacto y riesgo ambiental”, Gaceta Ecológica Año VII Separata N° DGIRA/001/09 SEMARNAT/DGIRA México, D. F. January 8th, 2009.
• SPE (Society of Petroleum Engineers), “Guidelines for the Evaluation of Petroleum Reserves and Resources”, USA, 2001.