Embed Size (px)
Citation preview

EUBIROD Statistical Materials – Deliverable D6.1 – August 2010
Annex 2
Statistical Materials:Sample EUBIROD
Central Engine Report

The BIRO System
Statistical Report
European Diabetes Indicators
www.eubirod.eu
November 2, 2010

The BIRO Consortium
A Public Health Project co-funded by DG-SANCO, European Commission, 2005-2008
Project Website: www.biro-project.eu
Scientific Coordinator: Prof.Massimo Massi BenedettiTechnical Coordinator: Fabrizio Carinci
Partners:
Joanneum Research, AustriaMinistry of Health, CyprusUniversity of Bergen, NorwayPaulescu Institute, RomaniaUniversity of Dundee, ScotlandUniversity of Malta, MaltaUniversity of Perugia, Italy
Subcontractors:
Serectrix snc, ItalyTelemedica Consulting, Romania
The EUBIROD Consortium
A Public Health Project co-funded by DG-SANCO, European Commission, 2008-2011
Project Website: www.eubirod.eu
Scientific Coordinator: Prof.Massimo Massi BenedettiTechnical Coordinator: Fabrizio Carinci
Partners:
Adelaide and Meath Hospital, Dublin, IrelandCentre Hospitalier de Luxembourg, LuxemburgDutch Institute for Healthcare Improvement, NertherlandsHavelhohe, BerlinHillerød University Hospital, Hillerød, DenmarkIMABIS Foundation, Malaga, SpainInternational Diabetes Federation, BelgiumInst. Scient. Sante Pub. WIV, Brussels, BelgiumJoanneum Research, AustriaMedical University of Silesia, Katowice, PolandMinistry of Health, CyprusNOKLUS, NorwayPaulescu Institute, RomaniaSahlgrenska Academy, Gothenburg, SwedenSerectrix snc, ItalyUniversity of Dundee, ScotlandUniversity of Malta, MaltaUniversity of Perugia, ItalyUniversity of Debrecen, Debrecen, HungaryUniversity Children’s Hospital, Ljubljana, SloveniaVuk Vrhovac University Clinic for Diabetes, Zagreb, Croatia
Subcontractors:
Telemedica Consulting, Romania

The BIRO System Development Team
The BIRO System is an open source project licensed under the terms of the GPLSoftware Homepage: www.eubirod.eu
Coordination and Management:Massimo Massi Benedetti, University of Perugia, Italy, [email protected] Carinci, University of Perugia, Italy, [email protected] Baglioni, University of Perugia, Italy, [email protected] Ragni, University of Perugia, Italy, [email protected]
Clinical Review and Definition of Indicators:Peter Beck, Joanneum Research, Austria, [email protected]
Data Dictionary of Standardized Definitions:Scott Cunningham, University of Dundee, Scotland, UK, [email protected] McAlpine, University of Dundee, Scotland, UK, [email protected] Leese, University of Dundee, Scotland, UK, [email protected]
Privacy by Design and Privacy Impact Assessment:Concetta Tania Di Iorio, Serectrix snc, Italy, [email protected] Carinci, Serectrix snc, Italy, [email protected] Brillante, University of Dundee, Scotland, UK, [email protected]
Database Engine:Valentina Baglioni,University of Perugia, [email protected]
Statistical and Central Engines:Fabrizio Carinci, Serectrix snc, Italy, [email protected] Rossi, University of Perugia, Italy, [email protected]
Customized Toolbox and BIROX Distribution:Peter Beck, Joanneum Research, Austria, [email protected] Perner, Joanneum Research, Austria, [email protected] Wieser, Joanneum Research, [email protected] Whiting, IDF, Belgium, [email protected]
Report Template and Web Portal:Svein Skeie, NOKLUS, Norway, [email protected] Tysse, NOKLUS, Norway, [email protected] Samuelsen, NOKLUS, [email protected] Taverner, NOKLUS, Norway, [email protected] Fjeld Løvaas, NOKLUS, Norway, [email protected]
Software Integration and System Administration:Stefano Gualdi, University of Perugia, Italy, [email protected]
Technology Transfer:Simion Pruna, Telemedica Consulting, Romania, [email protected] Azzopardi, University of Malta, Malta, [email protected] Scerri, University of Malta, Malta, [email protected] Olympios, Ministry of Health, Cyprus, [email protected] Traynor, Ministry of Health, Cyprus, [email protected] Evripidou, Ministry of Health, Cyprus, [email protected]

The EUBIROD Site Testers Group
Xenios Anastassiades, Ministry of Health, Cyprus, [email protected] Lindblad, Sahlgrenska Academy, Sweden,[email protected] Melander,Sahlgrenska Academy, Sweden,[email protected] Aberg,Sahlgrenska Academy, Sweden,[email protected] Adany, University of Debrecen, Hungary, [email protected] Nagy, University of Debrecen, Hungary, [email protected] Sandor, University of Debrecen, [email protected] Ostafie, Telemedica Consulting, Romania, [email protected] Cristina Russu, Telemedica Consulting, Romania, [email protected] Debacker, Scientific Institute of Public Health, Belgium, [email protected] Didier, Scientific Institute of Public Health, Belgium, [email protected] Boran, Adelaide and Meath Hospital, Ireland, [email protected] Moulton, Adelaide and Meath Hospital, Ireland, [email protected] Storms, CBO, Netherlands, [email protected] Battelino, University of Ljubljana, Slovenia, [email protected] Bratina, University of Ljubljana, Slovenia, [email protected] de Beaufort, Centre Hospitalier de Luxembourg, Luxembourg, [email protected] Bocquet, Centre Hospitalier de Luxembourg, Luxembourg, [email protected] Jarosz-Chobot, Medical University of Silesia, Poland, [email protected] Polanska, Medical University of Silesia, Poland, [email protected] Deja, Medical University of Silesia, Poland, [email protected] Garofano Serrano, IMABIS Foundation, Spain, [email protected] Jecht, Havelhohe Hospital, Germany, [email protected] Whiting, IDF, Belgium, [email protected] Røder, Hillerød University Hospital, Denmark, [email protected] Irene Hansen, Hillerød University Hospital, Denmark, [email protected] Falsoft, Hillerød University Hospital, Denmark, [email protected] Thorsteinsson, Hillerød University Hospital, Denmark, [email protected] Metelko, Vuk Vrhovac University, Croatia,[email protected] Poljicanin, Vuk Vrhovac University, Croatia,[email protected]

Parameters used for the productionof this Statistical ReportAuthor: The BIRO Consortium,Date: 02 November 2010Time: 10:19:36EUBIROD source: umbriaTime interval: NA - NAOutput Directory:
/home/fabrizio/Desktop/testrun−2.0.7/workingDirectory/ ce /output/reports/#021110101936/umbria
INPUT DATA
Database: central
CONTENTS
Copyright the BIRO Consortium 2010


Contents
1 Demographic characteristics 11.1 Basic demographics . . . . . . . . . . . . . . . . . . . . . . . . . . . . . . . . . . . . . . . . 2
1.1 Age (Classes) . . . . . . . . . . . . . . . . . . . . . . . . . . . . . . . . . . . . . . . . . 3
2 Clinical characteristics 52.1 Diabetes Status . . . . . . . . . . . . . . . . . . . . . . . . . . . . . . . . . . . . . . . . . . 6
2.1.1 Type of diabetes . . . . . . . . . . . . . . . . . . . . . . . . . . . . . . . . . . . . . . 72.1.2. Duration of diabetes (Classes) . . . . . . . . . . . . . . . . . . . . . . . . . . . . . . 9
2.2 Risk Factors . . . . . . . . . . . . . . . . . . . . . . . . . . . . . . . . . . . . . . . . . . . . 302.2.1.1. Weight (last episode in 12 months) . . . . . . . . . . . . . . . . . . . . . . . . . . 31
2.2.2 Lifestyle . . . . . . . . . . . . . . . . . . . . . . . . . . . . . . . . . . . . . . . . . . . . . 672.2.3. Clinical measurements . . . . . . . . . . . . . . . . . . . . . . . . . . . . . . . . . . . . . 68
2.2.3.1. Systolic BP (last episode in 12 months) . . . . . . . . . . . . . . . . . . . . . . . . 692.2.3.2. Diastolic BP (last episode in 12 months) . . . . . . . . . . . . . . . . . . . . . . . 1052.2.3.3 Total cholesterol (last episode in 12 months) . . . . . . . . . . . . . . . . . . . . . . 1412.2.3.4. HDL-cholesterol (last episode in 12 months) . . . . . . . . . . . . . . . . . . . . . 1772.2.3.5 Creatinine (last episode in 12 months) . . . . . . . . . . . . . . . . . . . . . . . . . 2132.2.3.6. HbA1c (last episode in 12 months) . . . . . . . . . . . . . . . . . . . . . . . . . . 249
2.3. Diabetes complications . . . . . . . . . . . . . . . . . . . . . . . . . . . . . . . . . . . . . 285
3 Health System 2863.1. Structure (provider level) . . . . . . . . . . . . . . . . . . . . . . . . . . . . . . . . . . . . 287
3.1.1 Type of Provider . . . . . . . . . . . . . . . . . . . . . . . . . . . . . . . . . . . . . . 2883.1.2 Average diabetes population . . . . . . . . . . . . . . . . . . . . . . . . . . . . . . . 289
3.2. Structural quality . . . . . . . . . . . . . . . . . . . . . . . . . . . . . . . . . . . . . . . . 2943.2.1 Hospital beds per 100,000 population . . . . . . . . . . . . . . . . . . . . . . . . . . . 2953.2.2 Physicians employed per 100,000 population . . . . . . . . . . . . . . . . . . . . . . . 296
3.3. Processes (individual level) . . . . . . . . . . . . . . . . . . . . . . . . . . . . . . . . . . . 2973.3.1. Foot examination . . . . . . . . . . . . . . . . . . . . . . . . . . . . . . . . . . . . . 2983.3.2. Eye examination . . . . . . . . . . . . . . . . . . . . . . . . . . . . . . . . . . . . . . 2993.3.3 Measurements examination . . . . . . . . . . . . . . . . . . . . . . . . . . . . . . . . 3003.3.3.1 BP (last episode in 12 months) . . . . . . . . . . . . . . . . . . . . . . . . . . . . . 3013.3.3.2 Lipids . . . . . . . . . . . . . . . . . . . . . . . . . . . . . . . . . . . . . . . . . . . 3063.3.3.4 HbA1c (last episode in 12 months) . . . . . . . . . . . . . . . . . . . . . . . . . . . 3113.3.4 Treatment . . . . . . . . . . . . . . . . . . . . . . . . . . . . . . . . . . . . . . . . . . 3163.3.4.1 Antihypertensive Medication (last episode in 12 months) . . . . . . . . . . . . . . . 3173.3.4.2 Lipid Lowering Medication (last episode in 12 months) . . . . . . . . . . . . . . . . 3183.3.4.3 ASA Medication (last episode in 12 months) . . . . . . . . . . . . . . . . . . . . . 3193.3.4.4.1 Glucose Lowering: Diet Only (last episode in 12 months) . . . . . . . . . . . . . 3203.3.4.4.2 Glucose Lowering: Tablets Only (last episode in 12 months) . . . . . . . . . . . . 3253.3.4.4.3 Glucose Lowering: Insulin Only (last episode in 12 months) . . . . . . . . . . . . 3303.3.4.4.4 Glucose Lowering: Insulin and Tablets (last episode in 12 months) . . . . . . . . 335
3.3.5 Management . . . . . . . . . . . . . . . . . . . . . . . . . . . . . . . . . . . . . . . . . . 3403.3.5.2 Visit Frequency . . . . . . . . . . . . . . . . . . . . . . . . . . . . . . . . . . . . . . 341
i

4 Population 3464.1 Vital Statistics . . . . . . . . . . . . . . . . . . . . . . . . . . . . . . . . . . . . . . . . . . 347
4.1.1. Total population . . . . . . . . . . . . . . . . . . . . . . . . . . . . . . . . . . . . . . 3484.1.2. Life expectancy . . . . . . . . . . . . . . . . . . . . . . . . . . . . . . . . . . . . . . 3494.1.3. Mortality data . . . . . . . . . . . . . . . . . . . . . . . . . . . . . . . . . . . . . . . 350
5 Risk Adjusted Indicators 3515.1. Epidemiology . . . . . . . . . . . . . . . . . . . . . . . . . . . . . . . . . . . . . . . . . . . 352
5.1.1 Prevalence of diabetes mellitus per 1,000 . . . . . . . . . . . . . . . . . . . . . . . . . 3535.1.2. Age at diagnosis by 10 year age bands . . . . . . . . . . . . . . . . . . . . . . . . . 356
5.2. Process Quality . . . . . . . . . . . . . . . . . . . . . . . . . . . . . . . . . . . . . . . . . 3605.2.1 % of subjects with 1+ HbA1c tests in last 12 months . . . . . . . . . . . . . . . . . . 3615.2.6 % with serum creatinine tested in last 12 months . . . . . . . . . . . . . . . . . . . . 3815.2.7 % of subjects with diabetes and one or more blood pressure measurements within
the last 12 months . . . . . . . . . . . . . . . . . . . . . . . . . . . . . . . . . . . . 4015.2.10 % of subjects treated with insulin . . . . . . . . . . . . . . . . . . . . . . . . . . . . 421
5.3. Outcome quality - intermediate outcomes . . . . . . . . . . . . . . . . . . . . . . . . . . . 4415.3.1 % of subjects with most recent HbA1c level greater than 9.0 pct (poor control) . . . 4425.3.2 % of subjects with most recent HbA1c level greater than 7,5 pct . . . . . . . . . . . 4645.3.3 % of subjects with most recent blood pressure less than 140/90 mmHg . . . . . . . . 486
5.4. Outcome quality - terminal outcomes . . . . . . . . . . . . . . . . . . . . . . . . . . . . . 494
6 Appendix 4951.1 Age (Classes) . . . . . . . . . . . . . . . . . . . . . . . . . . . . . . . . . . . . . . . . . 4962.1.1 Type of diabetes . . . . . . . . . . . . . . . . . . . . . . . . . . . . . . . . . . . . . . 4972.1.2. Duration of diabetes (Classes) . . . . . . . . . . . . . . . . . . . . . . . . . . . . . . 4982.2.1.1. Weight (last episode in 12 months) . . . . . . . . . . . . . . . . . . . . . . . . . . 4992.2.3.1. Systolic BP (last episode in 12 months) . . . . . . . . . . . . . . . . . . . . . . . . 5002.2.3.2. Diastolic BP (last episode in 12 months) . . . . . . . . . . . . . . . . . . . . . . . 5012.2.3.3 Total cholesterol (last episode in 12 months) . . . . . . . . . . . . . . . . . . . . . . 5022.2.3.4. HDL-cholesterol (last episode in 12 months) . . . . . . . . . . . . . . . . . . . . . 5032.2.3.5 Creatinine (last episode in 12 months) . . . . . . . . . . . . . . . . . . . . . . . . . 5042.2.3.6. HbA1c (last episode in 12 months) . . . . . . . . . . . . . . . . . . . . . . . . . . 5053.1.2 Average diabetes population . . . . . . . . . . . . . . . . . . . . . . . . . . . . . . . 5063.3.3.1 BP (last episode in 12 months) . . . . . . . . . . . . . . . . . . . . . . . . . . . . . 5073.3.3.2 Lipids . . . . . . . . . . . . . . . . . . . . . . . . . . . . . . . . . . . . . . . . . . . 5083.3.3.4 HbA1c (last episode in 12 months) . . . . . . . . . . . . . . . . . . . . . . . . . . . 5093.3.4.4.1 Glucose Lowering: Diet Only (last episode in 12 months) . . . . . . . . . . . . . 5103.3.4.4.2 Glucose Lowering: Tablets Only (last episode in 12 months) . . . . . . . . . . . . 5113.3.4.4.3 Glucose Lowering: Insulin Only (last episode in 12 months) . . . . . . . . . . . . 5123.3.4.4.4 Glucose Lowering: Insulin and Tablets (last episode in 12 months) . . . . . . . . 5133.3.5.2 Visit Frequency . . . . . . . . . . . . . . . . . . . . . . . . . . . . . . . . . . . . . . 5145.1.2. Age at diagnosis by 10 year age bands . . . . . . . . . . . . . . . . . . . . . . . . . 5155.2.1 % of subjects with 1+ HbA1c tests in last 12 months . . . . . . . . . . . . . . . . . . 5165.2.6 % with serum creatinine tested in last 12 months . . . . . . . . . . . . . . . . . . . . 5175.2.7 % of subjects with diabetes and one or more blood pressure measurements within
the last 12 months . . . . . . . . . . . . . . . . . . . . . . . . . . . . . . . . . . . . 5185.2.10 % of subjects treated with insulin . . . . . . . . . . . . . . . . . . . . . . . . . . . . 5195.3.1 % of subjects with most recent HbA1c level greater than 9.0 pct (poor control) . . . 5205.3.2 % of subjects with most recent HbA1c level greater than 7,5 pct . . . . . . . . . . . 521
ii

Chapter 1
Demographic characteristics
1

1.1 Basic demographics
2

1.1 Age (Classes)
Age GenderValid Value ( % ) NV/NA ( % ) N ( % )
Valid Value 9739 (100.0) 0( 0.0) 9739 (100.0)NV/NA 0 ( 0.0) 0( 0.0) 0 ( 0.0)TOTAL 9739(100.0) 0( 0.0) 9739 (100.0)
Table 1.1.1.1: Missing Data Age (by Gender)
Age GenderMale ( % ) Female ( % ) N ( % )
[0 - 18) 3 ( 0.1) 5( 0.1) 8 ( 0.1)[18 - 35) 97 ( 1.9) 170( 3.7) 267 ( 2.7)[35 - 55) 798 ( 15.5) 603( 13.2) 1401 ( 14.4)[55 - 75) 3199 ( 62.0) 2549( 55.6) 5748 ( 59.0)
[75+) 1059 ( 20.5) 1256( 27.4) 2315 ( 23.8)TOTAL 5156( 52.9) 4583( 47.1) 9739 (100.0)
Table 1.1.1.2: Age (by Gender)
CMH Chi-Square p.value dfValue 104.5171 0 4
3

1.1 Age (Classes)
●
●
Age
Valid ValueNV/NA
Valid Value NV/NA
025
5075
100
Barplot: 1.1.1.1 - Missing Data Age (by Gender)
●
●
●
●
●
Age
[0 − 18)[18 − 35)[35 − 55)[55 − 75)[75+)
Female Male
025
5075
100
Barplot: 1.1.1.2 - Age (by Gender)

Chapter 2
Clinical characteristics
5

2.1 Diabetes Status
6

2.1.1 Type of diabetes
Type AgeValid Value ( % ) NV/NA ( % ) N ( % )
Valid Value 9739 (100.0) 0( 0.0) 9739 (100.0)NV/NA 0 ( 0.0) 0( 0.0) 0 ( 0.0)TOTAL 9739(100.0) 0( 0.0) 9739 (100.0)
Table 2.1.1.1: Missing Data Type (by Age)
Type Age[0 - 18) ( % ) [18 - 35) ( % ) [35 - 55) ( % ) [55 - 75) ( % ) [75+) ( % ) N ( % )
Type 1 5 ( 62.5) 162 ( 60.7) 328 ( 23.4) 158 ( 2.7) 12( 0.5) 665 ( 6.8)Type 2 1 ( 12.5) 33 ( 12.4) 972 ( 69.4) 5442 ( 94.7) 2259( 97.6) 8707 ( 89.4)
Other Type 2 ( 25.0) 72 ( 27.0) 101 ( 7.2) 148 ( 2.6) 44( 1.9) 367 ( 3.8)TOTAL 8( 0.1) 267( 2.7) 1401( 14.4) 5748( 59.0) 2315( 23.8) 9739 (100.0)
Table 2.1.1.2: Type (by Age)
CMH Chi-Square p.value dfValue 2768.017 0 8
7

2.1.1 Type of diabetes
●
●
Type
Valid ValueNV/NA
Valid Value NV/NA
025
5075
100
Barplot: 2.1.1.1 - Missing Data Type (by Age)
●
●
●
Type
Type 1Type 2Other Type
[0 − 18) [18 − 35) [35 − 55) [55 − 75) [75 +)
025
5075
100
Barplot: 2.1.1.2 - Type (by Age)

2.1.2. Duration of diabetes (Classes)
Duration of Diabetes Type of DiabetesValid Value ( % ) NV/NA ( % ) N ( % )
Valid Value 9739 (100.0) 0( 0.0) 9739 (100.0)NV/NA 0 ( 0.0) 0( 0.0) 0 ( 0.0)TOTAL 9739(100.0) 0( 0.0) 9739 (100.0)
Table 2.1.2.1: Missing Data Duration of Diabetes (by Type of Diabetes)
Duration of Diabetes Type of DiabetesType 1 ( % ) Type 2 ( % ) Other Type ( % ) N ( % )
[0 - 10) 149 ( 22.4) 4690 ( 53.9) 303( 82.6) 5142 ( 52.8)[10 - 20) 191 ( 28.7) 2362 ( 27.1) 45( 12.3) 2598 ( 26.7)
[20+) 325 ( 48.9) 1655 ( 19.0) 19( 5.2) 1999 ( 20.5)TOTAL 665( 6.8) 8707( 89.4) 367( 3.8) 9739 (100.0)
Table 2.1.2.2: Duration of Diabetes (by Type of Diabetes)
CMH Chi-Square p.value dfValue 522.3092 0 4
9

2.1.2. Duration of diabetes (Classes)
Duration of Diabetes GenderValid Value ( % ) NV/NA ( % ) N ( % )
Valid Value 9739 (100.0) 0( 0.0) 9739 (100.0)NV/NA 0 ( 0.0) 0( 0.0) 0 ( 0.0)TOTAL 9739(100.0) 0( 0.0) 9739 (100.0)
Table 2.1.2.3: Missing Data Duration of Diabetes (by Gender)
Duration of Diabetes GenderMale ( % ) Female ( % ) N ( % )
[0 - 10) 2782 ( 54.0) 2360( 51.5) 5142 ( 52.8)[10 - 20) 1425 ( 27.6) 1173( 25.6) 2598 ( 26.7)
[20+) 949 ( 18.4) 1050( 22.9) 1999 ( 20.5)TOTAL 5156( 52.9) 4583( 47.1) 9739 (100.0)
Table 2.1.2.4: Duration of Diabetes (by Gender)
CMH Chi-Square p.value dfValue 30.5727 0 2

2.1.2. Duration of diabetes (Classes)
Duration of Diabetes HbA1c DoneValid Value ( % ) NV/NA ( % ) N ( % )
Valid Value 9739 (100.0) 0( 0.0) 9739 (100.0)NV/NA 0 ( 0.0) 0( 0.0) 0 ( 0.0)TOTAL 9739(100.0) 0( 0.0) 9739 (100.0)
Table 2.1.2.5: Missing Data Duration of Diabetes (by HbA1c Done)
Duration of Diabetes HbA1c Donewith hba1c ( % ) without hba1c ( % ) N ( % )
[0 - 10) 4672 ( 51.8) 470( 65.7) 5142 ( 52.8)[10 - 20) 2461 ( 27.3) 137( 19.2) 2598 ( 26.7)
[20+) 1891 ( 21.0) 108( 15.1) 1999 ( 20.5)TOTAL 9024( 92.7) 715( 7.3) 9739 (100.0)
Table 2.1.2.6: Duration of Diabetes (by HbA1c Done)
CMH Chi-Square p.value dfValue 51.8433 0 2

2.1.2. Duration of diabetes (Classes)Type of Diabetes = Type 1
Duration of Diabetes GenderValid Value ( % ) NV/NA ( % ) N ( % )
Valid Value 665 (100.0) 0( 0.0) 665 (100.0)NV/NA 0 ( 0.0) 0( 0.0) 0 ( 0.0)TOTAL 665(100.0) 0( 0.0) 665 (100.0)
Table 2.1.2.7: Missing Data Duration of Diabetes (by Gender, Type of Diabetes = Type 1)
Duration of Diabetes GenderMale ( % ) Female ( % ) N ( % )
[0 - 10) 90 ( 25.3) 59( 19.1) 149 ( 22.4)[10 - 20) 103 ( 28.9) 88( 28.5) 191 ( 28.7)
[20+) 163 ( 45.8) 162( 52.4) 325 ( 48.9)TOTAL 356( 53.5) 309( 46.5) 665 (100.0)
Table 2.1.2.8: Duration of Diabetes (by Gender, Type of Diabetes = Type 1)
CMH Chi-Square p.value dfValue 4.3306 0.1147 2

2.1.2. Duration of diabetes (Classes)Type of Diabetes = Type 1
Duration of Diabetes HbA1c DoneValid Value ( % ) NV/NA ( % ) N ( % )
Valid Value 665 (100.0) 0( 0.0) 665 (100.0)NV/NA 0 ( 0.0) 0( 0.0) 0 ( 0.0)TOTAL 665(100.0) 0( 0.0) 665 (100.0)
Table 2.1.2.9: Missing Data Duration of Diabetes (by HbA1c Done, Type of Diabetes = Type 1)
Duration of Diabetes HbA1c Donewith hba1c ( % ) without hba1c ( % ) N ( % )
[0 - 10) 133 ( 21.4) 16( 36.4) 149 ( 22.4)[10 - 20) 183 ( 29.5) 8( 18.2) 191 ( 28.7)
[20+) 305 ( 49.1) 20( 45.5) 325 ( 48.9)TOTAL 621( 93.4) 44( 6.6) 665 (100.0)
Table 2.1.2.10: Duration of Diabetes (by HbA1c Done, Type of Diabetes = Type 1)
CMH Chi-Square p.value dfValue 6.0318 0.049 2

2.1.2. Duration of diabetes (Classes)Type of Diabetes = Type 1
Duration of Diabetes Gender * HbA1c DoneValid Value NV/NA
Valid Value ( % ) NV/NA ( % ) Valid Value ( % ) NV/NA ( % ) N ( % )Valid Value 0 ( 0.0) 0 ( 0.0) 0 ( 0.0) 0( 0.0) 0 ( 0.0)
NV/NA 0 ( 0.0) 0 ( 0.0) 0 ( 0.0) 665(100.0) 665 (100.0)TOTAL 0( 0.0) 0( 0.0) 0( 0.0) 665(100.0) 665 (100.0)
Table 2.1.2.11: Missing Data Duration of Diabetes (by Gender * HbA1c Done, Type of Diabetes =Type 1)
Duration of Diabetes Gender * HbA1c Donewith hba1c without hba1c
Male ( % ) Female ( % ) Male ( % ) Female ( % ) N ( % )[0 - 10) 51 ( 18.0) 82 ( 24.3) 8 ( 30.8) 8( 44.4) 149 ( 22.4)[10 - 20) 84 ( 29.7) 99 ( 29.3) 4 ( 15.4) 4( 22.2) 191 ( 28.7)
[20+) 148 ( 52.3) 157 ( 46.4) 14 ( 53.8) 6( 33.3) 325 ( 48.9)TOTAL 283( 42.6) 338( 50.8) 26( 3.9) 18( 2.7) 665 (100.0)
Table 2.1.2.12: Duration of Diabetes (by Gender * HbA1c Done, Type of Diabetes = Type 1)
CMH Chi-Square p.value dfValue 654.585 0 11
2.1.2. Duration of diabetes (Classes)Type of Diabetes = Type 2
Duration of Diabetes GenderValid Value ( % ) NV/NA ( % ) N ( % )
Valid Value 8707 (100.0) 0( 0.0) 8707 (100.0)NV/NA 0 ( 0.0) 0( 0.0) 0 ( 0.0)TOTAL 8707(100.0) 0( 0.0) 8707 (100.0)
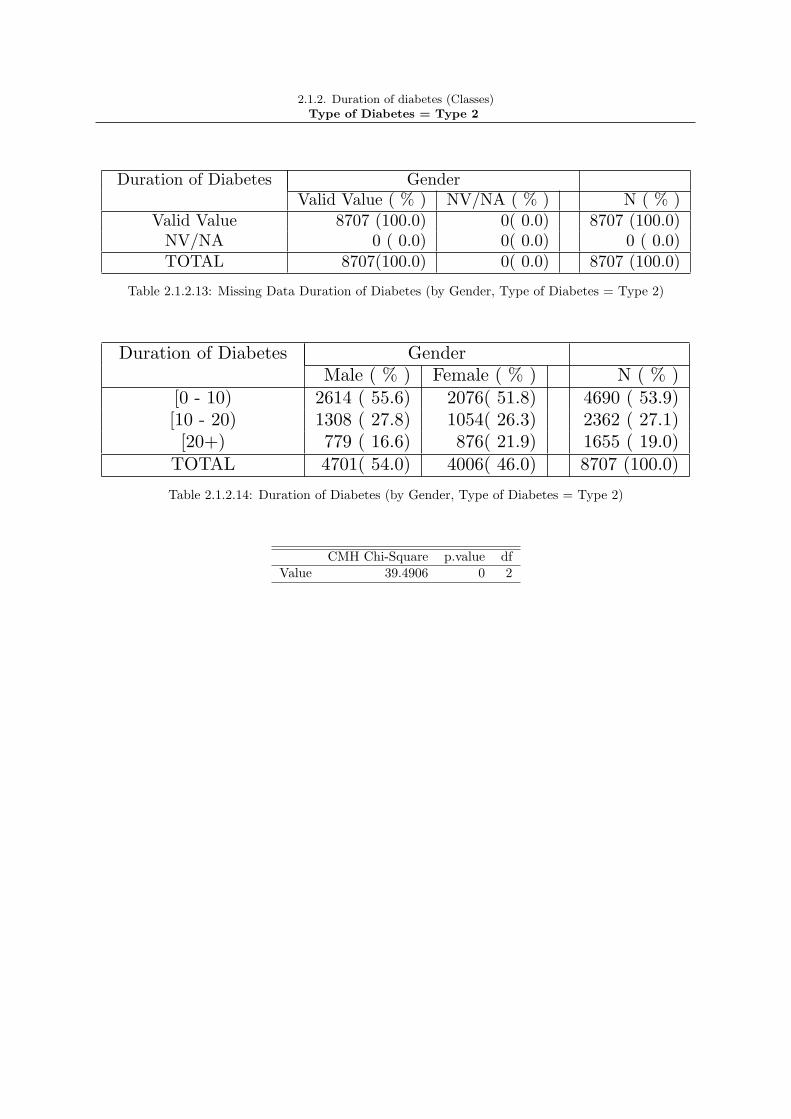
Table 2.1.2.13: Missing Data Duration of Diabetes (by Gender, Type of Diabetes = Type 2)
Duration of Diabetes GenderMale ( % ) Female ( % ) N ( % )
[0 - 10) 2614 ( 55.6) 2076( 51.8) 4690 ( 53.9)[10 - 20) 1308 ( 27.8) 1054( 26.3) 2362 ( 27.1)
[20+) 779 ( 16.6) 876( 21.9) 1655 ( 19.0)TOTAL 4701( 54.0) 4006( 46.0) 8707 (100.0)
Table 2.1.2.14: Duration of Diabetes (by Gender, Type of Diabetes = Type 2)
CMH Chi-Square p.value dfValue 39.4906 0 2

2.1.2. Duration of diabetes (Classes)Type of Diabetes = Type 2
Duration of Diabetes HbA1c DoneValid Value ( % ) NV/NA ( % ) N ( % )
Valid Value 8707 (100.0) 0( 0.0) 8707 (100.0)NV/NA 0 ( 0.0) 0( 0.0) 0 ( 0.0)TOTAL 8707(100.0) 0( 0.0) 8707 (100.0)
Table 2.1.2.15: Missing Data Duration of Diabetes (by HbA1c Done, Type of Diabetes = Type 2)
Duration of Diabetes HbA1c Donewith hba1c ( % ) without hba1c ( % ) N ( % )
[0 - 10) 4352 ( 53.2) 338( 63.7) 4690 ( 53.9)[10 - 20) 2254 ( 27.6) 108( 20.3) 2362 ( 27.1)
[20+) 1570 ( 19.2) 85( 16.0) 1655 ( 19.0)TOTAL 8176( 93.9) 531( 6.1) 8707 (100.0)
Table 2.1.2.16: Duration of Diabetes (by HbA1c Done, Type of Diabetes = Type 2)
CMH Chi-Square p.value dfValue 22.344 0 2

2.1.2. Duration of diabetes (Classes)Type of Diabetes = Type 2
Duration of Diabetes Gender * HbA1c DoneValid Value NV/NA
Valid Value ( % ) NV/NA ( % ) Valid Value ( % ) NV/NA ( % ) N ( % )Valid Value 0 ( 0.0) 0 ( 0.0) 0 ( 0.0) 0( 0.0) 0 ( 0.0)
NV/NA 0 ( 0.0) 0 ( 0.0) 0 ( 0.0) 8707(100.0) 8707 (100.0)TOTAL 0( 0.0) 0( 0.0) 0( 0.0) 8707(100.0) 8707 (100.0)
Table 2.1.2.17: Missing Data Duration of Diabetes (by Gender * HbA1c Done, Type of Diabetes =Type 2)
Duration of Diabetes Gender * HbA1c Donewith hba1c without hba1c
Male ( % ) Female ( % ) Male ( % ) Female ( % ) N ( % )[0 - 10) 1908 ( 50.9) 2444 ( 55.2) 168 ( 64.4) 170( 63.0) 4690 ( 53.9)[10 - 20) 1005 ( 26.8) 1249 ( 28.2) 49 ( 18.8) 59( 21.9) 2362 ( 27.1)
[20+) 832 ( 22.2) 738 ( 16.7) 44 ( 16.9) 41( 15.2) 1655 ( 19.0)TOTAL 3745( 43.0) 4431( 50.9) 261( 3.0) 270( 3.1) 8707 (100.0)
Table 2.1.2.18: Duration of Diabetes (by Gender * HbA1c Done, Type of Diabetes = Type 2)
CMH Chi-Square p.value dfValue 9880.9642 0 11

2.1.2. Duration of diabetes (Classes)Type of Diabetes = Other Type
Duration of Diabetes GenderValid Value ( % ) NV/NA ( % ) N ( % )
Valid Value 367 (100.0) 0( 0.0) 367 (100.0)NV/NA 0 ( 0.0) 0( 0.0) 0 ( 0.0)TOTAL 367(100.0) 0( 0.0) 367 (100.0)
Table 2.1.2.19: Missing Data Duration of Diabetes (by Gender, Type of Diabetes = Other Type)
Duration of Diabetes GenderMale ( % ) Female ( % ) N ( % )
[0 - 10) 78 ( 78.8) 225( 84.0) 303 ( 82.6)[10 - 20) 14 ( 14.1) 31( 11.6) 45 ( 12.3)
[20+) 7 ( 7.1) 12( 4.5) 19 ( 5.2)TOTAL 99( 27.0) 268( 73.0) 367 (100.0)
Table 2.1.2.20: Duration of Diabetes (by Gender, Type of Diabetes = Other Type)
CMH Chi-Square p.value dfValue 1.5635 0.4576 2

2.1.2. Duration of diabetes (Classes)Type of Diabetes = Other Type
Duration of Diabetes HbA1c DoneValid Value ( % ) NV/NA ( % ) N ( % )
Valid Value 367 (100.0) 0( 0.0) 367 (100.0)NV/NA 0 ( 0.0) 0( 0.0) 0 ( 0.0)TOTAL 367(100.0) 0( 0.0) 367 (100.0)
Table 2.1.2.21: Missing Data Duration of Diabetes (by HbA1c Done, Type of Diabetes = Other Type)
Duration of Diabetes HbA1c Donewith hba1c ( % ) without hba1c ( % ) N ( % )
[0 - 10) 187 ( 82.4) 116( 82.9) 303 ( 82.6)[10 - 20) 24 ( 10.6) 21( 15.0) 45 ( 12.3)
[20+) 16 ( 7.0) 3( 2.1) 19 ( 5.2)TOTAL 227( 61.9) 140( 38.1) 367 (100.0)
Table 2.1.2.22: Duration of Diabetes (by HbA1c Done, Type of Diabetes = Other Type)
CMH Chi-Square p.value dfValue 5.4118 0.0668 2
2.1.2. Duration of diabetes (Classes)Type of Diabetes = Other Type
Duration of Diabetes Gender * HbA1c DoneValid Value NV/NA
Valid Value ( % ) NV/NA ( % ) Valid Value ( % ) NV/NA ( % ) N ( % )Valid Value 0 ( 0.0) 0 ( 0.0) 0 ( 0.0) 0( 0.0) 0 ( 0.0)
NV/NA 0 ( 0.0) 0 ( 0.0) 0 ( 0.0) 367(100.0) 367 (100.0)TOTAL 0( 0.0) 0( 0.0) 0( 0.0) 367(100.0) 367 (100.0)
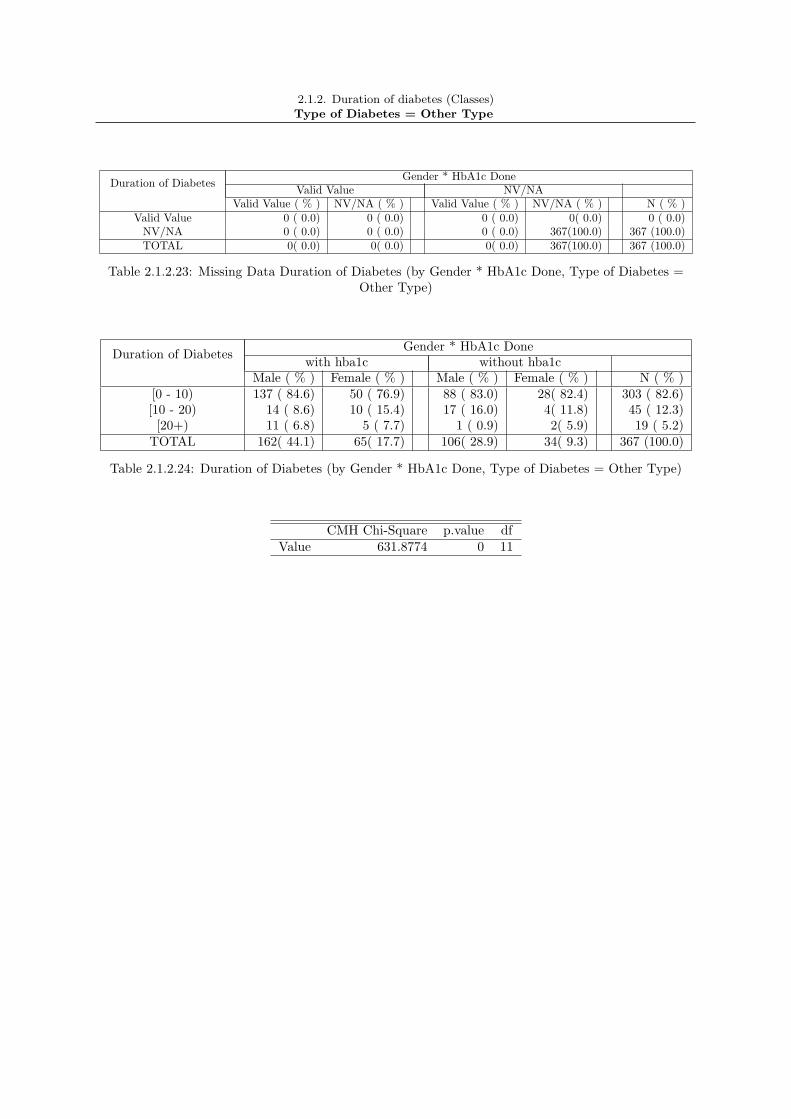
Table 2.1.2.23: Missing Data Duration of Diabetes (by Gender * HbA1c Done, Type of Diabetes =Other Type)
Duration of Diabetes Gender * HbA1c Donewith hba1c without hba1c
Male ( % ) Female ( % ) Male ( % ) Female ( % ) N ( % )[0 - 10) 137 ( 84.6) 50 ( 76.9) 88 ( 83.0) 28( 82.4) 303 ( 82.6)[10 - 20) 14 ( 8.6) 10 ( 15.4) 17 ( 16.0) 4( 11.8) 45 ( 12.3)
[20+) 11 ( 6.8) 5 ( 7.7) 1 ( 0.9) 2( 5.9) 19 ( 5.2)TOTAL 162( 44.1) 65( 17.7) 106( 28.9) 34( 9.3) 367 (100.0)
Table 2.1.2.24: Duration of Diabetes (by Gender * HbA1c Done, Type of Diabetes = Other Type)
CMH Chi-Square p.value dfValue 631.8774 0 11

2.1.2. Duration of diabetes (Classes)
●
●
Duration of Diabetes
Valid ValueNV/NA
Valid Value NV/NA
025
5075
100
Barplot: 2.1.2.1 - Missing Data Duration of Diabetes (by Type of Diabetes)
●
●
●
Duration of Diabetes
[0 − 10)[10 − 20)[20+)
Other Type Type 1 Type 2
025
5075
100
Barplot: 2.1.2.2 - Duration of Diabetes (by Type of Diabetes)

2.1.2. Duration of diabetes (Classes)
●
●
Duration of Diabetes
Valid ValueNV/NA
Valid Value NV/NA
025
5075
100
Barplot: 2.1.2.3 - Missing Data Duration of Diabetes (by Gender)
●
●
●
Duration of Diabetes
[0 − 10)[10 − 20)[20+)
Female Male
025
5075
100
Barplot: 2.1.2.4 - Duration of Diabetes (by Gender)

2.1.2. Duration of diabetes (Classes)
●
●
Duration of Diabetes
Valid ValueNV/NA
Valid Value NV/NA
025
5075
100
Barplot: 2.1.2.5 - Missing Data Duration of Diabetes (by HbA1c Done)
●
●
●
Duration of Diabetes
[0 − 10)[10 − 20)[20+)
with hba1c without hba1c
025
5075
100
Barplot: 2.1.2.6 - Duration of Diabetes (by HbA1c Done)

2.1.2. Duration of diabetes (Classes)Type of Diabetes = Type 1
●
●
Duration of Diabetes
Valid ValueNV/NA
Valid Value NV/NA
025
5075
100
Barplot: 2.1.2.7 - Missing Data Duration of Diabetes (by Gender, Type of Diabetes = Type 1)
●
●
●
Duration of Diabetes
[0 − 10)[10 − 20)[20+)
Female Male
025
5075
100
Barplot: 2.1.2.8 - Duration of Diabetes (by Gender, Type of Diabetes = Type 1)

2.1.2. Duration of diabetes (Classes)Type of Diabetes = Type 1
●
●
Duration of Diabetes
Valid ValueNV/NA
Valid Value NV/NA
025
5075
100
Barplot: 2.1.2.9 - Missing Data Duration of Diabetes (by HbA1c Done, Type of Diabetes = Type 1)
●
●
●
Duration of Diabetes
[0 − 10)[10 − 20)[20+)
with hba1c without hba1c
025
5075
100
Barplot: 2.1.2.10 - Duration of Diabetes (by HbA1c Done, Type of Diabetes = Type 1)

2.1.2. Duration of diabetes (Classes)Type of Diabetes = Type 2
●
●
Duration of Diabetes
Valid ValueNV/NA
Valid Value NV/NA
025
5075
100
Barplot: 2.1.2.11 - Missing Data Duration of Diabetes (by Gender, Type of Diabetes = Type 2)
●
●
●
Duration of Diabetes
[0 − 10)[10 − 20)[20+)
Female Male
025
5075
100
Barplot: 2.1.2.12 - Duration of Diabetes (by Gender, Type of Diabetes = Type 2)

2.1.2. Duration of diabetes (Classes)Type of Diabetes = Type 2
●
●
Duration of Diabetes
Valid ValueNV/NA
Valid Value NV/NA
025
5075
100
Barplot: 2.1.2.13 - Missing Data Duration of Diabetes (by HbA1c Done, Type of Diabetes = Type 2)
●
●
●
Duration of Diabetes
[0 − 10)[10 − 20)[20+)
with hba1c without hba1c
025
5075
100
Barplot: 2.1.2.14 - Duration of Diabetes (by HbA1c Done, Type of Diabetes = Type 2)

2.1.2. Duration of diabetes (Classes)Type of Diabetes = Other Type
●
●
Duration of Diabetes
Valid ValueNV/NA
Valid Value NV/NA
025
5075
100
Barplot: 2.1.2.15 - Missing Data Duration of Diabetes (by Gender, Type of Diabetes = Other Type)
●
●
●
Duration of Diabetes
[0 − 10)[10 − 20)[20+)
Female Male
025
5075
100
Barplot: 2.1.2.16 - Duration of Diabetes (by Gender, Type of Diabetes = Other Type)

2.1.2. Duration of diabetes (Classes)Type of Diabetes = Other Type
●
●
Duration of Diabetes
Valid ValueNV/NA
Valid Value NV/NA
025
5075
100
Barplot: 2.1.2.17 - Missing Data Duration of Diabetes (by HbA1c Done, Type of Diabetes = OtherType)
●
●
●
Duration of Diabetes
[0 − 10)[10 − 20)[20+)
with hba1c without hba1c
025
5075
100
Barplot: 2.1.2.18 - Duration of Diabetes (by HbA1c Done, Type of Diabetes = Other Type)

2.2 Risk Factors
30

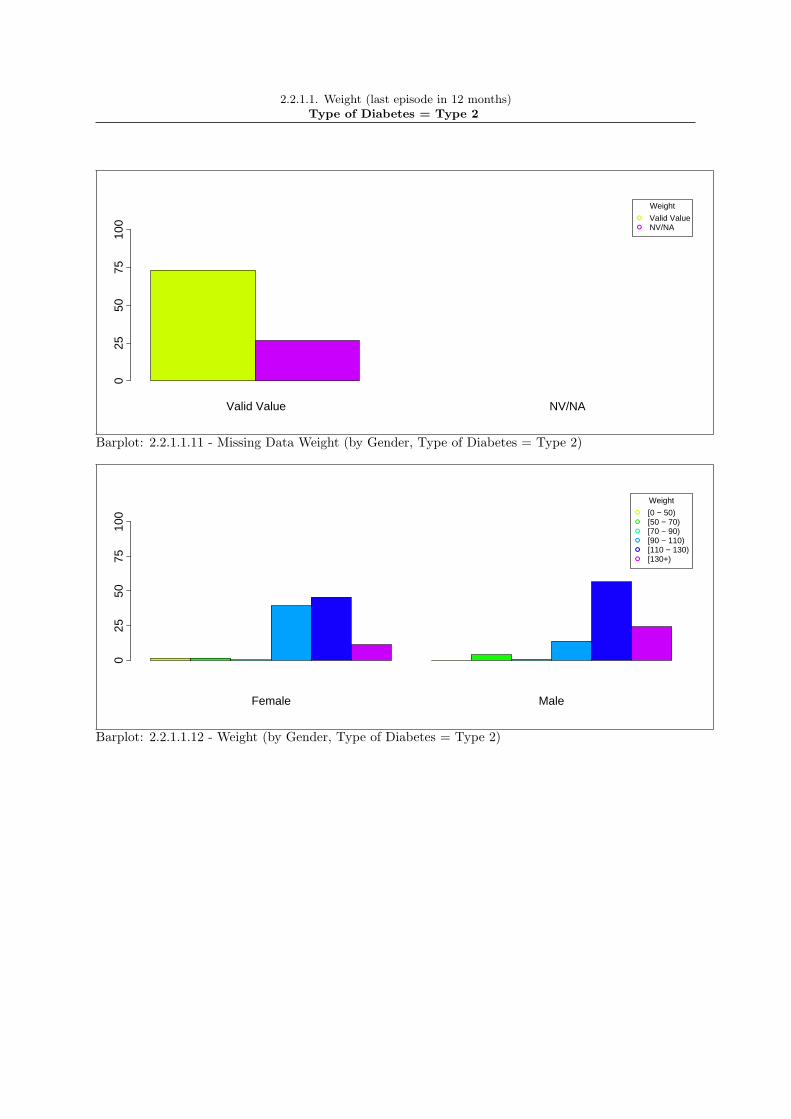
2.2.1.1. Weight (last episode in 12 months)
Weight Type of DiabetesValid Value ( % ) NV/NA ( % ) N ( % )
Valid Value 6987 ( 71.7) 0( 0.0) 6987 ( 71.7)NV/NA 2752 ( 28.3) 0( 0.0) 2752 ( 28.3)TOTAL 9739(100.0) 0( 0.0) 9739 (100.0)
Table 2.2.1.1.1: Missing Data Weight (by Type of Diabetes)
Weight Type of DiabetesType 1 ( % ) Type 2 ( % ) Other Type ( % ) N ( % )
[0 - 50) 8 ( 2.2) 48 ( 0.8) 8( 3.3) 64 ( 0.9)[50 - 70) 163 ( 44.2) 1633 ( 25.6) 85( 35.6) 1881 ( 26.9)[70 - 90) 163 ( 44.2) 3293 ( 51.6) 101( 42.3) 3557 ( 50.9)[90 - 110) 31 ( 8.4) 1173 ( 18.4) 28( 11.7) 1232 ( 17.6)[110 - 130) 3 ( 0.8) 189 ( 3.0) 15( 6.3) 207 ( 3.0)
[130+) 1 ( 0.3) 43 ( 0.7) 2( 0.8) 46 ( 0.7)TOTAL 369( 5.3) 6379( 91.3) 239( 3.4) 6987 (100.0)
Table 2.2.1.1.2: Weight (by Type of Diabetes)
CMH Chi-Square p.value dfValue 122.8464 0 10
31

2.2.1.1. Weight (last episode in 12 months)
Weight GenderValid Value ( % ) NV/NA ( % ) N ( % )
Valid Value 6987 ( 71.7) 0( 0.0) 6987 ( 71.7)NV/NA 2752 ( 28.3) 0( 0.0) 2752 ( 28.3)TOTAL 9739(100.0) 0( 0.0) 9739 (100.0)
Table 2.2.1.1.3: Missing Data Weight (by Gender)
Weight GenderMale ( % ) Female ( % ) N ( % )
[0 - 50) 4 ( 0.1) 60( 1.8) 64 ( 0.9)[50 - 70) 524 ( 14.2) 1357( 41.2) 1881 ( 26.9)[70 - 90) 2105 ( 57.0) 1452( 44.0) 3557 ( 50.9)[90 - 110) 875 ( 23.7) 357( 10.8) 1232 ( 17.6)[110 - 130) 149 ( 4.0) 58( 1.8) 207 ( 3.0)
[130+) 33 ( 0.9) 13( 0.4) 46 ( 0.7)TOTAL 3690( 52.8) 3297( 47.2) 6987 (100.0)
Table 2.2.1.1.4: Weight (by Gender)
CMH Chi-Square p.value dfValue 784.6457 0 5

2.2.1.1. Weight (last episode in 12 months)
Weight AgeValid Value ( % ) NV/NA ( % ) N ( % )
Valid Value 6987 ( 71.7) 0( 0.0) 6987 ( 71.7)NV/NA 2752 ( 28.3) 0( 0.0) 2752 ( 28.3)TOTAL 9739(100.0) 0( 0.0) 9739 (100.0)
Table 2.2.1.1.5: Missing Data Weight (by Age)
Weight Age[0 - 18) ( % ) [18 - 35) ( % ) [35 - 55) ( % ) [55 - 75) ( % ) [75+) ( % ) N ( % )
[0 - 50) 1 ( 16.7) 8 ( 4.2) 11 ( 1.1) 17 ( 0.4) 27( 1.8) 64 ( 0.9)[50 - 70) 1 ( 16.7) 75 ( 39.5) 214 ( 21.2) 988 ( 23.3) 603( 39.2) 1881 ( 26.9)[70 - 90) 2 ( 33.3) 70 ( 36.8) 457 ( 45.3) 2283 ( 53.8) 745( 48.5) 3557 ( 50.9)[90 - 110) 2 ( 33.3) 22 ( 11.6) 242 ( 24.0) 819 ( 19.3) 147( 9.6) 1232 ( 17.6)[110 - 130) 0 ( 0.0) 9 ( 4.7) 59 ( 5.9) 125 ( 2.9) 14( 0.9) 207 ( 3.0)
[130+) 0 ( 0.0) 6 ( 3.2) 25 ( 2.5) 14 ( 0.3) 1( 0.1) 46 ( 0.7)TOTAL 6( 0.1) 190( 2.7) 1008( 14.4) 4246( 60.8) 1537( 22.0) 6987 (100.0)
Table 2.2.1.1.6: Weight (by Age)
CMH Chi-SquareValue One or more cells have 0 obs

2.2.1.1. Weight (last episode in 12 months)Type of Diabetes = Type 1
Weight GenderValid Value ( % ) NV/NA ( % ) N ( % )
Valid Value 369 ( 55.5) 0( 0.0) 369 ( 55.5)NV/NA 296 ( 44.5) 0( 0.0) 296 ( 44.5)TOTAL 665(100.0) 0( 0.0) 665 (100.0)
Table 2.2.1.1.7: Missing Data Weight (by Gender, Type of Diabetes = Type 1)
Weight GenderMale ( % ) Female ( % ) N ( % )
[0 - 50) 1 ( 0.6) 7( 3.7) 8 ( 2.2)[50 - 70) 38 ( 21.1) 125( 66.1) 163 ( 44.2)[70 - 90) 112 ( 62.2) 51( 27.0) 163 ( 44.2)[90 - 110) 26 ( 14.4) 5( 2.6) 31 ( 8.4)[110 - 130) 2 ( 1.1) 1( 0.5) 3 ( 0.8)
[130+) 1 ( 0.6) 0( 0.0) 1 ( 0.3)TOTAL 180( 48.8) 189( 51.2) 369 (100.0)
Table 2.2.1.1.8: Weight (by Gender, Type of Diabetes = Type 1)
CMH Chi-SquareValue One or more cells have 0 obs

2.2.1.1. Weight (last episode in 12 months)Type of Diabetes = Type 1
Weight AgeValid Value ( % ) NV/NA ( % ) N ( % )
Valid Value 369 ( 55.5) 0( 0.0) 369 ( 55.5)NV/NA 296 ( 44.5) 0( 0.0) 296 ( 44.5)TOTAL 665(100.0) 0( 0.0) 665 (100.0)
Table 2.2.1.1.9: Missing Data Weight (by Age, Type of Diabetes = Type 1)
Weight Age[0 - 18) ( % ) [18 - 35) ( % ) [35 - 55) ( % ) [55 - 75) ( % ) [75+) ( % ) N ( % )
[0 - 50) 1 ( 25.0) 4 ( 4.3) 3 ( 1.7) 0 ( 0.0) 0( 0.0) 8 ( 2.2)[50 - 70) 1 ( 25.0) 44 ( 47.3) 82 ( 47.1) 33 ( 35.1) 3( 75.0) 163 ( 44.2)[70 - 90) 2 ( 50.0) 41 ( 44.1) 68 ( 39.1) 52 ( 55.3) 0( 0.0) 163 ( 44.2)[90 - 110) 0 ( 0.0) 3 ( 3.2) 19 ( 10.9) 8 ( 8.5) 1( 25.0) 31 ( 8.4)[110 - 130) 0 ( 0.0) 0 ( 0.0) 2 ( 1.1) 1 ( 1.1) 0( 0.0) 3 ( 0.8)
[130+) 0 ( 0.0) 1 ( 1.1) 0 ( 0.0) 0 ( 0.0) 0( 0.0) 1 ( 0.3)TOTAL 4( 1.1) 93( 25.2) 174( 47.2) 94( 25.5) 4( 1.1) 369 (100.0)
Table 2.2.1.1.10: Weight (by Age, Type of Diabetes = Type 1)
CMH Chi-SquareValue One or more cells have 0 obs

2.2.1.1. Weight (last episode in 12 months)Type of Diabetes = Type 1
Weight Gender * AgeValid Value NV/NA
Valid Value ( % ) NV/NA ( % ) Valid Value ( % ) NV/NA ( % ) N ( % )Valid Value 0 ( 0.0) 0 ( 0.0) 0 ( 0.0) 296( 44.5) 296 ( 44.5)
NV/NA 0 ( 0.0) 0 ( 0.0) 0 ( 0.0) 369( 55.5) 369 ( 55.5)TOTAL 0( 0.0) 0( 0.0) 0( 0.0) 665(100.0) 665 (100.0)
Table 2.2.1.1.11: Missing Data Weight (by Gender * Age, Type of Diabetes = Type 1)
Weight Gender * Age[0 - 18) [18 - 35) [35 - 55) [55 - 75) [75+)
Male ( % ) Female ( % ) Male ( % ) Female ( % ) Male ( % ) Female ( % ) Male ( % ) Female ( % ) Male ( % ) Female ( % ) N ( % )[0 - 50) 0 ( 0.0) 1 ( 50.0) 4 ( 7.3) 0 ( 0.0) 3 ( 3.5) 0 ( 0.0) 0 ( 0.0) 0 ( 0.0) 0 ( 0.0) 0( 0.0) 8 ( 2.2)[50 - 70) 0 ( 0.0) 0 ( 0.0) 0 ( 0.0) 0 ( 0.0) 1 ( 1.2) 1 ( 1.1) 0 ( 0.0) 1 ( 2.0) 0 ( 0.0) 0( 0.0) 3 ( 0.8)[70 - 90) 0 ( 0.0) 0 ( 0.0) 0 ( 0.0) 1 ( 2.6) 0 ( 0.0) 0 ( 0.0) 0 ( 0.0) 0 ( 0.0) 0 ( 0.0) 0( 0.0) 1 ( 0.3)[90 - 110) 1 ( 50.0) 0 ( 0.0) 33 ( 60.0) 11 ( 28.9) 63 ( 74.1) 19 ( 21.3) 25 ( 56.8) 8 ( 16.0) 3 (100.0) 0( 0.0) 163 ( 44.2)[110 - 130) 1 ( 50.0) 1 ( 50.0) 18 ( 32.7) 23 ( 60.5) 15 ( 17.6) 53 ( 59.6) 17 ( 38.6) 35 ( 70.0) 0 ( 0.0) 0( 0.0) 163 ( 44.2)
[130+) 0 ( 0.0) 0 ( 0.0) 0 ( 0.0) 3 ( 7.9) 3 ( 3.5) 16 ( 18.0) 2 ( 4.5) 6 ( 12.0) 0 ( 0.0) 1(100.0) 31 ( 8.4)TOTAL 2( 0.5) 2( 0.5) 55( 14.9) 38( 10.3) 85( 23.0) 89( 24.1) 44( 11.9) 50( 13.6) 3( 0.8) 1( 0.3) 369 (100.0)
Table 2.2.1.1.12: Weight (by Gender * Age, Type of Diabetes = Type 1)
CMH Chi-SquareValue One or more cells have 0 obs

2.2.1.1. Weight (last episode in 12 months)Type of Diabetes = Type 2
Weight GenderValid Value ( % ) NV/NA ( % ) N ( % )
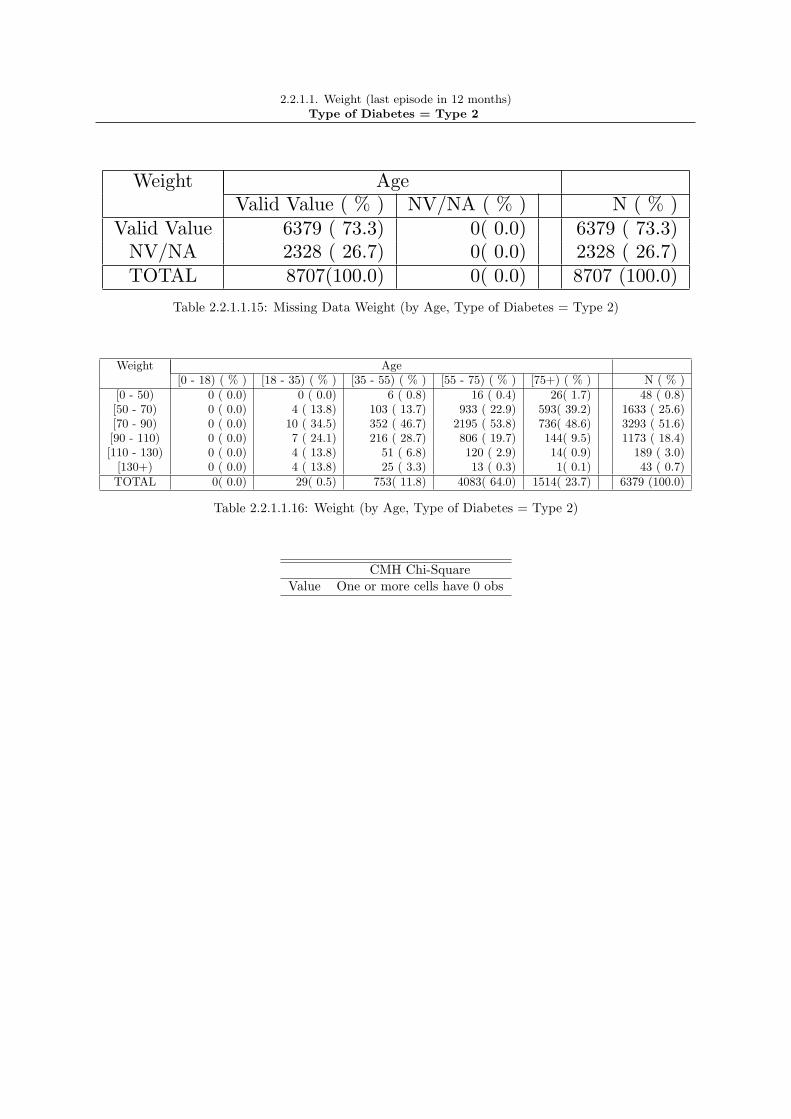
Valid Value 6379 ( 73.3) 0( 0.0) 6379 ( 73.3)NV/NA 2328 ( 26.7) 0( 0.0) 2328 ( 26.7)TOTAL 8707(100.0) 0( 0.0) 8707 (100.0)
Table 2.2.1.1.13: Missing Data Weight (by Gender, Type of Diabetes = Type 2)
Weight GenderMale ( % ) Female ( % ) N ( % )
[0 - 50) 3 ( 0.1) 45( 1.5) 48 ( 0.8)[50 - 70) 480 ( 13.9) 1153( 39.6) 1633 ( 25.6)[70 - 90) 1965 ( 56.7) 1328( 45.6) 3293 ( 51.6)[90 - 110) 842 ( 24.3) 331( 11.4) 1173 ( 18.4)[110 - 130) 143 ( 4.1) 46( 1.6) 189 ( 3.0)
[130+) 32 ( 0.9) 11( 0.4) 43 ( 0.7)TOTAL 3465( 54.3) 2914( 45.7) 6379 (100.0)
Table 2.2.1.1.14: Weight (by Gender, Type of Diabetes = Type 2)
CMH Chi-Square p.value dfValue 677.4408 0 5
2.2.1.1. Weight (last episode in 12 months)Type of Diabetes = Type 2
Weight AgeValid Value ( % ) NV/NA ( % ) N ( % )
Valid Value 6379 ( 73.3) 0( 0.0) 6379 ( 73.3)NV/NA 2328 ( 26.7) 0( 0.0) 2328 ( 26.7)TOTAL 8707(100.0) 0( 0.0) 8707 (100.0)
Table 2.2.1.1.15: Missing Data Weight (by Age, Type of Diabetes = Type 2)
Weight Age[0 - 18) ( % ) [18 - 35) ( % ) [35 - 55) ( % ) [55 - 75) ( % ) [75+) ( % ) N ( % )
[0 - 50) 0 ( 0.0) 0 ( 0.0) 6 ( 0.8) 16 ( 0.4) 26( 1.7) 48 ( 0.8)[50 - 70) 0 ( 0.0) 4 ( 13.8) 103 ( 13.7) 933 ( 22.9) 593( 39.2) 1633 ( 25.6)[70 - 90) 0 ( 0.0) 10 ( 34.5) 352 ( 46.7) 2195 ( 53.8) 736( 48.6) 3293 ( 51.6)[90 - 110) 0 ( 0.0) 7 ( 24.1) 216 ( 28.7) 806 ( 19.7) 144( 9.5) 1173 ( 18.4)[110 - 130) 0 ( 0.0) 4 ( 13.8) 51 ( 6.8) 120 ( 2.9) 14( 0.9) 189 ( 3.0)
[130+) 0 ( 0.0) 4 ( 13.8) 25 ( 3.3) 13 ( 0.3) 1( 0.1) 43 ( 0.7)TOTAL 0( 0.0) 29( 0.5) 753( 11.8) 4083( 64.0) 1514( 23.7) 6379 (100.0)
Table 2.2.1.1.16: Weight (by Age, Type of Diabetes = Type 2)
CMH Chi-SquareValue One or more cells have 0 obs

2.2.1.1. Weight (last episode in 12 months)Type of Diabetes = Type 2
Weight Gender * AgeValid Value NV/NA
Valid Value ( % ) NV/NA ( % ) Valid Value ( % ) NV/NA ( % ) N ( % )Valid Value 0 ( 0.0) 0 ( 0.0) 0 ( 0.0) 2328( 26.7) 2328 ( 26.7)
NV/NA 0 ( 0.0) 0 ( 0.0) 0 ( 0.0) 6379( 73.3) 6379 ( 73.3)TOTAL 0( 0.0) 0( 0.0) 0( 0.0) 8707(100.0) 8707 (100.0)
Table 2.2.1.1.17: Missing Data Weight (by Gender * Age, Type of Diabetes = Type 2)
Weight Gender * Age[0 - 18) [18 - 35) [35 - 55) [55 - 75) [75+)
Male ( % ) Female ( % ) Male ( % ) Female ( % ) Male ( % ) Female ( % ) Male ( % ) Female ( % ) Male ( % ) Female ( % ) N ( % )[0 - 50) 0 ( 0.0) 0 ( 0.0) 0 ( 0.0) 0 ( 0.0) 6 ( 2.1) 0 ( 0.0) 15 ( 0.8) 1 ( 0.0) 24 ( 3.0) 2( 0.3) 48 ( 0.8)[50 - 70) 0 ( 0.0) 0 ( 0.0) 3 ( 18.8) 1 ( 7.7) 13 ( 4.5) 38 ( 8.2) 28 ( 1.6) 92 ( 4.0) 2 ( 0.2) 12( 1.7) 189 ( 3.0)[70 - 90) 0 ( 0.0) 0 ( 0.0) 2 ( 12.5) 2 ( 15.4) 5 ( 1.7) 20 ( 4.3) 4 ( 0.2) 9 ( 0.4) 0 ( 0.0) 1( 0.1) 43 ( 0.7)[90 - 110) 0 ( 0.0) 0 ( 0.0) 1 ( 6.2) 3 ( 23.1) 77 ( 26.5) 26 ( 5.6) 656 ( 36.5) 277 ( 12.1) 419 ( 51.9) 174( 24.6) 1633 ( 25.6)[110 - 130) 0 ( 0.0) 0 ( 0.0) 5 ( 31.2) 5 ( 38.5) 134 ( 46.0) 218 ( 47.2) 865 ( 48.1) 1330 ( 58.2) 324 ( 40.1) 412( 58.4) 3293 ( 51.6)
[130+) 0 ( 0.0) 0 ( 0.0) 5 ( 31.2) 2 ( 15.4) 56 ( 19.2) 160 ( 34.6) 231 ( 12.8) 575 ( 25.2) 39 ( 4.8) 105( 14.9) 1173 ( 18.4)TOTAL 0( 0.0) 0( 0.0) 16( 0.3) 13( 0.2) 291( 4.6) 462( 7.2) 1799( 28.2) 2284( 35.8) 808( 12.7) 706( 11.1) 6379 (100.0)
Table 2.2.1.1.18: Weight (by Gender * Age, Type of Diabetes = Type 2)
CMH Chi-SquareValue One or more cells have 0 obs
2.2.1.1. Weight (last episode in 12 months)Type of Diabetes = Other Type
Weight GenderValid Value ( % ) NV/NA ( % ) N ( % )
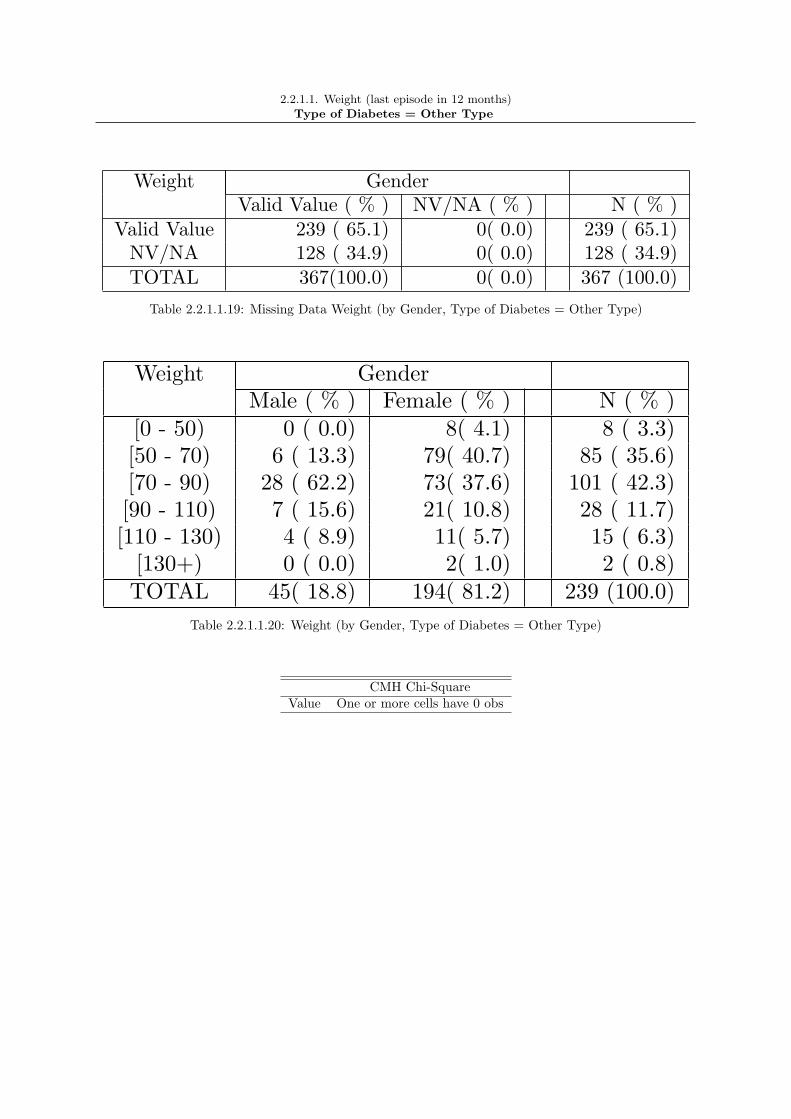
Valid Value 239 ( 65.1) 0( 0.0) 239 ( 65.1)NV/NA 128 ( 34.9) 0( 0.0) 128 ( 34.9)TOTAL 367(100.0) 0( 0.0) 367 (100.0)
Table 2.2.1.1.19: Missing Data Weight (by Gender, Type of Diabetes = Other Type)
Weight GenderMale ( % ) Female ( % ) N ( % )
[0 - 50) 0 ( 0.0) 8( 4.1) 8 ( 3.3)[50 - 70) 6 ( 13.3) 79( 40.7) 85 ( 35.6)[70 - 90) 28 ( 62.2) 73( 37.6) 101 ( 42.3)[90 - 110) 7 ( 15.6) 21( 10.8) 28 ( 11.7)[110 - 130) 4 ( 8.9) 11( 5.7) 15 ( 6.3)
[130+) 0 ( 0.0) 2( 1.0) 2 ( 0.8)TOTAL 45( 18.8) 194( 81.2) 239 (100.0)
Table 2.2.1.1.20: Weight (by Gender, Type of Diabetes = Other Type)
CMH Chi-SquareValue One or more cells have 0 obs

2.2.1.1. Weight (last episode in 12 months)Type of Diabetes = Other Type
Weight AgeValid Value ( % ) NV/NA ( % ) N ( % )
Valid Value 239 ( 65.1) 0( 0.0) 239 ( 65.1)NV/NA 128 ( 34.9) 0( 0.0) 128 ( 34.9)TOTAL 367(100.0) 0( 0.0) 367 (100.0)
Table 2.2.1.1.21: Missing Data Weight (by Age, Type of Diabetes = Other Type)
Weight Age[0 - 18) ( % ) [18 - 35) ( % ) [35 - 55) ( % ) [55 - 75) ( % ) [75+) ( % ) N ( % )
[0 - 50) 0 ( 0.0) 4 ( 5.9) 2 ( 2.5) 1 ( 1.4) 1( 5.3) 8 ( 3.3)[50 - 70) 0 ( 0.0) 27 ( 39.7) 29 ( 35.8) 22 ( 31.9) 7( 36.8) 85 ( 35.6)[70 - 90) 0 ( 0.0) 19 ( 27.9) 37 ( 45.7) 36 ( 52.2) 9( 47.4) 101 ( 42.3)[90 - 110) 2 (100.0) 12 ( 17.6) 7 ( 8.6) 5 ( 7.2) 2( 10.5) 28 ( 11.7)[110 - 130) 0 ( 0.0) 5 ( 7.4) 6 ( 7.4) 4 ( 5.8) 0( 0.0) 15 ( 6.3)
[130+) 0 ( 0.0) 1 ( 1.5) 0 ( 0.0) 1 ( 1.4) 0( 0.0) 2 ( 0.8)TOTAL 2( 0.8) 68( 28.5) 81( 33.9) 69( 28.9) 19( 7.9) 239 (100.0)
Table 2.2.1.1.22: Weight (by Age, Type of Diabetes = Other Type)
CMH Chi-SquareValue One or more cells have 0 obs

2.2.1.1. Weight (last episode in 12 months)Type of Diabetes = Other Type
Weight Gender * AgeValid Value NV/NA
Valid Value ( % ) NV/NA ( % ) Valid Value ( % ) NV/NA ( % ) N ( % )Valid Value 0 ( 0.0) 0 ( 0.0) 0 ( 0.0) 128( 34.9) 128 ( 34.9)
NV/NA 0 ( 0.0) 0 ( 0.0) 0 ( 0.0) 239( 65.1) 239 ( 65.1)TOTAL 0( 0.0) 0( 0.0) 0( 0.0) 367(100.0) 367 (100.0)
Table 2.2.1.1.23: Missing Data Weight (by Gender * Age, Type of Diabetes = Other Type)
Weight Gender * Age[0 - 18) [18 - 35) [35 - 55) [55 - 75) [75+)
Male ( % ) Female ( % ) Male ( % ) Female ( % ) Male ( % ) Female ( % ) Male ( % ) Female ( % ) Male ( % ) Female ( % ) N ( % )[0 - 50) 0 ( 0.0) 0 ( 0.0) 4 ( 5.9) 0 ( 0.0) 2 ( 2.9) 0 ( 0.0) 1 ( 2.2) 0 ( 0.0) 1 ( 8.3) 0( 0.0) 8 ( 3.3)[50 - 70) 0 ( 0.0) 0 ( 0.0) 5 ( 7.4) 0 ( 0.0) 3 ( 4.4) 3 ( 23.1) 3 ( 6.7) 1 ( 4.2) 0 ( 0.0) 0( 0.0) 15 ( 6.3)[70 - 90) 0 ( 0.0) 0 ( 0.0) 1 ( 1.5) 0 ( 0.0) 0 ( 0.0) 0 ( 0.0) 1 ( 2.2) 0 ( 0.0) 0 ( 0.0) 0( 0.0) 2 ( 0.8)[90 - 110) 0 ( 0.0) 0 ( 0.0) 27 ( 39.7) 0 ( 0.0) 27 ( 39.7) 2 ( 15.4) 18 ( 40.0) 4 ( 16.7) 7 ( 58.3) 0( 0.0) 85 ( 35.6)[110 - 130) 0 ( 0.0) 0 ( 0.0) 19 ( 27.9) 0 ( 0.0) 30 ( 44.1) 7 ( 53.8) 20 ( 44.4) 16 ( 66.7) 4 ( 33.3) 5( 71.4) 101 ( 42.3)
[130+) 1 (100.0) 1 (100.0) 12 ( 17.6) 0 ( 0.0) 6 ( 8.8) 1 ( 7.7) 2 ( 4.4) 3 ( 12.5) 0 ( 0.0) 2( 28.6) 28 ( 11.7)TOTAL 1( 0.4) 1( 0.4) 68( 28.5) 0( 0.0) 68( 28.5) 13( 5.4) 45( 18.8) 24( 10.0) 12( 5.0) 7( 2.9) 239 (100.0)
Table 2.2.1.1.24: Weight (by Gender * Age, Type of Diabetes = Other Type)
CMH Chi-SquareValue One or more cells have 0 obs

2.2.1.1. Weight (last episode in 12 months)
●
●
Weight
Valid ValueNV/NA
Valid Value NV/NA
025
5075
100
Barplot: 2.2.1.1.1 - Missing Data Weight (by Type of Diabetes)
●
●
●
●
●
●
Weight
[0 − 50)[50 − 70)[70 − 90)[90 − 110)[110 − 130)[130+)
Other Type Type 1 Type 2
025
5075
100
Barplot: 2.2.1.1.2 - Weight (by Type of Diabetes)

2.2.1.1. Weight (last episode in 12 months)
●
●
Weight
Valid ValueNV/NA
Valid Value NV/NA
025
5075
100
Barplot: 2.2.1.1.3 - Missing Data Weight (by Gender)
●
●
●
●
●
●
Weight
[0 − 50)[50 − 70)[70 − 90)[90 − 110)[110 − 130)[130+)
Female Male
025
5075
100
Barplot: 2.2.1.1.4 - Weight (by Gender)

2.2.1.1. Weight (last episode in 12 months)
●
●
Weight
Valid ValueNV/NA
Valid Value NV/NA
025
5075
100
Barplot: 2.2.1.1.5 - Missing Data Weight (by Age)
●
●
●
●
●
●
Weight
[0 − 50)[50 − 70)[70 − 90)[90 − 110)[110 − 130)[130+)
[0 − 18) [18 − 35) [35 − 55) [55 − 75) [75 +)
025
5075
100
Barplot: 2.2.1.1.6 - Weight (by Age)

2.2.1.1. Weight (last episode in 12 months)Type of Diabetes = Type 1
●
●
Weight
Valid ValueNV/NA
Valid Value NV/NA
025
5075
100
Barplot: 2.2.1.1.7 - Missing Data Weight (by Gender, Type of Diabetes = Type 1)
●
●
●
●
●
●
Weight
[0 − 50)[50 − 70)[70 − 90)[90 − 110)[110 − 130)[130+)
Female Male
025
5075
100
Barplot: 2.2.1.1.8 - Weight (by Gender, Type of Diabetes = Type 1)

2.2.1.1. Weight (last episode in 12 months)Type of Diabetes = Type 1
●
●
Weight
Valid ValueNV/NA
Valid Value NV/NA
025
5075
100
Barplot: 2.2.1.1.9 - Missing Data Weight (by Age, Type of Diabetes = Type 1)
●
●
●
●
●
●
Weight
[0 − 50)[50 − 70)[70 − 90)[90 − 110)[110 − 130)[130+)
[0 − 18) [18 − 35) [35 − 55) [55 − 75) [75 +)
025
5075
100
Barplot: 2.2.1.1.10 - Weight (by Age, Type of Diabetes = Type 1)
2.2.1.1. Weight (last episode in 12 months)Type of Diabetes = Type 2
●
●
Weight
Valid ValueNV/NA
Valid Value NV/NA
025
5075
100
Barplot: 2.2.1.1.11 - Missing Data Weight (by Gender, Type of Diabetes = Type 2)
●
●
●
●
●
●
Weight
[0 − 50)[50 − 70)[70 − 90)[90 − 110)[110 − 130)[130+)
Female Male
025
5075
100
Barplot: 2.2.1.1.12 - Weight (by Gender, Type of Diabetes = Type 2)

2.2.1.1. Weight (last episode in 12 months)Type of Diabetes = Type 2
●
●
Weight
Valid ValueNV/NA
Valid Value NV/NA
025
5075
100
Barplot: 2.2.1.1.13 - Missing Data Weight (by Age, Type of Diabetes = Type 2)
●
●
●
●
●
●
Weight
[0 − 50)[50 − 70)[70 − 90)[90 − 110)[110 − 130)[130+)
[0 − 18) [18 − 35) [35 − 55) [55 − 75) [75 +)
025
5075
100
Barplot: 2.2.1.1.14 - Weight (by Age, Type of Diabetes = Type 2)

2.2.1.1. Weight (last episode in 12 months)Type of Diabetes = Other Type
●
●
Weight
Valid ValueNV/NA
Valid Value NV/NA
025
5075
100
Barplot: 2.2.1.1.15 - Missing Data Weight (by Gender, Type of Diabetes = Other Type)
●
●
●
●
●
●
Weight
[0 − 50)[50 − 70)[70 − 90)[90 − 110)[110 − 130)[130+)
Female Male
025
5075
100
Barplot: 2.2.1.1.16 - Weight (by Gender, Type of Diabetes = Other Type)

2.2.1.1. Weight (last episode in 12 months)Type of Diabetes = Other Type
●
●
Weight
Valid ValueNV/NA
Valid Value NV/NA
025
5075
100
Barplot: 2.2.1.1.17 - Missing Data Weight (by Age, Type of Diabetes = Other Type)
●
●
●
●
●
●
Weight
[0 − 50)[50 − 70)[70 − 90)[90 − 110)[110 − 130)[130+)
[0 − 18) [18 − 35) [35 − 55) [55 − 75) [75 +)
025
5075
100
Barplot: 2.2.1.1.18 - Weight (by Age, Type of Diabetes = Other Type)

2.2.1.1. Weight (last episode in 12 months)Type of Diabetes = Type 1
weight_c sex age_c type_dm
Den
sity
0.00
0.01
0.02
0.03
0.04
0.05
0.06
50 100 150 200
Male[0 − 18)
Female[0 − 18)
Male[18 − 35)
0.00
0.01
0.02
0.03
0.04
0.05
0.06Female
[18 − 35)0.00
0.01
0.02
0.03
0.04
0.05
0.06Male
[35 − 55)Female
[35 − 55)
Male[55 − 75)
0.00
0.01
0.02
0.03
0.04
0.05
0.06Female
[55 − 75)0.00
0.01
0.02
0.03
0.04
0.05
0.06Male[75+)
50 100 150 200
Female[75+)
Trellis Barplot: 2.2.1.1.19 - * Weight * Gender (Type of Diabetes = Type 1)

2.2.1.1. Weight (last episode in 12 months)Type of Diabetes = Type 2
weight_c sex age_c type_dm
Den
sity
0.000
0.005
0.010
0.015
0.020
0.025
0.030
0 50 100 150 200 250
Male[18 − 35)
Female[18 − 35)
Male[35 − 55)
0.000
0.005
0.010
0.015
0.020
0.025
0.030
Female[35 − 55)
0.000
0.005
0.010
0.015
0.020
0.025
0.030
Male[55 − 75)
Female[55 − 75)
Male[75+)
0 50 100 150 200 250
0.000
0.005
0.010
0.015
0.020
0.025
0.030
Female[75+)
Trellis Barplot: 2.2.1.1.20 - * Weight * Gender (Type of Diabetes = Type 2)

2.2.1.1. Weight (last episode in 12 months)Type of Diabetes = Other Type
weight_c sex age_c type_dm
Den
sity
0.00
0.02
0.04
0.06
0.08
40 60 80 100 120 140
Male[0 − 18)
Female[0 − 18)
Male[18 − 35)
0.00
0.02
0.04
0.06
0.08
Female[18 − 35)
0.00
0.02
0.04
0.06
0.08
Male[35 − 55)
Female[35 − 55)
Male[55 − 75)
0.00
0.02
0.04
0.06
0.08
Female[55 − 75)
0.00
0.02
0.04
0.06
0.08
Male[75+)
40 60 80 100 120 140
Female[75+)
Trellis Barplot: 2.2.1.1.21 - * Weight * Gender (Type of Diabetes = Other Type)

2.2.1.1. Weight (last episode in 12 months)
Type 1 Type 2 Other Type
050
100
150
200
250
Boxplot: 2.2.1.1.1 - Weight (by Type of Diabetes)

2.2.1.1. Weight (last episode in 12 months)
Male Female
050
100
150
200
250
Boxplot: 2.2.1.1.2 - Weight (by Gender)

2.2.1.1. Weight (last episode in 12 months)
[0 − 18) [18 − 35) [35 − 55) [55 − 75) [75+)
050
100
150
200
250
Boxplot: 2.2.1.1.3 - Weight (by Age)

2.2.1.1. Weight (last episode in 12 months)Type of Diabetes = Type 1
Male Female
5010
015
0
Boxplot: 2.2.1.1.4 - Weight (by Gender, Type of Diabetes = Type 1)

2.2.1.1. Weight (last episode in 12 months)Type of Diabetes = Type 1
[0 − 18) [18 − 35) [35 − 55) [55 − 75) [75+)
5010
015
0
Boxplot: 2.2.1.1.5 - Weight (by Age, Type of Diabetes = Type 1)

2.2.1.1. Weight (last episode in 12 months)Type of Diabetes = Type 2
Male Female
050
100
150
200
250
Boxplot: 2.2.1.1.6 - Weight (by Gender, Type of Diabetes = Type 2)
2.2.1.1. Weight (last episode in 12 months)Type of Diabetes = Type 2
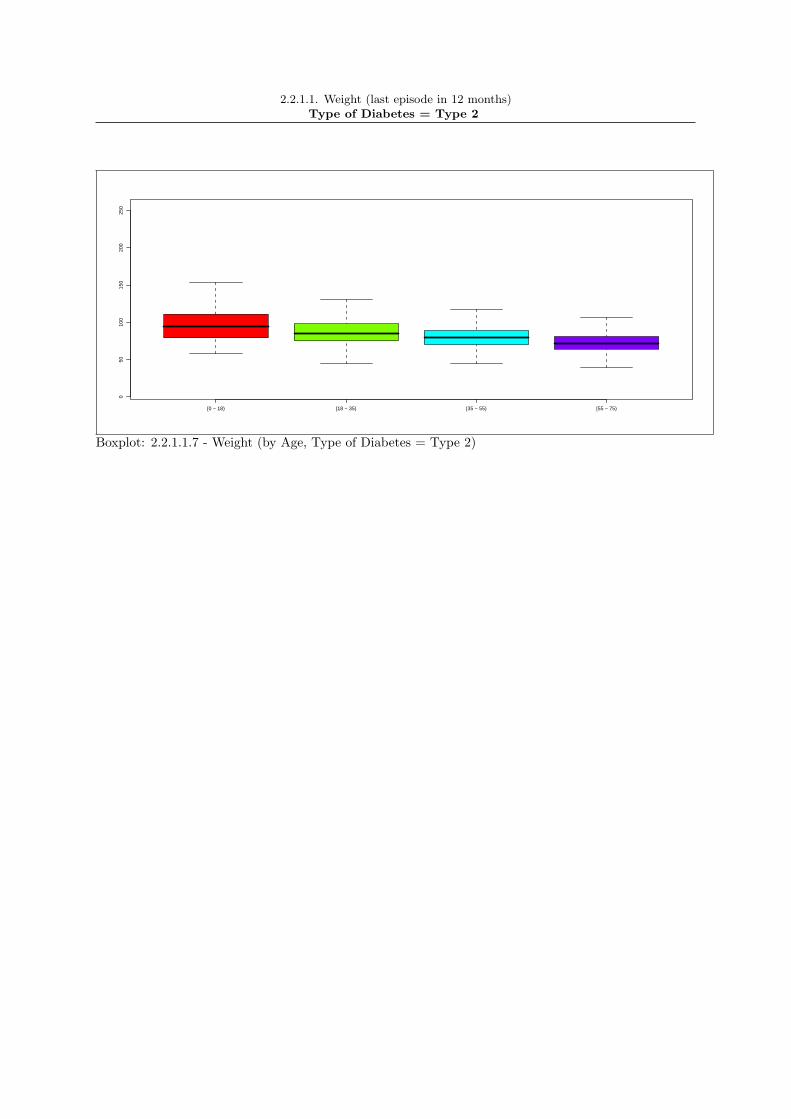
[0 − 18) [18 − 35) [35 − 55) [55 − 75)
050
100
150
200
250
Boxplot: 2.2.1.1.7 - Weight (by Age, Type of Diabetes = Type 2)

2.2.1.1. Weight (last episode in 12 months)Type of Diabetes = Other Type
Male Female
6080
100
120
Boxplot: 2.2.1.1.8 - Weight (by Gender, Type of Diabetes = Other Type)

2.2.1.1. Weight (last episode in 12 months)Type of Diabetes = Other Type
[0 − 18) [18 − 35) [35 − 55) [55 − 75) [75+)
6080
100
120
Boxplot: 2.2.1.1.9 - Weight (by Age, Type of Diabetes = Other Type)

2.2.1.1. Weight (last episode in 12 months)Type of Diabetes = Type 1
weight_i
50 100 150
●
Male[0 − 18)
●
Female[0 − 18)
● ●
Male[18 − 35)
●
Female[18 − 35)
● ●
Male[35 − 55)
● ●● ●●●● ●
Female[35 − 55)
● ●●
Male[55 − 75)
●
Female[55 − 75)
●
Male[75+)
50 100 150
●
Female[75+)
Trellis Boxplot: 2.2.1.1.10 - Weight * Gender * Age (Type of Diabetes = Type 1)

2.2.1.1. Weight (last episode in 12 months)Type of Diabetes = Type 2
weight_i
0 50 100 150 200 250
● ● ●
Male[18 − 35)
●
Female[18 − 35)
● ● ●● ●●●●●●●● ●
Male[35 − 55)
● ●●● ●● ●●
Female[35 − 55)
● ●● ●●●●●●●●● ●●● ●●●●●●●●●●●● ●● ●●●●●●●●●●●●● ●● ●
Male[55 − 75)
● ● ●●●●● ● ●● ● ●● ●●●●●●●●●●●●● ●
Female[55 − 75)
●● ●● ●● ●●●●●● ●●
Male[75+)
0 50 100 150 200 250
● ●● ●●●● ●
Female[75+)
Trellis Boxplot: 2.2.1.1.11 - Weight * Gender * Age (Type of Diabetes = Type 2)
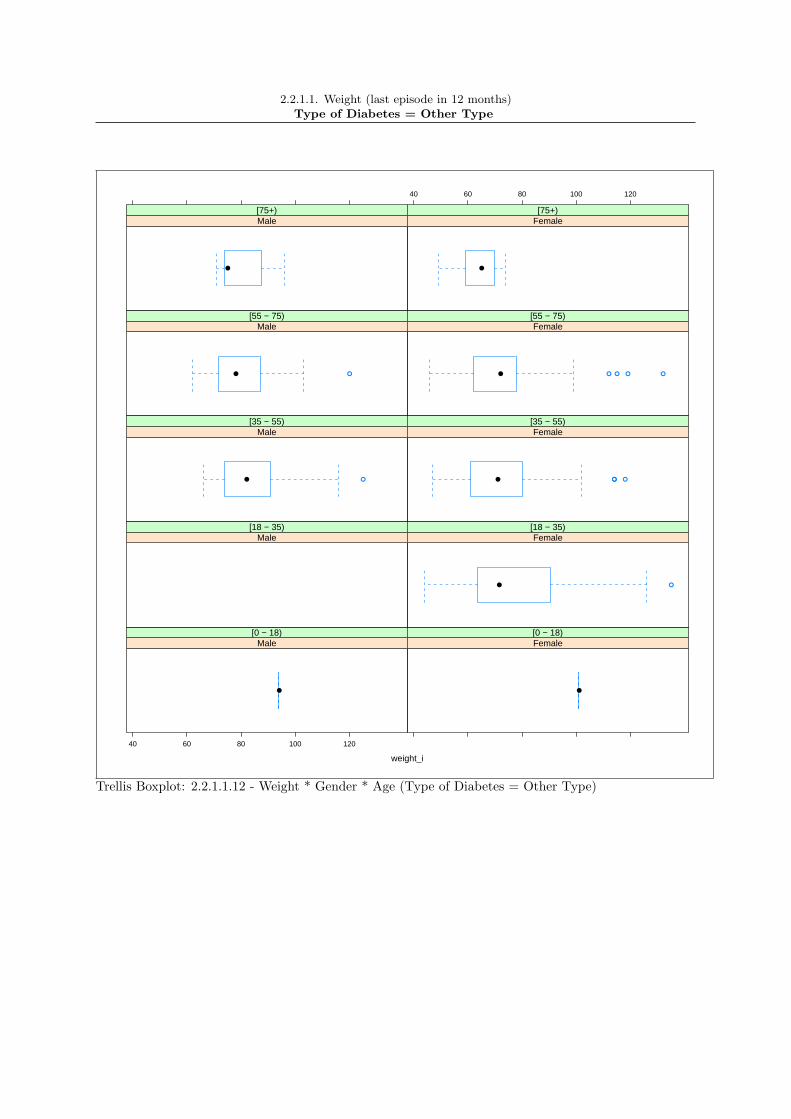
2.2.1.1. Weight (last episode in 12 months)Type of Diabetes = Other Type
weight_i
40 60 80 100 120
●
Male[0 − 18)
●
Female[0 − 18)
Male[18 − 35)
● ●
Female[18 − 35)
● ●
Male[35 − 55)
● ●● ●
Female[35 − 55)
● ●
Male[55 − 75)
● ●● ● ●
Female[55 − 75)
●
Male[75+)
40 60 80 100 120
●
Female[75+)
Trellis Boxplot: 2.2.1.1.12 - Weight * Gender * Age (Type of Diabetes = Other Type)

2.2.2 Lifestyle
67

2.2.3. Clinical measurements
68
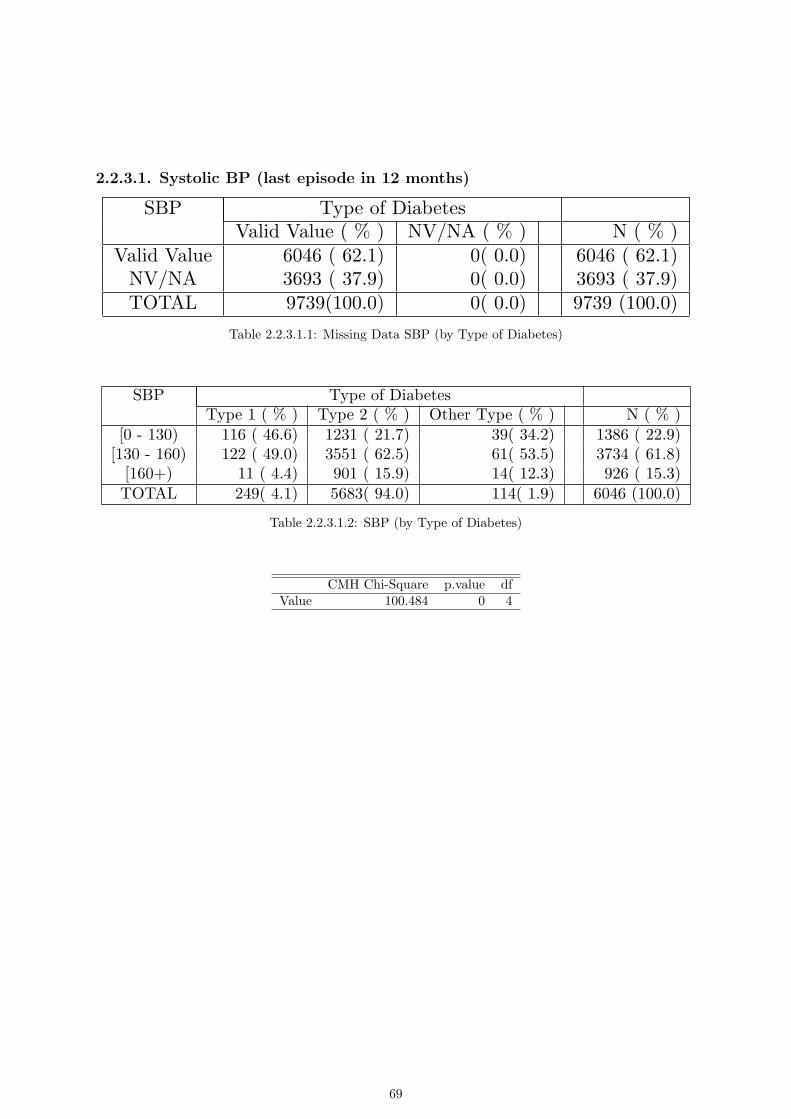
2.2.3.1. Systolic BP (last episode in 12 months)
SBP Type of DiabetesValid Value ( % ) NV/NA ( % ) N ( % )
Valid Value 6046 ( 62.1) 0( 0.0) 6046 ( 62.1)NV/NA 3693 ( 37.9) 0( 0.0) 3693 ( 37.9)TOTAL 9739(100.0) 0( 0.0) 9739 (100.0)
Table 2.2.3.1.1: Missing Data SBP (by Type of Diabetes)
SBP Type of DiabetesType 1 ( % ) Type 2 ( % ) Other Type ( % ) N ( % )
[0 - 130) 116 ( 46.6) 1231 ( 21.7) 39( 34.2) 1386 ( 22.9)[130 - 160) 122 ( 49.0) 3551 ( 62.5) 61( 53.5) 3734 ( 61.8)
[160+) 11 ( 4.4) 901 ( 15.9) 14( 12.3) 926 ( 15.3)TOTAL 249( 4.1) 5683( 94.0) 114( 1.9) 6046 (100.0)
Table 2.2.3.1.2: SBP (by Type of Diabetes)
CMH Chi-Square p.value dfValue 100.484 0 4
69
2.2.3.1. Systolic BP (last episode in 12 months)
SBP GenderValid Value ( % ) NV/NA ( % ) N ( % )
Valid Value 6046 ( 62.1) 0( 0.0) 6046 ( 62.1)NV/NA 3693 ( 37.9) 0( 0.0) 3693 ( 37.9)TOTAL 9739(100.0) 0( 0.0) 9739 (100.0)
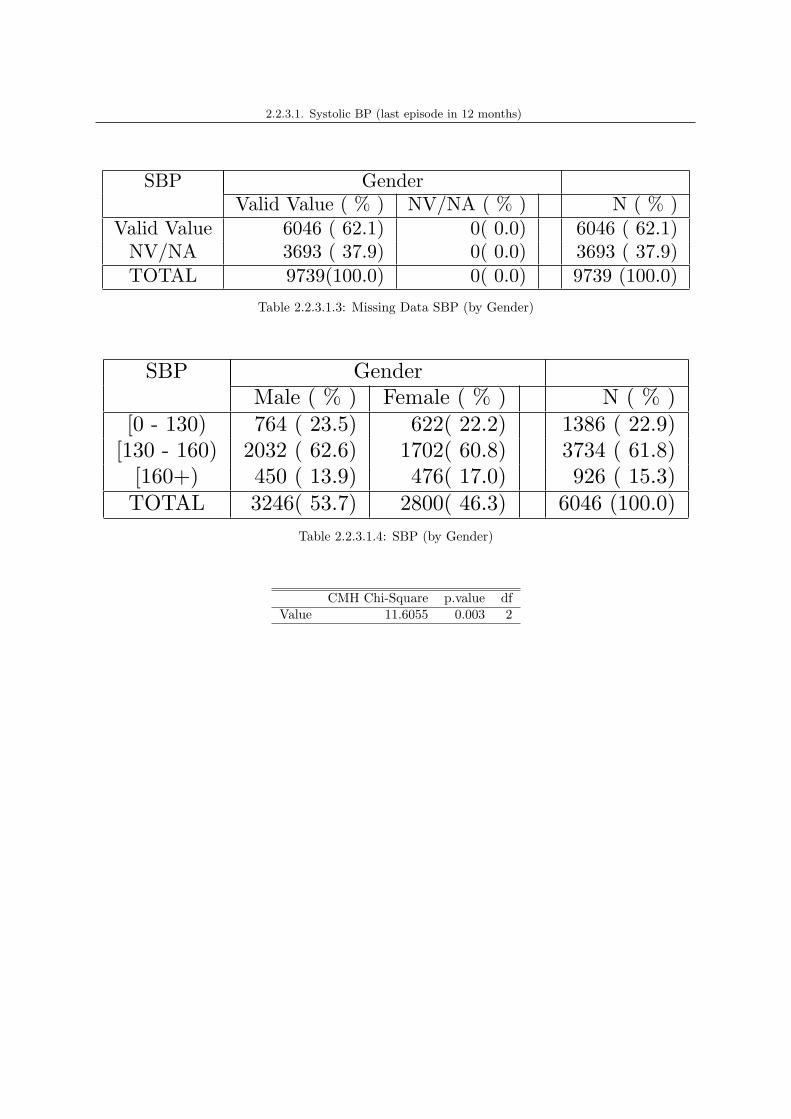
Table 2.2.3.1.3: Missing Data SBP (by Gender)
SBP GenderMale ( % ) Female ( % ) N ( % )
[0 - 130) 764 ( 23.5) 622( 22.2) 1386 ( 22.9)[130 - 160) 2032 ( 62.6) 1702( 60.8) 3734 ( 61.8)
[160+) 450 ( 13.9) 476( 17.0) 926 ( 15.3)TOTAL 3246( 53.7) 2800( 46.3) 6046 (100.0)
Table 2.2.3.1.4: SBP (by Gender)
CMH Chi-Square p.value dfValue 11.6055 0.003 2

2.2.3.1. Systolic BP (last episode in 12 months)
SBP AgeValid Value ( % ) NV/NA ( % ) N ( % )
Valid Value 6046 ( 62.1) 0( 0.0) 6046 ( 62.1)NV/NA 3693 ( 37.9) 0( 0.0) 3693 ( 37.9)TOTAL 9739(100.0) 0( 0.0) 9739 (100.0)
Table 2.2.3.1.5: Missing Data SBP (by Age)
SBP Age[0 - 18) ( % ) [18 - 35) ( % ) [35 - 55) ( % ) [55 - 75) ( % ) [75+) ( % ) N ( % )
[0 - 130) 1 (100.0) 66 ( 76.7) 294 ( 37.9) 789 ( 20.7) 236( 17.1) 1386 ( 22.9)[130 - 160) 0 ( 0.0) 20 ( 23.3) 424 ( 54.7) 2430 ( 63.9) 860( 62.3) 3734 ( 61.8)
[160+) 0 ( 0.0) 0 ( 0.0) 57 ( 7.4) 585 ( 15.4) 284( 20.6) 926 ( 15.3)TOTAL 1( 0.0) 86( 1.4) 775( 12.8) 3804( 62.9) 1380( 22.8) 6046 (100.0)
Table 2.2.3.1.6: SBP (by Age)
CMH Chi-SquareValue One or more cells have 0 obs

2.2.3.1. Systolic BP (last episode in 12 months)Type of Diabetes = Type 1
SBP GenderValid Value ( % ) NV/NA ( % ) N ( % )
Valid Value 249 ( 37.4) 0( 0.0) 249 ( 37.4)NV/NA 416 ( 62.6) 0( 0.0) 416 ( 62.6)TOTAL 665(100.0) 0( 0.0) 665 (100.0)
Table 2.2.3.1.7: Missing Data SBP (by Gender, Type of Diabetes = Type 1)
SBP GenderMale ( % ) Female ( % ) N ( % )
[0 - 130) 58 ( 42.6) 58( 51.3) 116 ( 46.6)[130 - 160) 71 ( 52.2) 51( 45.1) 122 ( 49.0)
[160+) 7 ( 5.1) 4( 3.5) 11 ( 4.4)TOTAL 136( 54.6) 113( 45.4) 249 (100.0)
Table 2.2.3.1.8: SBP (by Gender, Type of Diabetes = Type 1)
CMH Chi-Square p.value dfValue 1.9893 0.3698 2

2.2.3.1. Systolic BP (last episode in 12 months)Type of Diabetes = Type 1
SBP AgeValid Value ( % ) NV/NA ( % ) N ( % )
Valid Value 249 ( 37.4) 0( 0.0) 249 ( 37.4)NV/NA 416 ( 62.6) 0( 0.0) 416 ( 62.6)TOTAL 665(100.0) 0( 0.0) 665 (100.0)
Table 2.2.3.1.9: Missing Data SBP (by Age, Type of Diabetes = Type 1)
SBP Age[0 - 18) ( % ) [18 - 35) ( % ) [35 - 55) ( % ) [55 - 75) ( % ) [75+) ( % ) N ( % )
[0 - 130) 1 (100.0) 44 ( 83.0) 60 ( 50.0) 11 ( 15.5) 0( 0.0) 116 ( 46.6)[130 - 160) 0 ( 0.0) 9 ( 17.0) 58 ( 48.3) 51 ( 71.8) 4(100.0) 122 ( 49.0)
[160+) 0 ( 0.0) 0 ( 0.0) 2 ( 1.7) 9 ( 12.7) 0( 0.0) 11 ( 4.4)TOTAL 1( 0.4) 53( 21.3) 120( 48.2) 71( 28.5) 4( 1.6) 249 (100.0)
Table 2.2.3.1.10: SBP (by Age, Type of Diabetes = Type 1)
CMH Chi-SquareValue One or more cells have 0 obs

2.2.3.1. Systolic BP (last episode in 12 months)Type of Diabetes = Type 1
SBP Gender * AgeValid Value NV/NA
Valid Value ( % ) NV/NA ( % ) Valid Value ( % ) NV/NA ( % ) N ( % )Valid Value 0 ( 0.0) 0 ( 0.0) 0 ( 0.0) 416( 62.6) 416 ( 62.6)
NV/NA 0 ( 0.0) 0 ( 0.0) 0 ( 0.0) 249( 37.4) 249 ( 37.4)TOTAL 0( 0.0) 0( 0.0) 0( 0.0) 665(100.0) 665 (100.0)
Table 2.2.3.1.11: Missing Data SBP (by Gender * Age, Type of Diabetes = Type 1)
SBP Gender * Age[0 - 18) [18 - 35) [35 - 55) [55 - 75) [75+)
Male ( % ) Female ( % ) Male ( % ) Female ( % ) Male ( % ) Female ( % ) Male ( % ) Female ( % ) Male ( % ) Female ( % ) N ( % )[0 - 130) 1 (100.0) 0 ( 0.0) 21 ( 87.5) 23 ( 79.3) 29 ( 55.8) 31 ( 45.6) 7 ( 21.2) 4 ( 10.5) 0 ( 0.0) 0( 0.0) 116 ( 46.6)
[130 - 160) 0 ( 0.0) 0 ( 0.0) 3 ( 12.5) 6 ( 20.7) 23 ( 44.2) 35 ( 51.5) 22 ( 66.7) 29 ( 76.3) 3 (100.0) 1(100.0) 122 ( 49.0)[160+) 0 ( 0.0) 0 ( 0.0) 0 ( 0.0) 0 ( 0.0) 0 ( 0.0) 2 ( 2.9) 4 ( 12.1) 5 ( 13.2) 0 ( 0.0) 0( 0.0) 11 ( 4.4)
TOTAL 1( 0.4) 0( 0.0) 24( 9.6) 29( 11.6) 52( 20.9) 68( 27.3) 33( 13.3) 38( 15.3) 3( 1.2) 1( 0.4) 249 (100.0)
Table 2.2.3.1.12: SBP (by Gender * Age, Type of Diabetes = Type 1)
CMH Chi-SquareValue One or more cells have 0 obs

2.2.3.1. Systolic BP (last episode in 12 months)Type of Diabetes = Type 2
SBP GenderValid Value ( % ) NV/NA ( % ) N ( % )
Valid Value 5683 ( 65.3) 0( 0.0) 5683 ( 65.3)NV/NA 3024 ( 34.7) 0( 0.0) 3024 ( 34.7)TOTAL 8707(100.0) 0( 0.0) 8707 (100.0)
Table 2.2.3.1.13: Missing Data SBP (by Gender, Type of Diabetes = Type 2)
SBP GenderMale ( % ) Female ( % ) N ( % )
[0 - 130) 699 ( 22.8) 532( 20.4) 1231 ( 21.7)[130 - 160) 1936 ( 63.0) 1615( 61.8) 3551 ( 62.5)
[160+) 436 ( 14.2) 465( 17.8) 901 ( 15.9)TOTAL 3071( 54.0) 2612( 46.0) 5683 (100.0)
Table 2.2.3.1.14: SBP (by Gender, Type of Diabetes = Type 2)
CMH Chi-Square p.value dfValue 15.6363 4e− 04 2

2.2.3.1. Systolic BP (last episode in 12 months)Type of Diabetes = Type 2
SBP AgeValid Value ( % ) NV/NA ( % ) N ( % )
Valid Value 5683 ( 65.3) 0( 0.0) 5683 ( 65.3)NV/NA 3024 ( 34.7) 0( 0.0) 3024 ( 34.7)TOTAL 8707(100.0) 0( 0.0) 8707 (100.0)
Table 2.2.3.1.15: Missing Data SBP (by Age, Type of Diabetes = Type 2)
SBP Age[0 - 18) ( % ) [18 - 35) ( % ) [35 - 55) ( % ) [55 - 75) ( % ) [75+) ( % ) N ( % )
[0 - 130) 0 ( 0.0) 11 ( 57.9) 219 ( 34.8) 766 ( 20.8) 235( 17.3) 1231 ( 21.7)[130 - 160) 0 ( 0.0) 8 ( 42.1) 356 ( 56.5) 2341 ( 63.7) 846( 62.3) 3551 ( 62.5)
[160+) 0 ( 0.0) 0 ( 0.0) 55 ( 8.7) 568 ( 15.5) 278( 20.5) 901 ( 15.9)TOTAL 0( 0.0) 19( 0.3) 630( 11.1) 3675( 64.7) 1359( 23.9) 5683 (100.0)
Table 2.2.3.1.16: SBP (by Age, Type of Diabetes = Type 2)
CMH Chi-SquareValue One or more cells have 0 obs

2.2.3.1. Systolic BP (last episode in 12 months)Type of Diabetes = Type 2
SBP Gender * AgeValid Value NV/NA
Valid Value ( % ) NV/NA ( % ) Valid Value ( % ) NV/NA ( % ) N ( % )Valid Value 0 ( 0.0) 0 ( 0.0) 0 ( 0.0) 3024( 34.7) 3024 ( 34.7)
NV/NA 0 ( 0.0) 0 ( 0.0) 0 ( 0.0) 5683( 65.3) 5683 ( 65.3)TOTAL 0( 0.0) 0( 0.0) 0( 0.0) 8707(100.0) 8707 (100.0)
Table 2.2.3.1.17: Missing Data SBP (by Gender * Age, Type of Diabetes = Type 2)
SBP Gender * Age[0 - 18) [18 - 35) [35 - 55) [55 - 75) [75+)
Male ( % ) Female ( % ) Male ( % ) Female ( % ) Male ( % ) Female ( % ) Male ( % ) Female ( % ) Male ( % ) Female ( % ) N ( % )[0 - 130) 0 ( 0.0) 0 ( 0.0) 5 ( 55.6) 6 ( 60.0) 85 ( 35.6) 134 ( 34.3) 330 ( 20.3) 436 ( 21.3) 112 ( 15.2) 123( 19.7) 1231 ( 21.7)
[130 - 160) 0 ( 0.0) 0 ( 0.0) 4 ( 44.4) 4 ( 40.0) 127 ( 53.1) 229 ( 58.6) 1029 ( 63.2) 1312 ( 64.1) 455 ( 61.9) 391( 62.7) 3551 ( 62.5)[160+) 0 ( 0.0) 0 ( 0.0) 0 ( 0.0) 0 ( 0.0) 27 ( 11.3) 28 ( 7.2) 270 ( 16.6) 298 ( 14.6) 168 ( 22.9) 110( 17.6) 901 ( 15.9)
TOTAL 0( 0.0) 0( 0.0) 9( 0.2) 10( 0.2) 239( 4.2) 391( 6.9) 1629( 28.7) 2046( 36.0) 735( 12.9) 624( 11.0) 5683 (100.0)
Table 2.2.3.1.18: SBP (by Gender * Age, Type of Diabetes = Type 2)
CMH Chi-SquareValue One or more cells have 0 obs

2.2.3.1. Systolic BP (last episode in 12 months)Type of Diabetes = Other Type
SBP GenderValid Value ( % ) NV/NA ( % ) N ( % )
Valid Value 114 ( 31.1) 0( 0.0) 114 ( 31.1)NV/NA 253 ( 68.9) 0( 0.0) 253 ( 68.9)TOTAL 367(100.0) 0( 0.0) 367 (100.0)
Table 2.2.3.1.19: Missing Data SBP (by Gender, Type of Diabetes = Other Type)
SBP GenderMale ( % ) Female ( % ) N ( % )
[0 - 130) 7 ( 17.9) 32( 42.7) 39 ( 34.2)[130 - 160) 25 ( 64.1) 36( 48.0) 61 ( 53.5)
[160+) 7 ( 17.9) 7( 9.3) 14 ( 12.3)TOTAL 39( 34.2) 75( 65.8) 114 (100.0)
Table 2.2.3.1.20: SBP (by Gender, Type of Diabetes = Other Type)
CMH Chi-Square p.value dfValue 7.3764 0.025 2

2.2.3.1. Systolic BP (last episode in 12 months)Type of Diabetes = Other Type
SBP AgeValid Value ( % ) NV/NA ( % ) N ( % )
Valid Value 114 ( 31.1) 0( 0.0) 114 ( 31.1)NV/NA 253 ( 68.9) 0( 0.0) 253 ( 68.9)TOTAL 367(100.0) 0( 0.0) 367 (100.0)
Table 2.2.3.1.21: Missing Data SBP (by Age, Type of Diabetes = Other Type)
SBP Age[0 - 18) ( % ) [18 - 35) ( % ) [35 - 55) ( % ) [55 - 75) ( % ) [75+) ( % ) N ( % )
[0 - 130) 0 ( 0.0) 11 ( 78.6) 15 ( 60.0) 12 ( 20.7) 1( 5.9) 39 ( 34.2)[130 - 160) 0 ( 0.0) 3 ( 21.4) 10 ( 40.0) 38 ( 65.5) 10( 58.8) 61 ( 53.5)
[160+) 0 ( 0.0) 0 ( 0.0) 0 ( 0.0) 8 ( 13.8) 6( 35.3) 14 ( 12.3)TOTAL 0( 0.0) 14( 12.3) 25( 21.9) 58( 50.9) 17( 14.9) 114 (100.0)
Table 2.2.3.1.22: SBP (by Age, Type of Diabetes = Other Type)
CMH Chi-SquareValue One or more cells have 0 obs

2.2.3.1. Systolic BP (last episode in 12 months)Type of Diabetes = Other Type
SBP Gender * AgeValid Value NV/NA
Valid Value ( % ) NV/NA ( % ) Valid Value ( % ) NV/NA ( % ) N ( % )Valid Value 0 ( 0.0) 0 ( 0.0) 0 ( 0.0) 253( 68.9) 253 ( 68.9)
NV/NA 0 ( 0.0) 0 ( 0.0) 0 ( 0.0) 114( 31.1) 114 ( 31.1)TOTAL 0( 0.0) 0( 0.0) 0( 0.0) 367(100.0) 367 (100.0)
Table 2.2.3.1.23: Missing Data SBP (by Gender * Age, Type of Diabetes = Other Type)
SBP Gender * Age[0 - 18) [18 - 35) [35 - 55) [55 - 75) [75+)
Male ( % ) Female ( % ) Male ( % ) Female ( % ) Male ( % ) Female ( % ) Male ( % ) Female ( % ) Male ( % ) Female ( % ) N ( % )[0 - 130) 0 ( 0.0) 0 ( 0.0) 11 ( 78.6) 0 ( 0.0) 10 ( 66.7) 5 ( 50.0) 11 ( 30.6) 1 ( 4.5) 0 ( 0.0) 1( 14.3) 39 ( 34.2)
[130 - 160) 0 ( 0.0) 0 ( 0.0) 3 ( 21.4) 0 ( 0.0) 5 ( 33.3) 5 ( 50.0) 21 ( 58.3) 17 ( 77.3) 7 ( 70.0) 3( 42.9) 61 ( 53.5)[160+) 0 ( 0.0) 0 ( 0.0) 0 ( 0.0) 0 ( 0.0) 0 ( 0.0) 0 ( 0.0) 4 ( 11.1) 4 ( 18.2) 3 ( 30.0) 3( 42.9) 14 ( 12.3)
TOTAL 0( 0.0) 0( 0.0) 14( 12.3) 0( 0.0) 15( 13.2) 10( 8.8) 36( 31.6) 22( 19.3) 10( 8.8) 7( 6.1) 114 (100.0)
Table 2.2.3.1.24: SBP (by Gender * Age, Type of Diabetes = Other Type)
CMH Chi-SquareValue One or more cells have 0 obs

2.2.3.1. Systolic BP (last episode in 12 months)
●
●
SBP
Valid ValueNV/NA
Valid Value NV/NA
025
5075
100
Barplot: 2.2.3.1.1 - Missing Data SBP (by Type of Diabetes)
●
●
●
SBP
[0 − 130)[130 − 160)[160+)
Other Type Type 1 Type 2
025
5075
100
Barplot: 2.2.3.1.2 - SBP (by Type of Diabetes)

2.2.3.1. Systolic BP (last episode in 12 months)
●
●
SBP
Valid ValueNV/NA
Valid Value NV/NA
025
5075
100
Barplot: 2.2.3.1.3 - Missing Data SBP (by Gender)
●
●
●
SBP
[0 − 130)[130 − 160)[160+)
Female Male
025
5075
100
Barplot: 2.2.3.1.4 - SBP (by Gender)

2.2.3.1. Systolic BP (last episode in 12 months)
●
●
SBP
Valid ValueNV/NA
Valid Value NV/NA
025
5075
100
Barplot: 2.2.3.1.5 - Missing Data SBP (by Age)
●
●
●
SBP
[0 − 130)[130 − 160)[160+)
[0 − 18) [18 − 35) [35 − 55) [55 − 75) [75 +)
025
5075
100
Barplot: 2.2.3.1.6 - SBP (by Age)

2.2.3.1. Systolic BP (last episode in 12 months)Type of Diabetes = Type 1
●
●
SBP
Valid ValueNV/NA
Valid Value NV/NA
025
5075
100
Barplot: 2.2.3.1.7 - Missing Data SBP (by Gender, Type of Diabetes = Type 1)
●
●
●
SBP
[0 − 130)[130 − 160)[160+)
Female Male
025
5075
100
Barplot: 2.2.3.1.8 - SBP (by Gender, Type of Diabetes = Type 1)

2.2.3.1. Systolic BP (last episode in 12 months)Type of Diabetes = Type 1
●
●
SBP
Valid ValueNV/NA
Valid Value NV/NA
025
5075
100
Barplot: 2.2.3.1.9 - Missing Data SBP (by Age, Type of Diabetes = Type 1)
●
●
●
SBP
[0 − 130)[130 − 160)[160+)
[0 − 18) [18 − 35) [35 − 55) [55 − 75) [75 +)
025
5075
100
Barplot: 2.2.3.1.10 - SBP (by Age, Type of Diabetes = Type 1)

2.2.3.1. Systolic BP (last episode in 12 months)Type of Diabetes = Type 2
●
●
SBP
Valid ValueNV/NA
Valid Value NV/NA
025
5075
100
Barplot: 2.2.3.1.11 - Missing Data SBP (by Gender, Type of Diabetes = Type 2)
●
●
●
SBP
[0 − 130)[130 − 160)[160+)
Female Male
025
5075
100
Barplot: 2.2.3.1.12 - SBP (by Gender, Type of Diabetes = Type 2)

2.2.3.1. Systolic BP (last episode in 12 months)Type of Diabetes = Type 2
●
●
SBP
Valid ValueNV/NA
Valid Value NV/NA
025
5075
100
Barplot: 2.2.3.1.13 - Missing Data SBP (by Age, Type of Diabetes = Type 2)
●
●
●
SBP
[0 − 130)[130 − 160)[160+)
[0 − 18) [18 − 35) [35 − 55) [55 − 75) [75 +)
025
5075
100
Barplot: 2.2.3.1.14 - SBP (by Age, Type of Diabetes = Type 2)

2.2.3.1. Systolic BP (last episode in 12 months)Type of Diabetes = Other Type
●
●
SBP
Valid ValueNV/NA
Valid Value NV/NA
025
5075
100
Barplot: 2.2.3.1.15 - Missing Data SBP (by Gender, Type of Diabetes = Other Type)
●
●
●
SBP
[0 − 130)[130 − 160)[160+)
Female Male
025
5075
100
Barplot: 2.2.3.1.16 - SBP (by Gender, Type of Diabetes = Other Type)

2.2.3.1. Systolic BP (last episode in 12 months)Type of Diabetes = Other Type
●
●
SBP
Valid ValueNV/NA
Valid Value NV/NA
025
5075
100
Barplot: 2.2.3.1.17 - Missing Data SBP (by Age, Type of Diabetes = Other Type)
●
●
●
SBP
[0 − 130)[130 − 160)[160+)
[0 − 18) [18 − 35) [35 − 55) [55 − 75) [75 +)
025
5075
100
Barplot: 2.2.3.1.18 - SBP (by Age, Type of Diabetes = Other Type)
2.2.3.1. Systolic BP (last episode in 12 months)Type of Diabetes = Type 1
sbp_c sex age_c type_dm
Den
sity
0.00
0.01
0.02
0.03
0.04
0.05
0.06
100 150 200
Male[0 − 18)
Female[0 − 18)
Male[18 − 35)
0.00
0.01
0.02
0.03
0.04
0.05
0.06Female
[18 − 35)0.00
0.01
0.02
0.03
0.04
0.05
0.06Male
[35 − 55)Female
[35 − 55)
Male[55 − 75)
0.00
0.01
0.02
0.03
0.04
0.05
0.06Female
[55 − 75)0.00
0.01
0.02
0.03
0.04
0.05
0.06Male[75+)
100 150 200
Female[75+)
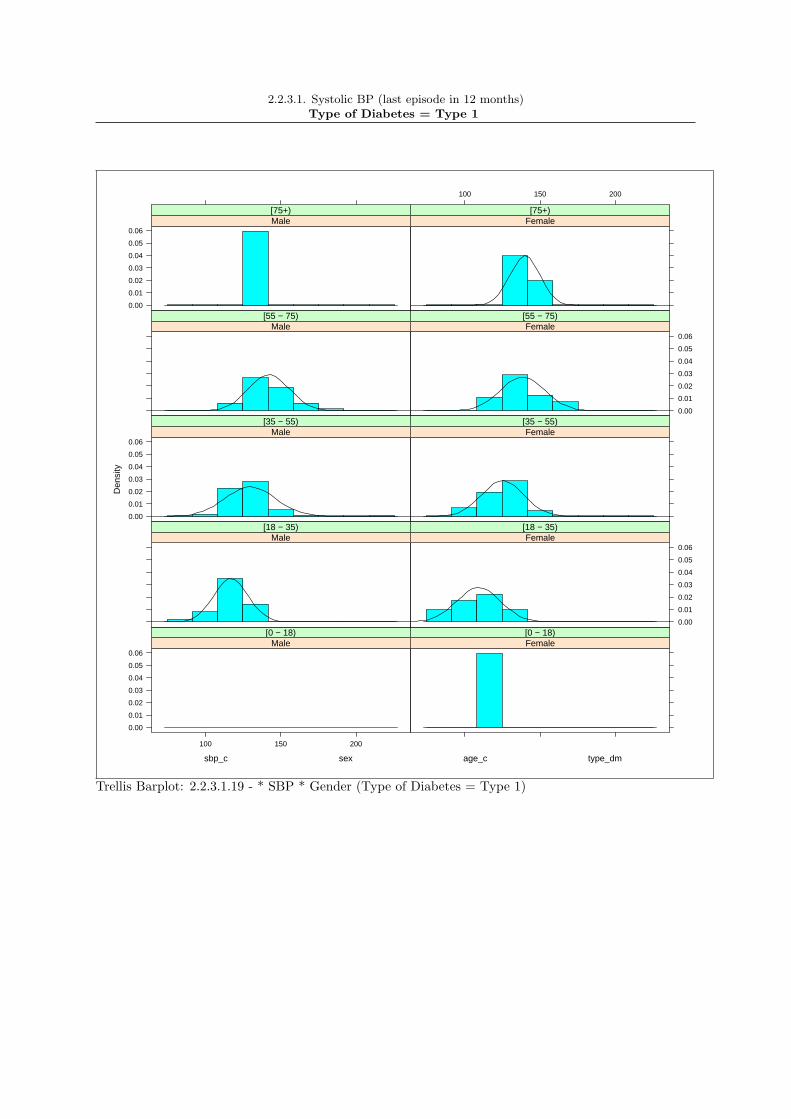
Trellis Barplot: 2.2.3.1.19 - * SBP * Gender (Type of Diabetes = Type 1)

2.2.3.1. Systolic BP (last episode in 12 months)Type of Diabetes = Type 2
sbp_c sex age_c type_dm
Den
sity
0.0000
0.0002
0.0004
0.0006
0.0008
0.0010
0 5000 10000
Male[18 − 35)
Female[18 − 35)
Male[35 − 55)
0.0000
0.0002
0.0004
0.0006
0.0008
0.0010Female
[35 − 55)0.0000
0.0002
0.0004
0.0006
0.0008
0.0010Male
[55 − 75)Female
[55 − 75)
Male[75+)
0 5000 10000
0.0000
0.0002
0.0004
0.0006
0.0008
0.0010Female[75+)
Trellis Barplot: 2.2.3.1.20 - * SBP * Gender (Type of Diabetes = Type 2)

2.2.3.1. Systolic BP (last episode in 12 months)Type of Diabetes = Other Type
sbp_c sex age_c type_dm
Den
sity
0.00
0.01
0.02
0.03
0.04
100 120 140 160 180
Male[18 − 35)
Female[18 − 35)
Male[35 − 55)
0.00
0.01
0.02
0.03
0.04
Female[35 − 55)
0.00
0.01
0.02
0.03
0.04
Male[55 − 75)
Female[55 − 75)
Male[75+)
100 120 140 160 180
0.00
0.01
0.02
0.03
0.04
Female[75+)
Trellis Barplot: 2.2.3.1.21 - * SBP * Gender (Type of Diabetes = Other Type)

2.2.3.1. Systolic BP (last episode in 12 months)
Type 1 Type 2 Other Type
020
0040
0060
0080
0010
000
1200
0
Boxplot: 2.2.3.1.1 - SBP (by Type of Diabetes)

2.2.3.1. Systolic BP (last episode in 12 months)
Male Female
020
0040
0060
0080
0010
000
1200
0
Boxplot: 2.2.3.1.2 - SBP (by Gender)

2.2.3.1. Systolic BP (last episode in 12 months)
[0 − 18) [18 − 35) [35 − 55) [55 − 75) [75+)
020
0040
0060
0080
0010
000
1200
0
Boxplot: 2.2.3.1.3 - SBP (by Age)

2.2.3.1. Systolic BP (last episode in 12 months)Type of Diabetes = Type 1
Male Female
8010
012
014
016
018
020
022
0
Boxplot: 2.2.3.1.4 - SBP (by Gender, Type of Diabetes = Type 1)

2.2.3.1. Systolic BP (last episode in 12 months)Type of Diabetes = Type 1
[0 − 18) [18 − 35) [35 − 55) [55 − 75) [75+)
8010
012
014
016
018
020
022
0
Boxplot: 2.2.3.1.5 - SBP (by Age, Type of Diabetes = Type 1)

2.2.3.1. Systolic BP (last episode in 12 months)Type of Diabetes = Type 2
Male Female
020
0040
0060
0080
0010
000
1200
0
Boxplot: 2.2.3.1.6 - SBP (by Gender, Type of Diabetes = Type 2)

2.2.3.1. Systolic BP (last episode in 12 months)Type of Diabetes = Type 2
[0 − 18) [18 − 35) [35 − 55) [55 − 75)
020
0040
0060
0080
0010
000
1200
0
Boxplot: 2.2.3.1.7 - SBP (by Age, Type of Diabetes = Type 2)

2.2.3.1. Systolic BP (last episode in 12 months)Type of Diabetes = Other Type
Male Female
100
120
140
160
180
Boxplot: 2.2.3.1.8 - SBP (by Gender, Type of Diabetes = Other Type)
2.2.3.1. Systolic BP (last episode in 12 months)Type of Diabetes = Other Type
[0 − 18) [18 − 35) [35 − 55) [55 − 75)
100
120
140
160
180
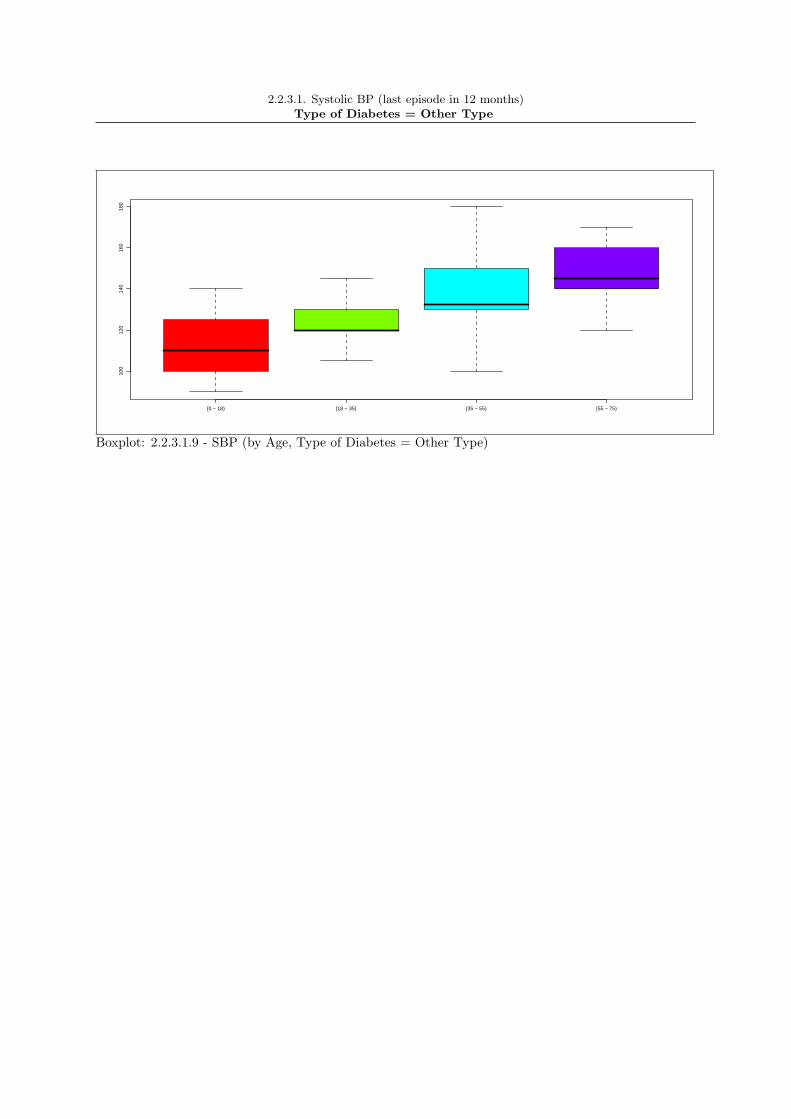
Boxplot: 2.2.3.1.9 - SBP (by Age, Type of Diabetes = Other Type)

2.2.3.1. Systolic BP (last episode in 12 months)Type of Diabetes = Type 1
sbp_i
100 150 200
Male[0 − 18)
●
Female[0 − 18)
●● ●
Male[18 − 35)
●
Female[18 − 35)
● ●
Male[35 − 55)
●
Female[35 − 55)
● ●●
Male[55 − 75)
●
Female[55 − 75)
●
Male[75+)
100 150 200
●
Female[75+)
Trellis Boxplot: 2.2.3.1.10 - SBP * Gender * Age (Type of Diabetes = Type 1)

2.2.3.1. Systolic BP (last episode in 12 months)Type of Diabetes = Type 2
sbp_i
0 5000 10000
●
Male[18 − 35)
●
Female[18 − 35)
●●●●●●●●
Male[35 − 55)
●●● ●●
Female[35 − 55)
●●●●●●●●●●●●●●●●●●●●●●●●●
Male[55 − 75)
●●●●●●●●●●●●●●●●●●●●●●●●●●●●●
Female[55 − 75)
●●●●●●●●●●●●●●
Male[75+)
0 5000 10000
●●●●●●●●●●●●●●●●●●●●●●●●●●●●●
Female[75+)
Trellis Boxplot: 2.2.3.1.11 - SBP * Gender * Age (Type of Diabetes = Type 2)

2.2.3.1. Systolic BP (last episode in 12 months)Type of Diabetes = Other Type
sbp_i
100 120 140 160 180
Male[18 − 35)
●
Female[18 − 35)
●
Male[35 − 55)
●
Female[35 − 55)
●
Male[55 − 75)
●
Female[55 − 75)
●●
Male[75+)
100 120 140 160 180
●
Female[75+)
Trellis Boxplot: 2.2.3.1.12 - SBP * Gender * Age (Type of Diabetes = Other Type)

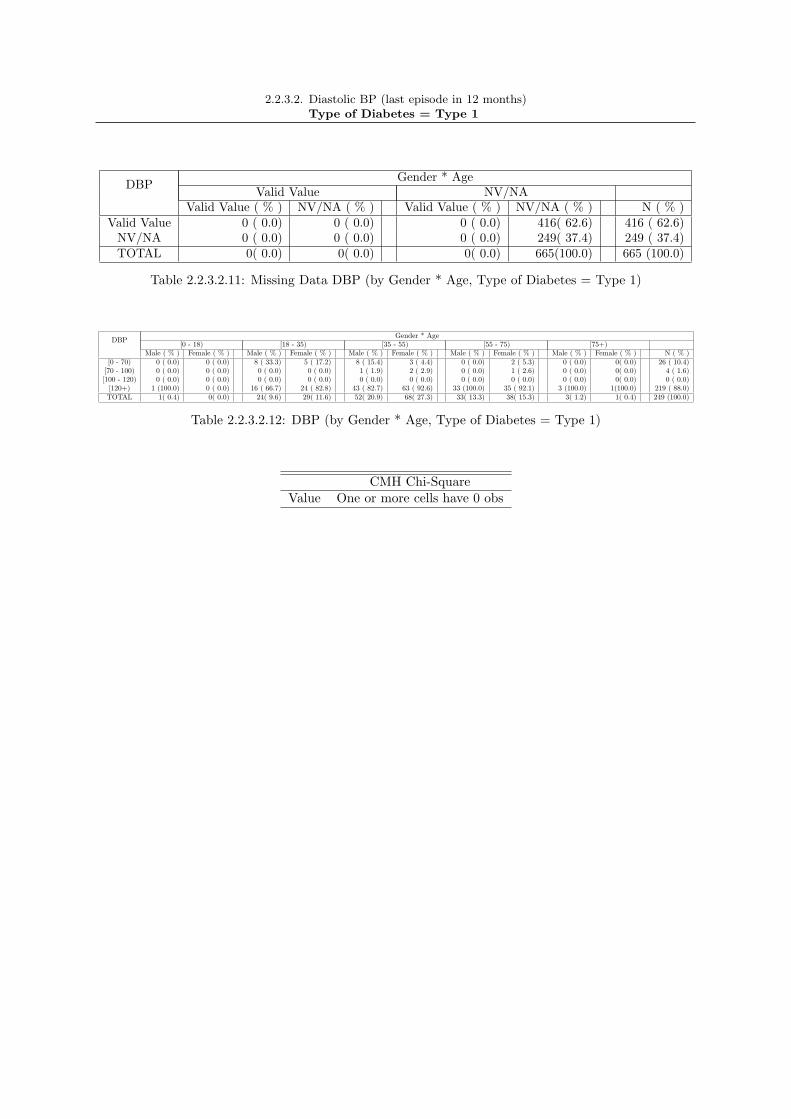
2.2.3.2. Diastolic BP (last episode in 12 months)
DBP Type of DiabetesValid Value ( % ) NV/NA ( % ) N ( % )
Valid Value 6050 ( 62.1) 0( 0.0) 6050 ( 62.1)NV/NA 3689 ( 37.9) 0( 0.0) 3689 ( 37.9)TOTAL 9739(100.0) 0( 0.0) 9739 (100.0)
Table 2.2.3.2.1: Missing Data DBP (by Type of Diabetes)
DBP Type of DiabetesType 1 ( % ) Type 2 ( % ) Other Type ( % ) N ( % )
[0 - 70) 26 ( 10.4) 294 ( 5.2) 9( 7.9) 329 ( 5.4)[70 - 100) 219 ( 88.0) 5138 ( 90.3) 103( 90.4) 5460 ( 90.2)[100 - 120) 4 ( 1.6) 243 ( 4.3) 2( 1.8) 249 ( 4.1)
[120+) 0 ( 0.0) 12 ( 0.2) 0( 0.0) 12 ( 0.2)TOTAL 249( 4.1) 5687( 94.0) 114( 1.9) 6050 (100.0)
Table 2.2.3.2.2: DBP (by Type of Diabetes)
CMH Chi-SquareValue One or more cells have 0 obs
105

2.2.3.2. Diastolic BP (last episode in 12 months)
DBP GenderValid Value ( % ) NV/NA ( % ) N ( % )
Valid Value 6050 ( 62.1) 0( 0.0) 6050 ( 62.1)NV/NA 3689 ( 37.9) 0( 0.0) 3689 ( 37.9)TOTAL 9739(100.0) 0( 0.0) 9739 (100.0)
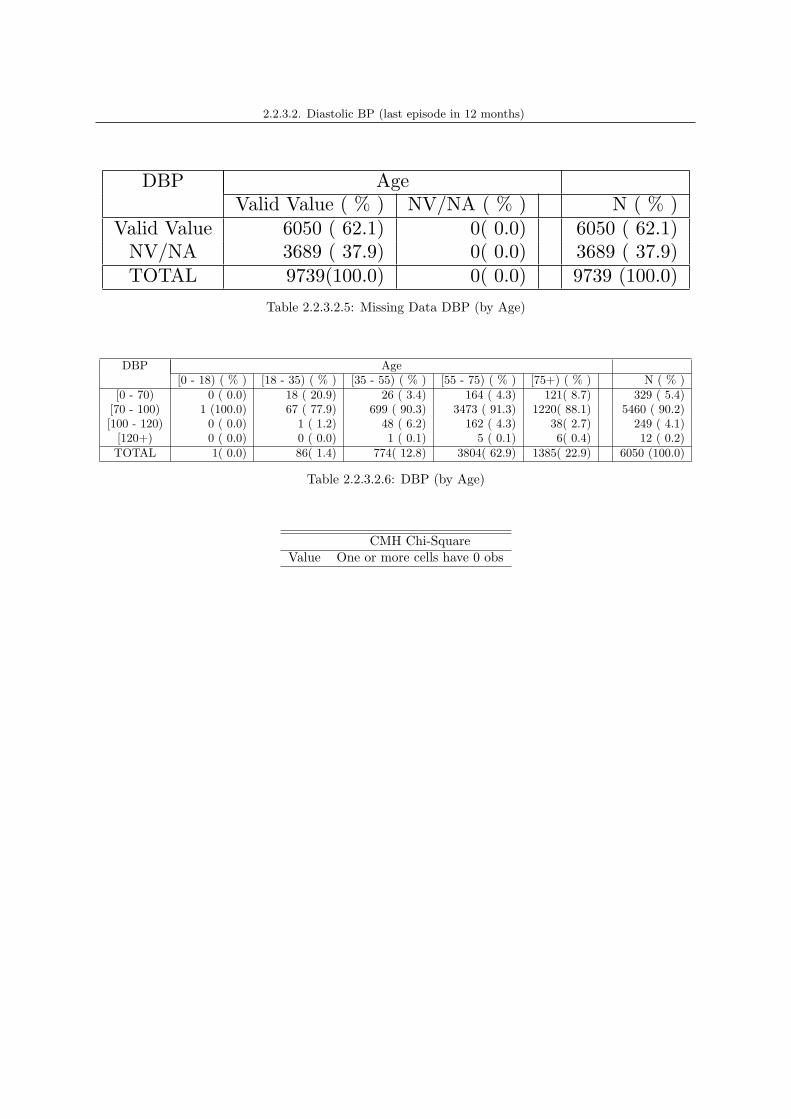
Table 2.2.3.2.3: Missing Data DBP (by Gender)
DBP GenderMale ( % ) Female ( % ) N ( % )
[0 - 70) 156 ( 4.8) 173( 6.2) 329 ( 5.4)[70 - 100) 2934 ( 90.3) 2526( 90.2) 5460 ( 90.2)[100 - 120) 151 ( 4.6) 98( 3.5) 249 ( 4.1)
[120+) 9 ( 0.3) 3( 0.1) 12 ( 0.2)TOTAL 3250( 53.7) 2800( 46.3) 6050 (100.0)
Table 2.2.3.2.4: DBP (by Gender)
CMH Chi-Square p.value dfValue 12.2441 0.0066 3
2.2.3.2. Diastolic BP (last episode in 12 months)
DBP AgeValid Value ( % ) NV/NA ( % ) N ( % )
Valid Value 6050 ( 62.1) 0( 0.0) 6050 ( 62.1)NV/NA 3689 ( 37.9) 0( 0.0) 3689 ( 37.9)TOTAL 9739(100.0) 0( 0.0) 9739 (100.0)
Table 2.2.3.2.5: Missing Data DBP (by Age)
DBP Age[0 - 18) ( % ) [18 - 35) ( % ) [35 - 55) ( % ) [55 - 75) ( % ) [75+) ( % ) N ( % )
[0 - 70) 0 ( 0.0) 18 ( 20.9) 26 ( 3.4) 164 ( 4.3) 121( 8.7) 329 ( 5.4)[70 - 100) 1 (100.0) 67 ( 77.9) 699 ( 90.3) 3473 ( 91.3) 1220( 88.1) 5460 ( 90.2)[100 - 120) 0 ( 0.0) 1 ( 1.2) 48 ( 6.2) 162 ( 4.3) 38( 2.7) 249 ( 4.1)
[120+) 0 ( 0.0) 0 ( 0.0) 1 ( 0.1) 5 ( 0.1) 6( 0.4) 12 ( 0.2)TOTAL 1( 0.0) 86( 1.4) 774( 12.8) 3804( 62.9) 1385( 22.9) 6050 (100.0)
Table 2.2.3.2.6: DBP (by Age)
CMH Chi-SquareValue One or more cells have 0 obs

2.2.3.2. Diastolic BP (last episode in 12 months)Type of Diabetes = Type 1
DBP GenderValid Value ( % ) NV/NA ( % ) N ( % )
Valid Value 249 ( 37.4) 0( 0.0) 249 ( 37.4)NV/NA 416 ( 62.6) 0( 0.0) 416 ( 62.6)TOTAL 665(100.0) 0( 0.0) 665 (100.0)
Table 2.2.3.2.7: Missing Data DBP (by Gender, Type of Diabetes = Type 1)
DBP GenderMale ( % ) Female ( % ) N ( % )
[0 - 70) 10 ( 7.4) 16( 14.2) 26 ( 10.4)[70 - 100) 123 ( 90.4) 96( 85.0) 219 ( 88.0)[100 - 120) 3 ( 2.2) 1( 0.9) 4 ( 1.6)
[120+) 0 ( 0.0) 0( 0.0) 0 ( 0.0)TOTAL 136( 54.6) 113( 45.4) 249 (100.0)
Table 2.2.3.2.8: DBP (by Gender, Type of Diabetes = Type 1)
CMH Chi-SquareValue One or more cells have 0 obs

2.2.3.2. Diastolic BP (last episode in 12 months)Type of Diabetes = Type 1
DBP AgeValid Value ( % ) NV/NA ( % ) N ( % )
Valid Value 249 ( 37.4) 0( 0.0) 249 ( 37.4)NV/NA 416 ( 62.6) 0( 0.0) 416 ( 62.6)TOTAL 665(100.0) 0( 0.0) 665 (100.0)
Table 2.2.3.2.9: Missing Data DBP (by Age, Type of Diabetes = Type 1)
DBP Age[0 - 18) ( % ) [18 - 35) ( % ) [35 - 55) ( % ) [55 - 75) ( % ) [75+) ( % ) N ( % )
[0 - 70) 0 ( 0.0) 13 ( 24.5) 11 ( 9.2) 2 ( 2.8) 0( 0.0) 26 ( 10.4)[70 - 100) 1 (100.0) 40 ( 75.5) 106 ( 88.3) 68 ( 95.8) 4(100.0) 219 ( 88.0)[100 - 120) 0 ( 0.0) 0 ( 0.0) 3 ( 2.5) 1 ( 1.4) 0( 0.0) 4 ( 1.6)
[120+) 0 ( 0.0) 0 ( 0.0) 0 ( 0.0) 0 ( 0.0) 0( 0.0) 0 ( 0.0)TOTAL 1( 0.4) 53( 21.3) 120( 48.2) 71( 28.5) 4( 1.6) 249 (100.0)
Table 2.2.3.2.10: DBP (by Age, Type of Diabetes = Type 1)
CMH Chi-SquareValue One or more cells have 0 obs
2.2.3.2. Diastolic BP (last episode in 12 months)Type of Diabetes = Type 1
DBP Gender * AgeValid Value NV/NA
Valid Value ( % ) NV/NA ( % ) Valid Value ( % ) NV/NA ( % ) N ( % )Valid Value 0 ( 0.0) 0 ( 0.0) 0 ( 0.0) 416( 62.6) 416 ( 62.6)
NV/NA 0 ( 0.0) 0 ( 0.0) 0 ( 0.0) 249( 37.4) 249 ( 37.4)TOTAL 0( 0.0) 0( 0.0) 0( 0.0) 665(100.0) 665 (100.0)
Table 2.2.3.2.11: Missing Data DBP (by Gender * Age, Type of Diabetes = Type 1)
DBP Gender * Age[0 - 18) [18 - 35) [35 - 55) [55 - 75) [75+)
Male ( % ) Female ( % ) Male ( % ) Female ( % ) Male ( % ) Female ( % ) Male ( % ) Female ( % ) Male ( % ) Female ( % ) N ( % )[0 - 70) 0 ( 0.0) 0 ( 0.0) 8 ( 33.3) 5 ( 17.2) 8 ( 15.4) 3 ( 4.4) 0 ( 0.0) 2 ( 5.3) 0 ( 0.0) 0( 0.0) 26 ( 10.4)
[70 - 100) 0 ( 0.0) 0 ( 0.0) 0 ( 0.0) 0 ( 0.0) 1 ( 1.9) 2 ( 2.9) 0 ( 0.0) 1 ( 2.6) 0 ( 0.0) 0( 0.0) 4 ( 1.6)[100 - 120) 0 ( 0.0) 0 ( 0.0) 0 ( 0.0) 0 ( 0.0) 0 ( 0.0) 0 ( 0.0) 0 ( 0.0) 0 ( 0.0) 0 ( 0.0) 0( 0.0) 0 ( 0.0)
[120+) 1 (100.0) 0 ( 0.0) 16 ( 66.7) 24 ( 82.8) 43 ( 82.7) 63 ( 92.6) 33 (100.0) 35 ( 92.1) 3 (100.0) 1(100.0) 219 ( 88.0)TOTAL 1( 0.4) 0( 0.0) 24( 9.6) 29( 11.6) 52( 20.9) 68( 27.3) 33( 13.3) 38( 15.3) 3( 1.2) 1( 0.4) 249 (100.0)
Table 2.2.3.2.12: DBP (by Gender * Age, Type of Diabetes = Type 1)
CMH Chi-SquareValue One or more cells have 0 obs

2.2.3.2. Diastolic BP (last episode in 12 months)Type of Diabetes = Type 2
DBP GenderValid Value ( % ) NV/NA ( % ) N ( % )
Valid Value 5687 ( 65.3) 0( 0.0) 5687 ( 65.3)NV/NA 3020 ( 34.7) 0( 0.0) 3020 ( 34.7)TOTAL 8707(100.0) 0( 0.0) 8707 (100.0)
Table 2.2.3.2.13: Missing Data DBP (by Gender, Type of Diabetes = Type 2)
DBP GenderMale ( % ) Female ( % ) N ( % )
[0 - 70) 146 ( 4.7) 148( 5.7) 294 ( 5.2)[70 - 100) 2773 ( 90.2) 2365( 90.5) 5138 ( 90.3)[100 - 120) 147 ( 4.8) 96( 3.7) 243 ( 4.3)
[120+) 9 ( 0.3) 3( 0.1) 12 ( 0.2)TOTAL 3075( 54.1) 2612( 45.9) 5687 (100.0)
Table 2.2.3.2.14: DBP (by Gender, Type of Diabetes = Type 2)
CMH Chi-Square p.value dfValue 8.4775 0.0371 3

2.2.3.2. Diastolic BP (last episode in 12 months)Type of Diabetes = Type 2
DBP AgeValid Value ( % ) NV/NA ( % ) N ( % )
Valid Value 5687 ( 65.3) 0( 0.0) 5687 ( 65.3)NV/NA 3020 ( 34.7) 0( 0.0) 3020 ( 34.7)TOTAL 8707(100.0) 0( 0.0) 8707 (100.0)
Table 2.2.3.2.15: Missing Data DBP (by Age, Type of Diabetes = Type 2)
DBP Age[0 - 18) ( % ) [18 - 35) ( % ) [35 - 55) ( % ) [55 - 75) ( % ) [75+) ( % ) N ( % )
[0 - 70) 0 ( 0.0) 0 ( 0.0) 14 ( 2.2) 161 ( 4.4) 119( 8.7) 294 ( 5.2)[70 - 100) 0 ( 0.0) 18 ( 94.7) 569 ( 90.5) 3350 ( 91.2) 1201( 88.0) 5138 ( 90.3)[100 - 120) 0 ( 0.0) 1 ( 5.3) 45 ( 7.2) 159 ( 4.3) 38( 2.8) 243 ( 4.3)
[120+) 0 ( 0.0) 0 ( 0.0) 1 ( 0.2) 5 ( 0.1) 6( 0.4) 12 ( 0.2)TOTAL 0( 0.0) 19( 0.3) 629( 11.1) 3675( 64.6) 1364( 24.0) 5687 (100.0)
Table 2.2.3.2.16: DBP (by Age, Type of Diabetes = Type 2)
CMH Chi-SquareValue One or more cells have 0 obs

2.2.3.2. Diastolic BP (last episode in 12 months)Type of Diabetes = Type 2
DBP Gender * AgeValid Value NV/NA
Valid Value ( % ) NV/NA ( % ) Valid Value ( % ) NV/NA ( % ) N ( % )Valid Value 0 ( 0.0) 0 ( 0.0) 0 ( 0.0) 3020( 34.7) 3020 ( 34.7)
NV/NA 0 ( 0.0) 0 ( 0.0) 0 ( 0.0) 5687( 65.3) 5687 ( 65.3)TOTAL 0( 0.0) 0( 0.0) 0( 0.0) 8707(100.0) 8707 (100.0)
Table 2.2.3.2.17: Missing Data DBP (by Gender * Age, Type of Diabetes = Type 2)
DBP Gender * Age[0 - 18) [18 - 35) [35 - 55) [55 - 75) [75+)
Male ( % ) Female ( % ) Male ( % ) Female ( % ) Male ( % ) Female ( % ) Male ( % ) Female ( % ) Male ( % ) Female ( % ) N ( % )[0 - 70) 0 ( 0.0) 0 ( 0.0) 0 ( 0.0) 0 ( 0.0) 6 ( 2.5) 8 ( 2.0) 79 ( 4.9) 82 ( 4.0) 63 ( 8.5) 56( 8.9) 294 ( 5.2)
[70 - 100) 0 ( 0.0) 0 ( 0.0) 0 ( 0.0) 1 ( 10.0) 13 ( 5.5) 32 ( 8.2) 62 ( 3.8) 97 ( 4.7) 21 ( 2.8) 17( 2.7) 243 ( 4.3)[100 - 120) 0 ( 0.0) 0 ( 0.0) 0 ( 0.0) 0 ( 0.0) 0 ( 0.0) 1 ( 0.3) 1 ( 0.1) 4 ( 0.2) 2 ( 0.3) 4( 0.6) 12 ( 0.2)
[120+) 0 ( 0.0) 0 ( 0.0) 9 (100.0) 9 ( 90.0) 219 ( 92.0) 350 ( 89.5) 1486 ( 91.3) 1864 ( 91.1) 651 ( 88.3) 550( 87.7) 5138 ( 90.3)TOTAL 0( 0.0) 0( 0.0) 9( 0.2) 10( 0.2) 238( 4.2) 391( 6.9) 1628( 28.6) 2047( 36.0) 737( 13.0) 627( 11.0) 5687 (100.0)
Table 2.2.3.2.18: DBP (by Gender * Age, Type of Diabetes = Type 2)
CMH Chi-SquareValue One or more cells have 0 obs

2.2.3.2. Diastolic BP (last episode in 12 months)Type of Diabetes = Other Type
DBP GenderValid Value ( % ) NV/NA ( % ) N ( % )
Valid Value 114 ( 31.1) 0( 0.0) 114 ( 31.1)NV/NA 253 ( 68.9) 0( 0.0) 253 ( 68.9)TOTAL 367(100.0) 0( 0.0) 367 (100.0)
Table 2.2.3.2.19: Missing Data DBP (by Gender, Type of Diabetes = Other Type)
DBP GenderMale ( % ) Female ( % ) N ( % )
[0 - 70) 0 ( 0.0) 9( 12.0) 9 ( 7.9)[70 - 100) 38 ( 97.4) 65( 86.7) 103 ( 90.4)[100 - 120) 1 ( 2.6) 1( 1.3) 2 ( 1.8)
[120+) 0 ( 0.0) 0( 0.0) 0 ( 0.0)TOTAL 39( 34.2) 75( 65.8) 114 (100.0)
Table 2.2.3.2.20: DBP (by Gender, Type of Diabetes = Other Type)
CMH Chi-SquareValue One or more cells have 0 obs

2.2.3.2. Diastolic BP (last episode in 12 months)Type of Diabetes = Other Type
DBP AgeValid Value ( % ) NV/NA ( % ) N ( % )
Valid Value 114 ( 31.1) 0( 0.0) 114 ( 31.1)NV/NA 253 ( 68.9) 0( 0.0) 253 ( 68.9)TOTAL 367(100.0) 0( 0.0) 367 (100.0)
Table 2.2.3.2.21: Missing Data DBP (by Age, Type of Diabetes = Other Type)
DBP Age[0 - 18) ( % ) [18 - 35) ( % ) [35 - 55) ( % ) [55 - 75) ( % ) [75+) ( % ) N ( % )
[0 - 70) 0 ( 0.0) 5 ( 35.7) 1 ( 4.0) 1 ( 1.7) 2( 11.8) 9 ( 7.9)[70 - 100) 0 ( 0.0) 9 ( 64.3) 24 ( 96.0) 55 ( 94.8) 15( 88.2) 103 ( 90.4)[100 - 120) 0 ( 0.0) 0 ( 0.0) 0 ( 0.0) 2 ( 3.4) 0( 0.0) 2 ( 1.8)
[120+) 0 ( 0.0) 0 ( 0.0) 0 ( 0.0) 0 ( 0.0) 0( 0.0) 0 ( 0.0)TOTAL 0( 0.0) 14( 12.3) 25( 21.9) 58( 50.9) 17( 14.9) 114 (100.0)
Table 2.2.3.2.22: DBP (by Age, Type of Diabetes = Other Type)
CMH Chi-SquareValue One or more cells have 0 obs

2.2.3.2. Diastolic BP (last episode in 12 months)Type of Diabetes = Other Type
DBP Gender * AgeValid Value NV/NA
Valid Value ( % ) NV/NA ( % ) Valid Value ( % ) NV/NA ( % ) N ( % )Valid Value 0 ( 0.0) 0 ( 0.0) 0 ( 0.0) 253( 68.9) 253 ( 68.9)
NV/NA 0 ( 0.0) 0 ( 0.0) 0 ( 0.0) 114( 31.1) 114 ( 31.1)TOTAL 0( 0.0) 0( 0.0) 0( 0.0) 367(100.0) 367 (100.0)
Table 2.2.3.2.23: Missing Data DBP (by Gender * Age, Type of Diabetes = Other Type)
DBP Gender * Age[0 - 18) [18 - 35) [35 - 55) [55 - 75) [75+)
Male ( % ) Female ( % ) Male ( % ) Female ( % ) Male ( % ) Female ( % ) Male ( % ) Female ( % ) Male ( % ) Female ( % ) N ( % )[0 - 70) 0 ( 0.0) 0 ( 0.0) 5 ( 35.7) 0 ( 0.0) 1 ( 6.7) 0 ( 0.0) 1 ( 2.8) 0 ( 0.0) 2 ( 20.0) 0( 0.0) 9 ( 7.9)
[70 - 100) 0 ( 0.0) 0 ( 0.0) 0 ( 0.0) 0 ( 0.0) 0 ( 0.0) 0 ( 0.0) 1 ( 2.8) 1 ( 4.5) 0 ( 0.0) 0( 0.0) 2 ( 1.8)[100 - 120) 0 ( 0.0) 0 ( 0.0) 0 ( 0.0) 0 ( 0.0) 0 ( 0.0) 0 ( 0.0) 0 ( 0.0) 0 ( 0.0) 0 ( 0.0) 0( 0.0) 0 ( 0.0)
[120+) 0 ( 0.0) 0 ( 0.0) 9 ( 64.3) 0 ( 0.0) 14 ( 93.3) 10 (100.0) 34 ( 94.4) 21 ( 95.5) 8 ( 80.0) 7(100.0) 103 ( 90.4)TOTAL 0( 0.0) 0( 0.0) 14( 12.3) 0( 0.0) 15( 13.2) 10( 8.8) 36( 31.6) 22( 19.3) 10( 8.8) 7( 6.1) 114 (100.0)
Table 2.2.3.2.24: DBP (by Gender * Age, Type of Diabetes = Other Type)
CMH Chi-SquareValue One or more cells have 0 obs

2.2.3.2. Diastolic BP (last episode in 12 months)
●
●
DBP
Valid ValueNV/NA
Valid Value NV/NA
025
5075
100
Barplot: 2.2.3.2.1 - Missing Data DBP (by Type of Diabetes)
●
●
●
●
DBP
[0 − 70)[70 − 100)[100 − 120)[120+)
Other Type Type 1 Type 2
025
5075
100
Barplot: 2.2.3.2.2 - DBP (by Type of Diabetes)

2.2.3.2. Diastolic BP (last episode in 12 months)
●
●
DBP
Valid ValueNV/NA
Valid Value NV/NA
025
5075
100
Barplot: 2.2.3.2.3 - Missing Data DBP (by Gender)
●
●
●
●
DBP
[0 − 70)[70 − 100)[100 − 120)[120+)
Female Male
025
5075
100
Barplot: 2.2.3.2.4 - DBP (by Gender)

2.2.3.2. Diastolic BP (last episode in 12 months)
●
●
DBP
Valid ValueNV/NA
Valid Value NV/NA
025
5075
100
Barplot: 2.2.3.2.5 - Missing Data DBP (by Age)
●
●
●
●
DBP
[0 − 70)[70 − 100)[100 − 120)[120+)
[0 − 18) [18 − 35) [35 − 55) [55 − 75) [75 +)
025
5075
100
Barplot: 2.2.3.2.6 - DBP (by Age)

2.2.3.2. Diastolic BP (last episode in 12 months)Type of Diabetes = Type 1
●
●
DBP
Valid ValueNV/NA
Valid Value NV/NA
025
5075
100
Barplot: 2.2.3.2.7 - Missing Data DBP (by Gender, Type of Diabetes = Type 1)
●
●
●
●
DBP
[0 − 70)[70 − 100)[100 − 120)[120+)
Female Male
025
5075
100
Barplot: 2.2.3.2.8 - DBP (by Gender, Type of Diabetes = Type 1)

2.2.3.2. Diastolic BP (last episode in 12 months)Type of Diabetes = Type 1
●
●
DBP
Valid ValueNV/NA
Valid Value NV/NA
025
5075
100
Barplot: 2.2.3.2.9 - Missing Data DBP (by Age, Type of Diabetes = Type 1)
●
●
●
●
DBP
[0 − 70)[70 − 100)[100 − 120)[120+)
[0 − 18) [18 − 35) [35 − 55) [55 − 75) [75 +)
025
5075
100
Barplot: 2.2.3.2.10 - DBP (by Age, Type of Diabetes = Type 1)

2.2.3.2. Diastolic BP (last episode in 12 months)Type of Diabetes = Type 2
●
●
DBP
Valid ValueNV/NA
Valid Value NV/NA
025
5075
100
Barplot: 2.2.3.2.11 - Missing Data DBP (by Gender, Type of Diabetes = Type 2)
●
●
●
●
DBP
[0 − 70)[70 − 100)[100 − 120)[120+)
Female Male
025
5075
100
Barplot: 2.2.3.2.12 - DBP (by Gender, Type of Diabetes = Type 2)

2.2.3.2. Diastolic BP (last episode in 12 months)Type of Diabetes = Type 2
●
●
DBP
Valid ValueNV/NA
Valid Value NV/NA
025
5075
100
Barplot: 2.2.3.2.13 - Missing Data DBP (by Age, Type of Diabetes = Type 2)
●
●
●
●
DBP
[0 − 70)[70 − 100)[100 − 120)[120+)
[0 − 18) [18 − 35) [35 − 55) [55 − 75) [75 +)
025
5075
100
Barplot: 2.2.3.2.14 - DBP (by Age, Type of Diabetes = Type 2)

2.2.3.2. Diastolic BP (last episode in 12 months)Type of Diabetes = Other Type
●
●
DBP
Valid ValueNV/NA
Valid Value NV/NA
025
5075
100
Barplot: 2.2.3.2.15 - Missing Data DBP (by Gender, Type of Diabetes = Other Type)
●
●
●
●
DBP
[0 − 70)[70 − 100)[100 − 120)[120+)
Female Male
025
5075
100
Barplot: 2.2.3.2.16 - DBP (by Gender, Type of Diabetes = Other Type)

2.2.3.2. Diastolic BP (last episode in 12 months)Type of Diabetes = Other Type
●
●
DBP
Valid ValueNV/NA
Valid Value NV/NA
025
5075
100
Barplot: 2.2.3.2.17 - Missing Data DBP (by Age, Type of Diabetes = Other Type)
●
●
●
●
DBP
[0 − 70)[70 − 100)[100 − 120)[120+)
[0 − 18) [18 − 35) [35 − 55) [55 − 75) [75 +)
025
5075
100
Barplot: 2.2.3.2.18 - DBP (by Age, Type of Diabetes = Other Type)

2.2.3.2. Diastolic BP (last episode in 12 months)Type of Diabetes = Type 1
dbp_c sex age_c type_dm
Den
sity
0.00
0.05
0.10
0.15
40 50 60 70 80 90 100
Male[0 − 18)
Female[0 − 18)
Male[18 − 35)
0.00
0.05
0.10
0.15
Female[18 − 35)
0.00
0.05
0.10
0.15
Male[35 − 55)
Female[35 − 55)
Male[55 − 75)
0.00
0.05
0.10
0.15
Female[55 − 75)
0.00
0.05
0.10
0.15
Male[75+)
40 50 60 70 80 90 100
Female[75+)
Trellis Barplot: 2.2.3.2.19 - * DBP * Gender (Type of Diabetes = Type 1)

2.2.3.2. Diastolic BP (last episode in 12 months)Type of Diabetes = Type 2
dbp_c sex age_c type_dm
Den
sity
0.00
0.01
0.02
0.03
0.04
0.05
0 50 100 150
Male[18 − 35)
Female[18 − 35)
Male[35 − 55)
0.00
0.01
0.02
0.03
0.04
0.05
Female[35 − 55)
0.00
0.01
0.02
0.03
0.04
0.05
Male[55 − 75)
Female[55 − 75)
Male[75+)
0 50 100 150
0.00
0.01
0.02
0.03
0.04
0.05
Female[75+)
Trellis Barplot: 2.2.3.2.20 - * DBP * Gender (Type of Diabetes = Type 2)

2.2.3.2. Diastolic BP (last episode in 12 months)Type of Diabetes = Other Type
dbp_c sex age_c type_dm
Den
sity
0.00
0.02
0.04
0.06
0.08
0.10
60 80 100
Male[18 − 35)
Female[18 − 35)
Male[35 − 55)
0.00
0.02
0.04
0.06
0.08
0.10Female
[35 − 55)0.00
0.02
0.04
0.06
0.08
0.10Male
[55 − 75)Female
[55 − 75)
Male[75+)
60 80 100
0.00
0.02
0.04
0.06
0.08
0.10Female[75+)
Trellis Barplot: 2.2.3.2.21 - * DBP * Gender (Type of Diabetes = Other Type)

2.2.3.2. Diastolic BP (last episode in 12 months)
Type 1 Type 2 Other Type
5010
015
0
Boxplot: 2.2.3.2.1 - DBP (by Type of Diabetes)

2.2.3.2. Diastolic BP (last episode in 12 months)
Male Female
5010
015
0
Boxplot: 2.2.3.2.2 - DBP (by Gender)

2.2.3.2. Diastolic BP (last episode in 12 months)
[0 − 18) [18 − 35) [35 − 55) [55 − 75) [75+)
5010
015
0
Boxplot: 2.2.3.2.3 - DBP (by Age)

2.2.3.2. Diastolic BP (last episode in 12 months)Type of Diabetes = Type 1
Male Female
5060
7080
9010
0
Boxplot: 2.2.3.2.4 - DBP (by Gender, Type of Diabetes = Type 1)

2.2.3.2. Diastolic BP (last episode in 12 months)Type of Diabetes = Type 1
[0 − 18) [18 − 35) [35 − 55) [55 − 75) [75+)
5060
7080
9010
0
Boxplot: 2.2.3.2.5 - DBP (by Age, Type of Diabetes = Type 1)

2.2.3.2. Diastolic BP (last episode in 12 months)Type of Diabetes = Type 2
Male Female
5010
015
0
Boxplot: 2.2.3.2.6 - DBP (by Gender, Type of Diabetes = Type 2)

2.2.3.2. Diastolic BP (last episode in 12 months)Type of Diabetes = Type 2
[0 − 18) [18 − 35) [35 − 55) [55 − 75)
5010
015
0
Boxplot: 2.2.3.2.7 - DBP (by Age, Type of Diabetes = Type 2)

2.2.3.2. Diastolic BP (last episode in 12 months)Type of Diabetes = Other Type
Male Female
5060
7080
9010
011
0
Boxplot: 2.2.3.2.8 - DBP (by Gender, Type of Diabetes = Other Type)

2.2.3.2. Diastolic BP (last episode in 12 months)Type of Diabetes = Other Type
[0 − 18) [18 − 35) [35 − 55) [55 − 75)
5060
7080
9010
011
0
Boxplot: 2.2.3.2.9 - DBP (by Age, Type of Diabetes = Other Type)
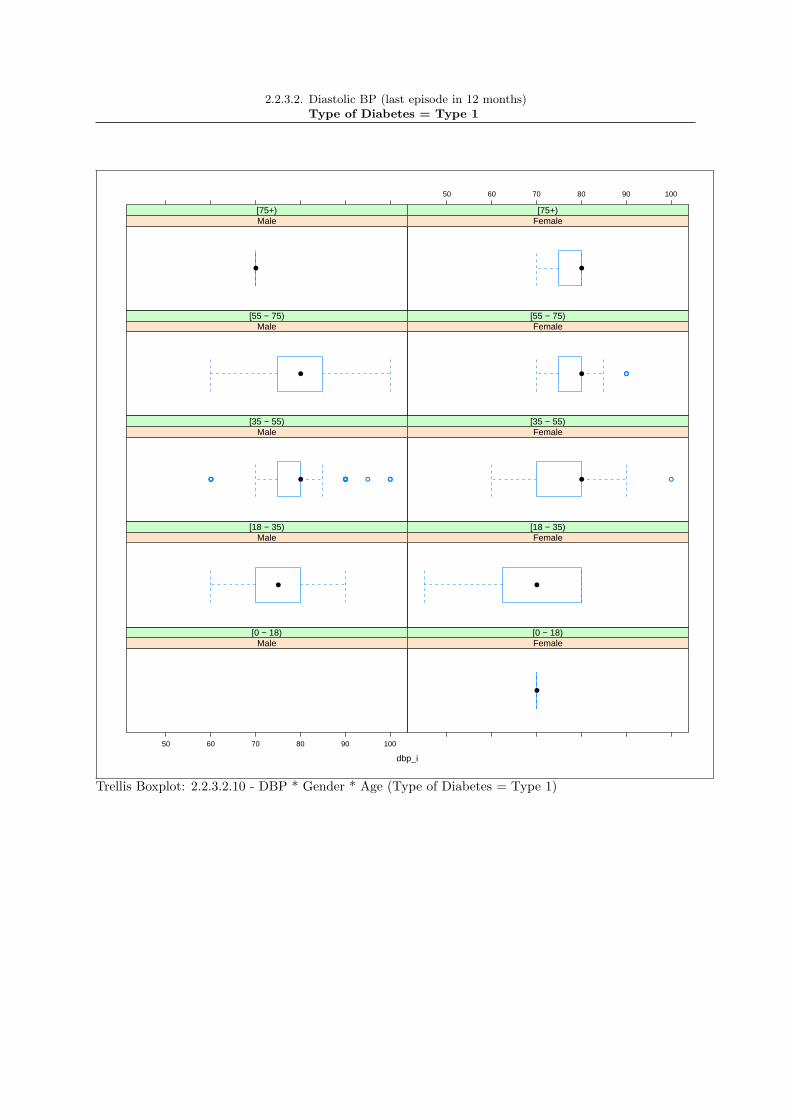
2.2.3.2. Diastolic BP (last episode in 12 months)Type of Diabetes = Type 1
dbp_i
50 60 70 80 90 100
Male[0 − 18)
●
Female[0 − 18)
●
Male[18 − 35)
●
Female[18 − 35)
● ●●● ● ●●● ●●●● ●●●●
Male[35 − 55)
● ●
Female[35 − 55)
●
Male[55 − 75)
● ●●
Female[55 − 75)
●
Male[75+)
50 60 70 80 90 100
●
Female[75+)
Trellis Boxplot: 2.2.3.2.10 - DBP * Gender * Age (Type of Diabetes = Type 1)

2.2.3.2. Diastolic BP (last episode in 12 months)Type of Diabetes = Type 2
dbp_i
0 50 100 150
●
Male[18 − 35)
● ●● ● ●
Female[18 − 35)
●●● ●●●●●● ●● ●
Male[35 − 55)
●
Female[35 − 55)
●● ●●● ●●● ●●●●●●●●●●●●●● ●●●●●●●●●●●●●●●●●●●●●●●●● ●●●●●●● ●●●● ●●●●●●●●●●●● ●● ● ●●●●●●●●●●●●●●●●●●●●●●●●●● ●●●●●●●●●●●●● ●●● ●●●●●●●●●●●●●●●●●● ●●●●●●●●●●●●●●●●●●●●●●●●●●●● ●● ●●● ● ●
Male[55 − 75)
●● ●●● ● ●●●●●●●●●●● ● ●●●●●●●●●●●● ●● ●●●●●●●●●●●●●●●●●●●●●●●●●●●●●●●●●●●●●●●●●●●●●●●●●●● ●●● ●●●●●●●●●●●●●●●●●●●●●●● ●● ●●●●●●●●●●●●●●●●●●●●●●●●●●●●●● ●● ●●●●●●●●●●●●● ● ●●●●●●●●●●●●●● ●●●●●●●●●●●● ●●●●●●●●●●●●●●●●●●●●●●●●●●●●●● ●●●● ●●●●●● ● ●●●●●●●●●●●●●●●●●●● ●●●●●●●●●●●●●● ●●●●●●●●●●●●●●●●●●●●●●●●●●●●●●●●●●●●●●●●●●●●●●●●●●●●●●●●●●●●●●●●●●●●●●●●●●●●●●●● ●●●●●●●●● ●●●●●●●●●●●●●● ● ●●●●
Female[55 − 75)
● ●● ●●●● ●●●● ●●●●● ●●●●● ● ● ● ● ●
Male[75+)
0 50 100 150
●● ● ●●●●●● ●●●●● ● ●● ●●●●●●●●● ● ● ●
Female[75+)
Trellis Boxplot: 2.2.3.2.11 - DBP * Gender * Age (Type of Diabetes = Type 2)
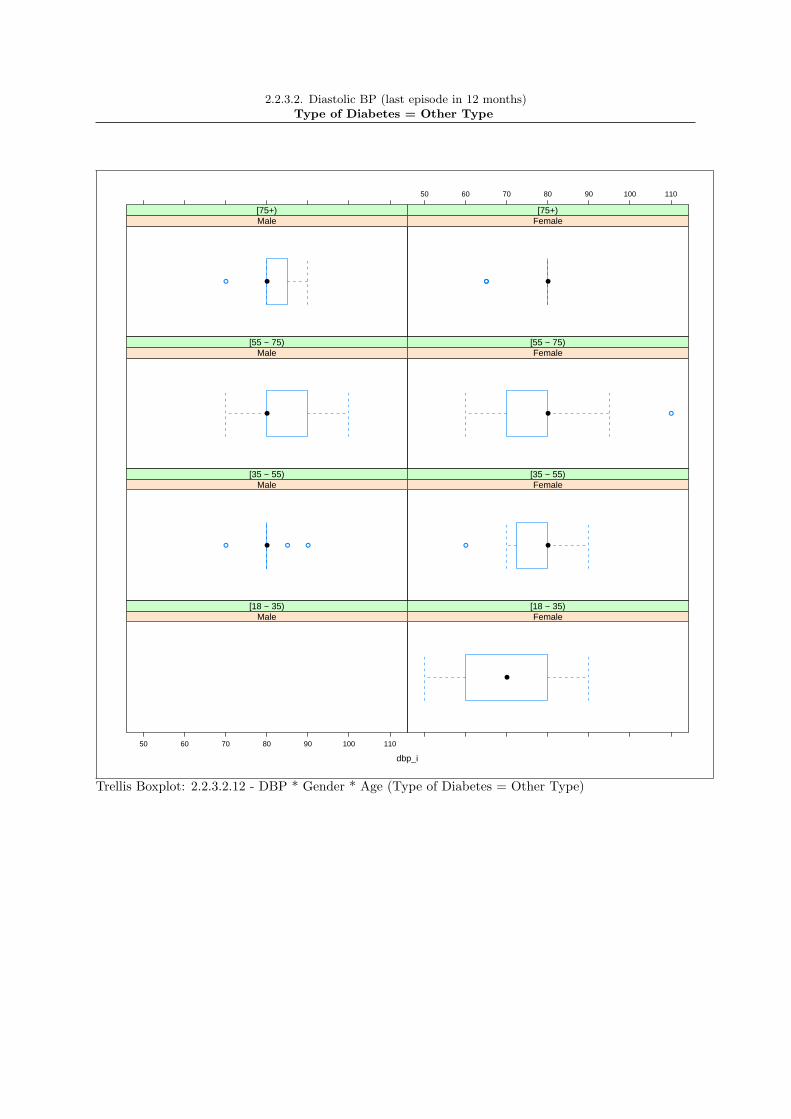
2.2.3.2. Diastolic BP (last episode in 12 months)Type of Diabetes = Other Type
dbp_i
50 60 70 80 90 100 110
Male[18 − 35)
●
Female[18 − 35)
●● ● ●
Male[35 − 55)
●●
Female[35 − 55)
●
Male[55 − 75)
● ●
Female[55 − 75)
●●
Male[75+)
50 60 70 80 90 100 110
●●●
Female[75+)
Trellis Boxplot: 2.2.3.2.12 - DBP * Gender * Age (Type of Diabetes = Other Type)

2.2.3.3 Total cholesterol (last episode in 12 months)
Cholesterol Type of DiabetesValid Value ( % ) NV/NA ( % ) N ( % )
Valid Value 7324 ( 75.2) 0( 0.0) 7324 ( 75.2)NV/NA 2415 ( 24.8) 0( 0.0) 2415 ( 24.8)TOTAL 9739(100.0) 0( 0.0) 9739 (100.0)
Table 2.2.3.3.1: Missing Data Cholesterol (by Type of Diabetes)
Cholesterol Type of DiabetesType 1 ( % ) Type 2 ( % ) Other Type ( % ) N ( % )
0 - 2.58 3 ( 0.7) 52 ( 0.8) 1( 0.5) 56 ( 0.8)2.59 - 5.17 255 ( 62.7) 4047 ( 60.4) 79( 35.9) 4381 ( 59.8)5.18 - 7.76 147 ( 36.1) 2554 ( 38.1) 126( 57.3) 2827 ( 38.6)
7.77 + 2 ( 0.5) 44 ( 0.7) 14( 6.4) 60 ( 0.8)TOTAL 407( 5.6) 6697( 91.4) 220( 3.0) 7324 (100.0)
Table 2.2.3.3.2: Cholesterol (by Type of Diabetes)
CMH Chi-Square p.value dfValue 128.4163 0 6
141

2.2.3.3 Total cholesterol (last episode in 12 months)
Cholesterol GenderValid Value ( % ) NV/NA ( % ) N ( % )
Valid Value 7324 ( 75.2) 0( 0.0) 7324 ( 75.2)NV/NA 2415 ( 24.8) 0( 0.0) 2415 ( 24.8)TOTAL 9739(100.0) 0( 0.0) 9739 (100.0)
Table 2.2.3.3.3: Missing Data Cholesterol (by Gender)
Cholesterol GenderMale ( % ) Female ( % ) N ( % )
0 - 2.58 49 ( 1.3) 7( 0.2) 56 ( 0.8)2.59 - 5.17 2555 ( 66.2) 1826( 52.7) 4381 ( 59.8)5.18 - 7.76 1238 ( 32.1) 1589( 45.9) 2827 ( 38.6)
7.77 + 19 ( 0.5) 41( 1.2) 60 ( 0.8)TOTAL 3861( 52.7) 3463( 47.3) 7324 (100.0)
Table 2.2.3.3.4: Cholesterol (by Gender)
CMH Chi-Square p.value dfValue 183.3661 0 3
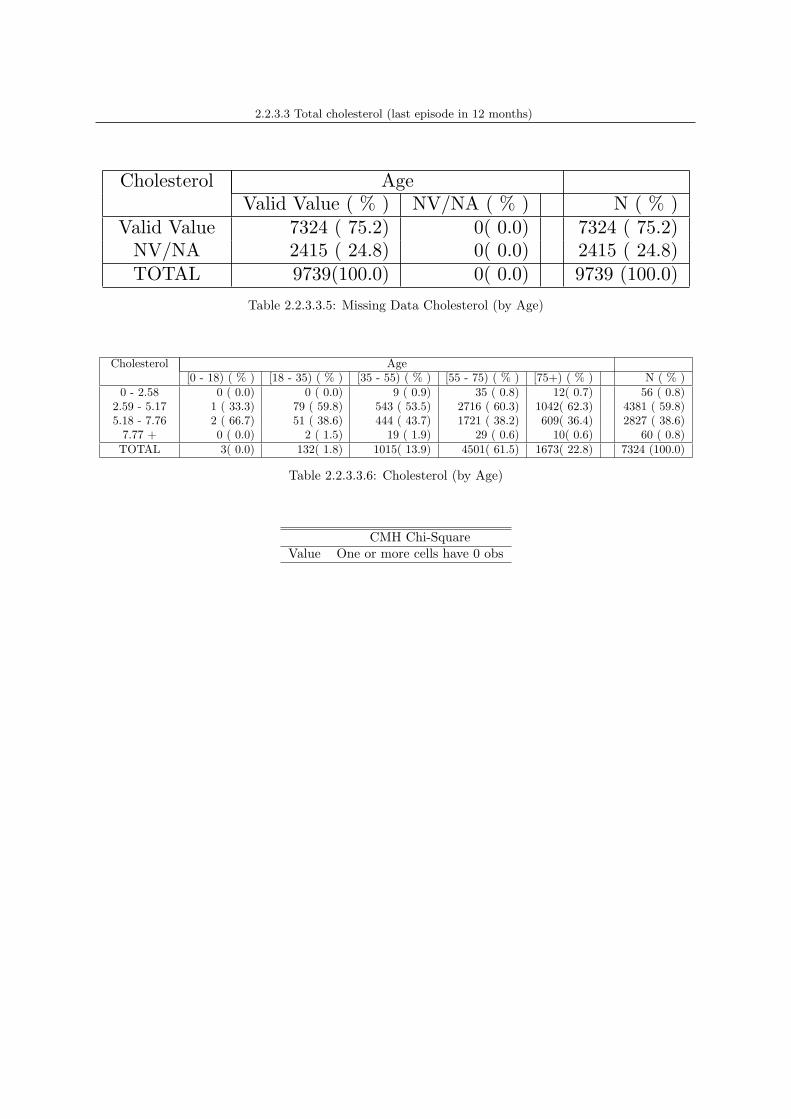
2.2.3.3 Total cholesterol (last episode in 12 months)
Cholesterol AgeValid Value ( % ) NV/NA ( % ) N ( % )
Valid Value 7324 ( 75.2) 0( 0.0) 7324 ( 75.2)NV/NA 2415 ( 24.8) 0( 0.0) 2415 ( 24.8)TOTAL 9739(100.0) 0( 0.0) 9739 (100.0)
Table 2.2.3.3.5: Missing Data Cholesterol (by Age)
Cholesterol Age[0 - 18) ( % ) [18 - 35) ( % ) [35 - 55) ( % ) [55 - 75) ( % ) [75+) ( % ) N ( % )
0 - 2.58 0 ( 0.0) 0 ( 0.0) 9 ( 0.9) 35 ( 0.8) 12( 0.7) 56 ( 0.8)2.59 - 5.17 1 ( 33.3) 79 ( 59.8) 543 ( 53.5) 2716 ( 60.3) 1042( 62.3) 4381 ( 59.8)5.18 - 7.76 2 ( 66.7) 51 ( 38.6) 444 ( 43.7) 1721 ( 38.2) 609( 36.4) 2827 ( 38.6)
7.77 + 0 ( 0.0) 2 ( 1.5) 19 ( 1.9) 29 ( 0.6) 10( 0.6) 60 ( 0.8)TOTAL 3( 0.0) 132( 1.8) 1015( 13.9) 4501( 61.5) 1673( 22.8) 7324 (100.0)
Table 2.2.3.3.6: Cholesterol (by Age)
CMH Chi-SquareValue One or more cells have 0 obs

2.2.3.3 Total cholesterol (last episode in 12 months)Type of Diabetes = Type 1
Cholesterol GenderValid Value ( % ) NV/NA ( % ) N ( % )
Valid Value 407 ( 61.2) 0( 0.0) 407 ( 61.2)NV/NA 258 ( 38.8) 0( 0.0) 258 ( 38.8)TOTAL 665(100.0) 0( 0.0) 665 (100.0)
Table 2.2.3.3.7: Missing Data Cholesterol (by Gender, Type of Diabetes = Type 1)
Cholesterol GenderMale ( % ) Female ( % ) N ( % )
0 - 2.58 3 ( 1.5) 0( 0.0) 3 ( 0.7)2.59 - 5.17 125 ( 62.2) 130( 63.1) 255 ( 62.7)5.18 - 7.76 73 ( 36.3) 74( 35.9) 147 ( 36.1)
7.77 + 0 ( 0.0) 2( 1.0) 2 ( 0.5)TOTAL 201( 49.4) 206( 50.6) 407 (100.0)
Table 2.2.3.3.8: Cholesterol (by Gender, Type of Diabetes = Type 1)
CMH Chi-SquareValue One or more cells have 0 obs

2.2.3.3 Total cholesterol (last episode in 12 months)Type of Diabetes = Type 1
Cholesterol AgeValid Value ( % ) NV/NA ( % ) N ( % )
Valid Value 407 ( 61.2) 0( 0.0) 407 ( 61.2)NV/NA 258 ( 38.8) 0( 0.0) 258 ( 38.8)TOTAL 665(100.0) 0( 0.0) 665 (100.0)
Table 2.2.3.3.9: Missing Data Cholesterol (by Age, Type of Diabetes = Type 1)
Cholesterol Age[0 - 18) ( % ) [18 - 35) ( % ) [35 - 55) ( % ) [55 - 75) ( % ) [75+) ( % ) N ( % )
0 - 2.58 0 ( 0.0) 0 ( 0.0) 3 ( 1.5) 0 ( 0.0) 0( 0.0) 3 ( 0.7)2.59 - 5.17 0 ( 0.0) 64 ( 68.8) 123 ( 61.2) 62 ( 59.0) 6( 85.7) 255 ( 62.7)5.18 - 7.76 1 (100.0) 27 ( 29.0) 75 ( 37.3) 43 ( 41.0) 1( 14.3) 147 ( 36.1)
7.77 + 0 ( 0.0) 2 ( 2.2) 0 ( 0.0) 0 ( 0.0) 0( 0.0) 2 ( 0.5)TOTAL 1( 0.2) 93( 22.9) 201( 49.4) 105( 25.8) 7( 1.7) 407 (100.0)
Table 2.2.3.3.10: Cholesterol (by Age, Type of Diabetes = Type 1)
CMH Chi-SquareValue One or more cells have 0 obs

2.2.3.3 Total cholesterol (last episode in 12 months)Type of Diabetes = Type 1
Cholesterol Gender * AgeValid Value NV/NA
Valid Value ( % ) NV/NA ( % ) Valid Value ( % ) NV/NA ( % ) N ( % )Valid Value 0 ( 0.0) 0 ( 0.0) 0 ( 0.0) 258( 38.8) 258 ( 38.8)
NV/NA 0 ( 0.0) 0 ( 0.0) 0 ( 0.0) 407( 61.2) 407 ( 61.2)TOTAL 0( 0.0) 0( 0.0) 0( 0.0) 665(100.0) 665 (100.0)
Table 2.2.3.3.11: Missing Data Cholesterol (by Gender * Age, Type of Diabetes = Type 1)
Cholesterol Gender * Age[0 - 18) [18 - 35) [35 - 55) [55 - 75) [75+)
Male ( % ) Female ( % ) Male ( % ) Female ( % ) Male ( % ) Female ( % ) Male ( % ) Female ( % ) Male ( % ) Female ( % ) N ( % )[0 - 2.59) 0 ( 0.0) 0 ( 0.0) 0 ( 0.0) 0 ( 0.0) 0 ( 0.0) 3 ( 2.9) 0 ( 0.0) 0 ( 0.0) 0 ( 0.0) 0( 0.0) 3 ( 0.7)
[2.59 - 5.18) 0 ( 0.0) 0 ( 0.0) 36 ( 69.2) 28 ( 68.3) 64 ( 66.0) 59 ( 56.7) 28 ( 52.8) 34 ( 65.4) 2 ( 66.7) 4(100.0) 255 ( 62.7)[5.18 - 7.77) 1 (100.0) 0 ( 0.0) 14 ( 26.9) 13 ( 31.7) 33 ( 34.0) 42 ( 40.4) 25 ( 47.2) 18 ( 34.6) 1 ( 33.3) 0( 0.0) 147 ( 36.1)
[7.77+) 0 ( 0.0) 0 ( 0.0) 2 ( 3.8) 0 ( 0.0) 0 ( 0.0) 0 ( 0.0) 0 ( 0.0) 0 ( 0.0) 0 ( 0.0) 0( 0.0) 2 ( 0.5)TOTAL 1( 0.2) 0( 0.0) 52( 12.8) 41( 10.1) 97( 23.8) 104( 25.6) 53( 13.0) 52( 12.8) 3( 0.7) 4( 1.0) 407 (100.0)
Table 2.2.3.3.12: Cholesterol (by Gender * Age, Type of Diabetes = Type 1)
CMH Chi-SquareValue One or more cells have 0 obs

2.2.3.3 Total cholesterol (last episode in 12 months)Type of Diabetes = Type 2
Cholesterol GenderValid Value ( % ) NV/NA ( % ) N ( % )
Valid Value 6697 ( 76.9) 0( 0.0) 6697 ( 76.9)NV/NA 2010 ( 23.1) 0( 0.0) 2010 ( 23.1)TOTAL 8707(100.0) 0( 0.0) 8707 (100.0)
Table 2.2.3.3.13: Missing Data Cholesterol (by Gender, Type of Diabetes = Type 2)
Cholesterol GenderMale ( % ) Female ( % ) N ( % )
0 - 2.58 46 ( 1.3) 6( 0.2) 52 ( 0.8)2.59 - 5.17 2392 ( 66.7) 1655( 53.2) 4047 ( 60.4)5.18 - 7.76 1130 ( 31.5) 1424( 45.8) 2554 ( 38.1)
7.77 + 17 ( 0.5) 27( 0.9) 44 ( 0.7)TOTAL 3585( 53.5) 3112( 46.5) 6697 (100.0)
Table 2.2.3.3.14: Cholesterol (by Gender, Type of Diabetes = Type 2)
CMH Chi-Square p.value dfValue 168.5339 0 3
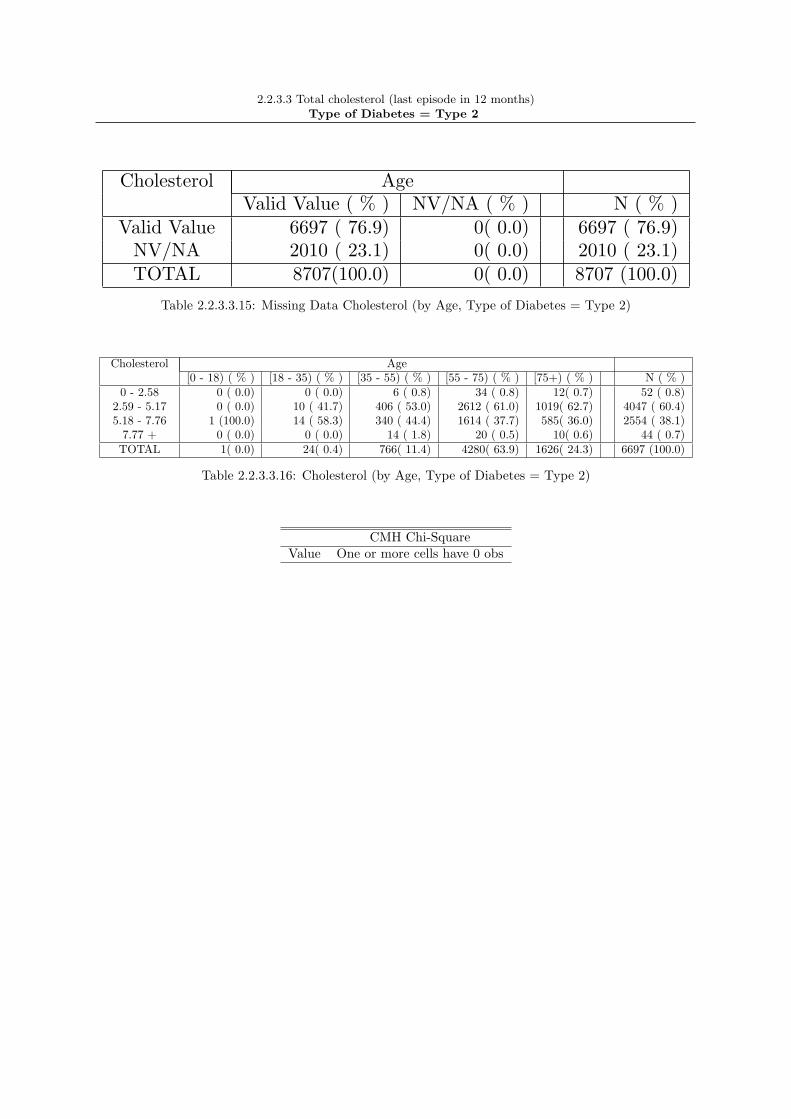
2.2.3.3 Total cholesterol (last episode in 12 months)Type of Diabetes = Type 2
Cholesterol AgeValid Value ( % ) NV/NA ( % ) N ( % )
Valid Value 6697 ( 76.9) 0( 0.0) 6697 ( 76.9)NV/NA 2010 ( 23.1) 0( 0.0) 2010 ( 23.1)TOTAL 8707(100.0) 0( 0.0) 8707 (100.0)
Table 2.2.3.3.15: Missing Data Cholesterol (by Age, Type of Diabetes = Type 2)
Cholesterol Age[0 - 18) ( % ) [18 - 35) ( % ) [35 - 55) ( % ) [55 - 75) ( % ) [75+) ( % ) N ( % )
0 - 2.58 0 ( 0.0) 0 ( 0.0) 6 ( 0.8) 34 ( 0.8) 12( 0.7) 52 ( 0.8)2.59 - 5.17 0 ( 0.0) 10 ( 41.7) 406 ( 53.0) 2612 ( 61.0) 1019( 62.7) 4047 ( 60.4)5.18 - 7.76 1 (100.0) 14 ( 58.3) 340 ( 44.4) 1614 ( 37.7) 585( 36.0) 2554 ( 38.1)
7.77 + 0 ( 0.0) 0 ( 0.0) 14 ( 1.8) 20 ( 0.5) 10( 0.6) 44 ( 0.7)TOTAL 1( 0.0) 24( 0.4) 766( 11.4) 4280( 63.9) 1626( 24.3) 6697 (100.0)
Table 2.2.3.3.16: Cholesterol (by Age, Type of Diabetes = Type 2)
CMH Chi-SquareValue One or more cells have 0 obs
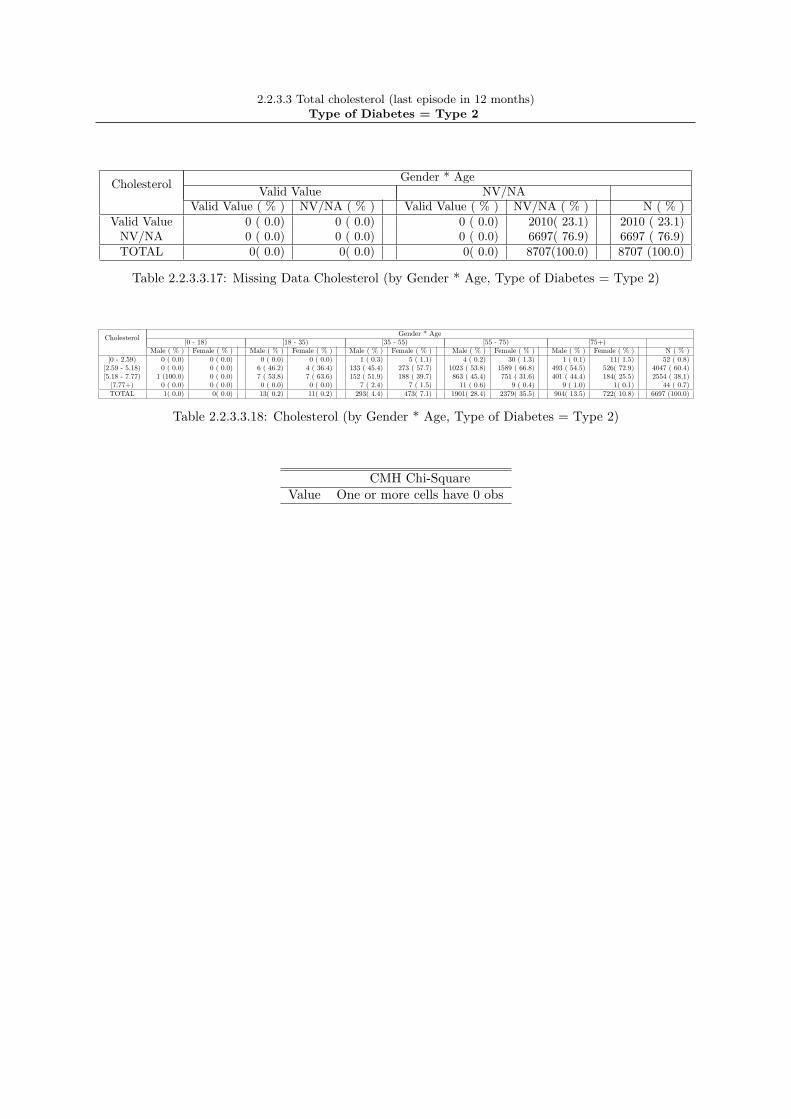
2.2.3.3 Total cholesterol (last episode in 12 months)Type of Diabetes = Type 2
Cholesterol Gender * AgeValid Value NV/NA
Valid Value ( % ) NV/NA ( % ) Valid Value ( % ) NV/NA ( % ) N ( % )Valid Value 0 ( 0.0) 0 ( 0.0) 0 ( 0.0) 2010( 23.1) 2010 ( 23.1)
NV/NA 0 ( 0.0) 0 ( 0.0) 0 ( 0.0) 6697( 76.9) 6697 ( 76.9)TOTAL 0( 0.0) 0( 0.0) 0( 0.0) 8707(100.0) 8707 (100.0)
Table 2.2.3.3.17: Missing Data Cholesterol (by Gender * Age, Type of Diabetes = Type 2)
Cholesterol Gender * Age[0 - 18) [18 - 35) [35 - 55) [55 - 75) [75+)
Male ( % ) Female ( % ) Male ( % ) Female ( % ) Male ( % ) Female ( % ) Male ( % ) Female ( % ) Male ( % ) Female ( % ) N ( % )[0 - 2.59) 0 ( 0.0) 0 ( 0.0) 0 ( 0.0) 0 ( 0.0) 1 ( 0.3) 5 ( 1.1) 4 ( 0.2) 30 ( 1.3) 1 ( 0.1) 11( 1.5) 52 ( 0.8)
[2.59 - 5.18) 0 ( 0.0) 0 ( 0.0) 6 ( 46.2) 4 ( 36.4) 133 ( 45.4) 273 ( 57.7) 1023 ( 53.8) 1589 ( 66.8) 493 ( 54.5) 526( 72.9) 4047 ( 60.4)[5.18 - 7.77) 1 (100.0) 0 ( 0.0) 7 ( 53.8) 7 ( 63.6) 152 ( 51.9) 188 ( 39.7) 863 ( 45.4) 751 ( 31.6) 401 ( 44.4) 184( 25.5) 2554 ( 38.1)
[7.77+) 0 ( 0.0) 0 ( 0.0) 0 ( 0.0) 0 ( 0.0) 7 ( 2.4) 7 ( 1.5) 11 ( 0.6) 9 ( 0.4) 9 ( 1.0) 1( 0.1) 44 ( 0.7)TOTAL 1( 0.0) 0( 0.0) 13( 0.2) 11( 0.2) 293( 4.4) 473( 7.1) 1901( 28.4) 2379( 35.5) 904( 13.5) 722( 10.8) 6697 (100.0)
Table 2.2.3.3.18: Cholesterol (by Gender * Age, Type of Diabetes = Type 2)
CMH Chi-SquareValue One or more cells have 0 obs

2.2.3.3 Total cholesterol (last episode in 12 months)Type of Diabetes = Other Type
Cholesterol GenderValid Value ( % ) NV/NA ( % ) N ( % )
Valid Value 220 ( 59.9) 0( 0.0) 220 ( 59.9)NV/NA 147 ( 40.1) 0( 0.0) 147 ( 40.1)TOTAL 367(100.0) 0( 0.0) 367 (100.0)
Table 2.2.3.3.19: Missing Data Cholesterol (by Gender, Type of Diabetes = Other Type)
Cholesterol GenderMale ( % ) Female ( % ) N ( % )
0 - 2.58 0 ( 0.0) 1( 0.7) 1 ( 0.5)2.59 - 5.17 38 ( 50.7) 41( 28.3) 79 ( 35.9)5.18 - 7.76 35 ( 46.7) 91( 62.8) 126 ( 57.3)
7.77 + 2 ( 2.7) 12( 8.3) 14 ( 6.4)TOTAL 75( 34.1) 145( 65.9) 220 (100.0)
Table 2.2.3.3.20: Cholesterol (by Gender, Type of Diabetes = Other Type)
CMH Chi-SquareValue One or more cells have 0 obs

2.2.3.3 Total cholesterol (last episode in 12 months)Type of Diabetes = Other Type
Cholesterol AgeValid Value ( % ) NV/NA ( % ) N ( % )
Valid Value 220 ( 59.9) 0( 0.0) 220 ( 59.9)NV/NA 147 ( 40.1) 0( 0.0) 147 ( 40.1)TOTAL 367(100.0) 0( 0.0) 367 (100.0)
Table 2.2.3.3.21: Missing Data Cholesterol (by Age, Type of Diabetes = Other Type)
Cholesterol Age[0 - 18) ( % ) [18 - 35) ( % ) [35 - 55) ( % ) [55 - 75) ( % ) [75+) ( % ) N ( % )
0 - 2.58 0 ( 0.0) 0 ( 0.0) 0 ( 0.0) 1 ( 0.9) 0( 0.0) 1 ( 0.5)2.59 - 5.17 1 (100.0) 5 ( 33.3) 14 ( 29.2) 42 ( 36.2) 17( 42.5) 79 ( 35.9)5.18 - 7.76 0 ( 0.0) 10 ( 66.7) 29 ( 60.4) 64 ( 55.2) 23( 57.5) 126 ( 57.3)
7.77 + 0 ( 0.0) 0 ( 0.0) 5 ( 10.4) 9 ( 7.8) 0( 0.0) 14 ( 6.4)TOTAL 1( 0.5) 15( 6.8) 48( 21.8) 116( 52.7) 40( 18.2) 220 (100.0)
Table 2.2.3.3.22: Cholesterol (by Age, Type of Diabetes = Other Type)
CMH Chi-SquareValue One or more cells have 0 obs
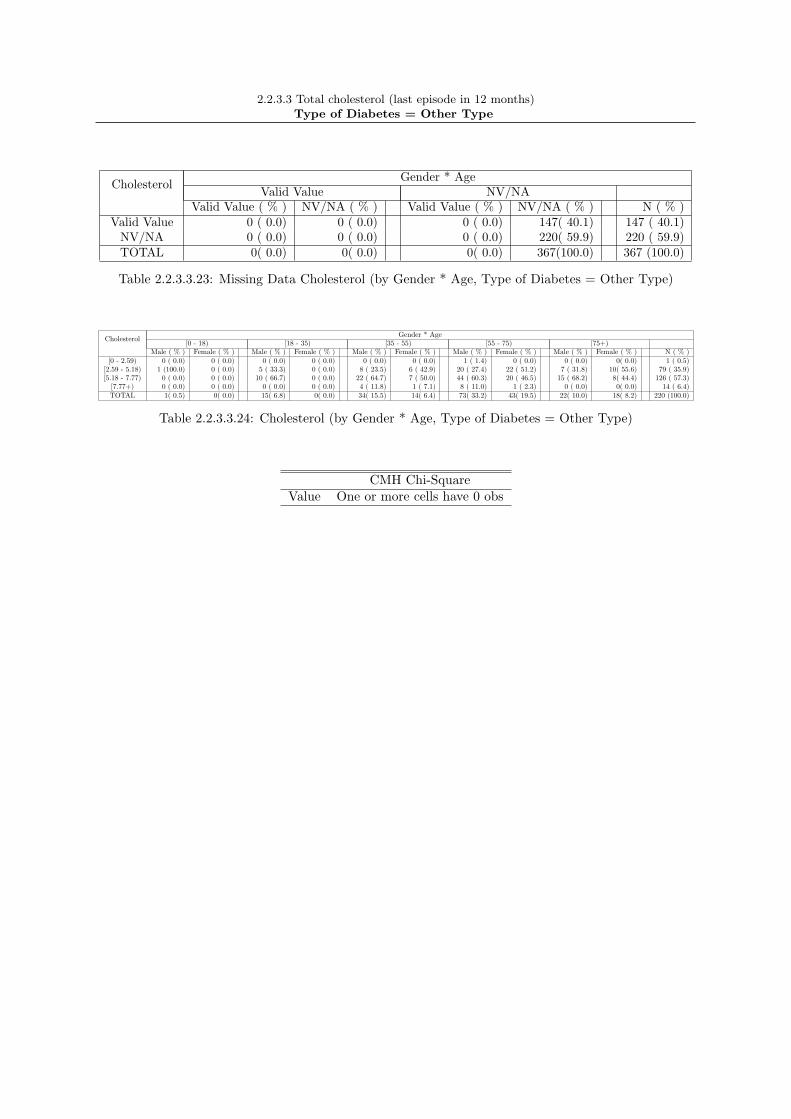
2.2.3.3 Total cholesterol (last episode in 12 months)Type of Diabetes = Other Type
Cholesterol Gender * AgeValid Value NV/NA
Valid Value ( % ) NV/NA ( % ) Valid Value ( % ) NV/NA ( % ) N ( % )Valid Value 0 ( 0.0) 0 ( 0.0) 0 ( 0.0) 147( 40.1) 147 ( 40.1)
NV/NA 0 ( 0.0) 0 ( 0.0) 0 ( 0.0) 220( 59.9) 220 ( 59.9)TOTAL 0( 0.0) 0( 0.0) 0( 0.0) 367(100.0) 367 (100.0)
Table 2.2.3.3.23: Missing Data Cholesterol (by Gender * Age, Type of Diabetes = Other Type)
Cholesterol Gender * Age[0 - 18) [18 - 35) [35 - 55) [55 - 75) [75+)
Male ( % ) Female ( % ) Male ( % ) Female ( % ) Male ( % ) Female ( % ) Male ( % ) Female ( % ) Male ( % ) Female ( % ) N ( % )[0 - 2.59) 0 ( 0.0) 0 ( 0.0) 0 ( 0.0) 0 ( 0.0) 0 ( 0.0) 0 ( 0.0) 1 ( 1.4) 0 ( 0.0) 0 ( 0.0) 0( 0.0) 1 ( 0.5)
[2.59 - 5.18) 1 (100.0) 0 ( 0.0) 5 ( 33.3) 0 ( 0.0) 8 ( 23.5) 6 ( 42.9) 20 ( 27.4) 22 ( 51.2) 7 ( 31.8) 10( 55.6) 79 ( 35.9)[5.18 - 7.77) 0 ( 0.0) 0 ( 0.0) 10 ( 66.7) 0 ( 0.0) 22 ( 64.7) 7 ( 50.0) 44 ( 60.3) 20 ( 46.5) 15 ( 68.2) 8( 44.4) 126 ( 57.3)
[7.77+) 0 ( 0.0) 0 ( 0.0) 0 ( 0.0) 0 ( 0.0) 4 ( 11.8) 1 ( 7.1) 8 ( 11.0) 1 ( 2.3) 0 ( 0.0) 0( 0.0) 14 ( 6.4)TOTAL 1( 0.5) 0( 0.0) 15( 6.8) 0( 0.0) 34( 15.5) 14( 6.4) 73( 33.2) 43( 19.5) 22( 10.0) 18( 8.2) 220 (100.0)
Table 2.2.3.3.24: Cholesterol (by Gender * Age, Type of Diabetes = Other Type)
CMH Chi-SquareValue One or more cells have 0 obs

2.2.3.3 Total cholesterol (last episode in 12 months)
●
●
Cholesterol
Valid ValueNV/NA
Valid Value NV/NA
025
5075
100
Barplot: 2.2.3.3.1 - Missing Data Cholesterol (by Type of Diabetes)
●
●
●
●
Cholesterol
[0 − 2.59)[2.59 − 5.18)[5.18 − 7.77)[7.77+)
Other Type Type 1 Type 2
025
5075
100
Barplot: 2.2.3.3.2 - Cholesterol (by Type of Diabetes)

2.2.3.3 Total cholesterol (last episode in 12 months)
●
●
Cholesterol
Valid ValueNV/NA
Valid Value NV/NA
025
5075
100
Barplot: 2.2.3.3.3 - Missing Data Cholesterol (by Gender)
●
●
●
●
Cholesterol
[0 − 2.59)[2.59 − 5.18)[5.18 − 7.77)[7.77+)
Female Male
025
5075
100
Barplot: 2.2.3.3.4 - Cholesterol (by Gender)

2.2.3.3 Total cholesterol (last episode in 12 months)
●
●
Cholesterol
Valid ValueNV/NA
Valid Value NV/NA
025
5075
100
Barplot: 2.2.3.3.5 - Missing Data Cholesterol (by Age)
●
●
●
●
Cholesterol
[0 − 2.59)[2.59 − 5.18)[5.18 − 7.77)[7.77+)
[0 − 18) [18 − 35) [35 − 55) [55 − 75) [75 +)
025
5075
100
Barplot: 2.2.3.3.6 - Cholesterol (by Age)

2.2.3.3 Total cholesterol (last episode in 12 months)Type of Diabetes = Type 1
●
●
Cholesterol
Valid ValueNV/NA
Valid Value NV/NA
025
5075
100
Barplot: 2.2.3.3.7 - Missing Data Cholesterol (by Gender, Type of Diabetes = Type 1)
●
●
●
●
Cholesterol
[0 − 2.59)[2.59 − 5.18)[5.18 − 7.77)[7.77+)
Female Male
025
5075
100
Barplot: 2.2.3.3.8 - Cholesterol (by Gender, Type of Diabetes = Type 1)

2.2.3.3 Total cholesterol (last episode in 12 months)Type of Diabetes = Type 1
●
●
Cholesterol
Valid ValueNV/NA
Valid Value NV/NA
025
5075
100
Barplot: 2.2.3.3.9 - Missing Data Cholesterol (by Age, Type of Diabetes = Type 1)
●
●
●
●
Cholesterol
[0 − 2.59)[2.59 − 5.18)[5.18 − 7.77)[7.77+)
[0 − 18) [18 − 35) [35 − 55) [55 − 75) [75 +)
025
5075
100
Barplot: 2.2.3.3.10 - Cholesterol (by Age, Type of Diabetes = Type 1)

2.2.3.3 Total cholesterol (last episode in 12 months)Type of Diabetes = Type 2
●
●
Cholesterol
Valid ValueNV/NA
Valid Value NV/NA
025
5075
100
Barplot: 2.2.3.3.11 - Missing Data Cholesterol (by Gender, Type of Diabetes = Type 2)
●
●
●
●
Cholesterol
[0 − 2.59)[2.59 − 5.18)[5.18 − 7.77)[7.77+)
Female Male
025
5075
100
Barplot: 2.2.3.3.12 - Cholesterol (by Gender, Type of Diabetes = Type 2)

2.2.3.3 Total cholesterol (last episode in 12 months)Type of Diabetes = Type 2
●
●
Cholesterol
Valid ValueNV/NA
Valid Value NV/NA
025
5075
100
Barplot: 2.2.3.3.13 - Missing Data Cholesterol (by Age, Type of Diabetes = Type 2)
●
●
●
●
Cholesterol
[0 − 2.59)[2.59 − 5.18)[5.18 − 7.77)[7.77+)
[0 − 18) [18 − 35) [35 − 55) [55 − 75) [75 +)
025
5075
100
Barplot: 2.2.3.3.14 - Cholesterol (by Age, Type of Diabetes = Type 2)

2.2.3.3 Total cholesterol (last episode in 12 months)Type of Diabetes = Other Type
●
●
Cholesterol
Valid ValueNV/NA
Valid Value NV/NA
025
5075
100
Barplot: 2.2.3.3.15 - Missing Data Cholesterol (by Gender, Type of Diabetes = Other Type)
●
●
●
●
Cholesterol
[0 − 2.59)[2.59 − 5.18)[5.18 − 7.77)[7.77+)
Female Male
025
5075
100
Barplot: 2.2.3.3.16 - Cholesterol (by Gender, Type of Diabetes = Other Type)

2.2.3.3 Total cholesterol (last episode in 12 months)Type of Diabetes = Other Type
●
●
Cholesterol
Valid ValueNV/NA
Valid Value NV/NA
025
5075
100
Barplot: 2.2.3.3.17 - Missing Data Cholesterol (by Age, Type of Diabetes = Other Type)
●
●
●
●
Cholesterol
[0 − 2.59)[2.59 − 5.18)[5.18 − 7.77)[7.77+)
[0 − 18) [18 − 35) [35 − 55) [55 − 75) [75 +)
025
5075
100
Barplot: 2.2.3.3.18 - Cholesterol (by Age, Type of Diabetes = Other Type)

2.2.3.3 Total cholesterol (last episode in 12 months)Type of Diabetes = Type 1
chol_c sex age_c type_dm
Den
sity
0.0
0.5
1.0
4 6 8 10
Male[0 − 18)
Female[0 − 18)
Male[18 − 35)
0.0
0.5
1.0
Female[18 − 35)
0.0
0.5
1.0
Male[35 − 55)
Female[35 − 55)
Male[55 − 75)
0.0
0.5
1.0
Female[55 − 75)
0.0
0.5
1.0
Male[75+)
4 6 8 10
Female[75+)
Trellis Barplot: 2.2.3.3.19 - * Cholesterol * Gender (Type of Diabetes = Type 1)

2.2.3.3 Total cholesterol (last episode in 12 months)Type of Diabetes = Type 2
chol_c sex age_c type_dm
Den
sity
0.0
0.1
0.2
0.3
0 10 20 30 40
Male[0 − 18)
Female[0 − 18)
Male[18 − 35)
0.0
0.1
0.2
0.3
Female[18 − 35)
0.0
0.1
0.2
0.3
Male[35 − 55)
Female[35 − 55)
Male[55 − 75)
0.0
0.1
0.2
0.3
Female[55 − 75)
0.0
0.1
0.2
0.3
Male[75+)
0 10 20 30 40
Female[75+)
Trellis Barplot: 2.2.3.3.20 - * Cholesterol * Gender (Type of Diabetes = Type 2)

2.2.3.3 Total cholesterol (last episode in 12 months)Type of Diabetes = Other Type
chol_c sex age_c type_dm
Den
sity
0.0
0.2
0.4
0.6
0.8
1.0
2 4 6 8
Male[0 − 18)
Female[0 − 18)
Male[18 − 35)
0.0
0.2
0.4
0.6
0.8
1.0
Female[18 − 35)
0.0
0.2
0.4
0.6
0.8
1.0
Male[35 − 55)
Female[35 − 55)
Male[55 − 75)
0.0
0.2
0.4
0.6
0.8
1.0
Female[55 − 75)
0.0
0.2
0.4
0.6
0.8
1.0
Male[75+)
2 4 6 8
Female[75+)
Trellis Barplot: 2.2.3.3.21 - * Cholesterol * Gender (Type of Diabetes = Other Type)

2.2.3.3 Total cholesterol (last episode in 12 months)
Type 1 Type 2 Other Type
010
2030
40
Boxplot: 2.2.3.3.1 - Cholesterol (by Type of Diabetes)
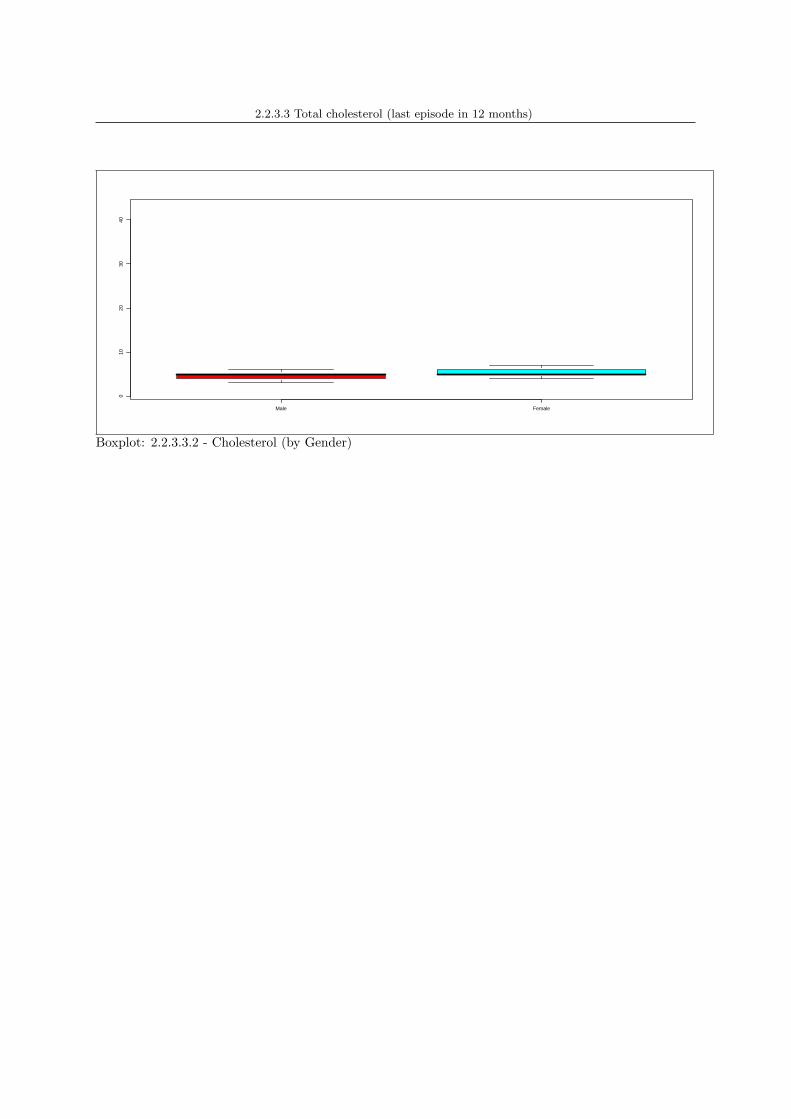
2.2.3.3 Total cholesterol (last episode in 12 months)
Male Female
010
2030
40
Boxplot: 2.2.3.3.2 - Cholesterol (by Gender)

2.2.3.3 Total cholesterol (last episode in 12 months)
[0 − 18) [18 − 35) [35 − 55) [55 − 75) [75+)
010
2030
40
Boxplot: 2.2.3.3.3 - Cholesterol (by Age)

2.2.3.3 Total cholesterol (last episode in 12 months)Type of Diabetes = Type 1
Male Female
34
56
78
910
Boxplot: 2.2.3.3.4 - Cholesterol (by Gender, Type of Diabetes = Type 1)

2.2.3.3 Total cholesterol (last episode in 12 months)Type of Diabetes = Type 1
[0 − 18) [18 − 35) [35 − 55) [55 − 75) [75+)
34
56
78
910
Boxplot: 2.2.3.3.5 - Cholesterol (by Age, Type of Diabetes = Type 1)

2.2.3.3 Total cholesterol (last episode in 12 months)Type of Diabetes = Type 2
Male Female
010
2030
40
Boxplot: 2.2.3.3.6 - Cholesterol (by Gender, Type of Diabetes = Type 2)

2.2.3.3 Total cholesterol (last episode in 12 months)Type of Diabetes = Type 2
[0 − 18) [18 − 35) [35 − 55) [55 − 75) [75+)
010
2030
40
Boxplot: 2.2.3.3.7 - Cholesterol (by Age, Type of Diabetes = Type 2)
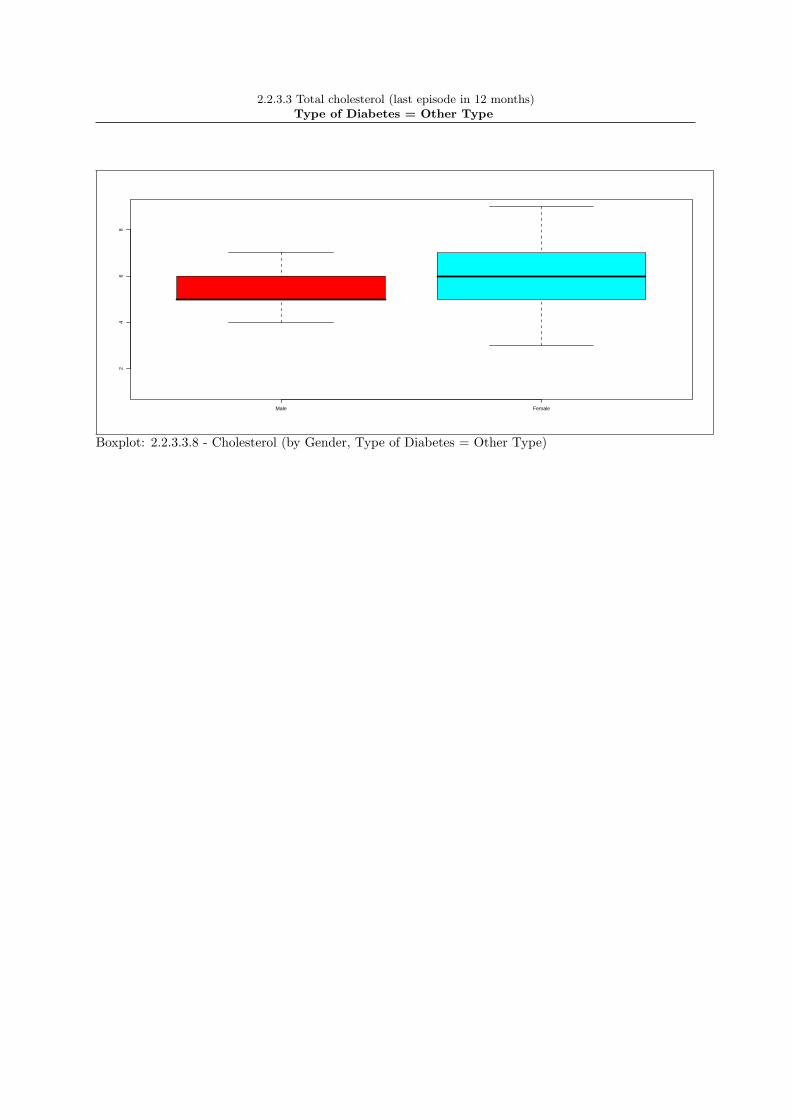
2.2.3.3 Total cholesterol (last episode in 12 months)Type of Diabetes = Other Type
Male Female
24
68
Boxplot: 2.2.3.3.8 - Cholesterol (by Gender, Type of Diabetes = Other Type)

2.2.3.3 Total cholesterol (last episode in 12 months)Type of Diabetes = Other Type
[0 − 18) [18 − 35) [35 − 55) [55 − 75) [75+)
24
68
Boxplot: 2.2.3.3.9 - Cholesterol (by Age, Type of Diabetes = Other Type)
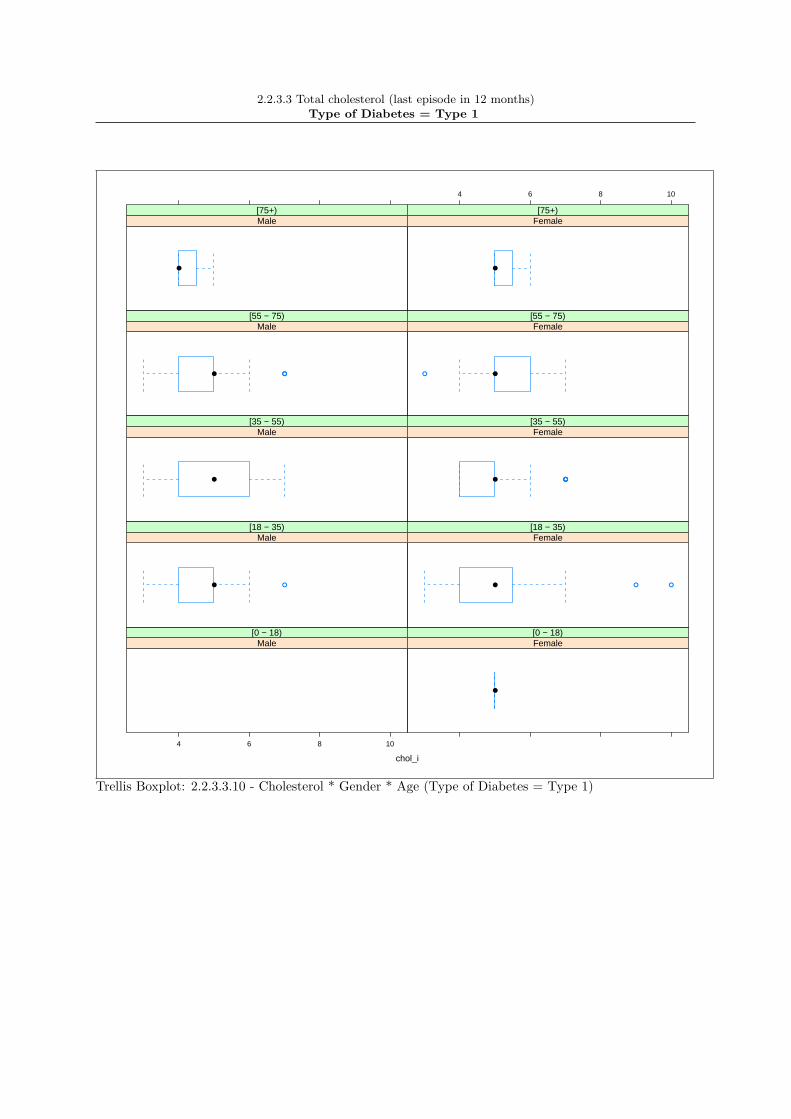
2.2.3.3 Total cholesterol (last episode in 12 months)Type of Diabetes = Type 1
chol_i
4 6 8 10
Male[0 − 18)
●
Female[0 − 18)
● ●
Male[18 − 35)
● ● ●
Female[18 − 35)
●
Male[35 − 55)
● ●●●●
Female[35 − 55)
● ●●
Male[55 − 75)
●●
Female[55 − 75)
●
Male[75+)
4 6 8 10
●
Female[75+)
Trellis Boxplot: 2.2.3.3.10 - Cholesterol * Gender * Age (Type of Diabetes = Type 1)

2.2.3.3 Total cholesterol (last episode in 12 months)Type of Diabetes = Type 2
chol_i
0 10 20 30 40
Male[0 − 18)
●
Female[0 − 18)
● ●
Male[18 − 35)
●
Female[18 − 35)
● ●
Male[35 − 55)
●●● ●●● ●● ● ●● ●●●● ●●●●
Female[35 − 55)
● ●●●●● ●●●●●●●●● ●●● ●●●●●●●●●● ●●●●● ●● ●●●●●●●●●●●●●●●●●●●●●● ●●●●●●● ●●●●●●●●●●●●●● ●● ●●●●●●●●●●● ●●●●●●●●●●●●●●●●●●●●●●● ●●● ●
Male[55 − 75)
● ●
Female[55 − 75)
● ●●● ●●●●●●●●●●●●●● ●●●●●●● ●●●
Male[75+)
0 10 20 30 40
●●● ● ● ●●●●●● ●● ●● ●●● ●● ●●●●●●●●●● ●●● ●
Female[75+)
Trellis Boxplot: 2.2.3.3.11 - Cholesterol * Gender * Age (Type of Diabetes = Type 2)

2.2.3.3 Total cholesterol (last episode in 12 months)Type of Diabetes = Other Type
chol_i
2 4 6 8
Male[0 − 18)
●
Female[0 − 18)
Male[18 − 35)
●
Female[18 − 35)
●● ● ●● ●
Male[35 − 55)
●
Female[35 − 55)
●● ●● ●
Male[55 − 75)
●●
Female[55 − 75)
● ●
Male[75+)
2 4 6 8
●
Female[75+)
Trellis Boxplot: 2.2.3.3.12 - Cholesterol * Gender * Age (Type of Diabetes = Other Type)

2.2.3.4. HDL-cholesterol (last episode in 12 months)
Cholesterol Type of DiabetesValid Value ( % ) NV/NA ( % ) N ( % )
Valid Value 7086 ( 72.8) 0( 0.0) 7086 ( 72.8)NV/NA 2653 ( 27.2) 0( 0.0) 2653 ( 27.2)TOTAL 9739(100.0) 0( 0.0) 9739 (100.0)
Table 2.2.3.4.1: Missing Data Cholesterol (by Type of Diabetes)
Cholesterol Type of DiabetesType 1 ( % ) Type 2 ( % ) Other Type ( % ) N ( % )
0 - 1.294 93 ( 23.7) 2831 ( 43.6) 63( 31.5) 2987 ( 42.2)1.295 + 300 ( 76.3) 3662 ( 56.4) 137( 68.5) 4099 ( 57.8)TOTAL 393( 5.5) 6493( 91.6) 200( 2.8) 7086 (100.0)
Table 2.2.3.4.2: Cholesterol (by Type of Diabetes)
CMH Chi-Square p.value dfValue 69.9835 0 2
177

2.2.3.4. HDL-cholesterol (last episode in 12 months)
Cholesterol GenderValid Value ( % ) NV/NA ( % ) N ( % )
Valid Value 7086 ( 72.8) 0( 0.0) 7086 ( 72.8)NV/NA 2653 ( 27.2) 0( 0.0) 2653 ( 27.2)TOTAL 9739(100.0) 0( 0.0) 9739 (100.0)
Table 2.2.3.4.3: Missing Data Cholesterol (by Gender)
Cholesterol GenderMale ( % ) Female ( % ) N ( % )
0 - 1.294 1989 ( 52.9) 998( 30.0) 2987 ( 42.2)1.295 + 1771 ( 47.1) 2328( 70.0) 4099 ( 57.8)TOTAL 3760( 53.1) 3326( 46.9) 7086 (100.0)
Table 2.2.3.4.4: Cholesterol (by Gender)
CMH Chi-Square p.value dfValue 378.3772 0 1

2.2.3.4. HDL-cholesterol (last episode in 12 months)
Cholesterol AgeValid Value ( % ) NV/NA ( % ) N ( % )
Valid Value 7086 ( 72.8) 0( 0.0) 7086 ( 72.8)NV/NA 2653 ( 27.2) 0( 0.0) 2653 ( 27.2)TOTAL 9739(100.0) 0( 0.0) 9739 (100.0)
Table 2.2.3.4.5: Missing Data Cholesterol (by Age)
Cholesterol Age[0 - 18) ( % ) [18 - 35) ( % ) [35 - 55) ( % ) [55 - 75) ( % ) [75+) ( % ) N ( % )
0 - 1.294 2 ( 66.7) 30 ( 24.8) 458 ( 47.1) 1931 ( 44.1) 566( 35.2) 2987 ( 42.2)1.295 + 1 ( 33.3) 91 ( 75.2) 514 ( 52.9) 2449 ( 55.9) 1044( 64.8) 4099 ( 57.8)TOTAL 3( 0.0) 121( 1.7) 972( 13.7) 4380( 61.8) 1610( 22.7) 7086 (100.0)
Table 2.2.3.4.6: Cholesterol (by Age)
CMH Chi-Square p.value dfValue 64.5735 0 4

2.2.3.4. HDL-cholesterol (last episode in 12 months)Type of Diabetes = Type 1
Cholesterol GenderValid Value ( % ) NV/NA ( % ) N ( % )
Valid Value 393 ( 59.1) 0( 0.0) 393 ( 59.1)NV/NA 272 ( 40.9) 0( 0.0) 272 ( 40.9)TOTAL 665(100.0) 0( 0.0) 665 (100.0)
Table 2.2.3.4.7: Missing Data Cholesterol (by Gender, Type of Diabetes = Type 1)
Cholesterol GenderMale ( % ) Female ( % ) N ( % )
0 - 1.294 71 ( 35.9) 22( 11.3) 93 ( 23.7)1.295 + 127 ( 64.1) 173( 88.7) 300 ( 76.3)TOTAL 198( 50.4) 195( 49.6) 393 (100.0)
Table 2.2.3.4.8: Cholesterol (by Gender, Type of Diabetes = Type 1)
CMH Chi-Square p.value dfValue 31.5031 0 1

2.2.3.4. HDL-cholesterol (last episode in 12 months)Type of Diabetes = Type 1
Cholesterol AgeValid Value ( % ) NV/NA ( % ) N ( % )
Valid Value 393 ( 59.1) 0( 0.0) 393 ( 59.1)NV/NA 272 ( 40.9) 0( 0.0) 272 ( 40.9)TOTAL 665(100.0) 0( 0.0) 665 (100.0)
Table 2.2.3.4.9: Missing Data Cholesterol (by Age, Type of Diabetes = Type 1)
Cholesterol Age[0 - 18) ( % ) [18 - 35) ( % ) [35 - 55) ( % ) [55 - 75) ( % ) [75+) ( % ) N ( % )
0 - 1.294 0 ( 0.0) 18 ( 20.2) 49 ( 25.1) 23 ( 22.8) 3( 42.9) 93 ( 23.7)1.295 + 1 (100.0) 71 ( 79.8) 146 ( 74.9) 78 ( 77.2) 4( 57.1) 300 ( 76.3)TOTAL 1( 0.3) 89( 22.6) 195( 49.6) 101( 25.7) 7( 1.8) 393 (100.0)
Table 2.2.3.4.10: Cholesterol (by Age, Type of Diabetes = Type 1)
CMH Chi-SquareValue One or more cells have 0 obs
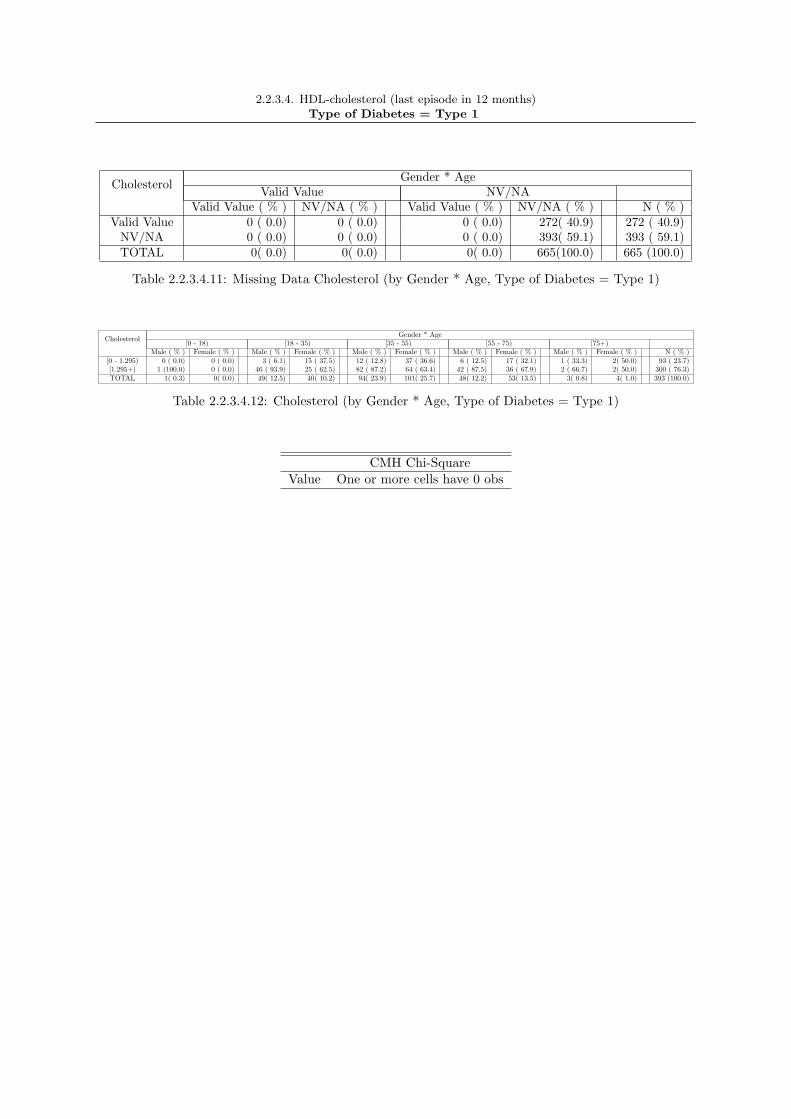
2.2.3.4. HDL-cholesterol (last episode in 12 months)Type of Diabetes = Type 1
Cholesterol Gender * AgeValid Value NV/NA
Valid Value ( % ) NV/NA ( % ) Valid Value ( % ) NV/NA ( % ) N ( % )Valid Value 0 ( 0.0) 0 ( 0.0) 0 ( 0.0) 272( 40.9) 272 ( 40.9)
NV/NA 0 ( 0.0) 0 ( 0.0) 0 ( 0.0) 393( 59.1) 393 ( 59.1)TOTAL 0( 0.0) 0( 0.0) 0( 0.0) 665(100.0) 665 (100.0)
Table 2.2.3.4.11: Missing Data Cholesterol (by Gender * Age, Type of Diabetes = Type 1)
Cholesterol Gender * Age[0 - 18) [18 - 35) [35 - 55) [55 - 75) [75+)
Male ( % ) Female ( % ) Male ( % ) Female ( % ) Male ( % ) Female ( % ) Male ( % ) Female ( % ) Male ( % ) Female ( % ) N ( % )[0 - 1.295) 0 ( 0.0) 0 ( 0.0) 3 ( 6.1) 15 ( 37.5) 12 ( 12.8) 37 ( 36.6) 6 ( 12.5) 17 ( 32.1) 1 ( 33.3) 2( 50.0) 93 ( 23.7)[1.295+) 1 (100.0) 0 ( 0.0) 46 ( 93.9) 25 ( 62.5) 82 ( 87.2) 64 ( 63.4) 42 ( 87.5) 36 ( 67.9) 2 ( 66.7) 2( 50.0) 300 ( 76.3)TOTAL 1( 0.3) 0( 0.0) 49( 12.5) 40( 10.2) 94( 23.9) 101( 25.7) 48( 12.2) 53( 13.5) 3( 0.8) 4( 1.0) 393 (100.0)
Table 2.2.3.4.12: Cholesterol (by Gender * Age, Type of Diabetes = Type 1)
CMH Chi-SquareValue One or more cells have 0 obs

2.2.3.4. HDL-cholesterol (last episode in 12 months)Type of Diabetes = Type 2
Cholesterol GenderValid Value ( % ) NV/NA ( % ) N ( % )
Valid Value 6493 ( 74.6) 0( 0.0) 6493 ( 74.6)NV/NA 2214 ( 25.4) 0( 0.0) 2214 ( 25.4)TOTAL 8707(100.0) 0( 0.0) 8707 (100.0)
Table 2.2.3.4.13: Missing Data Cholesterol (by Gender, Type of Diabetes = Type 2)
Cholesterol GenderMale ( % ) Female ( % ) N ( % )
0 - 1.294 1884 ( 53.9) 947( 31.6) 2831 ( 43.6)1.295 + 1609 ( 46.1) 2053( 68.4) 3662 ( 56.4)TOTAL 3493( 53.8) 3000( 46.2) 6493 (100.0)
Table 2.2.3.4.14: Cholesterol (by Gender, Type of Diabetes = Type 2)
CMH Chi-Square p.value dfValue 327.5115 0 1

2.2.3.4. HDL-cholesterol (last episode in 12 months)Type of Diabetes = Type 2
Cholesterol AgeValid Value ( % ) NV/NA ( % ) N ( % )
Valid Value 6493 ( 74.6) 0( 0.0) 6493 ( 74.6)NV/NA 2214 ( 25.4) 0( 0.0) 2214 ( 25.4)TOTAL 8707(100.0) 0( 0.0) 8707 (100.0)
Table 2.2.3.4.15: Missing Data Cholesterol (by Age, Type of Diabetes = Type 2)
Cholesterol Age[0 - 18) ( % ) [18 - 35) ( % ) [35 - 55) ( % ) [55 - 75) ( % ) [75+) ( % ) N ( % )
0 - 1.294 1 (100.0) 9 ( 47.4) 396 ( 54.0) 1873 ( 44.9) 552( 35.2) 2831 ( 43.6)1.295 + 0 ( 0.0) 10 ( 52.6) 338 ( 46.0) 2299 ( 55.1) 1015( 64.8) 3662 ( 56.4)TOTAL 1( 0.0) 19( 0.3) 734( 11.3) 4172( 64.3) 1567( 24.1) 6493 (100.0)
Table 2.2.3.4.16: Cholesterol (by Age, Type of Diabetes = Type 2)
CMH Chi-SquareValue One or more cells have 0 obs
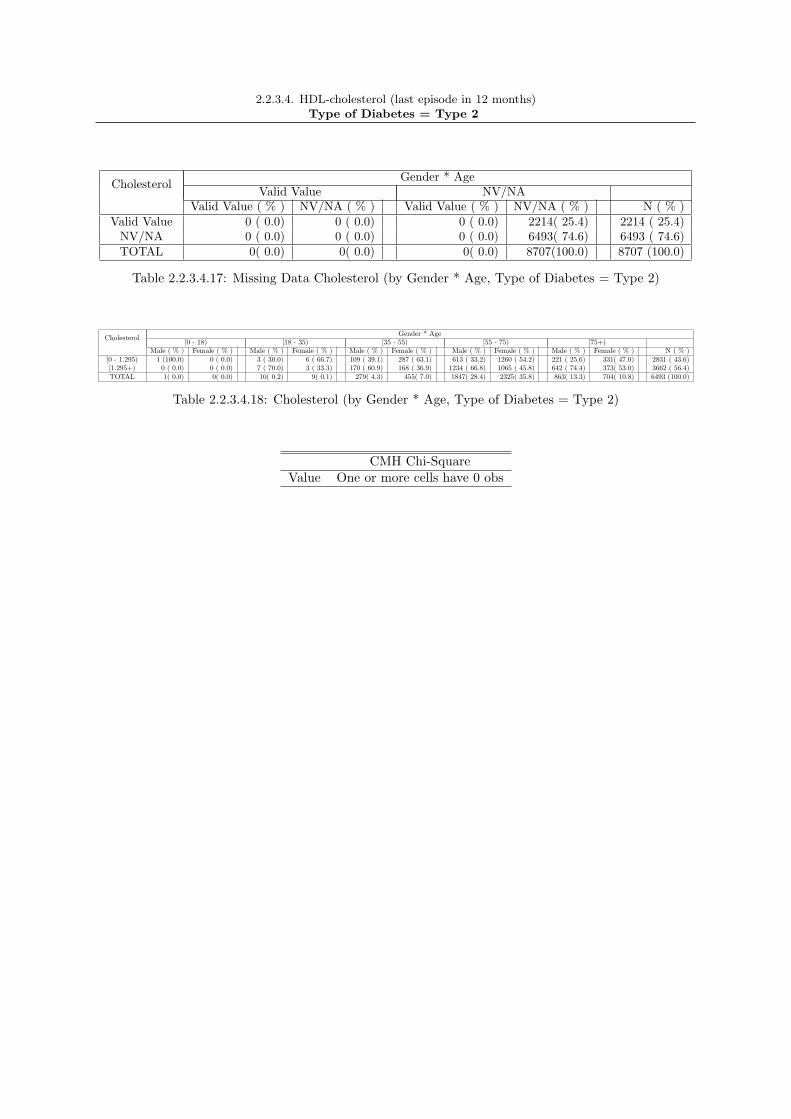
2.2.3.4. HDL-cholesterol (last episode in 12 months)Type of Diabetes = Type 2
Cholesterol Gender * AgeValid Value NV/NA
Valid Value ( % ) NV/NA ( % ) Valid Value ( % ) NV/NA ( % ) N ( % )Valid Value 0 ( 0.0) 0 ( 0.0) 0 ( 0.0) 2214( 25.4) 2214 ( 25.4)
NV/NA 0 ( 0.0) 0 ( 0.0) 0 ( 0.0) 6493( 74.6) 6493 ( 74.6)TOTAL 0( 0.0) 0( 0.0) 0( 0.0) 8707(100.0) 8707 (100.0)
Table 2.2.3.4.17: Missing Data Cholesterol (by Gender * Age, Type of Diabetes = Type 2)
Cholesterol Gender * Age[0 - 18) [18 - 35) [35 - 55) [55 - 75) [75+)
Male ( % ) Female ( % ) Male ( % ) Female ( % ) Male ( % ) Female ( % ) Male ( % ) Female ( % ) Male ( % ) Female ( % ) N ( % )[0 - 1.295) 1 (100.0) 0 ( 0.0) 3 ( 30.0) 6 ( 66.7) 109 ( 39.1) 287 ( 63.1) 613 ( 33.2) 1260 ( 54.2) 221 ( 25.6) 331( 47.0) 2831 ( 43.6)[1.295+) 0 ( 0.0) 0 ( 0.0) 7 ( 70.0) 3 ( 33.3) 170 ( 60.9) 168 ( 36.9) 1234 ( 66.8) 1065 ( 45.8) 642 ( 74.4) 373( 53.0) 3662 ( 56.4)TOTAL 1( 0.0) 0( 0.0) 10( 0.2) 9( 0.1) 279( 4.3) 455( 7.0) 1847( 28.4) 2325( 35.8) 863( 13.3) 704( 10.8) 6493 (100.0)
Table 2.2.3.4.18: Cholesterol (by Gender * Age, Type of Diabetes = Type 2)
CMH Chi-SquareValue One or more cells have 0 obs

2.2.3.4. HDL-cholesterol (last episode in 12 months)Type of Diabetes = Other Type
Cholesterol GenderValid Value ( % ) NV/NA ( % ) N ( % )
Valid Value 200 ( 54.5) 0( 0.0) 200 ( 54.5)NV/NA 167 ( 45.5) 0( 0.0) 167 ( 45.5)TOTAL 367(100.0) 0( 0.0) 367 (100.0)
Table 2.2.3.4.19: Missing Data Cholesterol (by Gender, Type of Diabetes = Other Type)
Cholesterol GenderMale ( % ) Female ( % ) N ( % )
0 - 1.294 34 ( 49.3) 29( 22.1) 63 ( 31.5)1.295 + 35 ( 50.7) 102( 77.9) 137 ( 68.5)TOTAL 69( 34.5) 131( 65.5) 200 (100.0)
Table 2.2.3.4.20: Cholesterol (by Gender, Type of Diabetes = Other Type)
CMH Chi-Square p.value dfValue 14.1936 2e− 04 1

2.2.3.4. HDL-cholesterol (last episode in 12 months)Type of Diabetes = Other Type
Cholesterol AgeValid Value ( % ) NV/NA ( % ) N ( % )
Valid Value 200 ( 54.5) 0( 0.0) 200 ( 54.5)NV/NA 167 ( 45.5) 0( 0.0) 167 ( 45.5)TOTAL 367(100.0) 0( 0.0) 367 (100.0)
Table 2.2.3.4.21: Missing Data Cholesterol (by Age, Type of Diabetes = Other Type)
Cholesterol Age[0 - 18) ( % ) [18 - 35) ( % ) [35 - 55) ( % ) [55 - 75) ( % ) [75+) ( % ) N ( % )
0 - 1.294 1 (100.0) 3 ( 23.1) 13 ( 30.2) 35 ( 32.7) 11( 30.6) 63 ( 31.5)1.295 + 0 ( 0.0) 10 ( 76.9) 30 ( 69.8) 72 ( 67.3) 25( 69.4) 137 ( 68.5)TOTAL 1( 0.5) 13( 6.5) 43( 21.5) 107( 53.5) 36( 18.0) 200 (100.0)
Table 2.2.3.4.22: Cholesterol (by Age, Type of Diabetes = Other Type)
CMH Chi-SquareValue One or more cells have 0 obs

2.2.3.4. HDL-cholesterol (last episode in 12 months)Type of Diabetes = Other Type
Cholesterol Gender * AgeValid Value NV/NA
Valid Value ( % ) NV/NA ( % ) Valid Value ( % ) NV/NA ( % ) N ( % )Valid Value 0 ( 0.0) 0 ( 0.0) 0 ( 0.0) 167( 45.5) 167 ( 45.5)
NV/NA 0 ( 0.0) 0 ( 0.0) 0 ( 0.0) 200( 54.5) 200 ( 54.5)TOTAL 0( 0.0) 0( 0.0) 0( 0.0) 367(100.0) 367 (100.0)
Table 2.2.3.4.23: Missing Data Cholesterol (by Gender * Age, Type of Diabetes = Other Type)
Cholesterol Gender * Age[0 - 18) [18 - 35) [35 - 55) [55 - 75) [75+)
Male ( % ) Female ( % ) Male ( % ) Female ( % ) Male ( % ) Female ( % ) Male ( % ) Female ( % ) Male ( % ) Female ( % ) N ( % )[0 - 1.295) 1 (100.0) 0 ( 0.0) 3 ( 23.1) 0 ( 0.0) 6 ( 20.0) 7 ( 53.8) 16 ( 24.2) 19 ( 46.3) 3 ( 14.3) 8( 53.3) 63 ( 31.5)[1.295+) 0 ( 0.0) 0 ( 0.0) 10 ( 76.9) 0 ( 0.0) 24 ( 80.0) 6 ( 46.2) 50 ( 75.8) 22 ( 53.7) 18 ( 85.7) 7( 46.7) 137 ( 68.5)TOTAL 1( 0.5) 0( 0.0) 13( 6.5) 0( 0.0) 30( 15.0) 13( 6.5) 66( 33.0) 41( 20.5) 21( 10.5) 15( 7.5) 200 (100.0)
Table 2.2.3.4.24: Cholesterol (by Gender * Age, Type of Diabetes = Other Type)
CMH Chi-SquareValue One or more cells have 0 obs

2.2.3.4. HDL-cholesterol (last episode in 12 months)
●
●
Cholesterol
Valid ValueNV/NA
Valid Value NV/NA
025
5075
100
Barplot: 2.2.3.4.1 - Missing Data Cholesterol (by Type of Diabetes)
●
●
Cholesterol
[0 − 1.295)[1.295+)
Other Type Type 1 Type 2
025
5075
100
Barplot: 2.2.3.4.2 - Cholesterol (by Type of Diabetes)

2.2.3.4. HDL-cholesterol (last episode in 12 months)
●
●
Cholesterol
Valid ValueNV/NA
Valid Value NV/NA
025
5075
100
Barplot: 2.2.3.4.3 - Missing Data Cholesterol (by Gender)
●
●
Cholesterol
[0 − 1.295)[1.295+)
Female Male
025
5075
100
Barplot: 2.2.3.4.4 - Cholesterol (by Gender)

2.2.3.4. HDL-cholesterol (last episode in 12 months)
●
●
Cholesterol
Valid ValueNV/NA
Valid Value NV/NA
025
5075
100
Barplot: 2.2.3.4.5 - Missing Data Cholesterol (by Age)
●
●
Cholesterol
[0 − 1.295)[1.295+)
[0 − 18) [18 − 35) [35 − 55) [55 − 75) [75 +)
025
5075
100
Barplot: 2.2.3.4.6 - Cholesterol (by Age)

2.2.3.4. HDL-cholesterol (last episode in 12 months)Type of Diabetes = Type 1
●
●
Cholesterol
Valid ValueNV/NA
Valid Value NV/NA
025
5075
100
Barplot: 2.2.3.4.7 - Missing Data Cholesterol (by Gender, Type of Diabetes = Type 1)
●
●
Cholesterol
[0 − 1.295)[1.295+)
Female Male
025
5075
100
Barplot: 2.2.3.4.8 - Cholesterol (by Gender, Type of Diabetes = Type 1)

2.2.3.4. HDL-cholesterol (last episode in 12 months)Type of Diabetes = Type 1
●
●
Cholesterol
Valid ValueNV/NA
Valid Value NV/NA
025
5075
100
Barplot: 2.2.3.4.9 - Missing Data Cholesterol (by Age, Type of Diabetes = Type 1)
●
●
Cholesterol
[0 − 1.295)[1.295+)
[0 − 18) [18 − 35) [35 − 55) [55 − 75) [75 +)
025
5075
100
Barplot: 2.2.3.4.10 - Cholesterol (by Age, Type of Diabetes = Type 1)
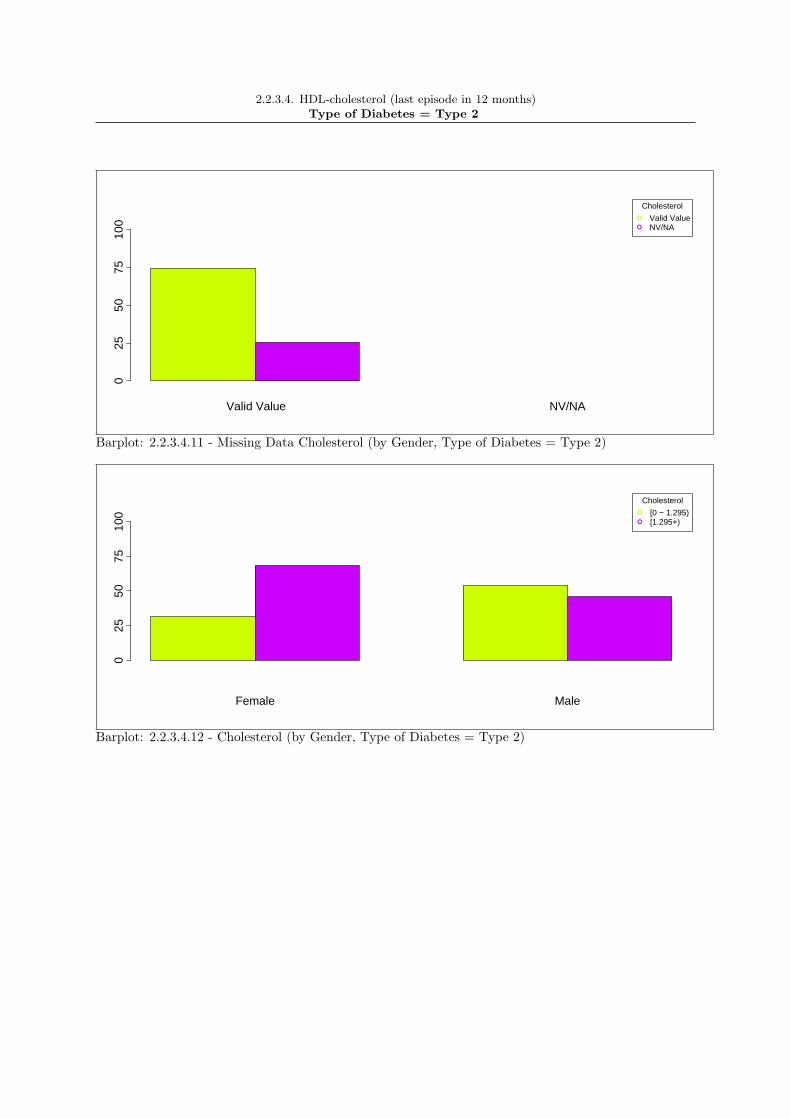
2.2.3.4. HDL-cholesterol (last episode in 12 months)Type of Diabetes = Type 2
●
●
Cholesterol
Valid ValueNV/NA
Valid Value NV/NA
025
5075
100
Barplot: 2.2.3.4.11 - Missing Data Cholesterol (by Gender, Type of Diabetes = Type 2)
●
●
Cholesterol
[0 − 1.295)[1.295+)
Female Male
025
5075
100
Barplot: 2.2.3.4.12 - Cholesterol (by Gender, Type of Diabetes = Type 2)

2.2.3.4. HDL-cholesterol (last episode in 12 months)Type of Diabetes = Type 2
●
●
Cholesterol
Valid ValueNV/NA
Valid Value NV/NA
025
5075
100
Barplot: 2.2.3.4.13 - Missing Data Cholesterol (by Age, Type of Diabetes = Type 2)
●
●
Cholesterol
[0 − 1.295)[1.295+)
[0 − 18) [18 − 35) [35 − 55) [55 − 75) [75 +)
025
5075
100
Barplot: 2.2.3.4.14 - Cholesterol (by Age, Type of Diabetes = Type 2)

2.2.3.4. HDL-cholesterol (last episode in 12 months)Type of Diabetes = Other Type
●
●
Cholesterol
Valid ValueNV/NA
Valid Value NV/NA
025
5075
100
Barplot: 2.2.3.4.15 - Missing Data Cholesterol (by Gender, Type of Diabetes = Other Type)
●
●
Cholesterol
[0 − 1.295)[1.295+)
Female Male
025
5075
100
Barplot: 2.2.3.4.16 - Cholesterol (by Gender, Type of Diabetes = Other Type)

2.2.3.4. HDL-cholesterol (last episode in 12 months)Type of Diabetes = Other Type
●
●
Cholesterol
Valid ValueNV/NA
Valid Value NV/NA
025
5075
100
Barplot: 2.2.3.4.17 - Missing Data Cholesterol (by Age, Type of Diabetes = Other Type)
●
●
Cholesterol
[0 − 1.295)[1.295+)
[0 − 18) [18 − 35) [35 − 55) [55 − 75) [75 +)
025
5075
100
Barplot: 2.2.3.4.18 - Cholesterol (by Age, Type of Diabetes = Other Type)

2.2.3.4. HDL-cholesterol (last episode in 12 months)Type of Diabetes = Type 1
hdl_c sex age_c type_dm
Den
sity
0
1
2
3
0 1 2 3
Male[0 − 18)
Female[0 − 18)
Male[18 − 35)
0
1
2
3
Female[18 − 35)
0
1
2
3
Male[35 − 55)
Female[35 − 55)
Male[55 − 75)
0
1
2
3
Female[55 − 75)
0
1
2
3
Male[75+)
0 1 2 3
Female[75+)
Trellis Barplot: 2.2.3.4.19 - * Cholesterol * Gender (Type of Diabetes = Type 1)

2.2.3.4. HDL-cholesterol (last episode in 12 months)Type of Diabetes = Type 2
hdl_c sex age_c type_dm
Den
sity
0
1
2
3
4
0 1 2 3
Male[0 − 18)
Female[0 − 18)
Male[18 − 35)
0
1
2
3
4
Female[18 − 35)
0
1
2
3
4
Male[35 − 55)
Female[35 − 55)
Male[55 − 75)
0
1
2
3
4
Female[55 − 75)
0
1
2
3
4
Male[75+)
0 1 2 3
Female[75+)
Trellis Barplot: 2.2.3.4.20 - * Cholesterol * Gender (Type of Diabetes = Type 2)

2.2.3.4. HDL-cholesterol (last episode in 12 months)Type of Diabetes = Other Type
hdl_c sex age_c type_dm
Den
sity
0
1
2
3
4
1.0 1.5 2.0 2.5 3.0
Male[0 − 18)
Female[0 − 18)
Male[18 − 35)
0
1
2
3
4
Female[18 − 35)
0
1
2
3
4
Male[35 − 55)
Female[35 − 55)
Male[55 − 75)
0
1
2
3
4
Female[55 − 75)
0
1
2
3
4
Male[75+)
1.0 1.5 2.0 2.5 3.0
Female[75+)
Trellis Barplot: 2.2.3.4.21 - * Cholesterol * Gender (Type of Diabetes = Other Type)

2.2.3.4. HDL-cholesterol (last episode in 12 months)
Type 1 Type 2 Other Type
0.0
0.5
1.0
1.5
2.0
2.5
3.0
Boxplot: 2.2.3.4.1 - Cholesterol (by Type of Diabetes)

2.2.3.4. HDL-cholesterol (last episode in 12 months)
Male Female
0.0
0.5
1.0
1.5
2.0
2.5
3.0
Boxplot: 2.2.3.4.2 - Cholesterol (by Gender)

2.2.3.4. HDL-cholesterol (last episode in 12 months)
[0 − 18) [18 − 35) [35 − 55) [55 − 75) [75+)
0.0
0.5
1.0
1.5
2.0
2.5
3.0
Boxplot: 2.2.3.4.3 - Cholesterol (by Age)

2.2.3.4. HDL-cholesterol (last episode in 12 months)Type of Diabetes = Type 1
Male Female
0.0
0.5
1.0
1.5
2.0
2.5
3.0
Boxplot: 2.2.3.4.4 - Cholesterol (by Gender, Type of Diabetes = Type 1)

2.2.3.4. HDL-cholesterol (last episode in 12 months)Type of Diabetes = Type 1
[0 − 18) [18 − 35) [35 − 55) [55 − 75) [75+)
0.0
0.5
1.0
1.5
2.0
2.5
3.0
Boxplot: 2.2.3.4.5 - Cholesterol (by Age, Type of Diabetes = Type 1)

2.2.3.4. HDL-cholesterol (last episode in 12 months)Type of Diabetes = Type 2
Male Female
0.0
0.5
1.0
1.5
2.0
2.5
3.0
Boxplot: 2.2.3.4.6 - Cholesterol (by Gender, Type of Diabetes = Type 2)

2.2.3.4. HDL-cholesterol (last episode in 12 months)Type of Diabetes = Type 2
[0 − 18) [18 − 35) [35 − 55) [55 − 75) [75+)
0.0
0.5
1.0
1.5
2.0
2.5
3.0
Boxplot: 2.2.3.4.7 - Cholesterol (by Age, Type of Diabetes = Type 2)

2.2.3.4. HDL-cholesterol (last episode in 12 months)Type of Diabetes = Other Type
Male Female
1.0
1.5
2.0
2.5
3.0
Boxplot: 2.2.3.4.8 - Cholesterol (by Gender, Type of Diabetes = Other Type)

2.2.3.4. HDL-cholesterol (last episode in 12 months)Type of Diabetes = Other Type
[0 − 18) [18 − 35) [35 − 55) [55 − 75) [75+)
1.0
1.5
2.0
2.5
3.0
Boxplot: 2.2.3.4.9 - Cholesterol (by Age, Type of Diabetes = Other Type)

2.2.3.4. HDL-cholesterol (last episode in 12 months)Type of Diabetes = Type 1
hdl_i
0.0 0.5 1.0 1.5 2.0 2.5 3.0
Male[0 − 18)
●
Female[0 − 18)
●
Male[18 − 35)
●
Female[18 − 35)
●
Male[35 − 55)
●●●●●●●●●●●●●●●●●●●●●●●●
Female[35 − 55)
●
Male[55 − 75)
●
Female[55 − 75)
●
Male[75+)
0.0 0.5 1.0 1.5 2.0 2.5 3.0
●
Female[75+)
Trellis Boxplot: 2.2.3.4.10 - Cholesterol * Gender * Age (Type of Diabetes = Type 1)

2.2.3.4. HDL-cholesterol (last episode in 12 months)Type of Diabetes = Type 2
hdl_i
0.0 0.5 1.0 1.5 2.0 2.5 3.0
Male[0 − 18)
●
Female[0 − 18)
●
Male[18 − 35)
●
Female[18 − 35)
● ●●●● ●●●●●●●●●●●●●●●●●●●●●●●●●●●●●●●●●●●●●●●●●●●●●●●●●●●●●●●●●●●●●●●●●●●●●●●●●●●●●●●●●●●●
Male[35 − 55)
●
Female[35 − 55)
●
Male[55 − 75)
●
Female[55 − 75)
●
Male[75+)
0.0 0.5 1.0 1.5 2.0 2.5 3.0
●
Female[75+)
Trellis Boxplot: 2.2.3.4.11 - Cholesterol * Gender * Age (Type of Diabetes = Type 2)

2.2.3.4. HDL-cholesterol (last episode in 12 months)Type of Diabetes = Other Type
hdl_i
1.0 1.5 2.0 2.5 3.0
Male[0 − 18)
●
Female[0 − 18)
Male[18 − 35)
●
Female[18 − 35)
● ●
Male[35 − 55)
●
Female[35 − 55)
●
Male[55 − 75)
●
Female[55 − 75)
●
Male[75+)
1.0 1.5 2.0 2.5 3.0
●●●●●● ●
Female[75+)
Trellis Boxplot: 2.2.3.4.12 - Cholesterol * Gender * Age (Type of Diabetes = Other Type)

2.2.3.5 Creatinine (last episode in 12 months)
Cratinine Type of DiabetesValid Value ( % ) NV/NA ( % ) N ( % )
Valid Value 6353 ( 65.2) 0( 0.0) 6353 ( 65.2)NV/NA 3386 ( 34.8) 0( 0.0) 3386 ( 34.8)TOTAL 9739(100.0) 0( 0.0) 9739 (100.0)
Table 2.2.3.5.1: Missing Data Cratinine (by Type of Diabetes)
Cratinine Type of DiabetesType 1 ( % ) Type 2 ( % ) Other Type ( % ) N ( % )
[0 - 50) 6 ( 1.8) 79 ( 1.3) 9( 6.7) 94 ( 1.5)[50 - 100) 278 ( 81.3) 4190 ( 71.3) 101( 75.4) 4569 ( 71.9)[100 - 150) 45 ( 13.2) 1334 ( 22.7) 21( 15.7) 1400 ( 22.0)
[150+) 13 ( 3.8) 274 ( 4.7) 3( 2.2) 290 ( 4.6)TOTAL 342( 5.4) 5877( 92.5) 134( 2.1) 6353 (100.0)
Table 2.2.3.5.2: Cratinine (by Type of Diabetes)
CMH Chi-Square p.value dfValue 48.4664 0 6
213

2.2.3.5 Creatinine (last episode in 12 months)
Cratinine GenderValid Value ( % ) NV/NA ( % ) N ( % )
Valid Value 6353 ( 65.2) 0( 0.0) 6353 ( 65.2)NV/NA 3386 ( 34.8) 0( 0.0) 3386 ( 34.8)TOTAL 9739(100.0) 0( 0.0) 9739 (100.0)
Table 2.2.3.5.3: Missing Data Cratinine (by Gender)
Cratinine GenderMale ( % ) Female ( % ) N ( % )
[0 - 50) 10 ( 0.3) 84( 2.8) 94 ( 1.5)[50 - 100) 2124 ( 63.0) 2445( 82.0) 4569 ( 71.9)[100 - 150) 1027 ( 30.4) 373( 12.5) 1400 ( 22.0)
[150+) 212 ( 6.3) 78( 2.6) 290 ( 4.6)TOTAL 3373( 53.1) 2980( 46.9) 6353 (100.0)
Table 2.2.3.5.4: Cratinine (by Gender)
CMH Chi-Square p.value dfValue 425.5535 0 3

2.2.3.5 Creatinine (last episode in 12 months)
Cratinine AgeValid Value ( % ) NV/NA ( % ) N ( % )
Valid Value 6353 ( 65.2) 0( 0.0) 6353 ( 65.2)NV/NA 3386 ( 34.8) 0( 0.0) 3386 ( 34.8)TOTAL 9739(100.0) 0( 0.0) 9739 (100.0)
Table 2.2.3.5.5: Missing Data Cratinine (by Age)
Cratinine Age[0 - 18) ( % ) [18 - 35) ( % ) [35 - 55) ( % ) [55 - 75) ( % ) [75+) ( % ) N ( % )
[0 - 50) 0 ( 0.0) 9 ( 8.2) 19 ( 2.3) 61 ( 1.6) 5( 0.3) 94 ( 1.5)[50 - 100) 1 ( 50.0) 89 ( 80.9) 674 ( 82.9) 2902 ( 74.6) 903( 58.7) 4569 ( 71.9)[100 - 150) 1 ( 50.0) 11 ( 10.0) 110 ( 13.5) 794 ( 20.4) 484( 31.5) 1400 ( 22.0)
[150+) 0 ( 0.0) 1 ( 0.9) 10 ( 1.2) 133 ( 3.4) 146( 9.5) 290 ( 4.6)TOTAL 2( 0.0) 110( 1.7) 813( 12.8) 3890( 61.2) 1538( 24.2) 6353 (100.0)
Table 2.2.3.5.6: Cratinine (by Age)
CMH Chi-SquareValue One or more cells have 0 obs

2.2.3.5 Creatinine (last episode in 12 months)Type of Diabetes = Type 1
Cratinine GenderValid Value ( % ) NV/NA ( % ) N ( % )
Valid Value 342 ( 51.4) 0( 0.0) 342 ( 51.4)NV/NA 323 ( 48.6) 0( 0.0) 323 ( 48.6)TOTAL 665(100.0) 0( 0.0) 665 (100.0)
Table 2.2.3.5.7: Missing Data Cratinine (by Gender, Type of Diabetes = Type 1)
Cratinine GenderMale ( % ) Female ( % ) N ( % )
[0 - 50) 0 ( 0.0) 6( 3.4) 6 ( 1.8)[50 - 100) 120 ( 71.9) 158( 90.3) 278 ( 81.3)[100 - 150) 39 ( 23.4) 6( 3.4) 45 ( 13.2)
[150+) 8 ( 4.8) 5( 2.9) 13 ( 3.8)TOTAL 167( 48.8) 175( 51.2) 342 (100.0)
Table 2.2.3.5.8: Cratinine (by Gender, Type of Diabetes = Type 1)
CMH Chi-SquareValue One or more cells have 0 obs

2.2.3.5 Creatinine (last episode in 12 months)Type of Diabetes = Type 1
Cratinine AgeValid Value ( % ) NV/NA ( % ) N ( % )
Valid Value 342 ( 51.4) 0( 0.0) 342 ( 51.4)NV/NA 323 ( 48.6) 0( 0.0) 323 ( 48.6)TOTAL 665(100.0) 0( 0.0) 665 (100.0)
Table 2.2.3.5.9: Missing Data Cratinine (by Age, Type of Diabetes = Type 1)
Cratinine Age[0 - 18) ( % ) [18 - 35) ( % ) [35 - 55) ( % ) [55 - 75) ( % ) [75+) ( % ) N ( % )
[0 - 50) 0 ( 0.0) 2 ( 2.6) 3 ( 1.8) 1 ( 1.0) 0( 0.0) 6 ( 1.8)[50 - 100) 1 (100.0) 64 ( 84.2) 138 ( 83.6) 74 ( 77.1) 1( 25.0) 278 ( 81.3)[100 - 150) 0 ( 0.0) 9 ( 11.8) 20 ( 12.1) 14 ( 14.6) 2( 50.0) 45 ( 13.2)
[150+) 0 ( 0.0) 1 ( 1.3) 4 ( 2.4) 7 ( 7.3) 1( 25.0) 13 ( 3.8)TOTAL 1( 0.3) 76( 22.2) 165( 48.2) 96( 28.1) 4( 1.2) 342 (100.0)
Table 2.2.3.5.10: Cratinine (by Age, Type of Diabetes = Type 1)
CMH Chi-SquareValue One or more cells have 0 obs

2.2.3.5 Creatinine (last episode in 12 months)Type of Diabetes = Type 1
Cratinine Gender * AgeValid Value NV/NA
Valid Value ( % ) NV/NA ( % ) Valid Value ( % ) NV/NA ( % ) N ( % )Valid Value 0 ( 0.0) 0 ( 0.0) 0 ( 0.0) 323( 48.6) 323 ( 48.6)
NV/NA 0 ( 0.0) 0 ( 0.0) 0 ( 0.0) 342( 51.4) 342 ( 51.4)TOTAL 0( 0.0) 0( 0.0) 0( 0.0) 665(100.0) 665 (100.0)
Table 2.2.3.5.11: Missing Data Cratinine (by Gender * Age, Type of Diabetes = Type 1)
Cratinine Gender * Age[0 - 18) [18 - 35) [35 - 55) [55 - 75) [75+)
Male ( % ) Female ( % ) Male ( % ) Female ( % ) Male ( % ) Female ( % ) Male ( % ) Female ( % ) Male ( % ) Female ( % ) N ( % )[0 - 50) 0 ( 0.0) 0 ( 0.0) 2 ( 4.5) 0 ( 0.0) 3 ( 3.8) 0 ( 0.0) 1 ( 2.0) 0 ( 0.0) 0 ( 0.0) 0( 0.0) 6 ( 1.8)
[50 - 100) 0 ( 0.0) 0 ( 0.0) 1 ( 2.3) 8 ( 25.0) 2 ( 2.5) 18 ( 21.2) 2 ( 4.1) 12 ( 25.5) 1 (100.0) 1( 33.3) 45 ( 13.2)[100 - 150) 0 ( 0.0) 0 ( 0.0) 0 ( 0.0) 1 ( 3.1) 0 ( 0.0) 4 ( 4.7) 5 ( 10.2) 2 ( 4.3) 0 ( 0.0) 1( 33.3) 13 ( 3.8)
[150+) 1 (100.0) 0 ( 0.0) 41 ( 93.2) 23 ( 71.9) 75 ( 93.8) 63 ( 74.1) 41 ( 83.7) 33 ( 70.2) 0 ( 0.0) 1( 33.3) 278 ( 81.3)TOTAL 1( 0.3) 0( 0.0) 44( 12.9) 32( 9.4) 80( 23.4) 85( 24.9) 49( 14.3) 47( 13.7) 1( 0.3) 3( 0.9) 342 (100.0)
Table 2.2.3.5.12: Cratinine (by Gender * Age, Type of Diabetes = Type 1)
CMH Chi-SquareValue One or more cells have 0 obs

2.2.3.5 Creatinine (last episode in 12 months)Type of Diabetes = Type 2
Cratinine GenderValid Value ( % ) NV/NA ( % ) N ( % )
Valid Value 5877 ( 67.5) 0( 0.0) 5877 ( 67.5)NV/NA 2830 ( 32.5) 0( 0.0) 2830 ( 32.5)TOTAL 8707(100.0) 0( 0.0) 8707 (100.0)
Table 2.2.3.5.13: Missing Data Cratinine (by Gender, Type of Diabetes = Type 2)
Cratinine GenderMale ( % ) Female ( % ) N ( % )
[0 - 50) 10 ( 0.3) 69( 2.5) 79 ( 1.3)[50 - 100) 1971 ( 62.4) 2219( 81.7) 4190 ( 71.3)[100 - 150) 977 ( 30.9) 357( 13.1) 1334 ( 22.7)
[150+) 203 ( 6.4) 71( 2.6) 274 ( 4.7)TOTAL 3161( 53.8) 2716( 46.2) 5877 (100.0)
Table 2.2.3.5.14: Cratinine (by Gender, Type of Diabetes = Type 2)
CMH Chi-Square p.value dfValue 378.9671 0 3

2.2.3.5 Creatinine (last episode in 12 months)Type of Diabetes = Type 2
Cratinine AgeValid Value ( % ) NV/NA ( % ) N ( % )
Valid Value 5877 ( 67.5) 0( 0.0) 5877 ( 67.5)NV/NA 2830 ( 32.5) 0( 0.0) 2830 ( 32.5)TOTAL 8707(100.0) 0( 0.0) 8707 (100.0)
Table 2.2.3.5.15: Missing Data Cratinine (by Age, Type of Diabetes = Type 2)
Cratinine Age[0 - 18) ( % ) [18 - 35) ( % ) [35 - 55) ( % ) [55 - 75) ( % ) [75+) ( % ) N ( % )
[0 - 50) 0 ( 0.0) 3 ( 16.7) 12 ( 1.9) 59 ( 1.6) 5( 0.3) 79 ( 1.3)[50 - 100) 0 ( 0.0) 13 ( 72.2) 519 ( 83.2) 2773 ( 74.5) 885( 58.6) 4190 ( 71.3)[100 - 150) 1 (100.0) 2 ( 11.1) 87 ( 13.9) 766 ( 20.6) 478( 31.6) 1334 ( 22.7)
[150+) 0 ( 0.0) 0 ( 0.0) 6 ( 1.0) 125 ( 3.4) 143( 9.5) 274 ( 4.7)TOTAL 1( 0.0) 18( 0.3) 624( 10.6) 3723( 63.3) 1511( 25.7) 5877 (100.0)
Table 2.2.3.5.16: Cratinine (by Age, Type of Diabetes = Type 2)
CMH Chi-SquareValue One or more cells have 0 obs

2.2.3.5 Creatinine (last episode in 12 months)Type of Diabetes = Type 2
Cratinine Gender * AgeValid Value NV/NA
Valid Value ( % ) NV/NA ( % ) Valid Value ( % ) NV/NA ( % ) N ( % )Valid Value 0 ( 0.0) 0 ( 0.0) 0 ( 0.0) 2830( 32.5) 2830 ( 32.5)
NV/NA 0 ( 0.0) 0 ( 0.0) 0 ( 0.0) 5877( 67.5) 5877 ( 67.5)TOTAL 0( 0.0) 0( 0.0) 0( 0.0) 8707(100.0) 8707 (100.0)
Table 2.2.3.5.17: Missing Data Cratinine (by Gender * Age, Type of Diabetes = Type 2)
Cratinine Gender * Age[0 - 18) [18 - 35) [35 - 55) [55 - 75) [75+)
Male ( % ) Female ( % ) Male ( % ) Female ( % ) Male ( % ) Female ( % ) Male ( % ) Female ( % ) Male ( % ) Female ( % ) N ( % )[0 - 50) 0 ( 0.0) 0 ( 0.0) 3 ( 33.3) 0 ( 0.0) 9 ( 3.8) 3 ( 0.8) 53 ( 3.2) 6 ( 0.3) 4 ( 0.5) 1( 0.1) 79 ( 1.3)
[50 - 100) 1 (100.0) 0 ( 0.0) 0 ( 0.0) 2 ( 22.2) 4 ( 1.7) 83 ( 21.3) 144 ( 8.8) 622 ( 29.9) 208 ( 25.0) 270( 39.7) 1334 ( 22.7)[100 - 150) 0 ( 0.0) 0 ( 0.0) 0 ( 0.0) 0 ( 0.0) 3 ( 1.3) 3 ( 0.8) 23 ( 1.4) 102 ( 4.9) 45 ( 5.4) 98( 14.4) 274 ( 4.7)
[150+) 0 ( 0.0) 0 ( 0.0) 6 ( 66.7) 7 ( 77.8) 219 ( 93.2) 300 ( 77.1) 1420 ( 86.6) 1353 ( 65.0) 574 ( 69.1) 311( 45.7) 4190 ( 71.3)TOTAL 1( 0.0) 0( 0.0) 9( 0.2) 9( 0.2) 235( 4.0) 389( 6.6) 1640( 27.9) 2083( 35.4) 831( 14.1) 680( 11.6) 5877 (100.0)
Table 2.2.3.5.18: Cratinine (by Gender * Age, Type of Diabetes = Type 2)
CMH Chi-SquareValue One or more cells have 0 obs

2.2.3.5 Creatinine (last episode in 12 months)Type of Diabetes = Other Type
Cratinine GenderValid Value ( % ) NV/NA ( % ) N ( % )
Valid Value 134 ( 36.5) 0( 0.0) 134 ( 36.5)NV/NA 233 ( 63.5) 0( 0.0) 233 ( 63.5)TOTAL 367(100.0) 0( 0.0) 367 (100.0)
Table 2.2.3.5.19: Missing Data Cratinine (by Gender, Type of Diabetes = Other Type)
Cratinine GenderMale ( % ) Female ( % ) N ( % )
[0 - 50) 0 ( 0.0) 9( 10.1) 9 ( 6.7)[50 - 100) 33 ( 73.3) 68( 76.4) 101 ( 75.4)[100 - 150) 11 ( 24.4) 10( 11.2) 21 ( 15.7)
[150+) 1 ( 2.2) 2( 2.2) 3 ( 2.2)TOTAL 45( 33.6) 89( 66.4) 134 (100.0)
Table 2.2.3.5.20: Cratinine (by Gender, Type of Diabetes = Other Type)
CMH Chi-SquareValue One or more cells have 0 obs

2.2.3.5 Creatinine (last episode in 12 months)Type of Diabetes = Other Type
Cratinine AgeValid Value ( % ) NV/NA ( % ) N ( % )
Valid Value 134 ( 36.5) 0( 0.0) 134 ( 36.5)NV/NA 233 ( 63.5) 0( 0.0) 233 ( 63.5)TOTAL 367(100.0) 0( 0.0) 367 (100.0)
Table 2.2.3.5.21: Missing Data Cratinine (by Age, Type of Diabetes = Other Type)
Cratinine Age[0 - 18) ( % ) [18 - 35) ( % ) [35 - 55) ( % ) [55 - 75) ( % ) [75+) ( % ) N ( % )
[0 - 50) 0 ( 0.0) 4 ( 25.0) 4 ( 16.7) 1 ( 1.4) 0( 0.0) 9 ( 6.7)[50 - 100) 0 ( 0.0) 12 ( 75.0) 17 ( 70.8) 55 ( 77.5) 17( 73.9) 101 ( 75.4)[100 - 150) 0 ( 0.0) 0 ( 0.0) 3 ( 12.5) 14 ( 19.7) 4( 17.4) 21 ( 15.7)
[150+) 0 ( 0.0) 0 ( 0.0) 0 ( 0.0) 1 ( 1.4) 2( 8.7) 3 ( 2.2)TOTAL 0( 0.0) 16( 11.9) 24( 17.9) 71( 53.0) 23( 17.2) 134 (100.0)
Table 2.2.3.5.22: Cratinine (by Age, Type of Diabetes = Other Type)
CMH Chi-SquareValue One or more cells have 0 obs

2.2.3.5 Creatinine (last episode in 12 months)Type of Diabetes = Other Type
Cratinine Gender * AgeValid Value NV/NA
Valid Value ( % ) NV/NA ( % ) Valid Value ( % ) NV/NA ( % ) N ( % )Valid Value 0 ( 0.0) 0 ( 0.0) 0 ( 0.0) 233( 63.5) 233 ( 63.5)
NV/NA 0 ( 0.0) 0 ( 0.0) 0 ( 0.0) 134( 36.5) 134 ( 36.5)TOTAL 0( 0.0) 0( 0.0) 0( 0.0) 367(100.0) 367 (100.0)
Table 2.2.3.5.23: Missing Data Cratinine (by Gender * Age, Type of Diabetes = Other Type)
Cratinine Gender * Age[0 - 18) [18 - 35) [35 - 55) [55 - 75) [75+)
Male ( % ) Female ( % ) Male ( % ) Female ( % ) Male ( % ) Female ( % ) Male ( % ) Female ( % ) Male ( % ) Female ( % ) N ( % )[0 - 50) 0 ( 0.0) 0 ( 0.0) 4 ( 25.0) 0 ( 0.0) 4 ( 25.0) 0 ( 0.0) 1 ( 2.3) 0 ( 0.0) 0 ( 0.0) 0( 0.0) 9 ( 6.7)
[50 - 100) 0 ( 0.0) 0 ( 0.0) 0 ( 0.0) 0 ( 0.0) 1 ( 6.2) 2 ( 25.0) 8 ( 18.6) 6 ( 21.4) 1 ( 7.1) 3( 33.3) 21 ( 15.7)[100 - 150) 0 ( 0.0) 0 ( 0.0) 0 ( 0.0) 0 ( 0.0) 0 ( 0.0) 0 ( 0.0) 1 ( 2.3) 0 ( 0.0) 1 ( 7.1) 1( 11.1) 3 ( 2.2)
[150+) 0 ( 0.0) 0 ( 0.0) 12 ( 75.0) 0 ( 0.0) 11 ( 68.8) 6 ( 75.0) 33 ( 76.7) 22 ( 78.6) 12 ( 85.7) 5( 55.6) 101 ( 75.4)TOTAL 0( 0.0) 0( 0.0) 16( 11.9) 0( 0.0) 16( 11.9) 8( 6.0) 43( 32.1) 28( 20.9) 14( 10.4) 9( 6.7) 134 (100.0)
Table 2.2.3.5.24: Cratinine (by Gender * Age, Type of Diabetes = Other Type)
CMH Chi-SquareValue One or more cells have 0 obs

2.2.3.5 Creatinine (last episode in 12 months)
●
●
Cratinine
Valid ValueNV/NA
Valid Value NV/NA
025
5075
100
Barplot: 2.2.3.5.1 - Missing Data Cratinine (by Type of Diabetes)
●
●
●
●
Cratinine
[0 − 50)[50 − 100)[100 − 150)[150+)
Other Type Type 1 Type 2
025
5075
100
Barplot: 2.2.3.5.2 - Cratinine (by Type of Diabetes)

2.2.3.5 Creatinine (last episode in 12 months)
●
●
Cratinine
Valid ValueNV/NA
Valid Value NV/NA
025
5075
100
Barplot: 2.2.3.5.3 - Missing Data Cratinine (by Gender)
●
●
●
●
Cratinine
[0 − 50)[50 − 100)[100 − 150)[150+)
Female Male
025
5075
100
Barplot: 2.2.3.5.4 - Cratinine (by Gender)

2.2.3.5 Creatinine (last episode in 12 months)
●
●
Cratinine
Valid ValueNV/NA
Valid Value NV/NA
025
5075
100
Barplot: 2.2.3.5.5 - Missing Data Cratinine (by Age)
●
●
●
●
Cratinine
[0 − 50)[50 − 100)[100 − 150)[150+)
[0 − 18) [18 − 35) [35 − 55) [55 − 75) [75 +)
025
5075
100
Barplot: 2.2.3.5.6 - Cratinine (by Age)

2.2.3.5 Creatinine (last episode in 12 months)Type of Diabetes = Type 1
●
●
Cratinine
Valid ValueNV/NA
Valid Value NV/NA
025
5075
100
Barplot: 2.2.3.5.7 - Missing Data Cratinine (by Gender, Type of Diabetes = Type 1)
●
●
●
●
Cratinine
[0 − 50)[50 − 100)[100 − 150)[150+)
Female Male
025
5075
100
Barplot: 2.2.3.5.8 - Cratinine (by Gender, Type of Diabetes = Type 1)

2.2.3.5 Creatinine (last episode in 12 months)Type of Diabetes = Type 1
●
●
Cratinine
Valid ValueNV/NA
Valid Value NV/NA
025
5075
100
Barplot: 2.2.3.5.9 - Missing Data Cratinine (by Age, Type of Diabetes = Type 1)
●
●
●
●
Cratinine
[0 − 50)[50 − 100)[100 − 150)[150+)
[0 − 18) [18 − 35) [35 − 55) [55 − 75) [75 +)
025
5075
100
Barplot: 2.2.3.5.10 - Cratinine (by Age, Type of Diabetes = Type 1)

2.2.3.5 Creatinine (last episode in 12 months)Type of Diabetes = Type 2
●
●
Cratinine
Valid ValueNV/NA
Valid Value NV/NA
025
5075
100
Barplot: 2.2.3.5.11 - Missing Data Cratinine (by Gender, Type of Diabetes = Type 2)
●
●
●
●
Cratinine
[0 − 50)[50 − 100)[100 − 150)[150+)
Female Male
025
5075
100
Barplot: 2.2.3.5.12 - Cratinine (by Gender, Type of Diabetes = Type 2)

2.2.3.5 Creatinine (last episode in 12 months)Type of Diabetes = Type 2
●
●
Cratinine
Valid ValueNV/NA
Valid Value NV/NA
025
5075
100
Barplot: 2.2.3.5.13 - Missing Data Cratinine (by Age, Type of Diabetes = Type 2)
●
●
●
●
Cratinine
[0 − 50)[50 − 100)[100 − 150)[150+)
[0 − 18) [18 − 35) [35 − 55) [55 − 75) [75 +)
025
5075
100
Barplot: 2.2.3.5.14 - Cratinine (by Age, Type of Diabetes = Type 2)
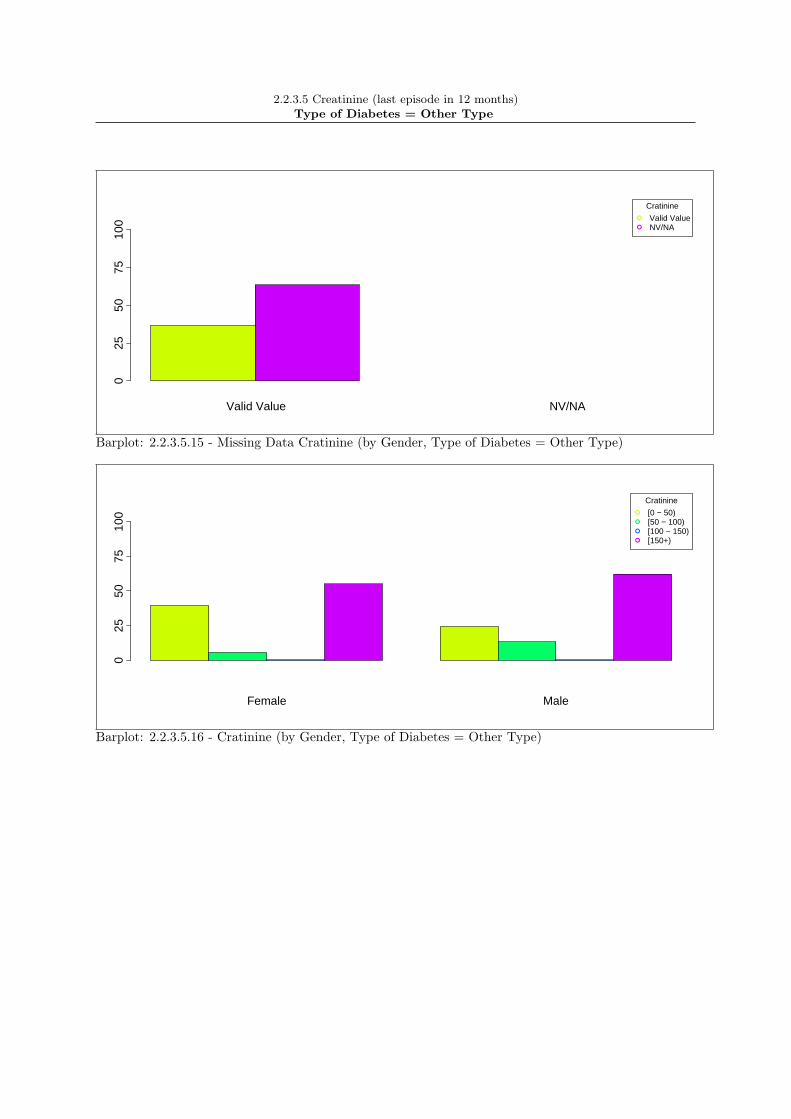
2.2.3.5 Creatinine (last episode in 12 months)Type of Diabetes = Other Type
●
●
Cratinine
Valid ValueNV/NA
Valid Value NV/NA
025
5075
100
Barplot: 2.2.3.5.15 - Missing Data Cratinine (by Gender, Type of Diabetes = Other Type)
●
●
●
●
Cratinine
[0 − 50)[50 − 100)[100 − 150)[150+)
Female Male
025
5075
100
Barplot: 2.2.3.5.16 - Cratinine (by Gender, Type of Diabetes = Other Type)

2.2.3.5 Creatinine (last episode in 12 months)Type of Diabetes = Other Type
●
●
Cratinine
Valid ValueNV/NA
Valid Value NV/NA
025
5075
100
Barplot: 2.2.3.5.17 - Missing Data Cratinine (by Age, Type of Diabetes = Other Type)
●
●
●
●
Cratinine
[0 − 50)[50 − 100)[100 − 150)[150+)
[0 − 18) [18 − 35) [35 − 55) [55 − 75) [75 +)
025
5075
100
Barplot: 2.2.3.5.18 - Cratinine (by Age, Type of Diabetes = Other Type)

2.2.3.5 Creatinine (last episode in 12 months)Type of Diabetes = Type 1
creat_c sex age_c type_dm
Den
sity
0.000
0.002
0.004
0.006
0 500 1000
Male[0 − 18)
Female[0 − 18)
Male[18 − 35)
0.000
0.002
0.004
0.006
Female[18 − 35)
0.000
0.002
0.004
0.006
Male[35 − 55)
Female[35 − 55)
Male[55 − 75)
0.000
0.002
0.004
0.006
Female[55 − 75)
0.000
0.002
0.004
0.006
Male[75+)
0 500 1000
Female[75+)
Trellis Barplot: 2.2.3.5.19 - * Cratinine * Gender (Type of Diabetes = Type 1)

2.2.3.5 Creatinine (last episode in 12 months)Type of Diabetes = Type 2
creat_c sex age_c type_dm
Den
sity
0.000
0.002
0.004
0.006
0.008
0.010
0 500 1000
Male[0 − 18)
Female[0 − 18)
Male[18 − 35)
0.000
0.002
0.004
0.006
0.008
0.010
Female[18 − 35)
0.000
0.002
0.004
0.006
0.008
0.010
Male[35 − 55)
Female[35 − 55)
Male[55 − 75)
0.000
0.002
0.004
0.006
0.008
0.010
Female[55 − 75)
0.000
0.002
0.004
0.006
0.008
0.010
Male[75+)
0 500 1000
Female[75+)
Trellis Barplot: 2.2.3.5.20 - * Cratinine * Gender (Type of Diabetes = Type 2)

2.2.3.5 Creatinine (last episode in 12 months)Type of Diabetes = Other Type
creat_c sex age_c type_dm
Den
sity
0.00
0.01
0.02
0.03
0.04
50 100 150
Male[18 − 35)
Female[18 − 35)
Male[35 − 55)
0.00
0.01
0.02
0.03
0.04Female
[35 − 55)0.00
0.01
0.02
0.03
0.04Male
[55 − 75)Female
[55 − 75)
Male[75+)
50 100 150
0.00
0.01
0.02
0.03
0.04Female[75+)
Trellis Barplot: 2.2.3.5.21 - * Cratinine * Gender (Type of Diabetes = Other Type)

2.2.3.5 Creatinine (last episode in 12 months)
Type 1 Type 2 Other Type
020
040
060
080
010
0012
00
Boxplot: 2.2.3.5.1 - Cratinine (by Type of Diabetes)

2.2.3.5 Creatinine (last episode in 12 months)
Male Female
020
040
060
080
010
0012
00
Boxplot: 2.2.3.5.2 - Cratinine (by Gender)

2.2.3.5 Creatinine (last episode in 12 months)
[0 − 18) [18 − 35) [35 − 55) [55 − 75) [75+)
020
040
060
080
010
0012
00
Boxplot: 2.2.3.5.3 - Cratinine (by Age)

2.2.3.5 Creatinine (last episode in 12 months)Type of Diabetes = Type 1
Male Female
020
040
060
080
010
0012
00
Boxplot: 2.2.3.5.4 - Cratinine (by Gender, Type of Diabetes = Type 1)

2.2.3.5 Creatinine (last episode in 12 months)Type of Diabetes = Type 1
[0 − 18) [18 − 35) [35 − 55) [55 − 75) [75+)
020
040
060
080
010
0012
00
Boxplot: 2.2.3.5.5 - Cratinine (by Age, Type of Diabetes = Type 1)
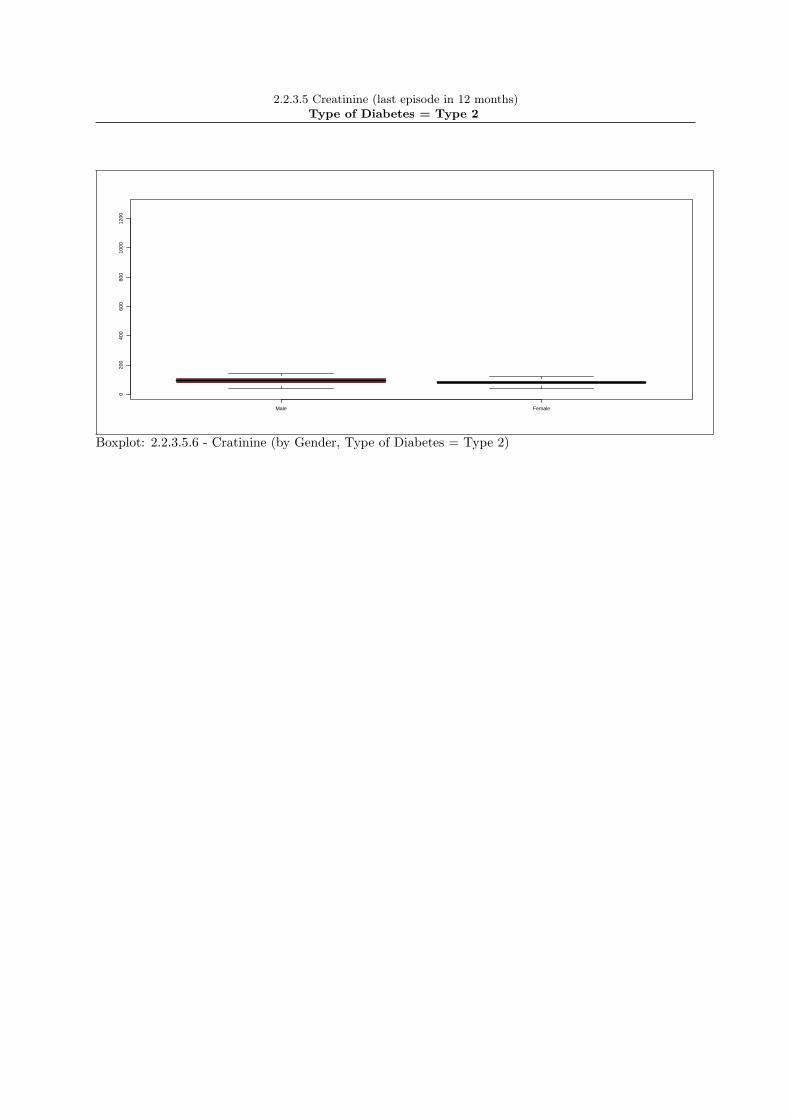
2.2.3.5 Creatinine (last episode in 12 months)Type of Diabetes = Type 2
Male Female
020
040
060
080
010
0012
00
Boxplot: 2.2.3.5.6 - Cratinine (by Gender, Type of Diabetes = Type 2)

2.2.3.5 Creatinine (last episode in 12 months)Type of Diabetes = Type 2
[0 − 18) [18 − 35) [35 − 55) [55 − 75) [75+)
020
040
060
080
010
0012
00
Boxplot: 2.2.3.5.7 - Cratinine (by Age, Type of Diabetes = Type 2)

2.2.3.5 Creatinine (last episode in 12 months)Type of Diabetes = Other Type
Male Female
4060
8010
012
014
016
0
Boxplot: 2.2.3.5.8 - Cratinine (by Gender, Type of Diabetes = Other Type)

2.2.3.5 Creatinine (last episode in 12 months)Type of Diabetes = Other Type
[0 − 18) [18 − 35) [35 − 55) [55 − 75)
4060
8010
012
014
016
0
Boxplot: 2.2.3.5.9 - Cratinine (by Age, Type of Diabetes = Other Type)

2.2.3.5 Creatinine (last episode in 12 months)Type of Diabetes = Type 1
creat_i
0 200 400 600 800 1000 1200
Male[0 − 18)
●
Female[0 − 18)
● ●
Male[18 − 35)
●
Female[18 − 35)
● ●●● ●
Male[35 − 55)
●● ●
Female[35 − 55)
● ●●
Male[55 − 75)
● ●● ● ●●
Female[55 − 75)
●
Male[75+)
0 200 400 600 800 1000 1200
●
Female[75+)
Trellis Boxplot: 2.2.3.5.10 - Cratinine * Gender * Age (Type of Diabetes = Type 1)

2.2.3.5 Creatinine (last episode in 12 months)Type of Diabetes = Type 2
creat_i
0 500 1000
Male[0 − 18)
●
Female[0 − 18)
●
Male[18 − 35)
●
Female[18 − 35)
●● ●●● ●●● ●●●●●● ●●●●●●●●●● ● ●
Male[35 − 55)
● ● ●●
Female[35 − 55)
● ●● ●●●●●●●●● ●●●●●●●●●●●●●●●●●● ●●● ● ●●●●● ●● ● ●● ●●●●●●● ●●●●● ● ● ●●●●●●●●●●●●●●●●●●●●●●●●●●●●●●●●●●● ● ● ●● ● ●● ● ● ● ● ●
Male[55 − 75)
●●●●●●●●●●●● ●●●●● ●●● ●●●●●●●●●●●●●●●●●●●●●●●●●●●●●●●●●● ●●●●●●●● ●●●●● ●●●●●●●●●●●●● ●●● ●●●●●●●●●●●●●●●●●●●●●●●●●●●●●●● ●
Female[55 − 75)
● ●●●●●● ●●●● ● ●●● ● ● ● ● ●● ●●●●●●●●●●●●●●●●●●● ● ● ●
Male[75+)
0 500 1000
● ● ●●● ●●●●●●●●●●●●●● ●●●●●●●●● ●●●●●●●●●●●●●●● ●●● ● ● ●
Female[75+)
Trellis Boxplot: 2.2.3.5.11 - Cratinine * Gender * Age (Type of Diabetes = Type 2)

2.2.3.5 Creatinine (last episode in 12 months)Type of Diabetes = Other Type
creat_i
50 100 150
Male[18 − 35)
● ●
Female[18 − 35)
●
Male[35 − 55)
● ● ●
Female[35 − 55)
● ●●
Male[55 − 75)
● ● ●
Female[55 − 75)
●
Male[75+)
50 100 150
● ●
Female[75+)
Trellis Boxplot: 2.2.3.5.12 - Cratinine * Gender * Age (Type of Diabetes = Other Type)

2.2.3.6. HbA1c (last episode in 12 months)
Hba1c Type of DiabetesValid Value ( % ) NV/NA ( % ) N ( % )
Valid Value 9024 ( 92.7) 0( 0.0) 9024 ( 92.7)NV/NA 715 ( 7.3) 0( 0.0) 715 ( 7.3)TOTAL 9739(100.0) 0( 0.0) 9739 (100.0)
Table 2.2.3.6.1: Missing Data Hba1c (by Type of Diabetes)
Hba1c Type of DiabetesType 1 ( % ) Type 2 ( % ) Other Type ( % ) N ( % )
0 - 5.9 163 ( 26.2) 3715 ( 45.4) 158( 69.6) 4036 ( 44.7)6 - 7.9 209 ( 33.7) 2659 ( 32.5) 38( 16.7) 2906 ( 32.2)
8 + 249 ( 40.1) 1802 ( 22.0) 31( 13.7) 2082 ( 23.1)TOTAL 621( 6.9) 8176( 90.6) 227( 2.5) 9024 (100.0)
Table 2.2.3.6.2: Hba1c (by Type of Diabetes)
CMH Chi-Square p.value dfValue 187.7736 0 4
249

2.2.3.6. HbA1c (last episode in 12 months)
Hba1c GenderValid Value ( % ) NV/NA ( % ) N ( % )
Valid Value 9024 ( 92.7) 0( 0.0) 9024 ( 92.7)NV/NA 715 ( 7.3) 0( 0.0) 715 ( 7.3)TOTAL 9739(100.0) 0( 0.0) 9739 (100.0)
Table 2.2.3.6.3: Missing Data Hba1c (by Gender)
Hba1c GenderMale ( % ) Female ( % ) N ( % )
0 - 5.9 2269 ( 46.9) 1767( 42.2) 4036 ( 44.7)6 - 7.9 1531 ( 31.7) 1375( 32.8) 2906 ( 32.2)
8 + 1034 ( 21.4) 1048( 25.0) 2082 ( 23.1)TOTAL 4834( 53.6) 4190( 46.4) 9024 (100.0)
Table 2.2.3.6.4: Hba1c (by Gender)
CMH Chi-Square p.value dfValue 25.0761 0 2

2.2.3.6. HbA1c (last episode in 12 months)
Hba1c AgeValid Value ( % ) NV/NA ( % ) N ( % )
Valid Value 9024 ( 92.7) 0( 0.0) 9024 ( 92.7)NV/NA 715 ( 7.3) 0( 0.0) 715 ( 7.3)TOTAL 9739(100.0) 0( 0.0) 9739 (100.0)
Table 2.2.3.6.5: Missing Data Hba1c (by Age)
Hba1c Age[0 - 18) ( % ) [18 - 35) ( % ) [35 - 55) ( % ) [55 - 75) ( % ) [75+) ( % ) N ( % )
0 - 5.9 0 ( 0.0) 106 ( 47.5) 516 ( 41.3) 2457 ( 45.6) 957( 44.3) 4036 ( 44.7)6 - 7.9 1 ( 20.0) 49 ( 22.0) 368 ( 29.5) 1725 ( 32.0) 763( 35.3) 2906 ( 32.2)
8 + 4 ( 80.0) 68 ( 30.5) 364 ( 29.2) 1205 ( 22.4) 441( 20.4) 2082 ( 23.1)TOTAL 5( 0.1) 223( 2.5) 1248( 13.8) 5387( 59.7) 2161( 23.9) 9024 (100.0)
Table 2.2.3.6.6: Hba1c (by Age)
CMH Chi-SquareValue One or more cells have 0 obs

2.2.3.6. HbA1c (last episode in 12 months)Type of Diabetes = Type 1
Hba1c GenderValid Value ( % ) NV/NA ( % ) N ( % )
Valid Value 621 ( 93.4) 0( 0.0) 621 ( 93.4)NV/NA 44 ( 6.6) 0( 0.0) 44 ( 6.6)TOTAL 665(100.0) 0( 0.0) 665 (100.0)
Table 2.2.3.6.7: Missing Data Hba1c (by Gender, Type of Diabetes = Type 1)
Hba1c GenderMale ( % ) Female ( % ) N ( % )
0 - 5.9 85 ( 25.1) 78( 27.6) 163 ( 26.2)6 - 7.9 127 ( 37.6) 82( 29.0) 209 ( 33.7)
8 + 126 ( 37.3) 123( 43.5) 249 ( 40.1)TOTAL 338( 54.4) 283( 45.6) 621 (100.0)
Table 2.2.3.6.8: Hba1c (by Gender, Type of Diabetes = Type 1)
CMH Chi-Square p.value dfValue 5.1953 0.0744 2

2.2.3.6. HbA1c (last episode in 12 months)Type of Diabetes = Type 1
Hba1c AgeValid Value ( % ) NV/NA ( % ) N ( % )
Valid Value 621 ( 93.4) 0( 0.0) 621 ( 93.4)NV/NA 44 ( 6.6) 0( 0.0) 44 ( 6.6)TOTAL 665(100.0) 0( 0.0) 665 (100.0)
Table 2.2.3.6.9: Missing Data Hba1c (by Age, Type of Diabetes = Type 1)
Hba1c Age[0 - 18) ( % ) [18 - 35) ( % ) [35 - 55) ( % ) [55 - 75) ( % ) [75+) ( % ) N ( % )
0 - 5.9 0 ( 0.0) 45 ( 30.4) 78 ( 25.5) 36 ( 23.8) 4( 36.4) 163 ( 26.2)6 - 7.9 1 ( 20.0) 44 ( 29.7) 113 ( 36.9) 47 ( 31.1) 4( 36.4) 209 ( 33.7)
8 + 4 ( 80.0) 59 ( 39.9) 115 ( 37.6) 68 ( 45.0) 3( 27.3) 249 ( 40.1)TOTAL 5( 0.8) 148( 23.8) 306( 49.3) 151( 24.3) 11( 1.8) 621 (100.0)
Table 2.2.3.6.10: Hba1c (by Age, Type of Diabetes = Type 1)
CMH Chi-SquareValue One or more cells have 0 obs

2.2.3.6. HbA1c (last episode in 12 months)Type of Diabetes = Type 1
Hba1c Gender * AgeValid Value NV/NA
Valid Value ( % ) NV/NA ( % ) Valid Value ( % ) NV/NA ( % ) N ( % )Valid Value 0 ( 0.0) 0 ( 0.0) 0 ( 0.0) 44( 6.6) 44 ( 6.6)
NV/NA 0 ( 0.0) 0 ( 0.0) 0 ( 0.0) 621( 93.4) 621 ( 93.4)TOTAL 0( 0.0) 0( 0.0) 0( 0.0) 665(100.0) 665 (100.0)
Table 2.2.3.6.11: Missing Data Hba1c (by Gender * Age, Type of Diabetes = Type 1)
Hba1c Gender * Age[0 - 18) [18 - 35) [35 - 55) [55 - 75) [75+)
Male ( % ) Female ( % ) Male ( % ) Female ( % ) Male ( % ) Female ( % ) Male ( % ) Female ( % ) Male ( % ) Female ( % ) N ( % )[0 - 7) 0 ( 0.0) 0 ( 0.0) 28 ( 39.4) 17 ( 22.1) 34 ( 25.8) 44 ( 25.3) 14 ( 19.7) 22 ( 27.5) 2 ( 33.3) 2( 40.0) 163 ( 26.2)[7 - 8) 0 ( 0.0) 1 ( 50.0) 15 ( 21.1) 29 ( 37.7) 47 ( 35.6) 66 ( 37.9) 19 ( 26.8) 28 ( 35.0) 1 ( 16.7) 3( 60.0) 209 ( 33.7)[8+) 3 (100.0) 1 ( 50.0) 28 ( 39.4) 31 ( 40.3) 51 ( 38.6) 64 ( 36.8) 38 ( 53.5) 30 ( 37.5) 3 ( 50.0) 0( 0.0) 249 ( 40.1)
TOTAL 3( 0.5) 2( 0.3) 71( 11.4) 77( 12.4) 132( 21.3) 174( 28.0) 71( 11.4) 80( 12.9) 6( 1.0) 5( 0.8) 621 (100.0)
Table 2.2.3.6.12: Hba1c (by Gender * Age, Type of Diabetes = Type 1)
CMH Chi-SquareValue One or more cells have 0 obs

2.2.3.6. HbA1c (last episode in 12 months)Type of Diabetes = Type 2
Hba1c GenderValid Value ( % ) NV/NA ( % ) N ( % )
Valid Value 8176 ( 93.9) 0( 0.0) 8176 ( 93.9)NV/NA 531 ( 6.1) 0( 0.0) 531 ( 6.1)TOTAL 8707(100.0) 0( 0.0) 8707 (100.0)
Table 2.2.3.6.13: Missing Data Hba1c (by Gender, Type of Diabetes = Type 2)
Hba1c GenderMale ( % ) Female ( % ) N ( % )
0 - 5.9 2145 ( 48.4) 1570( 41.9) 3715 ( 45.4)6 - 7.9 1391 ( 31.4) 1268( 33.9) 2659 ( 32.5)
8 + 895 ( 20.2) 907( 24.2) 1802 ( 22.0)TOTAL 4431( 54.2) 3745( 45.8) 8176 (100.0)
Table 2.2.3.6.14: Hba1c (by Gender, Type of Diabetes = Type 2)
CMH Chi-Square p.value dfValue 37.4725 0 2

2.2.3.6. HbA1c (last episode in 12 months)Type of Diabetes = Type 2
Hba1c AgeValid Value ( % ) NV/NA ( % ) N ( % )
Valid Value 8176 ( 93.9) 0( 0.0) 8176 ( 93.9)NV/NA 531 ( 6.1) 0( 0.0) 531 ( 6.1)TOTAL 8707(100.0) 0( 0.0) 8707 (100.0)
Table 2.2.3.6.15: Missing Data Hba1c (by Age, Type of Diabetes = Type 2)
Hba1c Age[0 - 18) ( % ) [18 - 35) ( % ) [35 - 55) ( % ) [55 - 75) ( % ) [75+) ( % ) N ( % )
0 - 5.9 0 ( 0.0) 22 ( 73.3) 390 ( 44.3) 2367 ( 46.0) 936( 44.1) 3715 ( 45.4)6 - 7.9 0 ( 0.0) 1 ( 3.3) 248 ( 28.1) 1659 ( 32.3) 751( 35.4) 2659 ( 32.5)
8 + 0 ( 0.0) 7 ( 23.3) 243 ( 27.6) 1118 ( 21.7) 434( 20.5) 1802 ( 22.0)TOTAL 0( 0.0) 30( 0.4) 881( 10.8) 5144( 62.9) 2121( 25.9) 8176 (100.0)
Table 2.2.3.6.16: Hba1c (by Age, Type of Diabetes = Type 2)
CMH Chi-SquareValue One or more cells have 0 obs

2.2.3.6. HbA1c (last episode in 12 months)Type of Diabetes = Type 2
Hba1c Gender * AgeValid Value NV/NA
Valid Value ( % ) NV/NA ( % ) Valid Value ( % ) NV/NA ( % ) N ( % )Valid Value 0 ( 0.0) 0 ( 0.0) 0 ( 0.0) 531( 6.1) 531 ( 6.1)
NV/NA 0 ( 0.0) 0 ( 0.0) 0 ( 0.0) 8176( 93.9) 8176 ( 93.9)TOTAL 0( 0.0) 0( 0.0) 0( 0.0) 8707(100.0) 8707 (100.0)
Table 2.2.3.6.17: Missing Data Hba1c (by Gender * Age, Type of Diabetes = Type 2)
Hba1c Gender * Age[0 - 18) [18 - 35) [35 - 55) [55 - 75) [75+)
Male ( % ) Female ( % ) Male ( % ) Female ( % ) Male ( % ) Female ( % ) Male ( % ) Female ( % ) Male ( % ) Female ( % ) N ( % )[0 - 7) 0 ( 0.0) 0 ( 0.0) 14 ( 82.4) 8 ( 61.5) 152 ( 44.8) 238 ( 43.9) 936 ( 42.0) 1431 ( 49.1) 468 ( 40.4) 468( 48.6) 3715 ( 45.4)[7 - 8) 0 ( 0.0) 0 ( 0.0) 1 ( 5.9) 0 ( 0.0) 94 ( 27.7) 154 ( 28.4) 754 ( 33.8) 905 ( 31.1) 419 ( 36.2) 332( 34.5) 2659 ( 32.5)[8+) 0 ( 0.0) 0 ( 0.0) 2 ( 11.8) 5 ( 38.5) 93 ( 27.4) 150 ( 27.7) 540 ( 24.2) 578 ( 19.8) 272 ( 23.5) 162( 16.8) 1802 ( 22.0)
TOTAL 0( 0.0) 0( 0.0) 17( 0.2) 13( 0.2) 339( 4.1) 542( 6.6) 2230( 27.3) 2914( 35.6) 1159( 14.2) 962( 11.8) 8176 (100.0)
Table 2.2.3.6.18: Hba1c (by Gender * Age, Type of Diabetes = Type 2)
CMH Chi-SquareValue One or more cells have 0 obs

2.2.3.6. HbA1c (last episode in 12 months)Type of Diabetes = Other Type
Hba1c GenderValid Value ( % ) NV/NA ( % ) N ( % )
Valid Value 227 ( 61.9) 0( 0.0) 227 ( 61.9)NV/NA 140 ( 38.1) 0( 0.0) 140 ( 38.1)TOTAL 367(100.0) 0( 0.0) 367 (100.0)
Table 2.2.3.6.19: Missing Data Hba1c (by Gender, Type of Diabetes = Other Type)
Hba1c GenderMale ( % ) Female ( % ) N ( % )
0 - 5.9 39 ( 60.0) 119( 73.5) 158 ( 69.6)6 - 7.9 13 ( 20.0) 25( 15.4) 38 ( 16.7)
8 + 13 ( 20.0) 18( 11.1) 31 ( 13.7)TOTAL 65( 28.6) 162( 71.4) 227 (100.0)
Table 2.2.3.6.20: Hba1c (by Gender, Type of Diabetes = Other Type)
CMH Chi-Square p.value dfValue 4.4689 0.107 2

2.2.3.6. HbA1c (last episode in 12 months)Type of Diabetes = Other Type
Hba1c AgeValid Value ( % ) NV/NA ( % ) N ( % )
Valid Value 227 ( 61.9) 0( 0.0) 227 ( 61.9)NV/NA 140 ( 38.1) 0( 0.0) 140 ( 38.1)TOTAL 367(100.0) 0( 0.0) 367 (100.0)
Table 2.2.3.6.21: Missing Data Hba1c (by Age, Type of Diabetes = Other Type)
Hba1c Age[0 - 18) ( % ) [18 - 35) ( % ) [35 - 55) ( % ) [55 - 75) ( % ) [75+) ( % ) N ( % )
0 - 5.9 0 ( 0.0) 39 ( 86.7) 48 ( 78.7) 54 ( 58.7) 17( 58.6) 158 ( 69.6)6 - 7.9 0 ( 0.0) 4 ( 8.9) 7 ( 11.5) 19 ( 20.7) 8( 27.6) 38 ( 16.7)
8 + 0 ( 0.0) 2 ( 4.4) 6 ( 9.8) 19 ( 20.7) 4( 13.8) 31 ( 13.7)TOTAL 0( 0.0) 45( 19.8) 61( 26.9) 92( 40.5) 29( 12.8) 227 (100.0)
Table 2.2.3.6.22: Hba1c (by Age, Type of Diabetes = Other Type)
CMH Chi-SquareValue One or more cells have 0 obs

2.2.3.6. HbA1c (last episode in 12 months)Type of Diabetes = Other Type
Hba1c Gender * AgeValid Value NV/NA
Valid Value ( % ) NV/NA ( % ) Valid Value ( % ) NV/NA ( % ) N ( % )Valid Value 0 ( 0.0) 0 ( 0.0) 0 ( 0.0) 140( 38.1) 140 ( 38.1)
NV/NA 0 ( 0.0) 0 ( 0.0) 0 ( 0.0) 227( 61.9) 227 ( 61.9)TOTAL 0( 0.0) 0( 0.0) 0( 0.0) 367(100.0) 367 (100.0)
Table 2.2.3.6.23: Missing Data Hba1c (by Gender * Age, Type of Diabetes = Other Type)
Hba1c Gender * Age[0 - 18) [18 - 35) [35 - 55) [55 - 75) [75+)
Male ( % ) Female ( % ) Male ( % ) Female ( % ) Male ( % ) Female ( % ) Male ( % ) Female ( % ) Male ( % ) Female ( % ) N ( % )[0 - 7) 0 ( 0.0) 0 ( 0.0) 39 ( 86.7) 0 ( 0.0) 38 ( 80.9) 10 ( 71.4) 33 ( 62.3) 21 ( 53.8) 9 ( 52.9) 8( 66.7) 158 ( 69.6)[7 - 8) 0 ( 0.0) 0 ( 0.0) 4 ( 8.9) 0 ( 0.0) 6 ( 12.8) 1 ( 7.1) 11 ( 20.8) 8 ( 20.5) 4 ( 23.5) 4( 33.3) 38 ( 16.7)[8+) 0 ( 0.0) 0 ( 0.0) 2 ( 4.4) 0 ( 0.0) 3 ( 6.4) 3 ( 21.4) 9 ( 17.0) 10 ( 25.6) 4 ( 23.5) 0( 0.0) 31 ( 13.7)
TOTAL 0( 0.0) 0( 0.0) 45( 19.8) 0( 0.0) 47( 20.7) 14( 6.2) 53( 23.3) 39( 17.2) 17( 7.5) 12( 5.3) 227 (100.0)
Table 2.2.3.6.24: Hba1c (by Gender * Age, Type of Diabetes = Other Type)
CMH Chi-SquareValue One or more cells have 0 obs

2.2.3.6. HbA1c (last episode in 12 months)
●
●
Hba1c
Valid ValueNV/NA
Valid Value NV/NA
025
5075
100
Barplot: 2.2.3.6.1 - Missing Data Hba1c (by Type of Diabetes)
●
●
●
Hba1c
[0 − 7)[7 − 8)[8+)
Other Type Type 1 Type 2
025
5075
100
Barplot: 2.2.3.6.2 - Hba1c (by Type of Diabetes)
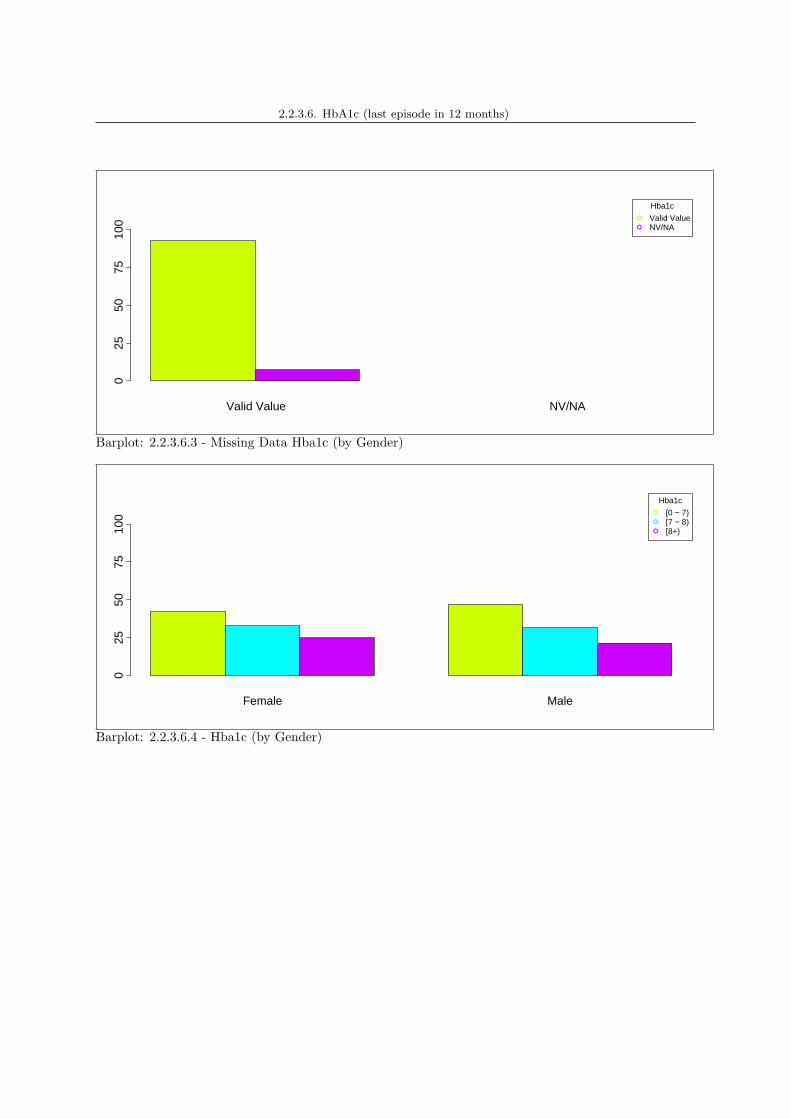
2.2.3.6. HbA1c (last episode in 12 months)
●
●
Hba1c
Valid ValueNV/NA
Valid Value NV/NA
025
5075
100
Barplot: 2.2.3.6.3 - Missing Data Hba1c (by Gender)
●
●
●
Hba1c
[0 − 7)[7 − 8)[8+)
Female Male
025
5075
100
Barplot: 2.2.3.6.4 - Hba1c (by Gender)

2.2.3.6. HbA1c (last episode in 12 months)
●
●
Hba1c
Valid ValueNV/NA
Valid Value NV/NA
025
5075
100
Barplot: 2.2.3.6.5 - Missing Data Hba1c (by Age)
●
●
●
Hba1c
[0 − 7)[7 − 8)[8+)
[0 − 18) [18 − 35) [35 − 55) [55 − 75) [75 +)
025
5075
100
Barplot: 2.2.3.6.6 - Hba1c (by Age)

2.2.3.6. HbA1c (last episode in 12 months)Type of Diabetes = Type 1
●
●
Hba1c
Valid ValueNV/NA
Valid Value NV/NA
025
5075
100
Barplot: 2.2.3.6.7 - Missing Data Hba1c (by Gender, Type of Diabetes = Type 1)
●
●
●
Hba1c
[0 − 7)[7 − 8)[8+)
Female Male
025
5075
100
Barplot: 2.2.3.6.8 - Hba1c (by Gender, Type of Diabetes = Type 1)

2.2.3.6. HbA1c (last episode in 12 months)Type of Diabetes = Type 1
●
●
Hba1c
Valid ValueNV/NA
Valid Value NV/NA
025
5075
100
Barplot: 2.2.3.6.9 - Missing Data Hba1c (by Age, Type of Diabetes = Type 1)
●
●
●
Hba1c
[0 − 7)[7 − 8)[8+)
[0 − 18) [18 − 35) [35 − 55) [55 − 75) [75 +)
025
5075
100
Barplot: 2.2.3.6.10 - Hba1c (by Age, Type of Diabetes = Type 1)

2.2.3.6. HbA1c (last episode in 12 months)Type of Diabetes = Type 2
●
●
Hba1c
Valid ValueNV/NA
Valid Value NV/NA
025
5075
100
Barplot: 2.2.3.6.11 - Missing Data Hba1c (by Gender, Type of Diabetes = Type 2)
●
●
●
Hba1c
[0 − 7)[7 − 8)[8+)
Female Male
025
5075
100
Barplot: 2.2.3.6.12 - Hba1c (by Gender, Type of Diabetes = Type 2)

2.2.3.6. HbA1c (last episode in 12 months)Type of Diabetes = Type 2
●
●
Hba1c
Valid ValueNV/NA
Valid Value NV/NA
025
5075
100
Barplot: 2.2.3.6.13 - Missing Data Hba1c (by Age, Type of Diabetes = Type 2)
●
●
●
Hba1c
[0 − 7)[7 − 8)[8+)
[0 − 18) [18 − 35) [35 − 55) [55 − 75) [75 +)
025
5075
100
Barplot: 2.2.3.6.14 - Hba1c (by Age, Type of Diabetes = Type 2)

2.2.3.6. HbA1c (last episode in 12 months)Type of Diabetes = Other Type
●
●
Hba1c
Valid ValueNV/NA
Valid Value NV/NA
025
5075
100
Barplot: 2.2.3.6.15 - Missing Data Hba1c (by Gender, Type of Diabetes = Other Type)
●
●
●
Hba1c
[0 − 7)[7 − 8)[8+)
Female Male
025
5075
100
Barplot: 2.2.3.6.16 - Hba1c (by Gender, Type of Diabetes = Other Type)

2.2.3.6. HbA1c (last episode in 12 months)Type of Diabetes = Other Type
●
●
Hba1c
Valid ValueNV/NA
Valid Value NV/NA
025
5075
100
Barplot: 2.2.3.6.17 - Missing Data Hba1c (by Age, Type of Diabetes = Other Type)
●
●
●
Hba1c
[0 − 7)[7 − 8)[8+)
[0 − 18) [18 − 35) [35 − 55) [55 − 75) [75 +)
025
5075
100
Barplot: 2.2.3.6.18 - Hba1c (by Age, Type of Diabetes = Other Type)

2.2.3.6. HbA1c (last episode in 12 months)Type of Diabetes = Type 1
hba1c_c sex age_c type_dm
Den
sity
0.0
0.2
0.4
0.6
0.8
4 6 8 10 12 14
Male[0 − 18)
Female[0 − 18)
Male[18 − 35)
0.0
0.2
0.4
0.6
0.8
Female[18 − 35)
0.0
0.2
0.4
0.6
0.8
Male[35 − 55)
Female[35 − 55)
Male[55 − 75)
0.0
0.2
0.4
0.6
0.8
Female[55 − 75)
0.0
0.2
0.4
0.6
0.8
Male[75+)
4 6 8 10 12 14
Female[75+)
Trellis Barplot: 2.2.3.6.19 - * Hba1c * Gender (Type of Diabetes = Type 1)
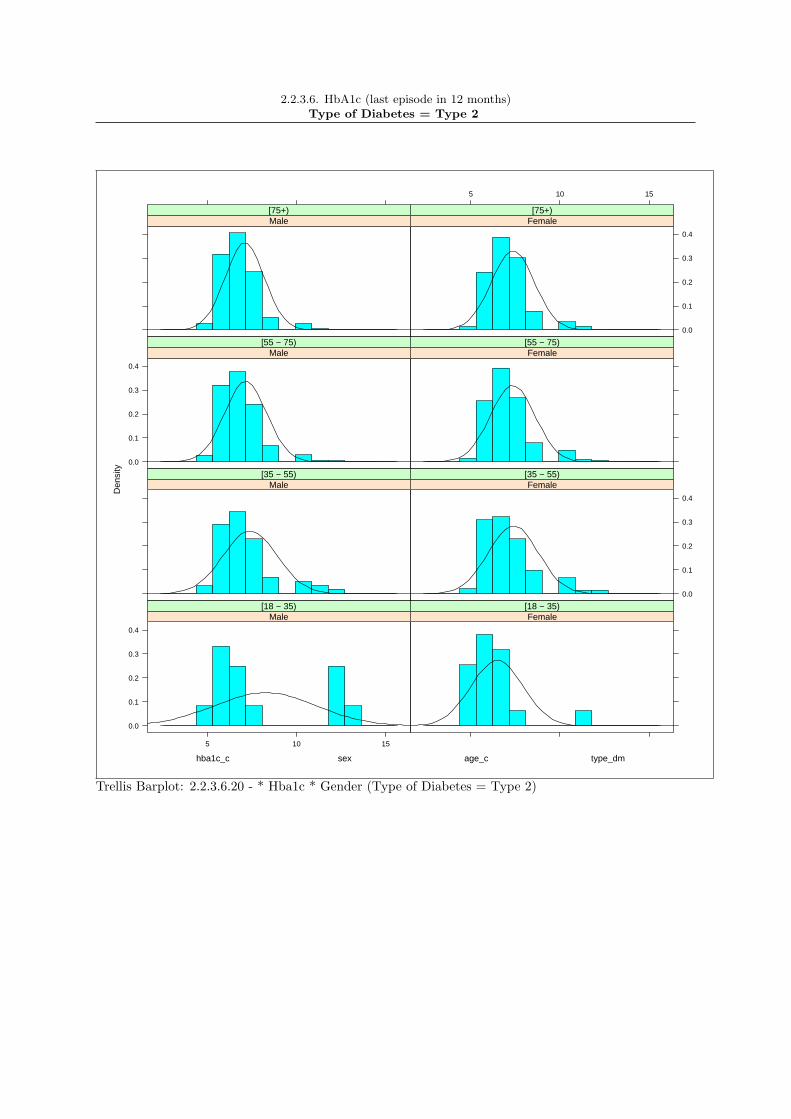
2.2.3.6. HbA1c (last episode in 12 months)Type of Diabetes = Type 2
hba1c_c sex age_c type_dm
Den
sity
0.0
0.1
0.2
0.3
0.4
5 10 15
Male[18 − 35)
Female[18 − 35)
Male[35 − 55)
0.0
0.1
0.2
0.3
0.4
Female[35 − 55)
0.0
0.1
0.2
0.3
0.4
Male[55 − 75)
Female[55 − 75)
Male[75+)
5 10 15
0.0
0.1
0.2
0.3
0.4
Female[75+)
Trellis Barplot: 2.2.3.6.20 - * Hba1c * Gender (Type of Diabetes = Type 2)

2.2.3.6. HbA1c (last episode in 12 months)Type of Diabetes = Other Type
hba1c_c sex age_c type_dm
Den
sity
0.0
0.1
0.2
0.3
0.4
0.5
5 10 15
Male[18 − 35)
Female[18 − 35)
Male[35 − 55)
0.0
0.1
0.2
0.3
0.4
0.5
Female[35 − 55)
0.0
0.1
0.2
0.3
0.4
0.5
Male[55 − 75)
Female[55 − 75)
Male[75+)
5 10 15
0.0
0.1
0.2
0.3
0.4
0.5
Female[75+)
Trellis Barplot: 2.2.3.6.21 - * Hba1c * Gender (Type of Diabetes = Other Type)

2.2.3.6. HbA1c (last episode in 12 months)
Type 1 Type 2 Other Type
46
810
1214
16
Boxplot: 2.2.3.6.1 - Hba1c (by Type of Diabetes)

2.2.3.6. HbA1c (last episode in 12 months)
Male Female
46
810
1214
16
Boxplot: 2.2.3.6.2 - Hba1c (by Gender)

2.2.3.6. HbA1c (last episode in 12 months)
[0 − 18) [18 − 35) [35 − 55) [55 − 75) [75+)
46
810
1214
16
Boxplot: 2.2.3.6.3 - Hba1c (by Age)

2.2.3.6. HbA1c (last episode in 12 months)Type of Diabetes = Type 1
Male Female
46
810
1214
Boxplot: 2.2.3.6.4 - Hba1c (by Gender, Type of Diabetes = Type 1)
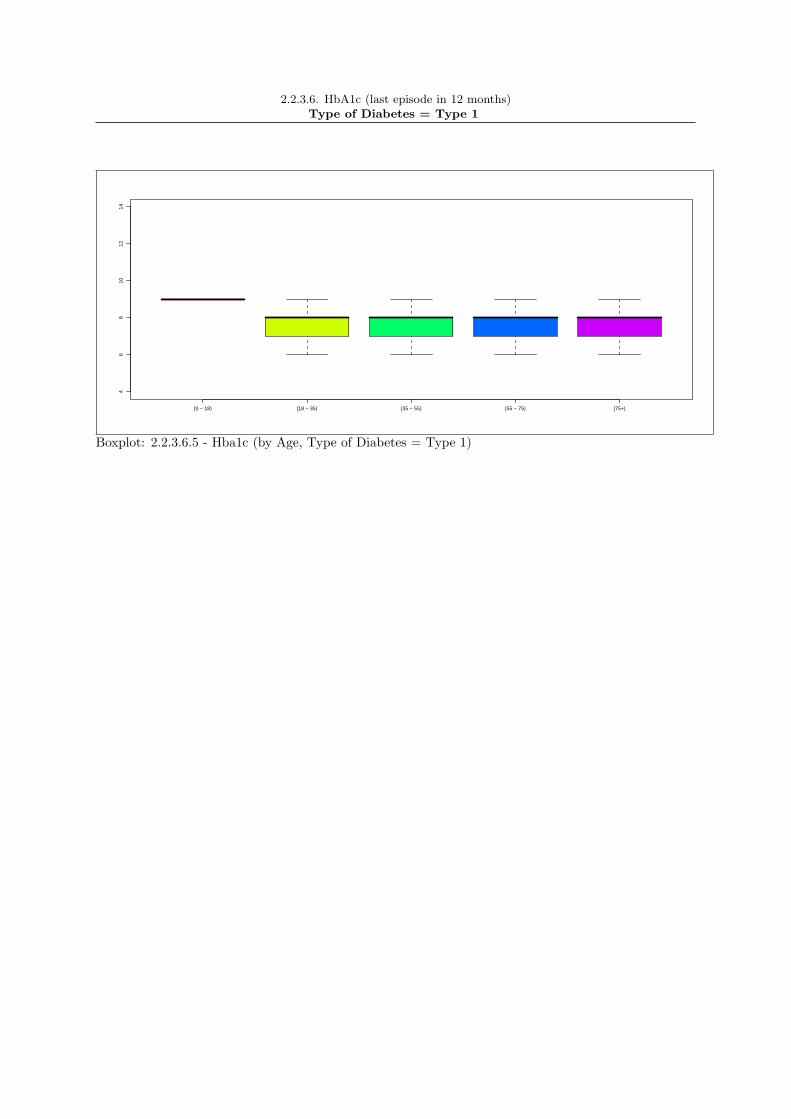
2.2.3.6. HbA1c (last episode in 12 months)Type of Diabetes = Type 1
[0 − 18) [18 − 35) [35 − 55) [55 − 75) [75+)
46
810
1214
Boxplot: 2.2.3.6.5 - Hba1c (by Age, Type of Diabetes = Type 1)

2.2.3.6. HbA1c (last episode in 12 months)Type of Diabetes = Type 2
Male Female
46
810
1214
Boxplot: 2.2.3.6.6 - Hba1c (by Gender, Type of Diabetes = Type 2)

2.2.3.6. HbA1c (last episode in 12 months)Type of Diabetes = Type 2
[0 − 18) [18 − 35) [35 − 55) [55 − 75)
46
810
1214
Boxplot: 2.2.3.6.7 - Hba1c (by Age, Type of Diabetes = Type 2)

2.2.3.6. HbA1c (last episode in 12 months)Type of Diabetes = Other Type
Male Female
46
810
1214
16
Boxplot: 2.2.3.6.8 - Hba1c (by Gender, Type of Diabetes = Other Type)
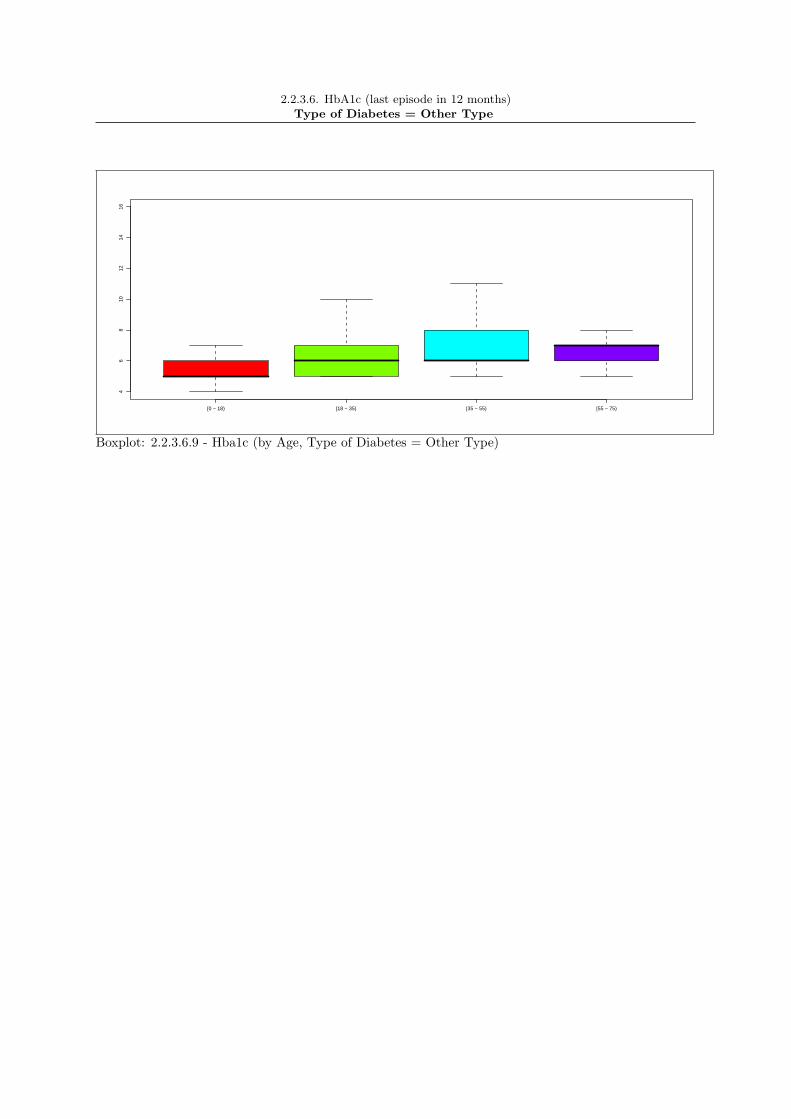
2.2.3.6. HbA1c (last episode in 12 months)Type of Diabetes = Other Type
[0 − 18) [18 − 35) [35 − 55) [55 − 75)
46
810
1214
16
Boxplot: 2.2.3.6.9 - Hba1c (by Age, Type of Diabetes = Other Type)

2.2.3.6. HbA1c (last episode in 12 months)Type of Diabetes = Type 1
hba1c_i
4 6 8 10 12 14
●
Male[0 − 18)
●
Female[0 − 18)
● ●●●●●● ● ●●● ●
Male[18 − 35)
●● ●●● ●● ●● ● ●
Female[18 − 35)
●● ● ●●● ●●●●● ●● ●
Male[35 − 55)
● ●●●●●●●● ●
Female[35 − 55)
● ●●●●●
Male[55 − 75)
●
Female[55 − 75)
●
Male[75+)
4 6 8 10 12 14
●
Female[75+)
Trellis Boxplot: 2.2.3.6.10 - Hba1c * Gender * Age (Type of Diabetes = Type 1)
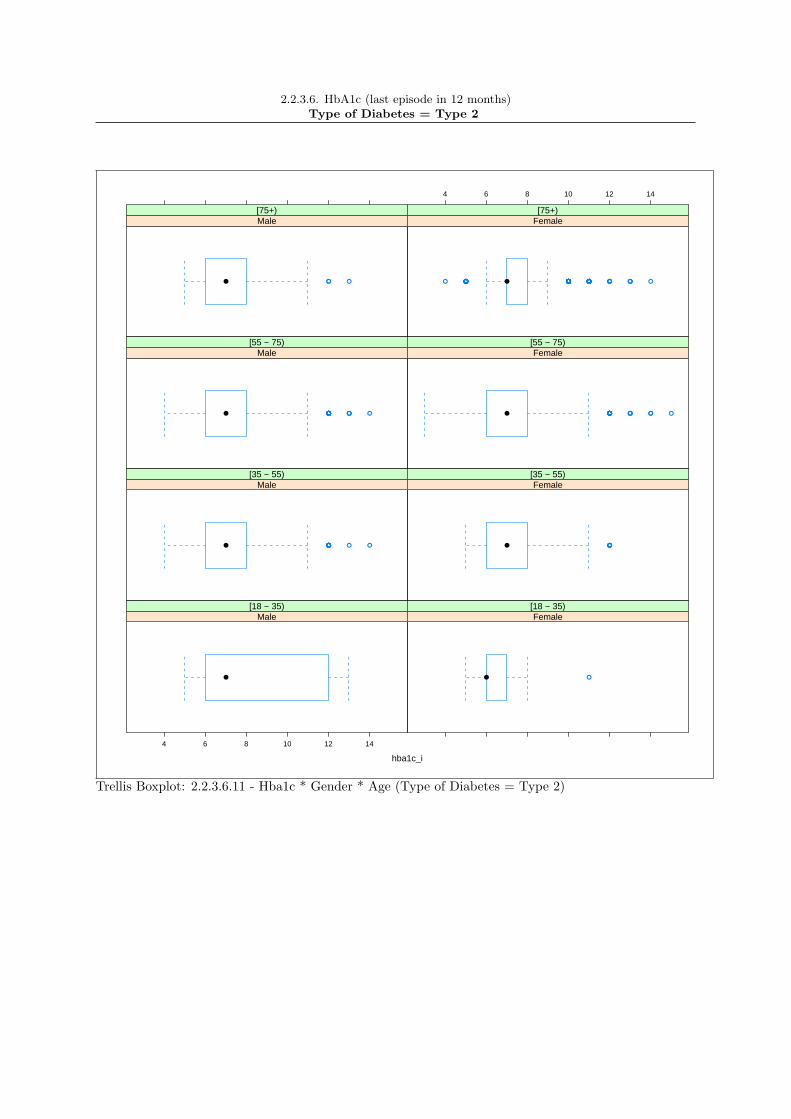
2.2.3.6. HbA1c (last episode in 12 months)Type of Diabetes = Type 2
hba1c_i
4 6 8 10 12 14
●
Male[18 − 35)
● ●
Female[18 − 35)
● ●●●●●●● ●●●● ●
Male[35 − 55)
● ●●●●●
Female[35 − 55)
● ●●●●●●●●●●●● ● ●●●●●● ●●
Male[55 − 75)
● ●● ●● ● ●● ●●●●● ●●●●●●●
Female[55 − 75)
● ●●●
Male[75+)
4 6 8 10 12 14
● ●●●●●● ●●●● ●● ●●●● ● ●● ●●●●●●●● ●●●●●●●●●●●●●●●●●●●●●● ●●●●●●● ●●●●●●●●●● ●●●●●● ●● ●●● ●
Female[75+)
Trellis Boxplot: 2.2.3.6.11 - Hba1c * Gender * Age (Type of Diabetes = Type 2)

2.2.3.6. HbA1c (last episode in 12 months)Type of Diabetes = Other Type
hba1c_i
4 6 8 10 12 14 16
Male[18 − 35)
● ●●●
Female[18 − 35)
● ●●
Male[35 − 55)
● ● ●●● ● ●
Female[35 − 55)
● ●
Male[55 − 75)
● ●
Female[55 − 75)
●
Male[75+)
4 6 8 10 12 14 16
●
Female[75+)
Trellis Boxplot: 2.2.3.6.12 - Hba1c * Gender * Age (Type of Diabetes = Other Type)

2.3. Diabetes complications
285

Chapter 3
Health System
286

3.1. Structure (provider level)
287

3.1.1 Type of Provider
centre id type dbname2 1 foligno2 1 spoleto2 1 orvieto2 1 gubbio2 1 perugia2 1 terni
288

3.1.2 Average diabetes population
Age Classes Type of DiabetesValid Value ( % ) NV/NA ( % ) N ( % )
Valid Value 9739 (100.0) 0( 0.0) 9739 (100.0)NV/NA 0 ( 0.0) 0( 0.0) 0 ( 0.0)TOTAL 9739(100.0) 0( 0.0) 9739 (100.0)
Table 3.1.2.1: Missing Data Age Classes (by Type of Diabetes)
Age Classes Type of DiabetesType 1 ( % ) Type 2 ( % ) Other Type ( % ) N ( % )
[0 - 10) 0 ( 0.0) 1 ( 0.0) 0( 0.0) 1 ( 0.0)[10 - 20) 12 ( 1.8) 1 ( 0.0) 3( 0.8) 16 ( 0.2)[20 - 30) 82 ( 12.3) 10 ( 0.1) 27( 7.4) 119 ( 1.2)[30 - 40) 151 ( 22.7) 70 ( 0.8) 89( 24.3) 310 ( 3.2)[40 - 50) 176 ( 26.5) 431 ( 5.0) 31( 8.4) 638 ( 6.6)[50 - 60) 127 ( 19.1) 1363 ( 15.7) 45( 12.3) 1535 ( 15.8)[60 - 70) 83 ( 12.5) 2951 ( 33.9) 85( 23.2) 3119 ( 32.0)[70 - 80) 29 ( 4.4) 2821 ( 32.4) 67( 18.3) 2917 ( 30.0)
[80+) 5 ( 0.8) 1059 ( 12.2) 20( 5.4) 1084 ( 11.1)TOTAL 665( 6.8) 8707( 89.4) 367( 3.8) 9739 (100.0)
Table 3.1.2.2: Age Classes (by Type of Diabetes)
CMH Chi-SquareValue One or more cells have 0 obs
289

3.1.2 Average diabetes population
Age Classes GenderValid Value ( % ) NV/NA ( % ) N ( % )
Valid Value 9739 (100.0) 0( 0.0) 9739 (100.0)NV/NA 0 ( 0.0) 0( 0.0) 0 ( 0.0)TOTAL 9739(100.0) 0( 0.0) 9739 (100.0)
Table 3.1.2.3: Missing Data Age Classes (by Gender)
Age Classes GenderMale ( % ) Female ( % ) N ( % )
[0 - 10) 0 ( 0.0) 1( 0.0) 1 ( 0.0)[10 - 20) 9 ( 0.2) 7( 0.2) 16 ( 0.2)[20 - 30) 48 ( 0.9) 71( 1.5) 119 ( 1.2)[30 - 40) 114 ( 2.2) 196( 4.3) 310 ( 3.2)[40 - 50) 373 ( 7.2) 265( 5.8) 638 ( 6.6)[50 - 60) 915 ( 17.7) 620( 13.5) 1535 ( 15.8)[60 - 70) 1746 ( 33.9) 1373( 30.0) 3119 ( 32.0)[70 - 80) 1498 ( 29.1) 1419( 31.0) 2917 ( 30.0)
[80+) 453 ( 8.8) 631( 13.8) 1084 ( 11.1)TOTAL 5156( 52.9) 4583( 47.1) 9739 (100.0)
Table 3.1.2.4: Age Classes (by Gender)
CMH Chi-SquareValue One or more cells have 0 obs

3.1.2 Average diabetes populationType of Diabetes = Type 1
Age Classes GenderValid Value ( % ) NV/NA ( % ) N ( % )
Valid Value 665 (100.0) 0( 0.0) 665 (100.0)NV/NA 0 ( 0.0) 0( 0.0) 0 ( 0.0)TOTAL 665(100.0) 0( 0.0) 665 (100.0)
Table 3.1.2.5: Missing Data Age Classes (by Gender, Type of Diabetes = Type 1)
Age Classes GenderMale ( % ) Female ( % ) N ( % )
[0 - 10) 0 ( 0.0) 0( 0.0) 0 ( 0.0)[10 - 20) 7 ( 2.0) 5( 1.6) 12 ( 1.8)[20 - 30) 43 ( 12.1) 39( 12.6) 82 ( 12.3)[30 - 40) 73 ( 20.5) 78( 25.2) 151 ( 22.7)[40 - 50) 97 ( 27.2) 79( 25.6) 176 ( 26.5)[50 - 60) 74 ( 20.8) 53( 17.2) 127 ( 19.1)[60 - 70) 47 ( 13.2) 36( 11.7) 83 ( 12.5)[70 - 80) 13 ( 3.7) 16( 5.2) 29 ( 4.4)
[80+) 2 ( 0.6) 3( 1.0) 5 ( 0.8)TOTAL 356( 53.5) 309( 46.5) 665 (100.0)
Table 3.1.2.6: Age Classes (by Gender, Type of Diabetes = Type 1)
CMH Chi-SquareValue One or more cells have 0 obs

3.1.2 Average diabetes populationType of Diabetes = Type 2
Age Classes GenderValid Value ( % ) NV/NA ( % ) N ( % )
Valid Value 8707 (100.0) 0( 0.0) 8707 (100.0)NV/NA 0 ( 0.0) 0( 0.0) 0 ( 0.0)TOTAL 8707(100.0) 0( 0.0) 8707 (100.0)
Table 3.1.2.7: Missing Data Age Classes (by Gender, Type of Diabetes = Type 2)
Age Classes GenderMale ( % ) Female ( % ) N ( % )
[0 - 10) 0 ( 0.0) 1( 0.0) 1 ( 0.0)[10 - 20) 1 ( 0.0) 0( 0.0) 1 ( 0.0)[20 - 30) 5 ( 0.1) 5( 0.1) 10 ( 0.1)[30 - 40) 41 ( 0.9) 29( 0.7) 70 ( 0.8)[40 - 50) 269 ( 5.7) 162( 4.0) 431 ( 5.0)[50 - 60) 819 ( 17.4) 544( 13.6) 1363 ( 15.7)[60 - 70) 1667 ( 35.5) 1284( 32.1) 2951 ( 33.9)[70 - 80) 1454 ( 30.9) 1367( 34.1) 2821 ( 32.4)
[80+) 445 ( 9.5) 614( 15.3) 1059 ( 12.2)TOTAL 4701( 54.0) 4006( 46.0) 8707 (100.0)
Table 3.1.2.8: Age Classes (by Gender, Type of Diabetes = Type 2)
CMH Chi-SquareValue One or more cells have 0 obs
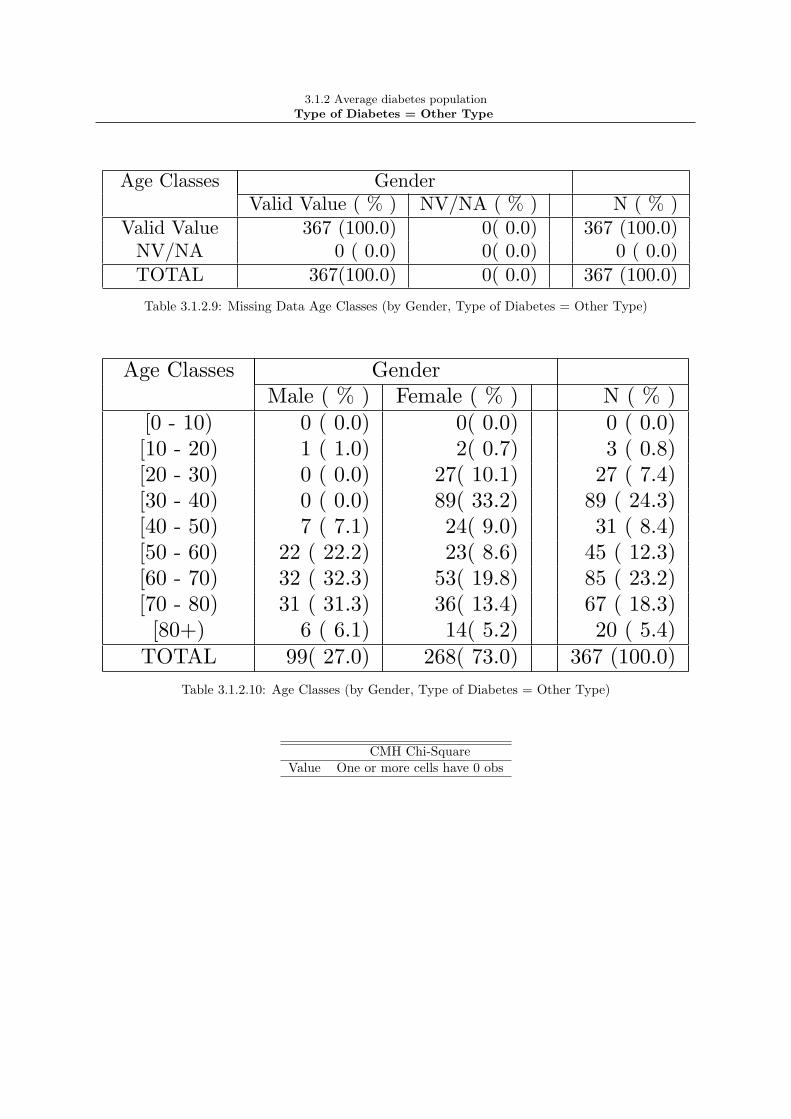
3.1.2 Average diabetes populationType of Diabetes = Other Type
Age Classes GenderValid Value ( % ) NV/NA ( % ) N ( % )
Valid Value 367 (100.0) 0( 0.0) 367 (100.0)NV/NA 0 ( 0.0) 0( 0.0) 0 ( 0.0)TOTAL 367(100.0) 0( 0.0) 367 (100.0)
Table 3.1.2.9: Missing Data Age Classes (by Gender, Type of Diabetes = Other Type)
Age Classes GenderMale ( % ) Female ( % ) N ( % )
[0 - 10) 0 ( 0.0) 0( 0.0) 0 ( 0.0)[10 - 20) 1 ( 1.0) 2( 0.7) 3 ( 0.8)[20 - 30) 0 ( 0.0) 27( 10.1) 27 ( 7.4)[30 - 40) 0 ( 0.0) 89( 33.2) 89 ( 24.3)[40 - 50) 7 ( 7.1) 24( 9.0) 31 ( 8.4)[50 - 60) 22 ( 22.2) 23( 8.6) 45 ( 12.3)[60 - 70) 32 ( 32.3) 53( 19.8) 85 ( 23.2)[70 - 80) 31 ( 31.3) 36( 13.4) 67 ( 18.3)
[80+) 6 ( 6.1) 14( 5.2) 20 ( 5.4)TOTAL 99( 27.0) 268( 73.0) 367 (100.0)
Table 3.1.2.10: Age Classes (by Gender, Type of Diabetes = Other Type)
CMH Chi-SquareValue One or more cells have 0 obs

3.2. Structural quality
294

3.2.1 Hospital beds per 100,000 population
year beds pop Rate2008 600 872964 68.73
295

3.2.2 Physicians employed per 100,000 population
year ds phisicians pop Rate2008 600 872964 68.73
296

3.3. Processes (individual level)
297
3.3.1. Foot examination
298

3.3.2. Eye examination
299
3.3.3 Measurements examination
300

3.3.3.1 BP (last episode in 12 months)
BP Exam Type of DiabetesValid Value ( % ) NV/NA ( % ) N ( % )
Valid Value 9739 (100.0) 0( 0.0) 9739 (100.0)NV/NA 0 ( 0.0) 0( 0.0) 0 ( 0.0)TOTAL 9739(100.0) 0( 0.0) 9739 (100.0)
Table 3.3.3.1.1: Missing Data BP Exam (by Type of Diabetes)
BP Exam Type of DiabetesType 1 ( % ) Type 2 ( % ) Other Type ( % ) N ( % )
Yes 249 ( 37.4) 5691 ( 65.4) 114( 31.1) 6054 ( 62.2)No 416 ( 62.6) 3016 ( 34.6) 253( 68.9) 3685 ( 37.8)
TOTAL 665( 6.8) 8707( 89.4) 367( 3.8) 9739 (100.0)
Table 3.3.3.1.2: BP Exam (by Type of Diabetes)
CMH Chi-Square p.value dfValue 361.5447 0 2
301

3.3.3.1 BP (last episode in 12 months)
BP Exam Age ClassesValid Value ( % ) NV/NA ( % ) N ( % )
Valid Value 9739 (100.0) 0( 0.0) 9739 (100.0)NV/NA 0 ( 0.0) 0( 0.0) 0 ( 0.0)TOTAL 9739(100.0) 0( 0.0) 9739 (100.0)
Table 3.3.3.1.3: Missing Data BP Exam (by Age Classes)
BP Exam Age Classes[0 - 18) ( % ) [18 - 35) ( % ) [35 - 55) ( % ) [55 - 75) ( % ) [75+) ( % ) N ( % )
Yes 1 ( 12.5) 86 ( 32.2) 775 ( 55.3) 3806 ( 66.2) 1386( 59.9) 6054 ( 62.2)No 7 ( 87.5) 181 ( 67.8) 626 ( 44.7) 1942 ( 33.8) 929( 40.1) 3685 ( 37.8)
TOTAL 8( 0.1) 267( 2.7) 1401( 14.4) 5748( 59.0) 2315( 23.8) 9739 (100.0)
Table 3.3.3.1.4: BP Exam (by Age Classes)
CMH Chi-Square p.value dfValue 183.4312 0 4

3.3.3.1 BP (last episode in 12 months)Type of Diabetes = Type 1
BP Exam Age ClassesValid Value ( % ) NV/NA ( % ) N ( % )
Valid Value 665 (100.0) 0( 0.0) 665 (100.0)NV/NA 0 ( 0.0) 0( 0.0) 0 ( 0.0)TOTAL 665(100.0) 0( 0.0) 665 (100.0)
Table 3.3.3.1.5: Missing Data BP Exam (by Age Classes, Type of Diabetes = Type 1)
BP Exam Age Classes[0 - 18) ( % ) [18 - 35) ( % ) [35 - 55) ( % ) [55 - 75) ( % ) [75+) ( % ) N ( % )
Yes 1 ( 20.0) 53 ( 32.7) 120 ( 36.6) 71 ( 44.9) 4( 33.3) 249 ( 37.4)No 4 ( 80.0) 109 ( 67.3) 208 ( 63.4) 87 ( 55.1) 8( 66.7) 416 ( 62.6)
TOTAL 5( 0.8) 162( 24.4) 328( 49.3) 158( 23.8) 12( 1.8) 665 (100.0)
Table 3.3.3.1.6: BP Exam (by Age Classes, Type of Diabetes = Type 1)
CMH Chi-Square p.value dfValue 6.1723 0.1866 4

3.3.3.1 BP (last episode in 12 months)Type of Diabetes = Type 2
BP Exam Age ClassesValid Value ( % ) NV/NA ( % ) N ( % )
Valid Value 8707 (100.0) 0( 0.0) 8707 (100.0)NV/NA 0 ( 0.0) 0( 0.0) 0 ( 0.0)TOTAL 8707(100.0) 0( 0.0) 8707 (100.0)
Table 3.3.3.1.7: Missing Data BP Exam (by Age Classes, Type of Diabetes = Type 2)
BP Exam Age Classes[0 - 18) ( % ) [18 - 35) ( % ) [35 - 55) ( % ) [55 - 75) ( % ) [75+) ( % ) N ( % )
Yes 0 ( 0.0) 19 ( 57.6) 630 ( 64.8) 3677 ( 67.6) 1365( 60.4) 5691 ( 65.4)No 1 (100.0) 14 ( 42.4) 342 ( 35.2) 1765 ( 32.4) 894( 39.6) 3016 ( 34.6)
TOTAL 1( 0.0) 33( 0.4) 972( 11.2) 5442( 62.5) 2259( 25.9) 8707 (100.0)
Table 3.3.3.1.8: BP Exam (by Age Classes, Type of Diabetes = Type 2)
CMH Chi-SquareValue One or more cells have 0 obs

3.3.3.1 BP (last episode in 12 months)Type of Diabetes = Other Type
BP Exam Age ClassesValid Value ( % ) NV/NA ( % ) N ( % )
Valid Value 367 (100.0) 0( 0.0) 367 (100.0)NV/NA 0 ( 0.0) 0( 0.0) 0 ( 0.0)TOTAL 367(100.0) 0( 0.0) 367 (100.0)Table 3.3.3.1.9: Missing Data BP Exam (by Age Classes, Type of Diabetes = Other Type)
BP Exam Age Classes[0 - 18) ( % ) [18 - 35) ( % ) [35 - 55) ( % ) [55 - 75) ( % ) [75+) ( % ) N ( % )
Yes 0 ( 0.0) 14 ( 19.4) 25 ( 24.8) 58 ( 39.2) 17( 38.6) 114 ( 31.1)No 2 (100.0) 58 ( 80.6) 76 ( 75.2) 90 ( 60.8) 27( 61.4) 253 ( 68.9)
TOTAL 2( 0.5) 72( 19.6) 101( 27.5) 148( 40.3) 44( 12.0) 367 (100.0)
Table 3.3.3.1.10: BP Exam (by Age Classes, Type of Diabetes = Other Type)
CMH Chi-SquareValue One or more cells have 0 obs

3.3.3.2 Lipids
Lipids Type of DiabetesValid Value ( % ) NV/NA ( % ) N ( % )
Valid Value 9739 (100.0) 0( 0.0) 9739 (100.0)NV/NA 0 ( 0.0) 0( 0.0) 0 ( 0.0)TOTAL 9739(100.0) 0( 0.0) 9739 (100.0)
Table 3.3.3.2.1: Missing Data Lipids (by Type of Diabetes)
Lipids Type of DiabetesType 1 ( % ) Type 2 ( % ) Other Type ( % ) N ( % )
Yes 410 ( 61.7) 6729 ( 77.3) 221( 60.2) 7360 ( 75.6)No 255 ( 38.3) 1978 ( 22.7) 146( 39.8) 2379 ( 24.4)
TOTAL 665( 6.8) 8707( 89.4) 367( 3.8) 9739 (100.0)
Table 3.3.3.2.2: Lipids (by Type of Diabetes)
CMH Chi-Square p.value dfValue 130.4478 0 2
306

3.3.3.2 Lipids
Lipids Age ClassesValid Value ( % ) NV/NA ( % ) N ( % )
Valid Value 9739 (100.0) 0( 0.0) 9739 (100.0)NV/NA 0 ( 0.0) 0( 0.0) 0 ( 0.0)TOTAL 9739(100.0) 0( 0.0) 9739 (100.0)
Table 3.3.3.2.3: Missing Data Lipids (by Age Classes)
Lipids Age Classes[0 - 18) ( % ) [18 - 35) ( % ) [35 - 55) ( % ) [55 - 75) ( % ) [75+) ( % ) N ( % )
Yes 3 ( 37.5) 133 ( 49.8) 1017 ( 72.6) 4523 ( 78.7) 1684( 72.7) 7360 ( 75.6)No 5 ( 62.5) 134 ( 50.2) 384 ( 27.4) 1225 ( 21.3) 631( 27.3) 2379 ( 24.4)
TOTAL 8( 0.1) 267( 2.7) 1401( 14.4) 5748( 59.0) 2315( 23.8) 9739 (100.0)
Table 3.3.3.2.4: Lipids (by Age Classes)
CMH Chi-Square p.value dfValue 149.2684 0 4

3.3.3.2 LipidsType of Diabetes = Type 1
Lipids Age ClassesValid Value ( % ) NV/NA ( % ) N ( % )
Valid Value 665 (100.0) 0( 0.0) 665 (100.0)NV/NA 0 ( 0.0) 0( 0.0) 0 ( 0.0)TOTAL 665(100.0) 0( 0.0) 665 (100.0)
Table 3.3.3.2.5: Missing Data Lipids (by Age Classes, Type of Diabetes = Type 1)
Lipids Age Classes[0 - 18) ( % ) [18 - 35) ( % ) [35 - 55) ( % ) [55 - 75) ( % ) [75+) ( % ) N ( % )
Yes 1 ( 20.0) 94 ( 58.0) 201 ( 61.3) 107 ( 67.7) 7( 58.3) 410 ( 61.7)No 4 ( 80.0) 68 ( 42.0) 127 ( 38.7) 51 ( 32.3) 5( 41.7) 255 ( 38.3)
TOTAL 5( 0.8) 162( 24.4) 328( 49.3) 158( 23.8) 12( 1.8) 665 (100.0)
Table 3.3.3.2.6: Lipids (by Age Classes, Type of Diabetes = Type 1)
CMH Chi-Square p.value dfValue 7.1077 0.1303 4

3.3.3.2 LipidsType of Diabetes = Type 2
Lipids Age ClassesValid Value ( % ) NV/NA ( % ) N ( % )
Valid Value 8707 (100.0) 0( 0.0) 8707 (100.0)NV/NA 0 ( 0.0) 0( 0.0) 0 ( 0.0)TOTAL 8707(100.0) 0( 0.0) 8707 (100.0)
Table 3.3.3.2.7: Missing Data Lipids (by Age Classes, Type of Diabetes = Type 2)
Lipids Age Classes[0 - 18) ( % ) [18 - 35) ( % ) [35 - 55) ( % ) [55 - 75) ( % ) [75+) ( % ) N ( % )
Yes 1 (100.0) 24 ( 72.7) 767 ( 78.9) 4300 ( 79.0) 1637( 72.5) 6729 ( 77.3)No 0 ( 0.0) 9 ( 27.3) 205 ( 21.1) 1142 ( 21.0) 622( 27.5) 1978 ( 22.7)
TOTAL 1( 0.0) 33( 0.4) 972( 11.2) 5442( 62.5) 2259( 25.9) 8707 (100.0)
Table 3.3.3.2.8: Lipids (by Age Classes, Type of Diabetes = Type 2)
CMH Chi-SquareValue One or more cells have 0 obs

3.3.3.2 LipidsType of Diabetes = Other Type
Lipids Age ClassesValid Value ( % ) NV/NA ( % ) N ( % )
Valid Value 367 (100.0) 0( 0.0) 367 (100.0)NV/NA 0 ( 0.0) 0( 0.0) 0 ( 0.0)TOTAL 367(100.0) 0( 0.0) 367 (100.0)
Table 3.3.3.2.9: Missing Data Lipids (by Age Classes, Type of Diabetes = Other Type)
Lipids Age Classes[0 - 18) ( % ) [18 - 35) ( % ) [35 - 55) ( % ) [55 - 75) ( % ) [75+) ( % ) N ( % )
Yes 1 ( 50.0) 15 ( 20.8) 49 ( 48.5) 116 ( 78.4) 40( 90.9) 221 ( 60.2)No 1 ( 50.0) 57 ( 79.2) 52 ( 51.5) 32 ( 21.6) 4( 9.1) 146 ( 39.8)
TOTAL 2( 0.5) 72( 19.6) 101( 27.5) 148( 40.3) 44( 12.0) 367 (100.0)
Table 3.3.3.2.10: Lipids (by Age Classes, Type of Diabetes = Other Type)
CMH Chi-Square p.value dfValue 90.1576 0 4

3.3.3.4 HbA1c (last episode in 12 months)
Hba1c done Type of DiabetesValid Value ( % ) NV/NA ( % ) N ( % )
Valid Value 9739 (100.0) 0( 0.0) 9739 (100.0)NV/NA 0 ( 0.0) 0( 0.0) 0 ( 0.0)TOTAL 9739(100.0) 0( 0.0) 9739 (100.0)
Table 3.3.3.4.1: Missing Data Hba1c done (by Type of Diabetes)
Hba1c done Type of DiabetesType 1 ( % ) Type 2 ( % ) Other Type ( % ) N ( % )
Yes 621 ( 93.4) 8176 ( 93.9) 227( 61.9) 9024 ( 92.7)No 44 ( 6.6) 531 ( 6.1) 140( 38.1) 715 ( 7.3)
TOTAL 665( 6.8) 8707( 89.4) 367( 3.8) 9739 (100.0)
Table 3.3.3.4.2: Hba1c done (by Type of Diabetes)
CMH Chi-Square p.value dfValue 532.2649 0 2
311

3.3.3.4 HbA1c (last episode in 12 months)
Hba1c done Age ClassesValid Value ( % ) NV/NA ( % ) N ( % )
Valid Value 9739 (100.0) 0( 0.0) 9739 (100.0)NV/NA 0 ( 0.0) 0( 0.0) 0 ( 0.0)TOTAL 9739(100.0) 0( 0.0) 9739 (100.0)
Table 3.3.3.4.3: Missing Data Hba1c done (by Age Classes)
Hba1c done Age Classes[0 - 18) ( % ) [18 - 35) ( % ) [35 - 55) ( % ) [55 - 75) ( % ) [75+) ( % ) N ( % )
Yes 5 ( 62.5) 223 ( 83.5) 1248 ( 89.1) 5387 ( 93.7) 2161( 93.3) 9024 ( 92.7)No 3 ( 37.5) 44 ( 16.5) 153 ( 10.9) 361 ( 6.3) 154( 6.7) 715 ( 7.3)
TOTAL 8( 0.1) 267( 2.7) 1401( 14.4) 5748( 59.0) 2315( 23.8) 9739 (100.0)
Table 3.3.3.4.4: Hba1c done (by Age Classes)
CMH Chi-Square p.value dfValue 80.9844 0 4

3.3.3.4 HbA1c (last episode in 12 months)Type of Diabetes = Type 1
Hba1c done Age ClassesValid Value ( % ) NV/NA ( % ) N ( % )
Valid Value 665 (100.0) 0( 0.0) 665 (100.0)NV/NA 0 ( 0.0) 0( 0.0) 0 ( 0.0)TOTAL 665(100.0) 0( 0.0) 665 (100.0)
Table 3.3.3.4.5: Missing Data Hba1c done (by Age Classes, Type of Diabetes = Type 1)
Hba1c done Age Classes[0 - 18) ( % ) [18 - 35) ( % ) [35 - 55) ( % ) [55 - 75) ( % ) [75+) ( % ) N ( % )
Yes 5 (100.0) 148 ( 91.4) 306 ( 93.3) 151 ( 95.6) 11( 91.7) 621 ( 93.4)No 0 ( 0.0) 14 ( 8.6) 22 ( 6.7) 7 ( 4.4) 1( 8.3) 44 ( 6.6)
TOTAL 5( 0.8) 162( 24.4) 328( 49.3) 158( 23.8) 12( 1.8) 665 (100.0)
Table 3.3.3.4.6: Hba1c done (by Age Classes, Type of Diabetes = Type 1)
CMH Chi-SquareValue One or more cells have 0 obs

3.3.3.4 HbA1c (last episode in 12 months)Type of Diabetes = Type 2
Hba1c done Age ClassesValid Value ( % ) NV/NA ( % ) N ( % )
Valid Value 8707 (100.0) 0( 0.0) 8707 (100.0)NV/NA 0 ( 0.0) 0( 0.0) 0 ( 0.0)TOTAL 8707(100.0) 0( 0.0) 8707 (100.0)
Table 3.3.3.4.7: Missing Data Hba1c done (by Age Classes, Type of Diabetes = Type 2)
Hba1c done Age Classes[0 - 18) ( % ) [18 - 35) ( % ) [35 - 55) ( % ) [55 - 75) ( % ) [75+) ( % ) N ( % )
Yes 0 ( 0.0) 30 ( 90.9) 881 ( 90.6) 5144 ( 94.5) 2121( 93.9) 8176 ( 93.9)No 1 (100.0) 3 ( 9.1) 91 ( 9.4) 298 ( 5.5) 138( 6.1) 531 ( 6.1)
TOTAL 1( 0.0) 33( 0.4) 972( 11.2) 5442( 62.5) 2259( 25.9) 8707 (100.0)
Table 3.3.3.4.8: Hba1c done (by Age Classes, Type of Diabetes = Type 2)
CMH Chi-SquareValue One or more cells have 0 obs

3.3.3.4 HbA1c (last episode in 12 months)Type of Diabetes = Other Type
Hba1c done Age ClassesValid Value ( % ) NV/NA ( % ) N ( % )
Valid Value 367 (100.0) 0( 0.0) 367 (100.0)NV/NA 0 ( 0.0) 0( 0.0) 0 ( 0.0)TOTAL 367(100.0) 0( 0.0) 367 (100.0)
Table 3.3.3.4.9: Missing Data Hba1c done (by Age Classes, Type of Diabetes = Other Type)
Hba1c done Age Classes[0 - 18) ( % ) [18 - 35) ( % ) [35 - 55) ( % ) [55 - 75) ( % ) [75+) ( % ) N ( % )
Yes 0 ( 0.0) 45 ( 62.5) 61 ( 60.4) 92 ( 62.2) 29( 65.9) 227 ( 61.9)No 2 (100.0) 27 ( 37.5) 40 ( 39.6) 56 ( 37.8) 15( 34.1) 140 ( 38.1)
TOTAL 2( 0.5) 72( 19.6) 101( 27.5) 148( 40.3) 44( 12.0) 367 (100.0)
Table 3.3.3.4.10: Hba1c done (by Age Classes, Type of Diabetes = Other Type)
CMH Chi-SquareValue One or more cells have 0 obs
3.3.4 Treatment
316

3.3.4.1 Antihypertensive Medication (last episode in 12 months)
317

3.3.4.2 Lipid Lowering Medication (last episode in 12 months)
318

3.3.4.3 ASA Medication (last episode in 12 months)
319

3.3.4.4.1 Glucose Lowering: Diet Only (last episode in 12 months)
Diet only Type of DiabetesValid Value ( % ) NV/NA ( % ) N ( % )
Valid Value 9739 (100.0) 0( 0.0) 9739 (100.0)NV/NA 0 ( 0.0) 0( 0.0) 0 ( 0.0)TOTAL 9739(100.0) 0( 0.0) 9739 (100.0)
Table 3.3.4.4.1.1: Missing Data Diet only (by Type of Diabetes)
Diet only Type of DiabetesType 1 ( % ) Type 2 ( % ) Other Type ( % ) N ( % )
Yes 26 ( 3.9) 2671 ( 30.7) 180( 49.0) 2877 ( 29.5)No 639 ( 96.1) 6036 ( 69.3) 187( 51.0) 6862 ( 70.5)
TOTAL 665( 6.8) 8707( 89.4) 367( 3.8) 9739 (100.0)
Table 3.3.4.4.1.2: Diet only (by Type of Diabetes)
CMH Chi-Square p.value dfValue 282.3693 0 2
320

3.3.4.4.1 Glucose Lowering: Diet Only (last episode in 12 months)
Diet only Age ClassesValid Value ( % ) NV/NA ( % ) N ( % )
Valid Value 9739 (100.0) 0( 0.0) 9739 (100.0)NV/NA 0 ( 0.0) 0( 0.0) 0 ( 0.0)TOTAL 9739(100.0) 0( 0.0) 9739 (100.0)
Table 3.3.4.4.1.3: Missing Data Diet only (by Age Classes)
Diet only Age Classes[0 - 18) ( % ) [18 - 35) ( % ) [35 - 55) ( % ) [55 - 75) ( % ) [75+) ( % ) N ( % )
Yes 3 ( 37.5) 42 ( 15.7) 457 ( 32.6) 1857 ( 32.3) 518( 22.4) 2877 ( 29.5)No 5 ( 62.5) 225 ( 84.3) 944 ( 67.4) 3891 ( 67.7) 1797( 77.6) 6862 ( 70.5)
TOTAL 8( 0.1) 267( 2.7) 1401( 14.4) 5748( 59.0) 2315( 23.8) 9739 (100.0)
Table 3.3.4.4.1.4: Diet only (by Age Classes)
CMH Chi-Square p.value dfValue 109.3171 0 4

3.3.4.4.1 Glucose Lowering: Diet Only (last episode in 12 months)Type of Diabetes = Type 1
Diet only Age ClassesValid Value ( % ) NV/NA ( % ) N ( % )
Valid Value 665 (100.0) 0( 0.0) 665 (100.0)NV/NA 0 ( 0.0) 0( 0.0) 0 ( 0.0)TOTAL 665(100.0) 0( 0.0) 665 (100.0)
Table 3.3.4.4.1.5: Missing Data Diet only (by Age Classes, Type of Diabetes = Type 1)
Diet only Age Classes[0 - 18) ( % ) [18 - 35) ( % ) [35 - 55) ( % ) [55 - 75) ( % ) [75+) ( % ) N ( % )
Yes 0 ( 0.0) 8 ( 4.9) 14 ( 4.3) 3 ( 1.9) 1( 8.3) 26 ( 3.9)No 5 (100.0) 154 ( 95.1) 314 ( 95.7) 155 ( 98.1) 11( 91.7) 639 ( 96.1)
TOTAL 5( 0.8) 162( 24.4) 328( 49.3) 158( 23.8) 12( 1.8) 665 (100.0)
Table 3.3.4.4.1.6: Diet only (by Age Classes, Type of Diabetes = Type 1)
CMH Chi-SquareValue One or more cells have 0 obs

3.3.4.4.1 Glucose Lowering: Diet Only (last episode in 12 months)Type of Diabetes = Type 2
Diet only Age ClassesValid Value ( % ) NV/NA ( % ) N ( % )
Valid Value 8707 (100.0) 0( 0.0) 8707 (100.0)NV/NA 0 ( 0.0) 0( 0.0) 0 ( 0.0)TOTAL 8707(100.0) 0( 0.0) 8707 (100.0)
Table 3.3.4.4.1.7: Missing Data Diet only (by Age Classes, Type of Diabetes = Type 2)
Diet only Age Classes[0 - 18) ( % ) [18 - 35) ( % ) [35 - 55) ( % ) [55 - 75) ( % ) [75+) ( % ) N ( % )
Yes 1 (100.0) 15 ( 45.5) 401 ( 41.3) 1762 ( 32.4) 492( 21.8) 2671 ( 30.7)No 0 ( 0.0) 18 ( 54.5) 571 ( 58.7) 3680 ( 67.6) 1767( 78.2) 6036 ( 69.3)
TOTAL 1( 0.0) 33( 0.4) 972( 11.2) 5442( 62.5) 2259( 25.9) 8707 (100.0)
Table 3.3.4.4.1.8: Diet only (by Age Classes, Type of Diabetes = Type 2)
CMH Chi-SquareValue One or more cells have 0 obs

3.3.4.4.1 Glucose Lowering: Diet Only (last episode in 12 months)Type of Diabetes = Other Type
Diet only Age ClassesValid Value ( % ) NV/NA ( % ) N ( % )
Valid Value 367 (100.0) 0( 0.0) 367 (100.0)NV/NA 0 ( 0.0) 0( 0.0) 0 ( 0.0)TOTAL 367(100.0) 0( 0.0) 367 (100.0)Table 3.3.4.4.1.9: Missing Data Diet only (by Age Classes, Type of Diabetes = Other Type)
Diet only Age Classes[0 - 18) ( % ) [18 - 35) ( % ) [35 - 55) ( % ) [55 - 75) ( % ) [75+) ( % ) N ( % )
Yes 2 (100.0) 19 ( 26.4) 42 ( 41.6) 92 ( 62.2) 25( 56.8) 180 ( 49.0)No 0 ( 0.0) 53 ( 73.6) 59 ( 58.4) 56 ( 37.8) 19( 43.2) 187 ( 51.0)
TOTAL 2( 0.5) 72( 19.6) 101( 27.5) 148( 40.3) 44( 12.0) 367 (100.0)
Table 3.3.4.4.1.10: Diet only (by Age Classes, Type of Diabetes = Other Type)
CMH Chi-SquareValue One or more cells have 0 obs

3.3.4.4.2 Glucose Lowering: Tablets Only (last episode in 12 months)
Tablets Only Type of DiabetesValid Value ( % ) NV/NA ( % ) N ( % )
Valid Value 9739 (100.0) 0( 0.0) 9739 (100.0)NV/NA 0 ( 0.0) 0( 0.0) 0 ( 0.0)TOTAL 9739(100.0) 0( 0.0) 9739 (100.0)
Table 3.3.4.4.2.1: Missing Data Tablets Only (by Type of Diabetes)
Tablets Only Type of DiabetesType 1 ( % ) Type 2 ( % ) Other Type ( % ) N ( % )
Yes 10 ( 1.5) 2727 ( 31.3) 33( 9.0) 2770 ( 28.4)No 655 ( 98.5) 5980 ( 68.7) 334( 91.0) 6969 ( 71.6)
TOTAL 665( 6.8) 8707( 89.4) 367( 3.8) 9739 (100.0)
Table 3.3.4.4.2.2: Tablets Only (by Type of Diabetes)
CMH Chi-Square p.value dfValue 340.7462 0 2
325

3.3.4.4.2 Glucose Lowering: Tablets Only (last episode in 12 months)
Tablets Only Age ClassesValid Value ( % ) NV/NA ( % ) N ( % )
Valid Value 9739 (100.0) 0( 0.0) 9739 (100.0)NV/NA 0 ( 0.0) 0( 0.0) 0 ( 0.0)TOTAL 9739(100.0) 0( 0.0) 9739 (100.0)
Table 3.3.4.4.2.3: Missing Data Tablets Only (by Age Classes)
Tablets Only Age Classes[0 - 18) ( % ) [18 - 35) ( % ) [35 - 55) ( % ) [55 - 75) ( % ) [75+) ( % ) N ( % )
Yes 0 ( 0.0) 7 ( 2.6) 263 ( 18.8) 1741 ( 30.3) 759( 32.8) 2770 ( 28.4)No 8 (100.0) 260 ( 97.4) 1138 ( 81.2) 4007 ( 69.7) 1556( 67.2) 6969 ( 71.6)
TOTAL 8( 0.1) 267( 2.7) 1401( 14.4) 5748( 59.0) 2315( 23.8) 9739 (100.0)
Table 3.3.4.4.2.4: Tablets Only (by Age Classes)
CMH Chi-SquareValue One or more cells have 0 obs

3.3.4.4.2 Glucose Lowering: Tablets Only (last episode in 12 months)Type of Diabetes = Type 1
Tablets Only Age ClassesValid Value ( % ) NV/NA ( % ) N ( % )
Valid Value 665 (100.0) 0( 0.0) 665 (100.0)NV/NA 0 ( 0.0) 0( 0.0) 0 ( 0.0)TOTAL 665(100.0) 0( 0.0) 665 (100.0)
Table 3.3.4.4.2.5: Missing Data Tablets Only (by Age Classes, Type of Diabetes = Type 1)
Tablets Only Age Classes[0 - 18) ( % ) [18 - 35) ( % ) [35 - 55) ( % ) [55 - 75) ( % ) [75+) ( % ) N ( % )
Yes 0 ( 0.0) 1 ( 0.6) 2 ( 0.6) 6 ( 3.8) 1( 8.3) 10 ( 1.5)No 5 (100.0) 161 ( 99.4) 326 ( 99.4) 152 ( 96.2) 11( 91.7) 655 ( 98.5)
TOTAL 5( 0.8) 162( 24.4) 328( 49.3) 158( 23.8) 12( 1.8) 665 (100.0)
Table 3.3.4.4.2.6: Tablets Only (by Age Classes, Type of Diabetes = Type 1)
CMH Chi-SquareValue One or more cells have 0 obs

3.3.4.4.2 Glucose Lowering: Tablets Only (last episode in 12 months)Type of Diabetes = Type 2
Tablets Only Age ClassesValid Value ( % ) NV/NA ( % ) N ( % )
Valid Value 8707 (100.0) 0( 0.0) 8707 (100.0)NV/NA 0 ( 0.0) 0( 0.0) 0 ( 0.0)TOTAL 8707(100.0) 0( 0.0) 8707 (100.0)
Table 3.3.4.4.2.7: Missing Data Tablets Only (by Age Classes, Type of Diabetes = Type 2)
Tablets Only Age Classes[0 - 18) ( % ) [18 - 35) ( % ) [35 - 55) ( % ) [55 - 75) ( % ) [75+) ( % ) N ( % )
Yes 0 ( 0.0) 4 ( 12.1) 255 ( 26.2) 1720 ( 31.6) 748( 33.1) 2727 ( 31.3)No 1 (100.0) 29 ( 87.9) 717 ( 73.8) 3722 ( 68.4) 1511( 66.9) 5980 ( 68.7)
TOTAL 1( 0.0) 33( 0.4) 972( 11.2) 5442( 62.5) 2259( 25.9) 8707 (100.0)
Table 3.3.4.4.2.8: Tablets Only (by Age Classes, Type of Diabetes = Type 2)
CMH Chi-SquareValue One or more cells have 0 obs

3.3.4.4.2 Glucose Lowering: Tablets Only (last episode in 12 months)Type of Diabetes = Other Type
Tablets Only Age ClassesValid Value ( % ) NV/NA ( % ) N ( % )
Valid Value 367 (100.0) 0( 0.0) 367 (100.0)NV/NA 0 ( 0.0) 0( 0.0) 0 ( 0.0)TOTAL 367(100.0) 0( 0.0) 367 (100.0)
Table 3.3.4.4.2.9: Missing Data Tablets Only (by Age Classes, Type of Diabetes = Other Type)
Tablets Only Age Classes[0 - 18) ( % ) [18 - 35) ( % ) [35 - 55) ( % ) [55 - 75) ( % ) [75+) ( % ) N ( % )
Yes 0 ( 0.0) 2 ( 2.8) 6 ( 5.9) 15 ( 10.1) 10( 22.7) 33 ( 9.0)No 2 (100.0) 70 ( 97.2) 95 ( 94.1) 133 ( 89.9) 34( 77.3) 334 ( 91.0)
TOTAL 2( 0.5) 72( 19.6) 101( 27.5) 148( 40.3) 44( 12.0) 367 (100.0)
Table 3.3.4.4.2.10: Tablets Only (by Age Classes, Type of Diabetes = Other Type)
CMH Chi-SquareValue One or more cells have 0 obs

3.3.4.4.3 Glucose Lowering: Insulin Only (last episode in 12 months)
Insulin Only Type of DiabetesValid Value ( % ) NV/NA ( % ) N ( % )
Valid Value 9739 (100.0) 0( 0.0) 9739 (100.0)NV/NA 0 ( 0.0) 0( 0.0) 0 ( 0.0)TOTAL 9739(100.0) 0( 0.0) 9739 (100.0)
Table 3.3.4.4.3.1: Missing Data Insulin Only (by Type of Diabetes)
Insulin Only Type of DiabetesType 1 ( % ) Type 2 ( % ) Other Type ( % ) N ( % )
Yes 600 ( 90.2) 1811 ( 20.8) 139( 37.9) 2550 ( 26.2)No 65 ( 9.8) 6896 ( 79.2) 228( 62.1) 7189 ( 73.8)
TOTAL 665( 6.8) 8707( 89.4) 367( 3.8) 9739 (100.0)
Table 3.3.4.4.3.2: Insulin Only (by Type of Diabetes)
CMH Chi-Square p.value dfValue 1567.6947 0 2
330

3.3.4.4.3 Glucose Lowering: Insulin Only (last episode in 12 months)
Insulin Only Age ClassesValid Value ( % ) NV/NA ( % ) N ( % )
Valid Value 9739 (100.0) 0( 0.0) 9739 (100.0)NV/NA 0 ( 0.0) 0( 0.0) 0 ( 0.0)TOTAL 9739(100.0) 0( 0.0) 9739 (100.0)
Table 3.3.4.4.3.3: Missing Data Insulin Only (by Age Classes)
Insulin Only Age Classes[0 - 18) ( % ) [18 - 35) ( % ) [35 - 55) ( % ) [55 - 75) ( % ) [75+) ( % ) N ( % )
Yes 5 ( 62.5) 216 ( 80.9) 533 ( 38.0) 1221 ( 21.2) 575( 24.8) 2550 ( 26.2)No 3 ( 37.5) 51 ( 19.1) 868 ( 62.0) 4527 ( 78.8) 1740( 75.2) 7189 ( 73.8)
TOTAL 8( 0.1) 267( 2.7) 1401( 14.4) 5748( 59.0) 2315( 23.8) 9739 (100.0)
Table 3.3.4.4.3.4: Insulin Only (by Age Classes)
CMH Chi-Square p.value dfValue 595.7856 0 4

3.3.4.4.3 Glucose Lowering: Insulin Only (last episode in 12 months)Type of Diabetes = Type 1
Insulin Only Age ClassesValid Value ( % ) NV/NA ( % ) N ( % )
Valid Value 665 (100.0) 0( 0.0) 665 (100.0)NV/NA 0 ( 0.0) 0( 0.0) 0 ( 0.0)TOTAL 665(100.0) 0( 0.0) 665 (100.0)
Table 3.3.4.4.3.5: Missing Data Insulin Only (by Age Classes, Type of Diabetes = Type 1)
Insulin Only Age Classes[0 - 18) ( % ) [18 - 35) ( % ) [35 - 55) ( % ) [55 - 75) ( % ) [75+) ( % ) N ( % )
Yes 5 (100.0) 151 ( 93.2) 296 ( 90.2) 139 ( 88.0) 9( 75.0) 600 ( 90.2)No 0 ( 0.0) 11 ( 6.8) 32 ( 9.8) 19 ( 12.0) 3( 25.0) 65 ( 9.8)
TOTAL 5( 0.8) 162( 24.4) 328( 49.3) 158( 23.8) 12( 1.8) 665 (100.0)
Table 3.3.4.4.3.6: Insulin Only (by Age Classes, Type of Diabetes = Type 1)
CMH Chi-SquareValue One or more cells have 0 obs

3.3.4.4.3 Glucose Lowering: Insulin Only (last episode in 12 months)Type of Diabetes = Type 2
Insulin Only Age ClassesValid Value ( % ) NV/NA ( % ) N ( % )
Valid Value 8707 (100.0) 0( 0.0) 8707 (100.0)NV/NA 0 ( 0.0) 0( 0.0) 0 ( 0.0)TOTAL 8707(100.0) 0( 0.0) 8707 (100.0)
Table 3.3.4.4.3.7: Missing Data Insulin Only (by Age Classes, Type of Diabetes = Type 2)
Insulin Only Age Classes[0 - 18) ( % ) [18 - 35) ( % ) [35 - 55) ( % ) [55 - 75) ( % ) [75+) ( % ) N ( % )
Yes 0 ( 0.0) 14 ( 42.4) 186 ( 19.1) 1052 ( 19.3) 559( 24.7) 1811 ( 20.8)No 1 (100.0) 19 ( 57.6) 786 ( 80.9) 4390 ( 80.7) 1700( 75.3) 6896 ( 79.2)
TOTAL 1( 0.0) 33( 0.4) 972( 11.2) 5442( 62.5) 2259( 25.9) 8707 (100.0)
Table 3.3.4.4.3.8: Insulin Only (by Age Classes, Type of Diabetes = Type 2)
CMH Chi-SquareValue One or more cells have 0 obs

3.3.4.4.3 Glucose Lowering: Insulin Only (last episode in 12 months)Type of Diabetes = Other Type
Insulin Only Age ClassesValid Value ( % ) NV/NA ( % ) N ( % )
Valid Value 367 (100.0) 0( 0.0) 367 (100.0)NV/NA 0 ( 0.0) 0( 0.0) 0 ( 0.0)TOTAL 367(100.0) 0( 0.0) 367 (100.0)
Table 3.3.4.4.3.9: Missing Data Insulin Only (by Age Classes, Type of Diabetes = Other Type)
Insulin Only Age Classes[0 - 18) ( % ) [18 - 35) ( % ) [35 - 55) ( % ) [55 - 75) ( % ) [75+) ( % ) N ( % )
Yes 0 ( 0.0) 51 ( 70.8) 51 ( 50.5) 30 ( 20.3) 7( 15.9) 139 ( 37.9)No 2 (100.0) 21 ( 29.2) 50 ( 49.5) 118 ( 79.7) 37( 84.1) 228 ( 62.1)
TOTAL 2( 0.5) 72( 19.6) 101( 27.5) 148( 40.3) 44( 12.0) 367 (100.0)
Table 3.3.4.4.3.10: Insulin Only (by Age Classes, Type of Diabetes = Other Type)
CMH Chi-SquareValue One or more cells have 0 obs

3.3.4.4.4 Glucose Lowering: Insulin and Tablets (last episode in 12 months)
Instab Type of DiabetesValid Value ( % ) NV/NA ( % ) N ( % )
Valid Value 9739 (100.0) 0( 0.0) 9739 (100.0)NV/NA 0 ( 0.0) 0( 0.0) 0 ( 0.0)TOTAL 9739(100.0) 0( 0.0) 9739 (100.0)
Table 3.3.4.4.4.1: Missing Data Instab (by Type of Diabetes)
Instab Type of DiabetesType 1 ( % ) Type 2 ( % ) Other Type ( % ) N ( % )
Yes 29 ( 4.4) 1498 ( 17.2) 15( 4.1) 1542 ( 15.8)No 636 ( 95.6) 7209 ( 82.8) 352( 95.9) 8197 ( 84.2)
TOTAL 665( 6.8) 8707( 89.4) 367( 3.8) 9739 (100.0)
Table 3.3.4.4.4.2: Instab (by Type of Diabetes)
CMH Chi-Square p.value dfValue 115.9598 0 2
335

3.3.4.4.4 Glucose Lowering: Insulin and Tablets (last episode in 12 months)
Instab Age ClassesValid Value ( % ) NV/NA ( % ) N ( % )
Valid Value 9739 (100.0) 0( 0.0) 9739 (100.0)NV/NA 0 ( 0.0) 0( 0.0) 0 ( 0.0)TOTAL 9739(100.0) 0( 0.0) 9739 (100.0)
Table 3.3.4.4.4.3: Missing Data Instab (by Age Classes)
Instab Age Classes[0 - 18) ( % ) [18 - 35) ( % ) [35 - 55) ( % ) [55 - 75) ( % ) [75+) ( % ) N ( % )
Yes 0 ( 0.0) 2 ( 0.7) 148 ( 10.6) 929 ( 16.2) 463( 20.0) 1542 ( 15.8)No 8 (100.0) 265 ( 99.3) 1253 ( 89.4) 4819 ( 83.8) 1852( 80.0) 8197 ( 84.2)
TOTAL 8( 0.1) 267( 2.7) 1401( 14.4) 5748( 59.0) 2315( 23.8) 9739 (100.0)
Table 3.3.4.4.4.4: Instab (by Age Classes)
CMH Chi-SquareValue One or more cells have 0 obs

3.3.4.4.4 Glucose Lowering: Insulin and Tablets (last episode in 12 months)Type of Diabetes = Type 1
Instab Age ClassesValid Value ( % ) NV/NA ( % ) N ( % )
Valid Value 665 (100.0) 0( 0.0) 665 (100.0)NV/NA 0 ( 0.0) 0( 0.0) 0 ( 0.0)TOTAL 665(100.0) 0( 0.0) 665 (100.0)
Table 3.3.4.4.4.5: Missing Data Instab (by Age Classes, Type of Diabetes = Type 1)
Instab Age Classes[0 - 18) ( % ) [18 - 35) ( % ) [35 - 55) ( % ) [55 - 75) ( % ) [75+) ( % ) N ( % )
Yes 0 ( 0.0) 2 ( 1.2) 16 ( 4.9) 10 ( 6.3) 1( 8.3) 29 ( 4.4)No 5 (100.0) 160 ( 98.8) 312 ( 95.1) 148 ( 93.7) 11( 91.7) 636 ( 95.6)
TOTAL 5( 0.8) 162( 24.4) 328( 49.3) 158( 23.8) 12( 1.8) 665 (100.0)
Table 3.3.4.4.4.6: Instab (by Age Classes, Type of Diabetes = Type 1)
CMH Chi-SquareValue One or more cells have 0 obs

3.3.4.4.4 Glucose Lowering: Insulin and Tablets (last episode in 12 months)Type of Diabetes = Type 2
Instab Age ClassesValid Value ( % ) NV/NA ( % ) N ( % )
Valid Value 8707 (100.0) 0( 0.0) 8707 (100.0)NV/NA 0 ( 0.0) 0( 0.0) 0 ( 0.0)TOTAL 8707(100.0) 0( 0.0) 8707 (100.0)
Table 3.3.4.4.4.7: Missing Data Instab (by Age Classes, Type of Diabetes = Type 2)
Instab Age Classes[0 - 18) ( % ) [18 - 35) ( % ) [35 - 55) ( % ) [55 - 75) ( % ) [75+) ( % ) N ( % )
Yes 0 ( 0.0) 0 ( 0.0) 130 ( 13.4) 908 ( 16.7) 460( 20.4) 1498 ( 17.2)No 1 (100.0) 33 (100.0) 842 ( 86.6) 4534 ( 83.3) 1799( 79.6) 7209 ( 82.8)
TOTAL 1( 0.0) 33( 0.4) 972( 11.2) 5442( 62.5) 2259( 25.9) 8707 (100.0)
Table 3.3.4.4.4.8: Instab (by Age Classes, Type of Diabetes = Type 2)
CMH Chi-SquareValue One or more cells have 0 obs

3.3.4.4.4 Glucose Lowering: Insulin and Tablets (last episode in 12 months)Type of Diabetes = Other Type
Instab Age ClassesValid Value ( % ) NV/NA ( % ) N ( % )
Valid Value 367 (100.0) 0( 0.0) 367 (100.0)NV/NA 0 ( 0.0) 0( 0.0) 0 ( 0.0)TOTAL 367(100.0) 0( 0.0) 367 (100.0)Table 3.3.4.4.4.9: Missing Data Instab (by Age Classes, Type of Diabetes = Other Type)
Instab Age Classes[0 - 18) ( % ) [18 - 35) ( % ) [35 - 55) ( % ) [55 - 75) ( % ) [75+) ( % ) N ( % )
Yes 0 ( 0.0) 0 ( 0.0) 2 ( 2.0) 11 ( 7.4) 2( 4.5) 15 ( 4.1)No 2 (100.0) 72 (100.0) 99 ( 98.0) 137 ( 92.6) 42( 95.5) 352 ( 95.9)
TOTAL 2( 0.5) 72( 19.6) 101( 27.5) 148( 40.3) 44( 12.0) 367 (100.0)
Table 3.3.4.4.4.10: Instab (by Age Classes, Type of Diabetes = Other Type)
CMH Chi-SquareValue One or more cells have 0 obs

3.3.5 Management
340

3.3.5.2 Visit Frequency
Visit Frequency Type of DiabetesValid Value ( % ) NV/NA ( % ) N ( % )
Valid Value 9739 (100.0) 0( 0.0) 9739 (100.0)NV/NA 0 ( 0.0) 0( 0.0) 0 ( 0.0)TOTAL 9739(100.0) 0( 0.0) 9739 (100.0)
Table 3.3.5.2.1: Missing Data Visit Frequency (by Type of Diabetes)
Visit Frequency Type of DiabetesType 1 ( % ) Type 2 ( % ) Other Type ( % ) N ( % )
Only one 221 ( 33.2) 3373 ( 38.7) 177( 48.2) 3771 ( 38.7)More than one 444 ( 66.8) 5334 ( 61.3) 190( 51.8) 5968 ( 61.3)
TOTAL 665( 6.8) 8707( 89.4) 367( 3.8) 9739 (100.0)
Table 3.3.5.2.2: Visit Frequency (by Type of Diabetes)
CMH Chi-Square p.value dfValue 22.4242 0 2
341

3.3.5.2 Visit Frequency
Visit Frequency Age ClassesValid Value ( % ) NV/NA ( % ) N ( % )
Valid Value 9739 (100.0) 0( 0.0) 9739 (100.0)NV/NA 0 ( 0.0) 0( 0.0) 0 ( 0.0)TOTAL 9739(100.0) 0( 0.0) 9739 (100.0)
Table 3.3.5.2.3: Missing Data Visit Frequency (by Age Classes)
Visit Frequency Age Classes[0 - 18) ( % ) [18 - 35) ( % ) [35 - 55) ( % ) [55 - 75) ( % ) [75+) ( % ) N ( % )
Only one 3 ( 37.5) 99 ( 37.1) 568 ( 40.5) 2105 ( 36.6) 996( 43.0) 3771 ( 38.7)More than one 5 ( 62.5) 168 ( 62.9) 833 ( 59.5) 3643 ( 63.4) 1319( 57.0) 5968 ( 61.3)
TOTAL 8( 0.1) 267( 2.7) 1401( 14.4) 5748( 59.0) 2315( 23.8) 9739 (100.0)
Table 3.3.5.2.4: Visit Frequency (by Age Classes)
CMH Chi-Square p.value dfValue 31.0092 0 4

3.3.5.2 Visit FrequencyType of Diabetes = Type 1
Visit Frequency Age ClassesValid Value ( % ) NV/NA ( % ) N ( % )
Valid Value 665 (100.0) 0( 0.0) 665 (100.0)NV/NA 0 ( 0.0) 0( 0.0) 0 ( 0.0)TOTAL 665(100.0) 0( 0.0) 665 (100.0)
Table 3.3.5.2.5: Missing Data Visit Frequency (by Age Classes, Type of Diabetes = Type 1)
Visit Frequency Age Classes[0 - 18) ( % ) [18 - 35) ( % ) [35 - 55) ( % ) [55 - 75) ( % ) [75+) ( % ) N ( % )
Only one 1 ( 20.0) 64 ( 39.5) 114 ( 34.8) 37 ( 23.4) 5( 41.7) 221 ( 33.2)More than one 4 ( 80.0) 98 ( 60.5) 214 ( 65.2) 121 ( 76.6) 7( 58.3) 444 ( 66.8)
TOTAL 5( 0.8) 162( 24.4) 328( 49.3) 158( 23.8) 12( 1.8) 665 (100.0)
Table 3.3.5.2.6: Visit Frequency (by Age Classes, Type of Diabetes = Type 1)
CMH Chi-Square p.value dfValue 10.8554 0.0282 4

3.3.5.2 Visit FrequencyType of Diabetes = Type 2
Visit Frequency Age ClassesValid Value ( % ) NV/NA ( % ) N ( % )
Valid Value 8707 (100.0) 0( 0.0) 8707 (100.0)NV/NA 0 ( 0.0) 0( 0.0) 0 ( 0.0)TOTAL 8707(100.0) 0( 0.0) 8707 (100.0)
Table 3.3.5.2.7: Missing Data Visit Frequency (by Age Classes, Type of Diabetes = Type 2)
Visit Frequency Age Classes[0 - 18) ( % ) [18 - 35) ( % ) [35 - 55) ( % ) [55 - 75) ( % ) [75+) ( % ) N ( % )
Only one 1 (100.0) 16 ( 48.5) 412 ( 42.4) 1980 ( 36.4) 964( 42.7) 3373 ( 38.7)More than one 0 ( 0.0) 17 ( 51.5) 560 ( 57.6) 3462 ( 63.6) 1295( 57.3) 5334 ( 61.3)
TOTAL 1( 0.0) 33( 0.4) 972( 11.2) 5442( 62.5) 2259( 25.9) 8707 (100.0)
Table 3.3.5.2.8: Visit Frequency (by Age Classes, Type of Diabetes = Type 2)
CMH Chi-SquareValue One or more cells have 0 obs

3.3.5.2 Visit FrequencyType of Diabetes = Other Type
Visit Frequency Age ClassesValid Value ( % ) NV/NA ( % ) N ( % )
Valid Value 367 (100.0) 0( 0.0) 367 (100.0)NV/NA 0 ( 0.0) 0( 0.0) 0 ( 0.0)TOTAL 367(100.0) 0( 0.0) 367 (100.0)
Table 3.3.5.2.9: Missing Data Visit Frequency (by Age Classes, Type of Diabetes = Other Type)
Visit Frequency Age Classes[0 - 18) ( % ) [18 - 35) ( % ) [35 - 55) ( % ) [55 - 75) ( % ) [75+) ( % ) N ( % )
Only one 1 ( 50.0) 19 ( 26.4) 42 ( 41.6) 88 ( 59.5) 27( 61.4) 177 ( 48.2)More than one 1 ( 50.0) 53 ( 73.6) 59 ( 58.4) 60 ( 40.5) 17( 38.6) 190 ( 51.8)
TOTAL 2( 0.5) 72( 19.6) 101( 27.5) 148( 40.3) 44( 12.0) 367 (100.0)
Table 3.3.5.2.10: Visit Frequency (by Age Classes, Type of Diabetes = Other Type)
CMH Chi-Square p.value dfValue 26.0592 0 4

Chapter 4
Population
346

4.1 Vital Statistics
347
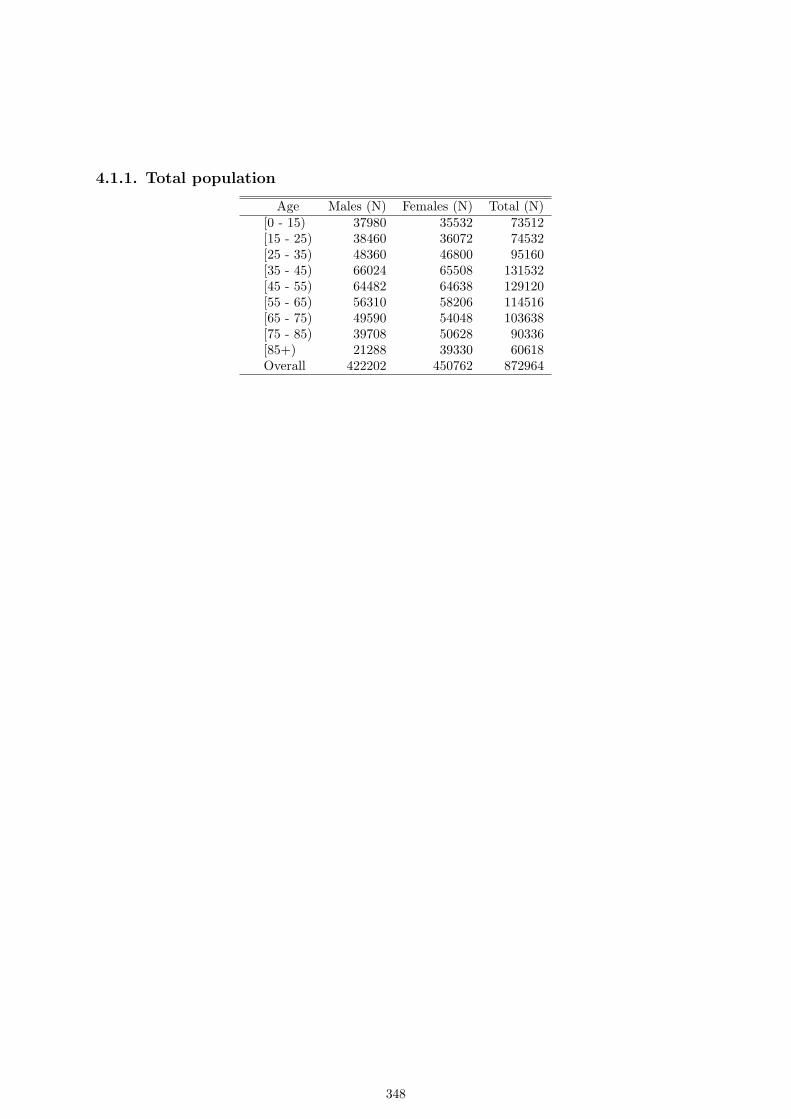
4.1.1. Total population
Age Males (N) Females (N) Total (N)[0 - 15) 37980 35532 73512[15 - 25) 38460 36072 74532[25 - 35) 48360 46800 95160[35 - 45) 66024 65508 131532[45 - 55) 64482 64638 129120[55 - 65) 56310 58206 114516[65 - 75) 49590 54048 103638[75 - 85) 39708 50628 90336[85+) 21288 39330 60618Overall 422202 450762 872964
348

4.1.2. Life expectancy
Age Males (years) Females (years)[0 - 15) 77 77[15 - 25) 66 66[25 - 35) 55 55[35 - 45) 44 44[45 - 55) 33 34[55 - 65) 22 23[65 - 75) 12 12[75 - 85) 2 2
349

4.1.3. Mortality data
Age Males (N) Females (N) Total (N)[0 - 15) 78 78 156[15 - 25) 48 48 96[25 - 35) 150 78 228[35 - 45) 300 150 450[45 - 55) 552 228 780[55 - 65) 1278 750 2028[65 - 75) 2550 1626 4176[75 - 85) 6750 4302 11052[85+) 11850 16374 28224Overall 23556 23634 47190
350

Chapter 5
Risk Adjusted Indicators
351

5.1. Epidemiology
352

5.1.1 Prevalence of diabetes mellitus per 1,000
s O E N CR AR 95% C.I. [O-E]/E % 95% C.I. [O-E]/E1 perugia 3033 1562 872964 3.5 3.5 ( 3.4; 3.5) 94.2 ( 91.7; 96.7)2 terni 2782 1562 872964 3.2 3.2 ( 3.1; 3.2) 78.1 ( 75.7; 80.6)3 orvieto 1256 1562 872964 1.4 1.4 ( 1.4; 1.5) -19.6 (-22.1;-17.1)4 gubbio 1098 1562 872964 1.3 1.3 ( 1.2; 1.3) -29.7 (-32.2;-27.2)5 spoleto 890 1562 872964 1.0 1.0 ( 1.0; 1.1) -43.0 (-45.5;-40.5)6 foligno 313 1562 872964 0.4 0.4 ( 0.3; 0.4) -80.0 (-82.5;-77.5)
T 9372 872964 10.7
Standardized Estimates 5.1.1.1 - 5.1.1 Prevalence of diabetes mellitus per 1,000
353

5.1.1 Prevalence of diabetes mellitus per 1,000
foligno
spoleto
gubbio
orvieto
terni
perugia
0
200
400
600
800
1000
0.4
1.0
1.3
1.4
3.2
3.5
0.1
Barplots: 5.1.1.4 - Adjusted Rates 5.1.1 Prevalence of diabetes mellitus per 1,000
354

5.1.1 Prevalence of diabetes mellitus per 1,000
●
●
●
●
●
●
[O−E]/E %
−100 −50 0 50 100
foligno
spoleto
gubbio
orvieto
terni
perugia
Forest plots: 5.1.1.1 - 5.1.1 Prevalence of diabetes mellitus per 1,000
355

5.1.2. Age at diagnosis by 10 year age bands
Age Type of DiabetesValid Value ( % ) NV/NA ( % ) N ( % )
Valid Value 9372 (100.0) 0( 0.0) 9372 (100.0)NV/NA 0 ( 0.0) 0( 0.0) 0 ( 0.0)TOTAL 9372(100.0) 0( 0.0) 9372 (100.0)
Table 5.1.2.1: Missing Data Age (by Type of Diabetes)
Age Type of DiabetesType 1 ( % ) Type 2 ( % ) N ( % )
[0 - 10) 78 ( 11.7) 2( 0.0) 80 ( 0.9)[10 - 20) 171 ( 25.7) 7( 0.1) 178 ( 1.9)[20 - 30) 192 ( 28.9) 112( 1.3) 304 ( 3.2)[30 - 40) 148 ( 22.3) 609( 7.0) 757 ( 8.1)[40 - 50) 53 ( 8.0) 1830( 21.0) 1883 ( 20.1)[50 - 60) 15 ( 2.3) 2839( 32.6) 2854 ( 30.5)[60 - 70) 8 ( 1.2) 2243( 25.8) 2251 ( 24.0)[70 - 80) 0 ( 0.0) 912( 10.5) 912 ( 9.7)
[80+) 0 ( 0.0) 153( 1.8) 153 ( 1.6)TOTAL 665( 7.1) 8707( 92.9) 9372 (100.0)
Table 5.1.2.2: Age (by Type of Diabetes)
CMH Chi-SquareValue One or more cells have 0 obs
356

5.1.2. Age at diagnosis by 10 year age bands
Age GenderValid Value ( % ) NV/NA ( % ) N ( % )
Valid Value 9372 (100.0) 0( 0.0) 9372 (100.0)NV/NA 0 ( 0.0) 0( 0.0) 0 ( 0.0)TOTAL 9372(100.0) 0( 0.0) 9372 (100.0)
Table 5.1.2.3: Missing Data Age (by Gender)
Age GenderMale ( % ) Female ( % ) N ( % )
[0 - 10) 34 ( 0.7) 46( 1.1) 80 ( 0.9)[10 - 20) 88 ( 1.7) 90( 2.1) 178 ( 1.9)[20 - 30) 158 ( 3.1) 146( 3.4) 304 ( 3.2)[30 - 40) 428 ( 8.5) 329( 7.6) 757 ( 8.1)[40 - 50) 1065 ( 21.1) 818( 19.0) 1883 ( 20.1)[50 - 60) 1562 ( 30.9) 1292( 29.9) 2854 ( 30.5)[60 - 70) 1229 ( 24.3) 1022( 23.7) 2251 ( 24.0)[70 - 80) 427 ( 8.4) 485( 11.2) 912 ( 9.7)
[80+) 66 ( 1.3) 87( 2.0) 153 ( 1.6)TOTAL 5057( 54.0) 4315( 46.0) 9372 (100.0)
Table 5.1.2.4: Age (by Gender)
CMH Chi-Square p.value dfValue 40.2998 0 8
357

5.1.2. Age at diagnosis by 10 year age bandsType of Diabetes = Type 1
Age GenderValid Value ( % ) NV/NA ( % ) N ( % )
Valid Value 665 (100.0) 0( 0.0) 665 (100.0)NV/NA 0 ( 0.0) 0( 0.0) 0 ( 0.0)TOTAL 665(100.0) 0( 0.0) 665 (100.0)
Table 5.1.2.5: Missing Data Age (by Gender, Type of Diabetes = Type 1)
Age GenderMale ( % ) Female ( % ) N ( % )
[0 - 10) 33 ( 9.3) 45( 14.6) 78 ( 11.7)[10 - 20) 85 ( 23.9) 86( 27.8) 171 ( 25.7)[20 - 30) 110 ( 30.9) 82( 26.5) 192 ( 28.9)[30 - 40) 82 ( 23.0) 66( 21.4) 148 ( 22.3)[40 - 50) 30 ( 8.4) 23( 7.4) 53 ( 8.0)[50 - 60) 11 ( 3.1) 4( 1.3) 15 ( 2.3)[60 - 70) 5 ( 1.4) 3( 1.0) 8 ( 1.2)[70 - 80) 0 ( 0.0) 0( 0.0) 0 ( 0.0)
[80+) 0 ( 0.0) 0( 0.0) 0 ( 0.0)TOTAL 356( 53.5) 309( 46.5) 665 (100.0)
Table 5.1.2.6: Age (by Gender, Type of Diabetes = Type 1)
CMH Chi-SquareValue One or more cells have 0 obs
358

5.1.2. Age at diagnosis by 10 year age bandsType of Diabetes = Type 2
Age GenderValid Value ( % ) NV/NA ( % ) N ( % )
Valid Value 8707 (100.0) 0( 0.0) 8707 (100.0)NV/NA 0 ( 0.0) 0( 0.0) 0 ( 0.0)TOTAL 8707(100.0) 0( 0.0) 8707 (100.0)
Table 5.1.2.7: Missing Data Age (by Gender, Type of Diabetes = Type 2)
Age GenderMale ( % ) Female ( % ) N ( % )
[0 - 10) 1 ( 0.0) 1( 0.0) 2 ( 0.0)[10 - 20) 3 ( 0.1) 4( 0.1) 7 ( 0.1)[20 - 30) 48 ( 1.0) 64( 1.6) 112 ( 1.3)[30 - 40) 346 ( 7.4) 263( 6.6) 609 ( 7.0)[40 - 50) 1035 ( 22.0) 795( 19.8) 1830 ( 21.0)[50 - 60) 1551 ( 33.0) 1288( 32.2) 2839 ( 32.6)[60 - 70) 1224 ( 26.0) 1019( 25.4) 2243 ( 25.8)[70 - 80) 427 ( 9.1) 485( 12.1) 912 ( 10.5)
[80+) 66 ( 1.4) 87( 2.2) 153 ( 1.8)TOTAL 4701( 54.0) 4006( 46.0) 8707 (100.0)
Table 5.1.2.8: Age (by Gender, Type of Diabetes = Type 2)
CMH Chi-Square p.value dfValue 39.6641 0 8
359

5.2. Process Quality
360

5.2.1 % of subjects with 1+ HbA1c tests in last 12 months
HbA1c done Type of DiabetesValid Value ( % ) NV/NA ( % ) N ( % )
Valid Value 9372 (100.0) 0( 0.0) 9372 (100.0)NV/NA 0 ( 0.0) 0( 0.0) 0 ( 0.0)TOTAL 9372(100.0) 0( 0.0) 9372 (100.0)
Table 5.2.1.1: Missing Data HbA1c done (by Type of Diabetes)
HbA1c done Type of DiabetesType 1 ( % ) Type 2 ( % ) N ( % )
at least one test 621 ( 93.4) 8176( 93.9) 8797 ( 93.9)no test 44 ( 6.6) 531( 6.1) 575 ( 6.1)TOTAL 665( 7.1) 8707( 92.9) 9372 (100.0)
Table 5.2.1.2: HbA1c done (by Type of Diabetes)
CMH Chi-Square p.value dfValue 0.2049 0.6508 1
361
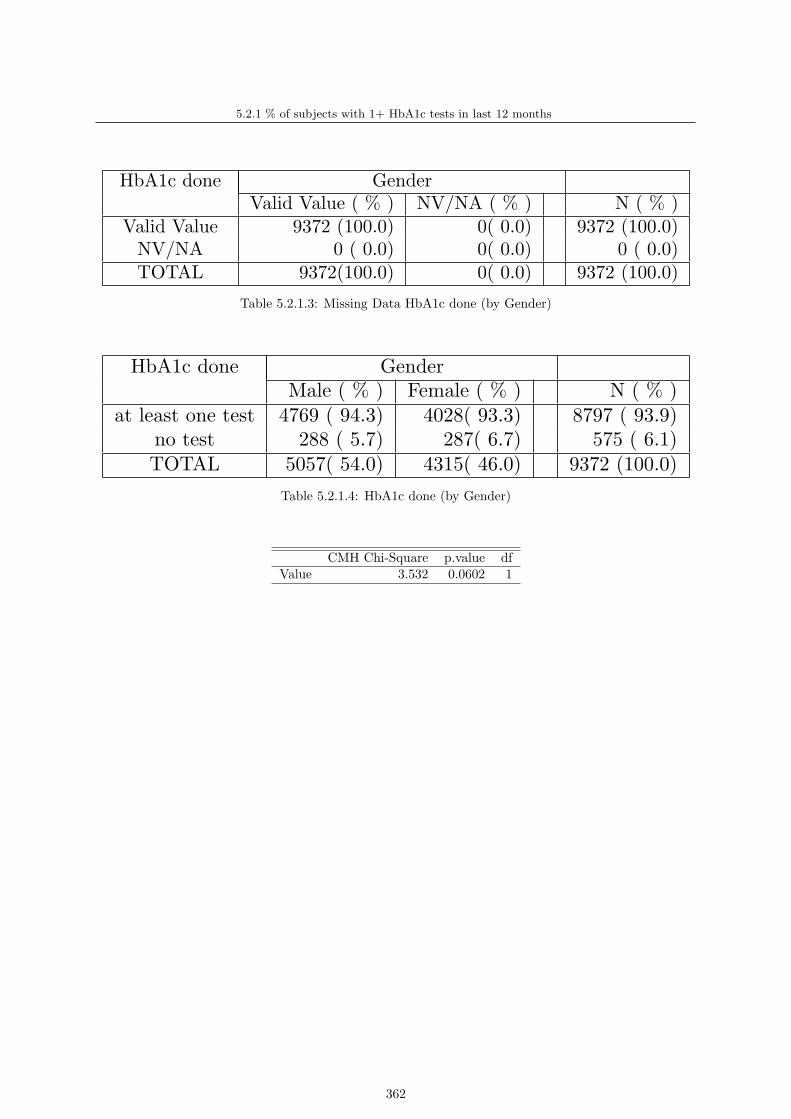
5.2.1 % of subjects with 1+ HbA1c tests in last 12 months
HbA1c done GenderValid Value ( % ) NV/NA ( % ) N ( % )
Valid Value 9372 (100.0) 0( 0.0) 9372 (100.0)NV/NA 0 ( 0.0) 0( 0.0) 0 ( 0.0)TOTAL 9372(100.0) 0( 0.0) 9372 (100.0)
Table 5.2.1.3: Missing Data HbA1c done (by Gender)
HbA1c done GenderMale ( % ) Female ( % ) N ( % )
at least one test 4769 ( 94.3) 4028( 93.3) 8797 ( 93.9)no test 288 ( 5.7) 287( 6.7) 575 ( 6.1)TOTAL 5057( 54.0) 4315( 46.0) 9372 (100.0)
Table 5.2.1.4: HbA1c done (by Gender)
CMH Chi-Square p.value dfValue 3.532 0.0602 1
362

5.2.1 % of subjects with 1+ HbA1c tests in last 12 months
HbA1c done AgeValid Value ( % ) NV/NA ( % ) N ( % )
Valid Value 9372 (100.0) 0( 0.0) 9372 (100.0)NV/NA 0 ( 0.0) 0( 0.0) 0 ( 0.0)TOTAL 9372(100.0) 0( 0.0) 9372 (100.0)
Table 5.2.1.5: Missing Data HbA1c done (by Age)
HbA1c done Age[0 - 18) ( % ) [18 - 35) ( % ) [35 - 55) ( % ) [55 - 75) ( % ) [75+) ( % ) N ( % )
at least one test 5 ( 83.3) 178 ( 91.3) 1187 ( 91.3) 5295 ( 94.6) 2132( 93.9) 8797 ( 93.9)no test 1 ( 16.7) 17 ( 8.7) 113 ( 8.7) 305 ( 5.4) 139( 6.1) 575 ( 6.1)TOTAL 6( 0.1) 195( 2.1) 1300( 13.9) 5600( 59.8) 2271( 24.2) 9372 (100.0)
Table 5.2.1.6: HbA1c done (by Age)
CMH Chi-Square p.value dfValue 22.7889 1e− 04 4
363

5.2.1 % of subjects with 1+ HbA1c tests in last 12 monthsType of Diabetes = Type 1
HbA1c done GenderValid Value ( % ) NV/NA ( % ) N ( % )
Valid Value 665 (100.0) 0( 0.0) 665 (100.0)NV/NA 0 ( 0.0) 0( 0.0) 0 ( 0.0)TOTAL 665(100.0) 0( 0.0) 665 (100.0)
Table 5.2.1.7: Missing Data HbA1c done (by Gender, Type of Diabetes = Type 1)
HbA1c done GenderMale ( % ) Female ( % ) N ( % )
at least one test 338 ( 94.9) 283( 91.6) 621 ( 93.4)no test 18 ( 5.1) 26( 8.4) 44 ( 6.6)TOTAL 356( 53.5) 309( 46.5) 665 (100.0)
Table 5.2.1.8: HbA1c done (by Gender, Type of Diabetes = Type 1)
CMH Chi-Square p.value dfValue 2.5 0.1138 1
364

5.2.1 % of subjects with 1+ HbA1c tests in last 12 monthsType of Diabetes = Type 1
HbA1c done AgeValid Value ( % ) NV/NA ( % ) N ( % )
Valid Value 665 (100.0) 0( 0.0) 665 (100.0)NV/NA 0 ( 0.0) 0( 0.0) 0 ( 0.0)TOTAL 665(100.0) 0( 0.0) 665 (100.0)
Table 5.2.1.9: Missing Data HbA1c done (by Age, Type of Diabetes = Type 1)
HbA1c done Age[0 - 18) ( % ) [18 - 35) ( % ) [35 - 55) ( % ) [55 - 75) ( % ) [75+) ( % ) N ( % )
at least one test 5 (100.0) 148 ( 91.4) 306 ( 93.3) 151 ( 95.6) 11( 91.7) 621 ( 93.4)no test 0 ( 0.0) 14 ( 8.6) 22 ( 6.7) 7 ( 4.4) 1( 8.3) 44 ( 6.6)TOTAL 5( 0.8) 162( 24.4) 328( 49.3) 158( 23.8) 12( 1.8) 665 (100.0)
Table 5.2.1.10: HbA1c done (by Age, Type of Diabetes = Type 1)
CMH Chi-SquareValue One or more cells have 0 obs
365

5.2.1 % of subjects with 1+ HbA1c tests in last 12 monthsType of Diabetes = Type 2
HbA1c done GenderValid Value ( % ) NV/NA ( % ) N ( % )
Valid Value 8707 (100.0) 0( 0.0) 8707 (100.0)NV/NA 0 ( 0.0) 0( 0.0) 0 ( 0.0)TOTAL 8707(100.0) 0( 0.0) 8707 (100.0)
Table 5.2.1.11: Missing Data HbA1c done (by Gender, Type of Diabetes = Type 2)
HbA1c done GenderMale ( % ) Female ( % ) N ( % )
at least one test 4431 ( 94.3) 3745( 93.5) 8176 ( 93.9)no test 270 ( 5.7) 261( 6.5) 531 ( 6.1)TOTAL 4701( 54.0) 4006( 46.0) 8707 (100.0)
Table 5.2.1.12: HbA1c done (by Gender, Type of Diabetes = Type 2)
CMH Chi-Square p.value dfValue 2.1169 0.1457 1
366

5.2.1 % of subjects with 1+ HbA1c tests in last 12 monthsType of Diabetes = Type 2
HbA1c done AgeValid Value ( % ) NV/NA ( % ) N ( % )
Valid Value 8707 (100.0) 0( 0.0) 8707 (100.0)NV/NA 0 ( 0.0) 0( 0.0) 0 ( 0.0)TOTAL 8707(100.0) 0( 0.0) 8707 (100.0)
Table 5.2.1.13: Missing Data HbA1c done (by Age, Type of Diabetes = Type 2)
HbA1c done Age[0 - 18) ( % ) [18 - 35) ( % ) [35 - 55) ( % ) [55 - 75) ( % ) [75+) ( % ) N ( % )
at least one test 0 ( 0.0) 30 ( 90.9) 881 ( 90.6) 5144 ( 94.5) 2121( 93.9) 8176 ( 93.9)no test 1 (100.0) 3 ( 9.1) 91 ( 9.4) 298 ( 5.5) 138( 6.1) 531 ( 6.1)TOTAL 1( 0.0) 33( 0.4) 972( 11.2) 5442( 62.5) 2259( 25.9) 8707 (100.0)
Table 5.2.1.14: HbA1c done (by Age, Type of Diabetes = Type 2)
CMH Chi-SquareValue One or more cells have 0 obs
367

5.2.1 % of subjects with 1+ HbA1c tests in last 12 months
●
●
HbA1c done
Valid ValueNV/NA
Valid Value NV/NA
025
5075
100
Barplot: 5.2.1.1 - Missing Data HbA1c done (by Type of Diabetes)
●
●
HbA1c done
at least one testno test
Type 1 Type 2
025
5075
100
Barplot: 5.2.1.2 - HbA1c done (by Type of Diabetes)
368

5.2.1 % of subjects with 1+ HbA1c tests in last 12 months
●
●
HbA1c done
Valid ValueNV/NA
Valid Value NV/NA
025
5075
100
Barplot: 5.2.1.3 - Missing Data HbA1c done (by Gender)
●
●
HbA1c done
at least one testno test
Female Male
025
5075
100
Barplot: 5.2.1.4 - HbA1c done (by Gender)
369

5.2.1 % of subjects with 1+ HbA1c tests in last 12 months
●
●
HbA1c done
Valid ValueNV/NA
Valid Value NV/NA
025
5075
100
Barplot: 5.2.1.5 - Missing Data HbA1c done (by Age)
●
●
HbA1c done
at least one testno test
[0 − 18) [18 − 35) [35 − 55) [55 − 75) [75 +)
025
5075
100
Barplot: 5.2.1.6 - HbA1c done (by Age)
370

5.2.1 % of subjects with 1+ HbA1c tests in last 12 monthsType of Diabetes = Type 1
●
●
HbA1c done
Valid ValueNV/NA
Valid Value NV/NA
025
5075
100
Barplot: 5.2.1.7 - Missing Data HbA1c done (by Gender, Type of Diabetes = Type 1)
●
●
HbA1c done
at least one testno test
Female Male
025
5075
100
Barplot: 5.2.1.8 - HbA1c done (by Gender, Type of Diabetes = Type 1)
371

5.2.1 % of subjects with 1+ HbA1c tests in last 12 monthsType of Diabetes = Type 1
●
●
HbA1c done
Valid ValueNV/NA
Valid Value NV/NA
025
5075
100
Barplot: 5.2.1.9 - Missing Data HbA1c done (by Age, Type of Diabetes = Type 1)
●
●
HbA1c done
at least one testno test
[0 − 18) [18 − 35) [35 − 55) [55 − 75) [75 +)
025
5075
100
Barplot: 5.2.1.10 - HbA1c done (by Age, Type of Diabetes = Type 1)
372

5.2.1 % of subjects with 1+ HbA1c tests in last 12 monthsType of Diabetes = Type 2
●
●
HbA1c done
Valid ValueNV/NA
Valid Value NV/NA
025
5075
100
Barplot: 5.2.1.11 - Missing Data HbA1c done (by Gender, Type of Diabetes = Type 2)
●
●
HbA1c done
at least one testno test
Female Male
025
5075
100
Barplot: 5.2.1.12 - HbA1c done (by Gender, Type of Diabetes = Type 2)
373
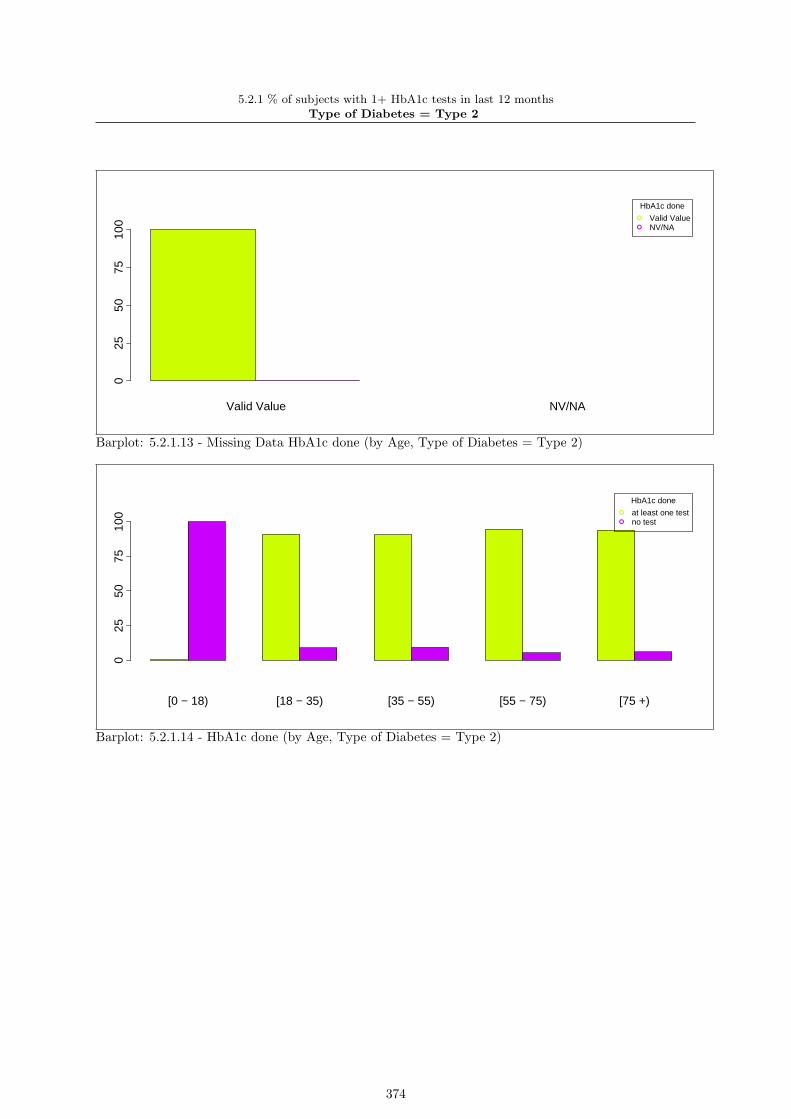
5.2.1 % of subjects with 1+ HbA1c tests in last 12 monthsType of Diabetes = Type 2
●
●
HbA1c done
Valid ValueNV/NA
Valid Value NV/NA
025
5075
100
Barplot: 5.2.1.13 - Missing Data HbA1c done (by Age, Type of Diabetes = Type 2)
●
●
HbA1c done
at least one testno test
[0 − 18) [18 − 35) [35 − 55) [55 − 75) [75 +)
025
5075
100
Barplot: 5.2.1.14 - HbA1c done (by Age, Type of Diabetes = Type 2)
374

5.2.1 5.2.1 % of subjects with 1+ HbA1c tests in last 12 monthsType of Diabetes = Type 2
s O E N CR AR 95% C.I. [O-E]/E % 95% C.I. [O-E]/E1 foligno 296 283 300 98.7 98.2 ( 95.6;100.0) 4.6 ( 1.8 ; 7.4 )2 orvieto 1182 1132 1205 98.1 98.0 ( 96.7; 99.4) 4.4 ( 3.0 ; 5.8 )3 gubbio 1020 986 1049 97.2 97.1 ( 95.7; 98.6) 3.4 ( 1.9 ; 5.0 )4 terni 2530 2520 2684 94.3 94.3 ( 93.4; 95.2) 0.4 (-0.6 ; 1.4 )5 spoleto 791 807 860 92.0 92.0 ( 90.4; 93.6) -2.0 (-3.7 ;-0.3 )6 perugia 2357 2449 2609 90.3 90.4 ( 89.5; 91.3) -3.8 (-4.7 ;-2.8 )
T 8176 8707 93.9
Standardized Estimates 5.2.1.15 - 5.2.1 % of subjects with 1+ HbA1c tests in last 12 months
375

5.2.1 % of subjects with 1+ HbA1c tests in last 12 monthsType of Diabetes = Type 2
perugia
spoleto
terni
gubbio
orvieto
foligno
0 20 40 60 80 100
90.4
92.0
94.3
97.1
98.0
98.2
93.9
Barplots: 5.2.1.17 - Adjusted Rates 5.2.1 % of subjects with 1+ HbA1c tests in last 12 months
376

5.2.1 % of subjects with 1+ HbA1c tests in last 12 monthsType of Diabetes = Type 2
●
●
●
●
●
●
[O−E]/E %
−100 −50 0 50 100
perugia
spoleto
terni
gubbio
orvieto
foligno
Forest plots: 5.2.1.2 - 5.2.1 % of subjects with 1+ HbA1c tests in last 12 months
377

5.2.1 5.2.1 % of subjects with 1+ HbA1c tests in last 12 monthsType of Diabetes = Type 1
s O E N CR AR 95% C.I. [O-E]/E % 95% C.I. [O-E]/E1 gubbio 49 47 49 100.0 97.4 ( 91.4;100.0) 4.3 ( -1.9;10.4 )2 orvieto 51 49 51 100.0 97.2 ( 90.5;100.0) 4.1 ( -2.9;11.1 )3 foligno 13 13 13 100.0 93.4 ( 80.5;100.0) 0.0 (-12.9;12.9 )4 terni 92 92 98 93.9 93.4 ( 88.8; 98.0) 0.0 ( -4.9; 4.9 )5 perugia 387 394 424 91.3 91.7 ( 89.3; 94.1) -1.8 ( -4.4; 0.8 )6 spoleto 29 30 30 96.7 90.3 ( 83.6; 97.0) -3.3 (-10.0; 3.3 )
T 621 665 93.4
Standardized Estimates 5.2.1.16 - 5.2.1 % of subjects with 1+ HbA1c tests in last 12 months
378

5.2.1 % of subjects with 1+ HbA1c tests in last 12 monthsType of Diabetes = Type 1
spoleto
perugia
foligno
terni
orvieto
gubbio
0 20 40 60 80 100
90.3
91.7
93.4
93.4
97.2
97.4
93.4
Barplots: 5.2.1.18 - Adjusted Rates 5.2.1 % of subjects with 1+ HbA1c tests in last 12 months
379

5.2.1 % of subjects with 1+ HbA1c tests in last 12 monthsType of Diabetes = Type 1
●
●
●
●
●
●
[O−E]/E %
−100 −50 0 50 100
spoleto
perugia
foligno
terni
orvieto
gubbio
Forest plots: 5.2.1.3 - 5.2.1 % of subjects with 1+ HbA1c tests in last 12 months
380

5.2.6 % with serum creatinine tested in last 12 months
Creatinine Type of DiabetesValid Value ( % ) NV/NA ( % ) N ( % )
Valid Value 9372 (100.0) 0( 0.0) 9372 (100.0)NV/NA 0 ( 0.0) 0( 0.0) 0 ( 0.0)TOTAL 9372(100.0) 0( 0.0) 9372 (100.0)
Table 5.2.6.1: Missing Data Creatinine (by Type of Diabetes)
Creatinine Type of DiabetesType 1 ( % ) Type 2 ( % ) N ( % )
Yes 342 ( 51.4) 5877( 67.5) 6219 ( 66.4)No 323 ( 48.6) 2830( 32.5) 3153 ( 33.6)
TOTAL 665( 7.1) 8707( 92.9) 9372 (100.0)Table 5.2.6.2: Creatinine (by Type of Diabetes)
CMH Chi-Square p.value dfValue 70.7394 0 1
381
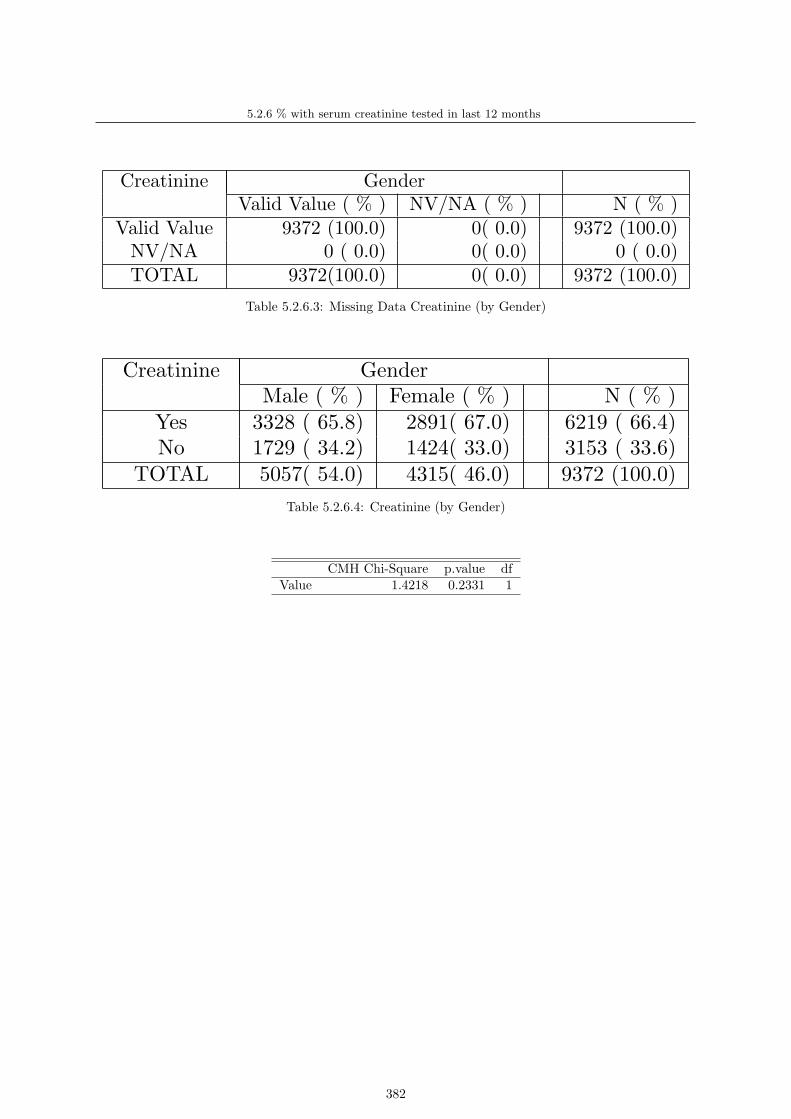
5.2.6 % with serum creatinine tested in last 12 months
Creatinine GenderValid Value ( % ) NV/NA ( % ) N ( % )
Valid Value 9372 (100.0) 0( 0.0) 9372 (100.0)NV/NA 0 ( 0.0) 0( 0.0) 0 ( 0.0)TOTAL 9372(100.0) 0( 0.0) 9372 (100.0)
Table 5.2.6.3: Missing Data Creatinine (by Gender)
Creatinine GenderMale ( % ) Female ( % ) N ( % )
Yes 3328 ( 65.8) 2891( 67.0) 6219 ( 66.4)No 1729 ( 34.2) 1424( 33.0) 3153 ( 33.6)
TOTAL 5057( 54.0) 4315( 46.0) 9372 (100.0)Table 5.2.6.4: Creatinine (by Gender)
CMH Chi-Square p.value dfValue 1.4218 0.2331 1
382

5.2.6 % with serum creatinine tested in last 12 months
Creatinine AgeValid Value ( % ) NV/NA ( % ) N ( % )
Valid Value 9372 (100.0) 0( 0.0) 9372 (100.0)NV/NA 0 ( 0.0) 0( 0.0) 0 ( 0.0)TOTAL 9372(100.0) 0( 0.0) 9372 (100.0)
Table 5.2.6.5: Missing Data Creatinine (by Age)
Creatinine Age[0 - 18) ( % ) [18 - 35) ( % ) [35 - 55) ( % ) [55 - 75) ( % ) [75+) ( % ) N ( % )
Yes 2 ( 33.3) 94 ( 48.2) 789 ( 60.7) 3819 ( 68.2) 1515( 66.7) 6219 ( 66.4)No 4 ( 66.7) 101 ( 51.8) 511 ( 39.3) 1781 ( 31.8) 756( 33.3) 3153 ( 33.6)
TOTAL 6( 0.1) 195( 2.1) 1300( 13.9) 5600( 59.8) 2271( 24.2) 9372 (100.0)
Table 5.2.6.6: Creatinine (by Age)
CMH Chi-Square p.value dfValue 59.0121 0 4
383

5.2.6 % with serum creatinine tested in last 12 monthsType of Diabetes = Type 1
Creatinine GenderValid Value ( % ) NV/NA ( % ) N ( % )
Valid Value 665 (100.0) 0( 0.0) 665 (100.0)NV/NA 0 ( 0.0) 0( 0.0) 0 ( 0.0)TOTAL 665(100.0) 0( 0.0) 665 (100.0)
Table 5.2.6.7: Missing Data Creatinine (by Gender, Type of Diabetes = Type 1)
Creatinine GenderMale ( % ) Female ( % ) N ( % )
Yes 167 ( 46.9) 175( 56.6) 342 ( 51.4)No 189 ( 53.1) 134( 43.4) 323 ( 48.6)
TOTAL 356( 53.5) 309( 46.5) 665 (100.0)Table 5.2.6.8: Creatinine (by Gender, Type of Diabetes = Type 1)
CMH Chi-Square p.value dfValue 5.8787 0.0153 1
384

5.2.6 % with serum creatinine tested in last 12 monthsType of Diabetes = Type 1
Creatinine AgeValid Value ( % ) NV/NA ( % ) N ( % )
Valid Value 665 (100.0) 0( 0.0) 665 (100.0)NV/NA 0 ( 0.0) 0( 0.0) 0 ( 0.0)TOTAL 665(100.0) 0( 0.0) 665 (100.0)
Table 5.2.6.9: Missing Data Creatinine (by Age, Type of Diabetes = Type 1)
Creatinine Age[0 - 18) ( % ) [18 - 35) ( % ) [35 - 55) ( % ) [55 - 75) ( % ) [75+) ( % ) N ( % )
Yes 1 ( 20.0) 76 ( 46.9) 165 ( 50.3) 96 ( 60.8) 4( 33.3) 342 ( 51.4)No 4 ( 80.0) 86 ( 53.1) 163 ( 49.7) 62 ( 39.2) 8( 66.7) 323 ( 48.6)
TOTAL 5( 0.8) 162( 24.4) 328( 49.3) 158( 23.8) 12( 1.8) 665 (100.0)
Table 5.2.6.10: Creatinine (by Age, Type of Diabetes = Type 1)
CMH Chi-Square p.value dfValue 10.545 0.0322 4
385

5.2.6 % with serum creatinine tested in last 12 monthsType of Diabetes = Type 2
Creatinine GenderValid Value ( % ) NV/NA ( % ) N ( % )
Valid Value 8707 (100.0) 0( 0.0) 8707 (100.0)NV/NA 0 ( 0.0) 0( 0.0) 0 ( 0.0)TOTAL 8707(100.0) 0( 0.0) 8707 (100.0)
Table 5.2.6.11: Missing Data Creatinine (by Gender, Type of Diabetes = Type 2)
Creatinine GenderMale ( % ) Female ( % ) N ( % )
Yes 3161 ( 67.2) 2716( 67.8) 5877 ( 67.5)No 1540 ( 32.8) 1290( 32.2) 2830 ( 32.5)
TOTAL 4701( 54.0) 4006( 46.0) 8707 (100.0)Table 5.2.6.12: Creatinine (by Gender, Type of Diabetes = Type 2)
CMH Chi-Square p.value dfValue 0.2813 0.5958 1
386
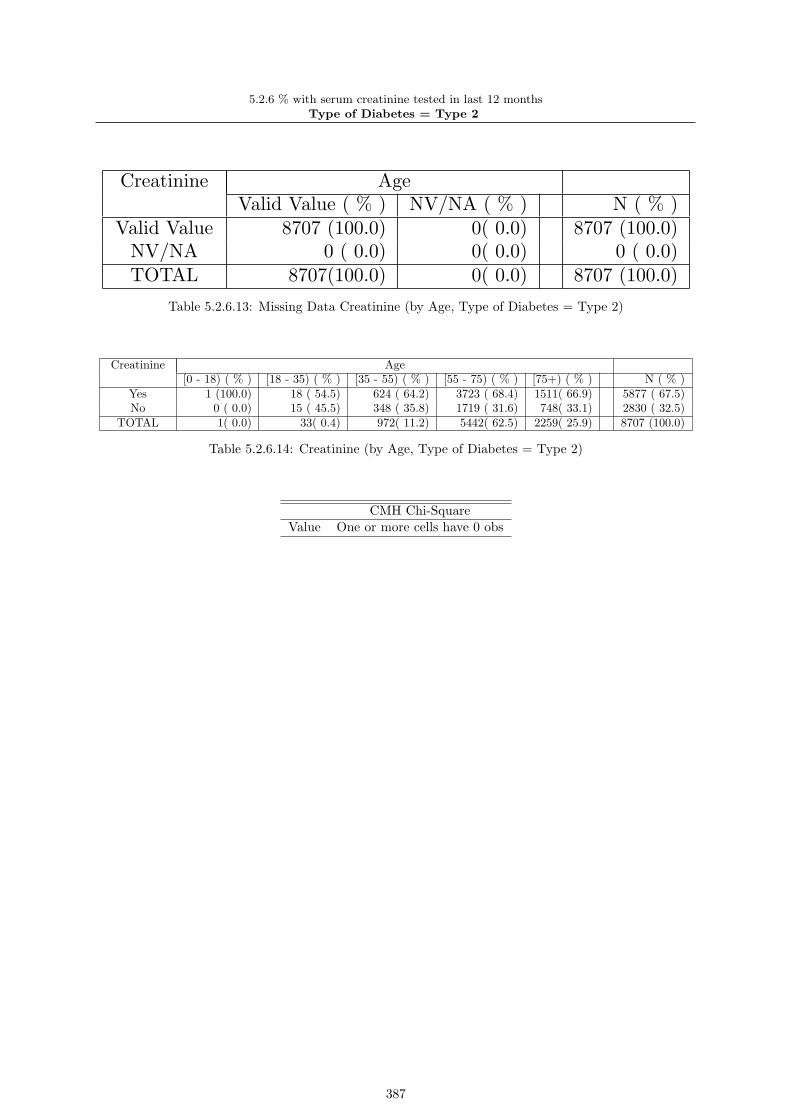
5.2.6 % with serum creatinine tested in last 12 monthsType of Diabetes = Type 2
Creatinine AgeValid Value ( % ) NV/NA ( % ) N ( % )
Valid Value 8707 (100.0) 0( 0.0) 8707 (100.0)NV/NA 0 ( 0.0) 0( 0.0) 0 ( 0.0)TOTAL 8707(100.0) 0( 0.0) 8707 (100.0)
Table 5.2.6.13: Missing Data Creatinine (by Age, Type of Diabetes = Type 2)
Creatinine Age[0 - 18) ( % ) [18 - 35) ( % ) [35 - 55) ( % ) [55 - 75) ( % ) [75+) ( % ) N ( % )
Yes 1 (100.0) 18 ( 54.5) 624 ( 64.2) 3723 ( 68.4) 1511( 66.9) 5877 ( 67.5)No 0 ( 0.0) 15 ( 45.5) 348 ( 35.8) 1719 ( 31.6) 748( 33.1) 2830 ( 32.5)
TOTAL 1( 0.0) 33( 0.4) 972( 11.2) 5442( 62.5) 2259( 25.9) 8707 (100.0)
Table 5.2.6.14: Creatinine (by Age, Type of Diabetes = Type 2)
CMH Chi-SquareValue One or more cells have 0 obs
387

5.2.6 % with serum creatinine tested in last 12 months
●
●
Creatinine
Valid ValueNV/NA
Valid Value NV/NA
025
5075
100
Barplot: 5.2.6.1 - Missing Data Creatinine (by Type of Diabetes)
●
●
Creatinine
YesNo
Type 1 Type 2
025
5075
100
Barplot: 5.2.6.2 - Creatinine (by Type of Diabetes)
388

5.2.6 % with serum creatinine tested in last 12 months
●
●
Creatinine
Valid ValueNV/NA
Valid Value NV/NA
025
5075
100
Barplot: 5.2.6.3 - Missing Data Creatinine (by Gender)
●
●
Creatinine
YesNo
Female Male
025
5075
100
Barplot: 5.2.6.4 - Creatinine (by Gender)
389

5.2.6 % with serum creatinine tested in last 12 months
●
●
Creatinine
Valid ValueNV/NA
Valid Value NV/NA
025
5075
100
Barplot: 5.2.6.5 - Missing Data Creatinine (by Age)
●
●
Creatinine
YesNo
[0 − 18) [18 − 35) [35 − 55) [55 − 75) [75 +)
025
5075
100
Barplot: 5.2.6.6 - Creatinine (by Age)
390

5.2.6 % with serum creatinine tested in last 12 monthsType of Diabetes = Type 1
●
●
Creatinine
Valid ValueNV/NA
Valid Value NV/NA
025
5075
100
Barplot: 5.2.6.7 - Missing Data Creatinine (by Gender, Type of Diabetes = Type 1)
●
●
Creatinine
YesNo
Female Male
025
5075
100
Barplot: 5.2.6.8 - Creatinine (by Gender, Type of Diabetes = Type 1)
391

5.2.6 % with serum creatinine tested in last 12 monthsType of Diabetes = Type 1
●
●
Creatinine
Valid ValueNV/NA
Valid Value NV/NA
025
5075
100
Barplot: 5.2.6.9 - Missing Data Creatinine (by Age, Type of Diabetes = Type 1)
●
●
Creatinine
YesNo
[0 − 18) [18 − 35) [35 − 55) [55 − 75) [75 +)
025
5075
100
Barplot: 5.2.6.10 - Creatinine (by Age, Type of Diabetes = Type 1)
392

5.2.6 % with serum creatinine tested in last 12 monthsType of Diabetes = Type 2
●
●
Creatinine
Valid ValueNV/NA
Valid Value NV/NA
025
5075
100
Barplot: 5.2.6.11 - Missing Data Creatinine (by Gender, Type of Diabetes = Type 2)
●
●
Creatinine
YesNo
Female Male
025
5075
100
Barplot: 5.2.6.12 - Creatinine (by Gender, Type of Diabetes = Type 2)
393

5.2.6 % with serum creatinine tested in last 12 monthsType of Diabetes = Type 2
●
●
Creatinine
Valid ValueNV/NA
Valid Value NV/NA
025
5075
100
Barplot: 5.2.6.13 - Missing Data Creatinine (by Age, Type of Diabetes = Type 2)
●
●
Creatinine
YesNo
[0 − 18) [18 − 35) [35 − 55) [55 − 75) [75 +)
025
5075
100
Barplot: 5.2.6.14 - Creatinine (by Age, Type of Diabetes = Type 2)
394

5.2.6 5.2.6 % with serum creatinine tested in last 12 monthsType of Diabetes = Type 2
s O E N CR AR 95% C.I. [O-E]/E % 95% C.I. [O-E]/E1 terni 2503 1812 2684 93.3 93.2 ( 91.5; 95.0) 38.1 ( 35.5; 40.8)2 orvieto 1016 815 1205 84.3 84.1 ( 81.5; 86.8) 24.7 ( 20.8; 28.6)3 spoleto 638 579 860 74.2 74.4 ( 71.2; 77.5) 10.2 ( 5.5; 14.8)4 foligno 222 203 300 74.0 73.8 ( 68.5; 79.1) 9.4 ( 1.6; 17.2)5 gubbio 730 708 1049 69.6 69.6 ( 66.8; 72.4) 3.1 ( -1.1; 7.3)6 perugia 768 1759 2609 29.4 29.5 ( 27.7; 31.3) -56.3 (-59.0;-53.7)
T 5877 8707 67.5
Standardized Estimates 5.2.6.15 - 5.2.6 % with serum creatinine tested in last 12 months
395

5.2.6 % with serum creatinine tested in last 12 monthsType of Diabetes = Type 2
perugia
gubbio
foligno
spoleto
orvieto
terni
0 20 40 60 80 100
29.5
69.6
73.8
74.4
84.1
93.2
67.5
Barplots: 5.2.6.17 - Adjusted Rates 5.2.6 % with serum creatinine tested in last 12 months
396

5.2.6 % with serum creatinine tested in last 12 monthsType of Diabetes = Type 2
●
●
●
●
●
●
[O−E]/E %
−100 −50 0 50 100
perugia
gubbio
foligno
spoleto
orvieto
terni
Forest plots: 5.2.6.4 - 5.2.6 % with serum creatinine tested in last 12 months
397

5.2.6 5.2.6 % with serum creatinine tested in last 12 monthsType of Diabetes = Type 1
s O E N CR AR 95% C.I. [O-E]/E % 95% C.I. [O-E]/E1 foligno 11 6 13 84.6 94.3 ( 64.2;100.0) 83.3 ( 18.2;148.5)2 terni 92 51 98 93.9 92.8 ( 83.2;100.0) 80.4 ( 62.0; 98.8)3 orvieto 47 27 51 92.2 89.5 ( 76.4;100.0) 74.1 ( 49.2; 98.9)4 gubbio 39 24 49 79.6 83.6 ( 69.1; 98.1) 62.5 ( 32.9; 92.1)5 spoleto 24 16 30 80.0 77.1 ( 60.1; 94.2) 50.0 ( 18.0; 82.0)6 perugia 129 215 424 30.4 30.9 ( 26.1; 35.6) -40.0 (-49.3;-30.7)
T 342 665 51.4
Standardized Estimates 5.2.6.16 - 5.2.6 % with serum creatinine tested in last 12 months
398

5.2.6 % with serum creatinine tested in last 12 monthsType of Diabetes = Type 1
perugia
spoleto
gubbio
orvieto
terni
foligno
0 20 40 60 80 100
30.9
77.1
83.6
89.5
92.8
94.3
51.4
Barplots: 5.2.6.18 - Adjusted Rates 5.2.6 % with serum creatinine tested in last 12 months
399

5.2.6 % with serum creatinine tested in last 12 monthsType of Diabetes = Type 1
●
●
●
●
●
●
[O−E]/E %
−100 −50 0 50 100
perugia
spoleto
gubbio
orvieto
terni
foligno
Forest plots: 5.2.6.5 - 5.2.6 % with serum creatinine tested in last 12 months
400

5.2.7 % of subjects with diabetes and one or more blood pressure measure-ments within the last 12 months
BP measurements Type of DiabetesValid Value ( % ) NV/NA ( % ) N ( % )
Valid Value 9372 (100.0) 0( 0.0) 9372 (100.0)NV/NA 0 ( 0.0) 0( 0.0) 0 ( 0.0)TOTAL 9372(100.0) 0( 0.0) 9372 (100.0)
Table 5.2.7.1: Missing Data BP measurements (by Type of Diabetes)
BP measurements Type of DiabetesType 1 ( % ) Type 2 ( % ) N ( % )
Yes 249 ( 37.4) 5679( 65.2) 5928 ( 63.3)No 416 ( 62.6) 3028( 34.8) 3444 ( 36.7)
TOTAL 665( 7.1) 8707( 92.9) 9372 (100.0)
Table 5.2.7.2: BP measurements (by Type of Diabetes)
CMH Chi-Square p.value dfValue 203.9269 0 1
401

5.2.7 % of subjects with diabetes and one or more blood pressure measurements within the last 12 months
BP measurements GenderValid Value ( % ) NV/NA ( % ) N ( % )
Valid Value 9372 (100.0) 0( 0.0) 9372 (100.0)NV/NA 0 ( 0.0) 0( 0.0) 0 ( 0.0)TOTAL 9372(100.0) 0( 0.0) 9372 (100.0)
Table 5.2.7.3: Missing Data BP measurements (by Gender)
BP measurements GenderMale ( % ) Female ( % ) N ( % )
Yes 3205 ( 63.4) 2723( 63.1) 5928 ( 63.3)No 1852 ( 36.6) 1592( 36.9) 3444 ( 36.7)
TOTAL 5057( 54.0) 4315( 46.0) 9372 (100.0)
Table 5.2.7.4: BP measurements (by Gender)
CMH Chi-Square p.value dfValue 0.0629 0.802 1
402

5.2.7 % of subjects with diabetes and one or more blood pressure measurements within the last 12 months
BP measurements AgeValid Value ( % ) NV/NA ( % ) N ( % )
Valid Value 9372 (100.0) 0( 0.0) 9372 (100.0)NV/NA 0 ( 0.0) 0( 0.0) 0 ( 0.0)TOTAL 9372(100.0) 0( 0.0) 9372 (100.0)
Table 5.2.7.5: Missing Data BP measurements (by Age)
BP measurements Age[0 - 18) ( % ) [18 - 35) ( % ) [35 - 55) ( % ) [55 - 75) ( % ) [75+) ( % ) N ( % )
Yes 1 ( 16.7) 72 ( 36.9) 749 ( 57.6) 3744 ( 66.9) 1362( 60.0) 5928 ( 63.3)No 5 ( 83.3) 123 ( 63.1) 551 ( 42.4) 1856 ( 33.1) 909( 40.0) 3444 ( 36.7)
TOTAL 6( 0.1) 195( 2.1) 1300( 13.9) 5600( 59.8) 2271( 24.2) 9372 (100.0)
Table 5.2.7.6: BP measurements (by Age)
CMH Chi-Square p.value dfValue 123.3417 0 4
403

5.2.7 % of subjects with diabetes and one or more blood pressure measurements within the last 12 monthsType of Diabetes = Type 1
BP measurements GenderValid Value ( % ) NV/NA ( % ) N ( % )
Valid Value 665 (100.0) 0( 0.0) 665 (100.0)NV/NA 0 ( 0.0) 0( 0.0) 0 ( 0.0)TOTAL 665(100.0) 0( 0.0) 665 (100.0)
Table 5.2.7.7: Missing Data BP measurements (by Gender, Type of Diabetes = Type 1)
BP measurements GenderMale ( % ) Female ( % ) N ( % )
Yes 136 ( 38.2) 113( 36.6) 249 ( 37.4)No 220 ( 61.8) 196( 63.4) 416 ( 62.6)
TOTAL 356( 53.5) 309( 46.5) 665 (100.0)Table 5.2.7.8: BP measurements (by Gender, Type of Diabetes = Type 1)
CMH Chi-Square p.value dfValue 0.125 0.7237 1
404

5.2.7 % of subjects with diabetes and one or more blood pressure measurements within the last 12 monthsType of Diabetes = Type 1
BP measurements AgeValid Value ( % ) NV/NA ( % ) N ( % )
Valid Value 665 (100.0) 0( 0.0) 665 (100.0)NV/NA 0 ( 0.0) 0( 0.0) 0 ( 0.0)TOTAL 665(100.0) 0( 0.0) 665 (100.0)
Table 5.2.7.9: Missing Data BP measurements (by Age, Type of Diabetes = Type 1)
BP measurements Age[0 - 18) ( % ) [18 - 35) ( % ) [35 - 55) ( % ) [55 - 75) ( % ) [75+) ( % ) N ( % )
Yes 1 ( 20.0) 53 ( 32.7) 120 ( 36.6) 71 ( 44.9) 4( 33.3) 249 ( 37.4)No 4 ( 80.0) 109 ( 67.3) 208 ( 63.4) 87 ( 55.1) 8( 66.7) 416 ( 62.6)
TOTAL 5( 0.8) 162( 24.4) 328( 49.3) 158( 23.8) 12( 1.8) 665 (100.0)
Table 5.2.7.10: BP measurements (by Age, Type of Diabetes = Type 1)
CMH Chi-Square p.value dfValue 6.1723 0.1866 4
405

5.2.7 % of subjects with diabetes and one or more blood pressure measurements within the last 12 monthsType of Diabetes = Type 2
BP measurements GenderValid Value ( % ) NV/NA ( % ) N ( % )
Valid Value 8707 (100.0) 0( 0.0) 8707 (100.0)NV/NA 0 ( 0.0) 0( 0.0) 0 ( 0.0)TOTAL 8707(100.0) 0( 0.0) 8707 (100.0)
Table 5.2.7.11: Missing Data BP measurements (by Gender, Type of Diabetes = Type 2)
BP measurements GenderMale ( % ) Female ( % ) N ( % )
Yes 3069 ( 65.3) 2610( 65.2) 5679 ( 65.2)No 1632 ( 34.7) 1396( 34.8) 3028 ( 34.8)
TOTAL 4701( 54.0) 4006( 46.0) 8707 (100.0)
Table 5.2.7.12: BP measurements (by Gender, Type of Diabetes = Type 2)
CMH Chi-Square p.value dfValue 0.0112 0.9155 1
406
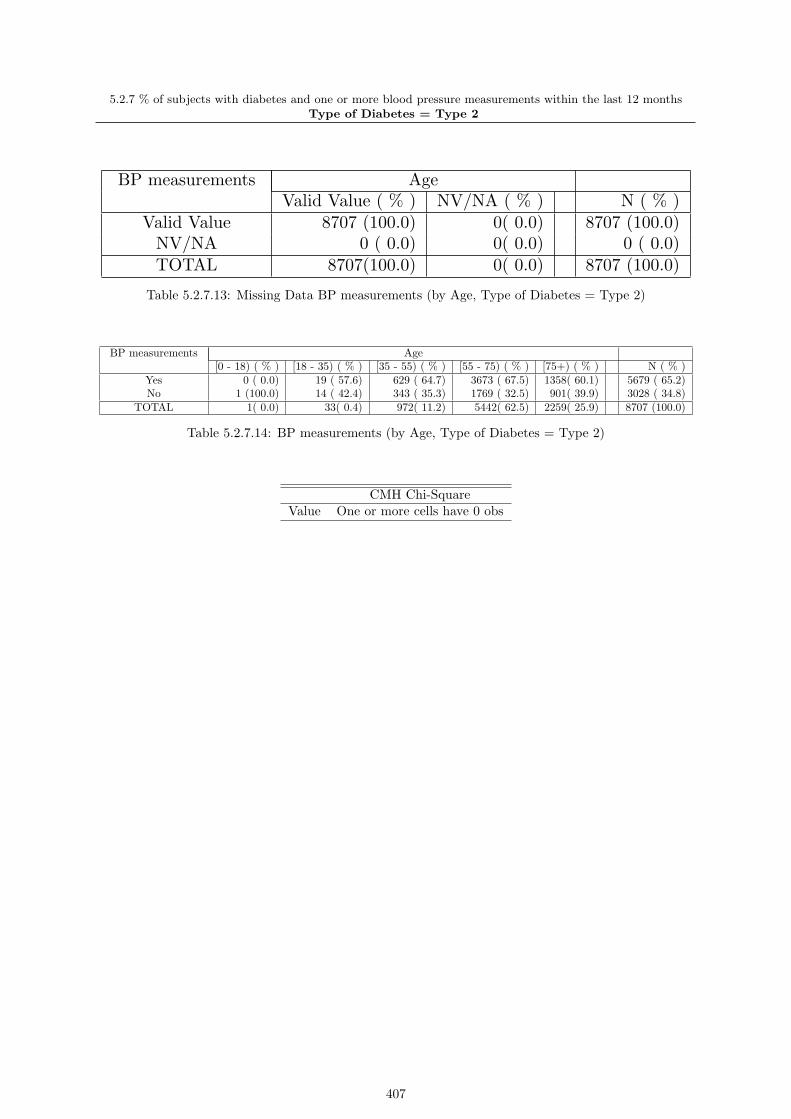
5.2.7 % of subjects with diabetes and one or more blood pressure measurements within the last 12 monthsType of Diabetes = Type 2
BP measurements AgeValid Value ( % ) NV/NA ( % ) N ( % )
Valid Value 8707 (100.0) 0( 0.0) 8707 (100.0)NV/NA 0 ( 0.0) 0( 0.0) 0 ( 0.0)TOTAL 8707(100.0) 0( 0.0) 8707 (100.0)
Table 5.2.7.13: Missing Data BP measurements (by Age, Type of Diabetes = Type 2)
BP measurements Age[0 - 18) ( % ) [18 - 35) ( % ) [35 - 55) ( % ) [55 - 75) ( % ) [75+) ( % ) N ( % )
Yes 0 ( 0.0) 19 ( 57.6) 629 ( 64.7) 3673 ( 67.5) 1358( 60.1) 5679 ( 65.2)No 1 (100.0) 14 ( 42.4) 343 ( 35.3) 1769 ( 32.5) 901( 39.9) 3028 ( 34.8)
TOTAL 1( 0.0) 33( 0.4) 972( 11.2) 5442( 62.5) 2259( 25.9) 8707 (100.0)
Table 5.2.7.14: BP measurements (by Age, Type of Diabetes = Type 2)
CMH Chi-SquareValue One or more cells have 0 obs
407

5.2.7 % of subjects with diabetes and one or more blood pressure measurements within the last 12 months
●
●
BP measurements
Valid ValueNV/NA
Valid Value NV/NA
025
5075
100
Barplot: 5.2.7.1 - Missing Data BP measurements (by Type of Diabetes)
●
●
BP measurements
YesNo
Type 1 Type 2
025
5075
100
Barplot: 5.2.7.2 - BP measurements (by Type of Diabetes)
408

5.2.7 % of subjects with diabetes and one or more blood pressure measurements within the last 12 months
●
●
BP measurements
Valid ValueNV/NA
Valid Value NV/NA
025
5075
100
Barplot: 5.2.7.3 - Missing Data BP measurements (by Gender)
●
●
BP measurements
YesNo
Female Male
025
5075
100
Barplot: 5.2.7.4 - BP measurements (by Gender)
409

5.2.7 % of subjects with diabetes and one or more blood pressure measurements within the last 12 months
●
●
BP measurements
Valid ValueNV/NA
Valid Value NV/NA
025
5075
100
Barplot: 5.2.7.5 - Missing Data BP measurements (by Age)
●
●
BP measurements
YesNo
[0 − 18) [18 − 35) [35 − 55) [55 − 75) [75 +)
025
5075
100
Barplot: 5.2.7.6 - BP measurements (by Age)
410

5.2.7 % of subjects with diabetes and one or more blood pressure measurements within the last 12 monthsType of Diabetes = Type 1
●
●
BP measurements
Valid ValueNV/NA
Valid Value NV/NA
025
5075
100
Barplot: 5.2.7.7 - Missing Data BP measurements (by Gender, Type of Diabetes = Type 1)
●
●
BP measurements
YesNo
Female Male
025
5075
100
Barplot: 5.2.7.8 - BP measurements (by Gender, Type of Diabetes = Type 1)
411

5.2.7 % of subjects with diabetes and one or more blood pressure measurements within the last 12 monthsType of Diabetes = Type 1
●
●
BP measurements
Valid ValueNV/NA
Valid Value NV/NA
025
5075
100
Barplot: 5.2.7.9 - Missing Data BP measurements (by Age, Type of Diabetes = Type 1)
●
●
BP measurements
YesNo
[0 − 18) [18 − 35) [35 − 55) [55 − 75) [75 +)
025
5075
100
Barplot: 5.2.7.10 - BP measurements (by Age, Type of Diabetes = Type 1)
412

5.2.7 % of subjects with diabetes and one or more blood pressure measurements within the last 12 monthsType of Diabetes = Type 2
●
●
BP measurements
Valid ValueNV/NA
Valid Value NV/NA
025
5075
100
Barplot: 5.2.7.11 - Missing Data BP measurements (by Gender, Type of Diabetes = Type 2)
●
●
BP measurements
YesNo
Female Male
025
5075
100
Barplot: 5.2.7.12 - BP measurements (by Gender, Type of Diabetes = Type 2)
413

5.2.7 % of subjects with diabetes and one or more blood pressure measurements within the last 12 monthsType of Diabetes = Type 2
●
●
BP measurements
Valid ValueNV/NA
Valid Value NV/NA
025
5075
100
Barplot: 5.2.7.13 - Missing Data BP measurements (by Age, Type of Diabetes = Type 2)
●
●
BP measurements
YesNo
[0 − 18) [18 − 35) [35 − 55) [55 − 75) [75 +)
025
5075
100
Barplot: 5.2.7.14 - BP measurements (by Age, Type of Diabetes = Type 2)
414

5.2.7 5.2.7 % of subjects with diabetes and one or more blood pressure measurements within the last 12 monthsType of Diabetes = Type 2
s O E N CR AR 95% C.I. [O-E]/E % 95% C.I. [O-E]/E1 terni 2509 1747 2684 93.5 93.7 ( 91.9; 95.5) 43.6 ( 40.9; 46.4)2 gubbio 941 688 1049 89.7 89.2 ( 86.4; 92.1) 36.8 ( 32.4; 41.1)3 orvieto 1030 791 1205 85.5 84.9 ( 82.3; 87.6) 30.2 ( 26.2; 34.3)4 foligno 242 196 300 80.7 80.5 ( 75.2; 85.9) 23.5 ( 15.3; 31.7)5 perugia 939 1703 2609 36.0 36.0 ( 34.1; 37.8) -44.9 ( -47.6;-42.1)6 spoleto 18 555 860 2.1 2.1 ( -1.1; 5.3) -96.8 (-101.7;-91.8)
T 5679 8707 65.2
Standardized Estimates 5.2.7.15 - 5.2.7 % of subjects with diabetes and one or more blood pressuremeasurements within the last 12 months
415

5.2.7 % of subjects with diabetes and one or more blood pressure measurements within the last 12 monthsType of Diabetes = Type 2
spoleto
perugia
foligno
orvieto
gubbio
terni
0 20 40 60 80 100
2.1
36.0
80.5
84.9
89.2
93.7
65.2
Barplots: 5.2.7.17 - Adjusted Rates 5.2.7 % of subjects with diabetes and one or more bloodpressure measurements within the last 12 months
416

5.2.7 % of subjects with diabetes and one or more blood pressure measurements within the last 12 monthsType of Diabetes = Type 2
●
●
●
●
●
●
[O−E]/E %
−100 −50 0 50 100
spoleto
perugia
foligno
orvieto
gubbio
terni
Forest plots: 5.2.7.6 - 5.2.7 % of subjects with diabetes and one or more blood pressuremeasurements within the last 12 months
417

5.2.7 5.2.7 % of subjects with diabetes and one or more blood pressure measurements within the last 12 monthsType of Diabetes = Type 1
s O E N CR AR 95% C.I. [O-E]/E % 95% C.I. [O-E]/E1 orvieto 49 20 51 96.1 100.0 ( 88.5;100.0) 145.0 (108.6;181.4)2 spoleto 30 12 30 100.0 100.0 ( 86.4;100.0) 150.0 (103.8;196.2)3 gubbio 47 21 49 95.9 93.9 ( 80.5;100.0) 123.8 ( 92.6;155.1)4 terni 83 41 98 84.7 84.9 ( 75.2; 94.6) 102.4 ( 79.2;125.7)5 foligno 9 5 13 69.2 75.5 ( 46.9;100.0) 80.0 ( 5.7;154.3)6 perugia 61 172 424 14.4 14.9 ( 10.1; 19.6) -64.5 (-76.3;-52.8)
T 279 665 42.0
Standardized Estimates 5.2.7.16 - 5.2.7 % of subjects with diabetes and one or more blood pressuremeasurements within the last 12 months
418

5.2.7 % of subjects with diabetes and one or more blood pressure measurements within the last 12 monthsType of Diabetes = Type 1
perugia
foligno
terni
gubbio
orvieto
spoleto
0 20 40 60 80 100
14.9
75.5
84.9
93.9
100.0
100.0
42
Barplots: 5.2.7.18 - Adjusted Rates 5.2.7 % of subjects with diabetes and one or more bloodpressure measurements within the last 12 months
419

5.2.7 % of subjects with diabetes and one or more blood pressure measurements within the last 12 monthsType of Diabetes = Type 1
●
●
●
[O−E]/E %
−100 −50 0 50 100
perugia
foligno
terni
gubbio
orvieto
spoleto
Forest plots: 5.2.7.7 - 5.2.7 % of subjects with diabetes and one or more blood pressuremeasurements within the last 12 months
420

5.2.10 % of subjects treated with insulin
insulin Type of DiabetesValid Value ( % ) NV/NA ( % ) N ( % )
Valid Value 9372 (100.0) 0( 0.0) 9372 (100.0)NV/NA 0 ( 0.0) 0( 0.0) 0 ( 0.0)TOTAL 9372(100.0) 0( 0.0) 9372 (100.0)
Table 5.2.10.1: Missing Data insulin (by Type of Diabetes)
insulin Type of DiabetesType 1 ( % ) Type 2 ( % ) N ( % )
Treated 629 ( 94.6) 3309( 38.0) 3938 ( 42.0)Not Treated 36 ( 5.4) 5398( 62.0) 5434 ( 58.0)
TOTAL 665( 7.1) 8707( 92.9) 9372 (100.0)Table 5.2.10.2: insulin (by Type of Diabetes)
CMH Chi-Square p.value dfValue 809.5601 0 1
421

5.2.10 % of subjects treated with insulin
insulin GenderValid Value ( % ) NV/NA ( % ) N ( % )
Valid Value 9372 (100.0) 0( 0.0) 9372 (100.0)NV/NA 0 ( 0.0) 0( 0.0) 0 ( 0.0)TOTAL 9372(100.0) 0( 0.0) 9372 (100.0)
Table 5.2.10.3: Missing Data insulin (by Gender)
insulin GenderMale ( % ) Female ( % ) N ( % )
Treated 2050 ( 40.5) 1888( 43.8) 3938 ( 42.0)Not Treated 3007 ( 59.5) 2427( 56.2) 5434 ( 58.0)
TOTAL 5057( 54.0) 4315( 46.0) 9372 (100.0)Table 5.2.10.4: insulin (by Gender)
CMH Chi-Square p.value dfValue 9.7556 0.0018 1
422
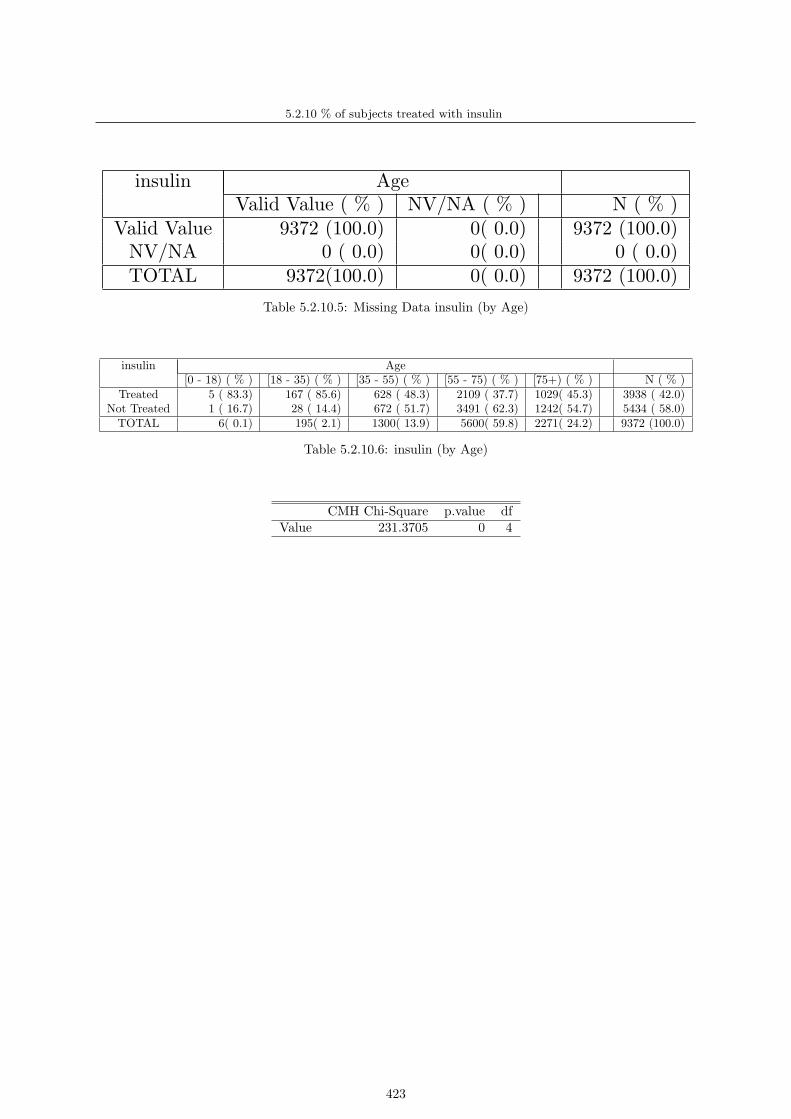
5.2.10 % of subjects treated with insulin
insulin AgeValid Value ( % ) NV/NA ( % ) N ( % )
Valid Value 9372 (100.0) 0( 0.0) 9372 (100.0)NV/NA 0 ( 0.0) 0( 0.0) 0 ( 0.0)TOTAL 9372(100.0) 0( 0.0) 9372 (100.0)
Table 5.2.10.5: Missing Data insulin (by Age)
insulin Age[0 - 18) ( % ) [18 - 35) ( % ) [35 - 55) ( % ) [55 - 75) ( % ) [75+) ( % ) N ( % )
Treated 5 ( 83.3) 167 ( 85.6) 628 ( 48.3) 2109 ( 37.7) 1029( 45.3) 3938 ( 42.0)Not Treated 1 ( 16.7) 28 ( 14.4) 672 ( 51.7) 3491 ( 62.3) 1242( 54.7) 5434 ( 58.0)
TOTAL 6( 0.1) 195( 2.1) 1300( 13.9) 5600( 59.8) 2271( 24.2) 9372 (100.0)
Table 5.2.10.6: insulin (by Age)
CMH Chi-Square p.value dfValue 231.3705 0 4
423

5.2.10 % of subjects treated with insulinType of Diabetes = Type 1
insulin GenderValid Value ( % ) NV/NA ( % ) N ( % )
Valid Value 665 (100.0) 0( 0.0) 665 (100.0)NV/NA 0 ( 0.0) 0( 0.0) 0 ( 0.0)TOTAL 665(100.0) 0( 0.0) 665 (100.0)
Table 5.2.10.7: Missing Data insulin (by Gender, Type of Diabetes = Type 1)
insulin GenderMale ( % ) Female ( % ) N ( % )
Treated 339 ( 95.2) 290( 93.9) 629 ( 94.6)Not Treated 17 ( 4.8) 19( 6.1) 36 ( 5.4)
TOTAL 356( 53.5) 309( 46.5) 665 (100.0)Table 5.2.10.8: insulin (by Gender, Type of Diabetes = Type 1)
CMH Chi-Square p.value dfValue 0.3708 0.5426 1
424

5.2.10 % of subjects treated with insulinType of Diabetes = Type 1
insulin AgeValid Value ( % ) NV/NA ( % ) N ( % )
Valid Value 665 (100.0) 0( 0.0) 665 (100.0)NV/NA 0 ( 0.0) 0( 0.0) 0 ( 0.0)TOTAL 665(100.0) 0( 0.0) 665 (100.0)
Table 5.2.10.9: Missing Data insulin (by Age, Type of Diabetes = Type 1)
insulin Age[0 - 18) ( % ) [18 - 35) ( % ) [35 - 55) ( % ) [55 - 75) ( % ) [75+) ( % ) N ( % )
Treated 5 (100.0) 153 ( 94.4) 312 ( 95.1) 149 ( 94.3) 10( 83.3) 629 ( 94.6)Not Treated 0 ( 0.0) 9 ( 5.6) 16 ( 4.9) 9 ( 5.7) 2( 16.7) 36 ( 5.4)
TOTAL 5( 0.8) 162( 24.4) 328( 49.3) 158( 23.8) 12( 1.8) 665 (100.0)
Table 5.2.10.10: insulin (by Age, Type of Diabetes = Type 1)
CMH Chi-SquareValue One or more cells have 0 obs
425
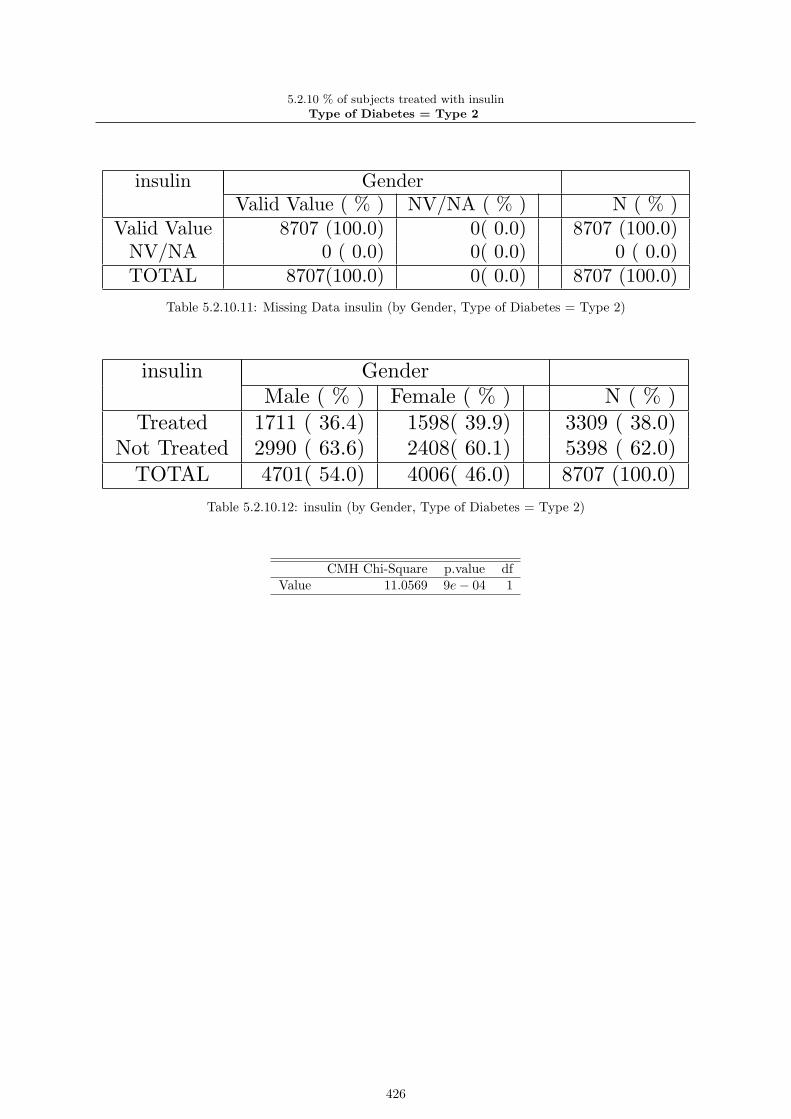
5.2.10 % of subjects treated with insulinType of Diabetes = Type 2
insulin GenderValid Value ( % ) NV/NA ( % ) N ( % )
Valid Value 8707 (100.0) 0( 0.0) 8707 (100.0)NV/NA 0 ( 0.0) 0( 0.0) 0 ( 0.0)TOTAL 8707(100.0) 0( 0.0) 8707 (100.0)
Table 5.2.10.11: Missing Data insulin (by Gender, Type of Diabetes = Type 2)
insulin GenderMale ( % ) Female ( % ) N ( % )
Treated 1711 ( 36.4) 1598( 39.9) 3309 ( 38.0)Not Treated 2990 ( 63.6) 2408( 60.1) 5398 ( 62.0)
TOTAL 4701( 54.0) 4006( 46.0) 8707 (100.0)Table 5.2.10.12: insulin (by Gender, Type of Diabetes = Type 2)
CMH Chi-Square p.value dfValue 11.0569 9e− 04 1
426

5.2.10 % of subjects treated with insulinType of Diabetes = Type 2
insulin AgeValid Value ( % ) NV/NA ( % ) N ( % )
Valid Value 8707 (100.0) 0( 0.0) 8707 (100.0)NV/NA 0 ( 0.0) 0( 0.0) 0 ( 0.0)TOTAL 8707(100.0) 0( 0.0) 8707 (100.0)
Table 5.2.10.13: Missing Data insulin (by Age, Type of Diabetes = Type 2)
insulin Age[0 - 18) ( % ) [18 - 35) ( % ) [35 - 55) ( % ) [55 - 75) ( % ) [75+) ( % ) N ( % )
Treated 0 ( 0.0) 14 ( 42.4) 316 ( 32.5) 1960 ( 36.0) 1019( 45.1) 3309 ( 38.0)Not Treated 1 (100.0) 19 ( 57.6) 656 ( 67.5) 3482 ( 64.0) 1240( 54.9) 5398 ( 62.0)
TOTAL 1( 0.0) 33( 0.4) 972( 11.2) 5442( 62.5) 2259( 25.9) 8707 (100.0)
Table 5.2.10.14: insulin (by Age, Type of Diabetes = Type 2)
CMH Chi-SquareValue One or more cells have 0 obs
427

5.2.10 % of subjects treated with insulin
●
●
insulin
Valid ValueNV/NA
Valid Value NV/NA
025
5075
100
Barplot: 5.2.10.1 - Missing Data insulin (by Type of Diabetes)
●
●
insulin
TreatedNot Treated
Type 1 Type 2
025
5075
100
Barplot: 5.2.10.2 - insulin (by Type of Diabetes)
428

5.2.10 % of subjects treated with insulin
●
●
insulin
Valid ValueNV/NA
Valid Value NV/NA
025
5075
100
Barplot: 5.2.10.3 - Missing Data insulin (by Gender)
●
●
insulin
TreatedNot Treated
Female Male
025
5075
100
Barplot: 5.2.10.4 - insulin (by Gender)
429

5.2.10 % of subjects treated with insulin
●
●
insulin
Valid ValueNV/NA
Valid Value NV/NA
025
5075
100
Barplot: 5.2.10.5 - Missing Data insulin (by Age)
●
●
insulin
TreatedNot Treated
[0 − 18) [18 − 35) [35 − 55) [55 − 75) [75 +)
025
5075
100
Barplot: 5.2.10.6 - insulin (by Age)
430

5.2.10 % of subjects treated with insulinType of Diabetes = Type 1
●
●
insulin
Valid ValueNV/NA
Valid Value NV/NA
025
5075
100
Barplot: 5.2.10.7 - Missing Data insulin (by Gender, Type of Diabetes = Type 1)
●
●
insulin
TreatedNot Treated
Female Male
025
5075
100
Barplot: 5.2.10.8 - insulin (by Gender, Type of Diabetes = Type 1)
431

5.2.10 % of subjects treated with insulinType of Diabetes = Type 1
●
●
insulin
Valid ValueNV/NA
Valid Value NV/NA
025
5075
100
Barplot: 5.2.10.9 - Missing Data insulin (by Age, Type of Diabetes = Type 1)
●
●
insulin
TreatedNot Treated
[0 − 18) [18 − 35) [35 − 55) [55 − 75) [75 +)
025
5075
100
Barplot: 5.2.10.10 - insulin (by Age, Type of Diabetes = Type 1)
432
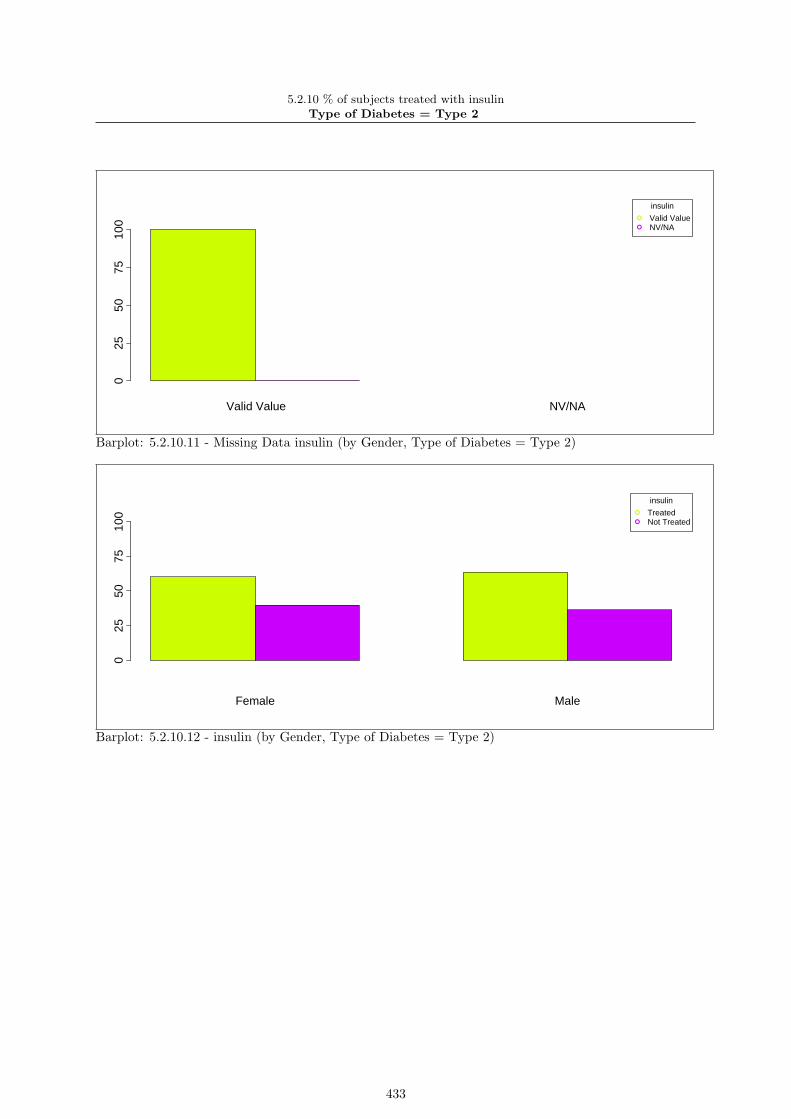
5.2.10 % of subjects treated with insulinType of Diabetes = Type 2
●
●
insulin
Valid ValueNV/NA
Valid Value NV/NA
025
5075
100
Barplot: 5.2.10.11 - Missing Data insulin (by Gender, Type of Diabetes = Type 2)
●
●
insulin
TreatedNot Treated
Female Male
025
5075
100
Barplot: 5.2.10.12 - insulin (by Gender, Type of Diabetes = Type 2)
433

5.2.10 % of subjects treated with insulinType of Diabetes = Type 2
●
●
insulin
Valid ValueNV/NA
Valid Value NV/NA
025
5075
100
Barplot: 5.2.10.13 - Missing Data insulin (by Age, Type of Diabetes = Type 2)
●
●
insulin
TreatedNot Treated
[0 − 18) [18 − 35) [35 − 55) [55 − 75) [75 +)
025
5075
100
Barplot: 5.2.10.14 - insulin (by Age, Type of Diabetes = Type 2)
434

5.2.10 5.2.10 % of subjects treated with insulinType of Diabetes = Type 2
s O E N CR AR 95% C.I. [O-E]/E % 95% C.I. [O-E]/E1 perugia 1481 992 2609 56.8 56.7 ( 54.9; 58.6) 49.3 ( 44.4; 54.2)2 gubbio 380 393 1049 36.2 36.7 ( 33.8; 39.7) -3.3 (-11.2; 4.6)3 orvieto 400 453 1205 33.2 33.6 ( 30.8; 36.3) -11.7 (-19.0; -4.4)4 spoleto 247 332 860 28.7 28.3 ( 25.1; 31.5) -25.6 (-33.8;-17.4)5 terni 726 1026 2684 27.0 26.9 ( 25.1; 28.7) -29.2 (-34.0;-24.5)6 foligno 75 114 300 25.0 25.0 ( 19.5; 30.5) -34.2 (-48.6;-19.8)
T 3309 8707 38.0
Standardized Estimates 5.2.10.15 - 5.2.10 % of subjects treated with insulin
435

5.2.10 % of subjects treated with insulinType of Diabetes = Type 2
foligno
terni
spoleto
orvieto
gubbio
perugia
0 20 40 60 80 100
25.0
26.9
28.3
33.6
36.7
56.7
38
Barplots: 5.2.10.17 - Adjusted Rates 5.2.10 % of subjects treated with insulin
436

5.2.10 % of subjects treated with insulinType of Diabetes = Type 2
●
●
●
●
●
●
[O−E]/E %
−100 −50 0 50 100
foligno
terni
spoleto
orvieto
gubbio
perugia
Forest plots: 5.2.10.8 - 5.2.10 % of subjects treated with insulin
437

5.2.10 5.2.10 % of subjects treated with insulinType of Diabetes = Type 1
s O E N CR AR 95% C.I. [O-E]/E % 95% C.I. [O-E]/E1 perugia 402 401 424 94.8 94.8 ( 92.8; 96.9) 0.2 ( -1.9; 2.4 )2 terni 93 93 98 94.9 94.6 ( 90.2; 99.0) 0.0 ( -4.7; 4.7 )3 spoleto 29 30 30 96.7 91.4 ( 83.1; 99.8) -3.3 (-11.7; 5.0 )4 orvieto 49 51 51 96.1 90.9 ( 84.9; 96.8) -3.9 ( -9.9; 2.0 )5 gubbio 45 47 49 91.8 90.6 ( 84.2; 96.9) -4.3 (-10.8; 2.3 )6 foligno 11 13 13 84.6 80.0 ( 69.6; 90.4) -15.4 (-25.8;-5.0 )
T 629 665 94.6
Standardized Estimates 5.2.10.16 - 5.2.10 % of subjects treated with insulin
438
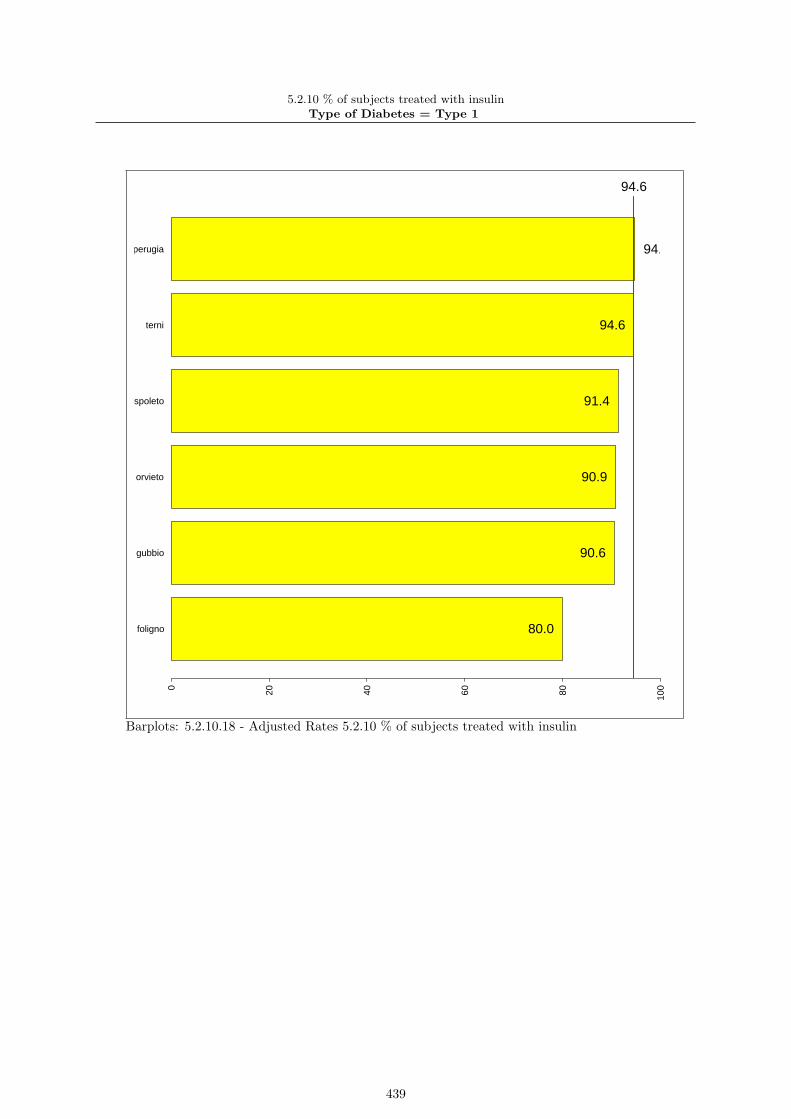
5.2.10 % of subjects treated with insulinType of Diabetes = Type 1
foligno
gubbio
orvieto
spoleto
terni
perugia
0 20 40 60 80 100
80.0
90.6
90.9
91.4
94.6
94.8
94.6
Barplots: 5.2.10.18 - Adjusted Rates 5.2.10 % of subjects treated with insulin
439

5.2.10 % of subjects treated with insulinType of Diabetes = Type 1
●
●
●
●
●
●
[O−E]/E %
−100 −50 0 50 100
foligno
gubbio
orvieto
spoleto
terni
perugia
Forest plots: 5.2.10.9 - 5.2.10 % of subjects treated with insulin
440

5.3. Outcome quality - intermediate outcomes
441

5.3.1 % of subjects with most recent HbA1c level greater than 9.0 pct (poorcontrol)
HbA1c Type of DiabetesValid Value ( % ) NV/NA ( % ) N ( % )
Valid Value 8797 ( 93.9) 0( 0.0) 8797 ( 93.9)NV/NA 575 ( 6.1) 0( 0.0) 575 ( 6.1)TOTAL 9372(100.0) 0( 0.0) 9372 (100.0)
Table 5.3.1.1: Missing Data HbA1c (by Type of Diabetes)
HbA1c Type of DiabetesType 1 ( % ) Type 2 ( % ) N ( % )
(0 - 9] 545 ( 87.8) 7558( 92.4) 8103 ( 92.1)(9 + ) 76 ( 12.2) 618( 7.6) 694 ( 7.9)
TOTAL 621( 7.1) 8176( 92.9) 8797 (100.0)Table 5.3.1.2: HbA1c (by Type of Diabetes)
CMH Chi-Square p.value dfValue 16.7553 0 1
442

5.3.1 % of subjects with most recent HbA1c level greater than 9.0 pct (poor control)
HbA1c GenderValid Value ( % ) NV/NA ( % ) N ( % )
Valid Value 8797 ( 93.9) 0( 0.0) 8797 ( 93.9)NV/NA 575 ( 6.1) 0( 0.0) 575 ( 6.1)TOTAL 9372(100.0) 0( 0.0) 9372 (100.0)
Table 5.3.1.3: Missing Data HbA1c (by Gender)
HbA1c GenderMale ( % ) Female ( % ) N ( % )
(0 - 9] 4438 ( 93.1) 3665( 91.0) 8103 ( 92.1)(9 + ) 331 ( 6.9) 363( 9.0) 694 ( 7.9)
TOTAL 4769( 54.2) 4028( 45.8) 8797 (100.0)Table 5.3.1.4: HbA1c (by Gender)
CMH Chi-Square p.value dfValue 12.6084 4e− 04 1
443
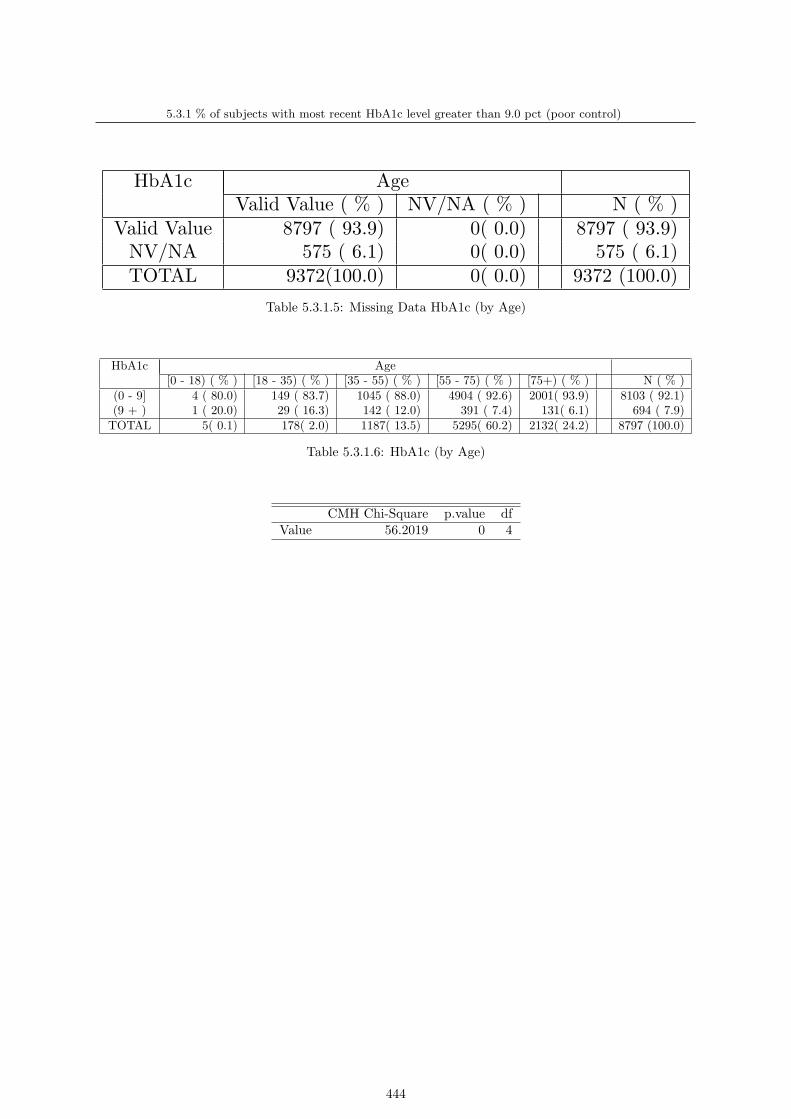
5.3.1 % of subjects with most recent HbA1c level greater than 9.0 pct (poor control)
HbA1c AgeValid Value ( % ) NV/NA ( % ) N ( % )
Valid Value 8797 ( 93.9) 0( 0.0) 8797 ( 93.9)NV/NA 575 ( 6.1) 0( 0.0) 575 ( 6.1)TOTAL 9372(100.0) 0( 0.0) 9372 (100.0)
Table 5.3.1.5: Missing Data HbA1c (by Age)
HbA1c Age[0 - 18) ( % ) [18 - 35) ( % ) [35 - 55) ( % ) [55 - 75) ( % ) [75+) ( % ) N ( % )
(0 - 9] 4 ( 80.0) 149 ( 83.7) 1045 ( 88.0) 4904 ( 92.6) 2001( 93.9) 8103 ( 92.1)(9 + ) 1 ( 20.0) 29 ( 16.3) 142 ( 12.0) 391 ( 7.4) 131( 6.1) 694 ( 7.9)
TOTAL 5( 0.1) 178( 2.0) 1187( 13.5) 5295( 60.2) 2132( 24.2) 8797 (100.0)
Table 5.3.1.6: HbA1c (by Age)
CMH Chi-Square p.value dfValue 56.2019 0 4
444

5.3.1 % of subjects with most recent HbA1c level greater than 9.0 pct (poor control)Type of Diabetes = Type 1
HbA1c GenderValid Value ( % ) NV/NA ( % ) N ( % )
Valid Value 621 ( 93.4) 0( 0.0) 621 ( 93.4)NV/NA 44 ( 6.6) 0( 0.0) 44 ( 6.6)TOTAL 665(100.0) 0( 0.0) 665 (100.0)
Table 5.3.1.7: Missing Data HbA1c (by Gender, Type of Diabetes = Type 1)
HbA1c GenderMale ( % ) Female ( % ) N ( % )
(0 - 9] 299 ( 88.5) 246( 86.9) 545 ( 87.8)(9 + ) 39 ( 11.5) 37( 13.1) 76 ( 12.2)
TOTAL 338( 54.4) 283( 45.6) 621 (100.0)Table 5.3.1.8: HbA1c (by Gender, Type of Diabetes = Type 1)
CMH Chi-Square p.value dfValue 0.2104 0.6465 1
445
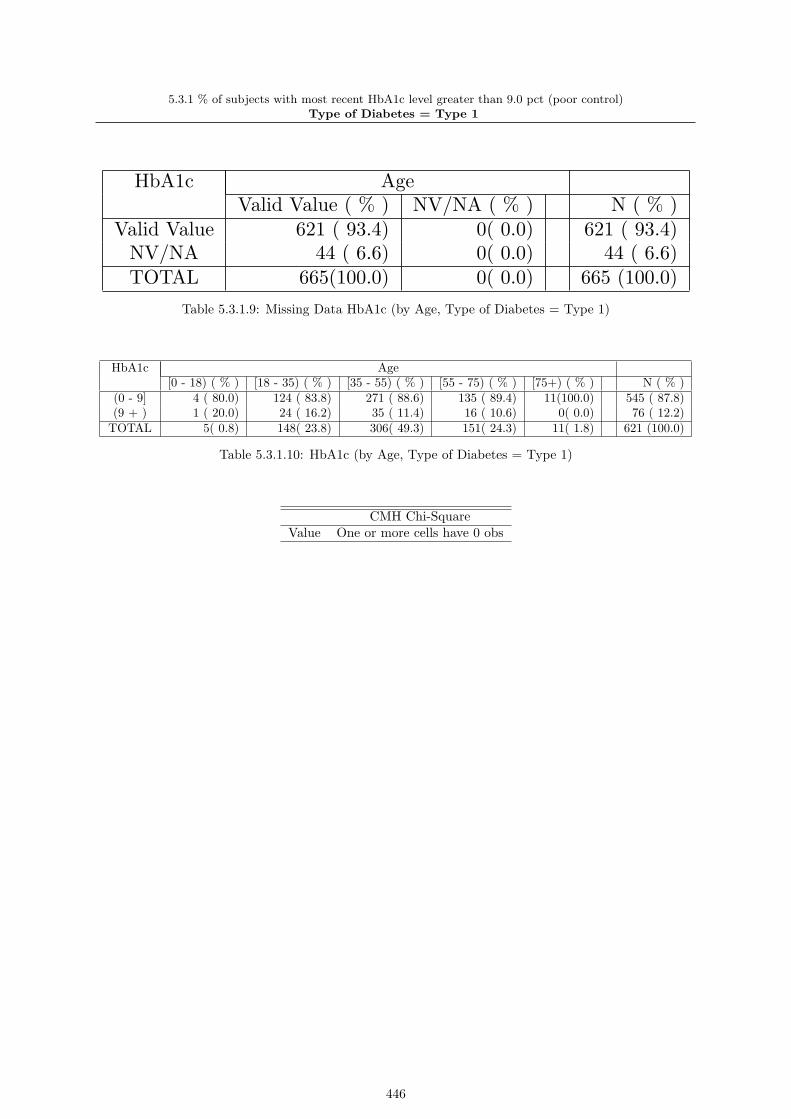
5.3.1 % of subjects with most recent HbA1c level greater than 9.0 pct (poor control)Type of Diabetes = Type 1
HbA1c AgeValid Value ( % ) NV/NA ( % ) N ( % )
Valid Value 621 ( 93.4) 0( 0.0) 621 ( 93.4)NV/NA 44 ( 6.6) 0( 0.0) 44 ( 6.6)TOTAL 665(100.0) 0( 0.0) 665 (100.0)
Table 5.3.1.9: Missing Data HbA1c (by Age, Type of Diabetes = Type 1)
HbA1c Age[0 - 18) ( % ) [18 - 35) ( % ) [35 - 55) ( % ) [55 - 75) ( % ) [75+) ( % ) N ( % )
(0 - 9] 4 ( 80.0) 124 ( 83.8) 271 ( 88.6) 135 ( 89.4) 11(100.0) 545 ( 87.8)(9 + ) 1 ( 20.0) 24 ( 16.2) 35 ( 11.4) 16 ( 10.6) 0( 0.0) 76 ( 12.2)
TOTAL 5( 0.8) 148( 23.8) 306( 49.3) 151( 24.3) 11( 1.8) 621 (100.0)
Table 5.3.1.10: HbA1c (by Age, Type of Diabetes = Type 1)
CMH Chi-SquareValue One or more cells have 0 obs
446

5.3.1 % of subjects with most recent HbA1c level greater than 9.0 pct (poor control)Type of Diabetes = Type 1
HbA1c Gender * AgeValid Value NV/NA
Valid Value ( % ) NV/NA ( % ) Valid Value ( % ) NV/NA ( % ) N ( % )Valid Value 0 ( 0.0) 0 ( 0.0) 0 ( 0.0) 44( 6.6) 44 ( 6.6)
NV/NA 0 ( 0.0) 0 ( 0.0) 0 ( 0.0) 621( 93.4) 621 ( 93.4)TOTAL 0( 0.0) 0( 0.0) 0( 0.0) 665(100.0) 665 (100.0)
Table 5.3.1.11: Missing Data HbA1c (by Gender * Age, Type of Diabetes = Type 1)
HbA1c Gender * Age[0 - 18) [18 - 35) [35 - 55) [55 - 75) [75+)
Male ( % ) Female ( % ) Male ( % ) Female ( % ) Male ( % ) Female ( % ) Male ( % ) Female ( % ) Male ( % ) Female ( % ) N ( % )9 + 2 ( 66.7) 2 (100.0) 59 ( 83.1) 65 ( 84.4) 118 ( 89.4) 153 ( 87.9) 61 ( 85.9) 74 ( 92.5) 6 (100.0) 5(100.0) 545 ( 87.8)
0 - 9] 1 ( 33.3) 0 ( 0.0) 12 ( 16.9) 12 ( 15.6) 14 ( 10.6) 21 ( 12.1) 10 ( 14.1) 6 ( 7.5) 0 ( 0.0) 0( 0.0) 76 ( 12.2)TOTAL 3( 0.5) 2( 0.3) 71( 11.4) 77( 12.4) 132( 21.3) 174( 28.0) 71( 11.4) 80( 12.9) 6( 1.0) 5( 0.8) 621 (100.0)
Table 5.3.1.12: HbA1c (by Gender * Age, Type of Diabetes = Type 1)
CMH Chi-SquareValue One or more cells have 0 obs
447

5.3.1 % of subjects with most recent HbA1c level greater than 9.0 pct (poor control)Type of Diabetes = Type 2
HbA1c GenderValid Value ( % ) NV/NA ( % ) N ( % )
Valid Value 8176 ( 93.9) 0( 0.0) 8176 ( 93.9)NV/NA 531 ( 6.1) 0( 0.0) 531 ( 6.1)TOTAL 8707(100.0) 0( 0.0) 8707 (100.0)
Table 5.3.1.13: Missing Data HbA1c (by Gender, Type of Diabetes = Type 2)
HbA1c GenderMale ( % ) Female ( % ) N ( % )
(0 - 9] 4139 ( 93.4) 3419( 91.3) 7558 ( 92.4)(9 + ) 292 ( 6.6) 326( 8.7) 618 ( 7.6)
TOTAL 4431( 54.2) 3745( 45.8) 8176 (100.0)Table 5.3.1.14: HbA1c (by Gender, Type of Diabetes = Type 2)
CMH Chi-Square p.value dfValue 12.6924 4e− 04 1
448

5.3.1 % of subjects with most recent HbA1c level greater than 9.0 pct (poor control)Type of Diabetes = Type 2
HbA1c AgeValid Value ( % ) NV/NA ( % ) N ( % )
Valid Value 8176 ( 93.9) 0( 0.0) 8176 ( 93.9)NV/NA 531 ( 6.1) 0( 0.0) 531 ( 6.1)TOTAL 8707(100.0) 0( 0.0) 8707 (100.0)
Table 5.3.1.15: Missing Data HbA1c (by Age, Type of Diabetes = Type 2)
HbA1c Age[0 - 18) ( % ) [18 - 35) ( % ) [35 - 55) ( % ) [55 - 75) ( % ) [75+) ( % ) N ( % )
(0 - 9] 0 ( 0.0) 25 ( 83.3) 774 ( 87.9) 4769 ( 92.7) 1990( 93.8) 7558 ( 92.4)(9 + ) 0 ( 0.0) 5 ( 16.7) 107 ( 12.1) 375 ( 7.3) 131( 6.2) 618 ( 7.6)
TOTAL 0( 0.0) 30( 0.4) 881( 10.8) 5144( 62.9) 2121( 25.9) 8176 (100.0)
Table 5.3.1.16: HbA1c (by Age, Type of Diabetes = Type 2)
CMH Chi-SquareValue One or more cells have 0 obs
449

5.3.1 % of subjects with most recent HbA1c level greater than 9.0 pct (poor control)Type of Diabetes = Type 2
HbA1c Gender * AgeValid Value NV/NA
Valid Value ( % ) NV/NA ( % ) Valid Value ( % ) NV/NA ( % ) N ( % )Valid Value 0 ( 0.0) 0 ( 0.0) 0 ( 0.0) 531( 6.1) 531 ( 6.1)
NV/NA 0 ( 0.0) 0 ( 0.0) 0 ( 0.0) 8176( 93.9) 8176 ( 93.9)TOTAL 0( 0.0) 0( 0.0) 0( 0.0) 8707(100.0) 8707 (100.0)
Table 5.3.1.17: Missing Data HbA1c (by Gender * Age, Type of Diabetes = Type 2)
HbA1c Gender * Age[0 - 18) [18 - 35) [35 - 55) [55 - 75) [75+)
Male ( % ) Female ( % ) Male ( % ) Female ( % ) Male ( % ) Female ( % ) Male ( % ) Female ( % ) Male ( % ) Female ( % ) N ( % )9 + 0 ( 0.0) 0 ( 0.0) 16 ( 94.1) 9 ( 69.2) 298 ( 87.9) 476 ( 87.8) 2034 ( 91.2) 2735 ( 93.9) 1071 ( 92.4) 919( 95.5) 7558 ( 92.4)
0 - 9] 0 ( 0.0) 0 ( 0.0) 1 ( 5.9) 4 ( 30.8) 41 ( 12.1) 66 ( 12.2) 196 ( 8.8) 179 ( 6.1) 88 ( 7.6) 43( 4.5) 618 ( 7.6)TOTAL 0( 0.0) 0( 0.0) 17( 0.2) 13( 0.2) 339( 4.1) 542( 6.6) 2230( 27.3) 2914( 35.6) 1159( 14.2) 962( 11.8) 8176 (100.0)
Table 5.3.1.18: HbA1c (by Gender * Age, Type of Diabetes = Type 2)
CMH Chi-SquareValue One or more cells have 0 obs
450

5.3.1 % of subjects with most recent HbA1c level greater than 9.0 pct (poor control)
●
●
HbA1c
Valid ValueNV/NA
Valid Value NV/NA
025
5075
100
Barplot: 5.3.1.1 - Missing Data HbA1c (by Type of Diabetes)
●
●
HbA1c
9 + 0 − 9]
Type 1 Type 2
025
5075
100
Barplot: 5.3.1.2 - HbA1c (by Type of Diabetes)
451

5.3.1 % of subjects with most recent HbA1c level greater than 9.0 pct (poor control)
●
●
HbA1c
Valid ValueNV/NA
Valid Value NV/NA
025
5075
100
Barplot: 5.3.1.3 - Missing Data HbA1c (by Gender)
●
●
HbA1c
9 + 0 − 9]
Female Male
025
5075
100
Barplot: 5.3.1.4 - HbA1c (by Gender)
452

5.3.1 % of subjects with most recent HbA1c level greater than 9.0 pct (poor control)
●
●
HbA1c
Valid ValueNV/NA
Valid Value NV/NA
025
5075
100
Barplot: 5.3.1.5 - Missing Data HbA1c (by Age)
●
●
HbA1c
9 + 0 − 9]
[0 − 18) [18 − 35) [35 − 55) [55 − 75) [75 +)
025
5075
100
Barplot: 5.3.1.6 - HbA1c (by Age)
453

5.3.1 % of subjects with most recent HbA1c level greater than 9.0 pct (poor control)Type of Diabetes = Type 1
●
●
HbA1c
Valid ValueNV/NA
Valid Value NV/NA
025
5075
100
Barplot: 5.3.1.7 - Missing Data HbA1c (by Gender, Type of Diabetes = Type 1)
●
●
HbA1c
9 + 0 − 9]
Female Male
025
5075
100
Barplot: 5.3.1.8 - HbA1c (by Gender, Type of Diabetes = Type 1)
454

5.3.1 % of subjects with most recent HbA1c level greater than 9.0 pct (poor control)Type of Diabetes = Type 1
●
●
HbA1c
Valid ValueNV/NA
Valid Value NV/NA
025
5075
100
Barplot: 5.3.1.9 - Missing Data HbA1c (by Age, Type of Diabetes = Type 1)
●
●
HbA1c
9 + 0 − 9]
[0 − 18) [18 − 35) [35 − 55) [55 − 75) [75 +)
025
5075
100
Barplot: 5.3.1.10 - HbA1c (by Age, Type of Diabetes = Type 1)
455

5.3.1 % of subjects with most recent HbA1c level greater than 9.0 pct (poor control)Type of Diabetes = Type 2
●
●
HbA1c
Valid ValueNV/NA
Valid Value NV/NA
025
5075
100
Barplot: 5.3.1.11 - Missing Data HbA1c (by Gender, Type of Diabetes = Type 2)
●
●
HbA1c
9 + 0 − 9]
Female Male
025
5075
100
Barplot: 5.3.1.12 - HbA1c (by Gender, Type of Diabetes = Type 2)
456

5.3.1 % of subjects with most recent HbA1c level greater than 9.0 pct (poor control)Type of Diabetes = Type 2
●
●
HbA1c
Valid ValueNV/NA
Valid Value NV/NA
025
5075
100
Barplot: 5.3.1.13 - Missing Data HbA1c (by Age, Type of Diabetes = Type 2)
●
●
HbA1c
9 + 0 − 9]
[0 − 18) [18 − 35) [35 − 55) [55 − 75) [75 +)
025
5075
100
Barplot: 5.3.1.14 - HbA1c (by Age, Type of Diabetes = Type 2)
457

5.3.1 5.3.1 % of subjects with most recent HbA1c level greater than 9.0 pct (poor control)Type of Diabetes = Type 2
s O E N CR AR 95% C.I. [O-E]/E % 95% C.I. [O-E]/E1 spoleto 81 60 791 10.2 10.2 ( 8.4; 12.0) 35.0 ( 11.1; 58.9)2 perugia 215 176 2357 9.1 9.2 ( 8.2; 10.3) 22.2 ( 7.8; 36.5)3 gubbio 89 78 1020 8.7 8.6 ( 7.0; 10.2) 14.1 ( -6.7; 34.9)4 terni 181 190 2530 7.2 7.2 ( 6.2; 8.2) -4.7 (-18.4; 9.0)5 foligno 14 21 296 4.7 5.0 ( 1.9; 8.2) -33.3 (-78.3; 11.6)6 orvieto 38 91 1182 3.2 3.2 ( 1.7; 4.6) -58.2 (-77.6;-38.9)
T 618 8176 7.6
Standardized Estimates 5.3.1.19 - 5.3.1 % of subjects with most recent HbA1c level greater than 9.0pct (poor control)
458

5.3.1 % of subjects with most recent HbA1c level greater than 9.0 pct (poor control)Type of Diabetes = Type 2
orvieto
foligno
terni
gubbio
perugia
spoleto
0 20 40 60 80 100
3.2
5.0
7.2
8.6
9.2
10.2
7.6
Barplots: 5.3.1.17 - Adjusted Rates 5.3.1 % of subjects with most recent HbA1c level greaterthan 9.0 pct (poor control)
459

5.3.1 % of subjects with most recent HbA1c level greater than 9.0 pct (poor control)Type of Diabetes = Type 2
●
●
●
●
●
●
[O−E]/E %
−100 −50 0 50 100
orvieto
foligno
terni
gubbio
perugia
spoleto
Forest plots: 5.3.1.10 - 5.3.1 % of subjects with most recent HbA1c level greater than 9.0 pct(poor control)
460

5.3.1 5.3.1 % of subjects with most recent HbA1c level greater than 9.0 pct (poor control)Type of Diabetes = Type 1
s O E N CR AR 95% C.I. [O-E]/E % 95% C.I. [O-E]/E1 foligno 13 1 13 100.0 100.0 (149.5;100.0) 1200.0 ( 721.1;1678.9)2 spoleto 4 3 29 13.8 19.1 ( 1.2; 37.0) 33.3 (-139.5; 206.2)3 orvieto 7 7 51 13.7 14.3 ( 4.2; 24.5) 0.0 ( -73.9; 73.9)4 perugia 48 54 387 12.4 12.7 ( 9.2; 16.3) -11.1 ( -36.4; 14.2)5 terni 12 14 92 13.0 12.3 ( 5.7; 18.9) -14.3 ( -57.8; 29.3)6 gubbio 5 7 49 10.2 10.2 ( 0.5; 20.0) -28.6 ( -96.7; 39.6)
T 89 621 14.3
Standardized Estimates 5.3.1.20 - 5.3.1 % of subjects with most recent HbA1c level greater than 9.0pct (poor control)
461

5.3.1 % of subjects with most recent HbA1c level greater than 9.0 pct (poor control)Type of Diabetes = Type 1
gubbio
terni
perugia
orvieto
spoleto
foligno
0 20 40 60 80 100
10.2
12.3
12.7
14.3
19.1
100.0
14.3
Barplots: 5.3.1.18 - Adjusted Rates 5.3.1 % of subjects with most recent HbA1c level greaterthan 9.0 pct (poor control)
462

5.3.1 % of subjects with most recent HbA1c level greater than 9.0 pct (poor control)Type of Diabetes = Type 1
●
●
●
●
●
[O−E]/E %
−100 −50 0 50 100
gubbio
terni
perugia
orvieto
spoleto
foligno
Forest plots: 5.3.1.11 - 5.3.1 % of subjects with most recent HbA1c level greater than 9.0 pct(poor control)
463

5.3.2 % of subjects with most recent HbA1c level greater than 7,5 pct
HbA1c Type of DiabetesValid Value ( % ) NV/NA ( % ) N ( % )
Valid Value 8797 ( 93.9) 0( 0.0) 8797 ( 93.9)NV/NA 575 ( 6.1) 0( 0.0) 575 ( 6.1)TOTAL 9372(100.0) 0( 0.0) 9372 (100.0)
Table 5.3.2.1: Missing Data HbA1c (by Type of Diabetes)
HbA1c Type of DiabetesType 1 ( % ) Type 2 ( % ) N ( % )
(0 - 7.5] 286 ( 46.1) 5509( 67.4) 5795 ( 65.9)(7.5 + ) 335 ( 53.9) 2667( 32.6) 3002 ( 34.1)TOTAL 621( 7.1) 8176( 92.9) 8797 (100.0)
Table 5.3.2.2: HbA1c (by Type of Diabetes)
CMH Chi-Square p.value dfValue 115.814 0 1
464

5.3.2 % of subjects with most recent HbA1c level greater than 7,5 pct
HbA1c GenderValid Value ( % ) NV/NA ( % ) N ( % )
Valid Value 8797 ( 93.9) 0( 0.0) 8797 ( 93.9)NV/NA 575 ( 6.1) 0( 0.0) 575 ( 6.1)TOTAL 9372(100.0) 0( 0.0) 9372 (100.0)
Table 5.3.2.3: Missing Data HbA1c (by Gender)
HbA1c GenderMale ( % ) Female ( % ) N ( % )
(0 - 7.5] 3260 ( 68.4) 2535( 62.9) 5795 ( 65.9)(7.5 + ) 1509 ( 31.6) 1493( 37.1) 3002 ( 34.1)TOTAL 4769( 54.2) 4028( 45.8) 8797 (100.0)
Table 5.3.2.4: HbA1c (by Gender)
CMH Chi-Square p.value dfValue 28.3336 0 1
465

5.3.2 % of subjects with most recent HbA1c level greater than 7,5 pct
HbA1c AgeValid Value ( % ) NV/NA ( % ) N ( % )
Valid Value 8797 ( 93.9) 0( 0.0) 8797 ( 93.9)NV/NA 575 ( 6.1) 0( 0.0) 575 ( 6.1)TOTAL 9372(100.0) 0( 0.0) 9372 (100.0)
Table 5.3.2.5: Missing Data HbA1c (by Age)
HbA1c Age[0 - 18) ( % ) [18 - 35) ( % ) [35 - 55) ( % ) [55 - 75) ( % ) [75+) ( % ) N ( % )
(0 - 7.5] 0 ( 0.0) 89 ( 50.0) 708 ( 59.6) 3555 ( 67.1) 1443( 67.7) 5795 ( 65.9)(7.5 + ) 5 (100.0) 89 ( 50.0) 479 ( 40.4) 1740 ( 32.9) 689( 32.3) 3002 ( 34.1)TOTAL 5( 0.1) 178( 2.0) 1187( 13.5) 5295( 60.2) 2132( 24.2) 8797 (100.0)
Table 5.3.2.6: HbA1c (by Age)
CMH Chi-SquareValue One or more cells have 0 obs
466

5.3.2 % of subjects with most recent HbA1c level greater than 7,5 pctType of Diabetes = Type 1
HbA1c GenderValid Value ( % ) NV/NA ( % ) N ( % )
Valid Value 621 ( 93.4) 0( 0.0) 621 ( 93.4)NV/NA 44 ( 6.6) 0( 0.0) 44 ( 6.6)TOTAL 665(100.0) 0( 0.0) 665 (100.0)
Table 5.3.2.7: Missing Data HbA1c (by Gender, Type of Diabetes = Type 1)
HbA1c GenderMale ( % ) Female ( % ) N ( % )
(0 - 7.5] 164 ( 48.5) 122( 43.1) 286 ( 46.1)(7.5 + ) 174 ( 51.5) 161( 56.9) 335 ( 53.9)TOTAL 338( 54.4) 283( 45.6) 621 (100.0)
Table 5.3.2.8: HbA1c (by Gender, Type of Diabetes = Type 1)
CMH Chi-Square p.value dfValue 1.6041 0.2053 1
467

5.3.2 % of subjects with most recent HbA1c level greater than 7,5 pctType of Diabetes = Type 1
HbA1c AgeValid Value ( % ) NV/NA ( % ) N ( % )
Valid Value 621 ( 93.4) 0( 0.0) 621 ( 93.4)NV/NA 44 ( 6.6) 0( 0.0) 44 ( 6.6)TOTAL 665(100.0) 0( 0.0) 665 (100.0)
Table 5.3.2.9: Missing Data HbA1c (by Age, Type of Diabetes = Type 1)
HbA1c Age[0 - 18) ( % ) [18 - 35) ( % ) [35 - 55) ( % ) [55 - 75) ( % ) [75+) ( % ) N ( % )
(0 - 7.5] 0 ( 0.0) 66 ( 44.6) 147 ( 48.0) 68 ( 45.0) 5( 45.5) 286 ( 46.1)(7.5 + ) 5 (100.0) 82 ( 55.4) 159 ( 52.0) 83 ( 55.0) 6( 54.5) 335 ( 53.9)TOTAL 5( 0.8) 148( 23.8) 306( 49.3) 151( 24.3) 11( 1.8) 621 (100.0)
Table 5.3.2.10: HbA1c (by Age, Type of Diabetes = Type 1)
CMH Chi-SquareValue One or more cells have 0 obs
468

5.3.2 % of subjects with most recent HbA1c level greater than 7,5 pctType of Diabetes = Type 1
HbA1c Gender * AgeValid Value NV/NA
Valid Value ( % ) NV/NA ( % ) Valid Value ( % ) NV/NA ( % ) N ( % )Valid Value 0 ( 0.0) 0 ( 0.0) 0 ( 0.0) 44( 6.6) 44 ( 6.6)
NV/NA 0 ( 0.0) 0 ( 0.0) 0 ( 0.0) 621( 93.4) 621 ( 93.4)TOTAL 0( 0.0) 0( 0.0) 0( 0.0) 665(100.0) 665 (100.0)
Table 5.3.2.11: Missing Data HbA1c (by Gender * Age, Type of Diabetes = Type 1)
HbA1c Gender * Age[0 - 18) [18 - 35) [35 - 55) [55 - 75) [75+)
Male ( % ) Female ( % ) Male ( % ) Female ( % ) Male ( % ) Female ( % ) Male ( % ) Female ( % ) Male ( % ) Female ( % ) N ( % )7.5 + 0 ( 0.0) 0 ( 0.0) 37 ( 52.1) 29 ( 37.7) 60 ( 45.5) 87 ( 50.0) 23 ( 32.4) 45 ( 56.2) 2 ( 33.3) 3( 60.0) 286 ( 46.1)
0 - 7.5] 3 (100.0) 2 (100.0) 34 ( 47.9) 48 ( 62.3) 72 ( 54.5) 87 ( 50.0) 48 ( 67.6) 35 ( 43.8) 4 ( 66.7) 2( 40.0) 335 ( 53.9)TOTAL 3( 0.5) 2( 0.3) 71( 11.4) 77( 12.4) 132( 21.3) 174( 28.0) 71( 11.4) 80( 12.9) 6( 1.0) 5( 0.8) 621 (100.0)
Table 5.3.2.12: HbA1c (by Gender * Age, Type of Diabetes = Type 1)
CMH Chi-SquareValue One or more cells have 0 obs
469

5.3.2 % of subjects with most recent HbA1c level greater than 7,5 pctType of Diabetes = Type 2
HbA1c GenderValid Value ( % ) NV/NA ( % ) N ( % )
Valid Value 8176 ( 93.9) 0( 0.0) 8176 ( 93.9)NV/NA 531 ( 6.1) 0( 0.0) 531 ( 6.1)TOTAL 8707(100.0) 0( 0.0) 8707 (100.0)
Table 5.3.2.13: Missing Data HbA1c (by Gender, Type of Diabetes = Type 2)
HbA1c GenderMale ( % ) Female ( % ) N ( % )
(0 - 7.5] 3096 ( 69.9) 2413( 64.4) 5509 ( 67.4)(7.5 + ) 1335 ( 30.1) 1332( 35.6) 2667 ( 32.6)TOTAL 4431( 54.2) 3745( 45.8) 8176 (100.0)
Table 5.3.2.14: HbA1c (by Gender, Type of Diabetes = Type 2)
CMH Chi-Square p.value dfValue 27.0682 0 1
470

5.3.2 % of subjects with most recent HbA1c level greater than 7,5 pctType of Diabetes = Type 2
HbA1c AgeValid Value ( % ) NV/NA ( % ) N ( % )
Valid Value 8176 ( 93.9) 0( 0.0) 8176 ( 93.9)NV/NA 531 ( 6.1) 0( 0.0) 531 ( 6.1)TOTAL 8707(100.0) 0( 0.0) 8707 (100.0)
Table 5.3.2.15: Missing Data HbA1c (by Age, Type of Diabetes = Type 2)
HbA1c Age[0 - 18) ( % ) [18 - 35) ( % ) [35 - 55) ( % ) [55 - 75) ( % ) [75+) ( % ) N ( % )
(0 - 7.5] 0 ( 0.0) 23 ( 76.7) 561 ( 63.7) 3487 ( 67.8) 1438( 67.8) 5509 ( 67.4)(7.5 + ) 0 ( 0.0) 7 ( 23.3) 320 ( 36.3) 1657 ( 32.2) 683( 32.2) 2667 ( 32.6)TOTAL 0( 0.0) 30( 0.4) 881( 10.8) 5144( 62.9) 2121( 25.9) 8176 (100.0)
Table 5.3.2.16: HbA1c (by Age, Type of Diabetes = Type 2)
CMH Chi-SquareValue One or more cells have 0 obs
471

5.3.2 % of subjects with most recent HbA1c level greater than 7,5 pctType of Diabetes = Type 2
HbA1c Gender * AgeValid Value NV/NA
Valid Value ( % ) NV/NA ( % ) Valid Value ( % ) NV/NA ( % ) N ( % )Valid Value 0 ( 0.0) 0 ( 0.0) 0 ( 0.0) 531( 6.1) 531 ( 6.1)
NV/NA 0 ( 0.0) 0 ( 0.0) 0 ( 0.0) 8176( 93.9) 8176 ( 93.9)TOTAL 0( 0.0) 0( 0.0) 0( 0.0) 8707(100.0) 8707 (100.0)
Table 5.3.2.17: Missing Data HbA1c (by Gender * Age, Type of Diabetes = Type 2)
HbA1c Gender * Age[0 - 18) [18 - 35) [35 - 55) [55 - 75) [75+)
Male ( % ) Female ( % ) Male ( % ) Female ( % ) Male ( % ) Female ( % ) Male ( % ) Female ( % ) Male ( % ) Female ( % ) N ( % )7.5 + 0 ( 0.0) 0 ( 0.0) 15 ( 88.2) 8 ( 61.5) 217 ( 64.0) 344 ( 63.5) 1447 ( 64.9) 2040 ( 70.0) 734 ( 63.3) 704( 73.2) 5509 ( 67.4)
0 - 7.5] 0 ( 0.0) 0 ( 0.0) 2 ( 11.8) 5 ( 38.5) 122 ( 36.0) 198 ( 36.5) 783 ( 35.1) 874 ( 30.0) 425 ( 36.7) 258( 26.8) 2667 ( 32.6)TOTAL 0( 0.0) 0( 0.0) 17( 0.2) 13( 0.2) 339( 4.1) 542( 6.6) 2230( 27.3) 2914( 35.6) 1159( 14.2) 962( 11.8) 8176 (100.0)
Table 5.3.2.18: HbA1c (by Gender * Age, Type of Diabetes = Type 2)
CMH Chi-SquareValue One or more cells have 0 obs
472

5.3.2 % of subjects with most recent HbA1c level greater than 7,5 pct
●
●
HbA1c
Valid ValueNV/NA
Valid Value NV/NA
025
5075
100
Barplot: 5.3.2.1 - Missing Data HbA1c (by Type of Diabetes)
●
●
HbA1c
7.5 + 0 − 7.5]
Type 1 Type 2
025
5075
100
Barplot: 5.3.2.2 - HbA1c (by Type of Diabetes)
473

5.3.2 % of subjects with most recent HbA1c level greater than 7,5 pct
●
●
HbA1c
Valid ValueNV/NA
Valid Value NV/NA
025
5075
100
Barplot: 5.3.2.3 - Missing Data HbA1c (by Gender)
●
●
HbA1c
7.5 + 0 − 7.5]
Female Male
025
5075
100
Barplot: 5.3.2.4 - HbA1c (by Gender)
474

5.3.2 % of subjects with most recent HbA1c level greater than 7,5 pct
●
●
HbA1c
Valid ValueNV/NA
Valid Value NV/NA
025
5075
100
Barplot: 5.3.2.5 - Missing Data HbA1c (by Age)
●
●
HbA1c
7.5 + 0 − 7.5]
[0 − 18) [18 − 35) [35 − 55) [55 − 75) [75 +)
025
5075
100
Barplot: 5.3.2.6 - HbA1c (by Age)
475

5.3.2 % of subjects with most recent HbA1c level greater than 7,5 pctType of Diabetes = Type 1
●
●
HbA1c
Valid ValueNV/NA
Valid Value NV/NA
025
5075
100
Barplot: 5.3.2.7 - Missing Data HbA1c (by Gender, Type of Diabetes = Type 1)
●
●
HbA1c
7.5 + 0 − 7.5]
Female Male
025
5075
100
Barplot: 5.3.2.8 - HbA1c (by Gender, Type of Diabetes = Type 1)
476

5.3.2 % of subjects with most recent HbA1c level greater than 7,5 pctType of Diabetes = Type 1
●
●
HbA1c
Valid ValueNV/NA
Valid Value NV/NA
025
5075
100
Barplot: 5.3.2.9 - Missing Data HbA1c (by Age, Type of Diabetes = Type 1)
●
●
HbA1c
7.5 + 0 − 7.5]
[0 − 18) [18 − 35) [35 − 55) [55 − 75) [75 +)
025
5075
100
Barplot: 5.3.2.10 - HbA1c (by Age, Type of Diabetes = Type 1)
477

5.3.2 % of subjects with most recent HbA1c level greater than 7,5 pctType of Diabetes = Type 2
●
●
HbA1c
Valid ValueNV/NA
Valid Value NV/NA
025
5075
100
Barplot: 5.3.2.11 - Missing Data HbA1c (by Gender, Type of Diabetes = Type 2)
●
●
HbA1c
7.5 + 0 − 7.5]
Female Male
025
5075
100
Barplot: 5.3.2.12 - HbA1c (by Gender, Type of Diabetes = Type 2)
478

5.3.2 % of subjects with most recent HbA1c level greater than 7,5 pctType of Diabetes = Type 2
●
●
HbA1c
Valid ValueNV/NA
Valid Value NV/NA
025
5075
100
Barplot: 5.3.2.13 - Missing Data HbA1c (by Age, Type of Diabetes = Type 2)
●
●
HbA1c
7.5 + 0 − 7.5]
[0 − 18) [18 − 35) [35 − 55) [55 − 75) [75 +)
025
5075
100
Barplot: 5.3.2.14 - HbA1c (by Age, Type of Diabetes = Type 2)
479

5.3.2 5.3.2 % of subjects with most recent HbA1c level greater than 7,5 pctType of Diabetes = Type 2
s O E N CR AR 95% C.I. [O-E]/E % 95% C.I. [O-E]/E1 gubbio 429 330 1020 42.1 42.4 ( 39.5; 45.3) 30.0 ( 21.1; 38.9)2 perugia 957 768 2357 40.6 40.6 ( 38.8; 42.5) 24.6 ( 18.8; 30.4)3 terni 734 824 2530 29.0 29.1 ( 27.2; 30.9) -10.9 (-16.5; -5.3)4 spoleto 228 258 791 28.8 28.8 ( 25.6; 32.1) -11.6 (-21.6; -1.7)5 foligno 67 97 296 22.6 22.5 ( 17.2; 27.8) -30.9 (-47.1;-14.8)6 orvieto 252 389 1182 21.3 21.1 ( 18.5; 23.8) -35.2 (-43.3;-27.2)
T 2667 8176 32.6
Standardized Estimates 5.3.2.19 - 5.3.2 % of subjects with most recent HbA1c level greater than 7,5 pct
480

5.3.2 % of subjects with most recent HbA1c level greater than 7,5 pctType of Diabetes = Type 2
orvieto
foligno
spoleto
terni
perugia
gubbio
0 20 40 60 80 100
21.1
22.5
28.8
29.1
40.6
42.4
32.6
Barplots: 5.3.2.17 - Adjusted Rates 5.3.2 % of subjects with most recent HbA1c level greaterthan 7,5 pct
481

5.3.2 % of subjects with most recent HbA1c level greater than 7,5 pctType of Diabetes = Type 2
●
●
●
●
●
●
[O−E]/E %
−100 −50 0 50 100
orvieto
foligno
spoleto
terni
perugia
gubbio
Forest plots: 5.3.2.12 - 5.3.2 % of subjects with most recent HbA1c level greater than 7,5 pct
482

5.3.2 5.3.2 % of subjects with most recent HbA1c level greater than 7,5 pctType of Diabetes = Type 1
s O E N CR AR 95% C.I. [O-E]/E % 95% C.I. [O-E]/E1 perugia 221 207 387 57.1 57.6 ( 52.7; 62.5) 6.8 ( -2.4;15.9 )2 gubbio 26 25 49 53.1 56.1 ( 41.5; 70.7) 4.0 (-24.5;32.5 )3 orvieto 27 29 51 52.9 50.2 ( 37.8; 62.7) -6.9 (-28.8;15.0 )4 spoleto 13 15 29 44.8 46.8 ( 28.6; 64.9) -13.3 (-48.5;21.8 )5 terni 43 50 92 46.7 46.4 ( 36.6; 56.2) -14.0 (-32.1; 4.1 )6 foligno 5 8 13 38.5 33.7 ( 10.5; 56.9) -37.5 (-75.2; 0.2 )
T 335 621 53.9
Standardized Estimates 5.3.2.20 - 5.3.2 % of subjects with most recent HbA1c level greater than 7,5 pct
483

5.3.2 % of subjects with most recent HbA1c level greater than 7,5 pctType of Diabetes = Type 1
foligno
terni
spoleto
orvieto
gubbio
perugia
0 20 40 60 80 100
33.7
46.4
46.8
50.2
56.1
57.6
53.9
Barplots: 5.3.2.18 - Adjusted Rates 5.3.2 % of subjects with most recent HbA1c level greaterthan 7,5 pct
484

5.3.2 % of subjects with most recent HbA1c level greater than 7,5 pctType of Diabetes = Type 1
●
●
●
●
●
●
[O−E]/E %
−100 −50 0 50 100
foligno
terni
spoleto
orvieto
gubbio
perugia
Forest plots: 5.3.2.13 - 5.3.2 % of subjects with most recent HbA1c level greater than 7,5 pct
485

5.3.3 % of subjects with most recent blood pressure less than 140/90 mmHg
486

5.3.3 % of subjects with most recent blood pressure less than 140/90 mmHg
●
●
SBP
Valid ValueNV/NA
Valid Value NV/NA
025
5075
100
Barplot: 5.3.3.1 - Missing Data SBP (by Type of Diabetes)
●
●
SBP
[0 − 140)[140 +)
Type 1 Type 2
025
5075
100
Barplot: 5.3.3.2 - SBP (by Type of Diabetes)
487

5.3.3 % of subjects with most recent blood pressure less than 140/90 mmHg
●
●
SBP
Valid ValueNV/NA
Valid Value NV/NA
025
5075
100
Barplot: 5.3.3.3 - Missing Data SBP (by Gender)
●
●
SBP
[0 − 140)[140 +)
Female Male
025
5075
100
Barplot: 5.3.3.4 - SBP (by Gender)
488

5.3.3 % of subjects with most recent blood pressure less than 140/90 mmHg
●
●
SBP
Valid ValueNV/NA
Valid Value NV/NA
025
5075
100
Barplot: 5.3.3.5 - Missing Data SBP (by Age)
●
●
SBP
[0 − 140)[140 +)
[0 − 18) [18 − 35) [35 − 55) [55 − 75) [75 +)
025
5075
100
Barplot: 5.3.3.6 - SBP (by Age)
489

5.3.3 % of subjects with most recent blood pressure less than 140/90 mmHgType of Diabetes = Type 1
●
●
SBP
Valid ValueNV/NA
Valid Value NV/NA
025
5075
100
Barplot: 5.3.3.7 - Missing Data SBP (by Gender, Type of Diabetes = Type 1)
●
●
SBP
[0 − 140)[140 +)
Female Male
025
5075
100
Barplot: 5.3.3.8 - SBP (by Gender, Type of Diabetes = Type 1)
490

5.3.3 % of subjects with most recent blood pressure less than 140/90 mmHgType of Diabetes = Type 1
●
●
SBP
Valid ValueNV/NA
Valid Value NV/NA
025
5075
100
Barplot: 5.3.3.9 - Missing Data SBP (by Age, Type of Diabetes = Type 1)
●
●
SBP
[0 − 140)[140 +)
[0 − 18) [18 − 35) [35 − 55) [55 − 75) [75 +)
025
5075
100
Barplot: 5.3.3.10 - SBP (by Age, Type of Diabetes = Type 1)
491

5.3.3 % of subjects with most recent blood pressure less than 140/90 mmHgType of Diabetes = Type 2
●
●
SBP
Valid ValueNV/NA
Valid Value NV/NA
025
5075
100
Barplot: 5.3.3.11 - Missing Data SBP (by Gender, Type of Diabetes = Type 2)
●
●
SBP
[0 − 140)[140 +)
Female Male
025
5075
100
Barplot: 5.3.3.12 - SBP (by Gender, Type of Diabetes = Type 2)
492

5.3.3 % of subjects with most recent blood pressure less than 140/90 mmHgType of Diabetes = Type 2
●
●
SBP
Valid ValueNV/NA
Valid Value NV/NA
025
5075
100
Barplot: 5.3.3.13 - Missing Data SBP (by Age, Type of Diabetes = Type 2)
●
●
SBP
[0 − 140)[140 +)
[0 − 18) [18 − 35) [35 − 55) [55 − 75) [75 +)
025
5075
100
Barplot: 5.3.3.14 - SBP (by Age, Type of Diabetes = Type 2)
493

5.4. Outcome quality - terminal outcomes
494

Chapter 6
Appendix
495

1.1 Age (Classes)
centre id dbname2 foligno2 spoleto2 orvieto2 gubbio2 perugia2 terni
496

2.1.1 Type of diabetes
centre id dbname2 foligno2 spoleto2 orvieto2 gubbio2 perugia2 terni
497

2.1.2. Duration of diabetes (Classes)
centre id dbname2 foligno2 spoleto2 orvieto2 gubbio2 perugia2 terni
498

2.2.1.1. Weight (last episode in 12 months)
centre id dbname2 foligno2 spoleto2 orvieto2 gubbio2 perugia2 terni
499

2.2.3.1. Systolic BP (last episode in 12 months)
centre id dbname2 foligno2 spoleto2 orvieto2 gubbio2 perugia2 terni
500

2.2.3.2. Diastolic BP (last episode in 12 months)
centre id dbname2 foligno2 spoleto2 orvieto2 gubbio2 perugia2 terni
501
2.2.3.3 Total cholesterol (last episode in 12 months)
centre id dbname2 foligno2 spoleto2 orvieto2 gubbio2 perugia2 terni
502

2.2.3.4. HDL-cholesterol (last episode in 12 months)
centre id dbname2 foligno2 spoleto2 orvieto2 gubbio2 perugia2 terni
503

2.2.3.5 Creatinine (last episode in 12 months)
centre id dbname2 foligno2 spoleto2 orvieto2 gubbio2 perugia2 terni
504

2.2.3.6. HbA1c (last episode in 12 months)
centre id dbname2 foligno2 spoleto2 orvieto2 gubbio2 perugia2 terni
505

3.1.2 Average diabetes population
centre id dbname2 foligno2 spoleto2 orvieto2 gubbio2 perugia2 terni
506

3.3.3.1 BP (last episode in 12 months)
centre id dbname2 foligno2 spoleto2 orvieto2 gubbio2 perugia2 terni
507

3.3.3.2 Lipids
centre id dbname2 foligno2 spoleto2 orvieto2 gubbio2 perugia2 terni
508

3.3.3.4 HbA1c (last episode in 12 months)
centre id dbname2 foligno2 spoleto2 orvieto2 gubbio2 perugia2 terni
509

3.3.4.4.1 Glucose Lowering: Diet Only (last episode in 12 months)
centre id dbname2 foligno2 spoleto2 orvieto2 gubbio2 perugia2 terni
510

3.3.4.4.2 Glucose Lowering: Tablets Only (last episode in 12 months)
centre id dbname2 foligno2 spoleto2 orvieto2 gubbio2 perugia2 terni
511

3.3.4.4.3 Glucose Lowering: Insulin Only (last episode in 12 months)
centre id dbname2 foligno2 spoleto2 orvieto2 gubbio2 perugia2 terni
512

3.3.4.4.4 Glucose Lowering: Insulin and Tablets (last episode in 12 months)
centre id dbname2 foligno2 spoleto2 orvieto2 gubbio2 perugia2 terni
513

3.3.5.2 Visit Frequency
centre id dbname2 foligno2 spoleto2 orvieto2 gubbio2 perugia2 terni
514

5.1.2. Age at diagnosis by 10 year age bands
centre id dbname2 foligno2 spoleto2 orvieto2 gubbio2 perugia2 terni
515

5.2.1 % of subjects with 1+ HbA1c tests in last 12 months
centre id dbname2 foligno2 spoleto2 orvieto2 gubbio2 perugia2 terni
516

5.2.6 % with serum creatinine tested in last 12 months
centre id dbname2 foligno2 spoleto2 orvieto2 gubbio2 perugia2 terni
517

5.2.7 % of subjects with diabetes and one or more blood pressure measure-ments within the last 12 months
centre id dbname2 foligno2 spoleto2 orvieto2 gubbio2 perugia2 terni
518

5.2.10 % of subjects treated with insulin
centre id dbname2 foligno2 spoleto2 orvieto2 gubbio2 perugia2 terni
519

5.3.1 % of subjects with most recent HbA1c level greater than 9.0 pct (poorcontrol)
centre id dbname2 foligno2 spoleto2 orvieto2 gubbio2 perugia2 terni
520

5.3.2 % of subjects with most recent HbA1c level greater than 7,5 pct
centre id dbname2 foligno2 spoleto2 orvieto2 gubbio2 perugia2 terni
521


![Meath Earthquakes 1 1 1 [1]](https://img.dokumen.tips/doc/110x75/54967439b47959507a8b466d/meath-earthquakes-1-1-1-1.jpg)

