Embed Size (px)
Citation preview

1 of 22
Collection
Frequency2012/13 2013/14 2014/15 Quarter 1 Quarter 2 Quarter 3 Quarter 4 Target Polarity DoT
JSA Claimants: % of Working Age Population (16-64) Monthly 2.30% 1.60% 0.80% 0.60% - - - - Up is Bad Good
Benchmark - National Data Monthly 3.80% 2.90% 2.00% 1.70% - - - -
Benchmark - Regional Data Monthly 4.90% 3.80% 2.70% 2.40% - - - -
Regional Rank (Rank out of 15) Monthly 1 1 1 1 - - - -
JSA Claimants: % of Working Age Population (18-24) Monthly 2.60% 1.50% 0.70% 0.41% - - - - Up is Bad Good
Benchmark - National Data Monthly 7.10% 5.00% 3.10% 2.43% - - - -
Benchmark - Regional Data Monthly 9.00% 6.40% 4.20% 3.41% - - - -
Regional Rank (Rank out of 15) Monthly 1 1 1 1 - - - -
JSA Claimants: % of Working Age Population (16-64) (Over one year) Monthly 0.50% 0.40% 0.20% 0.20% - - - - Up is Bad Good
Benchmark - National Data Monthly 1.00% 0.80% 0.50% 0.50% - - - -
Benchmark - Regional Data Monthly 1.40% 1.20% 0.80% 0.70% - - - -
Regional Rank (Rank out of 15) Monthly 1 1 1 1 - - - -
Total Benefit Claimants (Working Age 16-64) Quarterly 11,510 10,670 (avail
Aug 15)- - - - - Up is Bad Good
Regional Rank (Rank out of 15) Quarterly 1 1 - - - - - -
% Total Benefit Claimants (Working Age 16-64) Quarterly 8.60% 7.90% (avail
Aug 15)- - - - - Up is Bad Good
Benchmark - National Data Quarterly 14.30% 13.30% (avail
Aug 15)- - - - -
Benchmark - Regional Data Quarterly 15.90% 14.90% (avail
Aug 15)- - - - -
Regional Rank (Rank out of 15) Quarterly 1 1 - - - - - -
Lone Parents (Working Age 16-64) Quarterly 910 850 (avail
Aug 15)- - - - - Up is Bad Good
Regional Rank (Rank out of 15) Quarterly 1 1 - - - - - -
% Lone Parents (Working Age 16-64) Quarterly 0.70% 0.60% (avail
Aug 15)- - - - - Up is Bad Good
Benchmark - National Data Quarterly 1.30% 1.20% (avail
Aug 15)- - - - -
Benchmark - Regional Data Quarterly 1.30% 1.30% (avail
Aug 15)- - - - -
Regional Rank (Rank out of 15) Quarterly 2 1 - - - - - -
CJGE11 Workless Households % of all HouseholdsDiscontinu
ed13.20% - - - - - - - Up is Bad Neutral
CJGE13
0Universal Credit: Number of claimants on caseload Monthly N/A N/A 60 273 - - - - Up is Bad Bad
CJGE22 Number of vacant city centre shops Monthly 40 42 40 44 - - - - Up is Bad Neutral
CJGE23 % of vacant city centre shops Monthly 5.95% 6.25% 5.99% 6.62% - - - - Up is Bad Neutral
Bu
sin
ess
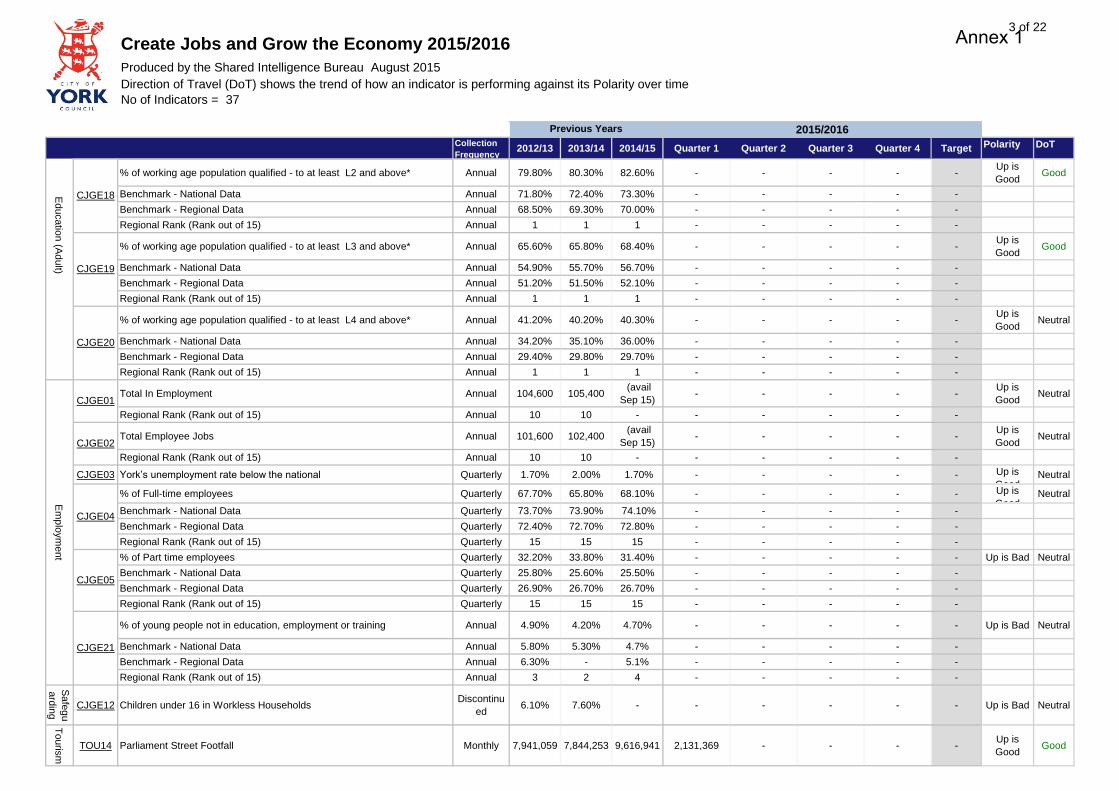
Create Jobs and Grow the Economy 2015/2016
Produced by the Shared Intelligence Bureau August 2015
Direction of Travel (DoT) shows the trend of how an indicator is performing against its Polarity over time
No of Indicators = 37
Previous Years 2015/2016
Be
ne
fits
CJGE06
CJGE07
CJGE08
CJGE38
CJGE09
CJGE39
CJGE10
Annex 1

2 of 22
Collection
Frequency2012/13 2013/14 2014/15 Quarter 1 Quarter 2 Quarter 3 Quarter 4 Target Polarity DoT
Create Jobs and Grow the Economy 2015/2016
Produced by the Shared Intelligence Bureau August 2015
Direction of Travel (DoT) shows the trend of how an indicator is performing against its Polarity over time
No of Indicators = 37
Previous Years 2015/2016
Total Businesses Annual 8,010 8,135 8,105 - - - - - Up is
GoodNeutral
Regional Rank (Rank out of 15) Annual 8 8 9 - - - - -
Business Births Annual 720 945 (avail
Nov 15)- - - - -
Up is
GoodGood
Regional Rank (Rank out of 15) Annual 11 10 - - - - - -
Business Deaths Annual 635 600 (avail
Nov 15)- - - - - Up is Bad Neutral
Regional Rank (Rank out of 15) Annual 3 4 - - - - - -
GVA per head (£) Annual 23,084 23,483 (avail
Dec 15)- - - - -
Up is
GoodGood
Regional Rank (Rank out of 15) Annual 2 2 - - - - - -
Total GVA (£ billion) Annual 4.62 4.75 (avail
Dec 15)- - - - -
Up is
GoodGood
Regional Rank (Rank out of 15) Annual 9 11 - - - - - -
CJGE32 Business Startups - (YTD) Monthly 1,494 1,155 1144 254 - - - - Up is
GoodNeutral
CFC04 Business stock per 10,000 population (Rank out of 64) Annual 20 19 19 - - - - - Up is Bad Neutral
CFC12 Total CO2 emissions per capita (t) (Rank out of 64) Annual 20 21 18 - - - - - Up is Bad Neutral
CFC17 Employment rate (%) (Rank out of 64) Annual 2 16 12 - - - - - Up is Bad Neutral
CFC23 Working age population with qualification at NVQ4+ (%) (Rank out of 64) Annual 7 7 9 - - - - - Up is Bad Bad
Proportion of Children in Child Poverty (HMRC) Annual 11.10% - - - - - - - Up is Bad Neutral
Benchmark - National Data Annual 18.60% - - - - - - -
Benchmark - Regional Data Annual 20.00% - - - - - - -
Regional Rank (Rank out of 15) Annual 2 - - - - - - -
Median earnings of residents – Gross Weekly Pay (£) Annual 523.10 526.50 478.70 - - - - - Up is
GoodBad
Benchmark - National Data Annual 508.3 517.9 520.8 - - - - -
Benchmark - Regional Data Annual 465.2 479.1 479.0 - - - - -
CJGE15 Median earnings of residents (% difference between York & GB) Annual 2.83% 1.63% -8.79% - - - - -Up is
GoodBad
CJGE16 Earnings gap between the 25 percentile and the median (£) (York) Annual 244.10 237.90 181.70 - - - - - Up is Bad Good
% of working age population qualified - No qualifications Annual 6.50% 6.90% 4.80% - - - - - Up is Bad Good
Benchmark - National Data Annual 9.70% 9.40% 8.80% - - - - -
Benchmark - Regional Data Annual 11.60% 10.60% 9.80% - - - - -
Regional Rank (Rank out of 15) Annual 1 1 2 - - - - -
Ce
ntre
for
Citie
s
De
priv
atio
n
an
d P
ove
rty
CJGE13
Earn
ings
CJGE14
Ed
uca
tion
(Ad
ult)
CJGE17
Bu
sin
ess
CJGE27
CJGE28
CJGE29
CJGE30
CJGE31
Annex 1
3 of 22
Collection
Frequency2012/13 2013/14 2014/15 Quarter 1 Quarter 2 Quarter 3 Quarter 4 Target Polarity DoT
Create Jobs and Grow the Economy 2015/2016
Produced by the Shared Intelligence Bureau August 2015
Direction of Travel (DoT) shows the trend of how an indicator is performing against its Polarity over time
No of Indicators = 37
Previous Years 2015/2016
% of working age population qualified - to at least L2 and above* Annual 79.80% 80.30% 82.60% - - - - -Up is
GoodGood
Benchmark - National Data Annual 71.80% 72.40% 73.30% - - - - -
Benchmark - Regional Data Annual 68.50% 69.30% 70.00% - - - - -
Regional Rank (Rank out of 15) Annual 1 1 1 - - - - -
% of working age population qualified - to at least L3 and above* Annual 65.60% 65.80% 68.40% - - - - -Up is
GoodGood
Benchmark - National Data Annual 54.90% 55.70% 56.70% - - - - -
Benchmark - Regional Data Annual 51.20% 51.50% 52.10% - - - - -
Regional Rank (Rank out of 15) Annual 1 1 1 - - - - -
% of working age population qualified - to at least L4 and above* Annual 41.20% 40.20% 40.30% - - - - -Up is
GoodNeutral
Benchmark - National Data Annual 34.20% 35.10% 36.00% - - - - -
Benchmark - Regional Data Annual 29.40% 29.80% 29.70% - - - - -
Regional Rank (Rank out of 15) Annual 1 1 1 - - - - -
Total In Employment Annual 104,600 105,400 (avail
Sep 15)- - - - -
Up is
GoodNeutral
Regional Rank (Rank out of 15) Annual 10 10 - - - - - -
Total Employee Jobs Annual 101,600 102,400 (avail
Sep 15)- - - - -
Up is
GoodNeutral
Regional Rank (Rank out of 15) Annual 10 10 - - - - - -
CJGE03 York’s unemployment rate below the national Quarterly 1.70% 2.00% 1.70% - - - - - Up is
GoodNeutral
% of Full-time employees Quarterly 67.70% 65.80% 68.10% - - - - - Up is
GoodNeutral
Benchmark - National Data Quarterly 73.70% 73.90% 74.10% - - - - -
Benchmark - Regional Data Quarterly 72.40% 72.70% 72.80% - - - - -
Regional Rank (Rank out of 15) Quarterly 15 15 15 - - - - -
% of Part time employees Quarterly 32.20% 33.80% 31.40% - - - - - Up is Bad Neutral
Benchmark - National Data Quarterly 25.80% 25.60% 25.50% - - - - -
Benchmark - Regional Data Quarterly 26.90% 26.70% 26.70% - - - - -
Regional Rank (Rank out of 15) Quarterly 15 15 15 - - - - -
% of young people not in education, employment or training Annual 4.90% 4.20% 4.70% - - - - - Up is Bad Neutral
Benchmark - National Data Annual 5.80% 5.30% 4.7% - - - - -
Benchmark - Regional Data Annual 6.30% - 5.1% - - - - -
Regional Rank (Rank out of 15) Annual 3 2 4 - - - - -
Sa
feg
u
ard
ing
CJGE12 Children under 16 in Workless HouseholdsDiscontinu
ed6.10% 7.60% - - - - - - Up is Bad Neutral
To
uris
m
TOU14 Parliament Street Footfall Monthly 7,941,059 7,844,253 9,616,941 2,131,369 - - - -Up is
GoodGood
Em
plo
ym
en
t
CJGE01
CJGE02
CJGE04
CJGE05
CJGE21
Ed
uca
tion
(Ad
ult)
CJGE18
CJGE19
CJGE20
Annex 1
4 of 22
Collection
Frequency2012/13 2013/14 2014/15 Quarter 1 Quarter 2 Quarter 3 Quarter 4 Target Polarity DoT
Build
ing
Wo
rks
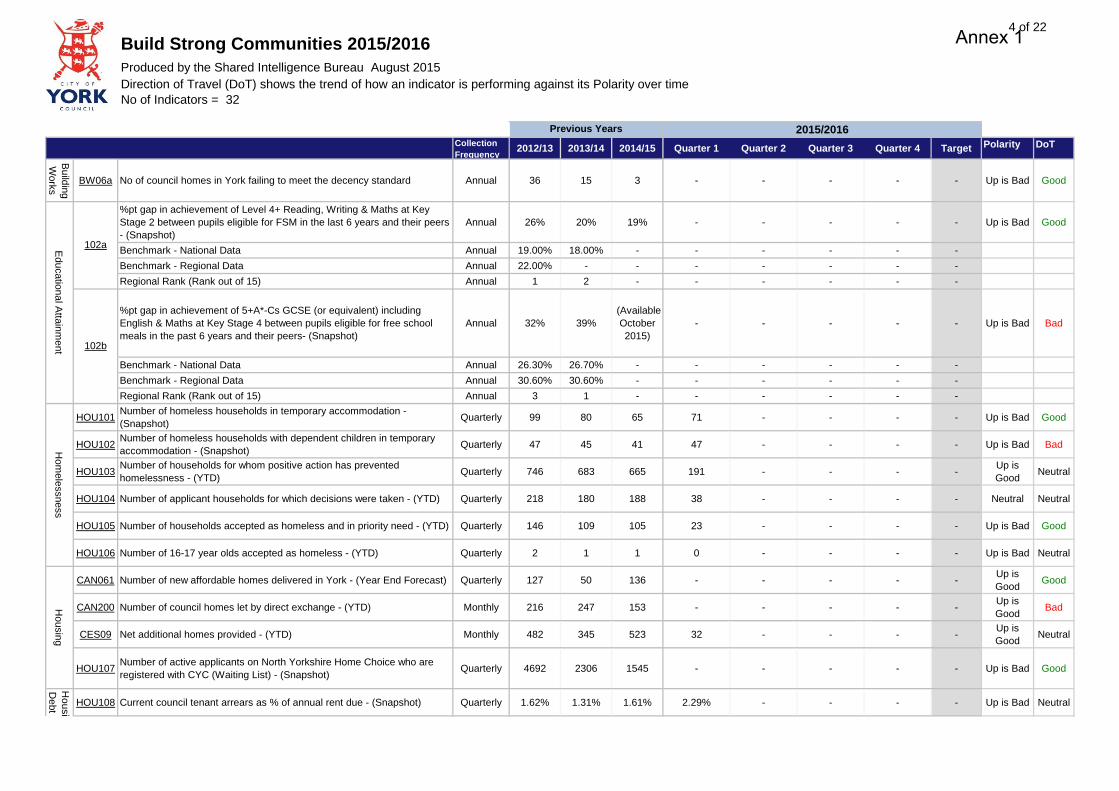
BW06a No of council homes in York failing to meet the decency standard Annual 36 15 3 - - - - - Up is Bad Good
%pt gap in achievement of Level 4+ Reading, Writing & Maths at Key
Stage 2 between pupils eligible for FSM in the last 6 years and their peers
- (Snapshot)
Annual 26% 20% 19% - - - - - Up is Bad Good
Benchmark - National Data Annual 19.00% 18.00% - - - - - -
Benchmark - Regional Data Annual 22.00% - - - - - - -
Regional Rank (Rank out of 15) Annual 1 2 - - - - - -
%pt gap in achievement of 5+A*-Cs GCSE (or equivalent) including
English & Maths at Key Stage 4 between pupils eligible for free school
meals in the past 6 years and their peers- (Snapshot)
Annual 32% 39%
(Available
October
2015)
- - - - - Up is Bad Bad
Benchmark - National Data Annual 26.30% 26.70% - - - - - -
Benchmark - Regional Data Annual 30.60% 30.60% - - - - - -
Regional Rank (Rank out of 15) Annual 3 1 - - - - - -
HOU101Number of homeless households in temporary accommodation -
(Snapshot)Quarterly 99 80 65 71 - - - - Up is Bad Good
HOU102Number of homeless households with dependent children in temporary
accommodation - (Snapshot)Quarterly 47 45 41 47 - - - - Up is Bad Bad
HOU103Number of households for whom positive action has prevented
homelessness - (YTD)Quarterly 746 683 665 191 - - - -
Up is
GoodNeutral
HOU104 Number of applicant households for which decisions were taken - (YTD) Quarterly 218 180 188 38 - - - - Neutral Neutral
HOU105 Number of households accepted as homeless and in priority need - (YTD) Quarterly 146 109 105 23 - - - - Up is Bad Good
HOU106 Number of 16-17 year olds accepted as homeless - (YTD) Quarterly 2 1 1 0 - - - - Up is Bad Neutral
CAN061 Number of new affordable homes delivered in York - (Year End Forecast) Quarterly 127 50 136 - - - - -Up is
GoodGood
CAN200 Number of council homes let by direct exchange - (YTD) Monthly 216 247 153 - - - - -Up is
GoodBad
CES09 Net additional homes provided - (YTD) Monthly 482 345 523 32 - - - -Up is
GoodNeutral
HOU107Number of active applicants on North Yorkshire Home Choice who are
registered with CYC (Waiting List) - (Snapshot)Quarterly 4692 2306 1545 - - - - - Up is Bad Good
HOU108 Current council tenant arrears as % of annual rent due - (Snapshot) Quarterly 1.62% 1.31% 1.61% 2.29% - - - - Up is Bad Neutral
Build Strong Communities 2015/2016
Produced by the Shared Intelligence Bureau August 2015
Direction of Travel (DoT) shows the trend of how an indicator is performing against its Polarity over time
No of Indicators = 32
Previous Years 2015/2016
Ed
uca
tion
al A
ttain
me
nt
102a
102b
Ho
me
lessn
ess
Ho
usin
gH
ou
sin
g -
De
bt a
nd
Annex 1

5 of 22
Collection
Frequency2012/13 2013/14 2014/15 Quarter 1 Quarter 2 Quarter 3 Quarter 4 Target Polarity DoT
Build Strong Communities 2015/2016
Produced by the Shared Intelligence Bureau August 2015
Direction of Travel (DoT) shows the trend of how an indicator is performing against its Polarity over time
No of Indicators = 32
Previous Years 2015/2016
HOU109% of rent collected (including current arrears brought forward) -
(Snapshot)Quarterly 97.90% 98.04% 97.84% 90.42% - - - -
Up is
GoodNeutral
Lib
rarie
s
LIB01 Library Visits - All Libraries Monthly 1,005,595 1,043,285 799083 165,491 - - - -Up is
GoodBad
CAN008 Average days taken to remove obscene graffiti - (YTD) Monthly 0.78 0.69 1.34 0.67 - - - - Up is Bad Neutral
CAN009 Average days taken to remove non-obscene graffiti - (YTD) Monthly 1.19 0.98 2.05 2.79 - - - - Up is Bad Bad
BSC01 Customer satisfaction that the quality of streets/public places is improving Annual 63% 49% - - - - - -Up is
GoodBad
BSC02 Customer satisfaction on how we work to improve green spaces Annual 60% 48% - - - - - -Up is
GoodBad
BSC03% of residents who feel its important for them to feel part of their local
communityAnnual 70% 74% - - - - - - Neutral Neutral
BSC04% of CYC residents stating it's important residents can influence
decisions in their local areaAnnual 75% 86% - - - - - -
Up is
GoodGood
BYS001% of residents who agree that they can influence decisions in their local
area - Agree (All Responses)Annual 29% 24% - - - - - -
Up is
GoodBad
BYS053% of residents who are satisfied with their local area as a place to live -
Satisfied (All Responses)Annual 91% 83% - - - - - -
Up is
GoodBad
BYS079% of residents who agree that they belong to their local area - Agree (All
Responses)Annual 55% 54% - - - - - -
Up is
GoodNeutral
BYS105% of residents who agree their local area is a place where people from
different backgrounds get on well together - Agree (All Responses)Annual 73% 58% - - - - - -
Up is
GoodBad
BYS131% of residents who agree that York is a safe city to live in, relatively free
from crime and violence - Agree (All Responses)Annual 74% 80% - - - - - -
Up is
GoodGood
BYS254 % of residents who volunteer at least once a month (All Responses) Annual 26% 33% - - - - - -Up is
GoodGood
BYS300% of residents who agree their local area is a safe place to live (All
Responses)Annual 79% 79% - - - - - -
Up is
GoodNeutral
BYS301% that think CYC/partners are doing well at reducing crime and anti
social behaviourAnnual 56% 48% - - - - - -
Up is
GoodBad
BYS302% of CYC residents think CYC/partners are working well to make
communities saferAnnual 54% 45% - - - - - -
Up is
GoodBad
Te
na
nt
Sa
tisfa
ctio
n
TSS35% of tenants satisfied that their landlord listens to their views and acts on
themAnnual 67.30% 61.57% 61.26% - - - - -
Up is
GoodBad
Ho
usin
g -
De
bt a
nd
Pu
blic
Re
alm
- R
esid
en
t an
d C
orp
ora
te S
urv
eys
Annex 1

6 of 22
Collection
Frequency2012/13 2013/14 2014/15 Quarter 1 Quarter 2 Quarter 3 Quarter 4 Target Polarity DoT
PVP01People supported through personal budgets or direct payments
receiving community-based services (%) (ADASS Survey definition)Monthly - 84.13% 91.29% 92.81% - - - -
Up is
GoodNeutral
PVP02Number of permanent admissions to residential & nursing care
homes for older people (65+)Monthly - - 241 85 - - - - Up is Bad Good
PVP04 Total number of Acute delayed discharges (YDH only) - (Snapshot) Monthly - - 120Available Aug
2015- - - - Up is Bad Neutral
PVP05Total number of reimbursable CYC delays (attributable to CYC)
(YDH Only) - (Snapshot)Monthly - - 115
Available Aug
2015- - - - Up is Bad Neutral
PVP06Reablement - assessments to be completed within 6 weeks of
referralMonthly - - 26.84% 33.33% - - - -
Up is
GoodGood
PVP07 OT/OTA assessments - to be completed within 28 days Monthly - - 95.87% 95.80% - - - -Up is
GoodNeutral
PVP08People supported to live independently through social services
PACKAGES OF CAREMonthly 1,784 1,753 1487 1776 - - - - Neutral Neutral
PVP09People supported to live independently through social services
PREVENTIONMonthly 2,822 2,570 2643 2437 - - - - Neutral Neutral
% of adult social care users who have as much social contact as
they would like Annual 42.7 43.00 - - - - - -
Up is
GoodNeutral
Benchmark - National Data Annual 43.2 44.50 - - - - - -
Benchmark - Regional Data Annual 45.4 44.20 - - - - - -
Regional Rank (Rank out of 15) Annual 12 12 - - - - - -
% of adults with learning disabilities in paid employment (New
definition for 2014/15)Monthly 8.70% 7.70% 13.72% 7.08% - - - -
Up is
GoodNeutral
Benchmark - National Data Annual 7.00% 6.70% - - - - - -
Benchmark - Regional Data Annual 6.50% 6.20% - - - - - -
Regional Rank (Rank out of 15) Annual 3 3 - - - - - -
% of adults with learning disabilities who live in their own home or
with family (New definition for 2014/15)Monthly 63.20% 82.60% 91.77% 82.00% - - - -
Up is
GoodGood
Benchmark - National Data Annual 73.50% 74.90% - - - - - -
Benchmark - Regional Data Annual 77.90% 79.20% - - - - - -
Regional Rank (Rank out of 15) Annual 15 5 - - - - - -
Permanent admissions to residential and nursing care homes for
younger adults (18-64), per 100,000 population (New definition for
2014/15)
Monthly 7.7 11.5 9.97 2.30 - - - - Up is Bad Good
Benchmark - National Data Annual 15 14.4 - - - - - -
Benchmark - Regional Data Annual 15.3 11 - - - - - -
Regional Rank (Rank out of 15) Annual 1 7 - - - - - -
Ad
ult S
ocia
l Ca
re O
utc
om
es F
ram
ew
ork
ASCOF1
E
ASCOF1
G
ASCOF2
A1
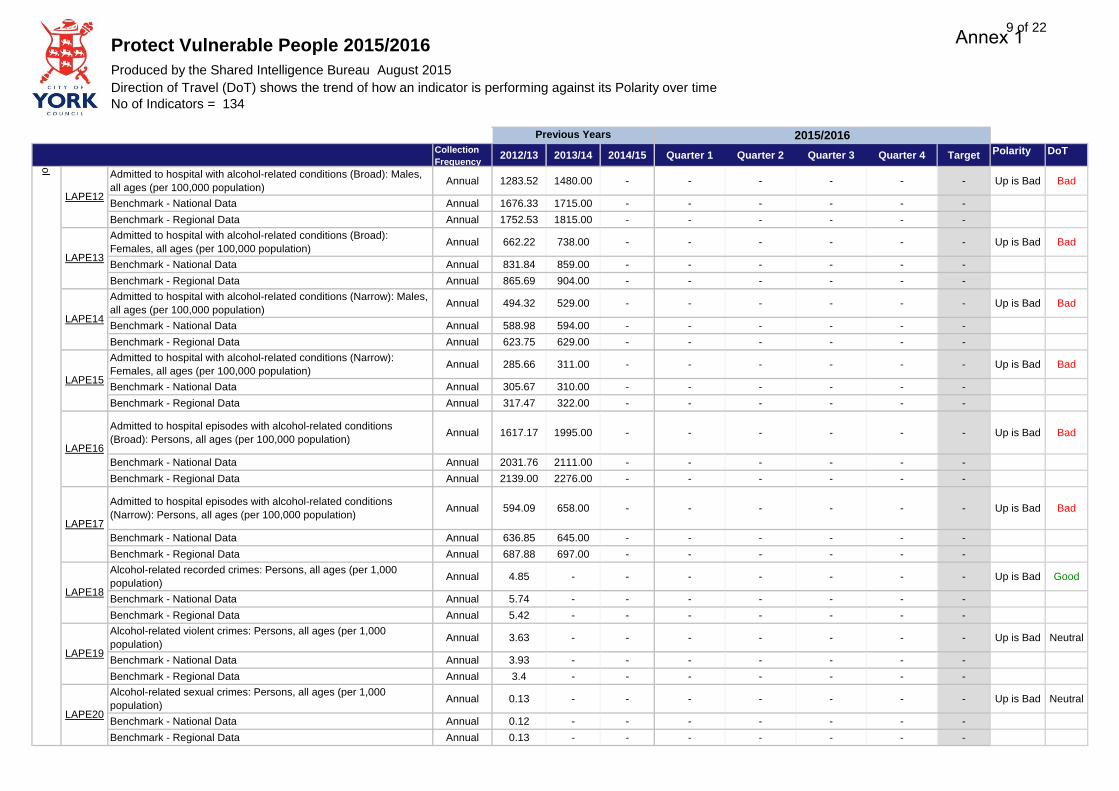
Protect Vulnerable People 2015/2016
Produced by the Shared Intelligence Bureau August 2015
Direction of Travel (DoT) shows the trend of how an indicator is performing against its Polarity over time
No of Indicators = 134
Previous Years 2015/2016
Ad
ult S
ocia
l Ca
re
PHOF15
Annex 1

7 of 22
Collection
Frequency2012/13 2013/14 2014/15 Quarter 1 Quarter 2 Quarter 3 Quarter 4 Target Polarity DoT
Protect Vulnerable People 2015/2016
Produced by the Shared Intelligence Bureau August 2015
Direction of Travel (DoT) shows the trend of how an indicator is performing against its Polarity over time
No of Indicators = 134
Previous Years 2015/2016
Permanent admissions to residential and nursing care homes for
older people (65+), per 100,000 population (New definition for
2014/15)
Monthly 617.7 767.5 644.26 238.10 - - - - Up is Bad Good
Benchmark - National Data Annual 697.2 650.6 - - - - - -
Benchmark - Regional Data Annual 680.3 644.1 - - - - - -
Regional Rank (Rank out of 15) Annual 4 13 - - - - - -
% of older people (65+) who were still at home 91 days after
discharge from hospital into reablement/rehabilitation servicesAnnual 69.80% 80.90% 81.48% - - - - -
Up is
GoodGood
Benchmark - National Data Annual 81.40% 82.50% - - - - - -
Benchmark - Regional Data Annual 81.50% 85.30% - - - - - -
Regional Rank (Rank out of 15) Annual 14 12 - - - - - -
% of older people (65 and over) who were offered reablement
services following discharge from hospitalAnnual 0.70% 1.10% 0.89% - - - - -
Up is
GoodNeutral
Benchmark - National Data Annual 3.20% 3.30% - - - - - -
Benchmark - Regional Data Annual 2.00% 1.90% - - - - - -
Regional Rank (Rank out of 15) Annual 13 12 - - - - - -
Delayed transfers of care from hospital, per 100,000 population -
(Snapshot)Monthly 18.2 17.6 11.89 - - - - - Up is Bad Good
Benchmark - National Data Annual 9.4 9.6 - - - - - -
Benchmark - Regional Data Annual 7.8 9.1 - - - - - -
Regional Rank (Rank out of 15) Annual 15 14 - - - - - -
Delayed transfers of care from hospital which are attributable to
adult social care, per 100,000 population - (Snapshot)Monthly 10.7 11.1 6.35 - - - - - Up is Bad Good
Benchmark - National Data Annual 3.2 3.1 - - - - - -
Benchmark - Regional Data Annual 2.3 2.5 - - - - - -
Regional Rank (Rank out of 15) Annual 15 15 - - - - - -
% of people who use services who feel safe (New definition for
2014/15 - ASCS sampling frame updated)Annual 61.80% 63.40% 62.00% - - - - -
Up is
GoodNeutral
Benchmark - National Data Annual 65.10% 66.00% - - - - - -
Benchmark - Regional Data Annual 67.30% 66.20% - - - - - -
Regional Rank (Rank out of 15) Annual 14 11 - - - - - -
Overall satisfaction of people who use services with their care and
support (New definition for 2014/15 - ASCS sampling frame
updated)
Annual 65.80% 67.40% 67.00% - - - - -Up is
GoodNeutral
Benchmark - National Data Annual 64.10% 64.80% - - - - - -
Benchmark - Regional Data Annual 65.40% 65.80% - - - - - -
Regional Rank (Rank out of 15) Annual 7 5 - - - - - -
ASCOF3
A
Ad
ult S
ocia
l Ca
re O
utc
om
es F
ram
ew
ork
ASCOF2
A2
ASCOF2
B1
ASCOF2
B2
ASCOF2
C1
ASCOF2
C2
ASCOF4
A
Annex 1

8 of 22
Collection
Frequency2012/13 2013/14 2014/15 Quarter 1 Quarter 2 Quarter 3 Quarter 4 Target Polarity DoT
Protect Vulnerable People 2015/2016
Produced by the Shared Intelligence Bureau August 2015
Direction of Travel (DoT) shows the trend of how an indicator is performing against its Polarity over time
No of Indicators = 134
Previous Years 2015/2016
Alcohol related admissions to hospital (per 100,000 population) Annual 594.09 658 - - - - - - Up is Bad Bad
Benchmark - National Data Annual 636.85 645 - - - - - -
Benchmark - Regional Data Annual 687.88 697 - - - - - -
Regional Rank (Rank out of 15) Annual 3 - - - - - - -
Months of life lost due to alcohol: Males aged less than 75 years Annual 11.91 11.69 - - - - - - Up is Bad Neutral
Benchmark - National Data Annual 11.49 11.97 - - - - - -
Benchmark - Regional Data Annual 12.26 12.98 - - - - - -
Months of life lost due to alcohol: Females aged less than 75 years Annual 5.54 5.65 - - - - - - Up is Bad Bad
Benchmark - National Data Annual 5.38 5.58 - - - - - -
Alcohol-specific mortality: Males, all ages (per 100,000 population) Annual 13.28 14.60 - - - - - - Up is Bad Bad
Benchmark - National Data Annual 14.57 16.61 - - - - - -
Benchmark - Regional Data Annual 15.80 18.13 - - - - - -
Alcohol-specific mortality: Females, all ages (per 100,000
population)Annual 6.83 7.86 - - - - - - Up is Bad Bad
Benchmark - National Data Annual 6.78 7.47 - - - - - -
Benchmark - Regional Data Annual 7.49 8.73 - - - - - -
Alcohol-related mortality: Males, all ages (per 100,000 population) Annual 58.79 60.05 - - - - - - Up is Bad Neutral
Benchmark - National Data Annual 63.20 65.43 - - - - - -
Benchmark - Regional Data Annual 66.95 68.36 - - - - - -
Alcohol-related mortality: Females, all ages (per 100,000 population) Annual 27.16 26.12 - - - - - - Up is Bad Neutral
Benchmark - National Data Annual 28.05 28.42 - - - - - -
Benchmark - Regional Data Annual 28.07 30.27 - - - - - -
Under 18s admitted to hospital with alcohol-specific conditions (per
100,000 population)Annual 28.86 30.50 - - - - - - Up is Bad Good
Benchmark - National Data Annual 44.88 40.10 - - - - - -
Benchmark - Regional Data Annual 44.14 38.10 - - - - - -
Admitted to hospital with alcohol-specific conditions: Males, all ages
(per 100,000 population)Annual 387.16 449.00 - - - - - - Up is Bad Bad
Benchmark - Regional Data Annual 521.67 535.00 - - - - - -
Admitted to hospital with alcohol-specific conditions: Females, all
ages (per 100,000 population)Annual 219.11 251.00 - - - - - - Up is Bad Bad
Benchmark - National Data Annual 232.26 241.00 - - - - - -
Benchmark - Regional Data Annual 243.63 255.00 - - - - - -
LAPE10
LAPE11Alc
oh
ol
PHOF03
LAPE01
LAPE02
LAPE03
LAPE04
LAPE07
LAPE08
LAPE09
Annex 1
9 of 22
Collection
Frequency2012/13 2013/14 2014/15 Quarter 1 Quarter 2 Quarter 3 Quarter 4 Target Polarity DoT
Protect Vulnerable People 2015/2016
Produced by the Shared Intelligence Bureau August 2015
Direction of Travel (DoT) shows the trend of how an indicator is performing against its Polarity over time
No of Indicators = 134
Previous Years 2015/2016
Admitted to hospital with alcohol-related conditions (Broad): Males,
all ages (per 100,000 population)Annual 1283.52 1480.00 - - - - - - Up is Bad Bad
Benchmark - National Data Annual 1676.33 1715.00 - - - - - -
Benchmark - Regional Data Annual 1752.53 1815.00 - - - - - -
Admitted to hospital with alcohol-related conditions (Broad):
Females, all ages (per 100,000 population)Annual 662.22 738.00 - - - - - - Up is Bad Bad
Benchmark - National Data Annual 831.84 859.00 - - - - - -
Benchmark - Regional Data Annual 865.69 904.00 - - - - - -
Admitted to hospital with alcohol-related conditions (Narrow): Males,
all ages (per 100,000 population)Annual 494.32 529.00 - - - - - - Up is Bad Bad
Benchmark - National Data Annual 588.98 594.00 - - - - - -
Benchmark - Regional Data Annual 623.75 629.00 - - - - - -
Admitted to hospital with alcohol-related conditions (Narrow):
Females, all ages (per 100,000 population)Annual 285.66 311.00 - - - - - - Up is Bad Bad
Benchmark - National Data Annual 305.67 310.00 - - - - - -
Benchmark - Regional Data Annual 317.47 322.00 - - - - - -
Admitted to hospital episodes with alcohol-related conditions
(Broad): Persons, all ages (per 100,000 population)Annual 1617.17 1995.00 - - - - - - Up is Bad Bad
Benchmark - National Data Annual 2031.76 2111.00 - - - - - -
Benchmark - Regional Data Annual 2139.00 2276.00 - - - - - -
Admitted to hospital episodes with alcohol-related conditions
(Narrow): Persons, all ages (per 100,000 population)Annual 594.09 658.00 - - - - - - Up is Bad Bad
Benchmark - National Data Annual 636.85 645.00 - - - - - -
Benchmark - Regional Data Annual 687.88 697.00 - - - - - -
Alcohol-related recorded crimes: Persons, all ages (per 1,000
population)Annual 4.85 - - - - - - - Up is Bad Good
Benchmark - National Data Annual 5.74 - - - - - - -
Benchmark - Regional Data Annual 5.42 - - - - - - -
Alcohol-related violent crimes: Persons, all ages (per 1,000
population)Annual 3.63 - - - - - - - Up is Bad Neutral
Benchmark - National Data Annual 3.93 - - - - - - -
Benchmark - Regional Data Annual 3.4 - - - - - - -
Alcohol-related sexual crimes: Persons, all ages (per 1,000
population)Annual 0.13 - - - - - - - Up is Bad Neutral
Benchmark - National Data Annual 0.12 - - - - - - -
Benchmark - Regional Data Annual 0.13 - - - - - - -
LAPE12
LAPE13
LAPE14
LAPE15
LAPE16
LAPE17
LAPE18
LAPE19
LAPE20
Alc
oh
ol
Annex 1
10 of 22
Collection
Frequency2012/13 2013/14 2014/15 Quarter 1 Quarter 2 Quarter 3 Quarter 4 Target Polarity DoT
Protect Vulnerable People 2015/2016
Produced by the Shared Intelligence Bureau August 2015
Direction of Travel (DoT) shows the trend of how an indicator is performing against its Polarity over time
No of Indicators = 134
Previous Years 2015/2016
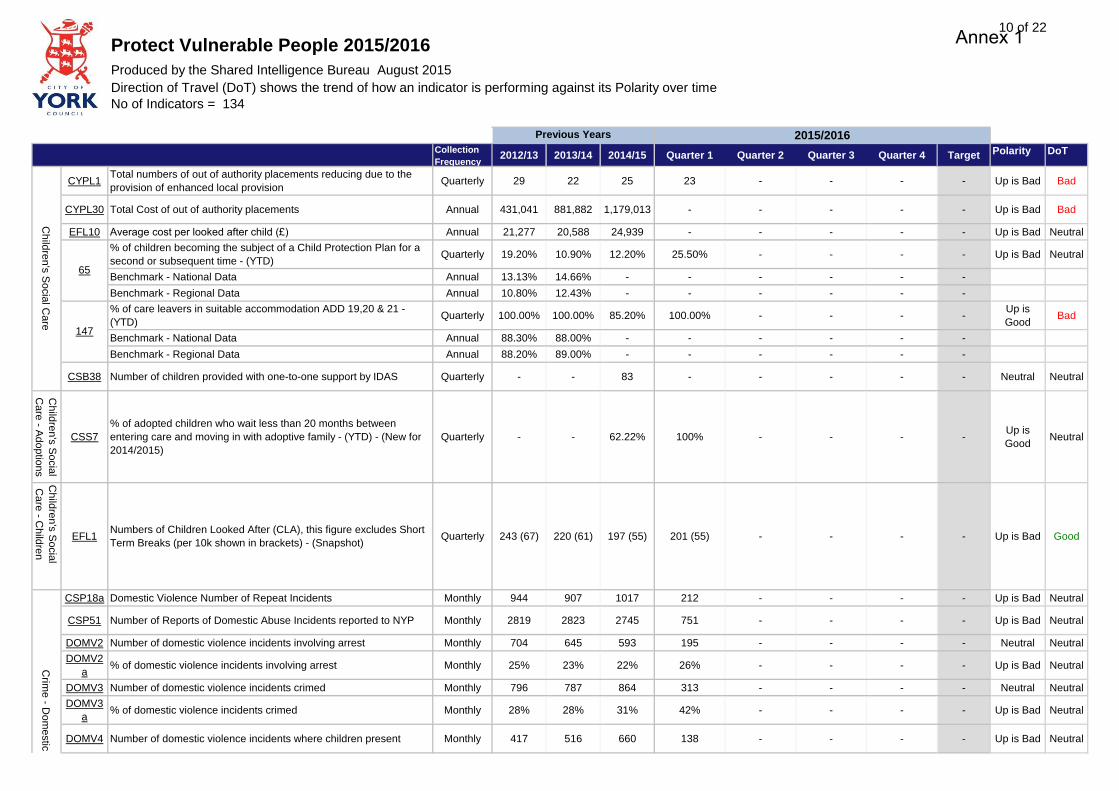
CYPL1Total numbers of out of authority placements reducing due to the
provision of enhanced local provisionQuarterly 29 22 25 23 - - - - Up is Bad Bad
CYPL30 Total Cost of out of authority placements Annual 431,041 881,882 1,179,013 - - - - - Up is Bad Bad
EFL10 Average cost per looked after child (£) Annual 21,277 20,588 24,939 - - - - - Up is Bad Neutral
% of children becoming the subject of a Child Protection Plan for a
second or subsequent time - (YTD)Quarterly 19.20% 10.90% 12.20% 25.50% - - - - Up is Bad Neutral
Benchmark - National Data Annual 13.13% 14.66% - - - - - -
Benchmark - Regional Data Annual 10.80% 12.43% - - - - - -
% of care leavers in suitable accommodation ADD 19,20 & 21 -
(YTD)Quarterly 100.00% 100.00% 85.20% 100.00% - - - -
Up is
GoodBad
Benchmark - National Data Annual 88.30% 88.00% - - - - - -
Benchmark - Regional Data Annual 88.20% 89.00% - - - - - -
CSB38 Number of children provided with one-to-one support by IDAS Quarterly - - 83 - - - - - Neutral Neutral
Ch
ildre
n's
So
cia
l
Ca
re - A
do
ptio
ns
CSS7
% of adopted children who wait less than 20 months between
entering care and moving in with adoptive family - (YTD) - (New for
2014/2015)
Quarterly - - 62.22% 100% - - - -Up is
GoodNeutral
Ch
ildre
n's
So
cia
l
Ca
re - C
hild
ren
EFL1Numbers of Children Looked After (CLA), this figure excludes Short
Term Breaks (per 10k shown in brackets) - (Snapshot)Quarterly 243 (67) 220 (61) 197 (55) 201 (55) - - - - Up is Bad Good
CSP18a Domestic Violence Number of Repeat Incidents Monthly 944 907 1017 212 - - - - Up is Bad Neutral
CSP51 Number of Reports of Domestic Abuse Incidents reported to NYP Monthly 2819 2823 2745 751 - - - - Up is Bad Neutral
DOMV2 Number of domestic violence incidents involving arrest Monthly 704 645 593 195 - - - - Neutral Neutral
DOMV2
a% of domestic violence incidents involving arrest Monthly 25% 23% 22% 26% - - - - Up is Bad Neutral
DOMV3 Number of domestic violence incidents crimed Monthly 796 787 864 313 - - - - Neutral Neutral
DOMV3
a% of domestic violence incidents crimed Monthly 28% 28% 31% 42% - - - - Up is Bad Neutral
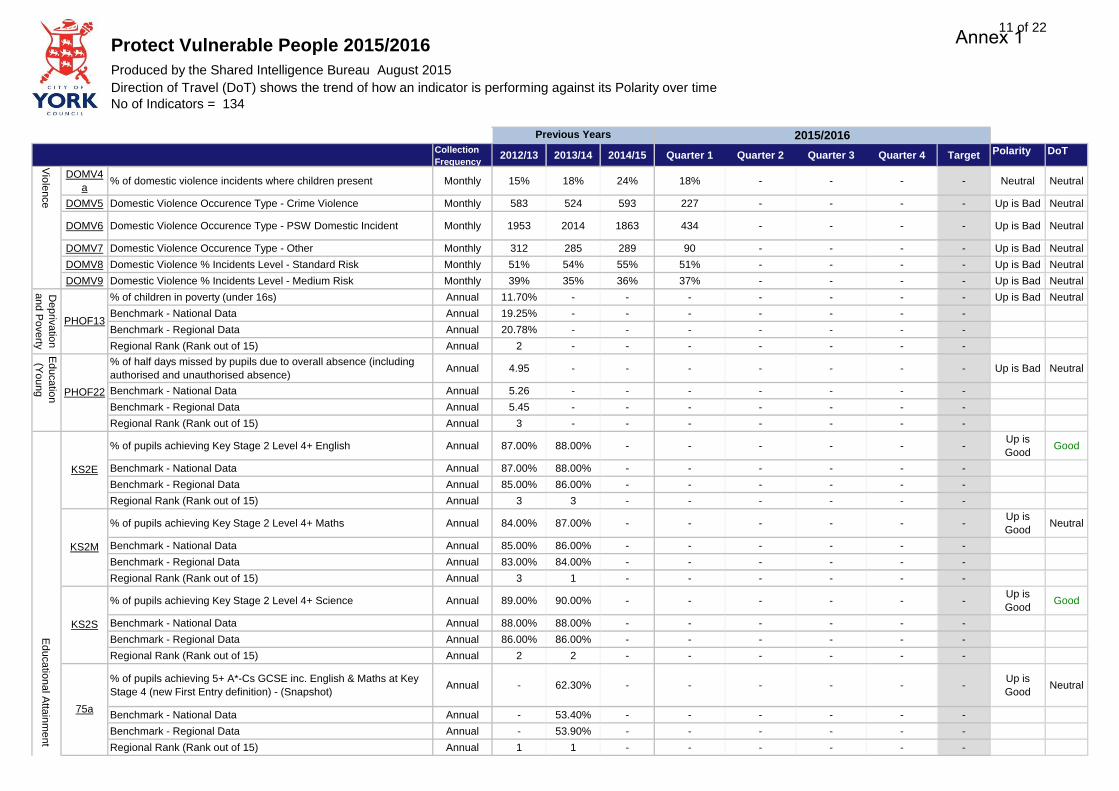
DOMV4 Number of domestic violence incidents where children present Monthly 417 516 660 138 - - - - Up is Bad Neutral
Crim
e - D
om
estic
Vio
len
ce
Ch
ildre
n's
So
cia
l Ca
re
65
147
Annex 1
11 of 22
Collection
Frequency2012/13 2013/14 2014/15 Quarter 1 Quarter 2 Quarter 3 Quarter 4 Target Polarity DoT
Protect Vulnerable People 2015/2016
Produced by the Shared Intelligence Bureau August 2015
Direction of Travel (DoT) shows the trend of how an indicator is performing against its Polarity over time
No of Indicators = 134
Previous Years 2015/2016
DOMV4
a% of domestic violence incidents where children present Monthly 15% 18% 24% 18% - - - - Neutral Neutral
DOMV5 Domestic Violence Occurence Type - Crime Violence Monthly 583 524 593 227 - - - - Up is Bad Neutral
DOMV6 Domestic Violence Occurence Type - PSW Domestic Incident Monthly 1953 2014 1863 434 - - - - Up is Bad Neutral
DOMV7 Domestic Violence Occurence Type - Other Monthly 312 285 289 90 - - - - Up is Bad Neutral
DOMV8 Domestic Violence % Incidents Level - Standard Risk Monthly 51% 54% 55% 51% - - - - Up is Bad Neutral
DOMV9 Domestic Violence % Incidents Level - Medium Risk Monthly 39% 35% 36% 37% - - - - Up is Bad Neutral
% of children in poverty (under 16s) Annual 11.70% - - - - - - - Up is Bad Neutral
Benchmark - National Data Annual 19.25% - - - - - - -
Benchmark - Regional Data Annual 20.78% - - - - - - -
Regional Rank (Rank out of 15) Annual 2 - - - - - - -
% of half days missed by pupils due to overall absence (including
authorised and unauthorised absence)Annual 4.95 - - - - - - - Up is Bad Neutral
Benchmark - National Data Annual 5.26 - - - - - - -
Benchmark - Regional Data Annual 5.45 - - - - - - -
Regional Rank (Rank out of 15) Annual 3 - - - - - - -
% of pupils achieving Key Stage 2 Level 4+ English Annual 87.00% 88.00% - - - - - -Up is
GoodGood
Benchmark - National Data Annual 87.00% 88.00% - - - - - -
Benchmark - Regional Data Annual 85.00% 86.00% - - - - - -
Regional Rank (Rank out of 15) Annual 3 3 - - - - - -
% of pupils achieving Key Stage 2 Level 4+ Maths Annual 84.00% 87.00% - - - - - -Up is
GoodNeutral
Benchmark - National Data Annual 85.00% 86.00% - - - - - -
Benchmark - Regional Data Annual 83.00% 84.00% - - - - - -
Regional Rank (Rank out of 15) Annual 3 1 - - - - - -
% of pupils achieving Key Stage 2 Level 4+ Science Annual 89.00% 90.00% - - - - - -Up is
GoodGood
Benchmark - National Data Annual 88.00% 88.00% - - - - - -
Benchmark - Regional Data Annual 86.00% 86.00% - - - - - -
Regional Rank (Rank out of 15) Annual 2 2 - - - - - -
% of pupils achieving 5+ A*-Cs GCSE inc. English & Maths at Key
Stage 4 (new First Entry definition) - (Snapshot)Annual - 62.30% - - - - - -
Up is
GoodNeutral
Benchmark - National Data Annual - 53.40% - - - - - -
Benchmark - Regional Data Annual - 53.90% - - - - - -
Regional Rank (Rank out of 15) Annual 1 1 - - - - - -
Ed
uca
tion
al A
ttain
me
nt
KS2E
KS2M
KS2S
75a
Crim
e - D
om
estic
Vio
len
ce
De
priv
atio
n
an
d P
ove
rty
PHOF13
Ed
uca
tion
(Yo
un
g PHOF22
Annex 1
12 of 22
Collection
Frequency2012/13 2013/14 2014/15 Quarter 1 Quarter 2 Quarter 3 Quarter 4 Target Polarity DoT
Protect Vulnerable People 2015/2016
Produced by the Shared Intelligence Bureau August 2015
Direction of Travel (DoT) shows the trend of how an indicator is performing against its Polarity over time
No of Indicators = 134
Previous Years 2015/2016
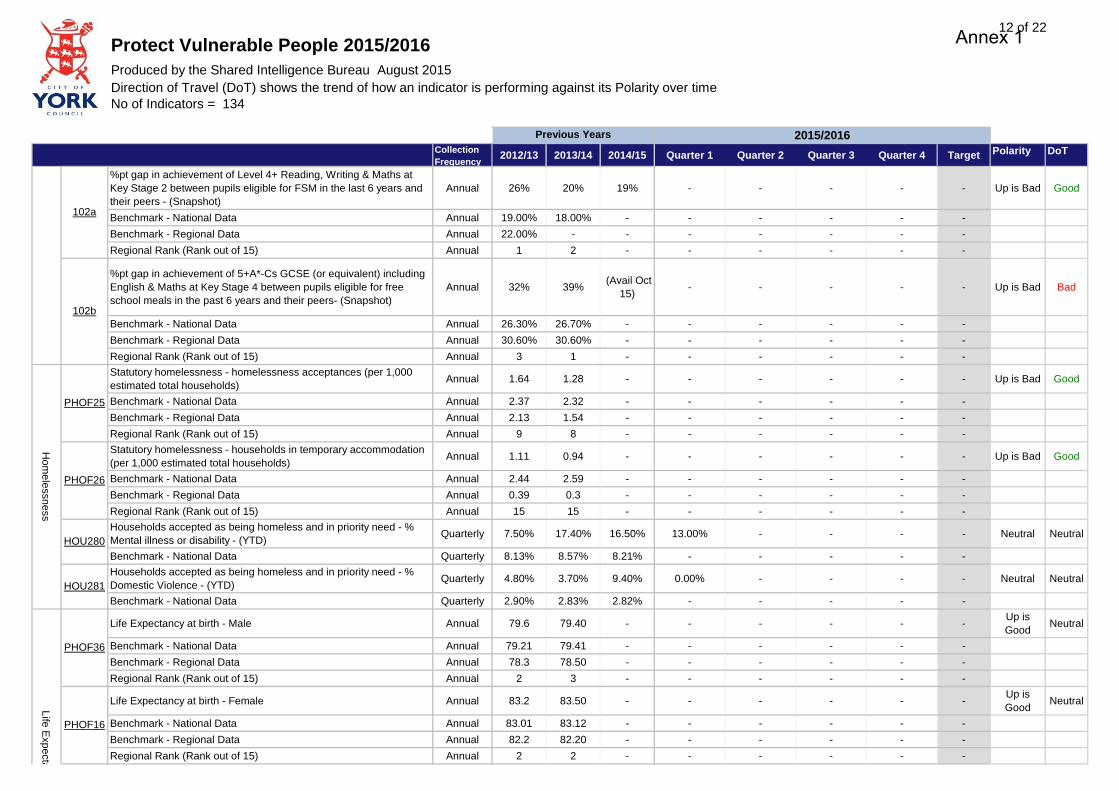
%pt gap in achievement of Level 4+ Reading, Writing & Maths at
Key Stage 2 between pupils eligible for FSM in the last 6 years and
their peers - (Snapshot)
Annual 26% 20% 19% - - - - - Up is Bad Good
Benchmark - National Data Annual 19.00% 18.00% - - - - - -
Benchmark - Regional Data Annual 22.00% - - - - - - -
Regional Rank (Rank out of 15) Annual 1 2 - - - - - -
%pt gap in achievement of 5+A*-Cs GCSE (or equivalent) including
English & Maths at Key Stage 4 between pupils eligible for free
school meals in the past 6 years and their peers- (Snapshot)
Annual 32% 39% (Avail Oct
15)- - - - - Up is Bad Bad
Benchmark - National Data Annual 26.30% 26.70% - - - - - -
Benchmark - Regional Data Annual 30.60% 30.60% - - - - - -
Regional Rank (Rank out of 15) Annual 3 1 - - - - - -
Statutory homelessness - homelessness acceptances (per 1,000
estimated total households)Annual 1.64 1.28 - - - - - - Up is Bad Good
Benchmark - National Data Annual 2.37 2.32 - - - - - -
Benchmark - Regional Data Annual 2.13 1.54 - - - - - -
Regional Rank (Rank out of 15) Annual 9 8 - - - - - -
Statutory homelessness - households in temporary accommodation
(per 1,000 estimated total households)Annual 1.11 0.94 - - - - - - Up is Bad Good
Benchmark - National Data Annual 2.44 2.59 - - - - - -
Benchmark - Regional Data Annual 0.39 0.3 - - - - - -
Regional Rank (Rank out of 15) Annual 15 15 - - - - - -
Households accepted as being homeless and in priority need - %
Mental illness or disability - (YTD)Quarterly 7.50% 17.40% 16.50% 13.00% - - - - Neutral Neutral
Benchmark - National Data Quarterly 8.13% 8.57% 8.21% - - - - -
Households accepted as being homeless and in priority need - %
Domestic Violence - (YTD)Quarterly 4.80% 3.70% 9.40% 0.00% - - - - Neutral Neutral
Benchmark - National Data Quarterly 2.90% 2.83% 2.82% - - - - -
Life Expectancy at birth - Male Annual 79.6 79.40 - - - - - -Up is
GoodNeutral
Benchmark - National Data Annual 79.21 79.41 - - - - - -
Benchmark - Regional Data Annual 78.3 78.50 - - - - - -
Regional Rank (Rank out of 15) Annual 2 3 - - - - - -
Life Expectancy at birth - Female Annual 83.2 83.50 - - - - - -Up is
GoodNeutral
Benchmark - National Data Annual 83.01 83.12 - - - - - -
Benchmark - Regional Data Annual 82.2 82.20 - - - - - -
Regional Rank (Rank out of 15) Annual 2 2 - - - - - -
PHOF16
102a
102b
Ho
me
lessn
ess
PHOF25
PHOF26
HOU280
HOU281
Ed
uca
tion
al A
ttain
me
nt
Life
Exp
ecta
ncy
PHOF36
Annex 1
13 of 22
Collection
Frequency2012/13 2013/14 2014/15 Quarter 1 Quarter 2 Quarter 3 Quarter 4 Target Polarity DoT
Protect Vulnerable People 2015/2016
Produced by the Shared Intelligence Bureau August 2015
Direction of Travel (DoT) shows the trend of how an indicator is performing against its Polarity over time
No of Indicators = 134
Previous Years 2015/2016
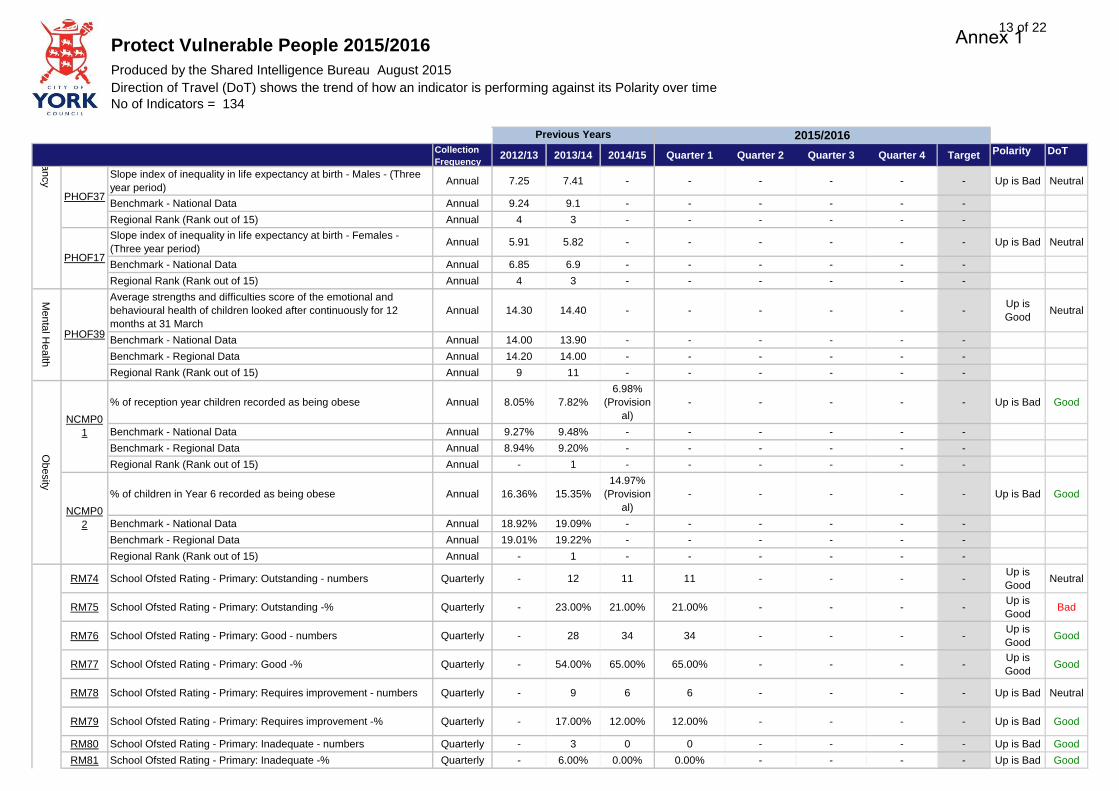
Slope index of inequality in life expectancy at birth - Males - (Three
year period)Annual 7.25 7.41 - - - - - - Up is Bad Neutral
Benchmark - National Data Annual 9.24 9.1 - - - - - -
Regional Rank (Rank out of 15) Annual 4 3 - - - - - -
Slope index of inequality in life expectancy at birth - Females -
(Three year period)Annual 5.91 5.82 - - - - - - Up is Bad Neutral
Benchmark - National Data Annual 6.85 6.9 - - - - - -
Regional Rank (Rank out of 15) Annual 4 3 - - - - - -
Average strengths and difficulties score of the emotional and
behavioural health of children looked after continuously for 12
months at 31 March
Annual 14.30 14.40 - - - - - -Up is
GoodNeutral
Benchmark - National Data Annual 14.00 13.90 - - - - - -
Benchmark - Regional Data Annual 14.20 14.00 - - - - - -
Regional Rank (Rank out of 15) Annual 9 11 - - - - - -
% of reception year children recorded as being obese Annual 8.05% 7.82%
6.98%
(Provision
al)
- - - - - Up is Bad Good
Benchmark - National Data Annual 9.27% 9.48% - - - - - -
Benchmark - Regional Data Annual 8.94% 9.20% - - - - - -
Regional Rank (Rank out of 15) Annual - 1 - - - - - -
% of children in Year 6 recorded as being obese Annual 16.36% 15.35%
14.97%
(Provision
al)
- - - - - Up is Bad Good
Benchmark - National Data Annual 18.92% 19.09% - - - - - -
Benchmark - Regional Data Annual 19.01% 19.22% - - - - - -
Regional Rank (Rank out of 15) Annual - 1 - - - - - -
RM74 School Ofsted Rating - Primary: Outstanding - numbers Quarterly - 12 11 11 - - - -Up is
GoodNeutral
RM75 School Ofsted Rating - Primary: Outstanding -% Quarterly - 23.00% 21.00% 21.00% - - - -Up is
GoodBad
RM76 School Ofsted Rating - Primary: Good - numbers Quarterly - 28 34 34 - - - -Up is
GoodGood
RM77 School Ofsted Rating - Primary: Good -% Quarterly - 54.00% 65.00% 65.00% - - - -Up is
GoodGood
RM78 School Ofsted Rating - Primary: Requires improvement - numbers Quarterly - 9 6 6 - - - - Up is Bad Neutral
RM79 School Ofsted Rating - Primary: Requires improvement -% Quarterly - 17.00% 12.00% 12.00% - - - - Up is Bad Good
RM80 School Ofsted Rating - Primary: Inadequate - numbers Quarterly - 3 0 0 - - - - Up is Bad Good
RM81 School Ofsted Rating - Primary: Inadequate -% Quarterly - 6.00% 0.00% 0.00% - - - - Up is Bad Good
Ofs
ted
Ra
ting
s
PHOF37
PHOF17
Ob
esity
NCMP0
1
NCMP0
2
Me
nta
l He
alth
PHOF39
Life
Exp
ecta
ncy
Annex 1
14 of 22
Collection
Frequency2012/13 2013/14 2014/15 Quarter 1 Quarter 2 Quarter 3 Quarter 4 Target Polarity DoT
Protect Vulnerable People 2015/2016
Produced by the Shared Intelligence Bureau August 2015
Direction of Travel (DoT) shows the trend of how an indicator is performing against its Polarity over time
No of Indicators = 134
Previous Years 2015/2016
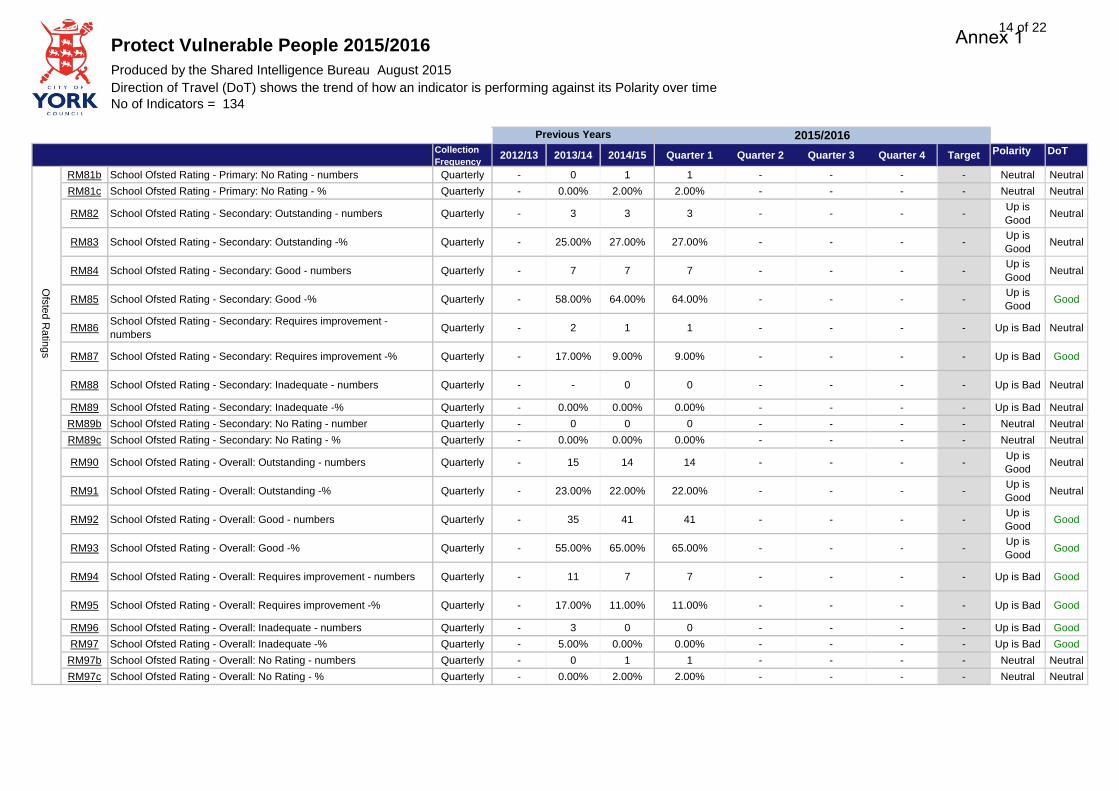
RM81b School Ofsted Rating - Primary: No Rating - numbers Quarterly - 0 1 1 - - - - Neutral Neutral
RM81c School Ofsted Rating - Primary: No Rating - % Quarterly - 0.00% 2.00% 2.00% - - - - Neutral Neutral
RM82 School Ofsted Rating - Secondary: Outstanding - numbers Quarterly - 3 3 3 - - - -Up is
GoodNeutral
RM83 School Ofsted Rating - Secondary: Outstanding -% Quarterly - 25.00% 27.00% 27.00% - - - -Up is
GoodNeutral
RM84 School Ofsted Rating - Secondary: Good - numbers Quarterly - 7 7 7 - - - -Up is
GoodNeutral
RM85 School Ofsted Rating - Secondary: Good -% Quarterly - 58.00% 64.00% 64.00% - - - -Up is
GoodGood
RM86School Ofsted Rating - Secondary: Requires improvement -
numbersQuarterly - 2 1 1 - - - - Up is Bad Neutral
RM87 School Ofsted Rating - Secondary: Requires improvement -% Quarterly - 17.00% 9.00% 9.00% - - - - Up is Bad Good
RM88 School Ofsted Rating - Secondary: Inadequate - numbers Quarterly - - 0 0 - - - - Up is Bad Neutral
RM89 School Ofsted Rating - Secondary: Inadequate -% Quarterly - 0.00% 0.00% 0.00% - - - - Up is Bad Neutral
RM89b School Ofsted Rating - Secondary: No Rating - number Quarterly - 0 0 0 - - - - Neutral Neutral
RM89c School Ofsted Rating - Secondary: No Rating - % Quarterly - 0.00% 0.00% 0.00% - - - - Neutral Neutral
RM90 School Ofsted Rating - Overall: Outstanding - numbers Quarterly - 15 14 14 - - - -Up is
GoodNeutral
RM91 School Ofsted Rating - Overall: Outstanding -% Quarterly - 23.00% 22.00% 22.00% - - - -Up is
GoodNeutral
RM92 School Ofsted Rating - Overall: Good - numbers Quarterly - 35 41 41 - - - -Up is
GoodGood
RM93 School Ofsted Rating - Overall: Good -% Quarterly - 55.00% 65.00% 65.00% - - - -Up is
GoodGood
RM94 School Ofsted Rating - Overall: Requires improvement - numbers Quarterly - 11 7 7 - - - - Up is Bad Good
RM95 School Ofsted Rating - Overall: Requires improvement -% Quarterly - 17.00% 11.00% 11.00% - - - - Up is Bad Good
RM96 School Ofsted Rating - Overall: Inadequate - numbers Quarterly - 3 0 0 - - - - Up is Bad Good
RM97 School Ofsted Rating - Overall: Inadequate -% Quarterly - 5.00% 0.00% 0.00% - - - - Up is Bad Good
RM97b School Ofsted Rating - Overall: No Rating - numbers Quarterly - 0 1 1 - - - - Neutral Neutral
RM97c School Ofsted Rating - Overall: No Rating - % Quarterly - 0.00% 2.00% 2.00% - - - - Neutral Neutral
Ofs
ted
Ra
ting
s
Annex 1

15 of 22
Collection
Frequency2012/13 2013/14 2014/15 Quarter 1 Quarter 2 Quarter 3 Quarter 4 Target Polarity DoT
Protect Vulnerable People 2015/2016
Produced by the Shared Intelligence Bureau August 2015
Direction of Travel (DoT) shows the trend of how an indicator is performing against its Polarity over time
No of Indicators = 134
Previous Years 2015/2016
Injuries due to falls in people aged 65 and over (per 100,000
population)Annual 1,912.09 1983.23 - - - - - - Up is Bad Neutral
Benchmark - National Data Annual 2,011.01 2064.26 - - - - - -
Benchmark - Regional Data Annual 1,913.62 2005.90 - - - - - -
Regional Rank (Rank out of 15) Annual 7 7 - - - - - -
% of the population exposed to road, rail and air transport noise of
55 dB(A) or more during the night-timeAnnual - - - - - - - - Up is Bad Neutral
Benchmark - National Data Annual - - - - - - - -
Benchmark - Regional Data Annual - - - - - - - -
Regional Rank (Rank out of 15) Annual - - - - - - - -
Cancer screening coverage - breast cancer (% eligible women
screened adequately within previous 3 years)Annual 81.42% 80.63% - - - - - -
Up is
GoodBad
Benchmark - National Data Annual 76.32 75.9 - - - - - -
Benchmark - Regional Data Annual 76.69 76.13 - - - - - -
Regional Rank (Rank out of 15) Annual 1 1 - - - - - -
Cancer screening coverage - cervical cancer (% eligible women
screened adequately within previous 3.5 or 5.5 years)Annual 74.74% 74.69% - - - - - -
Up is
GoodNeutral
Benchmark - National Data Annual 73.93 64.16 - - - - - -
Benchmark - Regional Data Annual 76.05 76.16 - - - - - -
Regional Rank (Rank out of 15) Annual 13 14 - - - - - -
% of eligible population aged 40-74 who received an NHS Health
CheckAnnual - 8.69% - - - - - -
Up is
GoodNeutral
Benchmark - National Data Annual - 9.03% - - - - - -
Benchmark - Regional Data Annual - 8.24% - - - - - -
Regional Rank (Rank out of 15) Annual - 6 - - - - - -
Suicide rate (per 100,000 population) Annual 10.13 - - - - - - - Up is Bad Bad
Benchmark - National Data Annual 8.77 - - - - - - -
Benchmark - Regional Data Annual 9.33 - - - - - - -
Regional Rank (Rank out of 15) Annual 10 - - - - - - -
CYP10-4 Number of Troubled Families turned around - (New 2014/2015) Quarterly - - 306 315 - - - -Up is
GoodGood
CYP10-5Troubled Families: Number of identified families that are being/have
been worked with - (New for 2014/2015)Quarterly - - 315 315 - - - -
Up is
GoodNeutral
CYP10-6Troubled Families: Number of families “turned around” for Education
and Crime/ASB issues - (New for 2014/2015)Quarterly - - 266 271 - - - -
Up is
GoodGood
PHOF32
Sa
feg
ua
rdin
g (Y
ou
ng
Pe
op
le)
Pu
blic
He
alth
an
d W
ellb
ein
g
PHOF21
PHOF24
PHOF29
PHOF30
PHOF31
Annex 1

16 of 22
Collection
Frequency2012/13 2013/14 2014/15 Quarter 1 Quarter 2 Quarter 3 Quarter 4 Target Polarity DoT
Protect Vulnerable People 2015/2016
Produced by the Shared Intelligence Bureau August 2015
Direction of Travel (DoT) shows the trend of how an indicator is performing against its Polarity over time
No of Indicators = 134
Previous Years 2015/2016
CYP10-7Troubled Families: Number of families “turned around” for
Employment - (New for 2014/2015)Quarterly - - 40 44 - - - -
Up is
GoodGood
EFL2Numbers of Children with a Child Protection Plan (per 10k shown in
brackets) - (Snapshot)Quarterly 137 (38) 131 (36) 124 (34) 124 (34) - - - - Up is Bad Good
Under 18 conceptions: conceptions in those aged under 16 (per
1,000 females aged 13-15) (Calendar Year)Annual 6.2 2.8 - - - - - - Up is Bad Good
Benchmark - National Data Annual 5.56 4.8 - - - - - -
Benchmark - Regional Data Annual 6.8 6 - - - - - -
Regional Rank (Rank out of 15) Annual 6 1 - - - - - -
Hospital admissions caused by unintentional and deliberate injuries
in children (aged 0-14 years) (per 10,000 resident population)Annual 95.84 99.79 - - - - - - Up is Bad Bad
Benchmark - National Data Annual 103.83 112.16 - - - - - -
Benchmark - Regional Data Annual 109.57 120.97 - - - - - -
Regional Rank (Rank out of 15) Annual 3 1 - - - - - -
Primary pupils eligible for and claiming Free School Meals Annual 11.50% 10.20% - - - - - - Neutral Neutral
Benchmark - National Data Annual 18.10% 17.00% - - - - - -
Benchmark - Regional Data Annual 18.60% 18.10% - - - - - -
RM3% of primary schools with 25% or more of their places unfilled -
(Snapshot)Annual 10.00% 8.00% 6.00% - - - - - Up is Bad Good
RM5% of primary schools oversubscribed by 5% or more (@ January
school census) - (Snapshot)Annual 13.00% 16.00% 18% - - - - - Up is Bad Bad
RM20
% of 1st preferences secured for York children for the Primary
school admission round (relates to the future academic year i.e.
12/13 figure relates to 13/14 academic year) - (Snapshot)
Annual 92.00% 93.00% 91.60% - - - - -Up is
GoodNeutral
RM70 Number of primary school places in York Annual 13,742 13,914 - - - - - - Neutral Neutral
RM71 Projected number of primary school aged-pupils in York Annual 12,870 13,230 - - - - - - Neutral Neutral
Secondary pupils eligible for and claiming Free School Meals Annual 8.40% 7.80% - - - - - - Neutral Neutral
Benchmark - National Data Annual 15.10% 14.60% - - - - - -
Benchmark - Regional Data Annual 16.00% 15.60% - - - - - -
RM4% of secondary schools with 25% or more of their places unfilled -
(Snapshot)Annual 25.00% 25.00% 11% - - - - - Up is Bad Good
RM6% of secondary schools oversubscribed by 5% or more in years 7-
11 (@ January school census) - (Snapshot)Annual - 0.00% 11% - - - - - Up is Bad Bad
Sa
feg
ua
rdin
g (Y
ou
ng
Pe
op
le)
PHOF27
PHOF28
Sch
oo
l Stra
teg
y a
nd
Pla
nn
ing
PriFSM
SecFSM
Annex 1

17 of 22
Collection
Frequency2012/13 2013/14 2014/15 Quarter 1 Quarter 2 Quarter 3 Quarter 4 Target Polarity DoT
Protect Vulnerable People 2015/2016
Produced by the Shared Intelligence Bureau August 2015
Direction of Travel (DoT) shows the trend of how an indicator is performing against its Polarity over time
No of Indicators = 134
Previous Years 2015/2016
RM21
% of 1st preferences secured for York children for the Secondary
school admission round (relates to the future academic year i.e.
12/13 figure relates to 13/14 academic year) - (Snapshot)
Annual 96.00% 94.00% 92.10% - - - - -Up is
GoodBad
RM72 Number of secondary school places in York Annual 9,165 9,165 - - - - - - Neutral Neutral
RM73 Projected number of secondary school aged-pupils in York Annual 8,425 8,360 - - - - - - Neutral Neutral
First time entrants to the youth justice system (per 100,000
population aged 10-17)Annual 498.01 406.82 - - - - - - Up is Bad Good
Benchmark - National Data Annual 556.05 440.93 - - - - - -
Benchmark - Regional Data Annual 536.69 458.66 - - - - - -
Regional Rank (Rank out of 15) Annual 7 7 - - - - - -
Yo
uth
Offe
nd
ing
PHOF23
Sch
oo
l Stra
teg
y a
nd
Pla
nn
ing
Annex 1

18 of 22
Collection
Frequency2012/13 2013/14 2014/15 Quarter 1 Quarter 2 Quarter 3 Quarter 4 Target Polarity DoT
CES01Assessment of how the council is adapting to climate change (Level
Number)Annual 1 1 - - - - - -
Up is
GoodNeutral
CES02 Reduction in CO2 through investing in more efficient street lighting Annual -13.64% - - - - - - - Up is Bad Good
CES020 York's CO2 per head of population (tonnes) Annual 5.3 (2011) 5.6 (2012) - - - - - - Up is Bad Neutral
CAN028The maximum Nitrogen Dioxide concentration in Salisbury Terrace
(ug/m3)Annual 36.08 37.60 - - - - - - Up is Bad Neutral
CAN028
a
The maximum Nitrogen Dioxide concentration in Prices/Nunnery
Lane (ug/m3)Annual 40.83 42.00 - - - - - - Up is Bad Neutral
CAN028
b
The maximum Nitrogen Dioxide concentration in Blossom St/Holgate
(ug/m3)Annual 51.59 49.18 - - - - - - Up is Bad Good
CAN028
c
The maximum Nitrogen Dioxide concentration in Fishergate/Paragon
(ug/m3)Annual 39.97 45.22 - - - - - - Up is Bad Neutral
CAN028
d
The maximum Nitrogen Dioxide concentration in Lawrence St
(ug/m3)Annual 47.45 46.97 - - - - - - Up is Bad Good
CAN028
eThe maximum Nitrogen Dioxide concentration in Fulford (ug/m3) Annual 36.29 39.46 - - - - - - Up is Bad Neutral
CAN028fThe maximum Nitrogen Dioxide concentration in Gillygate / LMW
(ug/m3)Annual 50.71 52.17 - - - - - - Up is Bad Neutral
CAN028
g
The maximum Nitrogen Dioxide concentration in Rougier St/GHS
(ug/m3)Annual 50.85 54.75 - - - - - - Up is Bad Neutral
CES11Active management of local sites to improve bio-diversity in the York
area
Discontinue
d- - - - - - - - Neutral Neutral
CES12 % of conservation areas with an up to date character appraisalDiscontinue
d- - - - - - - -
Up is
GoodNeutral
CES13 % of new homes built on previously developed land - (YTD) Monthly 73.00% 84.00% 70.17% 84.38% - - - -Up is
GoodGood
Residual household waste (kg per HH) - (YTD) Quarterly 541kg 559kg 553kgAvailable Aug
2015- - - - Up is Bad Neutral
Benchmark - National Data Annual 551kg 555kg (avail Nov
15)- - - - -
Benchmark - Regional Data Annual 543kg 534kg (avail Nov
15)- - - - -
Regional Rank (Rank out of 15) Annual 7 9 - - - - - -
Waste
CES35
Protect the Environment 2015/2016
Produced by the Shared Intelligence Bureau August 2015
Direction of Travel (DoT) shows the trend of how an indicator is performing against its Polarity over time
No of Indicators = 25
Previous Years 2015/2016
Clim
ate
Change
Natu
ral E
nviro
nm
ent
Annex 1

19 of 22
Collection
Frequency2012/13 2013/14 2014/15 Quarter 1 Quarter 2 Quarter 3 Quarter 4 Target Polarity DoT
Protect the Environment 2015/2016
Produced by the Shared Intelligence Bureau August 2015
Direction of Travel (DoT) shows the trend of how an indicator is performing against its Polarity over time
No of Indicators = 25
Previous Years 2015/2016
Household waste recycled / composted- (YTD) Quarterly 45.96% 43.63% 44.11%Available Aug
2015- - - -
Up is
GoodNeutral
Benchmark - National Data Annual 43.22% 43.45% (avail Nov
15)- - - - -
Benchmark - Regional Data Annual 43.31% 43.85% (avail Nov
15)- - - - -
Regional Rank (Rank out of 15) Annual 6 9 - - - - - -
Municipal waste landfilled - (YTD) Quarterly 53.76% 55.83% 56.06%Available Aug
2015- - - - Up is Bad Bad
Benchmark - National Data Annual 33.89% 30.93% (avail Nov
15)- - - - -
Benchmark - Regional Data Annual 38.17% 34.71% (avail Nov
15)- - - - -
Regional Rank (Rank out of 15) Annual 12 13 - - - - - -
CES38Total tonnes of municipal waste collected (household, commercial,
prescribed and inert waste) - (YTD)Quarterly 97,000 93,830 93,430
Available Aug
2015- - - - Neutral Neutral
CES39Tonnes of Landfilled waste - Household (excluding liquid waste) -
(YTD)Quarterly 45,930 46,850 46,740
Available Aug
2015- - - - Up is Bad Bad
CES40 Tonnes of Landfilled waste - Commercial collection rounds - (YTD) Quarterly 6,220 5,620 5,630Available Aug
2015- - - - Up is Bad Neutral
CES41 Tonnes of Landfilled waste - Combined (excluding liquid waste) Quarterly 52,150 52,470 52,370Available Aug
2015- - - - Up is Bad Neutral
CES42 Cost of landfill tax - Household (excluding liquid waste) Quarterly £2,939,520 £3,373,200 £3,739,200Available Aug
2015- - - - Up is Bad Bad
CES43 Cost of landfill tax - Commercial collection rounds Quarterly £398,080 £404,640 £450,400Available Aug
2015- - - - Up is Bad Bad
CES44 Cost of landfill tax - Combined (excluding liquid waste) Quarterly £3,337,600 £3,777,840 £4,189,600Available Aug
2015- - - - Up is Bad Bad
CES45 % of properties offered 2 kerbside recyclate collections - (YTD) Quarterly 98.70% 98.80% 99%Available Aug
2015- - - -
Up is
GoodGood
Waste
CES36
CES37
Annex 1

20 of 22
Collection
Frequency2012/13 2013/14 2014/15 Quarter 1 Quarter 2 Quarter 3 Quarter 4 Target Polarity DoT
CES03% of road and pathway network that are grade 3 (poor condition) -
roadwaysAnnual 15% 16% - - - - - - Up is Bad Neutral
CES04% of road and pathway network that are grade 3 (poor condition) -
pathwaysAnnual 5% 4% - - - - - - Up is Bad Good
CES05% of Principal roads where maintenance should be considered (NI
168)Annual 2% 2% - - - - - - Up is Bad Neutral
CES06% of Non-principal classified roads where maintenance should be
considered (NI 169)Annual 5% 4% - - - - - - Up is Bad Good
% of Unclassified roads where maintenance should be considered
(old BV224b)Annual 10% 10% - - - - - - Up is Bad Neutral
Benchmark - National Data Annual 17% - - - - - - -
Benchmark - Regional Data Annual 17% - - - - - - -
Regional Rank (Rank out of 15) Annual 3 - - - - - - -
CAN031Bus journeys originating in the authority area (P&R only) - (YTD)
(Provisional until financial year end) (LI 3b)Monthly 4.38m 4.45m 4.51m
Available Aug
2015- - - -
Up is
GoodGood
CAN032Local bus passenger journeys originating in the authority area
(excluding P&R) - (YTD) (Provisional until financial year end) (LI 3a)Monthly 9.70m 10.38m 10.48m
Available Aug
2015- - - -
Up is
GoodGood
CAN032-
A
Total Number of Bus Journeys (YTD) - (Provisional until financial
year end)- this is not a local indicator and is not comparable with the
DfT published figure
Monthly 14.08m 14.83mAvail Aug
15
Available Aug
2015- - - -
Up is
GoodGood
CAN033 % of Non-frequent bus services running on time (LI 22a) Annual 82.0% 84% - - - - - -Up is
GoodGood
CAN034Average excess waiting time for frequent bus services (Minutes and
seconds - decimal) (LI 22)Annual 0.9 0.6 - - - - - - Up is Bad Good
CES26 Index of cycling activity (AM Peak) (Calendar Year) (Baseline 2009) Annual 115% 122% 129% - - - - -Up is
GoodGood
CES27 Index of cycling activity (PM Peak) (Calendar Year) (Baseline 2009) Annual 115% 123% 125% - - - - -Up is
GoodGood
CES28 Index of cycling activity (12 hour) (Calendar Year) (Baseline 2009) Annual 115% 125% 128% - - - - -Up is
GoodGood
CES33Pedestrians crossing the inner cordon (12hr into & out of city centre)
Indexed baseline 2009/10Annual 105.5% 106.4% 106.6% - - - - -
Up is
GoodNeutral
CES34
% of customers arriving at York Station by sustainable modes of
transport (cycling, walking, taxi or bus - excluding cars, Lift,
Motorcycle, Train) (LI 4)
Annual 76.30% 73.00% 68.30% - - - - -Up is
GoodBad
Public
Tra
nsport
Susta
inable
Tra
vel
Get York Moving 2015/2016
Produced by the Shared Intelligence Bureau August 2015
Direction of Travel (DoT) shows the trend of how an indicator is performing against its Polarity over time
No of Indicators = 15
Previous Years 2015/2016
Hig
hw
ays M
ain
tenance
CES07
Annex 1

21 of 22
Collection
Frequency2012/13 2013/14 2014/15 Quarter 1 Quarter 2 Quarter 3 Quarter 4 Target Polarity DoT
YCC026 Do it Online - Number of service requests (Data Unvalidated) Weekly - 15629 16969 2988 - - - - Neutral Neutral
YCC027 Do it Online - Number of new user account created Weekly - 9,313 - - - - - -Up Is
GoodNeutral
YCC117 YCC % Calls answered in 20 seconds - TOTAL Weekly - 42.50% 47.60% 45.00% - - - -Up Is
GoodGood
YCC118 YCC % Calls Answered - TOTAL Weekly - 76.40% 79.50% 81.60% - - - -Up Is
GoodGood
% of non-domestic rates collected in year - (YTD) Monthly 98.02% 98.02% 98.20% 32.27% - - - 98.50%Up is
GoodNeutral
Benchmark - National Data (England) Annual 97.73% 97.93% 98.11% - - - - -
Regional Rank (Rank out of 15) Annual - - 4 - - - - -
OCC10 Non-domestic receipts collected in year (£m) - (YTD) Monthly 93.67 96.73 100.38 33.65 - - - -Up is
GoodGood
OCC04 % reduction in non-domestic rates prior year's balances - (YTD) Monthly 23.03% 47.27% 33.09% 6.46% - - - 42.00%Up is
GoodNeutral
OCC06Number of days taken to process Housing Benefit/Council Tax
Benefit new claims and change eventsMonthly 14.57 18 11 12 - - - - Up is Bad Good
OCC07 Benefit Reception Numbers Monthly 2,314 1,868 1,848 1,597 - - - - Neutral Neutral
OCC08 Average Benefit Caseload for CYC Monthly 15,123 13,919 13,103 12,870 - - - - Up is Bad Good
OCC11 % of supplier invoices paid within 30 days Monthly 94.93% 93.19% 96.48% - - - - 100%Up is
GoodNeutral
% of council tax collected in year - (YTD) Monthly 97.94% 97.58% 97.55% 29.81% - - - 97.80%Up is
GoodNeutral
Benchmark - National Data (England) Annual 97.37% 96.96% 97.01% - - - - -
Regional Rank (Rank out of 15) Annual - - 3 - - - - -
OCC02 Council tax receipts collected in year (£m) - (YTD) Monthly 82.85 87.21 90.27 27.43 - - - -Up is
GoodGood
OCC05 % reduction in council tax prior year's balances - (YTD) Monthly 35.29% 38.34% 33.78% 12.47% - - - 42.00%Up is
GoodNeutral
Sta
ffing
OCC09 CYC Apprenticeships Annual 20 14 18 - - - - -Up is
GoodNeutral
STF01 Staff Headcount - CYC Total (Including Schools) - (Snapshot) Monthly - 7038 6096 5336 - - - - Neutral Neutral
STF01a Staff Headcount - CYC Total (Excluding Schools) - (Snapshot) Monthly - - 2812 2776 - - - - Neutral Neutral
STF08 Staff FTE - CYC Total (Including Schools) - (Snapshot) Monthly - 4562 3995 3925 - - - - Neutral Neutral
STF08a Staff FTE - CYC Total (Excluding Schools) - (Snapshot) Monthly - - 2194 2193 - - - - Neutral Neutral
Fin
ance
OCC03
Fin
ance - C
ouncil T
ax
OCC01
Sta
ffing: 0
1 -
Headcount &
FT
E
11: P
hone
Sta
tistic
s -
Our Organisation 2015/2016
Produced by the Shared Intelligence Bureau August 2015
Direction of Travel (DoT) shows the trend of how an indicator is performing against its Polarity over time
No of Indicators = 23
Previous Years 2015/2016
02: D
o it
onlin
e
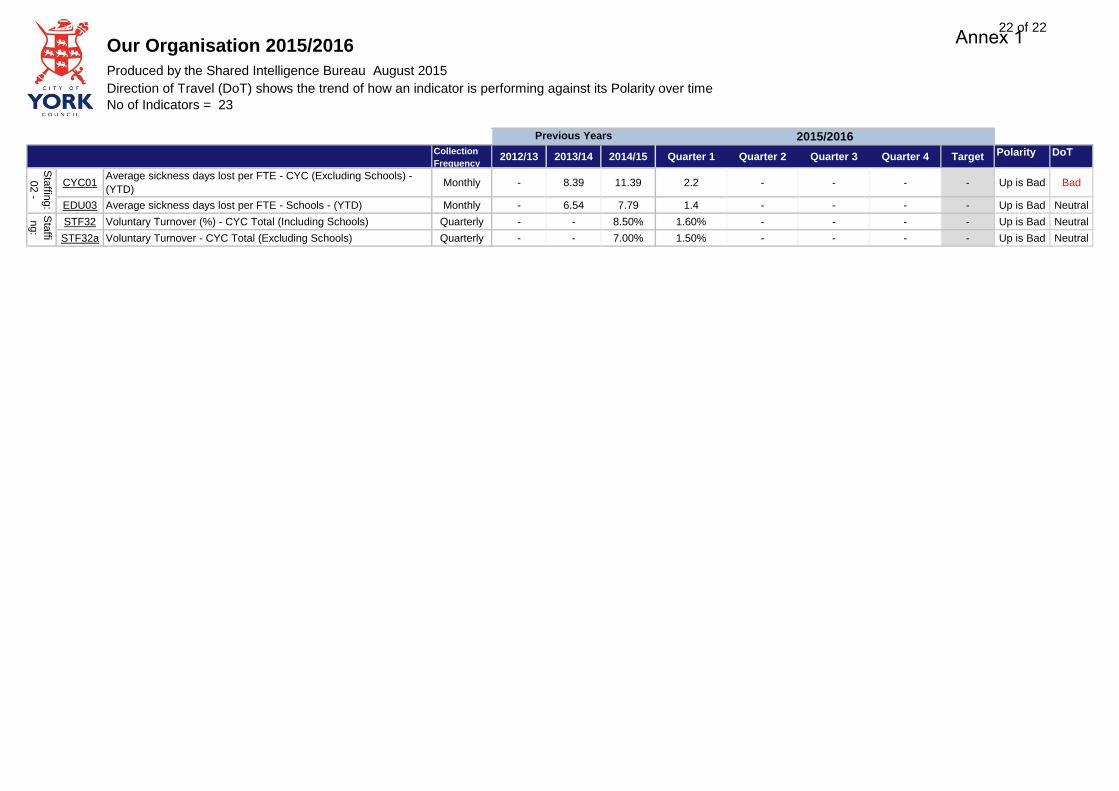
Annex 1
22 of 22
Collection
Frequency2012/13 2013/14 2014/15 Quarter 1 Quarter 2 Quarter 3 Quarter 4 Target Polarity DoT
Our Organisation 2015/2016
Produced by the Shared Intelligence Bureau August 2015
Direction of Travel (DoT) shows the trend of how an indicator is performing against its Polarity over time
No of Indicators = 23
Previous Years 2015/2016
CYC01Average sickness days lost per FTE - CYC (Excluding Schools) -
(YTD)Monthly - 8.39 11.39 2.2 - - - - Up is Bad Bad
EDU03 Average sickness days lost per FTE - Schools - (YTD) Monthly - 6.54 7.79 1.4 - - - - Up is Bad Neutral
STF32 Voluntary Turnover (%) - CYC Total (Including Schools) Quarterly - - 8.50% 1.60% - - - - Up is Bad Neutral
STF32a Voluntary Turnover - CYC Total (Excluding Schools) Quarterly - - 7.00% 1.50% - - - - Up is Bad Neutral
Sta
ffi
ng:
Sta
ffing:
02 -
Annex 1


