Embed Size (px)
Citation preview

RESEARCH ARTICLE
AnnapuRNA: A scoring function for predicting
RNA-small molecule binding poses
Filip StefaniakID1*, Janusz M. BujnickiID
1,2*
1 Laboratory of Bioinformatics and Protein Engineering, International Institute of Molecular and Cell Biology,
Warsaw, Poland, 2 Institute of Molecular Biology and Biotechnology, Faculty of Biology, Adam Mickiewicz
University, Poznan, Poland
* [email protected] (FS); [email protected] (JMB)
Abstract
RNA is considered as an attractive target for new small molecule drugs. Designing active
compounds can be facilitated by computational modeling. Most of the available tools devel-
oped for these prediction purposes, such as molecular docking or scoring functions, are
parametrized for protein targets. The performance of these methods, when applied to RNA-
ligand systems, is insufficient. To overcome these problems, we developed AnnapuRNA, a
new knowledge-based scoring function designed to evaluate RNA-ligand complex struc-
tures, generated by any computational docking method. We also evaluated three main fac-
tors that may influence the structure prediction, i.e., the starting conformer of a ligand, the
docking program, and the scoring function used. We applied the AnnapuRNA method for a
post-hoc study of the recently published structures of the FMN riboswitch. Software is avail-
able at https://github.com/filipspl/AnnapuRNA.
Author summary
Drug development is a lengthy and complicated process, which requires costly experi-
ments on a very large number of chemical compounds. The identification of chemical
molecules with desired properties can be facilitated by computational methods. Several
methods were developed for computer-aided design of drugs that target protein mole-
cules. However, recently the ribonucleic acid (RNA) emerged as an attractive target for
the development of new drugs. Unfortunately, the portfolio of the computer methods that
can be applied to study RNA and its interactions with small chemical molecules is very
limited. This situation motivated us to develop a new computational method, with which
to predict RNA-small molecule interactions. To this end, we collected the information on
the statistics of interactions in experimentally determined structures of complexes formed
by RNA with small molecules. We then used the statistical data to train machine learning
methods aiming to distinguish between RNA-ligand interactions observed experimentally
and other interactions that can be observed in theoretical analyses, but are not observed in
nature. The resulting method called AnnapuRNA is superior to other similar tools and
can be used to predict preferred ligands of RNA molecules and how RNA and small mole-
cules interact with each other.
PLOS Computational Biology | https://doi.org/10.1371/journal.pcbi.1008309 February 1, 2021 1 / 31
a1111111111
a1111111111
a1111111111
a1111111111
a1111111111
OPEN ACCESS
Citation: Stefaniak F, Bujnicki JM (2021)
AnnapuRNA: A scoring function for predicting
RNA-small molecule binding poses. PLoS Comput
Biol 17(2): e1008309. https://doi.org/10.1371/
journal.pcbi.1008309
Editor: Tamar Schlick, New York University,
UNITED STATES
Received: September 3, 2020
Accepted: December 16, 2020
Published: February 1, 2021
Copyright: © 2021 Stefaniak, Bujnicki. This is an
open access article distributed under the terms of
the Creative Commons Attribution License, which
permits unrestricted use, distribution, and
reproduction in any medium, provided the original
author and source are credited.
Data Availability Statement: The program code,
models, and sample data are available at the
repository: https://github.com/filipspl/annapurna
Supporting data is included in Supporting
Information file. Source data and additional data
are deposited in the repository: https://github.com/
filipspl/annapurna-additional.
Funding: This research was supported by the
Foundation for Polish Science and the EU European
Regional Development Fund (POIR.04.04.00-00-
3CF0/16 to J.M.B.). https://www.fnp.org.pl/ The
funders had no role in study design, data collection
Introduction
Ribonucleic acids (RNAs) play a pivotal role in many cellular processes such as transmission
of genetic information, sensing and communicating responses to cellular signals, and even
catalysis of chemical reactions [1]. These processes are often modulated by other molecules,
such as ions or small molecules, making RNA an attractive therapeutic target for new drugs
[2–4]. A well-studied and clinically validated example is the bacterial ribosome, a molecular
target for many antibiotics [5]. Riboswitches, a class of regulatory RNA structural elements
embedded in untranslated regions of mRNAs, comprise another interesting group of RNA tar-
gets. These structural elements can directly bind a ligand to regulate gene function without the
need for protein cofactors [6,7]. Riboswitches are common in bacterial cells and rarely occur
in eukaryotic cells, which makes them suitable targets for new antibacterial drugs. One well-
studied example is the FMN riboswitch, which controls expression of genes required for bio-
synthesis and transport of riboflavin (vitamin B2) in bacteria [8]. Several small-molecule inhib-
itors of the FMN riboswitch with proven antibacterial properties have been identified. Some of
these small molecule inhibitors include compounds such as roseoflavin [9,10] or 5FDQD [11],
which are structurally similar to the natural ligand, as well as structurally dissimilar ligands
having a different chemotype, for example, ribocil and its derivatives [12]. Apart from ribos-
witches, other medically-relevant RNAs include viral RNAs (dimerization initiation site of
HIV-1 RNA [13]), self-splicing group I introns (e.g., an inhibitor for the td intron RNA [14]),
group II introns (e.g., inhibitors of group IIB intron splicing [15]), and viral ribozymes (e.g,
hepatitis D virus ribozyme inhibition by aminoglycosides [16]) (for details, see [17]).
Elucidating the role of RNA-ligand interactions and design of new RNA-binding molecules
can be facilitated by analyzing three dimensional (3D) structures of the RNA of interest or its
complex with a ligand. Unfortunately, experimental determination of 3D structures is an
intensive task and often has to be supported by computational modeling [18] or performed
entirely in silico (for review on methods of modeling of ribonucleic acid–ligand interactions
see: [19]). These limitations, together with an increasing interest in RNA as a target for thera-
peutic intervention, highlight the need to develop new methods for predicting the 3D structure
of RNA-ligand complexes.
One of the most widely used computational methods used to predict the 3D structures of
macromolecules with ligands is molecular docking [20,21]. Many of the currently-available
docking programs were initially designed for protein-protein or protein-ligand docking (e.g.,
as AutoDock [22], AutoDock Vina [23], ICM [24], or iDock [25]) while some of them were
later adapted or reparameterized to enable RNA-ligand docking, where RNA is specified as the
receptor (Dock6, [26], ICM [27], or AutoDock [28]). A few programs were designed and opti-
mized specifically for docking ligands to RNA. MORDOR allows for both ligand and receptor
flexibility and uses a scoring function that estimates the total energy of the complexes and con-
sists of several terms (electrostatic, van der Waals, dihedral angle, torsion angle, bond, and
Urey−Bradley) [29]. rDock (formerly: RiboDock) consists of a genetic algorithm stochastic
search engine as a pose generator, and intermolecular scoring function validated against pro-
tein and RNA targets [30,31]. The main component of this scoring function is a van der Waals
potential, an empirical term for attractive and repulsive polar interactions, and an optional
desolvation potential that combines a weighted solvent accessible surface area approach.
rDock program can also be used for rescoring poses generated by an external tool.
In a portfolio of methods facilitating prediction of 3D RNA-ligand structures, there are also
standalone scoring functions specific for RNA-ligand complexes, intended to be used for
rescoring of models generated by molecular docking. A separate group of such methods con-
sists of statistical potentials (statistical scoring functions, or knowledge-based potentials),
PLOS COMPUTATIONAL BIOLOGY AnnapuRNA: A scoring function for predicting RNA-small molecule binding poses
PLOS Computational Biology | https://doi.org/10.1371/journal.pcbi.1008309 February 1, 2021 2 / 31
and analysis, decision to publish, or preparation of
the manuscript.
Competing interests: The authors have declared
that no competing interests exist.
which are derived from an analysis of experimentally solved structures. Pfeffer and Gohlke
developed a scoring function named DrugScoreRNA, which employs a distance-dependent
potential calculated on the basis of contacts between ligand and receptor atoms [32]. Both
interacting partners are in all-atom representation using Tripos atom types. Similarly, a
KScore scoring function, described by Zhao et al., is also a distance-dependent potential,
which in addition to the standard set of Tripos atom types, uses an extended atom type set to
characterize the metal-ligand and water-ligand interactions better. It likewise defines a special
atom-typing scheme for nucleic acids, and it was parameterized on ligand complexes with pro-
teins (2422 complexes), DNA (300 complexes), and RNA (97 complexes). Yan and Wang
described a distance-dependent scoring function termed SPA-LN, where Tripos atom types
are used for RNA and ligand representation [33]. During the optimization of parameters, they
focused not only on recapitulating the near-native pose of the ligand but also on the affinity
estimation. Improving the affinity predictions was a goal of Chen et al., authors of
iMDLScore1 and iMDLScore2 functions [34]. They optimized AutoDock4.1 scoring terms
using multilinear regression methods and binding affinity data for 45 RNA complexes. Our
group developed LigandRNA—an anisotropic distance- and angle-dependent statistical poten-
tial [35]. It was derived from a diversified set of 251 experimentally solved RNA-ligand com-
plexes and used all-atom representation with Tripos atom types. It was shown to be superior
to scoring functions described earlier in terms of accuracy of finding a near-native conforma-
tion of ligands. Chhabra et al. in the RNAPosers used a distance-dependent fingerprint to
describe a binding pose of a ligand in RNA binding pocket [36]. Data derived from 80 experi-
mentally solved RNA-ligand complexes were used to train a machine-learning algorithm,
which was then used to rank docking poses. Similarly to the programs described above, RNA-
Posers uses an all-atom representation with Tripos atom types.
In this study, we describe AnnapuRNA, a new knowledge-based scoring function designed
to evaluate RNA-ligand complex structures, generated by any computational docking method.
We also present a benchmark in which we compare AnnapuRNA with other available scoring
functions. We present a case study in which we used molecular docking in combination with
the AnnapuRNA scoring function to predict a recently published structure of an FMN ribos-
witch co-crystallized with a new small-molecule inhibitor. Our method successfully predicted
the structure of this complex based on the previously published structure of FMN in complex
with a different ligand, as well as the low-resolution apo structure of this RNA.
AnnapuRNA is freely available to the scientific community at https://github.com/filipspl/
AnnapuRNA.
Results and discussion
AnnapuRNA is a machine-learning statistical scoring function developed by us for predicting the
structure of RNA-ligand complexes with high accuracy. Our program internally uses a coarse-
grained representation for both interacting partners—RNA and small molecule ligands. Using
coarse-grained representation has been proven successful for simulating various biomolecular sys-
tems [37], including folding of the RNA molecule by the SimRNA program, also developed by
our group. We derived machine learning models expressing the probability of RNA-ligand inter-
actions, based on the interaction data collected from experimentally solved complexes extracted
from the PDB database. AnnapuRNA can be used to identify native-like poses of ligands from the
pool of poses generated through molecular docking experiments. It supports outputs from multi-
ple docking programs (such as rDock, iDock, AutoDock Vina, Dock6, among others).
To evaluate the accuracy of AnnapuRNA in finding near-native structures of RNA-ligand
complexes, we carried out extensive benchmarking. We tested three main factors that are likely
PLOS COMPUTATIONAL BIOLOGY AnnapuRNA: A scoring function for predicting RNA-small molecule binding poses
PLOS Computational Biology | https://doi.org/10.1371/journal.pcbi.1008309 February 1, 2021 3 / 31
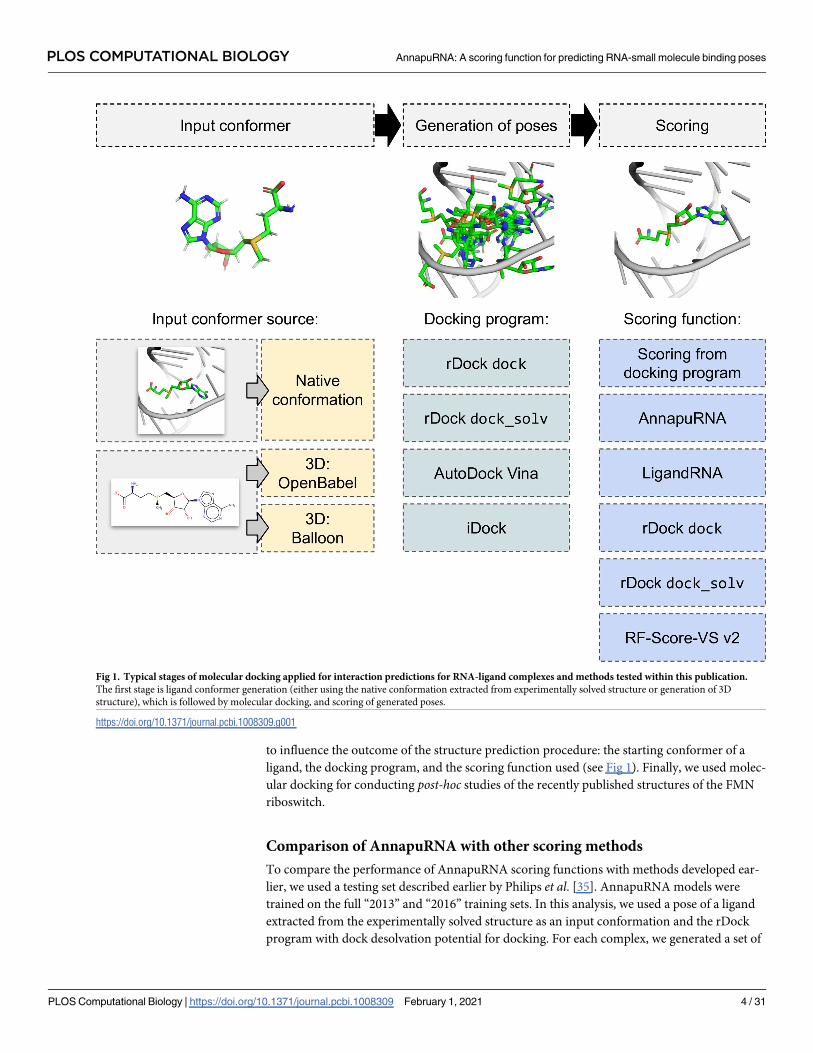
to influence the outcome of the structure prediction procedure: the starting conformer of a
ligand, the docking program, and the scoring function used (see Fig 1). Finally, we used molec-
ular docking for conducting post-hoc studies of the recently published structures of the FMN
riboswitch.
Comparison of AnnapuRNA with other scoring methods
To compare the performance of AnnapuRNA scoring functions with methods developed ear-
lier, we used a testing set described earlier by Philips et al. [35]. AnnapuRNA models were
trained on the full “2013” and “2016” training sets. In this analysis, we used a pose of a ligand
extracted from the experimentally solved structure as an input conformation and the rDock
program with dock desolvation potential for docking. For each complex, we generated a set of
Fig 1. Typical stages of molecular docking applied for interaction predictions for RNA-ligand complexes and methods tested within this publication.
The first stage is ligand conformer generation (either using the native conformation extracted from experimentally solved structure or generation of 3D
structure), which is followed by molecular docking, and scoring of generated poses.
https://doi.org/10.1371/journal.pcbi.1008309.g001
PLOS COMPUTATIONAL BIOLOGY AnnapuRNA: A scoring function for predicting RNA-small molecule binding poses
PLOS Computational Biology | https://doi.org/10.1371/journal.pcbi.1008309 February 1, 2021 4 / 31
100 poses and applied an external scoring function for rescoring. We tested nine rescoring
methods: RF-Score-VS v2 (Random Forest-based scoring function for Virtual Screening,
trained for proteins, [38]), rDock scoring functions with two desolvation potentials: dock and
dock_solv (these potentials, implemented in rDock docking program, consist of a van der
Waals potential, an empirical term for attractive and repulsive polar interactions, and an
optional desolvation potential), LigandRNA (a knowledge-based potential derived from
ligand-binding sites in the experimentally solved RNA–ligand complexes, obtained using the
inverse Boltzmann scheme; this scoring function was used in two versions: the one described
in the original publication, called “2013”, and the second, with an updated potential, called
“updated” [35], and AnnapuRNA described herein (variants based on two machine learning
methods: DL and kNN, with two sets of training data: “2013” and “2016”). Regrettably, we
were unable to run the DrugScoreRNA scoring function, despite contacting the authors and
obtaining the source code [32]. Also, the authors of the recently published SPA-LN scoring
function [33] were unable to provide us with the working copy of their program nor give
access to the dedicated web server. Results expressed as RMSD of the best-selected pose to the
reference pose (S(1)), S(3), and S(5) are summarized in the Figs 2 and S10 and S11 Tables. In
addition to the results of rescoring, we included data for the median RMSD values obtained
during docking (this serves as a negative control) and minimum RMSD values (a positive
control).
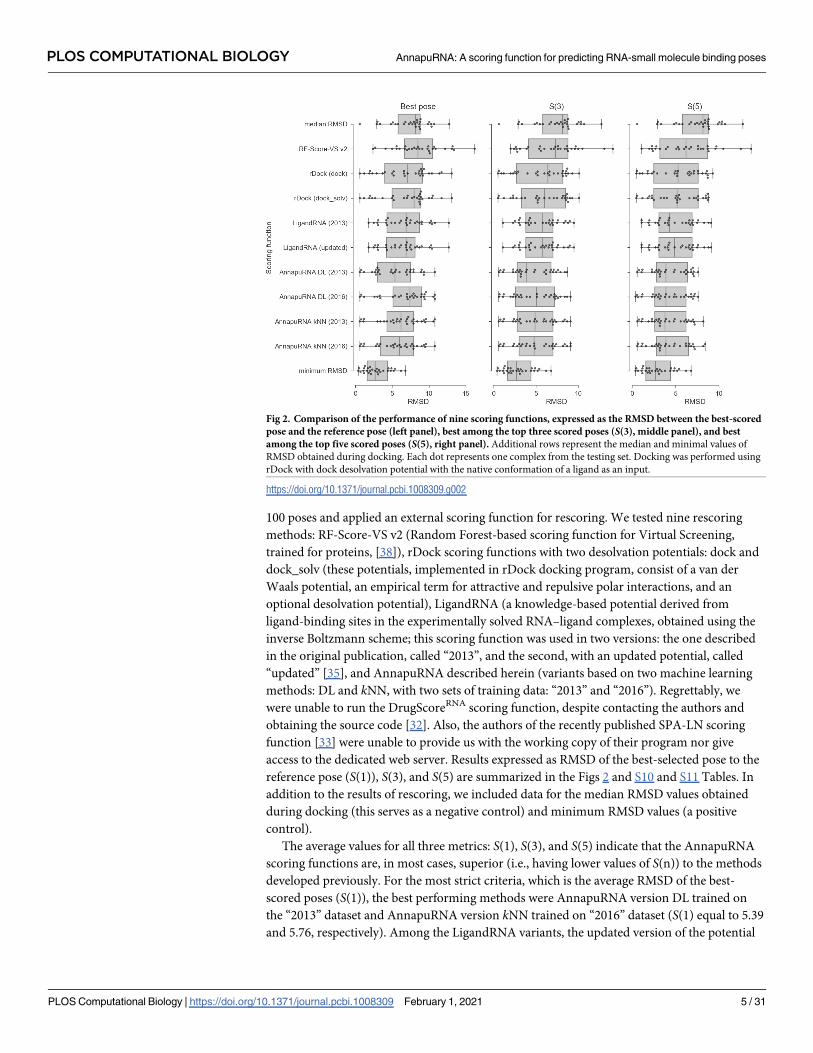
The average values for all three metrics: S(1), S(3), and S(5) indicate that the AnnapuRNA
scoring functions are, in most cases, superior (i.e., having lower values of S(n)) to the methods
developed previously. For the most strict criteria, which is the average RMSD of the best-
scored poses (S(1)), the best performing methods were AnnapuRNA version DL trained on
the “2013” dataset and AnnapuRNA version kNN trained on “2016” dataset (S(1) equal to 5.39
and 5.76, respectively). Among the LigandRNA variants, the updated version of the potential
Fig 2. Comparison of the performance of nine scoring functions, expressed as the RMSD between the best-scored
pose and the reference pose (left panel), best among the top three scored poses (S(3), middle panel), and best
among the top five scored poses (S(5), right panel). Additional rows represent the median and minimal values of
RMSD obtained during docking. Each dot represents one complex from the testing set. Docking was performed using
rDock with dock desolvation potential with the native conformation of a ligand as an input.
https://doi.org/10.1371/journal.pcbi.1008309.g002
PLOS COMPUTATIONAL BIOLOGY AnnapuRNA: A scoring function for predicting RNA-small molecule binding poses
PLOS Computational Biology | https://doi.org/10.1371/journal.pcbi.1008309 February 1, 2021 5 / 31
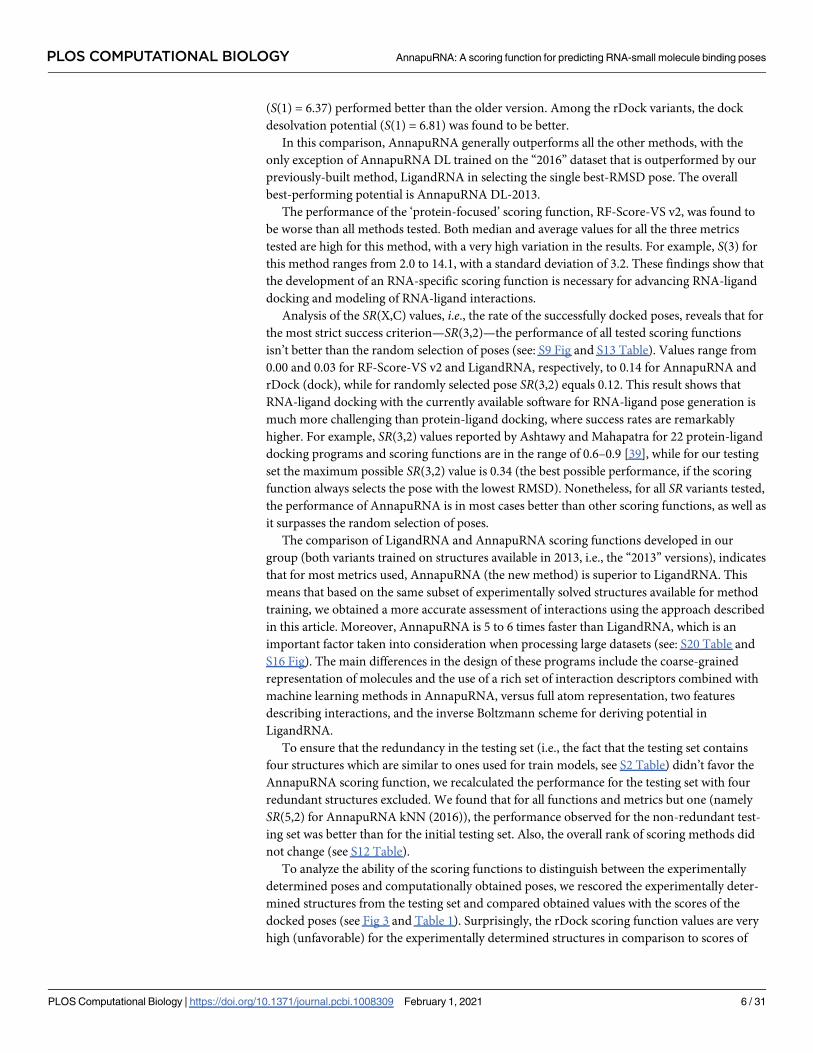
(S(1) = 6.37) performed better than the older version. Among the rDock variants, the dock
desolvation potential (S(1) = 6.81) was found to be better.
In this comparison, AnnapuRNA generally outperforms all the other methods, with the
only exception of AnnapuRNA DL trained on the “2016” dataset that is outperformed by our
previously-built method, LigandRNA in selecting the single best-RMSD pose. The overall
best-performing potential is AnnapuRNA DL-2013.
The performance of the ‘protein-focused’ scoring function, RF-Score-VS v2, was found to
be worse than all methods tested. Both median and average values for all the three metrics
tested are high for this method, with a very high variation in the results. For example, S(3) for
this method ranges from 2.0 to 14.1, with a standard deviation of 3.2. These findings show that
the development of an RNA-specific scoring function is necessary for advancing RNA-ligand
docking and modeling of RNA-ligand interactions.
Analysis of the SR(X,C) values, i.e., the rate of the successfully docked poses, reveals that for
the most strict success criterion—SR(3,2)—the performance of all tested scoring functions
isn’t better than the random selection of poses (see: S9 Fig and S13 Table). Values range from
0.00 and 0.03 for RF-Score-VS v2 and LigandRNA, respectively, to 0.14 for AnnapuRNA and
rDock (dock), while for randomly selected pose SR(3,2) equals 0.12. This result shows that
RNA-ligand docking with the currently available software for RNA-ligand pose generation is
much more challenging than protein-ligand docking, where success rates are remarkably
higher. For example, SR(3,2) values reported by Ashtawy and Mahapatra for 22 protein-ligand
docking programs and scoring functions are in the range of 0.6–0.9 [39], while for our testing
set the maximum possible SR(3,2) value is 0.34 (the best possible performance, if the scoring
function always selects the pose with the lowest RMSD). Nonetheless, for all SR variants tested,
the performance of AnnapuRNA is in most cases better than other scoring functions, as well as
it surpasses the random selection of poses.
The comparison of LigandRNA and AnnapuRNA scoring functions developed in our
group (both variants trained on structures available in 2013, i.e., the “2013” versions), indicates
that for most metrics used, AnnapuRNA (the new method) is superior to LigandRNA. This
means that based on the same subset of experimentally solved structures available for method
training, we obtained a more accurate assessment of interactions using the approach described
in this article. Moreover, AnnapuRNA is 5 to 6 times faster than LigandRNA, which is an
important factor taken into consideration when processing large datasets (see: S20 Table and
S16 Fig). The main differences in the design of these programs include the coarse-grained
representation of molecules and the use of a rich set of interaction descriptors combined with
machine learning methods in AnnapuRNA, versus full atom representation, two features
describing interactions, and the inverse Boltzmann scheme for deriving potential in
LigandRNA.
To ensure that the redundancy in the testing set (i.e., the fact that the testing set contains
four structures which are similar to ones used for train models, see S2 Table) didn’t favor the
AnnapuRNA scoring function, we recalculated the performance for the testing set with four
redundant structures excluded. We found that for all functions and metrics but one (namely
SR(5,2) for AnnapuRNA kNN (2016)), the performance observed for the non-redundant test-
ing set was better than for the initial testing set. Also, the overall rank of scoring methods did
not change (see S12 Table).
To analyze the ability of the scoring functions to distinguish between the experimentally
determined poses and computationally obtained poses, we rescored the experimentally deter-
mined structures from the testing set and compared obtained values with the scores of the
docked poses (see Fig 3 and Table 1). Surprisingly, the rDock scoring function values are very
high (unfavorable) for the experimentally determined structures in comparison to scores of
PLOS COMPUTATIONAL BIOLOGY AnnapuRNA: A scoring function for predicting RNA-small molecule binding poses
PLOS Computational Biology | https://doi.org/10.1371/journal.pcbi.1008309 February 1, 2021 6 / 31
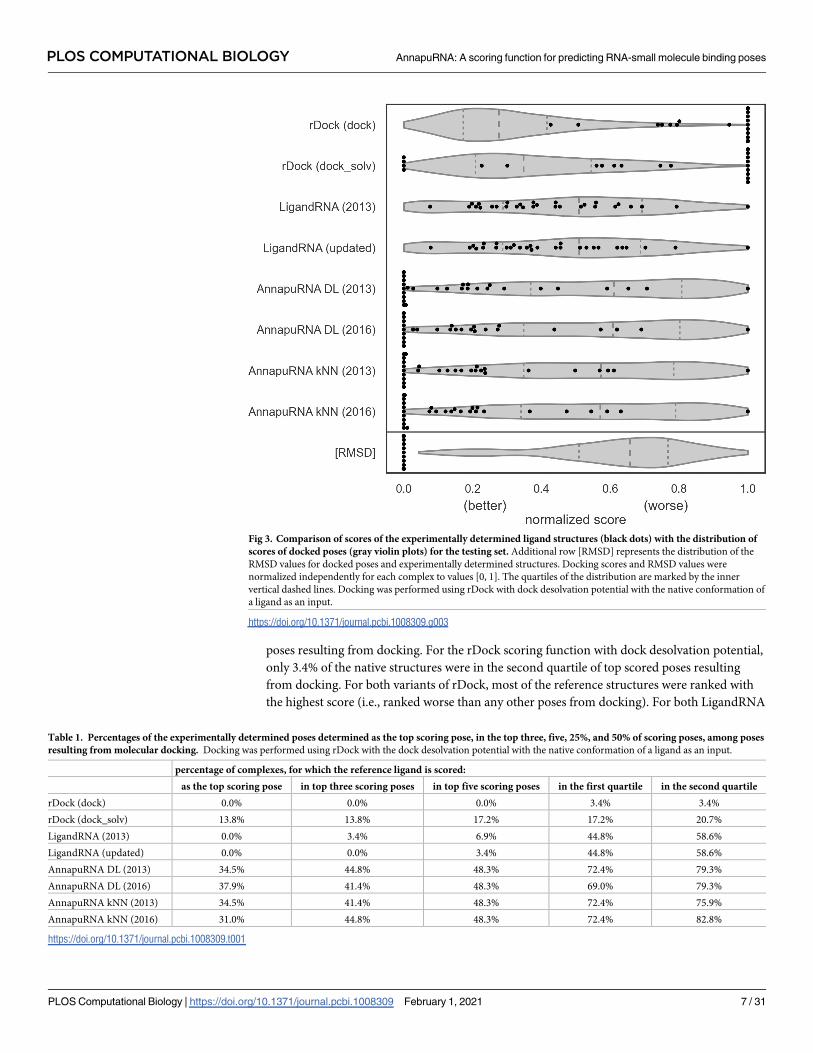
poses resulting from docking. For the rDock scoring function with dock desolvation potential,
only 3.4% of the native structures were in the second quartile of top scored poses resulting
from docking. For both variants of rDock, most of the reference structures were ranked with
the highest score (i.e., ranked worse than any other poses from docking). For both LigandRNA
Fig 3. Comparison of scores of the experimentally determined ligand structures (black dots) with the distribution of
scores of docked poses (gray violin plots) for the testing set. Additional row [RMSD] represents the distribution of the
RMSD values for docked poses and experimentally determined structures. Docking scores and RMSD values were
normalized independently for each complex to values [0, 1]. The quartiles of the distribution are marked by the inner
vertical dashed lines. Docking was performed using rDock with dock desolvation potential with the native conformation of
a ligand as an input.
https://doi.org/10.1371/journal.pcbi.1008309.g003
Table 1. Percentages of the experimentally determined poses determined as the top scoring pose, in the top three, five, 25%, and 50% of scoring poses, among poses
resulting from molecular docking. Docking was performed using rDock with the dock desolvation potential with the native conformation of a ligand as an input.
percentage of complexes, for which the reference ligand is scored:
as the top scoring pose in top three scoring poses in top five scoring poses in the first quartile in the second quartile
rDock (dock) 0.0% 0.0% 0.0% 3.4% 3.4%
rDock (dock_solv) 13.8% 13.8% 17.2% 17.2% 20.7%
LigandRNA (2013) 0.0% 3.4% 6.9% 44.8% 58.6%
LigandRNA (updated) 0.0% 0.0% 3.4% 44.8% 58.6%
AnnapuRNA DL (2013) 34.5% 44.8% 48.3% 72.4% 79.3%
AnnapuRNA DL (2016) 37.9% 41.4% 48.3% 69.0% 79.3%
AnnapuRNA kNN (2013) 34.5% 41.4% 48.3% 72.4% 75.9%
AnnapuRNA kNN (2016) 31.0% 44.8% 48.3% 72.4% 82.8%
https://doi.org/10.1371/journal.pcbi.1008309.t001
PLOS COMPUTATIONAL BIOLOGY AnnapuRNA: A scoring function for predicting RNA-small molecule binding poses
PLOS Computational Biology | https://doi.org/10.1371/journal.pcbi.1008309 February 1, 2021 7 / 31
scoring functions values obtained for the experimentally determined structures are more uni-
formly distributed among scores of all docked poses, however, the performance was still poor.
Only 44.8% of experimentally determined structures were scored by LigandRNA in the first
quartile of top scored poses from docking. The performance of AnnapuRNA in ranking the
experimentally determined poses was superior to other methods. For all AnnapuRNA variants,
48.3% of experimentally determined complexes were ranked among the top five scored poses
resulting from docking. For about one-third of the complexes the experimentally solved struc-
ture was ranked as the best among all poses (ranging from 31.0% for AnnapuRNA kNN 2016
to 37.9% for AnnapuRNA DL 2016). Such huge differences in the performance of the scoring
functions investigated in this work may result from the nature of the underlying algorithms.
While rDock and LigandRNA both utilize all-atom models, AnnapuRNA internally converts
RNA and ligand to a coarse-grained representation. In this first case, adding hydrogens to the
experimentally determined ligand structures (which is a necessary step prior to scoring, as
most of these structures have only coordinates of heavy atoms) may cause unfavorable interac-
tions with RNA, which results in high (unfavorable) scoring values. On the other hand, coarse-
grained models of AnnapuRNA don’t operate on such a detailed structural level, and thus they
are more resistant to small conformational errors, which leads to a better scoring.
Docking programs with selected scoring functions
An important factor to consider in docking is the ability to generate a RNA-ligand pose that
resembles the reference structure. To identify the best approach for pose generation, we com-
pared the performance of four molecular docking methods in combination with several scor-
ing functions. For pose generation, we tested rDock (with two desolvation potentials: dock
and dock_solv), AutoDock Vina, and iDock. Only rDock is specifically designed for docking
ligands to RNA or protein targets, while iDock and Autodock Vina are parameterized only for
protein targets. The goal of this analysis was to find the docking program that generates a set
of poses with at least one pose having low RMSD to the reference structure, using the ligand
conformer taken from the reference structure. Average and median values of the lowest
RMSD reported for the above-mentioned four docking programs are reported in Table 2, dis-
tribution of RMSD values are depicted in Fig 4, and RMSD values obtained for individual
structures are listed in S14 Table.
We found that rDock was unable to generate any solutions for four complexes in our data-
set, 2BE0, 2BEE, 2FCZ, and 2PWT. On the other hand, for these structures, AutoDock Vina
and iDock successfully generated poses, albeit with high RMSD to the native structure. To
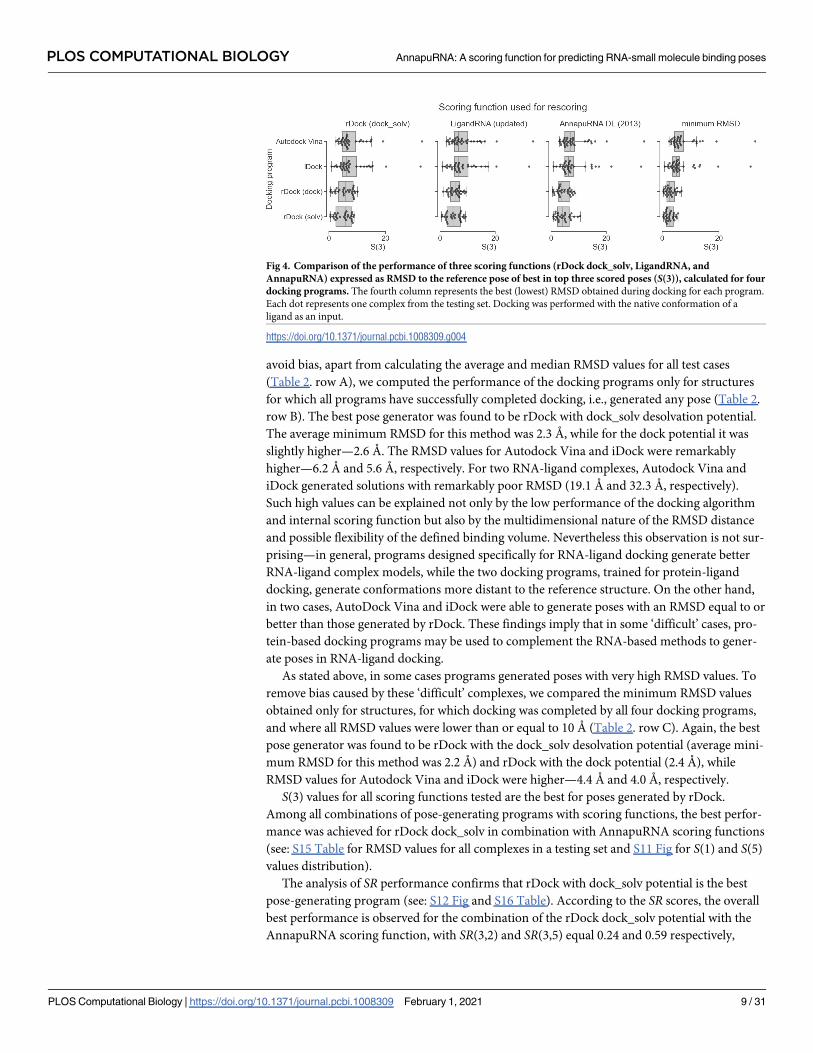
Table 2. Average and median values of the lowest RMSD reported for rDock (dock and dock_solv potentials), AutoDock Vina, and iDock. Values calculated for all
structures in the testing set (A), only for structures for which all programs completed docking (B), and only for structures for which RMSD values of poses found by all pro-
grams are below or equal 10 Å (C). Docking was performed using a native conformation of a ligand as an input.
AutodockVina iDock rdock-dock rdock-dock_solv
A. All data (33 structures):
Average 7.1 6.5 2.6 2.3
Median 5.1 4.4 2.1 1.9
B. Docking completed for all four docking programs (29 structures):
Average 6.2 5.6 2.6 2.3
Median 4.8 4.2 2.1 1.9
C. Docking completed for all four docking programs and all RMSD values < 10 Å (25 structures):
Average 4.4 4.0 2.4 2.2
Median 4.6 4.2 1.9 1.4
https://doi.org/10.1371/journal.pcbi.1008309.t002
PLOS COMPUTATIONAL BIOLOGY AnnapuRNA: A scoring function for predicting RNA-small molecule binding poses
PLOS Computational Biology | https://doi.org/10.1371/journal.pcbi.1008309 February 1, 2021 8 / 31
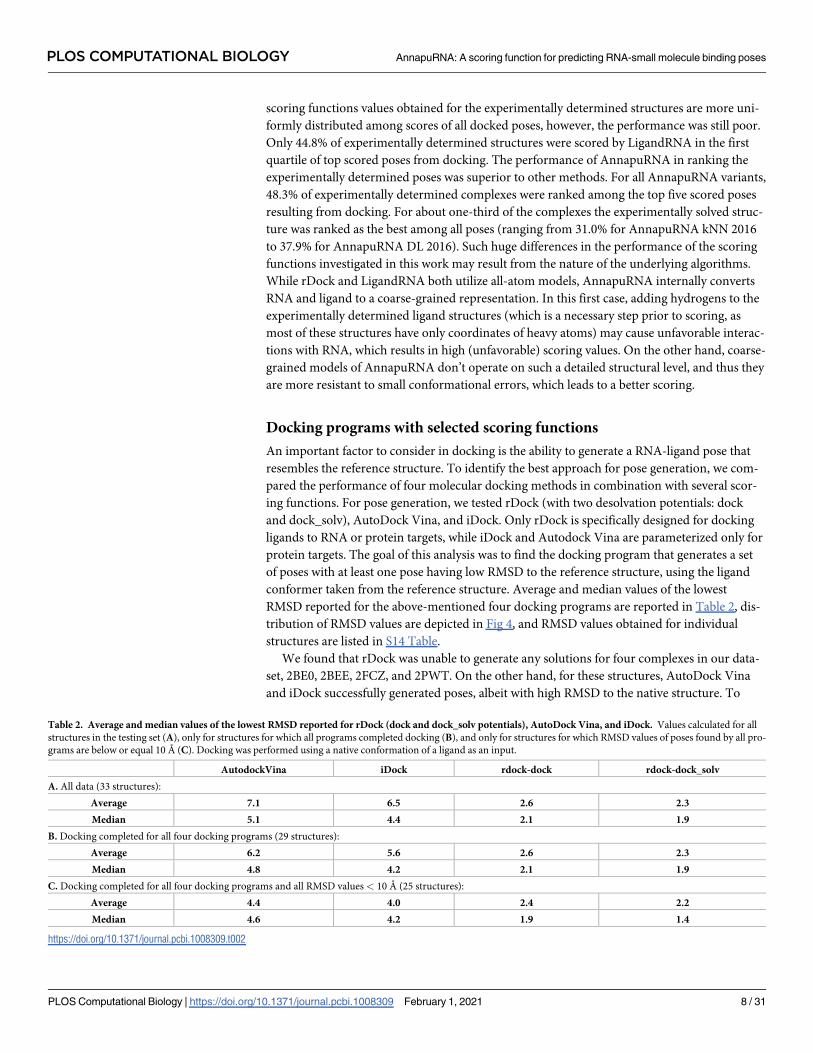
avoid bias, apart from calculating the average and median RMSD values for all test cases
(Table 2. row A), we computed the performance of the docking programs only for structures
for which all programs have successfully completed docking, i.e., generated any pose (Table 2.
row B). The best pose generator was found to be rDock with dock_solv desolvation potential.
The average minimum RMSD for this method was 2.3 Å, while for the dock potential it was
slightly higher—2.6 Å. The RMSD values for Autodock Vina and iDock were remarkably
higher—6.2 Å and 5.6 Å, respectively. For two RNA-ligand complexes, Autodock Vina and
iDock generated solutions with remarkably poor RMSD (19.1 Å and 32.3 Å, respectively).
Such high values can be explained not only by the low performance of the docking algorithm
and internal scoring function but also by the multidimensional nature of the RMSD distance
and possible flexibility of the defined binding volume. Nevertheless this observation is not sur-
prising—in general, programs designed specifically for RNA-ligand docking generate better
RNA-ligand complex models, while the two docking programs, trained for protein-ligand
docking, generate conformations more distant to the reference structure. On the other hand,
in two cases, AutoDock Vina and iDock were able to generate poses with an RMSD equal to or
better than those generated by rDock. These findings imply that in some ‘difficult’ cases, pro-
tein-based docking programs may be used to complement the RNA-based methods to gener-
ate poses in RNA-ligand docking.
As stated above, in some cases programs generated poses with very high RMSD values. To
remove bias caused by these ‘difficult’ complexes, we compared the minimum RMSD values
obtained only for structures, for which docking was completed by all four docking programs,
and where all RMSD values were lower than or equal to 10 Å (Table 2. row C). Again, the best
pose generator was found to be rDock with the dock_solv desolvation potential (average mini-
mum RMSD for this method was 2.2 Å) and rDock with the dock potential (2.4 Å), while
RMSD values for Autodock Vina and iDock were higher—4.4 Å and 4.0 Å, respectively.
S(3) values for all scoring functions tested are the best for poses generated by rDock.
Among all combinations of pose-generating programs with scoring functions, the best perfor-
mance was achieved for rDock dock_solv in combination with AnnapuRNA scoring functions
(see: S15 Table for RMSD values for all complexes in a testing set and S11 Fig for S(1) and S(5)
values distribution).
The analysis of SR performance confirms that rDock with dock_solv potential is the best
pose-generating program (see: S12 Fig and S16 Table). According to the SR scores, the overall
best performance is observed for the combination of the rDock dock_solv potential with the
AnnapuRNA scoring function, with SR(3,2) and SR(3,5) equal 0.24 and 0.59 respectively,
Fig 4. Comparison of the performance of three scoring functions (rDock dock_solv, LigandRNA, and
AnnapuRNA) expressed as RMSD to the reference pose of best in top three scored poses (S(3)), calculated for four
docking programs. The fourth column represents the best (lowest) RMSD obtained during docking for each program.
Each dot represents one complex from the testing set. Docking was performed with the native conformation of a
ligand as an input.
https://doi.org/10.1371/journal.pcbi.1008309.g004
PLOS COMPUTATIONAL BIOLOGY AnnapuRNA: A scoring function for predicting RNA-small molecule binding poses
PLOS Computational Biology | https://doi.org/10.1371/journal.pcbi.1008309 February 1, 2021 9 / 31
while the next top-performing method, LigandRNA, reached values 0.10 and 0.55,
respectively.
Conformer generation methods
In the assessment of RNA-ligand pose generators, we use the pose extracted from the experi-
mentally solved structure. However, in real-life cases, the ‘true’ conformation of the ligand is
unknown, and it must be predicted for executing the step of pose generation. Hence, we
extended our tests to include a comparison of results obtained from docking ligand conform-
ers, which were generated independently from the known bound conformation, using two
programs, OpenBabel and Balloon. For each ligand, in each of the programs, we generated a
single, lowest-energy conformer and used it for molecular docking.
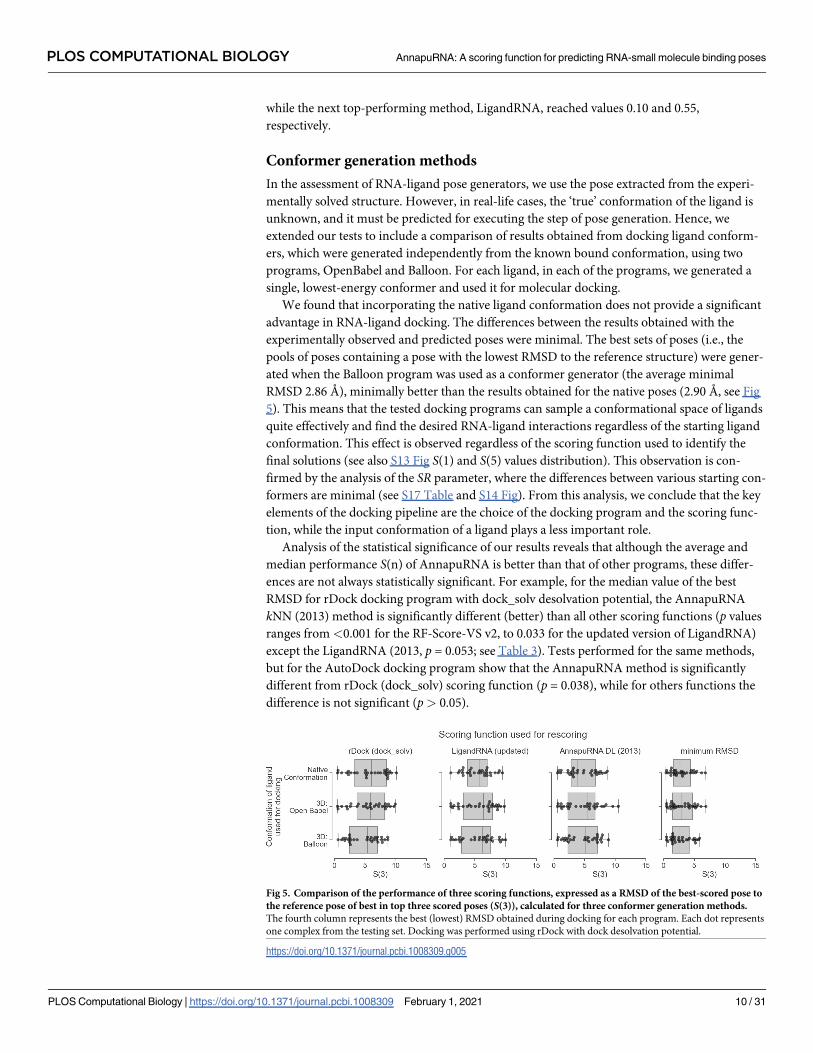
We found that incorporating the native ligand conformation does not provide a significant
advantage in RNA-ligand docking. The differences between the results obtained with the
experimentally observed and predicted poses were minimal. The best sets of poses (i.e., the
pools of poses containing a pose with the lowest RMSD to the reference structure) were gener-
ated when the Balloon program was used as a conformer generator (the average minimal
RMSD 2.86 Å), minimally better than the results obtained for the native poses (2.90 Å, see Fig
5). This means that the tested docking programs can sample a conformational space of ligands
quite effectively and find the desired RNA-ligand interactions regardless of the starting ligand
conformation. This effect is observed regardless of the scoring function used to identify the
final solutions (see also S13 Fig S(1) and S(5) values distribution). This observation is con-
firmed by the analysis of the SR parameter, where the differences between various starting con-
formers are minimal (see S17 Table and S14 Fig). From this analysis, we conclude that the key
elements of the docking pipeline are the choice of the docking program and the scoring func-
tion, while the input conformation of a ligand plays a less important role.
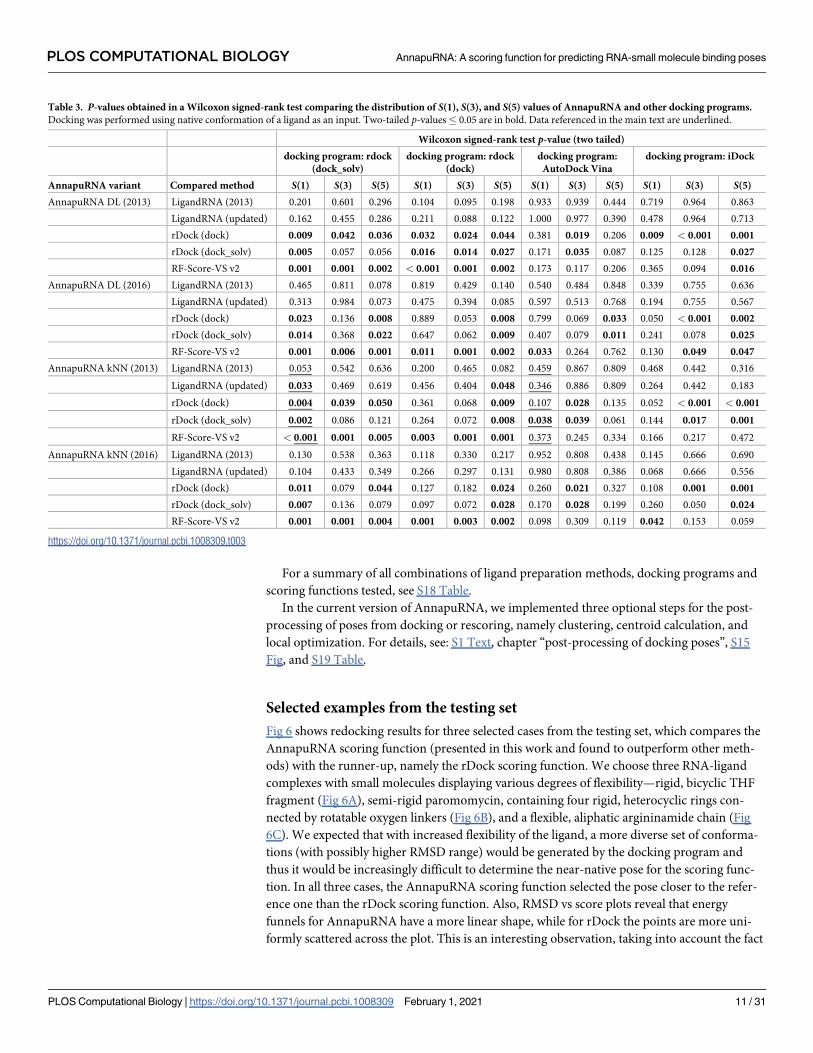
Analysis of the statistical significance of our results reveals that although the average and
median performance S(n) of AnnapuRNA is better than that of other programs, these differ-
ences are not always statistically significant. For example, for the median value of the best
RMSD for rDock docking program with dock_solv desolvation potential, the AnnapuRNA
kNN (2013) method is significantly different (better) than all other scoring functions (p values
ranges from <0.001 for the RF-Score-VS v2, to 0.033 for the updated version of LigandRNA)
except the LigandRNA (2013, p = 0.053; see Table 3). Tests performed for the same methods,
but for the AutoDock docking program show that the AnnapuRNA method is significantly
different from rDock (dock_solv) scoring function (p = 0.038), while for others functions the
difference is not significant (p> 0.05).
Fig 5. Comparison of the performance of three scoring functions, expressed as a RMSD of the best-scored pose to
the reference pose of best in top three scored poses (S(3)), calculated for three conformer generation methods.
The fourth column represents the best (lowest) RMSD obtained during docking for each program. Each dot represents
one complex from the testing set. Docking was performed using rDock with dock desolvation potential.
https://doi.org/10.1371/journal.pcbi.1008309.g005
PLOS COMPUTATIONAL BIOLOGY AnnapuRNA: A scoring function for predicting RNA-small molecule binding poses
PLOS Computational Biology | https://doi.org/10.1371/journal.pcbi.1008309 February 1, 2021 10 / 31
For a summary of all combinations of ligand preparation methods, docking programs and
scoring functions tested, see S18 Table.
In the current version of AnnapuRNA, we implemented three optional steps for the post-
processing of poses from docking or rescoring, namely clustering, centroid calculation, and
local optimization. For details, see: S1 Text, chapter “post-processing of docking poses”, S15
Fig, and S19 Table.
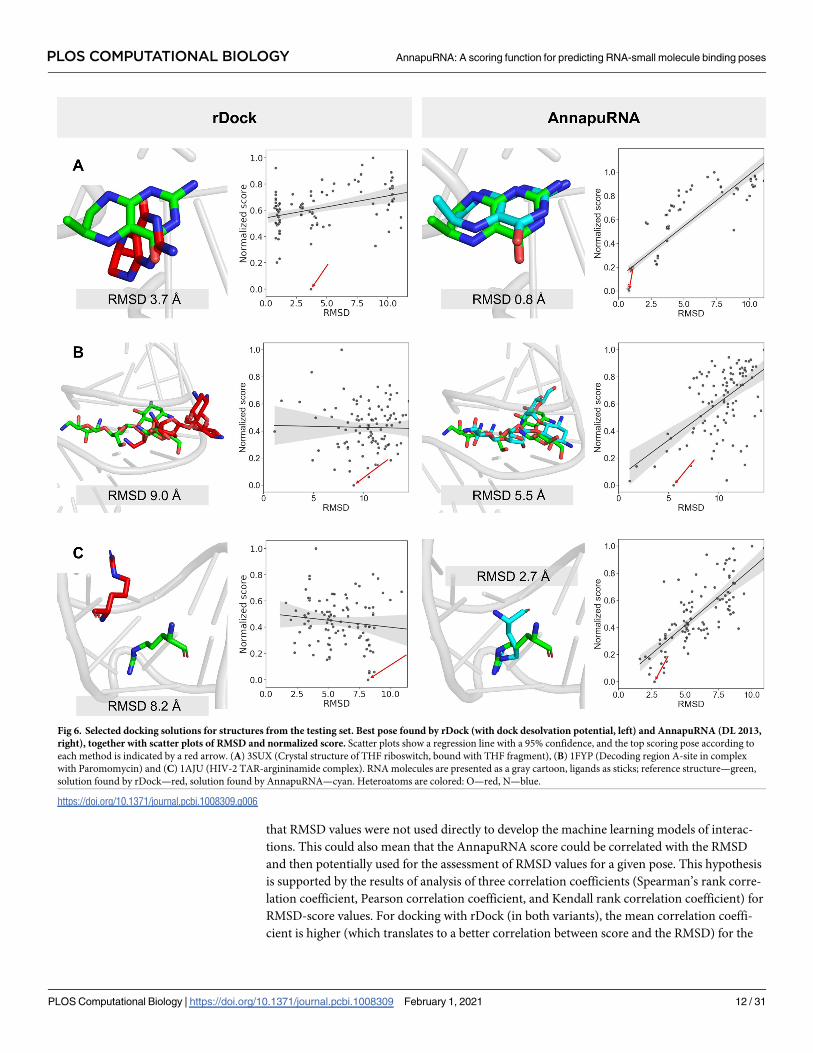
Selected examples from the testing set
Fig 6 shows redocking results for three selected cases from the testing set, which compares the
AnnapuRNA scoring function (presented in this work and found to outperform other meth-
ods) with the runner-up, namely the rDock scoring function. We choose three RNA-ligand
complexes with small molecules displaying various degrees of flexibility—rigid, bicyclic THF
fragment (Fig 6A), semi-rigid paromomycin, containing four rigid, heterocyclic rings con-
nected by rotatable oxygen linkers (Fig 6B), and a flexible, aliphatic argininamide chain (Fig
6C). We expected that with increased flexibility of the ligand, a more diverse set of conforma-
tions (with possibly higher RMSD range) would be generated by the docking program and
thus it would be increasingly difficult to determine the near-native pose for the scoring func-
tion. In all three cases, the AnnapuRNA scoring function selected the pose closer to the refer-
ence one than the rDock scoring function. Also, RMSD vs score plots reveal that energy
funnels for AnnapuRNA have a more linear shape, while for rDock the points are more uni-
formly scattered across the plot. This is an interesting observation, taking into account the fact
Table 3. P-values obtained in a Wilcoxon signed-rank test comparing the distribution of S(1), S(3), and S(5) values of AnnapuRNA and other docking programs.
Docking was performed using native conformation of a ligand as an input. Two-tailed p-values� 0.05 are in bold. Data referenced in the main text are underlined.
Wilcoxon signed-rank test p-value (two tailed)
docking program: rdock
(dock_solv)
docking program: rdock
(dock)
docking program:
AutoDock Vina
docking program: iDock
AnnapuRNA variant Compared method S(1) S(3) S(5) S(1) S(3) S(5) S(1) S(3) S(5) S(1) S(3) S(5)
AnnapuRNA DL (2013) LigandRNA (2013) 0.201 0.601 0.296 0.104 0.095 0.198 0.933 0.939 0.444 0.719 0.964 0.863
LigandRNA (updated) 0.162 0.455 0.286 0.211 0.088 0.122 1.000 0.977 0.390 0.478 0.964 0.713
rDock (dock) 0.009 0.042 0.036 0.032 0.024 0.044 0.381 0.019 0.206 0.009 < 0.001 0.001
rDock (dock_solv) 0.005 0.057 0.056 0.016 0.014 0.027 0.171 0.035 0.087 0.125 0.128 0.027
RF-Score-VS v2 0.001 0.001 0.002 < 0.001 0.001 0.002 0.173 0.117 0.206 0.365 0.094 0.016
AnnapuRNA DL (2016) LigandRNA (2013) 0.465 0.811 0.078 0.819 0.429 0.140 0.540 0.484 0.848 0.339 0.755 0.636
LigandRNA (updated) 0.313 0.984 0.073 0.475 0.394 0.085 0.597 0.513 0.768 0.194 0.755 0.567
rDock (dock) 0.023 0.136 0.008 0.889 0.053 0.008 0.799 0.069 0.033 0.050 < 0.001 0.002
rDock (dock_solv) 0.014 0.368 0.022 0.647 0.062 0.009 0.407 0.079 0.011 0.241 0.078 0.025
RF-Score-VS v2 0.001 0.006 0.001 0.011 0.001 0.002 0.033 0.264 0.762 0.130 0.049 0.047
AnnapuRNA kNN (2013) LigandRNA (2013) 0.053 0.542 0.636 0.200 0.465 0.082 0.459 0.867 0.809 0.468 0.442 0.316
LigandRNA (updated) 0.033 0.469 0.619 0.456 0.404 0.048 0.346 0.886 0.809 0.264 0.442 0.183
rDock (dock) 0.004 0.039 0.050 0.361 0.068 0.009 0.107 0.028 0.135 0.052 < 0.001 < 0.001
rDock (dock_solv) 0.002 0.086 0.121 0.264 0.072 0.008 0.038 0.039 0.061 0.144 0.017 0.001
RF-Score-VS v2 < 0.001 0.001 0.005 0.003 0.001 0.001 0.373 0.245 0.334 0.166 0.217 0.472
AnnapuRNA kNN (2016) LigandRNA (2013) 0.130 0.538 0.363 0.118 0.330 0.217 0.952 0.808 0.438 0.145 0.666 0.690
LigandRNA (updated) 0.104 0.433 0.349 0.266 0.297 0.131 0.980 0.808 0.386 0.068 0.666 0.556
rDock (dock) 0.011 0.079 0.044 0.127 0.182 0.024 0.260 0.021 0.327 0.108 0.001 0.001
rDock (dock_solv) 0.007 0.136 0.079 0.097 0.072 0.028 0.170 0.028 0.199 0.260 0.050 0.024
RF-Score-VS v2 0.001 0.001 0.004 0.001 0.003 0.002 0.098 0.309 0.119 0.042 0.153 0.059
https://doi.org/10.1371/journal.pcbi.1008309.t003
PLOS COMPUTATIONAL BIOLOGY AnnapuRNA: A scoring function for predicting RNA-small molecule binding poses
PLOS Computational Biology | https://doi.org/10.1371/journal.pcbi.1008309 February 1, 2021 11 / 31
that RMSD values were not used directly to develop the machine learning models of interac-
tions. This could also mean that the AnnapuRNA score could be correlated with the RMSD
and then potentially used for the assessment of RMSD values for a given pose. This hypothesis
is supported by the results of analysis of three correlation coefficients (Spearman’s rank corre-
lation coefficient, Pearson correlation coefficient, and Kendall rank correlation coefficient) for
RMSD-score values. For docking with rDock (in both variants), the mean correlation coeffi-
cient is higher (which translates to a better correlation between score and the RMSD) for the
Fig 6. Selected docking solutions for structures from the testing set. Best pose found by rDock (with dock desolvation potential, left) and AnnapuRNA (DL 2013,
right), together with scatter plots of RMSD and normalized score. Scatter plots show a regression line with a 95% confidence, and the top scoring pose according to
each method is indicated by a red arrow. (A) 3SUX (Crystal structure of THF riboswitch, bound with THF fragment), (B) 1FYP (Decoding region A-site in complex
with Paromomycin) and (C) 1AJU (HIV-2 TAR-argininamide complex). RNA molecules are presented as a gray cartoon, ligands as sticks; reference structure—green,
solution found by rDock—red, solution found by AnnapuRNA—cyan. Heteroatoms are colored: O—red, N—blue.
https://doi.org/10.1371/journal.pcbi.1008309.g006
PLOS COMPUTATIONAL BIOLOGY AnnapuRNA: A scoring function for predicting RNA-small molecule binding poses
PLOS Computational Biology | https://doi.org/10.1371/journal.pcbi.1008309 February 1, 2021 12 / 31
AnnapuRNA compared to other scoring functions. For example, the mean Spearman’s rank
correlation coefficient for rDock (dock), LigandRNA (2013) and AnnapuRNA (kNN, 2013) is
0.117, 0.244, and 0.333, respectively. For the updated version of our potential, these values are
even higher, reaching values of 0.345 and 0.336 for DL and kNN, respectively. This means that
the score calculated by AnnapuRNA correlates better with RMSD than the score of other scor-
ing functions tested (for details, see S21 Table and S17 Fig).
Case study
One of the most important applications of molecular docking and scoring functions is to pre-
dict the binding mode of a small molecule in a binding pocket for a macromolecule of interest
—a protein or nucleic acid. In a typical situation, the experimentally solved structure of the
macromolecule is used for modeling. In most cases, this structure is available either as a com-
plex with a structurally different ligand or as an apo structure. In these cases, predicting the
structure of a new complex is more challenging than in a redocking experiment or when a
macromolecule structure solved with a structurally similar ligand is used as a receptor [40].
We performed a set of simulations mimicking this real-life scenario. As a model system, we
used a recently published structure of the FMN riboswitch, co-crystallized with a small mole-
cule inhibitor (6DN2, resolution 2.880 Å [41]). Our task was to predict the binding mode of
this ligand using two structures of FMN riboswitch described seven years earlier [42]: the apo
form (2YIF, resolution 3.298 Å), and a complex with a structurally different ligand (2YIE, reso-
lution 2.941 Å). None of these structures were used for training or testing the AnnapuRNA
function. During this test, we compared two scoring functions—rDock and AnnapuRNA (DL
2013). The first experiment involved the redocking of the ligand to the native structure
(6DN2). Both scoring functions were able to find a pose that is close to the reference; however,
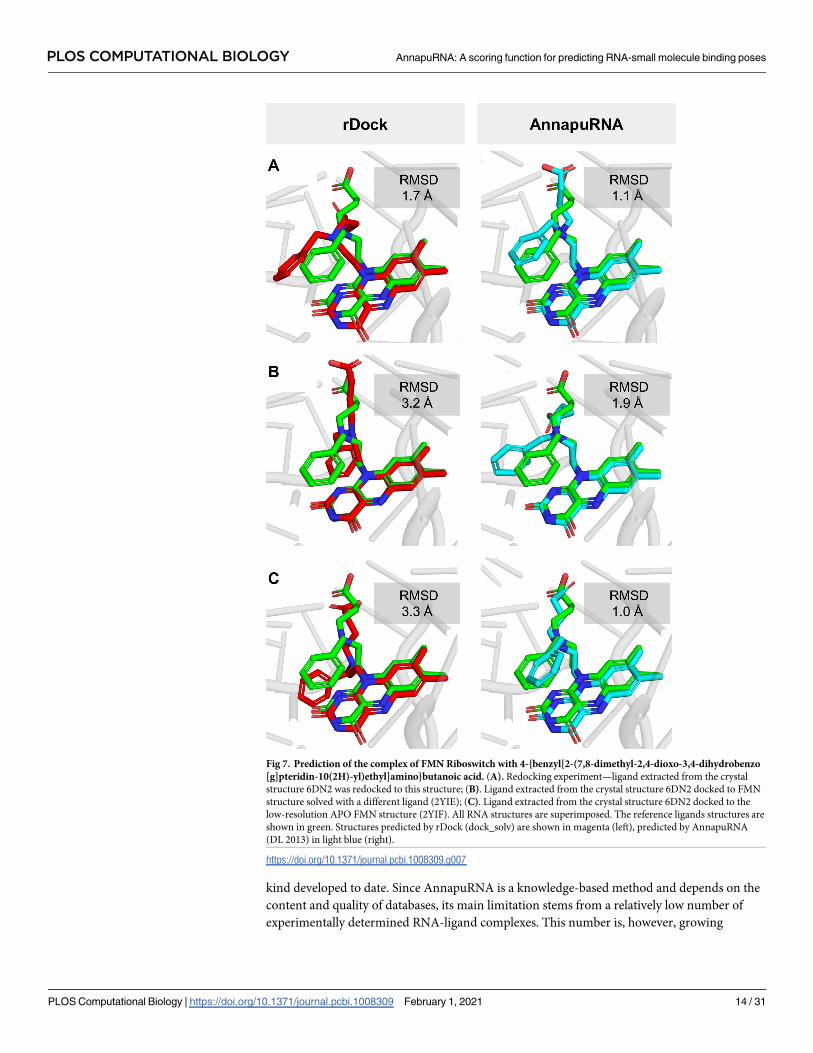
AnnapuRNA performed better than rDock (1.1 Å and 1.7 Å, respectively; Fig 7A).
In the second case study, we used the FMN structure solved with a structurally different
ligand. Here, AnnapuRNA outperformed the rDock scoring function (1.9 Å and 3.2 Å, respec-
tively; Fig 7B). As could be expected, the most difficult fragment to predict was an aliphatic
chain, which, in the case of a pose selected by AnnapuRNA, is closer to the reference structure
than that selected by rDock. Also, in the third experiment, where the apo structure of FMN
was used for docking, AnnapuRNA selected a pose that is very close to the reference, in con-
trast to the rDock (1.0 Å and 3.3 Å, respectively; Fig 7C). To our surprise, in the case of Anna-
puRNA, docking to the apo structure (Fig 7C) yielded better results than those obtained from
docking to RNA structures originally solved with ligands (Fig 7A and Fig 7B). This can be
attributed to a high entropic contribution/flexibility of the aliphatic side chain of the ligand
and thus the difficulty of the docking program in searching the full conformational space
exhaustively during each docking. Nevertheless, for each of these experiments, AnnapuRNA
selected a pose having an RMSD of 1.9 Å to the reference, which can be considered as a suc-
cessful docking (a most commonly used criterion is 2.0 Å to the reference structure [43]). In
this experiment, we showed that a combination of molecular docking and rescoring using the
AnnapuRNA function may be a valuable tool for predicting the structures of RNA-ligand
complexes, even when no good quality RNA structure is available.
Conclusion
In summary, we provide a novel method, AnnapuRNA, for predicting interactions of RNA
with small-molecule ligands. Our tool can be used as a computational workflow together with
a docking program to generate a biologically relevant model of the RNA-ligand complex. Tests
reported in this manuscript indicate that our new method is superior to other programs of this
PLOS COMPUTATIONAL BIOLOGY AnnapuRNA: A scoring function for predicting RNA-small molecule binding poses
PLOS Computational Biology | https://doi.org/10.1371/journal.pcbi.1008309 February 1, 2021 13 / 31
kind developed to date. Since AnnapuRNA is a knowledge-based method and depends on the
content and quality of databases, its main limitation stems from a relatively low number of
experimentally determined RNA-ligand complexes. This number is, however, growing
Fig 7. Prediction of the complex of FMN Riboswitch with 4-{benzyl[2-(7,8-dimethyl-2,4-dioxo-3,4-dihydrobenzo
[g]pteridin-10(2H)-yl)ethyl]amino}butanoic acid. (A). Redocking experiment—ligand extracted from the crystal
structure 6DN2 was redocked to this structure; (B). Ligand extracted from the crystal structure 6DN2 docked to FMN
structure solved with a different ligand (2YIE); (C). Ligand extracted from the crystal structure 6DN2 docked to the
low-resolution APO FMN structure (2YIF). All RNA structures are superimposed. The reference ligands structures are
shown in green. Structures predicted by rDock (dock_solv) are shown in magenta (left), predicted by AnnapuRNA
(DL 2013) in light blue (right).
https://doi.org/10.1371/journal.pcbi.1008309.g007
PLOS COMPUTATIONAL BIOLOGY AnnapuRNA: A scoring function for predicting RNA-small molecule binding poses
PLOS Computational Biology | https://doi.org/10.1371/journal.pcbi.1008309 February 1, 2021 14 / 31
steadily, and we plan to update AnnapuRNA in the future using new RNA-ligand structural
data.
Also, conformational changes of RNA are a big challenge for the docking methods, which
typically treat the macromolecular receptor as rigid and allow flexibility only for the ligand. If
a large structural rearrangement of a ligand-binding site is expected, the typical docking analy-
sis will most likely fail, and if all candidates are completely wrong then AnnapuRNA will not
help to select a “good” solution. However, it is worth to emphasize that AnnapuRNA can be
used to score and rank models resulting not only from docking methods, but from any method
that generates models, such as computational simulations that can be used to address the flexi-
bility of the RNA and structural change upon the ligand binding. Hence, the key issue is to use
a method for generating RNA-ligand poses that is fit-for-purpose, i.e., capable of generating
poses that are actually close to the real RNA-ligand complex structure. Once this condition is
fulfilled, AnnapuRNA is expected to find good solution(s).
Materials and methods
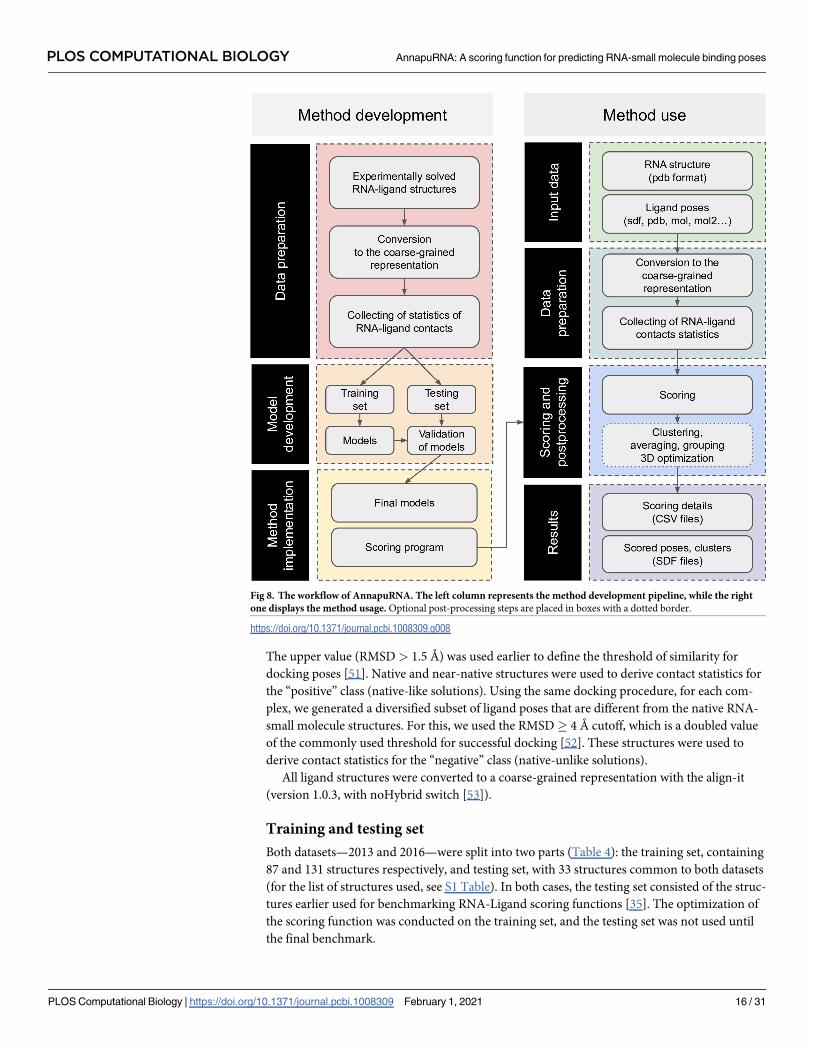
Fig 8 summarizes the main steps of the AnnapuRNA method development and use.
Datasets
Two RNA-ligand structures datasets were prepared. One, called “2013” was based on the struc-
tures selected by Philips et al. published until 2013 [35]. The second, called “2016” was updated
by additional structures solved and published until 2016.08 (extracted from the PDB database
with search criteria: contains RNA: yes; has ligand(s): yes; chemical component type: non-
polymer) and selected with the criteria described earlier by Philips at al. (i.e., for RNAs with
sequence identity >90%, which are in complex with the same ligand, only the structure with
the highest resolution was used; for NMR structures the first model in the file was used; for res-
idues with more than one alternative conformation, the first variant was used; structures con-
taining small molecule ligands closer than 6 Å to any atom other than RNA, water or cation
were excluded). For the comparison of structures added in the 2016 dataset with those in 2013,
see S3 Table and S6 and S7 Figs. Next, for both datasets, RNA structures were preprocessed
using the rna-tools software suite (commit b528a29; [44]). Small molecule structures were
fetched independently using the RCSB PDB RESTful Web Service interface [45]. Since the
AnnapuRNA potential was designed for drug-like compounds, complexes containing ligands
with atoms other than C, H, N, O, S, Br, Cl, F, P, Si, B, Se, or lacking C and H atoms were
excluded (a molecular formula provided in the xml file fetched from the PDB was used to ver-
ify the presence or absence of a given element). To keep only small molecule ligands, we
applied the molecular mass criteria with the upper limit of 1000 Da, as defined earlier [46].
This is beyond the most frequently used value of 500 Da [47,48] but allowed us to include
larger drug molecules such as oral antibacterial agents, having a substantial number of com-
pounds with the mass in 700–900 Da range [49]. All explicit hydrogens were added to ligand
structures with OpenBabel [50], based on the data fetched from the PDB (with no protonation
recalculation). For plots showing complexes diversity (pairwise comparison of ligands struc-
tural similarity, RNA sequence identity, and RNA RMSD, see S1–S5 Figs and S2 Table).
For each RNA-ligand complex structure, we generated additional near-native poses by
redocking the ligand to the RNA receptor. For docking, we used the rDock software, with rigid
RNA and flexible ligand, with dock_solv docking protocol and docking radius set to 10. For
each complex, 1000 poses were generated and clustered with 2.0 Å RMSD cutoff. We selected
a set of poses with RMSD between 0.1 and 1.5 Å to the native ligand pose. The lower value
(RMSD< 0.1 Å) was set arbitrarily to exclude poses that are very similar to the native pose.
PLOS COMPUTATIONAL BIOLOGY AnnapuRNA: A scoring function for predicting RNA-small molecule binding poses
PLOS Computational Biology | https://doi.org/10.1371/journal.pcbi.1008309 February 1, 2021 15 / 31
The upper value (RMSD> 1.5 Å) was used earlier to define the threshold of similarity for
docking poses [51]. Native and near-native structures were used to derive contact statistics for
the “positive” class (native-like solutions). Using the same docking procedure, for each com-
plex, we generated a diversified subset of ligand poses that are different from the native RNA-
small molecule structures. For this, we used the RMSD� 4 Å cutoff, which is a doubled value
of the commonly used threshold for successful docking [52]. These structures were used to
derive contact statistics for the “negative” class (native-unlike solutions).
All ligand structures were converted to a coarse-grained representation with the align-it
(version 1.0.3, with noHybrid switch [53]).
Training and testing set
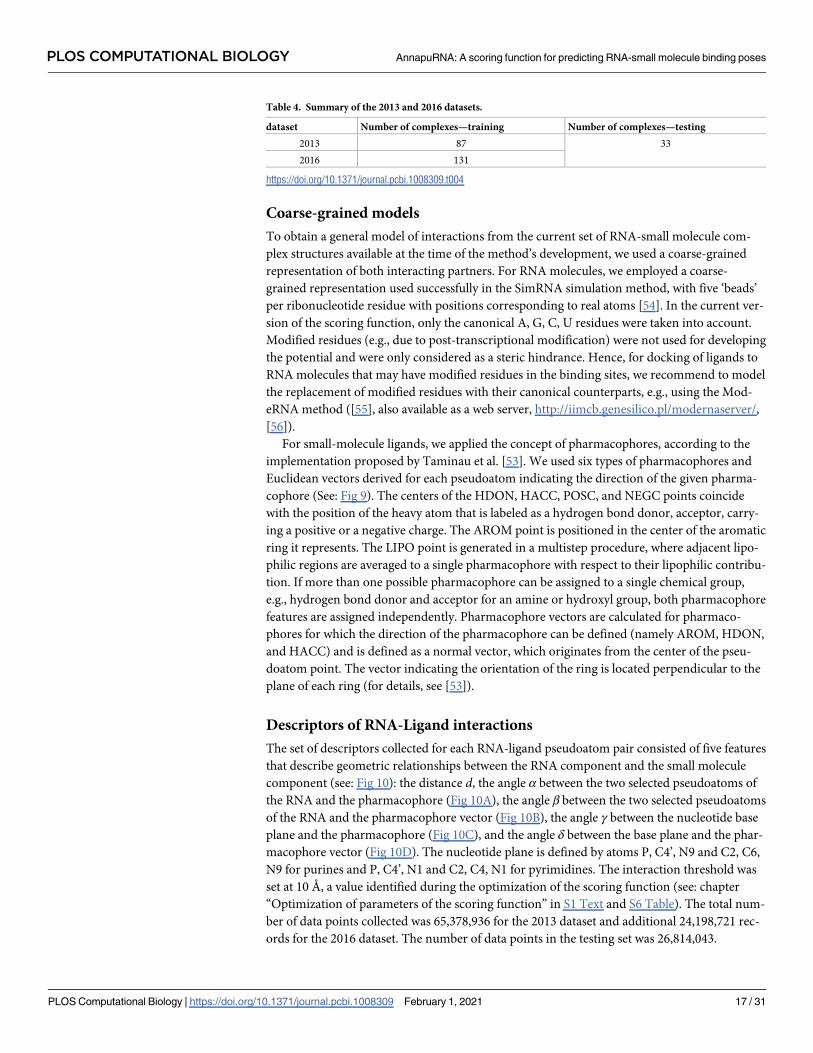
Both datasets—2013 and 2016—were split into two parts (Table 4): the training set, containing
87 and 131 structures respectively, and testing set, with 33 structures common to both datasets
(for the list of structures used, see S1 Table). In both cases, the testing set consisted of the struc-
tures earlier used for benchmarking RNA-Ligand scoring functions [35]. The optimization of
the scoring function was conducted on the training set, and the testing set was not used until
the final benchmark.
Fig 8. The workflow of AnnapuRNA. The left column represents the method development pipeline, while the right
one displays the method usage. Optional post-processing steps are placed in boxes with a dotted border.
https://doi.org/10.1371/journal.pcbi.1008309.g008
PLOS COMPUTATIONAL BIOLOGY AnnapuRNA: A scoring function for predicting RNA-small molecule binding poses
PLOS Computational Biology | https://doi.org/10.1371/journal.pcbi.1008309 February 1, 2021 16 / 31
Coarse-grained models
To obtain a general model of interactions from the current set of RNA-small molecule com-
plex structures available at the time of the method’s development, we used a coarse-grained
representation of both interacting partners. For RNA molecules, we employed a coarse-
grained representation used successfully in the SimRNA simulation method, with five ‘beads’
per ribonucleotide residue with positions corresponding to real atoms [54]. In the current ver-
sion of the scoring function, only the canonical A, G, C, U residues were taken into account.
Modified residues (e.g., due to post-transcriptional modification) were not used for developing
the potential and were only considered as a steric hindrance. Hence, for docking of ligands to
RNA molecules that may have modified residues in the binding sites, we recommend to model
the replacement of modified residues with their canonical counterparts, e.g., using the Mod-
eRNA method ([55], also available as a web server, http://iimcb.genesilico.pl/modernaserver/,
[56]).
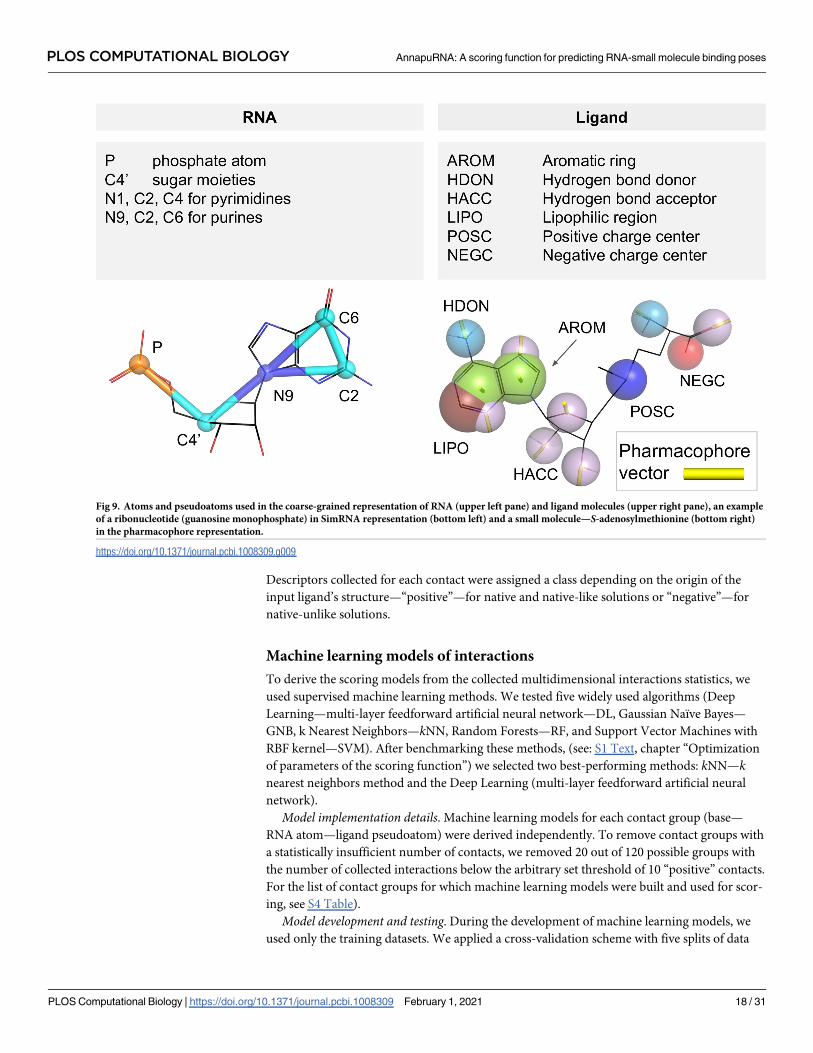
For small-molecule ligands, we applied the concept of pharmacophores, according to the
implementation proposed by Taminau et al. [53]. We used six types of pharmacophores and
Euclidean vectors derived for each pseudoatom indicating the direction of the given pharma-
cophore (See: Fig 9). The centers of the HDON, HACC, POSC, and NEGC points coincide
with the position of the heavy atom that is labeled as a hydrogen bond donor, acceptor, carry-
ing a positive or a negative charge. The AROM point is positioned in the center of the aromatic
ring it represents. The LIPO point is generated in a multistep procedure, where adjacent lipo-
philic regions are averaged to a single pharmacophore with respect to their lipophilic contribu-
tion. If more than one possible pharmacophore can be assigned to a single chemical group,
e.g., hydrogen bond donor and acceptor for an amine or hydroxyl group, both pharmacophore
features are assigned independently. Pharmacophore vectors are calculated for pharmaco-
phores for which the direction of the pharmacophore can be defined (namely AROM, HDON,
and HACC) and is defined as a normal vector, which originates from the center of the pseu-
doatom point. The vector indicating the orientation of the ring is located perpendicular to the
plane of each ring (for details, see [53]).
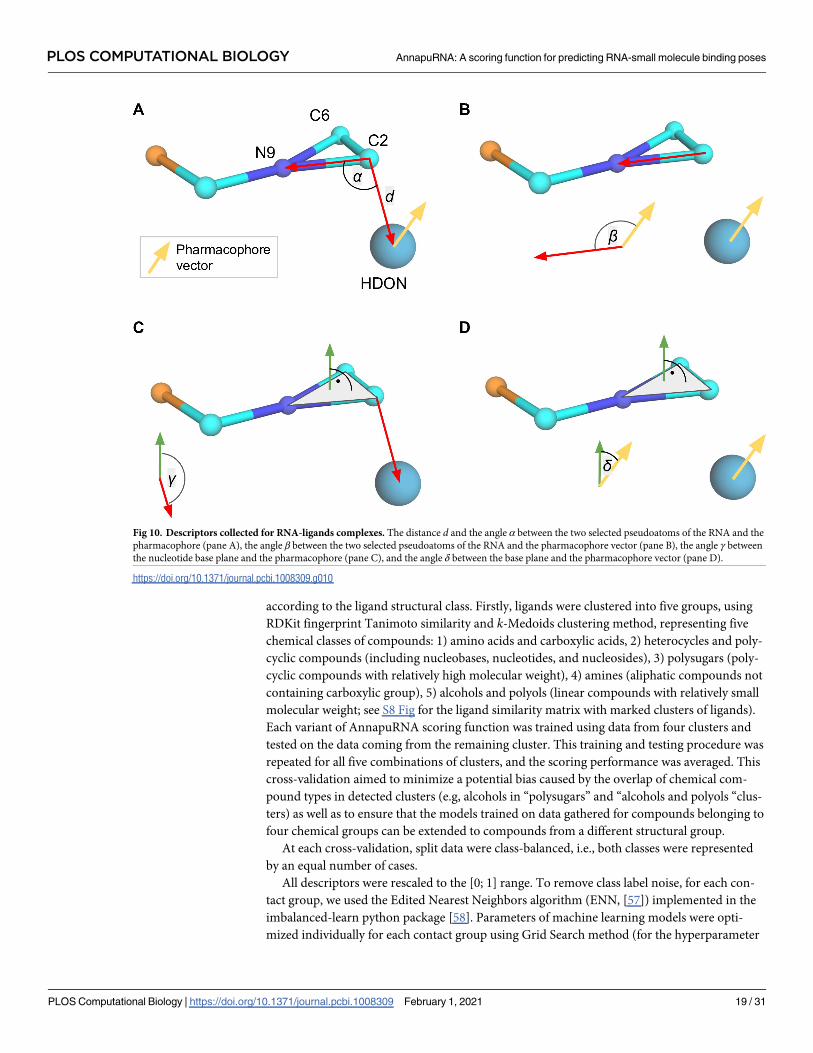
Descriptors of RNA-Ligand interactions
The set of descriptors collected for each RNA-ligand pseudoatom pair consisted of five features
that describe geometric relationships between the RNA component and the small molecule
component (see: Fig 10): the distance d, the angle α between the two selected pseudoatoms of
the RNA and the pharmacophore (Fig 10A), the angle β between the two selected pseudoatoms
of the RNA and the pharmacophore vector (Fig 10B), the angle γ between the nucleotide base
plane and the pharmacophore (Fig 10C), and the angle δ between the base plane and the phar-
macophore vector (Fig 10D). The nucleotide plane is defined by atoms P, C4’, N9 and C2, C6,
N9 for purines and P, C4’, N1 and C2, C4, N1 for pyrimidines. The interaction threshold was
set at 10 Å, a value identified during the optimization of the scoring function (see: chapter
“Optimization of parameters of the scoring function” in S1 Text and S6 Table). The total num-
ber of data points collected was 65,378,936 for the 2013 dataset and additional 24,198,721 rec-
ords for the 2016 dataset. The number of data points in the testing set was 26,814,043.
Table 4. Summary of the 2013 and 2016 datasets.
dataset Number of complexes—training Number of complexes—testing
2013 87 33
2016 131
https://doi.org/10.1371/journal.pcbi.1008309.t004
PLOS COMPUTATIONAL BIOLOGY AnnapuRNA: A scoring function for predicting RNA-small molecule binding poses
PLOS Computational Biology | https://doi.org/10.1371/journal.pcbi.1008309 February 1, 2021 17 / 31
Descriptors collected for each contact were assigned a class depending on the origin of the
input ligand’s structure—“positive”—for native and native-like solutions or “negative”—for
native-unlike solutions.
Machine learning models of interactions
To derive the scoring models from the collected multidimensional interactions statistics, we
used supervised machine learning methods. We tested five widely used algorithms (Deep
Learning—multi-layer feedforward artificial neural network—DL, Gaussian Naïve Bayes—
GNB, k Nearest Neighbors—kNN, Random Forests—RF, and Support Vector Machines with
RBF kernel—SVM). After benchmarking these methods, (see: S1 Text, chapter “Optimization
of parameters of the scoring function”) we selected two best-performing methods: kNN—knearest neighbors method and the Deep Learning (multi-layer feedforward artificial neural
network).
Model implementation details. Machine learning models for each contact group (base—
RNA atom—ligand pseudoatom) were derived independently. To remove contact groups with
a statistically insufficient number of contacts, we removed 20 out of 120 possible groups with
the number of collected interactions below the arbitrary set threshold of 10 “positive” contacts.
For the list of contact groups for which machine learning models were built and used for scor-
ing, see S4 Table).
Model development and testing. During the development of machine learning models, we
used only the training datasets. We applied a cross-validation scheme with five splits of data
Fig 9. Atoms and pseudoatoms used in the coarse-grained representation of RNA (upper left pane) and ligand molecules (upper right pane), an example
of a ribonucleotide (guanosine monophosphate) in SimRNA representation (bottom left) and a small molecule—S-adenosylmethionine (bottom right)
in the pharmacophore representation.
https://doi.org/10.1371/journal.pcbi.1008309.g009
PLOS COMPUTATIONAL BIOLOGY AnnapuRNA: A scoring function for predicting RNA-small molecule binding poses
PLOS Computational Biology | https://doi.org/10.1371/journal.pcbi.1008309 February 1, 2021 18 / 31
according to the ligand structural class. Firstly, ligands were clustered into five groups, using
RDKit fingerprint Tanimoto similarity and k-Medoids clustering method, representing five
chemical classes of compounds: 1) amino acids and carboxylic acids, 2) heterocycles and poly-
cyclic compounds (including nucleobases, nucleotides, and nucleosides), 3) polysugars (poly-
cyclic compounds with relatively high molecular weight), 4) amines (aliphatic compounds not
containing carboxylic group), 5) alcohols and polyols (linear compounds with relatively small
molecular weight; see S8 Fig for the ligand similarity matrix with marked clusters of ligands).
Each variant of AnnapuRNA scoring function was trained using data from four clusters and
tested on the data coming from the remaining cluster. This training and testing procedure was
repeated for all five combinations of clusters, and the scoring performance was averaged. This
cross-validation aimed to minimize a potential bias caused by the overlap of chemical com-
pound types in detected clusters (e.g, alcohols in “polysugars” and “alcohols and polyols “clus-
ters) as well as to ensure that the models trained on data gathered for compounds belonging to
four chemical groups can be extended to compounds from a different structural group.
At each cross-validation, split data were class-balanced, i.e., both classes were represented
by an equal number of cases.
All descriptors were rescaled to the [0; 1] range. To remove class label noise, for each con-
tact group, we used the Edited Nearest Neighbors algorithm (ENN, [57]) implemented in the
imbalanced-learn python package [58]. Parameters of machine learning models were opti-
mized individually for each contact group using Grid Search method (for the hyperparameter
Fig 10. Descriptors collected for RNA-ligands complexes. The distance d and the angle α between the two selected pseudoatoms of the RNA and the
pharmacophore (pane A), the angle β between the two selected pseudoatoms of the RNA and the pharmacophore vector (pane B), the angle γ between
the nucleotide base plane and the pharmacophore (pane C), and the angle δ between the base plane and the pharmacophore vector (pane D).
https://doi.org/10.1371/journal.pcbi.1008309.g010
PLOS COMPUTATIONAL BIOLOGY AnnapuRNA: A scoring function for predicting RNA-small molecule binding poses
PLOS Computational Biology | https://doi.org/10.1371/journal.pcbi.1008309 February 1, 2021 19 / 31
search space, see S5 Table). We used two python implementations of machine learning algo-
rithms: scikit-learn (version 0.17, [59]) and H2O (version 3.9.1.3501, https://www.h2o.ai/).
For the optimized set of parameters and developed processing pipeline, we built the final
four versions of predictive models—for two selected machine learning algorithms (kNN and
Deep Learning) using two training datasets (“2013” and “2016”).
Potential definition
The total score for RNA-Ligand complex is a sum of two terms:
E ¼ ERNA� Ligand þ ELigand ð1Þ
where E is the final score of the complex, ERNA-Ligand is the score of RNA-Ligand interaction
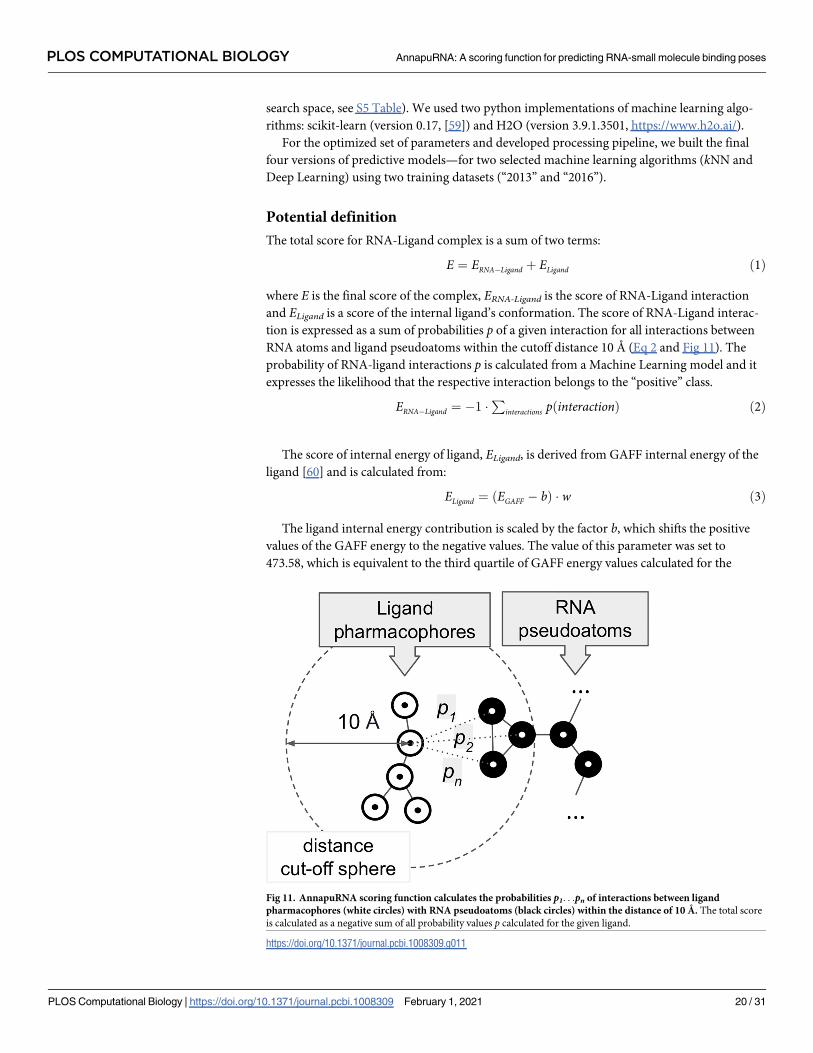
and ELigand is a score of the internal ligand’s conformation. The score of RNA-Ligand interac-
tion is expressed as a sum of probabilities p of a given interaction for all interactions between
RNA atoms and ligand pseudoatoms within the cutoff distance 10 Å (Eq 2 and Fig 11). The
probability of RNA-ligand interactions p is calculated from a Machine Learning model and it
expresses the likelihood that the respective interaction belongs to the “positive” class.
ERNA� Ligand ¼ � 1 �P
interactions pðinteractionÞ ð2Þ
The score of internal energy of ligand, ELigand, is derived from GAFF internal energy of the
ligand [60] and is calculated from:
ELigand ¼ ðEGAFF � bÞ � w ð3Þ
The ligand internal energy contribution is scaled by the factor b, which shifts the positive
values of the GAFF energy to the negative values. The value of this parameter was set to
473.58, which is equivalent to the third quartile of GAFF energy values calculated for the
Fig 11. AnnapuRNA scoring function calculates the probabilities p1. . .pn of interactions between ligand
pharmacophores (white circles) with RNA pseudoatoms (black circles) within the distance of 10 Å. The total score
is calculated as a negative sum of all probability values p calculated for the given ligand.
https://doi.org/10.1371/journal.pcbi.1008309.g011
PLOS COMPUTATIONAL BIOLOGY AnnapuRNA: A scoring function for predicting RNA-small molecule binding poses
PLOS Computational Biology | https://doi.org/10.1371/journal.pcbi.1008309 February 1, 2021 20 / 31
diversified set of experimentally determined ligand structures deposited in the PDB database.
The ligand’s contribution to the final complex score is scaled by the weighting factor w. This
parameter was set to 0.1 after optimization in a cross-validation experiment but may be
changed by the user via a command-line switch.
For the full optimization procedure of parameters of the AnnapuRNA scoring function, see
chapter “Optimization of parameters of the scoring function” in S1 Text and S7–S10 Tables.
Construction of the testing set
To compare the AnnapuRNA scoring function with the previously published methods, we per-
formed a redocking experiment. The testing set consisted of 33 RNA-small molecule complex
structures, included in the set used earlier by Philips et al. [35] and for which we were able to
obtain docking results using at least two methods.
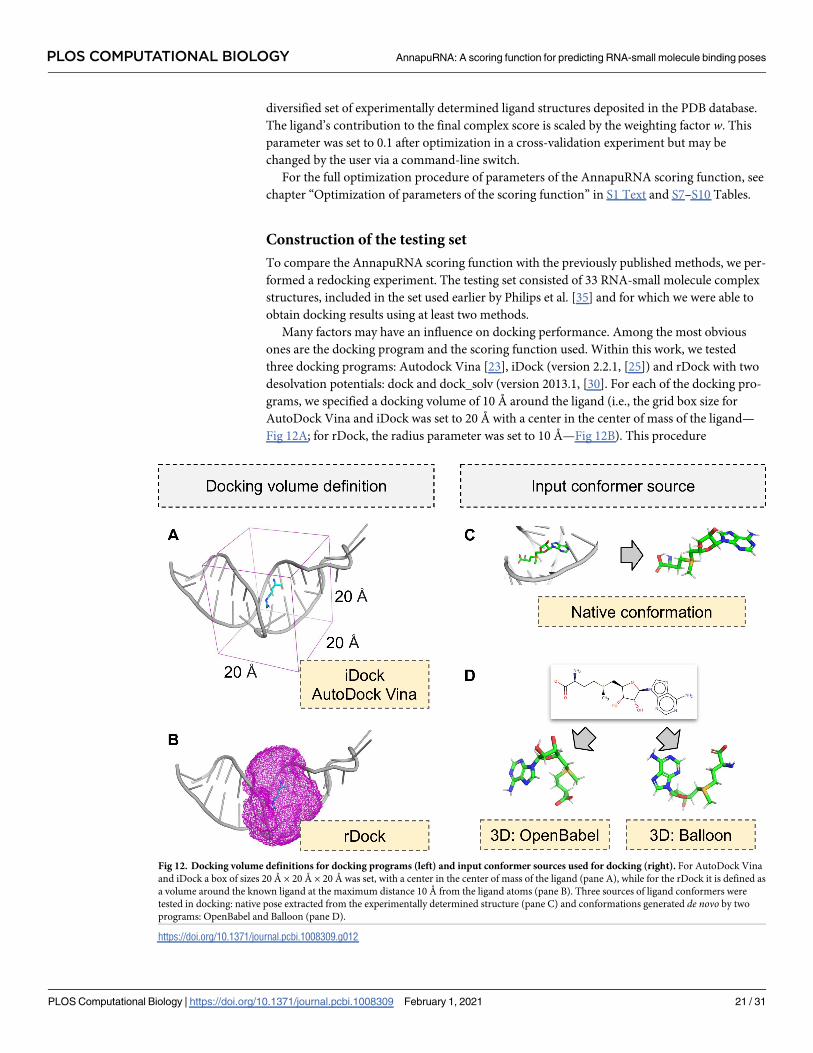
Many factors may have an influence on docking performance. Among the most obvious
ones are the docking program and the scoring function used. Within this work, we tested
three docking programs: Autodock Vina [23], iDock (version 2.2.1, [25]) and rDock with two
desolvation potentials: dock and dock_solv (version 2013.1, [30]. For each of the docking pro-
grams, we specified a docking volume of 10 Å around the ligand (i.e., the grid box size for
AutoDock Vina and iDock was set to 20 Å with a center in the center of mass of the ligand—
Fig 12A; for rDock, the radius parameter was set to 10 Å—Fig 12B). This procedure
Fig 12. Docking volume definitions for docking programs (left) and input conformer sources used for docking (right). For AutoDock Vina
and iDock a box of sizes 20 Å × 20 Å × 20 Å was set, with a center in the center of mass of the ligand (pane A), while for the rDock it is defined as
a volume around the known ligand at the maximum distance 10 Å from the ligand atoms (pane B). Three sources of ligand conformers were
tested in docking: native pose extracted from the experimentally determined structure (pane C) and conformations generated de novo by two
programs: OpenBabel and Balloon (pane D).
https://doi.org/10.1371/journal.pcbi.1008309.g012
PLOS COMPUTATIONAL BIOLOGY AnnapuRNA: A scoring function for predicting RNA-small molecule binding poses
PLOS Computational Biology | https://doi.org/10.1371/journal.pcbi.1008309 February 1, 2021 21 / 31
determines the volume that is allowed for the docking program to sample in search of the opti-
mal ligand poses. Although the methods used for determining the docking volume differ for
those docking programs, the values used in the setup will assure the docking space is similar in
all three cases. For each ligand, 100 poses were generated (except AutoDock Vina, for which
the maximum number of poses is 20).
Generated poses were rescored using nine scoring functions: LigandRNA (in two versions:
the one which is described in the original publication, called “2013”, and the second, with an
updated potential, called “updated”), rDock (with two potentials: dock and dock_solv),
RF-Score-VS (version v2, [61]) and four variants of the scoring function, AnnapuRNA, pre-
sented in this work. The four variants correspond to two versions of the scoring function: kNN
and DeepLearning, each trained on two datasets: “2013” and “2016”. In the final comparison
for iDock and AutoDock Vina, we also included results from the scoring function used by the
docking program (termed “Internal SF”).
In the real-life scenario of docking small molecules to a macromolecular receptor, an exper-
imentally solved structure of the macromolecule (Fig 12C) and a de novo generated three-
dimensional structure of a ligand are used (Fig 12D). In our redocking experiment, we wanted
to simulate this process and use not only the native ligand structure extracted from the solved
complex but also the single lowest energy ligand conformation generated from one-dimen-
sional SMILES structures. For this purpose we used two widely used tools: OpenBabel
with --gen3D option (version 2.3, [50]) and Balloon (version 1.6.2.1236, [62]). OpenBabel
uses a multistep procedure, which includes building 3D structures using rules and fragment
templates, rough geometry optimization with the MMFF94 force field, weighted rotor confor-
mational search, and the final conjugate gradient geometry optimization. Balloon uses geome-
try rules to build an initial conformer, which is then subject to geometric modifications
encoded by the individuals of the genetic algorithm (modifications include torsion angles, the
stereochemistry of double bonds and tetrahedral chiral centers, and ring conformations). The
final conformer is relaxed using a modified version of the MMFF94 force field.
Measuring the docking performance
To test the performance of our method as well as other methods in their ability to identify the
most accurate binding poses, we used the S(X) metric [35], which reports the lowest RMSD to
the reference ligand among the top X scoring poses. Here we used three variants of this metric:
S(1), S(3), and S(5), which report the RMSD of the top-scoring pose, the top three poses, and
the top five poses, respectively. Additionally, we used the success rate metric SR(X,C), which
indicates if a given docking analysis was successful or not, according to the criterion that
checks if in top X scoring poses there were any poses with RMSD� C Å) and assigns 1 or 0
values, respectively. We analyzed SR for the top X = {3, 5} poses with C = {2, 5} Å cut off values,
and reported the average values for all complexes in the testing set. As a negative control we
used a random selection of docked poses, e.g., for the SR(X,C) metric we randomly picked X
poses and tested if at least one has RMSD� C Å to the reference structure; this sampling was
conducted 100000 times and the SR values were averaged.
The RMSD between the docked ligand pose and the reference (experimentally determined)
ligand pose was calculated using an in-house python script, and it took into account the sym-
metry within the ligand structure. We employed the Wilcoxon signed-rank to test if the
median scores obtained from the AnnapuRNA algorithm was significantly different (in our
case: better) than for other scoring functions and reported two-tailed p values. Statistical analy-
sis was performed in the KNIME Analytics Platform 4.1.3 with a Wilcoxon Signed-Rank node
[63]. Correlation coefficients were calculated with pandas 1.0.5 [64].
PLOS COMPUTATIONAL BIOLOGY AnnapuRNA: A scoring function for predicting RNA-small molecule binding poses
PLOS Computational Biology | https://doi.org/10.1371/journal.pcbi.1008309 February 1, 2021 22 / 31
Supporting information
S1 Fig. Matrix of similarity of ligands of all complexes in the 2013 and 2016 training sets,
and in the testing set. Complexes included in these datasets are marked with black boxes.
Ligand similarity was calculated using the Tanimoto similarity of RDKit fingerprints (the
higher the value, the more similar ligands).
(PNG)
S2 Fig. Matrix of RNA sequence identity of all complexes in the 2013 and 2016 training
sets, and in the testing set. Complexes included in these datasets are marked with orange,
green, and blue boxes respectively. Sequence identity was calculated using Clustal 2.1.
(PNG)
S3 Fig. Matrix of RNA sequence identity of all complexes in the 2013 and 2016 training
sets, and in the testing set. Ligands of the same or very similar structure and RNA sequence
identity > = 90% are marked red. Complexes included in these datasets are marked with
orange, green, and blue boxes respectively. Sequence identity was calculated using Clustal 2.1.
(PNG)
S4 Fig. Matrix of RMSD distance of pairs of RNA of all complexes in the 2013 and 2016
training sets, and in the testing set. Complexes included in these datasets are marked with
orange, green, and blue boxes respectively. RMSD was calculated with PyMol 2.5.0 (function
align with cycles = 0 parameter).
(PNG)
S5 Fig. Matrix of RMSD distance of pairs of RNA of all complexes in the 2013 and 2016
training sets, and in the testing set. Ligands of the same or very similar structure and RNA
RMSD< = 5 Å are marked red. Complexes included in these datasets are marked with orange,
green, and blue boxes respectively.
(PNG)
S6 Fig. Distribution of similarity values of structures from the 2016 dataset to structures in the
2013 dataset: the maximum sequence identity (A), the minimum RMSD distance (B), and the
maximum ligand similarity (C).
(PNG)
S7 Fig. Bivariate histograms comparing the distribution of similarity values of structures from
the 2016 dataset to structures in the 2013 dataset: the maximum sequence identity and the
minimum RMSD distance (A), the maximum sequence identity and the maximum ligand sim-
ilarity (B), and the minimum RMSD distance and the maximum ligand similarity (C).
(PNG)
S8 Fig. Tanimoto ligands similarity matrix for the 2013 training set and clusters of ligands
used in cross validation.
(PNG)
S9 Fig. Comparison of the performance of nine scoring functions expressed as the average
SR values. SR(X,C) indicates if a given docking was successful (i.e., in top X scoring poses
there was at least one pose with RMSD� C Å). The first row represents the performance
obtained when the random poses are selected (the negative control). The last row represents
the performance obtained when poses are ranked by the RMSD to the reference structure (pos-
itive control). Horizontal lines represent 95% bootstrapped confidence intervals. Docking was
performed using rDock with the dock desolvation potential, with the native conformation of a
PLOS COMPUTATIONAL BIOLOGY AnnapuRNA: A scoring function for predicting RNA-small molecule binding poses
PLOS Computational Biology | https://doi.org/10.1371/journal.pcbi.1008309 February 1, 2021 23 / 31
ligand as an input.
(PNG)
S10 Fig. Comparison of the performance of nine scoring functions, expressed as a RMSD
of the best scored pose to the reference pose (left pane), best in top three scored poses (S(3), middle pane), and best in top five scored poses (S(5), right pane). Additional rows rep-
resent the internal scoring function of the docking program (Internal SF), median, and mini-
mal values of RMSD obtained during the docking. Each dot represents one complex from the
testing set. Docking was performed using rDock with the dock_solv desolvation potential (A),
iDock (B), and Autodock Vina (C). All docking was performed with the native conformation
of a ligand as an input.
(PDF)
S11 Fig. Comparison of the performance of three scoring functions—rDock dock_solv,
LigandRNA, and AnnapuRNA, expressed as a RMSD to the reference pose of best in scored
poses (pane A) and best in top five scored poses (S(5), pane B), calculated for four docking pro-
grams. The fourth column represents the best (lowest) RMSD obtained during docking for
each program. Each dot represents one complex from the testing set. Docking was performed
with the native conformation of a ligand as an input.
(PDF)
S12 Fig. Comparison of the performance of three scoring functions (rDock dock_solv,
LigandRNA, and AnnapuRNA) expressed as the average SR values. SR(X,C) indicates if a
given docking was successful (i.e., in top X scoring poses there was at least one pose with
RMSD� C Å). The first column represents the performance obtained when the random poses
are selected (the negative control). The last column represents the performance obtained when
poses are ranked by the RMSD to the reference structure (positive control). Horizontal lines
represent 95% bootstrapped confidence intervals. Docking was performed with the native con-
formation of a ligand as an input.
(PNG)
S13 Fig. Comparison of the performance of three scoring functions, expressed as a RMSD
to the reference pose of best in scored poses (pane A) and best in top five scored poses (S(5), pane B), calculated for three conformer generation methods. The fourth column repre-
sents the best (lowest) RMSD obtained during docking for each program. Each dot represents
one complex from the testing set. Docking was performed using rDock with the dock desolva-
tion potential.
(PDF)
S14 Fig. Comparison of the performance of three scoring functions (rDock dock_solv,
LigandRNA, and AnnapuRNA) expressed as the average SR values. SR(X,C) indicates if a
given docking was successful (i.e., in top X scoring poses there was at least one pose with
RMSD� C Å). The first column represents the performance obtained when the random poses
are selected (the negative control). The last column represents the performance obtained when
poses are ranked by the RMSD to the reference structure (positive control). Horizontal lines
represent 95% bootstrapped confidence intervals. Docking was performed using rDock with
the dock desolvation potential.
(PNG)
S15 Fig. The best in the three top-scored solutions in redocking experiment (PDB ID:
1KOC) selected by the AnnapuRNA method without post processing (A), with clustering
(AutoDock-like’ with 2 Å threshold, best in the three top-scored solutions, pane B),
PLOS COMPUTATIONAL BIOLOGY AnnapuRNA: A scoring function for predicting RNA-small molecule binding poses
PLOS Computational Biology | https://doi.org/10.1371/journal.pcbi.1008309 February 1, 2021 24 / 31
averaging the structure (C), and local optimization of the averaged ligand structure (D).
RNA molecules are presented as a gray cartoon, ligands as sticks, heteroatoms are colored: O
—red, N—blue, the reference ligand is green. Docking was performed using rDock with dock
desolvation potential with the native conformation of a ligand as an input, and rescored using
the AnnapuRNA DL 2016 method.
(TIF)
S16 Fig. Docking poses processing time (rDock docking program, 100 poses per complex;
time on logarithmic scale) for three scoring functions—LigandRNA developed earlier in
our group and the new scoring function in two variants (kNN and DL).
(PNG)
S17 Fig. Correlation coefficient values (RMSD vs score) of nine scoring functions obtained
for a testing set, expressed as a Spearman’s rank correlation coefficient (left panes), Pear-
son correlation coefficient (middle panes), and Kendall rank correlation coefficient (right
panes). Additional rows represent the internal scoring function of the docking program
(Internal SF). Each dot represents one complex from the testing set. Docking was performed
using rDock with the dock and dock_solv desolvation potentials (A and B, respectively), iDock
(B), and Autodock Vina (C). All docking was performed with native conformation of a ligand
as an input.
(PDF)
S1 Table. Structures (PDB IDs and ligands IDs) used in the “2013” dataset, the “2016”
dataset, and the testing set. For the cases, where PDB database mistakenly separated cocrys-
tallized ligand into several chunks, the ligand was concatenated into a single molecule and
ligand ID was indicated as “ligand”. E.g., for complex 1QD3, PDB database indicates four sepa-
rated ligands (BDG, CYY, IDG, and RIB) instead of a single Neomycin B molecule. x for com-
plexes from the testing set rDock docking program was not able to perform docking and
generate poses.
(PDF)
S2 Table. List of pairs of complexes with the same or very similar ligand (fingerprint simi-
larity = 100%), sequence identity > = 90% and RMSD < = 5 Å.
(PDF)
S3 Table. Comparison of the new structures used in the 2016 dataset with structures in the
2013 dataset.
(PDF)
S4 Table. List of contact groups (base—RNA atom—ligand pseudoatom) for which
machine learning models were built and used for scoring.
(PDF)
S5 Table. Hyperparameter search space for machine learning methods.
(PDF)
S6 Table. Performance of scoring functions derived with five machine learning methods,
based on four different interaction distance cutoffs. S(3) is the averaged value for the cross-
validation experiment.
(PDF)
S7 Table. Influence on the input data transformation—distance binning and angle binning
or cosine transformation and binning, on the performance of scoring functions. S(3) is the
PLOS COMPUTATIONAL BIOLOGY AnnapuRNA: A scoring function for predicting RNA-small molecule binding poses
PLOS Computational Biology | https://doi.org/10.1371/journal.pcbi.1008309 February 1, 2021 25 / 31
averaged value for the cross-validation experiment.
(PDF)
S8 Table. Influence on the interaction probability transformations on the performance of
scoring functions. S(3) is the averaged value for cross-validation experiment.
(PDF)
S9 Table. Comparison of two noise removal methods: Edited Nearest Neighbors (ENN)
and Tomek’s links (TL) on the performance of two scoring functions, expressed as S(3).
(PDF)
S10 Table. Comparison of the performance of two scoring functions (DL and kNN) for
various weights of the ligand term (w).
(PDF)
S11 Table. Summary of the performance, expressed as a RMSD of the best selected pose to
the reference pose (S(1)), S(3), and S(5), together with standard deviation values, for nine
tested scoring functions. Values represent averages for the testing set. Docking was per-
formed using rDock with the dock desolvation potential, with the native conformation of a
ligand as an input.
(PDF)
S12 Table. Comparison of the performance of scoring functions for the full testing set and
the non-redundant testing set (a full testing set with excluded four structures similar to
the training set—the same or very similar ligand, sequence identity > = 90% and RMSD <
= 5 Å). Values are highlighted for cases, where the performance is worse for the non-redun-
dant testing set than for the full testing set.
(PDF)
S13 Table. SR values for all combinations of conformer generation programs, docking pro-
grams, and scoring functions for the training set.
(PDF)
S14 Table. Lowest RMSD reported for each of the four docking programs. Docking was
performed using a native conformation of a ligand as an input. If for a given structure a pro-
gram was not able to complete the docking successfully, the row was grayed out. If for a given
structure a docking program was not able to find a solution with RMSD� 10 Å, the row was
marked red. The bottom rows summarizes the performance for all data presented (A), only for
a set of structures, for which all programs completed docking (B), and only for a set of struc-
tures, for which RMSD values of poses found by all programs were below or equal to 10 Å (C).
(PDF)
S15 Table. Comparison of scoring performance for a combination of four docking meth-
ods, with ten scoring functions. Additional column ([RMSD]) shows the lowest RMSD poses
obtained during docking. Docking was performed with the native conformation of a ligand as
an input.
(PDF)
S16 Table. Comparison of the performance of three scoring functions (rDock dock_solv,
LigandRNA, and AnnapuRNA) expressed as the average SR values. SR(X,C) indicates if a
given docking was successful (i.e., in top X scoring poses there was at least one pose with
RMSD� C Å). The first column represents the performance obtained when the random poses
are selected (the negative control). The last column represents the performance obtained when
PLOS COMPUTATIONAL BIOLOGY AnnapuRNA: A scoring function for predicting RNA-small molecule binding poses
PLOS Computational Biology | https://doi.org/10.1371/journal.pcbi.1008309 February 1, 2021 26 / 31
poses are ranked by the RMSD to the reference structure (positive control). Docking was per-
formed with the native conformation of a ligand as an input.
(PDF)
S17 Table. Comparison of the performance of three scoring functions (rDock dock_solv,
LigandRNA, and AnnapuRNA) expressed as the average SR values. SR(X,C) indicates if a
given docking was successful (i.e., in top X scoring poses there was at least one pose with
RMSD� C Å). The first column represents the performance obtained when the random poses
are selected (the negative control). The last column represents the performance obtained when
poses are ranked by the RMSD to the reference structure (positive control). Docking was per-
formed using rDock with the dock desolvation potential.
(PDF)
S18 Table. Comparison of scoring performance for a combination of three methods of
conformer generation, with four docking programs, with ten scoring functions. Additional
column ([RMSD]) shows the lowest RMSD poses obtained during the docking.
(PDF)
S19 Table. Comparison of the performance of AnnapuRNA scoring functions for the
‘AutoDock-like’ clustering (100% of poses and 2 Å RMSD threshold). Docking was per-
formed using rDock with the dock desolvation potential with the native conformation of a
ligand as an input.
(PDF)
S20 Table. Docking poses processing time (rDock docking program, 100 poses per com-
plex) for three scoring functions—LigandRNA developed earlier in our group and the new
scoring function in two variants (kNN and DL).
(PDF)
S21 Table. Mean and median correlation coefficient values (RMSD vs. score values)
obtained for a testing set of nine scoring functions, expressed as a Spearman’s rank corre-
lation coefficient, Pearson correlation coefficient, and Kendall rank correlation coefficient.
Additional rows represent the internal scoring function of the docking program (Internal SF).
All docking was performed with native conformation of a ligand as an input.
(PDF)
S1 Text. Additional information. Optimization of parameters of the scoring function; post-
processing of docking poses; additional information on docking algorithms.
(PDF)
Acknowledgments
We thank Katarzyna Merdas (IIMCB) and J. Mahita (Dartmouth College, New Hampshire,
USA) for critical reading and proof-reading of the manuscript. We thank Anna Philips for
help with LigandRNA and other members of the Bujnicki laboratory for their help. We also
thank the StackOverflow community (https://stackoverflow.com/) for support and building a
useful knowledge resource.
Author Contributions
Conceptualization: Janusz M. Bujnicki.
Data curation: Filip Stefaniak.
PLOS COMPUTATIONAL BIOLOGY AnnapuRNA: A scoring function for predicting RNA-small molecule binding poses
PLOS Computational Biology | https://doi.org/10.1371/journal.pcbi.1008309 February 1, 2021 27 / 31
Formal analysis: Filip Stefaniak.
Funding acquisition: Janusz M. Bujnicki.
Investigation: Filip Stefaniak.
Methodology: Filip Stefaniak, Janusz M. Bujnicki.
Project administration: Filip Stefaniak, Janusz M. Bujnicki.
Resources: Janusz M. Bujnicki.
Software: Filip Stefaniak.
Supervision: Janusz M. Bujnicki.
Validation: Janusz M. Bujnicki.
Visualization: Filip Stefaniak.
Writing – original draft: Filip Stefaniak, Janusz M. Bujnicki.
Writing – review & editing: Filip Stefaniak, Janusz M. Bujnicki.
References1. Atkins JF, Gesteland RF, Cech T. RNA Worlds: From Life’s Origins to Diversity in Gene Regulation.
2011.
2. Tor Y. RNA and the Small Molecule World. Angew Chem Int Ed Engl. 1999; 38: 1579–1582. https://doi.
org/10.1002/(SICI)1521-3773(19990601)38:11<1579::AID-ANIE1579>3.0.CO;2-H PMID: 29710996
3. Thomas JR, Hergenrother PJ. Targeting RNA with Small Molecules. Chem Rev. 2008; 108: 1171–
1224. https://doi.org/10.1021/cr0681546 PMID: 18361529
4. Wilson WD, Li K. Targeting RNA with small molecules. Curr Med Chem. 2000; 7: 73–98. https://doi.org/
10.2174/0929867003375434 PMID: 10637358
5. Poehlsgaard J, Douthwaite S. The bacterial ribosome as a target for antibiotics. Nat Rev Microbiol.
2005; 3: 870–881. https://doi.org/10.1038/nrmicro1265 PMID: 16261170
6. Blount KF, Breaker RR. Riboswitches as antibacterial drug targets. Nat Biotechnol. 2006; 24: 1558–
1564. https://doi.org/10.1038/nbt1268 PMID: 17160062
7. Montange RK, Batey RT. Riboswitches: emerging themes in RNA structure and function. Annu Rev Bio-
phys. 2008; 37: 117–133. https://doi.org/10.1146/annurev.biophys.37.032807.130000 PMID:
18573075
8. Winkler WC, Cohen-Chalamish S, Breaker RR. An mRNA structure that controls gene expression by
binding FMN. Proc Natl Acad Sci U S A. 2002; 99: 15908–15913. https://doi.org/10.1073/pnas.
212628899 PMID: 12456892
9. Otani S, Takatsu M, Nakano M, Kasai S, Miura R. Letter: Roseoflavin, a new antimicrobial pigment from
Streptomyces. J Antibiot. 1974; 27: 86–87. PMID: 4843053
10. Lee ER, Blount KF, Breaker RR. Roseoflavin is a natural antibacterial compound that binds to FMN
riboswitches and regulates gene expression. RNA Biol. 2009; 6: 187–194. https://doi.org/10.4161/rna.
6.2.7727 PMID: 19246992
11. Blount KF, Megyola C, Plummer M, Osterman D, O’Connell T, Aristoff P, et al. Novel riboswitch-binding
flavin analog that protects mice against Clostridium difficile infection without inhibiting cecal flora. Anti-
microb Agents Chemother. 2015; 59: 5736–5746. https://doi.org/10.1128/AAC.01282-15 PMID:
26169403
12. Howe JA, Wang H, Fischmann TO, Balibar CJ, Xiao L, Galgoci AM, et al. Selective small-molecule inhi-
bition of an RNA structural element. Nature. 2015; 526: 672–677. https://doi.org/10.1038/nature15542
PMID: 26416753
13. Ennifar E, Paillart J-C, Bodlenner A, Walter P, Weibel J-M, Aubertin A-M, et al. Targeting the dimeriza-
tion initiation site of HIV-1 RNA with aminoglycosides: from crystal to cell. Nucleic Acids Res. 2006; 34:
2328–2339. https://doi.org/10.1093/nar/gkl317 PMID: 16679451
14. Park IK, Kim JY, Lim EH, Shin S. Spectinomycin Inhibits the Self-Splicing of the Group 1 Intron RNA.
Biochem Biophys Res Commun. 2000; 269: 574–579. https://doi.org/10.1006/bbrc.2000.2336 PMID:
10708596
PLOS COMPUTATIONAL BIOLOGY AnnapuRNA: A scoring function for predicting RNA-small molecule binding poses
PLOS Computational Biology | https://doi.org/10.1371/journal.pcbi.1008309 February 1, 2021 28 / 31
15. Fedorova O, Jagdmann GE Jr, Adams RL, Yuan L, Van Zandt MC, Pyle AM. Small molecules that tar-
get group II introns are potent antifungal agents. Nat Chem Biol. 2018; 14: 1073–1078. https://doi.org/
10.1038/s41589-018-0142-0 PMID: 30323219
16. Chen PJ, Wu HL, Wang CJ, Chia JH, Chen DS. Molecular biology of hepatitis D virus: research and
potential for application. J Gastroenterol Hepatol. 1997; 12: S188–92. https://doi.org/10.1111/j.1440-
1746.1997.tb00500.x PMID: 9407337
17. Hermann T. Small molecules targeting viral RNA. Wiley Interdiscip Rev RNA. 2016; 7: 726–743. https://
doi.org/10.1002/wrna.1373 PMID: 27307213
18. Ponce-Salvatierra A, Astha, Merdas K, Nithin C, Ghosh P, Mukherjee S, et al. Computational modeling
of RNA 3D structure based on experimental data. Biosci Rep. 2019; 39. https://doi.org/10.1042/
BSR20180430 PMID: 30670629
19. Stefaniak F, Chudyk EI, Bodkin M, Dawson WK, Bujnicki JM. Modeling of ribonucleic acid-ligand inter-
actions. Wiley Interdiscip Rev Comput Mol Sci. 2015; 5: 425–439.
20. Ferreira L, dos Santos R, Oliva G, Andricopulo A. Molecular Docking and Structure-Based Drug Design
Strategies. Molecules. 2015; 20: 13384–13421. https://doi.org/10.3390/molecules200713384 PMID:
26205061
21. Pagadala NS, Syed K, Tuszynski J. Software for molecular docking: a review. Biophys Rev. 2017; 9:
91–102. https://doi.org/10.1007/s12551-016-0247-1 PMID: 28510083
22. Goodsell DS, Morris GM, Olson AJ. Automated docking of flexible ligands: applications of AutoDock. J
Mol Recognit. 1996; 9: 1–5. https://doi.org/10.1002/(sici)1099-1352(199601)9:1<1::aid-jmr241>3.0.
co;2-6 PMID: 8723313
23. Trott O, Olson AJ. AutoDock Vina: Improving the speed and accuracy of docking with a new scoring
function, efficient optimization, and multithreading. Journal of Computational Chemistry. 2009; NA–NA.
24. Abagyan R, Totrov M, Kuznetsov D. ICM-A new method for protein modeling and design: Applications
to docking and structure prediction from the distorted native conformation. J Comput Chem. 1994; 15:
488–506.
25. Li H, Leung K-S, Wong M-H. idock: A multithreaded virtual screening tool for flexible ligand docking.
2012. https://doi.org/10.1109/cibcb.2012.6217214
26. Lang PT, Brozell SR, Mukherjee S, Pettersen EF, Meng EC, Thomas V, et al. DOCK 6: combining tech-
niques to model RNA-small molecule complexes. RNA. 2009; 15: 1219–1230. https://doi.org/10.1261/
rna.1563609 PMID: 19369428
27. Filikov AV, Mohan V, Vickers TA, Griffey RH, Cook PD, Abagyan RA, et al. Identification of ligands for
RNA targets via structure-based virtual screening: HIV-1 TAR. J Comput Aided Mol Des. 2000; 14:
593–610. https://doi.org/10.1023/a:1008121029716 PMID: 10921774
28. Moitessier N, Westhof E, Hanessian S. Docking of Aminoglycosides to Hydrated and Flexible RNA. J
Med Chem. 2006; 49: 1023–1033. https://doi.org/10.1021/jm0508437 PMID: 16451068
29. Guilbert C, James TL. Docking to RNA via root-mean-square-deviation-driven energy minimization with
flexible ligands and flexible targets. J Chem Inf Model. 2008; 48: 1257–1268. https://doi.org/10.1021/
ci8000327 PMID: 18510306
30. Ruiz-Carmona S, Alvarez-Garcia D, Foloppe N, Garmendia-Doval AB, Juhos S, Schmidtke P, et al.
rDock: a fast, versatile and open source program for docking ligands to proteins and nucleic acids.
PLoS Comput Biol. 2014; 10: e1003571. https://doi.org/10.1371/journal.pcbi.1003571 PMID: 24722481
31. Morley SD, David Morley S, Afshar M. Validation of an empirical RNA-ligand scoring function for fast
flexible docking using RiboDock®. J Comput Aided Mol Des. 2004; 18: 189–208. https://doi.org/10.
1023/b:jcam.0000035199.48747.1e PMID: 15368919
32. Pfeffer P, Gohlke H. DrugScoreRNA—knowledge-based scoring function to predict RNA-ligand interac-
tions. J Chem Inf Model. 2007; 47: 1868–1876. https://doi.org/10.1021/ci700134p PMID: 17705464
33. Yan Z, Wang J. SPA-LN: a scoring function of ligand–nucleic acid interactions via optimizing both speci-
ficity and affinity. Nucleic Acids Res. 2017; 45: e110–e110. https://doi.org/10.1093/nar/gkx255 PMID:
28431169
34. Chen L, Calin GA, Zhang S. Novel insights of structure-based modeling for RNA-targeted drug discov-
ery. J Chem Inf Model. 2012; 52: 2741–2753. https://doi.org/10.1021/ci300320t PMID: 22947071
35. Philips A, Milanowska K, Lach G, Bujnicki JM. LigandRNA: computational predictor of RNA-ligand inter-
actions. RNA. 2013; 19: 1605–1616. https://doi.org/10.1261/rna.039834.113 PMID: 24145824
36. Chhabra S, Xie J, Frank AT. RNAPosers: Machine Learning Classifiers for Ribonucleic Acid–Ligand
Poses. J Phys Chem B. 2020; 124: 4436–4445. https://doi.org/10.1021/acs.jpcb.0c02322 PMID:
32427491
PLOS COMPUTATIONAL BIOLOGY AnnapuRNA: A scoring function for predicting RNA-small molecule binding poses
PLOS Computational Biology | https://doi.org/10.1371/journal.pcbi.1008309 February 1, 2021 29 / 31
37. Noid WG. Perspective: Coarse-grained models for biomolecular systems. J Chem Phys. 2013; 139:
090901. https://doi.org/10.1063/1.4818908 PMID: 24028092
38. Wojcikowski M, Zielenkiewicz P, Siedlecki P. Open Drug Discovery Toolkit (ODDT): a new open-source
player in the drug discovery field. J Cheminform. 2015; 7: 26. https://doi.org/10.1186/s13321-015-0078-
2 PMID: 26101548
39. Ashtawy HM, Mahapatra NR. Machine-learning scoring functions for identifying native poses of ligands
docked to known and novel proteins. BMC Bioinformatics. 2015; 16 Suppl 6: S3.
40. Sutherland JJ, Nandigam RK, Erickson JA, Vieth M. Lessons in Molecular Recognition. 2. Assessing
and Improving Cross-Docking Accuracy. J Chem Inf Model. 2007; 47: 2293–2302. https://doi.org/10.
1021/ci700253h PMID: 17956084
41. Vicens Q, Mondragon E, Reyes FE, Coish P, Aristoff P, Berman J, et al. Structure–Activity Relationship
of Flavin Analogues That Target the Flavin Mononucleotide Riboswitch. ACS Chem Biol. 2018; 13:
2908–2919. https://doi.org/10.1021/acschembio.8b00533 PMID: 30107111
42. Vicens Q, Mondragon E, Batey RT. Molecular sensing by the aptamer domain of the FMN riboswitch: a
general model for ligand binding by conformational selection. Nucleic Acids Res. 2011; 39: 8586–8598.
https://doi.org/10.1093/nar/gkr565 PMID: 21745821
43. Gorb L, Kuz’min V, Muratov E. Application of Computational Techniques in Pharmacy and Medicine.
Springer; 2014.
44. Magnus M, Antczak M, Zok T, Wiedemann J, Lukasiak P, Cao Y, et al. RNA-Puzzles toolkit: a computa-
tional resource of RNA 3D structure benchmark datasets, structure manipulation, and evaluation tools.
Nucleic Acids Res. 2020; 48: 576–588. https://doi.org/10.1093/nar/gkz1108 PMID: 31799609
45. Bank RPD. RCSB PDB—REST Web Service. [cited 2 Apr 2020]. Available: http://www.rcsb.org/pdb/
software/rest.do
46. Zaret KS. Using small molecules to great effect in stem cell differentiation. Cell stem cell. 2009. pp.
373–374. https://doi.org/10.1016/j.stem.2009.04.012 PMID: 19427285
47. Lipinski CA, Lombardo F, Dominy BW, Feeney PJ. Experimental and computational approaches to esti-
mate solubility and permeability in drug discovery and development settings. Adv Drug Deliv Rev. 1997;
23: 3–25.
48. Walters WP, Murcko MA. Prediction of “drug-likeness.” Adv Drug Deliv Rev. 2002; 54: 255–271. https://
doi.org/10.1016/s0169-409x(02)00003-0 PMID: 11922947
49. Dougherty TJ, Pucci MJ. Antibiotic Discovery and Development. Springer Science & Business Media;
2011.
50. O’Boyle NM, Banck M, James CA, Morley C, Vandermeersch T, Hutchison GR. Open Babel: An open
chemical toolbox. J Cheminform. 2011; 3: 33. https://doi.org/10.1186/1758-2946-3-33 PMID: 21982300
51. Plewczynski D, Łaźniewski M, von Grotthuss M, Rychlewski L, Ginalski K. VoteDock: consensus dock-
ing method for prediction of protein-ligand interactions. J Comput Chem. 2011; 32: 568–581. https://doi.
org/10.1002/jcc.21642 PMID: 20812324
52. Cole JC, Murray CW, Nissink JWM, Taylor RD, Taylor R. Comparing protein-ligand docking programs
is difficult. Proteins: Structure, Function, and Bioinformatics. 2005; 60: 325–332. https://doi.org/10.
1002/prot.20497 PMID: 15937897
53. Taminau J, Thijs G, De Winter H. Pharao: Pharmacophore alignment and optimization. J Mol Graph
Model. 2008; 27: 161–169. https://doi.org/10.1016/j.jmgm.2008.04.003 PMID: 18485770
54. Boniecki MJ, Lach G, Dawson WK, Tomala K, Lukasz P, Soltysinski T, et al. SimRNA: a coarse-grained
method for RNA folding simulations and 3D structure prediction. Nucleic Acids Res. 2016; 44: e63.
https://doi.org/10.1093/nar/gkv1479 PMID: 26687716
55. Rother M, Rother K, Puton T, Bujnicki JM. RNA tertiary structure prediction with ModeRNA. Brief Bioin-
form. 2011; 12: 601–613. https://doi.org/10.1093/bib/bbr050 PMID: 21896613
56. Rother M, Milanowska K, Puton T, Jeleniewicz J, Rother K, Bujnicki JM. ModeRNA server: an online
tool for modeling RNA 3D structures. Bioinformatics. 2011; 27: 2441–2442. https://doi.org/10.1093/
bioinformatics/btr400 PMID: 21727140
57. Wilson DL. Asymptotic Properties of Nearest Neighbor Rules Using Edited Data. IEEE Trans Syst Man
Cybern. 1972; SMC-2: 408–421.
58. Lemaıtre G, Nogueira F, Aridas CK. Imbalanced-learn: A Python Toolbox to Tackle the Curse of Imbal-
anced Datasets in Machine Learning. J Mach Learn Res. 2017; 18: 559–563.
59. Pedregosa F. and Varoquaux G. and Gramfort A. and Michel V. and Thirion B. and Grisel O. and Blon-
del M. and Prettenhofer P. and Weiss R. and Dubourg V. and Vanderplas J. and Passos A. and Courna-
peau D. and Brucher M. and Perrot M. and Duchesnay E. Scikit-learn: Machine Learning in Python. J
Mach Learn Res. 2011; 12: 2825–2830.
PLOS COMPUTATIONAL BIOLOGY AnnapuRNA: A scoring function for predicting RNA-small molecule binding poses
PLOS Computational Biology | https://doi.org/10.1371/journal.pcbi.1008309 February 1, 2021 30 / 31
60. Wang J, Wolf RM, Caldwell JW, Kollman PA, Case DA. Development and testing of a general amber
force field. J Comp Chem. 2004; 25: 1157–1174. https://doi.org/10.1002/jcc.20035 PMID: 15116359
61. Wojcikowski M, Ballester PJ, Siedlecki P. Performance of machine-learning scoring functions in struc-
ture-based virtual screening. Sci Rep. 2017; 7: 46710. https://doi.org/10.1038/srep46710 PMID:
28440302
62. Vainio MJ, Johnson MS. Generating conformer ensembles using a multiobjective genetic algorithm. J
Chem Inf Model. 2007; 47: 2462–2474. https://doi.org/10.1021/ci6005646 PMID: 17892278
63. Berthold MR, Cebron N, Dill F, Gabriel TR, Kotter T, Meinl T, et al. KNIME: The Konstanz Information
Miner. Data Analysis, Machine Learning and Applications. 2008; 319–326.
64. The pandas development team. pandas. 2020. https://doi.org/10.5281/zenodo.3509134
PLOS COMPUTATIONAL BIOLOGY AnnapuRNA: A scoring function for predicting RNA-small molecule binding poses
PLOS Computational Biology | https://doi.org/10.1371/journal.pcbi.1008309 February 1, 2021 31 / 31


![[Credit] scoring : predicting, understanding and ... · [CREDIT] SCORING: PREDICTING, UNDERSTANDING AND EXPLAINING CONSUMER BEHAVIOUR By ROBERT HAMILTON ABSTRACT Th1s thesis stems](https://img.dokumen.tips/doc/110x75/5c6a4bd809d3f20f298c6297/credit-scoring-predicting-understanding-and-credit-scoring-predicting.jpg)