Embed Size (px)
Citation preview


Anna Conley and Courtney Waller, 4th Grade Teachers, Layne Elementary School

PLC Rounds at McFerran Elementary School
22 Participants
Pictured:McFerran Teachers,Sam Watkins, andKaren Napier

Jodi O’Bryan, Counselor and Brooke Burd, FRYSC Coordinator, Layne Elementary School

Joseph Wood, Assistant Principal, Layne Elementary School


Ron Marshall, Principal, and Jennifer Mulrooney, RTI Lead (Response to Intervention Lead), Layne Elementary School

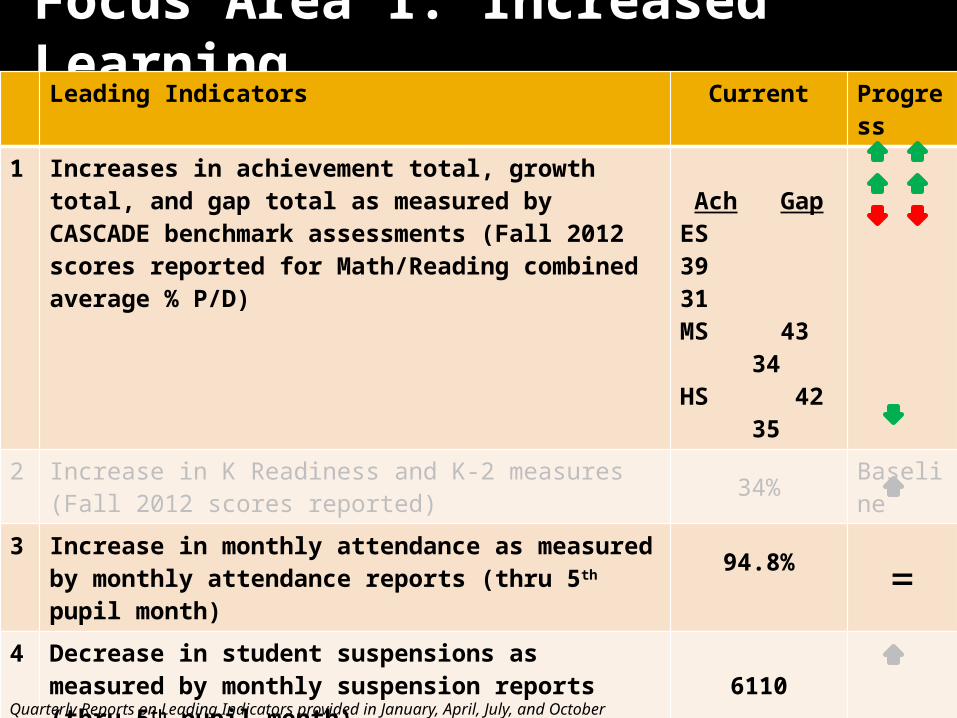
Focus Area 1: Increased LearningLeading Indicators Current Progre
ss
1 Increases in achievement total, growth total, and gap total as measured by CASCADE benchmark assessments (Fall 2012 scores reported for Math/Reading combined average % P/D)
Ach GapES 39 31MS 43 34HS 42 35
2 Increase in K Readiness and K-2 measures (Fall 2012 scores reported) 34% Baselin
e
3 Increase in monthly attendance as measured by monthly attendance reports (thru 5th pupil month)
94.8% =4 Decrease in student suspensions as
measured by monthly suspension reports (thru 5th pupil month)
6110
5 Decrease in dropouts as measured by monthly withdrawal reports (thru 5th pupil month) 938
6 Increase in number of observed instructional best practices per month UPDATE: A walkthrough toolkit is currently being developed
TBD
7 Increase in number of completed Curriculum Management Audit actions (as reported thru January 2013)
20%
Quarterly Reports on Leading Indicators provided in January, April, July, and October

Priority Schools - CASCADE
Increases in achievement total, growth total, and gap total as measured by CASCADE benchmark assessments (Fall 2012 scores reported for Math/Reading combined average % P/D)
LEVEL ACHIEVEMENT GAP
MIDDLE 7 out of 8 7 out of 8
HIGH 6 out of 10 8 out of 10
HIGHLIGHTS (Currently showing at least a 5% gain using CASCADE):
ACHIEVEMENT – Frost MS, Western MS, Shawnee HS, Fairdale HS, Stuart MS, Thomas Jefferson MS, and Westport MS
GAP - Frost MS, Western MS, Shawnee HS, Waggener HS, Stuart MS, Thomas Jefferson MS, and Westport MS
Focus Area 1: Increased LearningLeading Indicators Current Progre
ss
1 Increases in achievement total, growth total, and gap total as measured by CASCADE benchmark assessments (Fall 2012 scores reported for Math/Reading combined average % P/D)
Ach GapES 39 31MS 43 34HS 42 35
2 Increase in K Readiness and K-2 measures (Fall 2012 scores reported) 34% Baselin
e
3 Increase in monthly attendance as measured by monthly attendance reports (thru 5th pupil month)
94.8% =4 Decrease in student suspensions as
measured by monthly suspension reports (thru 5th pupil month)
6110
5 Decrease in dropouts as measured by monthly withdrawal reports (thru 5th pupil month) 938
6 Increase in number of observed instructional best practices per month UPDATE: A walkthrough toolkit is currently being developed
TBD
7 Increase in number of completed Curriculum Management Audit actions (as reported thru January 2013)
20%
Quarterly Reports on Leading Indicators provided in January, April, July, and October
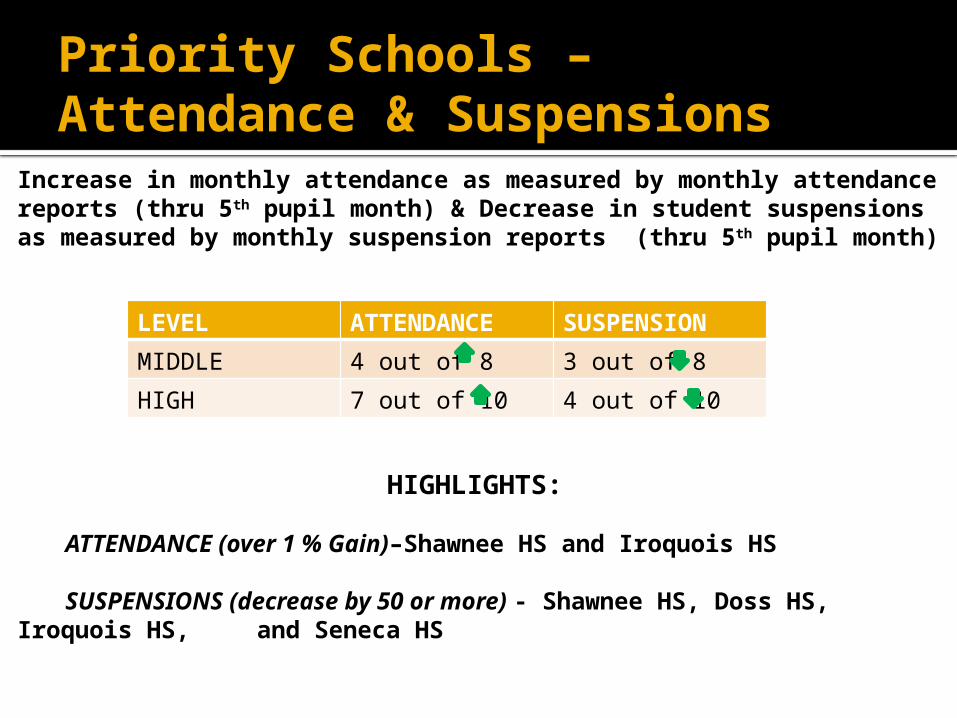
Priority Schools – Attendance & Suspensions
Increase in monthly attendance as measured by monthly attendance reports (thru 5th pupil month) & Decrease in student suspensions as measured by monthly suspension reports (thru 5th pupil month)
LEVEL ATTENDANCE SUSPENSION
MIDDLE 4 out of 8 3 out of 8
HIGH 7 out of 10 4 out of 10
HIGHLIGHTS:
ATTENDANCE (over 1 % Gain)–Shawnee HS and Iroquois HS
SUSPENSIONS (decrease by 50 or more) - Shawnee HS, Doss HS, Iroquois HS, and Seneca HS

Focus Area 2: Graduation and BeyondLeading Indicators Current Progres
s
1 Increase in the percentage of students reaching benchmarks on EXPLORE, PLAN, and ACT (2012 composite score reported)
EXPLORE – 14.6PLAN – 16.6ACT – 18.6
2 Increase in the percentage of students passing college placement tests (thru February 2013 compared with ¾ of 11-12 rate)
39%
3 Increase in the percentage of students receiving industry certifications or passing KOSSA (2012 scores reported)
2,855
4 Increase in the percentage of students enrolling in postsecondary institutions (reported as Any Time During the 1st Yr After High School on National Student Clearinghouse - 2011)
64%
5 Increase the number of students scoring 3 or better on Advanced Placement tests and scoring 24 or better on International Baccalaureate (IB) tests (2012 scores reported)
AP - 49.7%IB – 58.3%
6 Include survey indicators regarding the satisfaction as well as other skills (2012 CSS survey results reported):CSS – student satisfactionCSS – student preparedness for college
70.6%82.1%
Quarterly Reports on Leading Indicators provided in January, April, July, and October

College and Career Readiness Data*
2010 2011 201220253035404550556065
31 32
45.2
34
38
47.2
JCPSState
* without bonus

Priority Schools – College & Career Ready
Increase in the percentage of students passing college placement tests (thru February 2013 compared with ¾ of 11-12 rate)
LEVEL COLLEGE READY
MIDDLE 3 out of 8
HIGH 7 out of 10
HIGHLIGHTS:
Western MS over 10% gain and Westport MS over 7% gain
High Schools that are within 5% of passing 2012 College Readiness: Valley HS, Western HS (passed 2012), Fairdale HS, Southern HS, Waggener HS, and Seneca HS

Focus Area 3: Stakeholder Involvement &Engagement
Leading Indicators Current Progress
1 Increase in extended learning time as measured by the number of hours engaged in out-of-school time instruction on a monthly basis in the core content areas and ACT (Cumulative total through January 2013 for learning place students)
17.25 hours
2 Increase in number of enrichment opportunities/service learning to support student learning (reported through August 2012) UPDATE: Schools have been trained on data collection process and are now collecting data
11 hours Baseline
3 Increase in the use of the Parent Portal and parent contacts(reported as avg. number of weekly logins thru Jan 2013)
29,114
Quarterly Reports on Leading Indicators provided in January, April, July, and October

Parent Portal Logins Trend Data
Augu
st
Sept
embe
r
Octob
er
Novem
ber
Decem
ber
Janu
ary
-
5,000
10,000
15,000
20,000
25,000
30,000
35,000
40,000
2011-122012-13
Weekly
Avera
ge

Focus Area 4: Safe, Resourced, Supported, and Equipped SchoolsLeading Indicators Current Progress
1 Increase in percent of spending on items for school, increase in percent of total general fund directed at instruction, and decrease in spending unrelated to student achievement
School – 71%Instruction – 51%Business Offices - 4.2%
2 Increase in the retention and recruitment of high-quality staff as measured by retention rates, recruitment rates, and staff with advanced degrees or certifications
89.7% retained84% advanced degree recruitment data
3 Increase in the number of targeted professional development as measured by pdCentral (thru Feb 2013)
ParticipantsCC 9387PLCs 5824
4 Increased implementation of culturally responsive practices/principles and a decrease in race and poverty gaps on students’ sense of belonging as measured by survey data
Expected high impact on implementation – 57%Paid race gap-1.6%F/R race gap- 1.2%
Baseline
5 Increase in school safety as measured by discipline data, survey data, and school building safety assessment data
85% Feel safe2337 Safety Incidents 469 Bullying Incidents
Quarterly Reports on Leading Indicators provided in January, April, July, and October