Embed Size (px)
Citation preview
1
ANL – BSFC map predictionEngines 22-26StatusLars Böttcher, Panagiotis Grigoriadis, Berlin, 30th April 2019
© IAV ꞏ 02/2018 ꞏ LBo ꞏ TM-A2 @ Berlin

Content
2© IAV ꞏ 02/2018 ꞏ LBo ꞏ TM-A2 @ Berlin
• Engine 24 (VVT Miller eCharg. EGR)
• Engine 23b (VVL Miller VTG EGR)
• Engine 22b (Atkinson n.a.)
• Methodology
• Engine 26a (VCR EGR)
Content
3© IAV ꞏ 02/2018 ꞏ LBo ꞏ TM-A2 @ Berlin
• Engine 24 (VVT Miller eCharg. EGR)
• Engine 23b (VVL Miller VTG EGR)
• Engine 22b (Atkinson n.a.)
• Methodology
• Engine 26a (VCR EGR)
BMEP
in b
ar
0
1
2
3
4
5
6
7
8
9
10
11
12
13
14
15
16
Engine Speed in rpm1000 1500 2000 2500 3000 3500 4000 4500 5000 5500 6000 6500
465.8 488.7 469.9 498.2 507.4
336.7 321.9 327.4 332.3 345.3 381.0 406.5 450.5
292.2 274.0 275.3 280.3 289.6
269.5 256.4 256.8 258.4 266.5 288.1 296.9 318.7
261.3 234.4 236.6 238.2 239.7 257.3 265.1 286.1
255.1 252.6 226.4 227.5 228.0 242.6 253.3 271.6
290.3 301.2232.8 231.9 223.9 234.9 246.2 281.3
286.4283.3
299.9272.0 275.2 227.2 233.0 238.8 244.7 293.8
BSFC in g/kWh
4© IAV ꞏ 02/2018 ꞏ LBo ꞏ TM-A2 @ Berlin
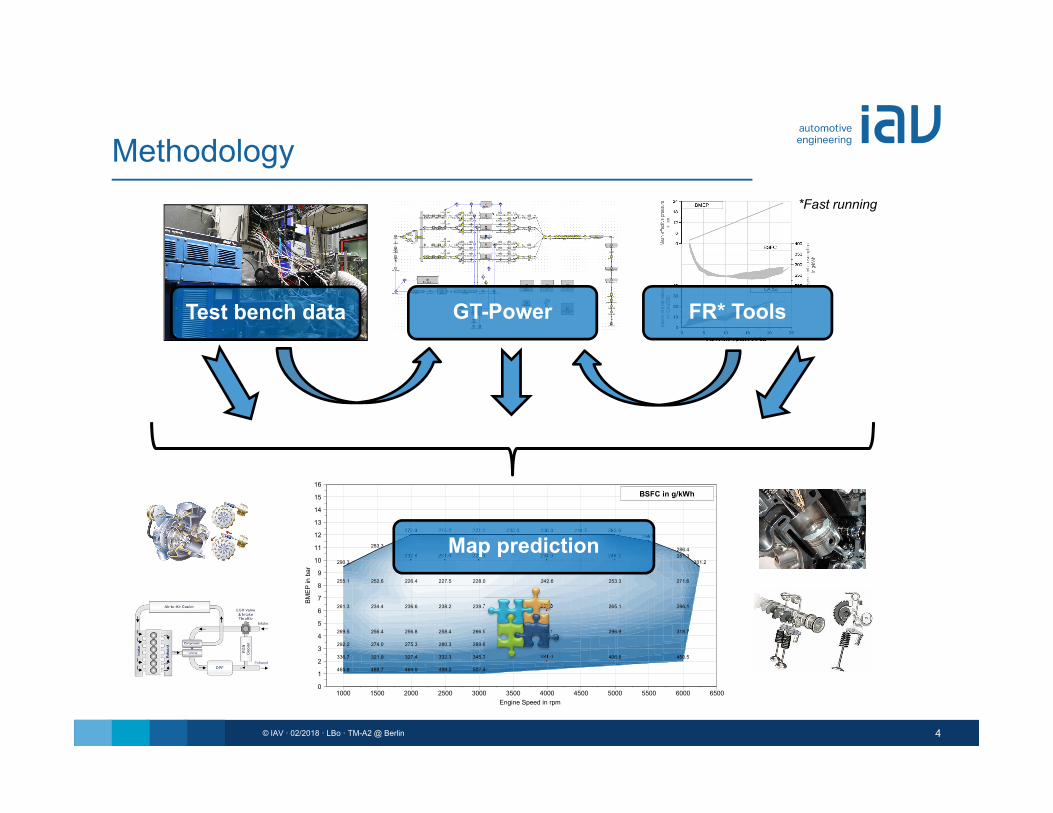
Methodology
GT-PowerTest bench data FR* Tools
Map prediction
*Fast running
5© IAV ꞏ 02/2018 ꞏ LBo ꞏ TM-A2 @ Berlin
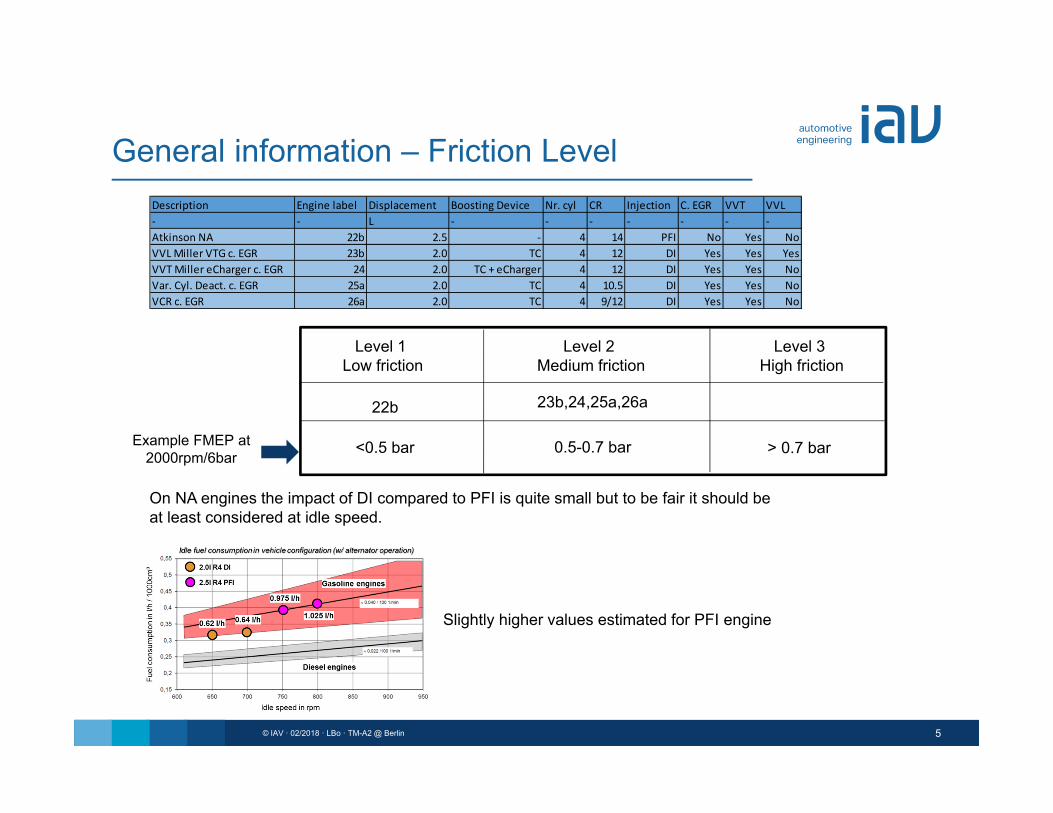
General information – Friction LevelDescription Engine label Displacement Boosting Device Nr. cyl CR Injection C. EGR VVT VVL‐ ‐ L ‐ ‐ ‐ ‐ ‐ ‐ ‐Atkinson NA 22b 2.5 ‐ 4 14 PFI No Yes NoVVL Miller VTG c. EGR 23b 2.0 TC 4 12 DI Yes Yes YesVVT Miller eCharger c. EGR 24 2.0 TC + eCharger 4 12 DI Yes Yes NoVar. Cyl. Deact. c. EGR 25a 2.0 TC 4 10.5 DI Yes Yes NoVCR c. EGR 26a 2.0 TC 4 9/12 DI Yes Yes No
Level 1 Low friction
Level 2 Medium friction
Level 3 High friction
22b
On NA engines the impact of DI compared to PFI is quite small but to be fair it should be at least considered at idle speed.
Slightly higher values estimated for PFI engine
23b,24,25a,26a
Example FMEP at 2000rpm/6bar <0.5 bar 0.5-0.7 bar > 0.7 bar
6© IAV ꞏ 02/2018 ꞏ LBo ꞏ TM-A2 @ Berlin
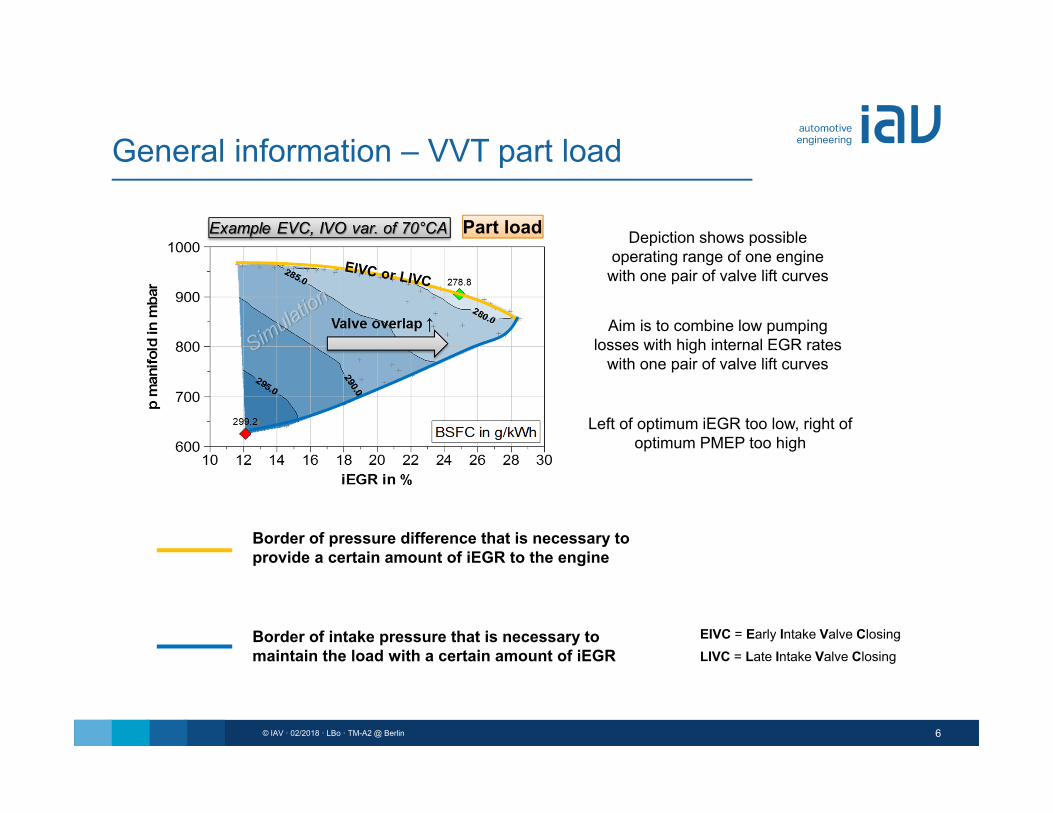
General information – VVT part load
Depiction shows possible operating range of one engine
with one pair of valve lift curves
Aim is to combine low pumping losses with high internal EGR rates
with one pair of valve lift curves
Part load
Border of pressure difference that is necessary to provide a certain amount of iEGR to the engine
Border of intake pressure that is necessary to maintain the load with a certain amount of iEGR
EIVC = Early Intake Valve ClosingLIVC = Late Intake Valve Closing
Left of optimum iEGR too low, right of optimum PMEP too high
7© IAV ꞏ 02/2018 ꞏ LBo ꞏ TM-A2 @ Berlin
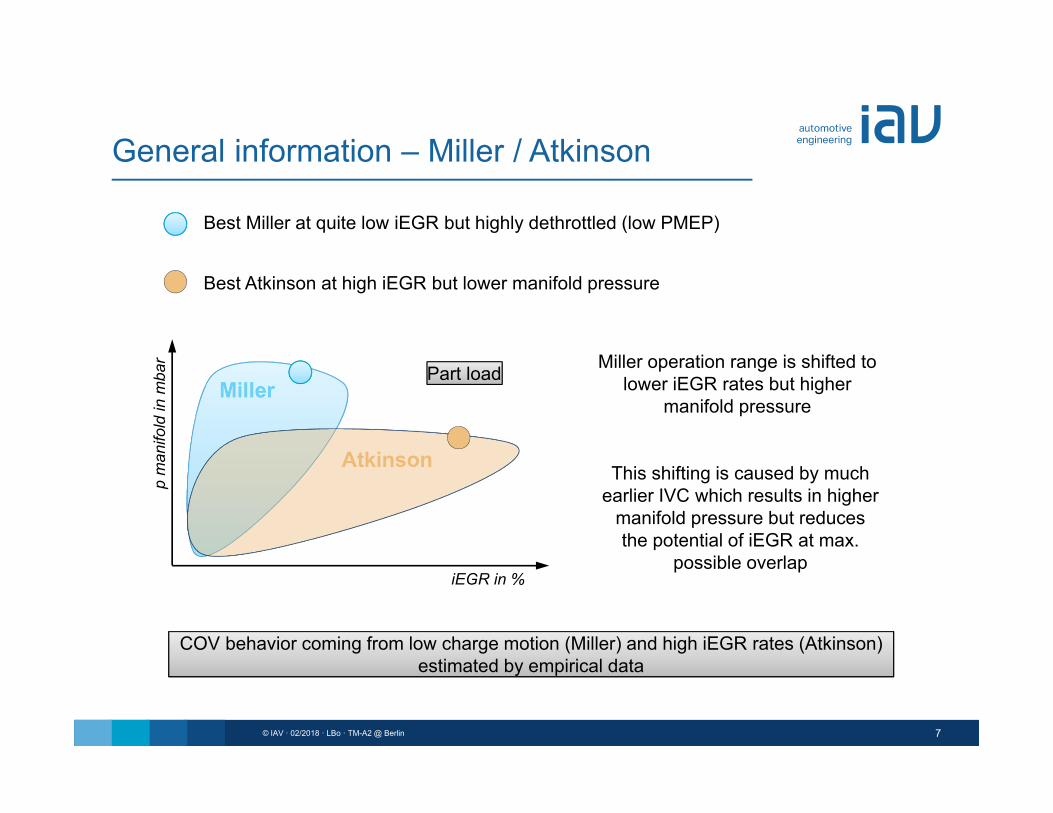
General information – Miller / Atkinson
iEGR in %
p m
anifo
ld in
mba
r
Best Miller at quite low iEGR but highly dethrottled (low PMEP)
Best Atkinson at high iEGR but lower manifold pressure
Part load Miller operation range is shifted to lower iEGR rates but higher
manifold pressure
This shifting is caused by much earlier IVC which results in higher
manifold pressure but reduces the potential of iEGR at max.
possible overlap
COV behavior coming from low charge motion (Miller) and high iEGR rates (Atkinson) estimated by empirical data
Content
8© IAV ꞏ 02/2018 ꞏ LBo ꞏ TM-A2 @ Berlin
• Engine 24 (VVT Miller eCharg. EGR)
• Engine 23b (VVL Miller VTG EGR)
• Engine 22b (Atkinson n.a.)
• Methodology
• Engine 26a (VCR EGR)
9© IAV ꞏ 02/2018 ꞏ LBo ꞏ TM-A2 @ Berlin
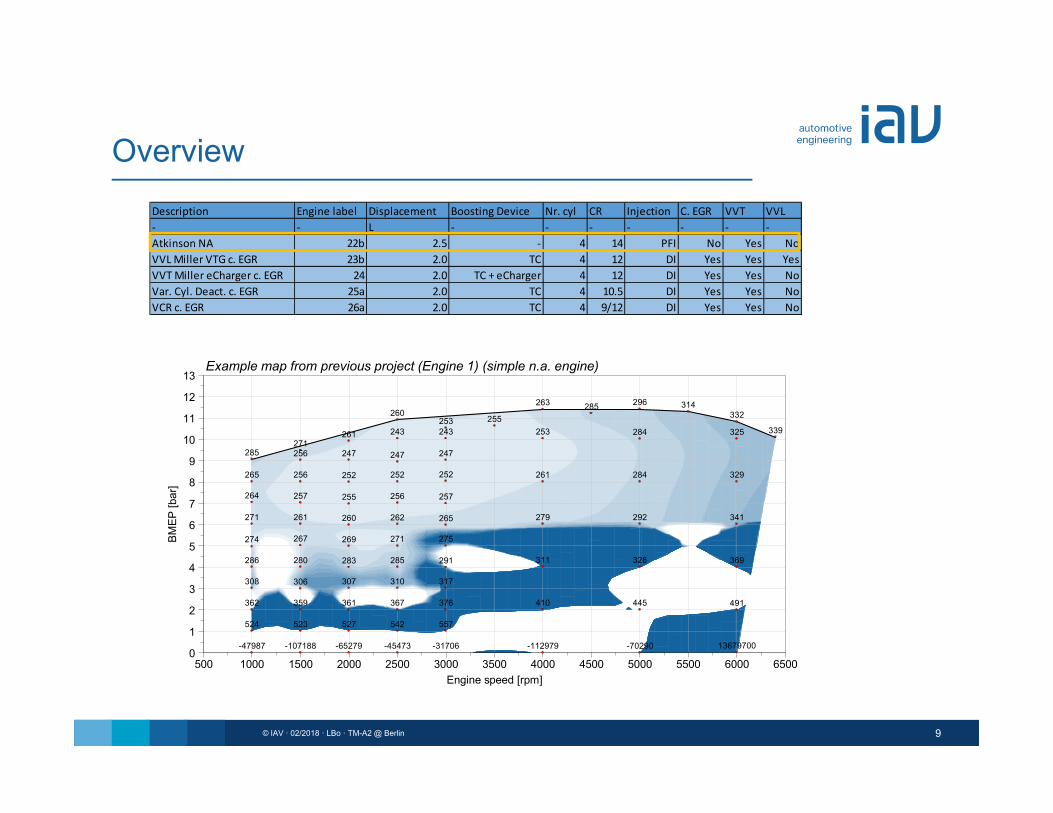
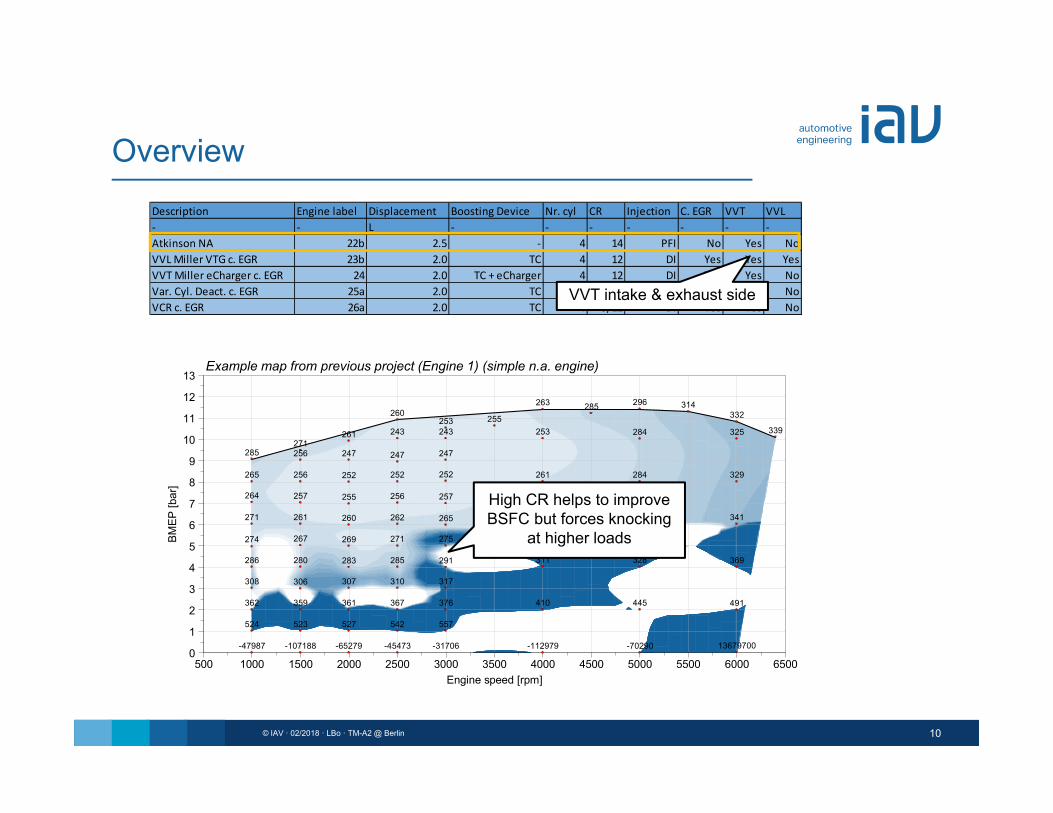
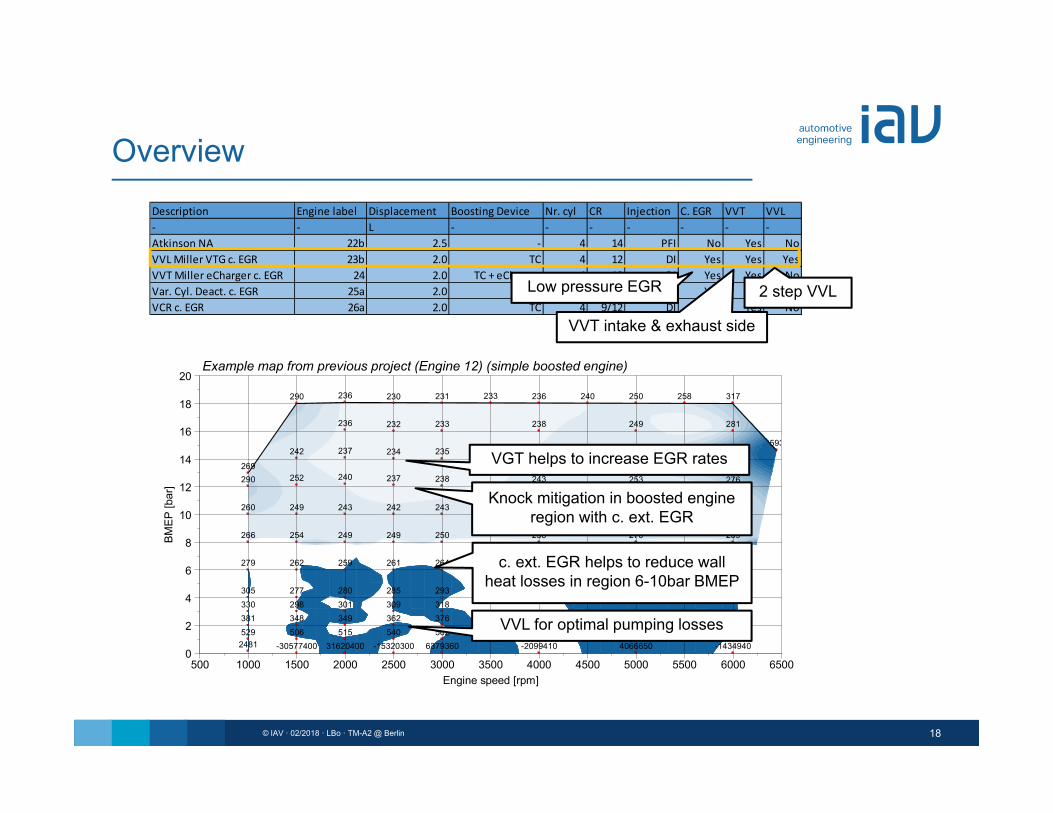
OverviewDescription Engine label Displacement Boosting Device Nr. cyl CR Injection C. EGR VVT VVL‐ ‐ L ‐ ‐ ‐ ‐ ‐ ‐ ‐Atkinson NA 22b 2.5 ‐ 4 14 PFI No Yes NoVVL Miller VTG c. EGR 23b 2.0 TC 4 12 DI Yes Yes YesVVT Miller eCharger c. EGR 24 2.0 TC + eCharger 4 12 DI Yes Yes NoVar. Cyl. Deact. c. EGR 25a 2.0 TC 4 10.5 DI Yes Yes NoVCR c. EGR 26a 2.0 TC 4 9/12 DI Yes Yes No
BMEP
[bar
]
0
1
2
3
4
5
6
7
8
9
10
11
12
13
Engine speed [rpm]500 1000 1500 2000 2500 3000 3500 4000 4500 5000 5500 6000 6500
-31706-45473 -70290-47987 -65279 -112979-107188 13679700
523 557542524 527
491362 376359 410367 445361
306308 310307 317
283 291280 285286 369328311
274 269 271 275267
265260 262 341279 292271 261
255 257256257264
252265 261256 329252 284252
247 247247256285271
261 325284253243 243 339253 255 332260
285 314263 296
Example map from previous project (Engine 1) (simple n.a. engine)
10© IAV ꞏ 02/2018 ꞏ LBo ꞏ TM-A2 @ Berlin
OverviewDescription Engine label Displacement Boosting Device Nr. cyl CR Injection C. EGR VVT VVL‐ ‐ L ‐ ‐ ‐ ‐ ‐ ‐ ‐Atkinson NA 22b 2.5 ‐ 4 14 PFI No Yes NoVVL Miller VTG c. EGR 23b 2.0 TC 4 12 DI Yes Yes YesVVT Miller eCharger c. EGR 24 2.0 TC + eCharger 4 12 DI Yes Yes NoVar. Cyl. Deact. c. EGR 25a 2.0 TC 4 10.5 DI Yes Yes NoVCR c. EGR 26a 2.0 TC 4 9/12 DI Yes Yes No
BMEP
[bar
]
0
1
2
3
4
5
6
7
8
9
10
11
12
13
Engine speed [rpm]500 1000 1500 2000 2500 3000 3500 4000 4500 5000 5500 6000 6500
-31706-45473 -70290-47987 -65279 -112979-107188 13679700
523 557542524 527
491362 376359 410367 445361
306308 310307 317
283 291280 285286 369328311
274 269 271 275267
265260 262 341279 292271 261
255 257256257264
252265 261256 329252 284252
247 247247256285271
261 325284253243 243 339253 255 332260
285 314263 296
Example map from previous project (Engine 1) (simple n.a. engine)
High CR helps to improve BSFC but forces knocking
at higher loads
VVT intake & exhaust side
11© IAV ꞏ 02/2018 ꞏ LBo ꞏ TM-A2 @ Berlin
Effects of higher CRBM
EP in
bar
0
2
4
6
8
10
12
14
16
18
20
22
24
26
Engine speed in rpm1000 1500 2000 2500 3000 3500 4000
0.0
-1.0 -2.0
-3.0
-0.5-1.5
-1.5
-2.5
-2.5
0.0
-1.0 -2.0
-3.0
-0.5-1.5
-1.5
-2.5
-2.5
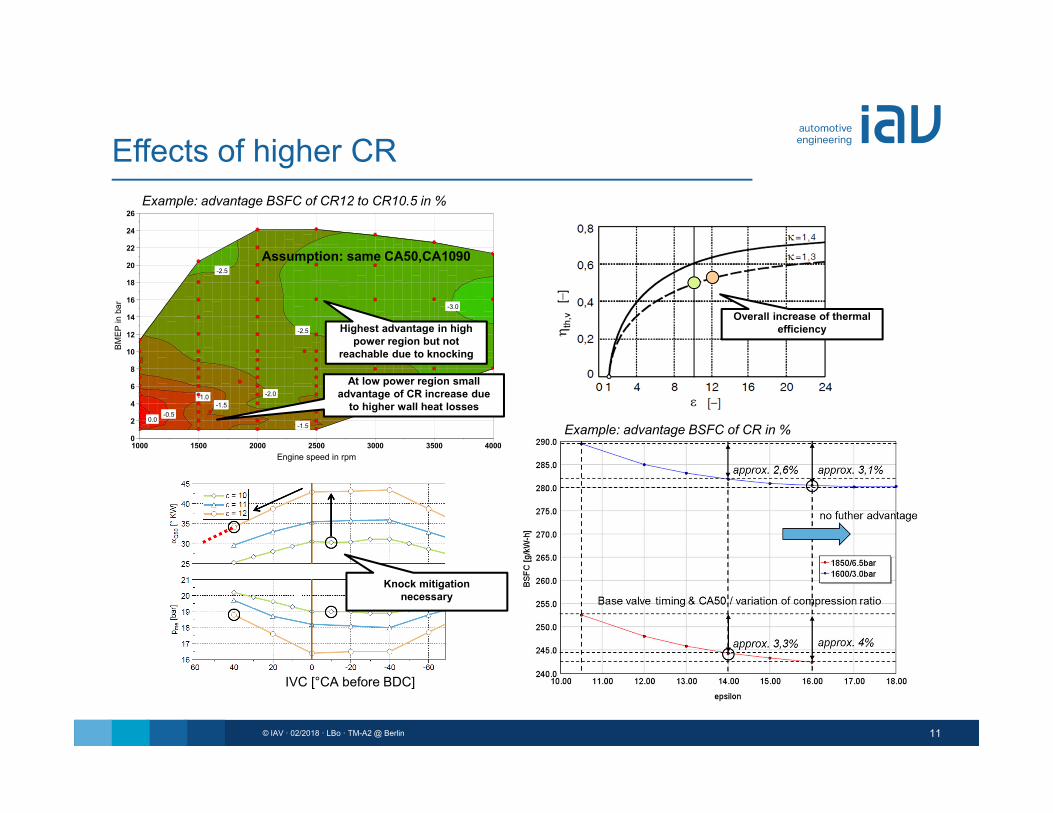
Example: advantage BSFC of CR12 to CR10.5 in %
Assumption: same CA50,CA1090
At low power region small advantage of CR increase due
to higher wall heat losses
Highest advantage in high power region but not
reachable due to knocking
Overall increase of thermal efficiency
Knock mitigation necessary
Example: advantage BSFC of CR in %
IVC [°CA before BDC]
12© IAV ꞏ 02/2018 ꞏ LBo ꞏ TM-A2 @ Berlin
Map prediction – Engine 22bBM
EP in
bar
0
1
2
3
4
5
6
7
8
9
10
11
12
13
14
15
16
Engine Speed in rpm1000 1500 2000 2500 3000 3500 4000 4500 5000 5500 6000 6500
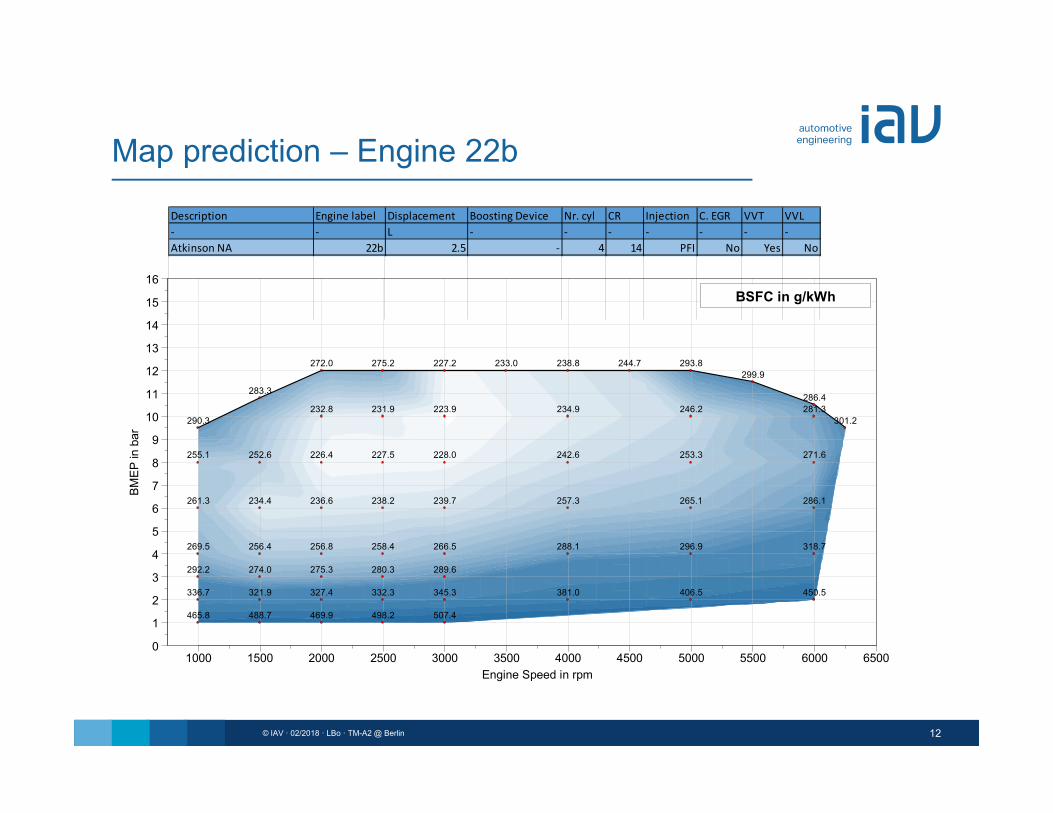
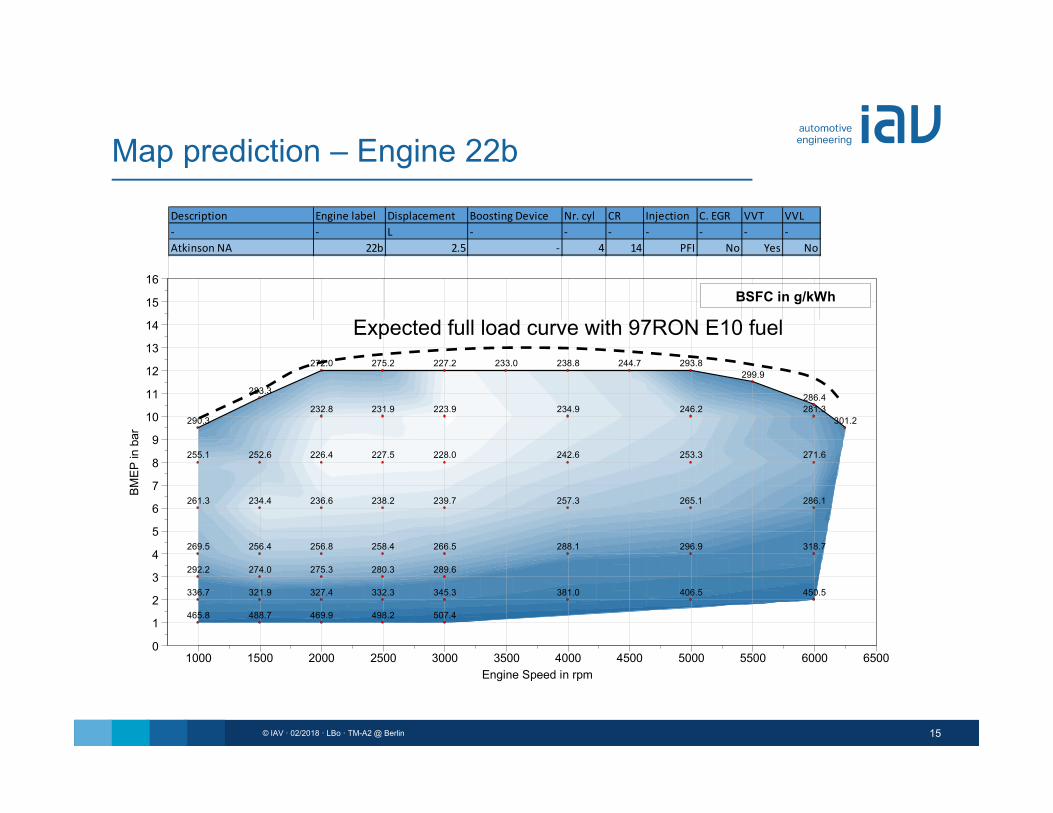
465.8 488.7 469.9 498.2 507.4
336.7 321.9 327.4 332.3 345.3 381.0 406.5 450.5
292.2 274.0 275.3 280.3 289.6
269.5 256.4 256.8 258.4 266.5 288.1 296.9 318.7
261.3 234.4 236.6 238.2 239.7 257.3 265.1 286.1
255.1 252.6 226.4 227.5 228.0 242.6 253.3 271.6
290.3 301.2232.8 231.9 223.9 234.9 246.2 281.3
286.4283.3
299.9272.0 275.2 227.2 233.0 238.8 244.7 293.8
BSFC in g/kWh
Description Engine label Displacement Boosting Device Nr. cyl CR Injection C. EGR VVT VVL‐ ‐ L ‐ ‐ ‐ ‐ ‐ ‐ ‐Atkinson NA 22b 2.5 ‐ 4 14 PFI No Yes No
13© IAV ꞏ 02/2018 ꞏ LBo ꞏ TM-A2 @ Berlin
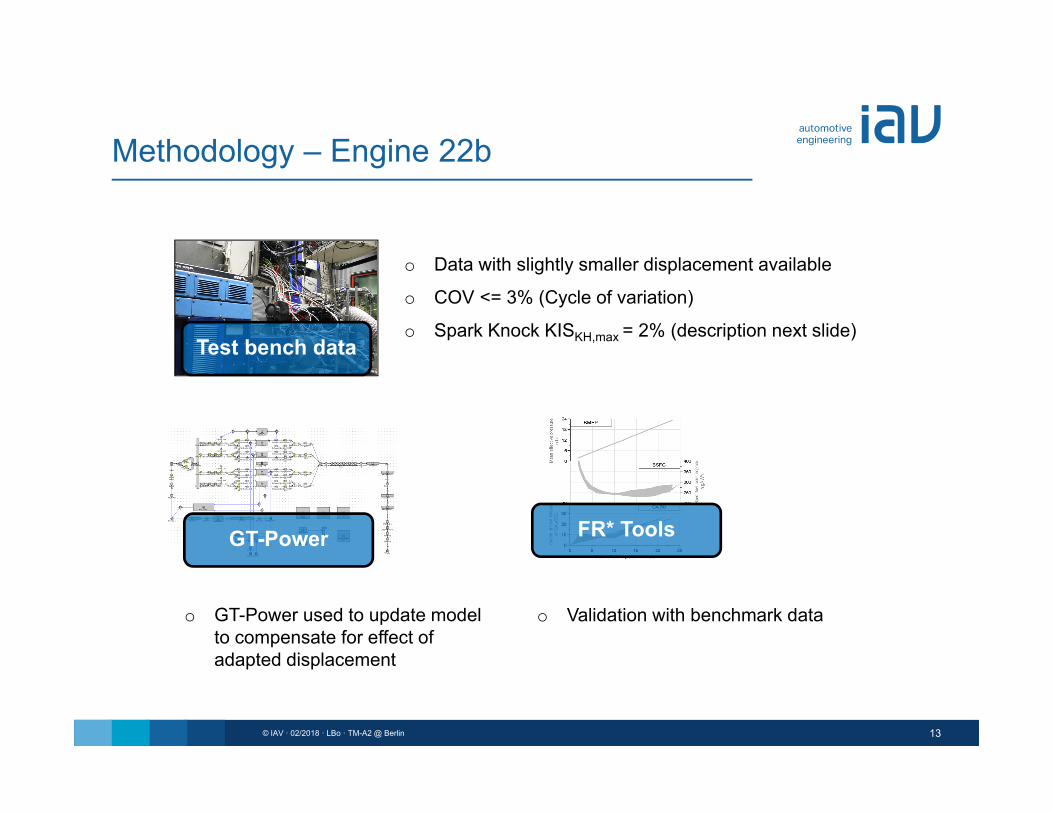
Methodology – Engine 22b
GT-Power
Test bench data
o Data with slightly smaller displacement available
o COV <= 3% (Cycle of variation)
o Spark Knock KISKH,max = 2% (description next slide)
o GT-Power used to update model to compensate for effect of adapted displacement
FR* Tools
o Validation with benchmark data
14© IAV ꞏ 02/2018 ꞏ LBo ꞏ TM-A2 @ Berlin
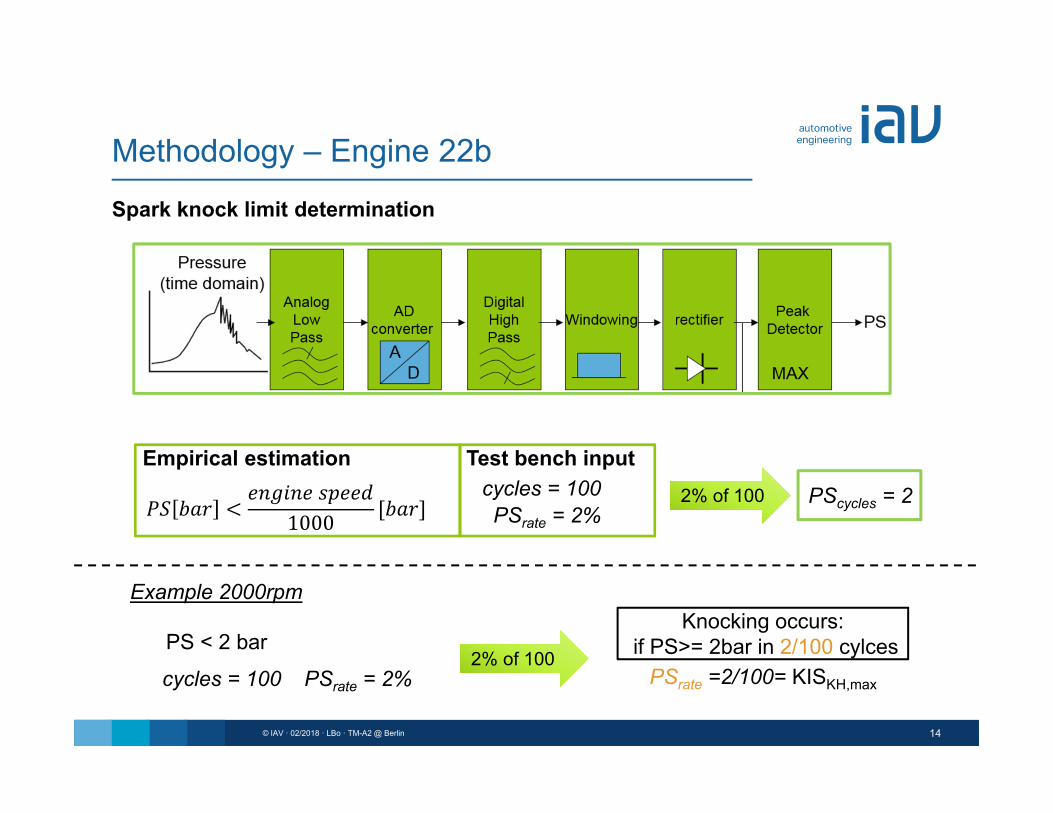
Methodology – Engine 22b
PSrate = 2%cycles = 100 PScycles = 2
Test bench input
Example 2000rpm
2% of 100
Empirical estimation
PS < 2 bar
𝑃𝑆 𝑏𝑎𝑟𝑒𝑛𝑔𝑖𝑛𝑒 𝑠𝑝𝑒𝑒𝑑
1000 𝑏𝑎𝑟
PSrate = 2%cycles = 100
Knocking occurs:if PS>= 2bar in 2/100 cylces2% of 100
PSrate =2/100= KISKH,max
Spark knock limit determination
15© IAV ꞏ 02/2018 ꞏ LBo ꞏ TM-A2 @ Berlin
Map prediction – Engine 22bBM
EP in
bar
0
1
2
3
4
5
6
7
8
9
10
11
12
13
14
15
16
Engine Speed in rpm1000 1500 2000 2500 3000 3500 4000 4500 5000 5500 6000 6500
465.8 488.7 469.9 498.2 507.4
336.7 321.9 327.4 332.3 345.3 381.0 406.5 450.5
292.2 274.0 275.3 280.3 289.6
269.5 256.4 256.8 258.4 266.5 288.1 296.9 318.7
261.3 234.4 236.6 238.2 239.7 257.3 265.1 286.1
255.1 252.6 226.4 227.5 228.0 242.6 253.3 271.6
290.3 301.2232.8 231.9 223.9 234.9 246.2 281.3
286.4283.3
299.9272.0 275.2 227.2 233.0 238.8 244.7 293.8
BSFC in g/kWh
Description Engine label Displacement Boosting Device Nr. cyl CR Injection C. EGR VVT VVL‐ ‐ L ‐ ‐ ‐ ‐ ‐ ‐ ‐Atkinson NA 22b 2.5 ‐ 4 14 PFI No Yes No
Expected full load curve with 97RON E10 fuel
Content
16© IAV ꞏ 02/2018 ꞏ LBo ꞏ TM-A2 @ Berlin
• Engine 24 (VVT Miller eCharg. EGR)
• Engine 23b (VVL Miller VTG EGR)
• Engine 22b (Atkinson n.a.)
• Methodology
• Engine 26a (VCR EGR)
17© IAV ꞏ 02/2018 ꞏ LBo ꞏ TM-A2 @ Berlin
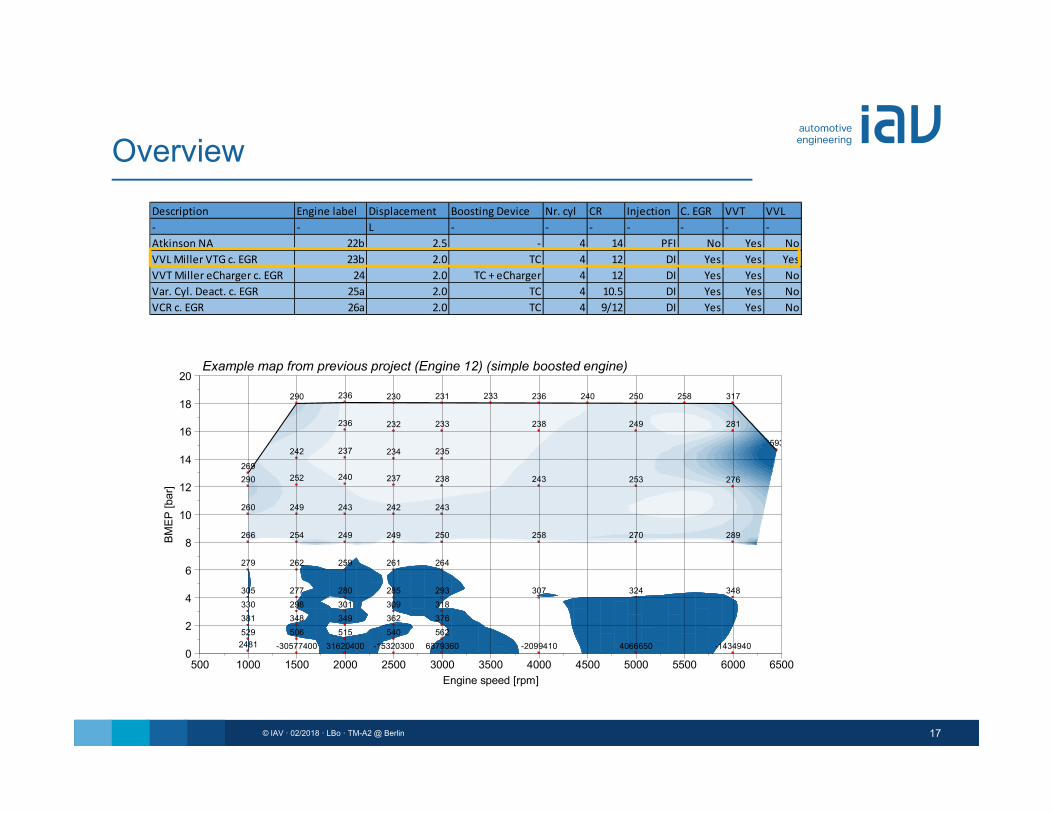
OverviewDescription Engine label Displacement Boosting Device Nr. cyl CR Injection C. EGR VVT VVL‐ ‐ L ‐ ‐ ‐ ‐ ‐ ‐ ‐Atkinson NA 22b 2.5 ‐ 4 14 PFI No Yes NoVVL Miller VTG c. EGR 23b 2.0 TC 4 12 DI Yes Yes YesVVT Miller eCharger c. EGR 24 2.0 TC + eCharger 4 12 DI Yes Yes NoVar. Cyl. Deact. c. EGR 25a 2.0 TC 4 10.5 DI Yes Yes NoVCR c. EGR 26a 2.0 TC 4 9/12 DI Yes Yes No
Example map from previous project (Engine 12) (simple boosted engine)
BMEP
[bar
]
0
2
4
6
8
10
12
14
16
18
20
Engine speed [rpm]500 1000 1500 2000 2500 3000 3500 4000 4500 5000 5500 6000 6500
-1434940-2099410-15320300-30577400 31620400 6379360 40666502481540 562515506529362348381 349 376
301298330 309 318293 307285305 277 348324280
264261259262279
266 258249254 249 250 289270
243249 243260 242
276290 253243238237252 240269
234 235242 237593
232 281249238233236
290 230 231 317250 258236 240233236
18© IAV ꞏ 02/2018 ꞏ LBo ꞏ TM-A2 @ Berlin
OverviewDescription Engine label Displacement Boosting Device Nr. cyl CR Injection C. EGR VVT VVL‐ ‐ L ‐ ‐ ‐ ‐ ‐ ‐ ‐Atkinson NA 22b 2.5 ‐ 4 14 PFI No Yes NoVVL Miller VTG c. EGR 23b 2.0 TC 4 12 DI Yes Yes YesVVT Miller eCharger c. EGR 24 2.0 TC + eCharger 4 12 DI Yes Yes NoVar. Cyl. Deact. c. EGR 25a 2.0 TC 4 10.5 DI Yes Yes NoVCR c. EGR 26a 2.0 TC 4 9/12 DI Yes Yes No
Example map from previous project (Engine 12) (simple boosted engine)
BMEP
[bar
]
0
2
4
6
8
10
12
14
16
18
20
Engine speed [rpm]500 1000 1500 2000 2500 3000 3500 4000 4500 5000 5500 6000 6500
-1434940-2099410-15320300-30577400 31620400 6379360 40666502481540 562515506529362348381 349 376
301298330 309 318293 307285305 277 348324280
264261259262279
266 258249254 249 250 289270
243249 243260 242
276290 253243238237252 240269
234 235242 237593
232 281249238233236
290 230 231 317250 258236 240233236
c. ext. EGR helps to reduce wall heat losses in region 6-10bar BMEP
Knock mitigation in boosted engine region with c. ext. EGR
VGT helps to increase EGR rates
VVL for optimal pumping losses
Low pressure EGR
VVT intake & exhaust side
2 step VVL
19© IAV ꞏ 02/2018 ꞏ LBo ꞏ TM-A2 @ Berlin
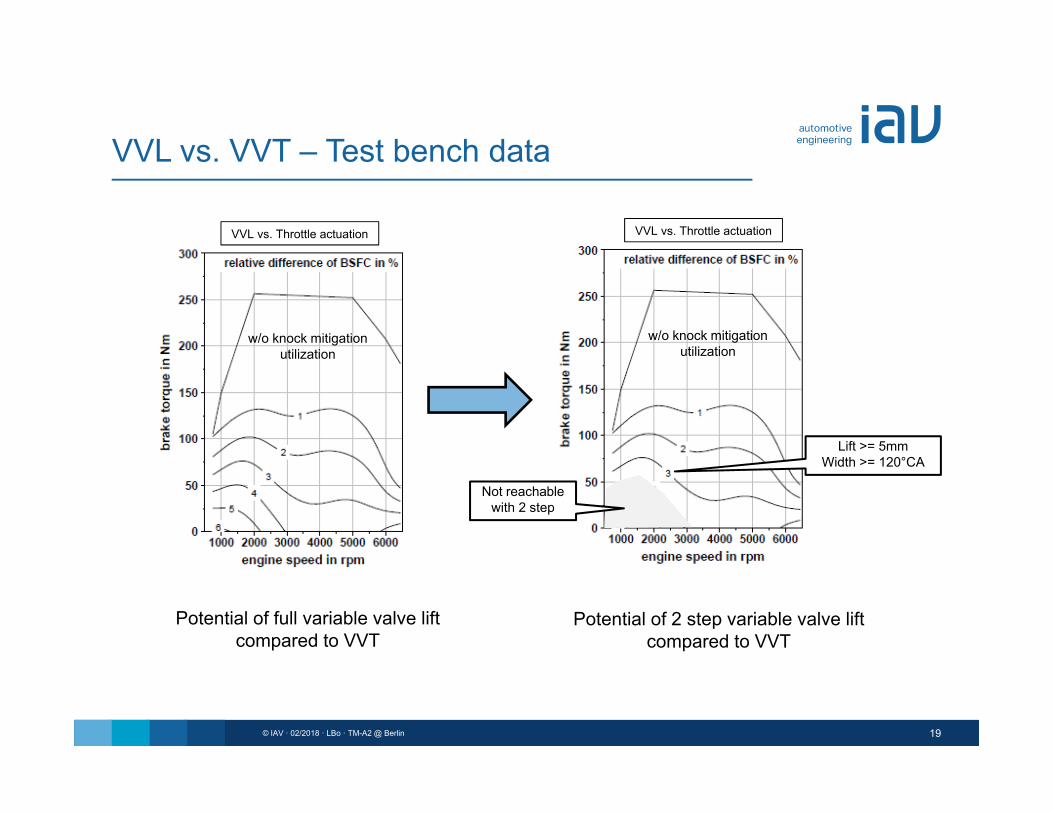
VVL vs. VVT – Test bench data
VVL vs. Throttle actuation
Potential of full variable valve lift compared to VVT
Potential of 2 step variable valve lift compared to VVT
VVL vs. Throttle actuation
Not reachable with 2 step
w/o knock mitigation utilization
w/o knock mitigation utilization
Lift >= 5mmWidth >= 120°CA
20© IAV ꞏ 02/2018 ꞏ LBo ꞏ TM-A2 @ Berlin
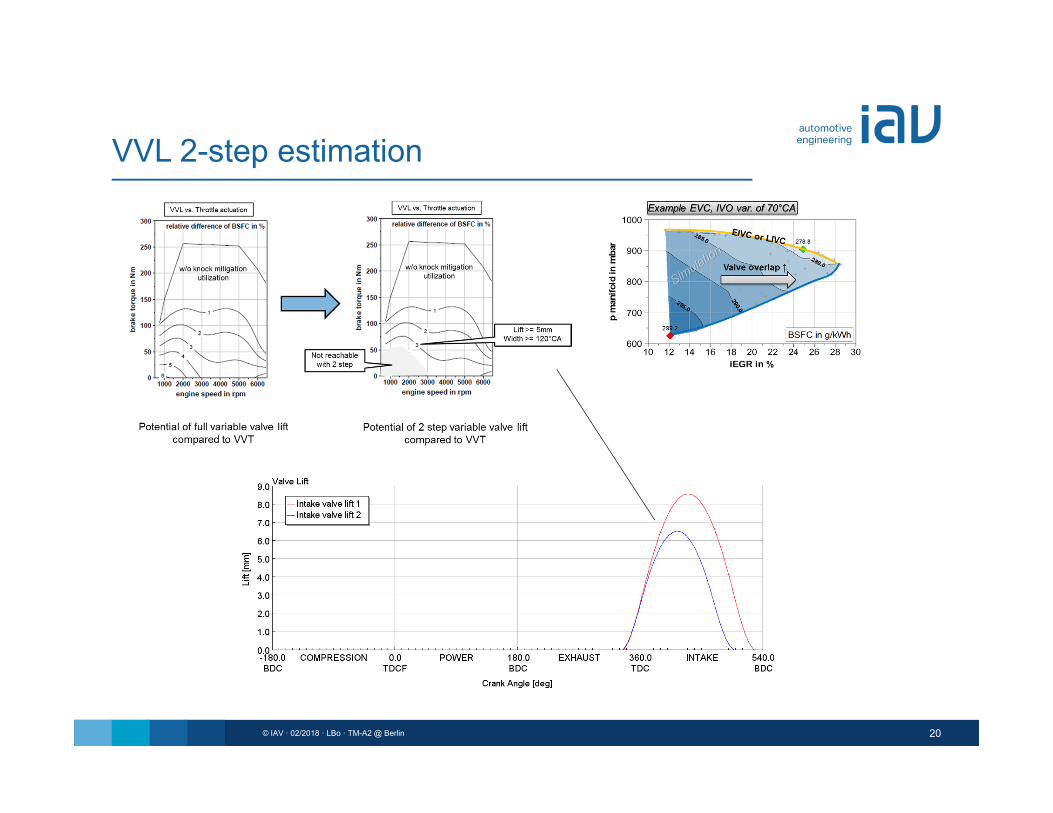
VVL 2-step estimation
21© IAV ꞏ 02/2018 ꞏ LBo ꞏ TM-A2 @ Berlin
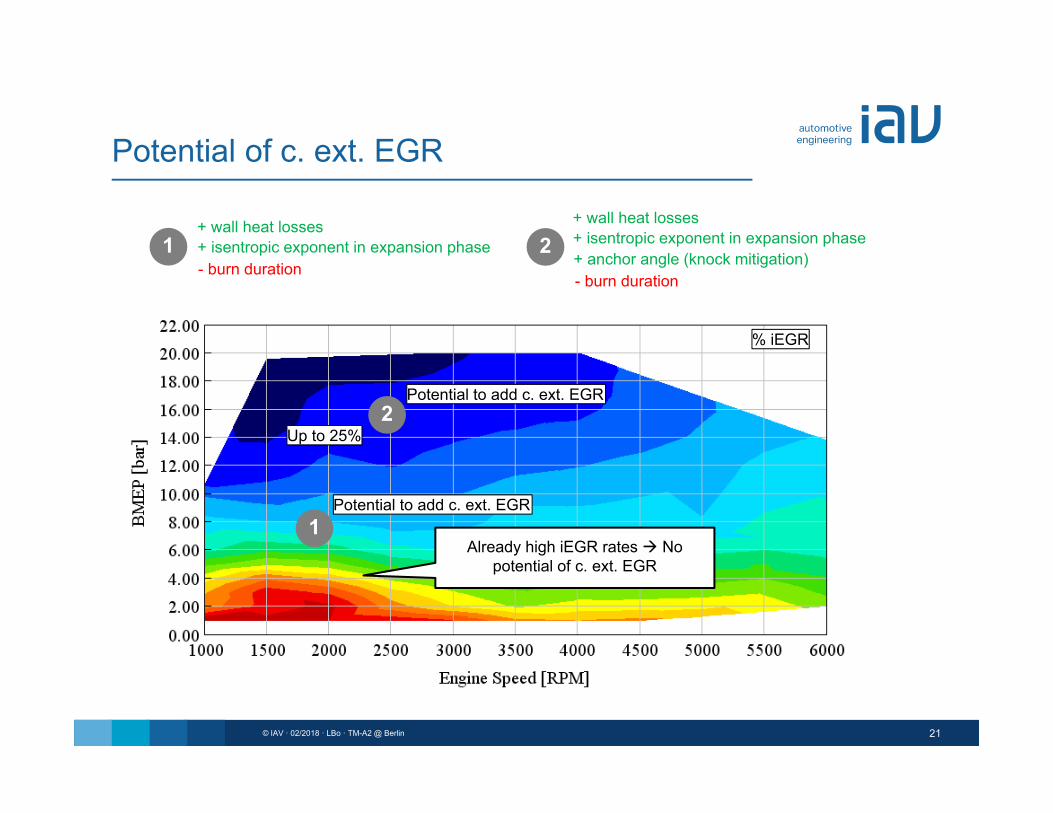
Potential of c. ext. EGR
Already high iEGR rates No potential of c. ext. EGR
1
1+ wall heat losses+ isentropic exponent in expansion phase- burn duration
2
2+ wall heat losses+ isentropic exponent in expansion phase+ anchor angle (knock mitigation)- burn duration
% iEGR
Potential to add c. ext. EGR
Potential to add c. ext. EGR
Up to 25%
22© IAV ꞏ 02/2018 ꞏ LBo ꞏ TM-A2 @ Berlin
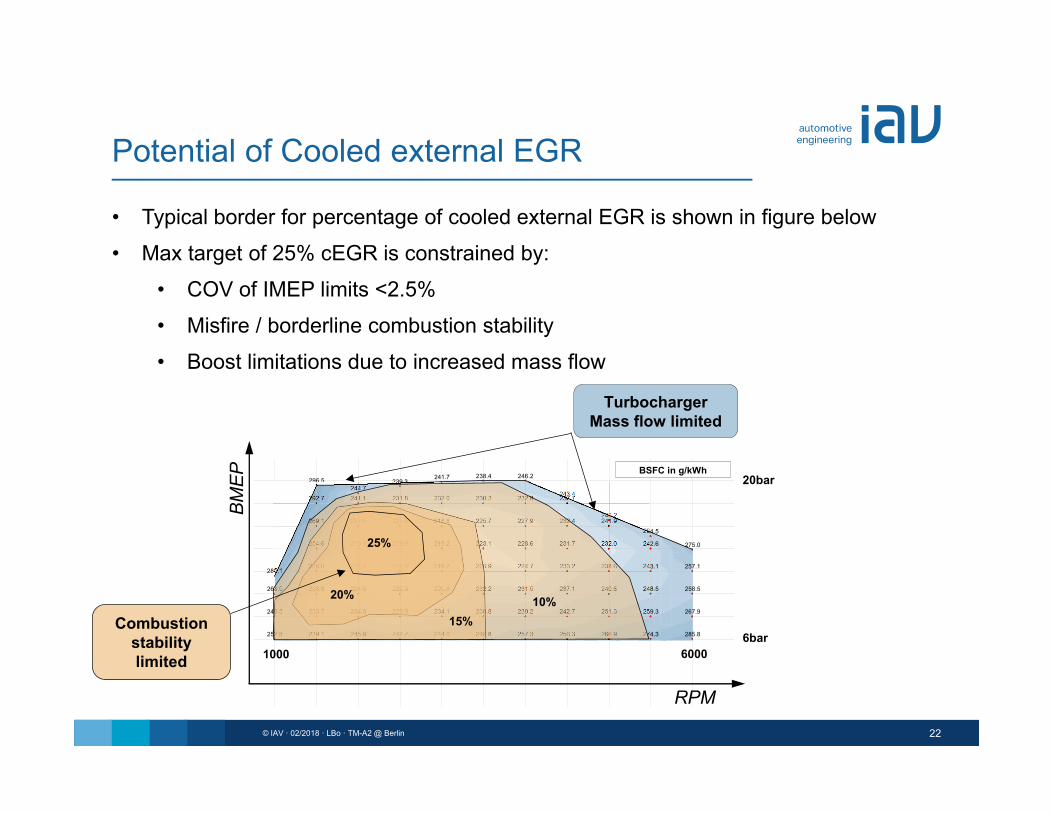
Potential of Cooled external EGR
• Typical border for percentage of cooled external EGR is shown in figure below• Max target of 25% cEGR is constrained by:
• COV of IMEP limits <2.5%• Misfire / borderline combustion stability• Boost limitations due to increased mass flow
252.8 239.1 245.8 242.7 244.0 248.8 257.3 256.3 266.9 274.3 285.8
248.3 233.7 234.8 229.9 234.1 238.8 239.2 242.7 251.3 259.3 267.9
268.5 228.9 224.5 222.9 225.6 232.2 231.5 237.1 240.6 248.5 258.5
285.1236.8 217.1 218.9 219.7 226.9 224.7 233.2 238.6 243.1 257.1
275.0254.6 219.9 219.9 219.2 223.1 228.6 231.7 232.0 242.6
254.5269.1 227.5 225.6 218.8 225.7 227.9 232.4 241.9
246.2
292.7 241.1 231.8 232.0 230.3 232.9 237.7243.4
244.7239.3296.5 241.7 238.4 246.2
BSFC in g/kWh
RPM
BM
EP
6bar
20bar
1000 6000
25%
20%
15%10%
Turbocharger Mass flow limited
Combustion stability limited
23© IAV ꞏ 02/2018 ꞏ LBo ꞏ TM-A2 @ Berlin
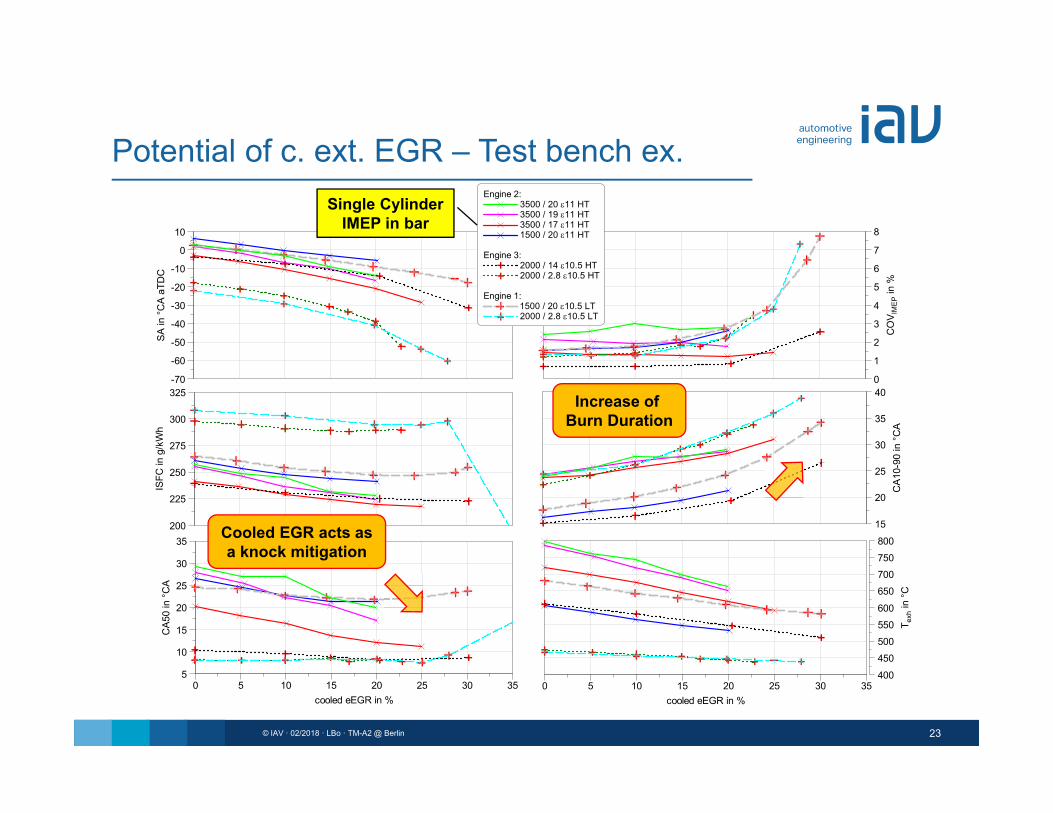
Potential of c. ext. EGR – Test bench ex.
EP6 N35 P4
SA in
°C
A aT
DC
-70
-60
-50
-40
-30
-20
-10
0
10
ISFC
in g
/kW
h
200
225
250
275
300
325
CA5
0 in
°C
A
5
10
15
20
25
30
35
cooled eEGR in %0 5 10 15 20 25 30 35
CA1
0-90
in °
CA
15
20
25
30
35
40
T exh
in °
C
400
450500550600
650700750800
cooled eEGR in %0 5 10 15 20 25 30 35
CO
V IM
EP in
%
0
1
2
3
4
5
6
7
8
Engine 2: 3500 / 20 11 HT 3500 / 19 11 HT 3500 / 17 11 HT 1500 / 20 11 HT
Engine 3: 2000 / 14 10.5 HT 2000 / 2.8 10.5 HT
Engine 1: 1500 / 20 10.5 LT 2000 / 2.8 10.5 LT
Cooled EGR acts asa knock mitigation
Increase of Burn Duration
Single CylinderIMEP in bar
24© IAV ꞏ 02/2018 ꞏ LBo ꞏ TM-A2 @ Berlin
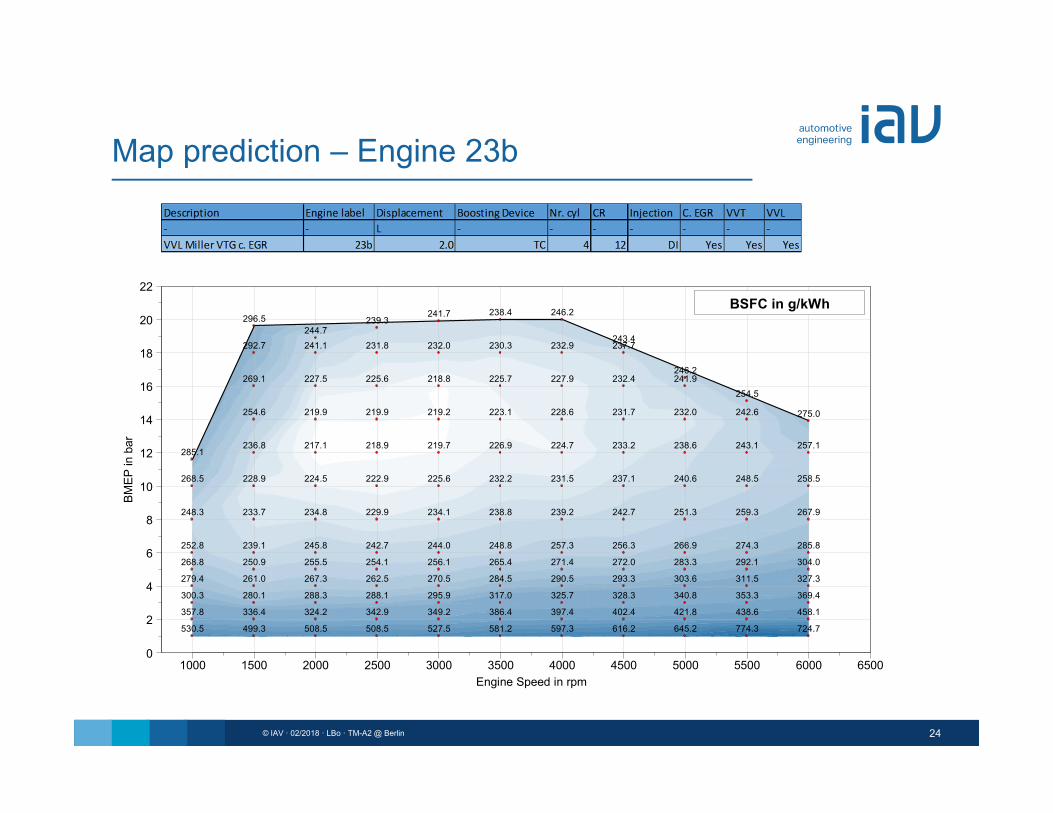
Map prediction – Engine 23bBM
EP in
bar
0
2
4
6
8
10
12
14
16
18
20
22
Engine Speed in rpm1000 1500 2000 2500 3000 3500 4000 4500 5000 5500 6000 6500
530.5 499.3 508.5 508.5 527.5 581.2 597.3 616.2 645.2 774.3 724.7
357.8 336.4 324.2 342.9 349.2 386.4 397.4 402.4 421.8 438.6 458.1
300.3 280.1 288.3 288.1 295.9 317.0 325.7 328.3 340.8 353.3 369.4
279.4 261.0 267.3 262.5 270.5 284.5 290.5 293.3 303.6 311.5 327.3
268.8 250.9 255.5 254.1 256.1 265.4 271.4 272.0 283.3 292.1 304.0
252.8 239.1 245.8 242.7 244.0 248.8 257.3 256.3 266.9 274.3 285.8
248.3 233.7 234.8 229.9 234.1 238.8 239.2 242.7 251.3 259.3 267.9
268.5 228.9 224.5 222.9 225.6 232.2 231.5 237.1 240.6 248.5 258.5
285.1236.8 217.1 218.9 219.7 226.9 224.7 233.2 238.6 243.1 257.1
275.0254.6 219.9 219.9 219.2 223.1 228.6 231.7 232.0 242.6
254.5269.1 227.5 225.6 218.8 225.7 227.9 232.4 241.9
246.2
292.7 241.1 231.8 232.0 230.3 232.9 237.7243.4
244.7239.3296.5 241.7 238.4 246.2
BSFC in g/kWh
25© IAV ꞏ 02/2018 ꞏ LBo ꞏ TM-A2 @ Berlin
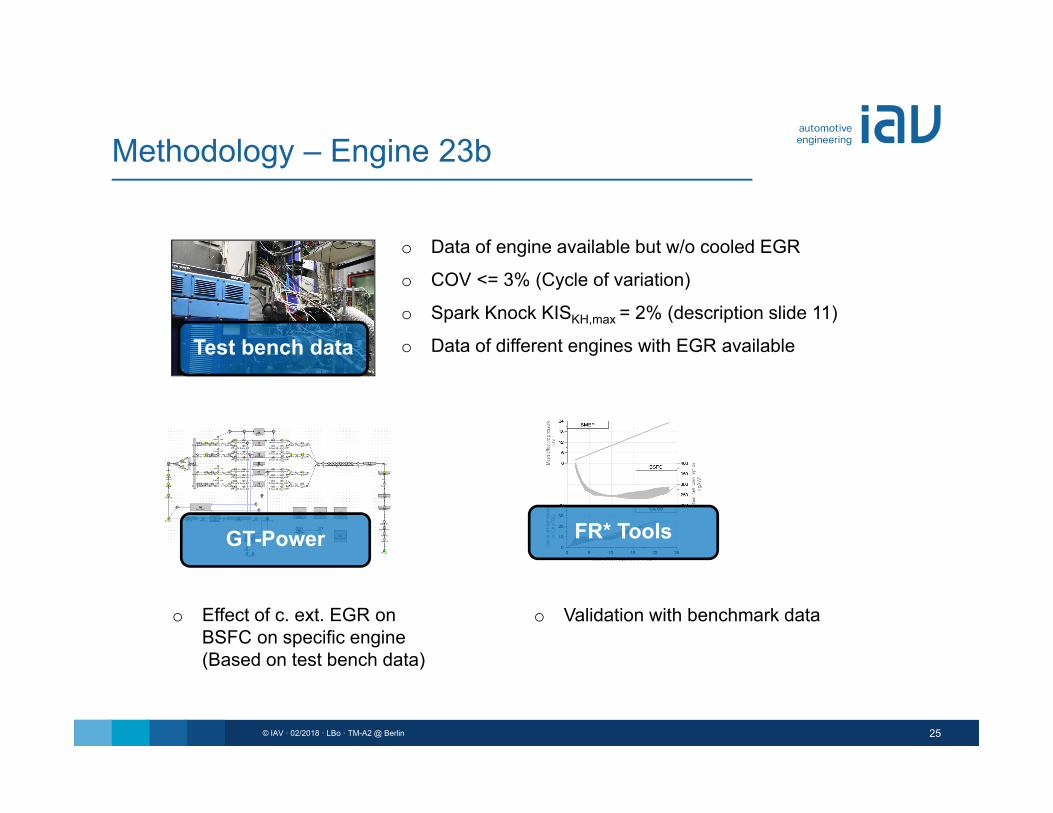
Methodology – Engine 23b
GT-Power
Test bench data
o Data of engine available but w/o cooled EGR
o COV <= 3% (Cycle of variation)
o Spark Knock KISKH,max = 2% (description slide 11)
o Data of different engines with EGR available
o Effect of c. ext. EGR on BSFC on specific engine (Based on test bench data)
FR* Tools
o Validation with benchmark data
Content
26© IAV ꞏ 02/2018 ꞏ LBo ꞏ TM-A2 @ Berlin
• Engine 24 (VVT Miller eCharg. EGR)
• Engine 23b (VVL Miller VTG EGR)
• Engine 22b (Atkinson n.a.)
• Methodology
• Engine 26a (VCR EGR)
27© IAV ꞏ 02/2018 ꞏ LBo ꞏ TM-A2 @ Berlin
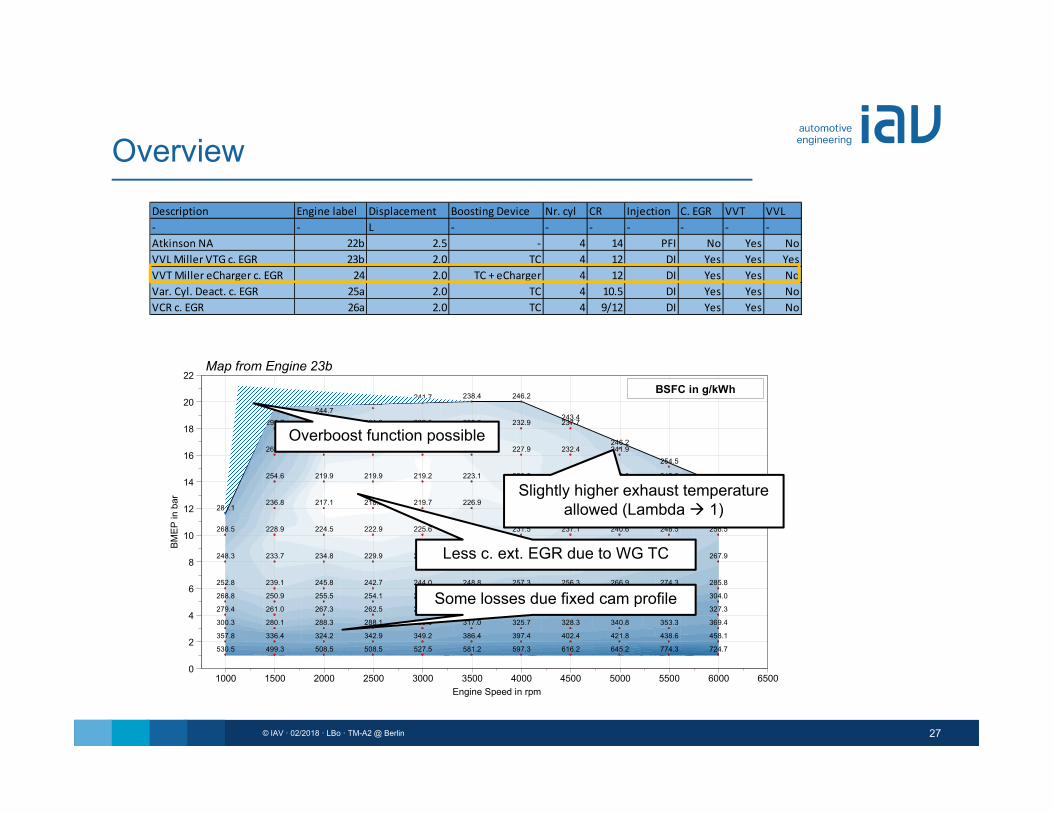
OverviewDescription Engine label Displacement Boosting Device Nr. cyl CR Injection C. EGR VVT VVL‐ ‐ L ‐ ‐ ‐ ‐ ‐ ‐ ‐Atkinson NA 22b 2.5 ‐ 4 14 PFI No Yes NoVVL Miller VTG c. EGR 23b 2.0 TC 4 12 DI Yes Yes YesVVT Miller eCharger c. EGR 24 2.0 TC + eCharger 4 12 DI Yes Yes NoVar. Cyl. Deact. c. EGR 25a 2.0 TC 4 10.5 DI Yes Yes NoVCR c. EGR 26a 2.0 TC 4 9/12 DI Yes Yes No
BMEP
in b
ar
0
2
4
6
8
10
12
14
16
18
20
22
Engine Speed in rpm1000 1500 2000 2500 3000 3500 4000 4500 5000 5500 6000 6500
530.5 499.3 508.5 508.5 527.5 581.2 597.3 616.2 645.2 774.3 724.7
357.8 336.4 324.2 342.9 349.2 386.4 397.4 402.4 421.8 438.6 458.1
300.3 280.1 288.3 288.1 295.9 317.0 325.7 328.3 340.8 353.3 369.4
279.4 261.0 267.3 262.5 270.5 284.5 290.5 293.3 303.6 311.5 327.3
268.8 250.9 255.5 254.1 256.1 265.4 271.4 272.0 283.3 292.1 304.0
252.8 239.1 245.8 242.7 244.0 248.8 257.3 256.3 266.9 274.3 285.8
248.3 233.7 234.8 229.9 234.1 238.8 239.2 242.7 251.3 259.3 267.9
268.5 228.9 224.5 222.9 225.6 232.2 231.5 237.1 240.6 248.5 258.5
285.1236.8 217.1 218.9 219.7 226.9 224.7 233.2 238.6 243.1 257.1
275.0254.6 219.9 219.9 219.2 223.1 228.6 231.7 232.0 242.6
254.5269.1 227.5 225.6 218.8 225.7 227.9 232.4 241.9
246.2
292.7 241.1 231.8 232.0 230.3 232.9 237.7243.4
244.7239.3296.5 241.7 238.4 246.2
BSFC in g/kWh
Map from Engine 23b
Some losses due fixed cam profile
Less c. ext. EGR due to WG TC
Overboost function possible
Slightly higher exhaust temperature allowed (Lambda 1)
28© IAV ꞏ 02/2018 ꞏ LBo ꞏ TM-A2 @ Berlin
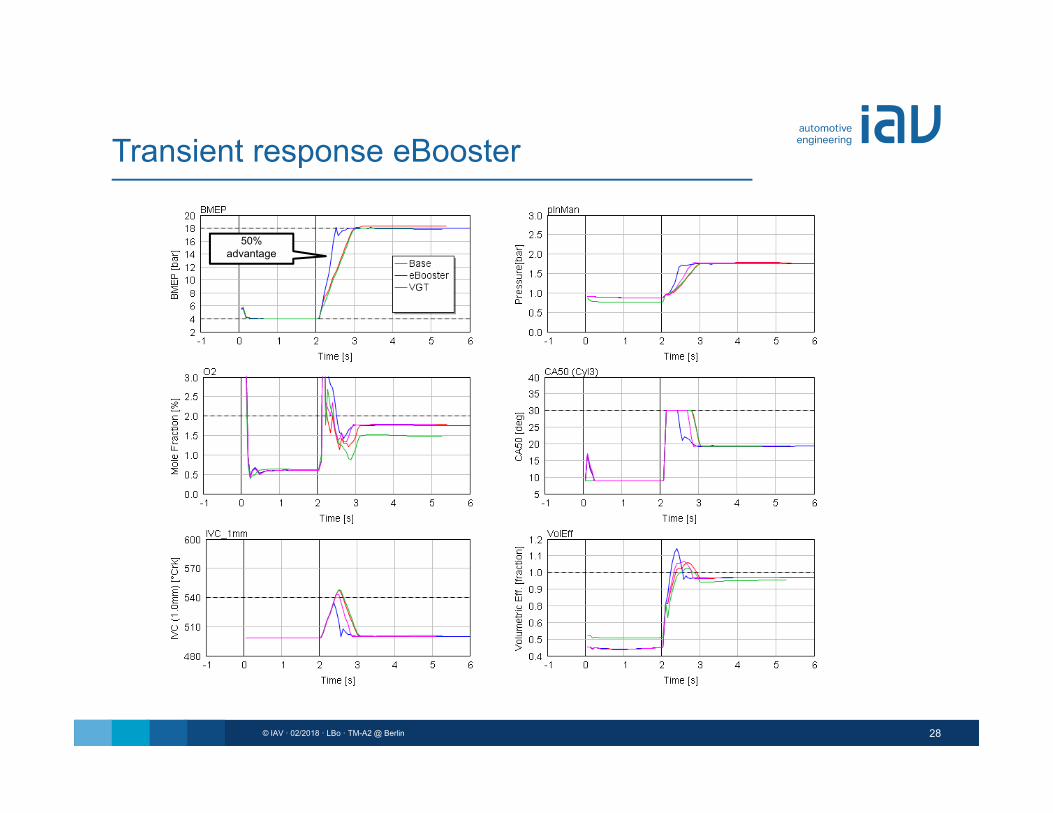
Transient response eBooster
50% advantage
29© IAV ꞏ 02/2018 ꞏ LBo ꞏ TM-A2 @ Berlin
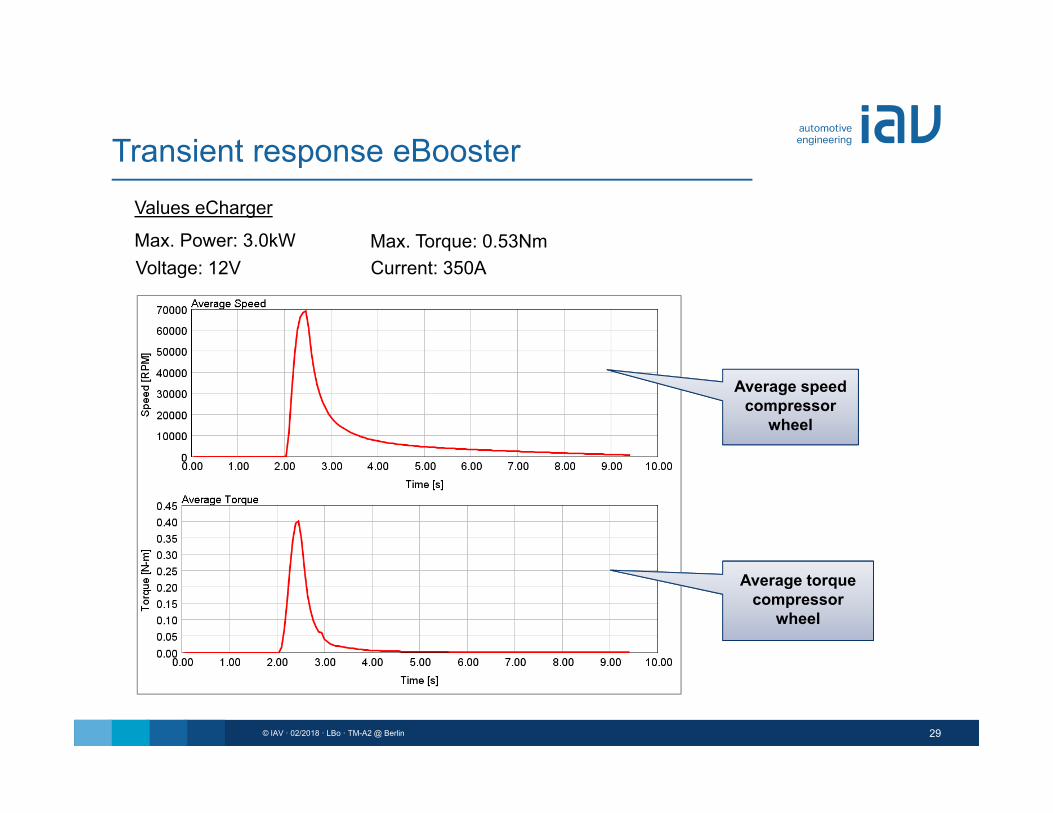
Transient response eBooster
Max. Power: 3.0kW
Values eCharger
Max. Torque: 0.53NmVoltage: 12V Current: 350A
Average speed compressor
wheel
Average torque compressor
wheel

30© IAV ꞏ 02/2018 ꞏ LBo ꞏ TM-A2 @ Berlin
Transient response eBooster
Max. Power: 3.0kW
Values eCharger
Max. Torque: 0.53NmVoltage: 12V Current: 350A
Speed of echarger shaft
Torque echargermotor
31© IAV ꞏ 02/2018 ꞏ LBo ꞏ TM-A2 @ Berlin
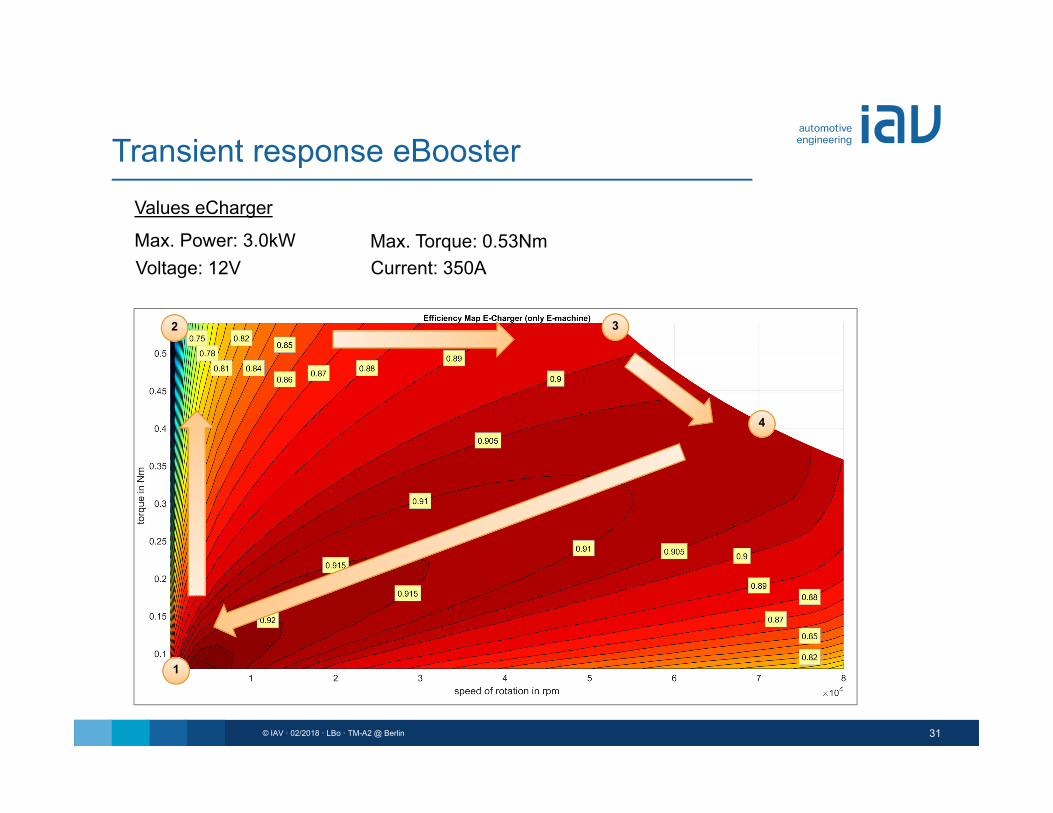
Transient response eBooster
Max. Power: 3.0kW
Values eCharger
Max. Torque: 0.53NmVoltage: 12V Current: 350A
1
2 3
4
32© IAV ꞏ 02/2018 ꞏ LBo ꞏ TM-A2 @ Berlin
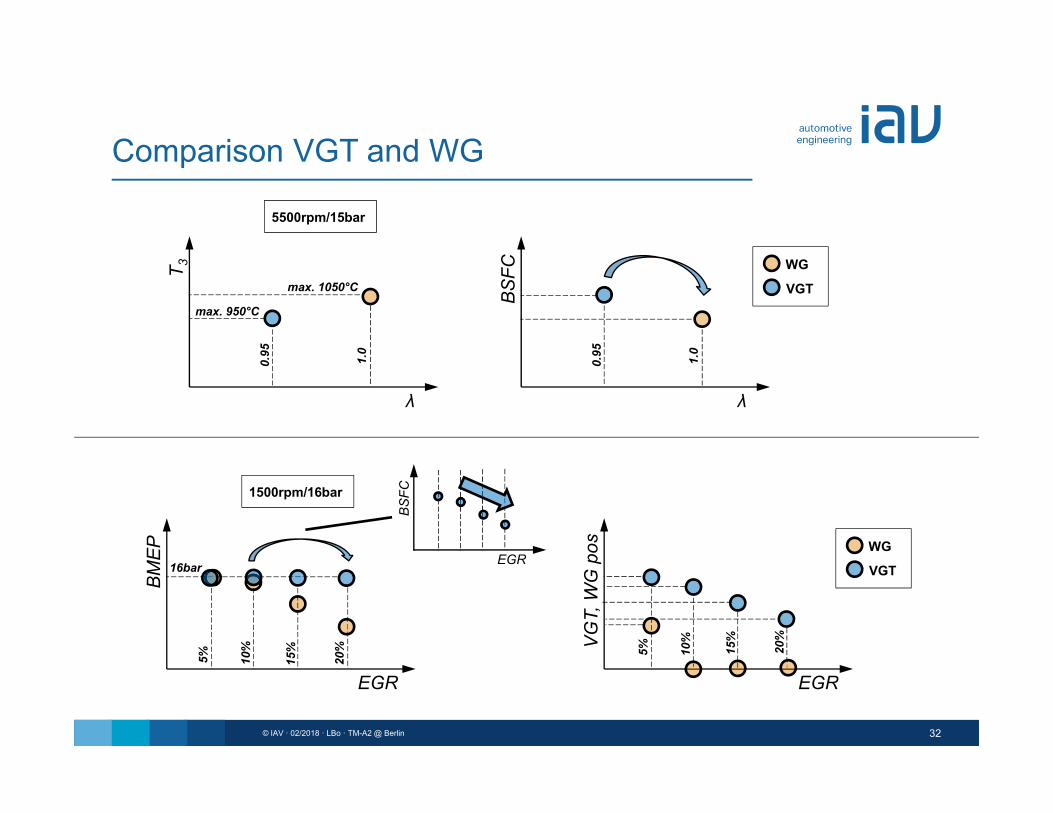
Comparison VGT and WG
λ
T 3
max. 1050°C
max. 950°C
0.95 1.0
λ
BS
FC
0.95 1.0
VGT
WG
EGR
BM
EP
EGR
VG
T, W
G p
osVGT
WG
5500rpm/15bar
1500rpm/16bar
5% 10%
15%
20%
16bar
5% 10%
15%
20%
EGR
BS
FC
Content
33© IAV ꞏ 02/2018 ꞏ LBo ꞏ TM-A2 @ Berlin
• Engine 24 (VVT Miller eCharg. EGR)
• Engine 23b (VVL Miller VTG EGR)
• Engine 22b (Atkinson n.a.)
• Methodology
• Engine 26a (VCR EGR)
34© IAV ꞏ 02/2018 ꞏ LBo ꞏ TM-A2 @ Berlin
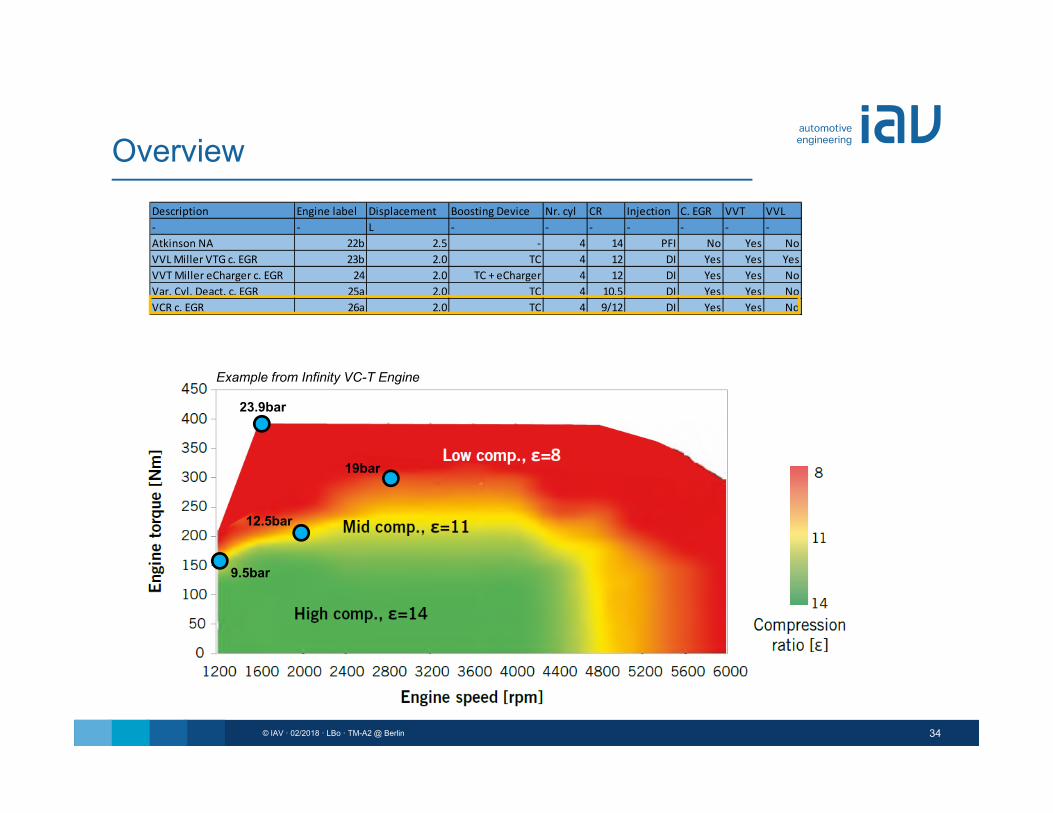
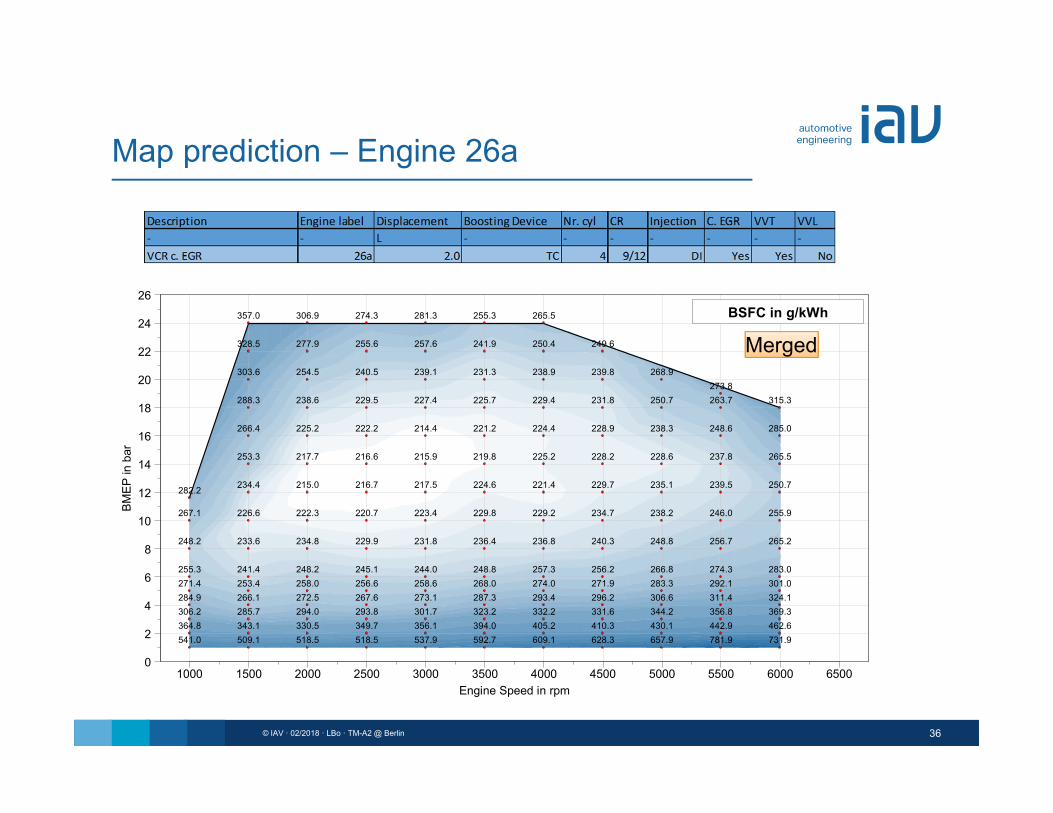
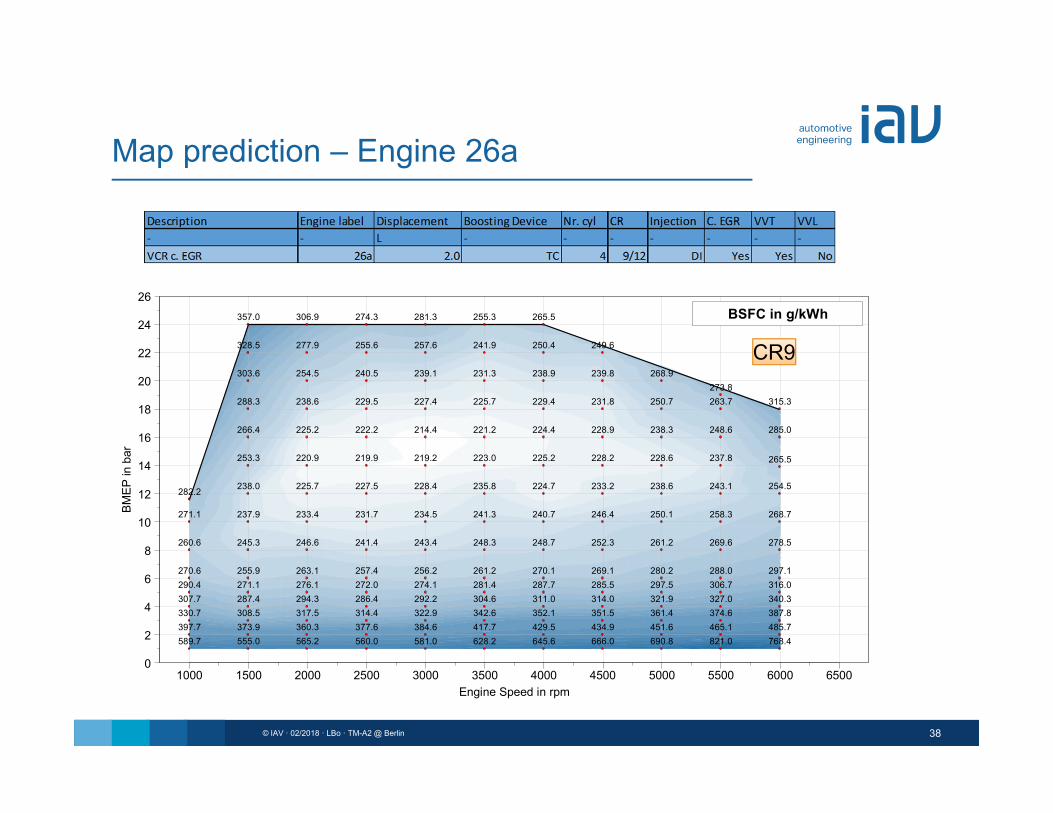
OverviewDescription Engine label Displacement Boosting Device Nr. cyl CR Injection C. EGR VVT VVL‐ ‐ L ‐ ‐ ‐ ‐ ‐ ‐ ‐Atkinson NA 22b 2.5 ‐ 4 14 PFI No Yes NoVVL Miller VTG c. EGR 23b 2.0 TC 4 12 DI Yes Yes YesVVT Miller eCharger c. EGR 24 2.0 TC + eCharger 4 12 DI Yes Yes NoVar. Cyl. Deact. c. EGR 25a 2.0 TC 4 10.5 DI Yes Yes NoVCR c. EGR 26a 2.0 TC 4 9/12 DI Yes Yes No
Example from Infinity VC-T Engine
9.5bar
12.5bar
19bar
23.9bar
35© IAV ꞏ 02/2018 ꞏ LBo ꞏ TM-A2 @ Berlin
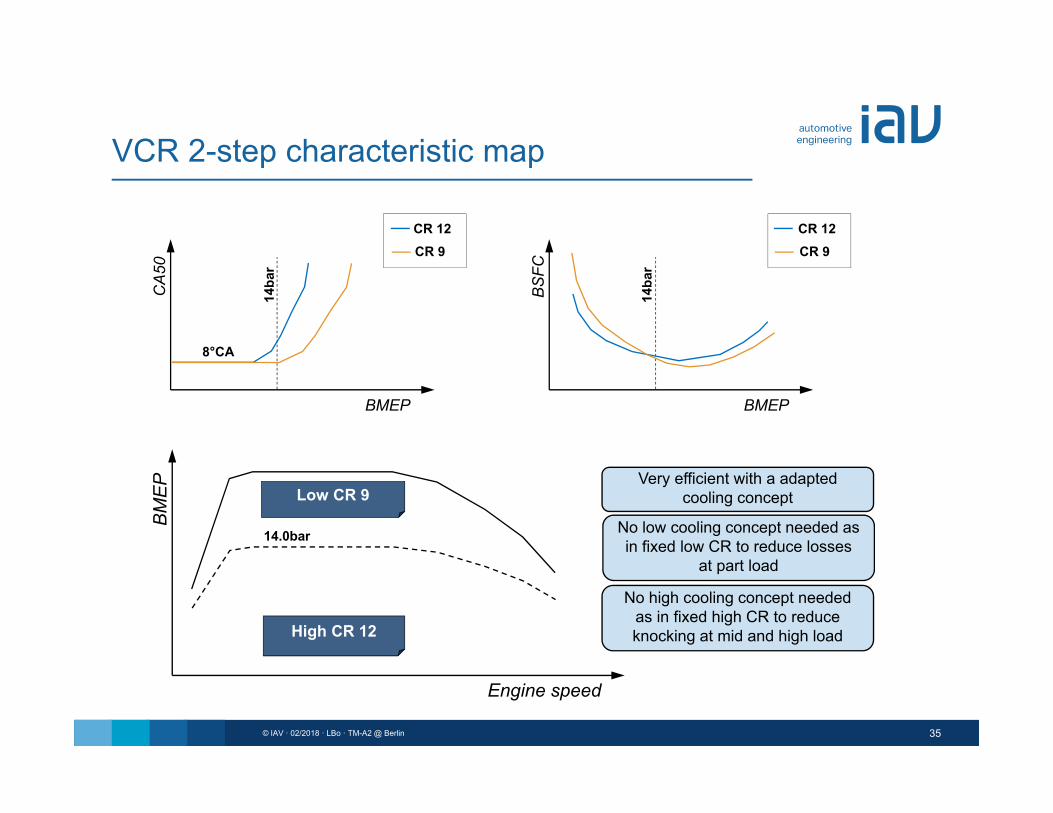
VCR 2-step characteristic mapB
ME
P
Engine speed
High CR 12
Low CR 9
14.0bar
BMEP
CA
50
BMEP
BS
FC
8°CA
CR 12CR 9
14ba
r
14ba
r
CR 12CR 9
Very efficient with a adapted cooling concept
No low cooling concept needed as in fixed low CR to reduce losses
at part load
No high cooling concept needed as in fixed high CR to reduce knocking at mid and high load
36© IAV ꞏ 02/2018 ꞏ LBo ꞏ TM-A2 @ Berlin
Map prediction – Engine 26aBM
EP in
bar
0
2
4
6
8
10
12
14
16
18
20
22
24
26
Engine Speed in rpm1000 1500 2000 2500 3000 3500 4000 4500 5000 5500 6000 6500
541.0 509.1 518.5 518.5 537.9 592.7 609.1 628.3 657.9 781.9 731.9364.8 343.1 330.5 349.7 356.1 394.0 405.2 410.3 430.1 442.9 462.6306.2 285.7 294.0 293.8 301.7 323.2 332.2 331.6 344.2 356.8 369.3284.9 266.1 272.5 267.6 273.1 287.3 293.4 296.2 306.6 311.4 324.1271.4 253.4 258.0 256.6 258.6 268.0 274.0 271.9 283.3 292.1 301.0255.3 241.4 248.2 245.1 244.0 248.8 257.3 256.2 266.8 274.3 283.0
248.2 233.6 234.8 229.9 231.8 236.4 236.8 240.3 248.8 256.7 265.2
267.1 226.6 222.3 220.7 223.4 229.8 229.2 234.7 238.2 246.0 255.9
282.2 234.4 215.0 216.7 217.5 224.6 221.4 229.7 235.1 239.5 250.7
253.3 217.7 216.6 215.9 219.8 225.2 228.2 228.6 237.8 265.5
266.4 225.2 222.2 214.4 221.2 224.4 228.9 238.3 248.6 285.0
288.3 238.6 229.5 227.4 225.7 229.4 231.8 250.7 263.7 315.3273.8
303.6 254.5 240.5 239.1 231.3 238.9 239.8 268.9
328.5 277.9 255.6 257.6 241.9 250.4 249.6
357.0 306.9 274.3 281.3 255.3 265.5 BSFC in g/kWh
Merged

37© IAV ꞏ 02/2018 ꞏ LBo ꞏ TM-A2 @ Berlin
Map prediction – Engine 26aBM
EP in
bar
0
2
4
6
8
10
12
14
16
18
20
22
24
26
Engine Speed in rpm1000 1500 2000 2500 3000 3500 4000 4500 5000 5500 6000 6500
541.0 509.1 518.5 518.5 537.9 592.7 609.1 628.3 657.9 781.9 731.9364.8 343.1 330.5 349.7 356.1 394.0 405.2 410.3 430.1 442.9 462.6306.2 285.7 294.0 293.8 301.7 323.2 332.2 331.6 344.2 356.8 369.3284.9 266.1 272.5 267.6 273.1 287.3 293.4 296.2 306.6 311.4 324.1271.4 253.4 258.0 256.6 258.6 268.0 274.0 271.9 283.3 292.1 301.0255.3 241.4 248.2 245.1 244.0 248.8 257.3 256.2 266.8 274.3 283.0
248.2 233.6 234.8 229.9 231.8 236.4 236.8 240.3 248.8 256.7 265.2
267.1 226.6 222.3 220.7 223.4 229.8 229.2 234.7 238.2 246.0 255.9
290.7 234.4 215.0 216.7 217.5 224.6 221.4 229.7 235.1 239.5 250.7
260.9 217.7 216.6 215.9 219.8 232.0 235.0 235.4 244.9 273.4
232.0 228.9 220.8 227.8
BSFC in g/kWh
CR12
38© IAV ꞏ 02/2018 ꞏ LBo ꞏ TM-A2 @ Berlin
Map prediction – Engine 26aBM
EP in
bar
0
2
4
6
8
10
12
14
16
18
20
22
24
26
Engine Speed in rpm1000 1500 2000 2500 3000 3500 4000 4500 5000 5500 6000 6500
589.7 555.0 565.2 560.0 581.0 628.2 645.6 666.0 690.8 821.0 768.4397.7 373.9 360.3 377.6 384.6 417.7 429.5 434.9 451.6 465.1 485.7330.7 308.5 317.5 314.4 322.9 342.6 352.1 351.5 361.4 374.6 387.8307.7 287.4 294.3 286.4 292.2 304.6 311.0 314.0 321.9 327.0 340.3290.4 271.1 276.1 272.0 274.1 281.4 287.7 285.5 297.5 306.7 316.0270.6 255.9 263.1 257.4 256.2 261.2 270.1 269.1 280.2 288.0 297.1
260.6 245.3 246.6 241.4 243.4 248.3 248.7 252.3 261.2 269.6 278.5
271.1 237.9 233.4 231.7 234.5 241.3 240.7 246.4 250.1 258.3 268.7
282.2 238.0 225.7 227.5 228.4 235.8 224.7 233.2 238.6 243.1 254.5
265.5253.3 220.9 219.9 219.2 223.0 225.2 228.2 228.6 237.8
266.4 225.2 222.2 214.4 221.2 224.4 228.9 238.3 248.6 285.0
288.3 238.6 229.5 227.4 225.7 229.4 231.8 250.7 263.7 315.3273.8
303.6 254.5 240.5 239.1 231.3 238.9 239.8 268.9
328.5 277.9 255.6 257.6 241.9 250.4 249.6
357.0 306.9 274.3 281.3 255.3 265.5 BSFC in g/kWh
CR9
39© IAV ꞏ 02/2018 ꞏ LBo ꞏ TM-A2 @ Berlin
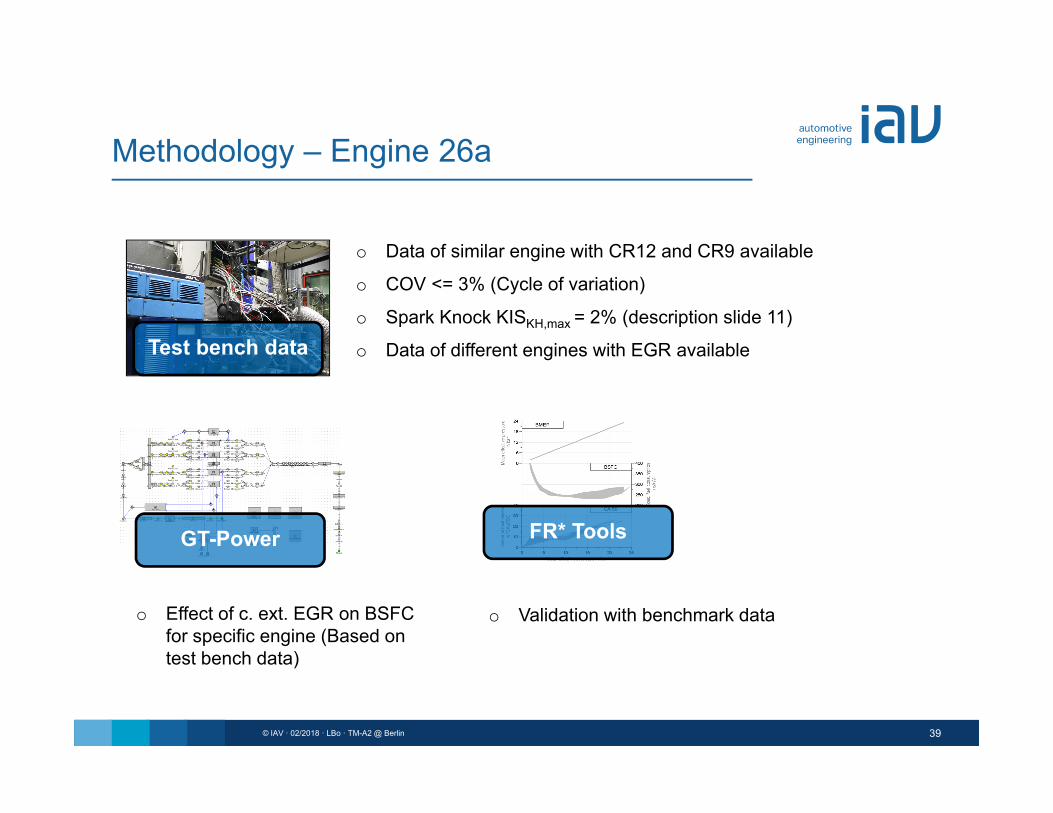
Methodology – Engine 26a
GT-Power
Test bench data
o Data of similar engine with CR12 and CR9 available
o COV <= 3% (Cycle of variation)
o Spark Knock KISKH,max = 2% (description slide 11)
o Data of different engines with EGR available
FR* Tools
o Validation with benchmark datao Effect of c. ext. EGR on BSFC for specific engine (Based on test bench data)
Thank YouLars BöttcherIAV GmbHCarnotstrasse 1, 10587 BERLIN (GERMANY)Phone +49 30 [email protected]
40© IAV ꞏ 02/2018 ꞏ LBo ꞏ TM-A2 @ Berlin