Embed Size (px)
Citation preview

Management’s Discussion and Analysis
For the Twelve Month Period Ended July 31, 2013

2
Angkor Gold Corp.
Management’s Discussion and Analysis of Financial Position and Results of Operations for the twelve month periods ended July 31, 2013
BACKGROUND
This Management’s Discussion & Analysis (“MD&A”) of Angkor Gold Corp. (“Angkor Gold” or the “Company”) is dated as of November 15, 2013, which is the date of filing this document. It provides a review of our financial results, from the viewpoint of management, for the twelve month period ended July 31, 2013. This MD&A should be read in conjunction with the Company’s audited consolidated financial statements for the year ended July 31, 2013. This discussion includes the accounts of the Company and its wholly‐owned subsidiaries, PPMC Canada, a corporation existing under the provincial laws of Alberta; Angkor Gold Corp. (Cambodia) Co. Ltd. (“PPMC Cambodia”), a corporation existing under the laws of the Kingdom of Cambodia; Liberty Mining International Pty Ltd. (“Liberty”), a corporation existing under the laws of Australia; Transol Mining and Exploration Pty Ltd. (“Transol Australia”), a corporation existing under the laws of Australia; Liberty Mining (Cambodia) Ltd. (“LMC Cambodia”), a corporation existing under the laws of the Kingdom of Cambodia; Liberty Mining International Pty Ltd. (“LMI Cambodia”), a corporation existing under the laws of the Kingdom of Cambodia; and Transol Mining and Exploration Pty Ltd. (“Transol Cambodia”), a corporation existing under the laws of the Kingdom of Cambodia. BUSINESS UPDATE
On August 30, 2012, the Company acquired all of the outstanding shares of Liberty from Interactive
Industrial Solutions Inc. (“IISI”) in exchange for cash in the amount of $200,000 and 4,250,000 common
shares in the capital of the Company. These shares were voluntarily escrowed for 6 months.
IISI is an Alberta Corporation controlled by Michael Weeks, the Chief Executive Officer and President of
Angkor. Liberty is an Australian corporation which owns Liberty Mining International Pty Ltd., a
Cambodian subsidiary company, which owns a 10% interest in Angkor’s Banlung, Banlung North and
Oyadao concessions. Liberty also owns Transol Mining and Exploration Pty Ltd., which owns 100% of the
209 square kilometer Andong Meas concession in Cambodia and a 10% interest in Angkor’s Oyadao
South gold exploration property.
In completing this transaction, Angkor now holds a 100% interest in the Banlung, Banlung North,
Oyadao, Oyadao South, and Andong Meas concessions by way of its 100% interest in Liberty. As a result
of this transaction, the Company holds 100% of the Banlung Gold and Base Metals project and the
Oyadao Base Metals project.
On December 19, 2012, the Company sold a 78 square kilometer subsection of its 300 square kilometer
Oyadao tenement to All Solutions (Cambodia) Co. Ltd. The Company retains the remaining 222 square
kilometer section of the existing Oyadao license. Proceeds of $2,396,849 USD were received. The costs
that had been capitalized to the portion of the license sold totalled $1,729,465 USD resulting in a gain on
sale of $672,021 ($667,384 USD).

3
On February 20, 2013, the Company signed a Definitive Agreement (“DA”) with Mesco Gold Ltd.
(“Mesco”) pursuant to which the Company has agreed to sell Mesco the rights to develop and mine the
Company’s Phum Syarung prospect located within its Oyadao South Concession in Ratanakiri Province,
Cambodia. The DA confirms that the Company will receive 10% of the net smelter royalty from all
production at the Phum Syarung prospect. Mesco will pay the Company $1,200,000 USD, $700,000 USD
in cash which has been paid and a $500,000 USD promissory note, for the prospect. The promissory
note is payable either two months from closing or when the Cambodian government grants a
preliminary exploitation license to Mesco, whichever is later. The sale closed on April 30, 2013 and
initial payment of $700,000 USD was received on that date. The sale resulted in a gain on sale of
$701,485 ($696,645 USD). It is management’s judgment that the preliminary exploitation license will be
granted in not more than the next twelve months.
On November 14, 2013, the Company closed a Purchase Agreement with Mesco which extends their
existing land package from 6 square kilometers to 12 square kilometers to include Angkor’s recently
identified Blue Lizard prospect. The financial statements are prepared in accordance with International Financial Reporting Standards. All financial information is presented in Canadian dollars, unless otherwise specified.
FORWARD‐LOOKING STATEMENTS
This MD&A may contain forward‐looking statements. Such statements involve known and unknown risks, uncertainties and other factors outside management’s control that could cause actual results to differ materially from those expressed in the forward‐looking statements. The Company does not assume responsibility for the accuracy and completeness of the forward‐looking statements and does not undertake any obligation to publicly revise these forward‐looking statements to reflect subsequent events or circumstances. Readers are cautioned not to place undue reliance on these forward‐looking statements, which speak only as of the date the statements were made, and readers are advised to consider such forward‐looking statements in light of the risks set forth below. SELECTED FINANCIAL INFORMATION
The following is selected financial data from the Company’s consolidated financial statements for the twelve month period ended July 31, 2013 and the last two years, ending July 31, 2012 and 2011. Years ended
July 31, 2013
July 31, 2012
July 31, 2011
Total revenues $ - $ - $ -
Net income (loss) for the period (1,034,484) (3,068,187) (3,710,432)
Earnings (loss) per share (0.01) (0.05) (0.36)
Earnings (loss) per share – fully diluted (0.01) (0.05) (0.36)
Cash and cash equivalents 1,321,170 1,371,441 457,085
Total assets 12,518,058 10,582,533 5,966,194
Total long-term liabilities 327,478 110,309 -

4
CORPORATE DEVELOPMENT AND STRATEGY
OVERVIEW The season started slowly, but once the rains were over and funding was in place, exploration moved into high gear, with an immediate dividend from the hard work and expense over the previous 18 months in researching and developing systematic termite mound geochemical sampling to replace auger sampling. By deploying no more men in the field, sampling rate increased fourfold. Whereas over the previous 3 years some 20,000 samples had been collected by auger sampling; in this year alone, field teams collected well in excess of 30,000 samples. This would have caused a massive cost in assays, had Angkor processed them through a commercial laboratory by standard fire assay for gold and by ICP‐MS for base metals. However, gold was assessed by simple pan concentration of one half of the sample, while the other was analysed in‐house by XRF. The result has been a significant reduction in unit assay costs to about 12% of previous levels. Constant and diligent application of stringent QA/QC protocols have ensured that this was achieved with very little compromise in confidence levels. Other innovations this year include the introduction of ongoing, in‐house ground geophysics as a standard follow‐up tool, including VLF‐EM, using 2 Geonics EM‐16 instruments; total field radiometrics using a hand held scintillometer; total field and gradiometric magnetics using a proton precession magnetometer; and natural or spontaneous potential, using an instrument created in‐house. In addition, detailed field mapping by geologists has been supplemented by extensive clay alteration surveys, using a Terraspec reflected light spectrometer. None of this could have been achieved without the enthusiastic hard work of our international geological team, under the leadership of the Exploration Manager, Kurtis Dunstone. Their invaluable contribution to this work is gratefully acknowledged. Otray, Dokyong and Okalla have become the main foci of our attention, and the complex geology of these prospects necessitated some advanced petrographic studies to unravel their lithologies. These were supplemented by ore microscopy on selected samples and specimens. As the company has no specialized equipment for this research, it was done commercially, but the expansion of our understanding of these key prospects justifies those additional costs. To cope with the level of data that has been, and is being, accumulated, the team expanded to include a database manager. Further, the complexity of some geological problems needed sophisticated solutions, and to this end the company has undertaken some serious academic research; supporting postgraduate studies at University of Exeter’s Camborne School of Mines, UK, on one prospect; and sponsoring research by one of our geologists on another key prospect at the Mineral Deposit Research Unit of the University of British Columbia. Aside from exploration on the 5 exploration licenses held, we continue aggressively to investigate other opportunities in Cambodia. Over a dozen properties, including those under Exploration and Mining Licences, Memoranda of Understanding and some unstaked ground, have been examined during the year; generally with a view to buy, farm‐in or joint venture, and some investigations are ongoing. These are time consuming, occasionally requiring exhaustive field work by large teams collecting data and samples for analysis, with no guarantees that the projects will be worthwhile. For obvious reasons, details must remain confidential, but since the end of the year the company has signed agreements to acquire 2 further licenses.

5
STREAM SEDIMENT SURVEYS Infill stream sediment (SSED) sampling was done on various locations of Oyadao, Oyadao South, Andong Meas, Banlung and Banlung North Tenements, which were not previously sampled by LMI, as it was perceived that there was only basalt in these areas based on the Russian and French geological maps. Further investigation has shown that streams in these areas have in most instances, cut through the basalt cap and exposed the rocks below, which is of great value in our exploration efforts. Sampling locations can be seen on the maps below.

6
The stream sediment locations are the red numbers with a white outline.
The following are the numeric statistics for all tenements for this year: TENEMENT PROSPECT ROCK CORE TERMITE PANCONS SIEVED XRF SSED
Andong Meas Various 51 - - - - 2,867 61 China Wall 6 - - - - 1,181 - Oyadao Various - - - - - - 50 Patang - - 4,552 1,796 2,253 3,571 - Oyadao South Various - - - - - 990 51 Dokyong 35 - - 1,888 - 2,943 - Otray 108 - 8,896 10,306 10,726 8,896 - Otray East - - - 2,096 6,000 4,458 - Banlung Various 16 - - - - - 30
Okalla 36 - 5,855 9,740 7,626 11,052 - BL13-039D
BL13-040D - 391 - - - - - BL13-041D - 368 - - - - - BL13-042D - 89 - - - - - BL13-043D Central Gabbro 3 - - 2,700 - 2,440 - Banlung Nth Kunmum - - 7,455 2,840 120 - 57 Siem Pang West Koulapuk 35 - 5,862 4,791 6,990 6,441 - Koan Nheak Koan Nheak - - 1,334 - - - - REGIONAL Memot 34 - 200 400 400 200 - Maxum East 11 - - - - - -
ALS Coefficient’s Multi-element Pulps - - - - - 5,016 -
Total 335 848 34,154 36,557 34,115 50,055 1,014
The apparent disparity between samples collected, sieved, assessed by panning and analysed by XRF reflects the calibration samples run (Coefficients) and backlog catch‐up. All work was preceded by UXO clearance teams.

7
ANDONG MEAS CURRENT OPERATIONS Towards the end of last year, methodical sampling of the Chinese Wall pit and Vietnamese adit and 3 diamond drill holes returned sporadic gold values scattered but exceptionally high molybdenum and tungsten values. Granite is the main rock type near surface with weak cross quartz veins and fractures. Diorite is intercepted in depth and shows moderate to weak copper mineralization (Cu< 1000 ppm). Mafic Dykes occur as xenoliths and have better mineralization of copper, molybdenum and gold. There is better mineralization in the contact between the granite and diorite. All lithologies are affected by milky quartz veins from 1 cm to 42m wide, but with no significant mineralization. The use of reflected light spectroscopy (Terraspec) to provide qualitative field data on alteration assemblages proved very successful in defining exploration targets more precisely, particularly with regard to their origins. There is a leached zone below surface which has hematite at the top grading to jarosite at the bottom. Phyllic alteration is present mainly in the granitic rocks, whereas the diorite is phyllic at the contact with granite and thereafter is mainly weak propyllic to fresh. Mafic dyke intervals are propylitic. Plane of drillhole projections demonstrate how values are concentrated on the granite‐diorite interface.
Geological reconnaissance over about ¼ of the tenement to verify areas of previous rock sampling with elevated mineralisation values, and validate an intrusive body in the high magnetic anomaly 4km northwest of China Wall was completed early in the season. A program of mapping and termite mound sampling was started, but was shortly contracted, then postponed to allow concentration of effort to complete other programs first. Much later in the season a camp was established, but the exploration effort was almost immediately abandoned when the early rains made logistics difficult.

8
The reconnaissance had indicated a vein‐related area of abandoned illegal mining within the Wild Boar prospect in the central‐east of the tenement. This forms a logical western extension to the Patang exploration effort in Oyadao exploration license. The numerous diggings on this vein system, which became known as Khmer mine, were cleared, surveyed, sampled, trenched and mapped. The diggings, sited on quartz veining form a fair potential diamond drill target, with quartz float containing oxidized sulphides extending 2200m northwest of the mining area. Again, as the rains approached, access became difficult, and operations were suspended. There is also a possible porphyry system beneath the strong magnetic high in the northwest. Of interest is the discovery of limestone, including float of endoskarn material with epidote alteration, magnetite, and molybdenite, in the reconnaissance area, which opens avenues for potential skarn targets, and trenching 280m southeast, and abundant quartz float with ex‐sulphide 1400m west, of China Wall. The early onset of the wet season also forced curtailment of further reconnaissance and a termite mound follow‐up geochemical survey, including the low magnetic area immediately west of China Wall. This becomes a priority for early next dry season.
9
BANLUNG OKALLA This remains a prospect of particular interest, where last season 2644m in 11 holes were drilled. The table below details the more significant intercepts in holes drilled in the western quadrant of the Okalla Prospect. Hole BL11‐026 is the only one that punched right through the mineralized stockwork zone of the porphyry:
Hole EAST NORTH TD (m) From To m Au g/t Cu % Mo % Ag g/t BL10-010D 716780 1504825 150.20 39.20 66.00 26.80 0.29 0.07 0.004 0.36 BL10-020D 716550 1504935 100.10 0.00 61.00 61.00 0.30 0.10 0.006 0.60 BL10-021D 716480 1504900 125.10 12.00 52.80 40.80 0.20 0.14 0.005 0.68 BL11-026D 716549 1504935 300.20 54.00 122.90 68.90 1.35 0.10 0.009 0.67 BL11-027D 716479 1504900 300.40 44.00 89.80 45.80 0.32 0.14 0.002 0.56 BL12-030D 716656 1504896 355.00 22.70 98.00 75.30 0.20 0.05 0.005 0.81 BL12-033D 716549 1504935 249.90 0.00 57.00 57.00 0.20 0.09 0.008 1.20 BL13-041D 716750 1504800 302.60 5.00 21.70 16.70 0.13 0.06 0.035 0.25
All cores from Okalla were fully re‐logged, coupled with a detailed alteration study by Terraspec, following which, the area was mapped in detail, greatly facilitated by unprecedented slash‐and‐burn land clearance by local peasant farmers, who have clear‐cut most of the surrounding forest. In consequence, we have been able to cover a lot of ground to the east and north of the previously mapped and drilled area, greatly aided by rapid pancon gold prospecting of termite mounds. The results are everything we could wish for.
Recent deforestation at Okalla
Deforestation allowed us to find numerous outcrops of the quartz vein stockwork hitherto only observed in cores, and revealed appreciable illegal colluvial and alluvial workings.
Stockwork in core BL10-026 Stockwork in outcrop
Ongoing mapping showed that Okalla diorite intrusive extends north and west of the basalt tongue, and that the mineralized quartz vein stockwork forms a ring structure within the diorite intrusive. The heart of the ring is strongly potassic barren diorite, whereas outside the ring the diorite and the sedimentary
10
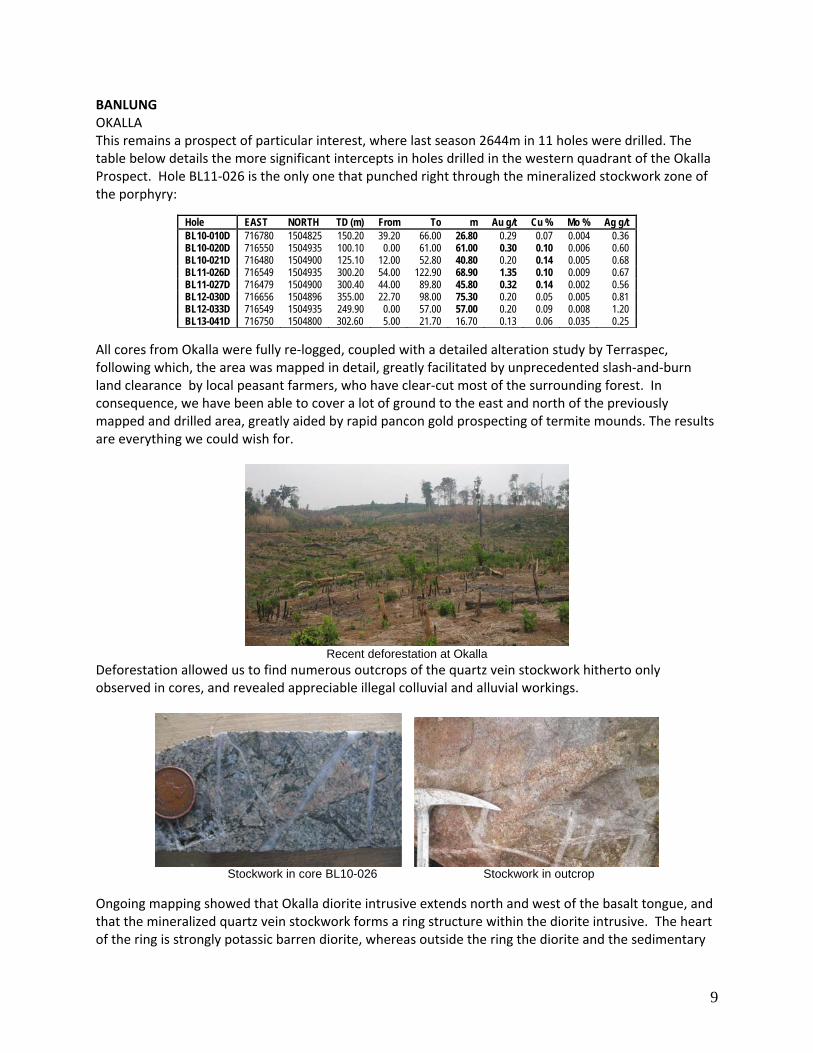
rocks which it intrudes show a propyllitic overprint on the potassic alteration. The diorite of the intrusive outside of the mineralized ring is essentially barren. An extensive termite mound geochemical survey, which is ongoing, shows an interesting phenomenon. Although most gold colours occur within the mapped limits of the diorite, there is a distinct “tail” continuing 3500m westwards into indurated and silicified Permian sediments. It is not clear whether this is a function of erosion, suggesting that intrusion and mineralization predate the sediment, or of mineralization permeating the sediments, which is more likely.
Recent geological mapping in the Okalla area
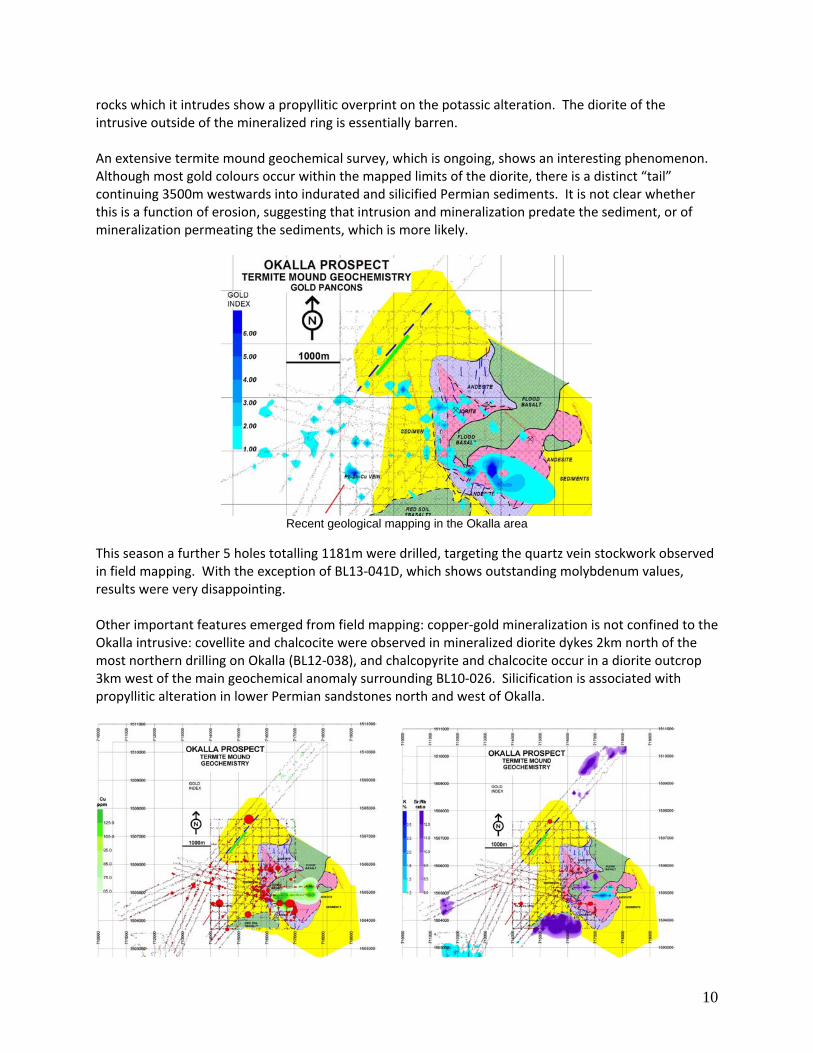
This season a further 5 holes totalling 1181m were drilled, targeting the quartz vein stockwork observed in field mapping. With the exception of BL13‐041D, which shows outstanding molybdenum values, results were very disappointing. Other important features emerged from field mapping: copper‐gold mineralization is not confined to the Okalla intrusive: covellite and chalcocite were observed in mineralized diorite dykes 2km north of the most northern drilling on Okalla (BL12‐038), and chalcopyrite and chalcocite occur in a diorite outcrop 3km west of the main geochemical anomaly surrounding BL10‐026. Silicification is associated with propyllitic alteration in lower Permian sandstones north and west of Okalla.

11
Strangely, this copper dispersion outside of the main diorite intrusive is not reflected in the geochemistry survey of the termite mounds. The copper is confined to the original diorite, and to the area roughly 2km long oriented east‐west south of the overlying basalt tongue. Gold, as evidenced by the gold index of pan concentrates of the termite mounds, depicted on the copper map by the red circles, is concentrated on much the same area as the copper, but as suggested above does form a tail out to the west. The distribution of potassium is interesting. Highest values occur within the heart of the diorite intrusive, exactly as one would expect from field observations of the distribution of potassic metasomatism. What requires some investigation is the high potassium values in the extreme southwest. This is an area of randomized sampling on a reconnaissance basis, but it returned very strong potassium in the termite mounds. The anomaly coincides with the extreme northeastern edge of the so‐called Central Gabbro. A low Rubidium:Strontium ratio is suggestive of high sulphidation in an epithermal environment. It also tracks extrusive volcanic activity. It is no surprise, that the Sr:Rb ratio shows strong positive anomalism coinciding with the outcrop of Quaternary flood basalts in the southeast, east and northeast. What is more interesting, however, is the isolated anomaly in the southwest. Again, this calls for some investigation on the ground. There is a strong structural component to the emplacement of Okalla diorite, its satellites, and the associated mineralization. The most fundamental structure is the repeated 035o fracturing, parallel to the Okan Fault that confines the mineralization and alteration in the east. A secondary feature, equally important in localizing mineralization, is a fracture direction of 100o, most prominently shown in the diamond drill holes. The “basalts” to the north and east are not all Quaternary, and not all are basalts! Beneath the Tertiary basalts are extrusive andesites, commonly with sulphide‐rich quartz veins, on some of which there are artisanal pits. Okalla diorite intrusive is not alone: there are other similar, albeit smaller, bodies outcropping to the north and west. Katieng diorite is but one of these bodies; and aeromagnetic evidence suggests that further similar intrusive diorites underlie the flood basalts to the north and east. Mapping and termite sampling to the north of Okalla naturally spilled over into Banlung North tenement, and is ongoing.

12
Observed diorite intrusives in the Okalla area.
In a petrographic study completed this year on some of the drillhole core, the abundance of plagioclase feldspars indicates an andesitic to dioritic composition, with microstructures that indicate a magmatic origin. The andesitic samples, which are porphyrytic hypabyssal rather than volcanically emplaced, show moderate to strong alteration (calcite‐chlorite‐quartz) with clay alteration and associated pyrite‐epidote‐chalcopyrite in some areas. Subhedral magnetite, which suggests a magmatic origin, also occurs in the andesites, but which could be indicative of postmagmatic hydrothermal activity. The other samples range from diorite to monzodiorite, with potassic metasomatism yielding microcline feldspars, biotite and magnetite and post magmatic propylitic alteration. Coupled with the petrographic study, 312 core sampled were analyzed by reflected light spectroscopy to determine the clay mineral alteration facies of the lithological assemblage. Coupled with the alteration assemblage study of the surface rocks, this has allowed a very clear picture to emerge of the porphyry. OYADAO PATANG The prospect was originally highlighted by multi‐element anomalies in contiguous catchments in a stream sediment geochemical survey by LMI in 2008. This season, 5889 termite mound samples were collected from an area of 5km2 on lines with 200m spacings. This geochemical survey was accompanied by detailed geological mapping. An additional 1395 samples had been collected further to the southeast in a previous survey, and these results, together with a pilot VLF‐EM survey were incorporated into the assessment. There is a strong arsenic‐copper‐lead‐zinc anomaly in the northwest, striking 045o over an area of at least 1000m diameter. The anomaly may in fact be a double anomaly, “smudged” together by the wide sampling line interval and localized by at least 2 fractures striking 015o; lying about 600m apart. Mapping showed silica flooding in this area, and chalcopyrite‐pyrite veining in paragneiss was noted at the red star on the map, and pan concentrates returned a modest gold index, almost all confined to these and 2 parallel fault features further east.

13
In the southeast, where an interesting gold anomaly was detected by standard fire assay of the termite mound samples in a separate exercise last season, the Phum Puik prospect was subjected to further termite mound sampling; extending the grid westward, and resampling the mounds in north‐south traverses, which had not been possible on the first pass. The result is another good gold showing in the southeast, and an excellent showing in the southwest. The southeast gold is associated with narrow sulphide‐rich quartz‐carbonate veining, similar to the veins of the Border Prospect, sold in January to All Solutions (Cambodia) Co. Ltd.. The subcrop is of limited extent, but the paragneiss host‐rock, intensely folded with strong metamorphism up to almandine‐amphibolite facies, is identical to that of the Border prospects, and further investigation is definitely warranted.
The concentration of gold colours in the centre south of Phum Puik prospect is enticing, but the proximity of the Sesan makes one suspect that the values may be alluvially emplaced by the river. However, there is anomalous arsenic in the termite mounds in this area, as shown in the more detailed maps below, which supports the gold having an epithermal or hydrothermal rather than alluvial origin. Lead shows a similar spatial distribution in the west of the detailed area.
There are 2 further areas of anomalous mineral concentration in the Phum Puik prospect. Note the coincidence of arsenic, lead, copper and zinc in the south, just to the east of centre. This covers an ellipse of some 200m x 300m in area, possibly related to the northeast trending faulting shown on the
CHALCOPYRITE

14
satellite map geological interpretation. The other area is the anomaly traced by copper and zinc over >300m in the east, striking almost 080o.
Detailed mapping has mostly indicated sediment cover over the majority of the Phum Puik prospect, though there are some very geologically interesting subcrops, directly in line with the geochemical anomalies in the east. The subcrop is of quartz‐carbonate veins with ex‐sulphide mineralization in a host‐rock of paragneiss, similar to that of the Border prospects. The subcrop is of limited extent, but further investigation is definitely warranted. The geological mapping is still being compiled, but it has already shown a diorite intrusive into intensely folded paragneiss with strong metamorphism up to almandine‐amphibolite facies, with scattered sulphide rich quartz veins, generally aligned with the fracture system.
Sulphide rich quartz-carbonate outcrop
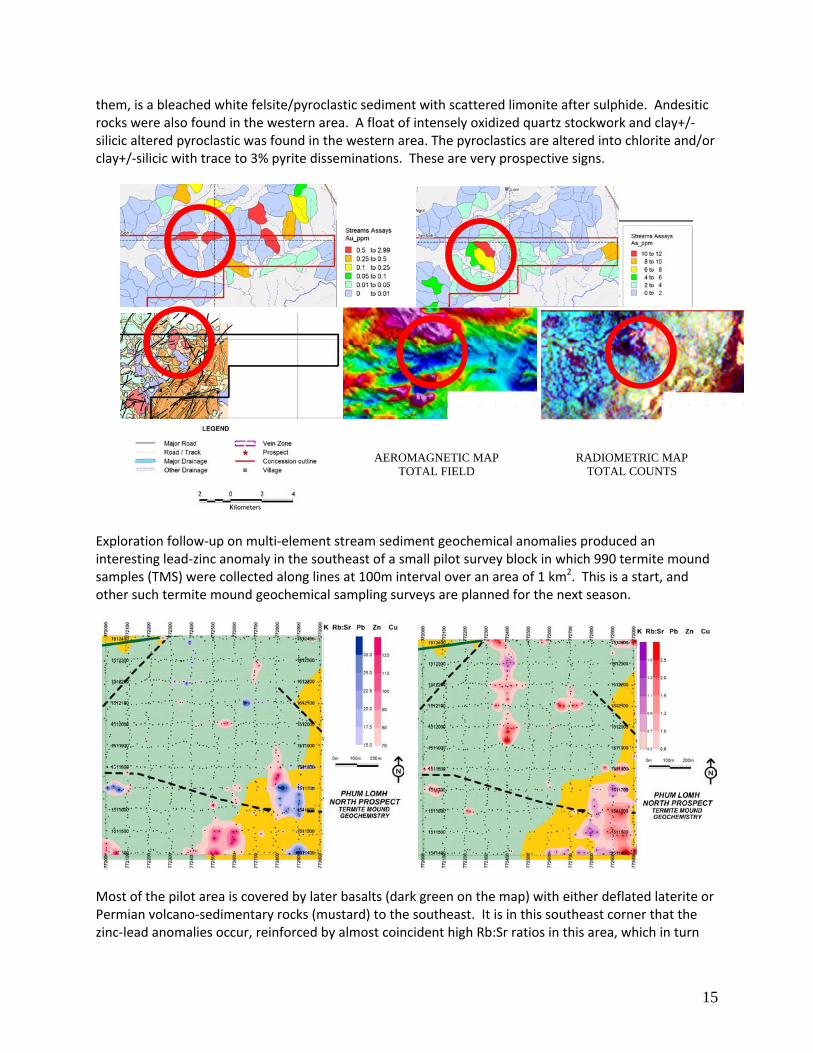
PHUM LOMH Stream sediment reconnaissance sampling in 2010 had indicated several strongly anomalous areas in the extreme southeast of the Exploration License area. The prospect straddles the boundary between Oyadao and Oyadao South Licenses. Geological reconnaissance in this general area has been greatly improved by jungle clearance for a rubber plantation, and several quite passable tracks. The initial work on Phum Lomh consisted of 20 kilometres of roadside mapping to confirm the geology by Dr Lockett. Outcrop within the prospect area indicates that the east part is mostly adamellite, clean and barren; intruded by central hornblende granite. In the west however, the area is underlain by pyroclastics, locally showing traces of sulphide (pyrite perhaps), faulted against the adamellite in the east. Further west of these, and possibly overlying
15
them, is a bleached white felsite/pyroclastic sediment with scattered limonite after sulphide. Andesitic rocks were also found in the western area. A float of intensely oxidized quartz stockwork and clay+/‐silicic altered pyroclastic was found in the western area. The pyroclastics are altered into chlorite and/or clay+/‐silicic with trace to 3% pyrite disseminations. These are very prospective signs.
Exploration follow‐up on multi‐element stream sediment geochemical anomalies produced an interesting lead‐zinc anomaly in the southeast of a small pilot survey block in which 990 termite mound samples (TMS) were collected along lines at 100m interval over an area of 1 km2. This is a start, and other such termite mound geochemical sampling surveys are planned for the next season.
Most of the pilot area is covered by later basalts (dark green on the map) with either deflated laterite or Permian volcano‐sedimentary rocks (mustard) to the southeast. It is in this southeast corner that the zinc‐lead anomalies occur, reinforced by almost coincident high Rb:Sr ratios in this area, which in turn
AEROMAGNETIC MAP TOTAL FIELD
RADIOMETRIC MAP TOTAL COUNTS

16
coincide with strong potassium in the termite mounds. These elements are suggestive of volcanic activity and associated low sulphidation mineralization. That they occur on a fault line striking 105o further enhances the possibilities. The survey area will be expanded towards the southeast.
Crosscutting quartz veinlets in a microstockwork fragment of float, Phum Lomh prospect.
BANLUNG NORTH KATIENG During mapping and termite mound geochemical sampling of the area to the north and west of Okalla, following up naturally led further northward, to overlap onto the Banlung North tenement. It is not proposed to break down the two areas purely on the basis of their legal descriptions. They are both a part of the same overall whole and work on the Katieng prospect is adequately covered in the section on Okalla prospect (Banlung tenement). KUNMUM The 2010 survey and mapping showed a very strong geochemical ‘C’ zone augered soil anomaly for gold and arsenic in the southeast of the grid area. These anomalies are coincident with a multiple narrow quartz vein stockwork in a roof pendant xenolith of hornfelsic sedimentary rocks in the Trapean Kraham granodiorite. There are strong stream sediment gold anomalies here from the original LMI survey and some gopher‐hole artisanal pitting and colluvial placer mining in the area as well. In July, with the return of the crews from Koulapuk, and because the area is readily accessible even in the wet, the long delayed follow‐up termite mound survey on Kunmum was finally started with the deployment of almost the full strength of the company’s geology department. The survey overlapped the previous grid and extended well to the east and south. With such an aggressive campaign, sampling was completed within a month, with duplicate samples collected from 7498 termite mounds on lines 200m apart over an area of 12km2. The Kunmum camp was shut down on the 12th of September following the completion of the termite mound pancon sample processing.

17
The purple circles on the above map represent anomalous gold indices from termite mound pan concentrates, but show no spatial relationship to the contoured tones of pink (Au) and blue (As) that represent the augered ‘C’ zone soil samples. XRF analyses of the sieved termite mound samples are anxiously awaited. OYADAO SOUTH DOKYONG, OTRAY AND BLUE LIZARD Last season, Dokyong, in the extreme south of the tenement, promised much when augered ‘C’ zone soil sampling produced at least 5 strong multi‐element geochemical anomalies. By integrating this work with the aeromagnetic, aerial radiometric air photo interpreted geology mapping of the whole tenement, it was obvious that this was part of a greater system, the prime locus of which was the fracture zone that strikes 010o and connects the Dokyong prospects with Phum Syarung prospect, which Angkor recently sold to Mesco Gold. This season, the focus was on this “Connector Fault Corridor”, and a field camp was established at a roughly central location beside the river Tray. The prospect that emerged became Otray. The first phase of exploration of Otray prospect was completed towards the end of May 2013. The program involved the collection of 11,461 termite mound samples (TMS) over an area of 15km2. Samples were taken from all termite mounds within a 20m corridor along linear north‐south and east‐west traverses at 200m intervals (in some areas at 100m intervals) coupled with ground magnetics, EM, scintillometer surveys, reflected light spectroscopy (Terraspec) on fresh rock specimens, and detailed
18
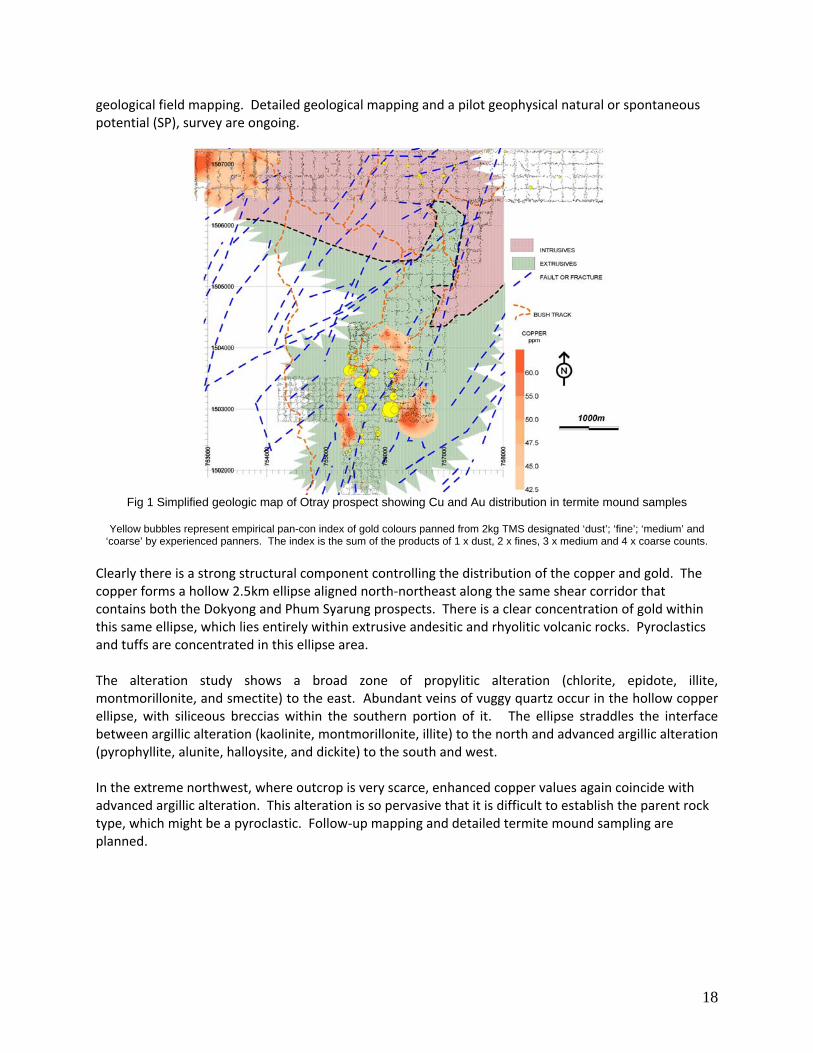
geological field mapping. Detailed geological mapping and a pilot geophysical natural or spontaneous potential (SP), survey are ongoing.
Fig 1 Simplified geologic map of Otray prospect showing Cu and Au distribution in termite mound samples
Yellow bubbles represent empirical pan-con index of gold colours panned from 2kg TMS designated ‘dust’; ‘fine’; ‘medium’ and
‘coarse’ by experienced panners. The index is the sum of the products of 1 x dust, 2 x fines, 3 x medium and 4 x coarse counts.
Clearly there is a strong structural component controlling the distribution of the copper and gold. The copper forms a hollow 2.5km ellipse aligned north‐northeast along the same shear corridor that contains both the Dokyong and Phum Syarung prospects. There is a clear concentration of gold within this same ellipse, which lies entirely within extrusive andesitic and rhyolitic volcanic rocks. Pyroclastics and tuffs are concentrated in this ellipse area. The alteration study shows a broad zone of propylitic alteration (chlorite, epidote, illite, montmorillonite, and smectite) to the east. Abundant veins of vuggy quartz occur in the hollow copper ellipse, with siliceous breccias within the southern portion of it. The ellipse straddles the interface between argillic alteration (kaolinite, montmorillonite, illite) to the north and advanced argillic alteration (pyrophyllite, alunite, halloysite, and dickite) to the south and west. In the extreme northwest, where outcrop is very scarce, enhanced copper values again coincide with advanced argillic alteration. This alteration is so pervasive that it is difficult to establish the parent rock type, which might be a pyroclastic. Follow‐up mapping and detailed termite mound sampling are planned.

19
. Fig 2 Simplified geologic map of Otray prospect showing distribution of specific lithologies.
Fig 3 Map of Otray prospect showing distribution of alteration facies
Blue Lizard Prospect to the northeast of Otray comprises at least 2 quartz veins with chalcopyrite, chalcocite and covellite in argillic alteration in a granitic environment. Trenching is ongoing, showing a strike of 000o to 030o and dipping 55o to the east and southeast. Thickness is still not clear. The property is exactly due south of Phum Syarung, which lies 3.5km to the north. The original Mesco property line is 400m north of Blue Lizard. Very detailed mapping and infill sampling has started, to be followed by a geophysical survey.

20
The most interesting assay results are summarized below, with a few worth mentioning.
SampleI_ID UTM_E UTM_N Au Ag As Cu Mo Pb Zn
Additional Metals ppm ppm ppm ppm ppm ppm ppm
1635441 755769 1502034 0.06 0.5 611 73 333 44 7 Sb- 54 ppm, Te -10 ppm 1635443 755848 1502377 0.12 3.9 24 63 42 273 6300 Cd-59.1 ppm 1635444 756402 1502754 0.02 12 260 144 41 49 V-108 ppm 1635445 756214 1501327 40 581 4 11 1635449 756775 1502201 26 363 22 15 1635450 756849 1502470 2.4 3 121 319 1485 21 1635451 756775 1502201 0.9 47 573 1000 16
Assay Highlights
Gold results are low, but there were some interesting base metal pathfinders (most notably Mo) and epithermal indicator elements (Sb and Te in 1635441). Sample 1635443 has elevated zinc (6300ppm) as well as 59 ppm cadmium along with minor Au, Ag, and Pb: further strong evidence of mineralization akin to Phum Syarung. Samples 1635450 and 1635451 had anomalous Pb (>1000 ppm), which at Phum Syarung was typically associated with, or close to, gold mineralization. Malachite was observed in veinlets in the wall rock in one area that will be followed up with detailed mapping and geophysics during the 2013‐14 field season. The anomalous polymetallic nature of these results highlights numerous areas for follow‐up groundwork in the dry season. “Where there is smoke, there is fire”, will hopefully prove true in the structural corridor. The complex geology of Otray and Dokyong prospects, and the great potential suggested by exploration to date prompted the Project Geologist, Craig Richardson, to commence research towards a higher degree on the area. Angkor is pleased to sponsor him in this endeavour with a grant‐in‐aid at the Mineral Deposits Research Unit at University of British Columbia.
OTHER PROJECTS KOAN NHEAK With the excellent cooperation of MIME, the Koan Nheak project was re‐examined in February 2013, when a full team of geologists and samplers ran a “blitz” examination of the property, which lies immediately south of the town of the same name in the northeast of Mondulkiri Province. It covers three prospects of interest in 171 km2: Peacock in the west, centred on a diorite intrusive surrounded by multiple stream sediment geochemical anomalies. One field sample returned greater than 3 g/t Au. In the east the East Ring Prospect is centred on a very much smaller diorite with strong anomalous gold in the stream sediment survey; and in the south two contiguous arsenic anomalies occur in the stream sediment survey. On Peacock Prospect, VLF (13 km), Scintillometer (14.5 km) , Magnetometer (14.5 km), Geology mapping (17 km2) and termite sample surveys (1334 samples) were done over an area where there are numerous quartz veins with sulphides, and some coincident Au and Cu anomalies with malachite and azurite. These surveys coupled with the ALS geochemical results have highlighted several follow‐up granitoid intrusive related exploration targets (porphyry and epithermal) for the 2013‐14 field season.

21

22
The termite mound geochemistry yielded some exciting results. An area in the west of Peacock, where the VLF‐EM suggested there should be a conductor striking 045o, which is corroborated by a northeast striking fracture on Dr Lockett’s satellite geology interpretation, shows a strong copper‐zinc anomaly, covering an area of some 500m diameter. This is the area where copper staining was observed in field mapping, occurring within a diorite intrusive. This coincides with a Rubidium:Strontium ratio low, which is suggestive of high sulphidation epithermal mineralization. The corresponding Rubidium:Strontium high, and the expected potassic high lies to the west, coinciding with an arsenic anomaly. On the basis of the field work conducted, an application for an exploration license over the area was made. In late September, 2013, MIME approved the application and signed an agreement to grant such a license to Angkor Gold. KOULAPUK Again, with the kind cooperation of MIME, the southwestern part of the Siem Pang project was re‐examined in June and July 2013, when a full team of samplers ran a “blitz” examination of the eastern portion of the Koulapuk prospect. In company with the team was a graduate student, Owen Gifford, from the Camborne School of Mines, Exeter University whom Angkor supported in a research project, mapping the geology of the area.

23
An arsenic anomaly of over 1500m strike length along 055o in the north‐centre of the mapped area, reflecting an alteration zone in the sedimentary rocks beneath is of interest, because it coincides with a weaker lead and zinc showing centred on the same feature. A second, much stronger parallel arsenic feature lies 700m south of here, with minor associated zinc highs. The most interesting anomaly is a further 2km to the south, where there are coincident arsenic, lead and zinc anomalies over 1000m strike along that same parallel direction.
The barrenness of the siliceous cap in the northwest is not unexpected: what lies beneath should be interesting. The triple parallel arsenic‐lead‐zinc anomalies in the centre and east are suggestive of epithermally generated narrow quartz veining. The lead‐zinc anomalism is corroborated by galena and sphalerite occurrences recorded in the field, and by unsolicited anecdotal evidence from a district community leader of a large “lead” deposit “near Phnom Koulapuk”. The company has started the process of applying for an exploration license over the area. MEMOT In April, 2013, a reconnaissance mission investigated this property, which is an abandoned gold mine previously worked by Sino Sun after it was offered to the company by MIME. While some excellent values were returned in the rock chip and ore stock‐pile grab sampling, in the absence of professionally created abandonment survey plans and reports, it became apparent that the only rational way to assess the property would be to dewater the old workings, make safe and conduct a full underground survey, mapping and sampling. This is clearly outside the financial abilities of the company and the offer was declined. ANALYTICAL PROCEDURES As a part of the ongoing QA/QC maintenance, the company runs check assays between the ALS‐Chemex ICP‐MS base metal determinations, and both XRF instruments A and B. A total of 962 such comparative analyses were made this season. In addition, blind standards, blanks, cross checks and repeats are inserted at regular intervals into the sample sequence. The first figure depicts copper values in standard NIST 2781 which was analyzed 563 times in the sequence by Instrument ‘A’. With an arithmetic mean of 519.4, the standard deviation is 13.36 ppm, or 2.6%. This is only just acceptable.

24
Note how at point ‘A’ there was a sequence of aberrant results from the instrument. This was assessed and an adjustment made. At point ‘B’ a sharp upward jolt in analytical results reflects a calibration reset. At point ‘C’, the second instrument was added to our arsenal. Note how this has consistently read low, compared to instrument ‘A’. This is reflected in other testing. At point ‘D’ there is another sequence of aberrant results, which is currently being corrected. The results from Instrument ‘B’ show only 216 samples analysed, but with an arithmetic mean of 505.7ppm and a standard deviation of 9.43 (1.9%), the consistency is far more acceptable.
In cross checking, results from the regular sample runs are cross checked against results the other XRF instrument. The copper results, shown in the green diagram below, show an excellent correlation coefficient of 0.998, with a slope of 1.03:1.00 and a back intercept of ‐0.56. although results from instrument ‘B’ run marginally lower than those from instrument ‘A’. Evidently, in the lower values, there is more discrepancy than in the higher values, deliberately exaggerated by plotting on a lognormal scale. This is quite as one would expect, for 2 simple reasons:
1. There are fewer higher values, so the few there are take on a far greater weight that a single lower value which is one of many
2. As values increase, so the relative precision increases because the absolute precision remains constant. For example a measurement of 10ppm is accurate to, say +10ppm (100% drift): so is a measurement of 100ppm (10% drift): so is a measurement of 1000ppm (1% drift).
In repeat sampling, random samples are renumbered and rerun on the same instrument. In the blue and red diagrams, the copper results for some 260 samples repeat analysed on XRF instruments ‘A’ and ‘B’ are shown. Both show excellent repeatability, although one aberrant result was noted on instrument ‘A’.
25
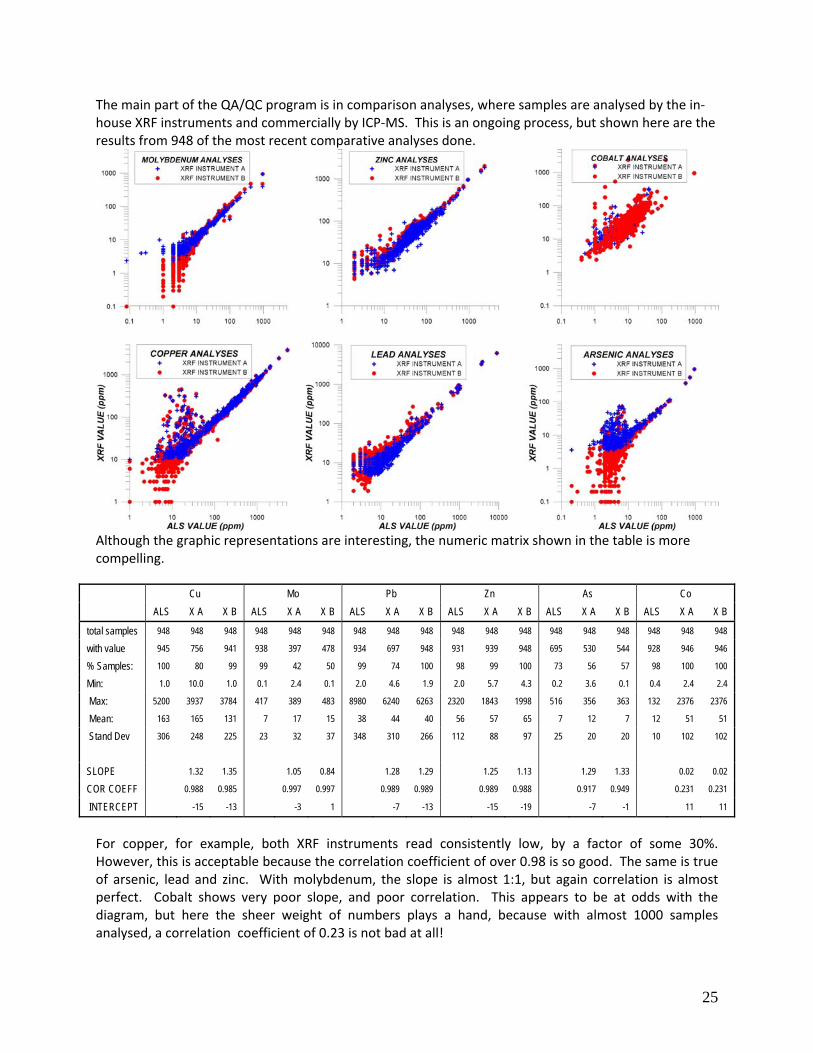
The main part of the QA/QC program is in comparison analyses, where samples are analysed by the in‐house XRF instruments and commercially by ICP‐MS. This is an ongoing process, but shown here are the results from 948 of the most recent comparative analyses done.
Although the graphic representations are interesting, the numeric matrix shown in the table is more compelling.
Cu Mo Pb Zn As Co
ALS X A X B ALS X A X B ALS X A X B ALS X A X B ALS X A X B ALS X A X B
total samples 948 948 948 948 948 948 948 948 948 948 948 948 948 948 948 948 948 948
with value 945 756 941 938 397 478 934 697 948 931 939 948 695 530 544 928 946 946
% Samples: 100 80 99 99 42 50 99 74 100 98 99 100 73 56 57 98 100 100
Min: 1.0 10.0 1.0 0.1 2.4 0.1 2.0 4.6 1.9 2.0 5.7 4.3 0.2 3.6 0.1 0.4 2.4 2.4
Max: 5200 3937 3784 417 389 483 8980 6240 6263 2320 1843 1998 516 356 363 132 2376 2376
Mean: 163 165 131 7 17 15 38 44 40 56 57 65 7 12 7 12 51 51
Stand Dev 306 248 225 23 32 37 348 310 266 112 88 97 25 20 20 10 102 102
SLOPE 1.32 1.35 1.05 0.84 1.28 1.29 1.25 1.13 1.29 1.33 0.02 0.02
COR COEFF 0.988 0.985 0.997 0.997 0.989 0.989 0.989 0.988 0.917 0.949 0.231 0.231
INTERCEPT -15 -13 -3 1 -7 -13 -15 -19 -7 -1 11 11
For copper, for example, both XRF instruments read consistently low, by a factor of some 30%. However, this is acceptable because the correlation coefficient of over 0.98 is so good. The same is true of arsenic, lead and zinc. With molybdenum, the slope is almost 1:1, but again correlation is almost perfect. Cobalt shows very poor slope, and poor correlation. This appears to be at odds with the diagram, but here the sheer weight of numbers plays a hand, because with almost 1000 samples analysed, a correlation coefficient of 0.23 is not bad at all!
26
OVERALL PERFORMANCE FOR THE REPORTING PERIOD
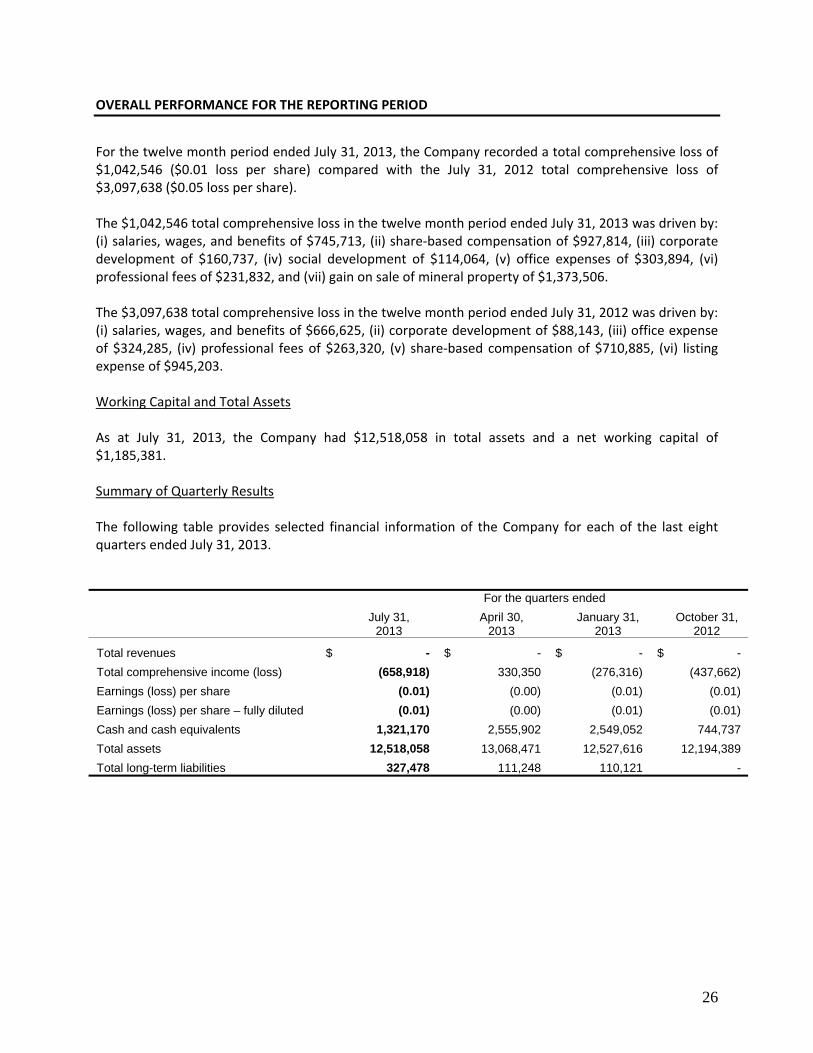
For the twelve month period ended July 31, 2013, the Company recorded a total comprehensive loss of $1,042,546 ($0.01 loss per share) compared with the July 31, 2012 total comprehensive loss of $3,097,638 ($0.05 loss per share). The $1,042,546 total comprehensive loss in the twelve month period ended July 31, 2013 was driven by: (i) salaries, wages, and benefits of $745,713, (ii) share‐based compensation of $927,814, (iii) corporate development of $160,737, (iv) social development of $114,064, (v) office expenses of $303,894, (vi) professional fees of $231,832, and (vii) gain on sale of mineral property of $1,373,506. The $3,097,638 total comprehensive loss in the twelve month period ended July 31, 2012 was driven by: (i) salaries, wages, and benefits of $666,625, (ii) corporate development of $88,143, (iii) office expense of $324,285, (iv) professional fees of $263,320, (v) share‐based compensation of $710,885, (vi) listing expense of $945,203. Working Capital and Total Assets As at July 31, 2013, the Company had $12,518,058 in total assets and a net working capital of $1,185,381. Summary of Quarterly Results The following table provides selected financial information of the Company for each of the last eight quarters ended July 31, 2013. For the quarters ended
July 31,
2013 April 30,
2013 January 31,
2013 October 31,
2012
Total revenues $ - $ - $ - $ -
Total comprehensive income (loss) (658,918) 330,350 (276,316) (437,662)
Earnings (loss) per share (0.01) (0.00) (0.01) (0.01)
Earnings (loss) per share – fully diluted (0.01) (0.00) (0.01) (0.01)
Cash and cash equivalents 1,321,170 2,555,902 2,549,052 744,737
Total assets 12,518,058 13,068,471 12,527,616 12,194,389
Total long-term liabilities 327,478 111,248 110,121 -
27
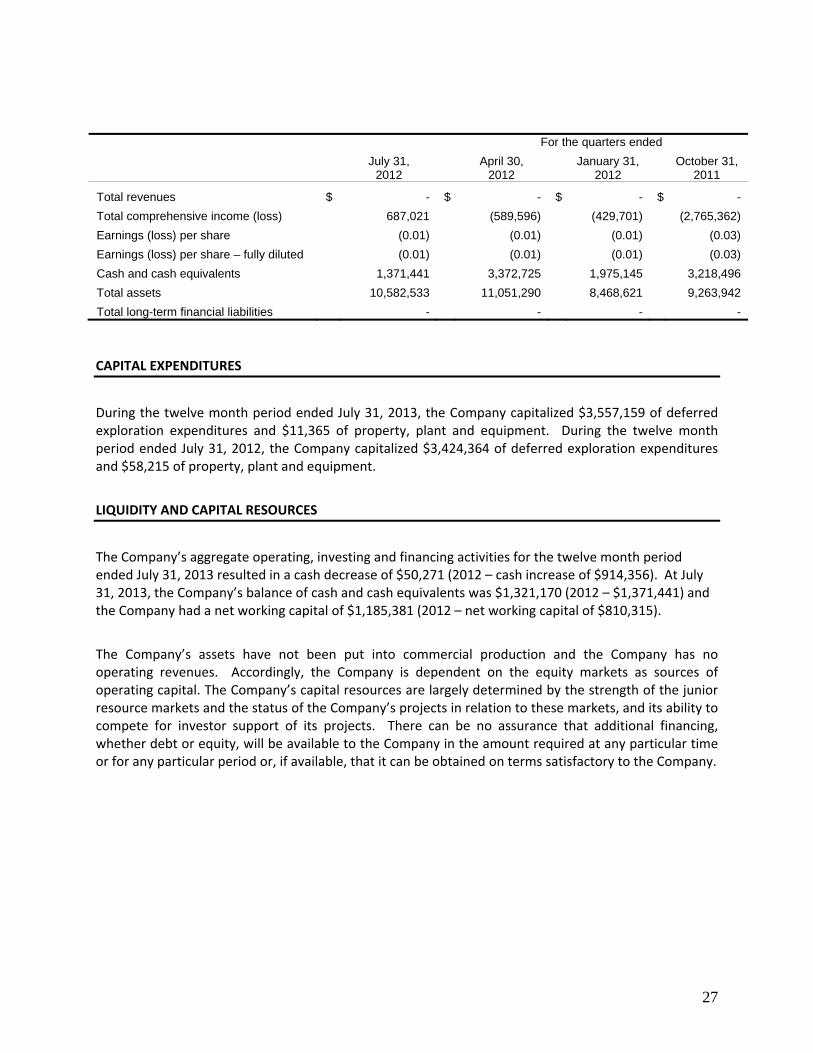
For the quarters ended
July 31,
2012 April 30,
2012 January 31,
2012 October 31,
2011
Total revenues $ - $ - $ - $ -
Total comprehensive income (loss) 687,021 (589,596) (429,701) (2,765,362)
Earnings (loss) per share (0.01) (0.01) (0.01) (0.03)
Earnings (loss) per share – fully diluted (0.01) (0.01) (0.01) (0.03)
Cash and cash equivalents 1,371,441 3,372,725 1,975,145 3,218,496
Total assets 10,582,533 11,051,290 8,468,621 9,263,942
Total long-term financial liabilities - - - -
CAPITAL EXPENDITURES
During the twelve month period ended July 31, 2013, the Company capitalized $3,557,159 of deferred exploration expenditures and $11,365 of property, plant and equipment. During the twelve month period ended July 31, 2012, the Company capitalized $3,424,364 of deferred exploration expenditures and $58,215 of property, plant and equipment.
LIQUIDITY AND CAPITAL RESOURCES
The Company’s aggregate operating, investing and financing activities for the twelve month period ended July 31, 2013 resulted in a cash decrease of $50,271 (2012 – cash increase of $914,356). At July 31, 2013, the Company’s balance of cash and cash equivalents was $1,321,170 (2012 – $1,371,441) and the Company had a net working capital of $1,185,381 (2012 – net working capital of $810,315).
The Company’s assets have not been put into commercial production and the Company has no operating revenues. Accordingly, the Company is dependent on the equity markets as sources of operating capital. The Company’s capital resources are largely determined by the strength of the junior resource markets and the status of the Company’s projects in relation to these markets, and its ability to compete for investor support of its projects. There can be no assurance that additional financing, whether debt or equity, will be available to the Company in the amount required at any particular time or for any particular period or, if available, that it can be obtained on terms satisfactory to the Company.

28
TRANSACTIONS WITH RELATED PARTIES
The Company entered into the following transactions with related parties during the twelve month period ended July 31, 2013. Amounts stated below are presented in reference to the twelve month periods ended July 31, 2013 and July 31, 2012, respectively:
Expense report reimbursements to certain directors and officers of the Company in the amount of $178,435 (2012 ‐ $140,419).
Of these related party transactions, $2,960 is remaining in accounts payable as at July 31, 2013 (2012 ‐
$20,887), which is unsecured, non‐interest bearing and have no specific terms of repayment.
All related party transactions were measured at the exchange amount, which is the amount of
consideration agreed to by the related parties.
The remuneration of directors and other members of key management were as follows:
2013 2012
Management payments $ 719,185 $ 720,634 Stock-based payments 480,434 589,225
$ 1,199,619 $ 1,309,859
In August 2012, Liberty became a subsidiary of the Company when the outstanding shares of Liberty
were acquired by the Company.
The shares of Liberty were acquired from a company owned by the Company’s CEO, which acquired
100% of the issued and outstanding shares of Liberty in June 2011.
OFF BALANCE SHEET ARRANGEMENTS
To the best of management’s knowledge, there are no off‐balance sheet arrangements that have, or are reasonably likely to have, a current or future effect on the results of operations or financial condition of the company. FINANCIAL INSTRUMENTS
As disclosed in its audited consolidated financial statements for the year ended July 31, 2013, the Company has identified several financial instruments that it utilizes in its day‐to‐day operations. It is management’s opinion that the Company is not exposed to significant interest, currency or credit risks arising from these financial instruments.

29
OUTSTANDING SHARE DATA
a) Authorized:
Common Shares
Unlimited number of common shares Preferred Shares
Unlimited number of preferred shares
b) Issued and outstanding:
July 31, 2013: 78,708,498 common shares November 15, 2013: 79,045,113 common shares
RISKS AND UNCERTAINTIES
The exploration for and development of mineral deposits are highly speculative activities and are subject to significant risks. The Company’s ability to realize its investments in exploration projects is dependent upon a number of factors, including its ability to continue to raise the financing necessary to complete the exploration and development of those projects and the existence of economically recoverable reserves within its projects. Other significant risks are listed below. Operations in Cambodia The Company’s primary mineral property is located in Cambodia and as such, it is exposed to various levels of political, economic, and other risks and uncertainties. These risks and uncertainties include, but are not limited to, terrorism, hostage taking, military repression, crime, political instability, labour unrest, the risks of war or civil unrest, expropriation and nationalization, renegotiation or nullification of existing concessions, licenses, permits, approvals and contracts, illegal mining, changes in taxation policies, restrictions on foreign exchange or repatriation, and changing political conditions and governmental regulations. Changes, if any, in mining or investment policies or shifts in political attitude in Cambodia may adversely affect the operations or profitability of the mineral property. Operations may be affected in varying degrees by government regulations with respect to, but not limited to, restrictions on production, price controls, export controls, currency remittance, income taxes, expropriation of property, foreign investment, maintenance of claims, environmental legislation, land use, land claims of local people, water use, mine safety, and the rewarding of contracts to local contractors or require foreign contractors to employ citizens of, or purchase supplies from, a particular jurisdiction. Failure to comply strictly with applicable laws, regulations, and local practices relating to mineral right applications and tenure, could result in loss, reduction or expropriation of entitlements, or the imposition of additional local or foreign parties as joint venture partners with carried or other interest. The occurrence of these various factors and uncertainties cannot be accurately predicted and could have an adverse effect on the mineral property.

30
Stage of Development The Company’s primary mineral property is in the exploration stage and the Company does not have an operating history with respect to its exploration activities. Exploration and development of mineral resources involves a high degree of risk and few properties which are explored are ultimately developed into producing properties. The amounts attributed to the Company’s interest in its properties as reflected in its financial statements represent acquisition and exploration expenses and should not be taken to represent realizable value. There is no assurance that the Company’s exploration and development activities will result in any discoveries of commercial bodies of ore. The long term profitability of the Company’s operations will be in part directly related to the cost and success of its exploration programs, which may be affected by a number of factors such as unusual or unexpected geological formations, and other known and unknown factors. Environmental Fires, power outages, labour disruptions, flooding, explosions, cave‐ins, landslides and the inability to obtain suitable or adequate machinery, equipment or labour are some of the risks involved in exploration programs. Unknowns with respect to geological structures and other conditions are involved. Existing and future environmental laws may cause additional expense and delays in the activities of the Company, and they may render the Company’s properties uneconomic. The Company has no liability insurance, and the Company may become subject to liability for pollution, cave‐ins or hazards against which it cannot insure or against which it may elect not to insure. The payment of such liabilities may have a material, adverse effect on the Company’s financial position. Future Financings If the Company’s exploration programs are successful, additional funds will be required for further exploration and development to place a property into commercial production. The Company’s available sources of funds are: (i) the Company’s existing cash and cash equivalents, (ii) the further sale of equity capital or (iii) the offering by the Company of an interest in its properties to be earned by another party or parties carrying out further exploration or development thereof. There is no assurance such sources will continue to be available on favourable terms or at all. If available, future equity financings may result in dilution to current shareholders. Profitability of Operations The Company is not currently operating profitably and it should be anticipated that it will operate at a loss at least until such time as production is achieved from its property, if production is, in fact, ever achieved. Investors also cannot expect to receive any dividends on their investment in the foreseeable future. Currency Risk The Company’s mineral property options incur costs which are denominated in USD. Future changes in exchange rates could materially affect the viability of exploring and developing this property.

31
DISCLOSURE CONTROLS AND PROCEDURES
Disclosure controls and procedures are designed to provide reasonable assurance that all relevant information is gathered and reported to senior management, including the Chief Executive Officer (“CEO”) and the Chief Financial Officer (“CFO”) on a timely basis so that appropriate decisions can be made regarding public disclosure. An evaluation of the effectiveness of the design and operation of disclosure controls and procedures was conducted as of July 31, 2013, by and under the supervision of the CEO and CFO. Based on this evaluation, the CEO and CFO have concluded that the disclosure controls and procedures, as defined in Canada by Multilateral Instrument 52‐109, Certification of Disclosure in Issuers’ Annual and Interim Filings, are effective to ensure that (i) information required to be disclosed in reports that are filed or submitted under Canadian securities legislation and the Exchange Act is recorded, processed, summarized and reported within the time periods specified in those rules and forms; and (ii) material information relating to the Company is accumulated and communicated to the Company’s management, including the CEO and CFO, or persons performing similar functions.
ADDITIONAL DISCLOSURE FOR VENTURE ISSUERS WITHOUT SIGNIFICANT REVENUE
The following is a breakdown of the cumulative material costs for exploration and evaluation assets:
Years ended
July 31, 2013
July 31, 2012
Non-earn in payments $ 5,776,310 $ 6,209,569
Earn in payments 4,745,173 2,752,533
Total $ 10,521,483 $ 8,962,102
General and administrative $ 2,489,872 $ 2,220,261
General and administrative expenses are provided by category of major expense in the Consolidated Statements of Comprehensive Loss included in the financial statements for the twelve month period ended July 31, 2013.
OTHER INFORMATION
Additional information relating to the Company is available on the SEDAR website at www.sedar.com.