Embed Size (px)
Citation preview

255
Acta Cryst. (1985). B41, 255-262
Anisotropie Thermal-Parameter Refinement of the DNA Dodeeamer CGCGAATTCGCG by the Segmented Rigid-Body Method
BY STEPHEN R. HOLBROOK
Laboratory of Chemical Biodynamics and Department of Chemistry, University of California, Berkeley, CA 94720, USA
RICHARD E. DICKERSON
Molecular Biology Institute, University of California, Los Angeles, CA 90024, USA
AND SUNG-HOU KIM
Laboratory of Chemical Biodynamics and Department of Chemistry, University of California, Berkeley, CA 94720, USA
(Received 27 August 1984; accepted 15 January 1985)
Abstract A structure-factor least-squares refinement of the deoxyoligonucleotide (CGCGAATTCGCG)2 has been conducted using a model with constraints and restraints on the positional parameters and a seg- mented rigid-body representation for the anisotropic temperature factors. The macromolecule was divided into subgroups each of which was treated as a rigid body in terms of both positional and thermal param- eters. For each subgroup, the thermal parameters determined were elements of translation, libration and correlation (TLS) tensors. This segmented rigid- body model of thermal motion has not previously been applied to the refinement of a macromolecular crystal structure. The anisotropic thermal-parameter refinement has significantly reduced the classical R factor as judged by the Hamilton test. The resulting difference Fourier map has a considerably lower noise level allowing fifteen additional low-occupancy water positions to be identified. In addition, analysis of the anisotropic thermal parameters has revealed new information about the local mobility of the groups in the oligonucleotide. Thus, the method of segmented rigid-body anisotropic temperature-factor refinement appears to be uniquely suited to macromolecules, especially nucleic acids, where high-resolution data are usually unavailable.
Introduction The combination of high thermal motion and static disorder in the loosely packed unit cells of macromolecular crystals usually limits the resolution of observable X-ray diffraction. Generally, individual atoms are not completely resolved in macromolecular electron density maps, but can be identified by their locations within resolved groups of atoms. During
0108-7681/85/040255-08501.50
crystallographic refinement of a model structure, the lack of high-resolution data and the large percentage of weak reflections results in a low ratio of the number of observations to parameters to be refined. To over- come the effects of errors in the observations and approximations made in data reduction this over- determination ratio must necessarily be as large as possible for accurate structural determination.
The number of parameters to be refined for a macromolecule can be reduced by incorporating information about the geometry of the constituents of the macromolecule obtained from high-resolution crystal structures of these constituents. Three approaches have been used to incorporate this infor- mation during refinement of the positional par- ameters: (1) constraints, (2) restraints, and (3) com- bined constraints and restraints. The first method uses rigid constraint conditions, where bond distances, bond angles, and some dihedral angles are maintained strictly at canonical values (Scheringer, 1963). A refinement procedure where all positional parameters, except flexible dihedral angles, were con- strained has been developed for the refinement of protein structures (Diamond, 1971). In the second method, information about the molecular geometry of the constituents is incorporated by non-rigid restraint conditions. These conditions are enforced by least-squares minimization of the difference in distance between observed and canonical values specifying bond lengths, angles, and any fixed torsion angles within the constituents. This least-squares minimization is done in conjunction with structure- factor least-squares refinement and the deviation of geometry from canonical values is adjusted by varying the ratio of weights applied (Konnert, 1976; Konnert & Hendrickson, 1980). The third method, which has been referred to as CORELS (COnstrained- REstrained Least Squares), uses a combination of
O 1985 International Union of Crystallography
256 ANISOTROPIC REFINEMENT OF THE DNA DODECAMER CGCGAATTCGCG
constraints and restraints in order to achieve the advantages of both methods (Sussman, Holbrook, Church & Kim, 1977). The combination of both con- straints and restraints allows sufficient flexibility to permit rapid convergence while keeping the number of variable parameters at a minimum.
A similar variety of approaches have been used for refinement of the isotropic thermal parameters of macromolecules. For structures where high-resolu- tion data are available, independent isotropic atomic thermal parameters may be assigned and refined. This has been done for rubredoxin at 1.2 A resolution (Watenpaugh, Margulis, Sieker & Jensen, 1978~ and the Z-DNA hexanucleotide, CGCGCG, at 0.9 A res- olution (Wang, Quigley, Kolpak, Crawford, van Boom, van der Marel & Rich, 1979) as well as other structures.
In most cases, however, atomic resolution data are not available and either constraint or restraint condi- tions must be applied to the thermal parameters for a meaningful refinement. Hendrickson & Konnert (1979) and Konnert & Hendrickson (1980) have developed a widely used procedure in which the isotropic atomic temperature factors are restrained to vary smoothly along the chain of covalently bonded atoms. An alternate approach, which has been used successfully in several crystallographic refinements (Sussman, Holbrook, Warrant, Church & Kim, 1978; Shoham, Yonath, Sussman, Moult, Traub & Kalb, 1979; Shakked, Rabinovich, Kennard, Cruse, Salis- bury & Viswamitra, 1983), is to constrain rigid groups of atoms within the macromolecule to a single isotropic temperature factor. This is in close analogy to the use of constraints on the positional parameters in the CORELS procedure.
For anisotropic thermal-parameter refinement, Konnert & Hendrickson (1980) have extended their restraint procedure to allow refinement of the par- ameters of the anisotropic thermal ellipsoids of the individual atoms. This method results in a very large number of parameters to be refined, although the 'effective' number of variables is reduced by the restraint conditions. This procedure has been used in the refinement of the carp muscle calcium binding protein (Konnert & Hendrickson, 1980).
In this paper we introduce a new approach to determination of anisotropic parameters of thermal motion for macromolecules. In analogy to the use of constrained rigid bodies in positional and isotropic thermal refinement we have adapted the 'TLS', or rigid-body, model of anisotropic thermal motion originally developed for small molecules to the refine- ment of macromolecules. In the 'TLS method' (Schomaker & Trueblood, 1968), the motion of a rigid body is described by three tensors: T, L, and S which correspond to translation, libration, and their average quadratic correlation respectively. The T and L tensors are symmetric 3 x 3 matrices and the S tensor
is in general a 3 ×3 non-symmetric matrix when an arbitrary origin is specified. A shift in origin changes the S and T matrices while L is left unchanged. The anisotropic thermal parameters of individual atoms can be calculated from these 'TLS' tensors. These parameters reflect only the rigid-body motions of translation and libration and neglect the effect of uncorrelated intemal vibrations of the atoms in the group. Since the T and L tensors are symmetric, there are 21 tensor elements per rigid body, of which 20 are independent parameters. As there are 6 anisotropic thermal parameters needed per atom in the atomic ellipsoid representation, a rigid group of four or more atoms in the 'TLS' model will be specified by fewer thermal parameters. The reduction in the total number of thermal parameters in the TLS model will increase linearly with the size of the rigid subgroup. This is precisely what is necessary for the determination of anisotropic thermal parameters in macromolecules.
We have, therefore, incorporated refinement of the parameters of the TLS tensors into the CORELS procedure for refinement of large structures. The structure is divided into a series of constrained groups (which usually corresponds to the constrained groups used in positional refinement) to be anisotropically refined in terms of their TLS thermal parameters. We refer to this division of constrained groups as the segmented rigid-body model of thermal motion.
Using this method, we have refined the anisotropic thermal parameters of the self-complementary deoxy- dodecanucleotide CGCGAATTCGCG. This crystal structure was previously solved and refined with isotropic thermal parameters at 1.9,g, resolution (Wing, Drew, Takano, Broka, Takana, Itakura & Dickerson, 1980). We chose this structure for the initial trial of the segmented rigid-body method for anisotropic refinement because of its biological importance as the first example of a B form DNA double helix, the unavailability of atomic resolution data, and the 'natural' division of oligonucleotides into subgroups which can be treated as rigid bodies.
Methods
A detailed discussion of the CORELS method of structure-factor least-squares refinement using con- strained and restrained positional parameters and constrained group isotropic thermal parameters has previously been published (Sussman, Holbrook, Church & Kim, 1977). The quantity minimized in this procedure is a sum of terms containing the structure- factor differences and the deviations of the restrained distances (between constrained groups) from ideal values:
Q = IV/Y-h [ Wh(Fo.h-- Fc, h) 2 ]
+ Wd Y., [ W,(Do.,- D~.,)2]. (1)
STEPHEN R. HOLBROOK, R I C H A R D E. D I C K E R S O N AND S U N G - H O U KIM 257
In the above equation Fo and Fc are the observed and calculated structure factors of the reflections (h). Do and Dc are the observed (canonical) and calcu- lated distances between atoms for each of the restraint conditions. As the structure is divided into a series of constrained groups, within which all bond dis- tances and angles are fixed, the normal-equation matrix can be constructed of derivatives of the group positional and thermal parameters obtained accord- ing to the chain rule:
(OFc/OPn)B = ~a ~b [(OFc/OXa, b)(aXa, b/aPn)] (2)
(OFdOP.)x =Y.~ [(OFdOB~)], (3)
where a is an index over all the atoms in a group or subgroup, b runs from 1 to 3 and n is an index referring to the group parameters of which there are six for group positions and one per isotropic sub- group.
The chain rule as stated above can also be used to formulate derivatives of the constrained groups in the TLS model of anisotropic motion (Pawley, 1964, 1966).
(OF~IOPt,,)=E[E (OFclOUo)(OUijlOPtls)]. (4)
From the parameters of the T, L and S matrices which are the variables refined versus the structure- factor data, the individual atomic anisotropic tem- perature factors can be calculated (Schomaker & Trueblood, 1968) for purposes of structure-factor calculation or graphic representation by a program such as ORTEP (Johnson, 1965).
ing test have been discussed elsewhere (Holbrook & Kim, 1984).
Rigid-body refinement of the DNA dodecamer
Crystals of the self-complementary DNA dodecanu- cleotide C G C G A A T I ' C G C G (space group P21212~, a =24.87, b =40.39, c = 6 6 . 2 0 A) contain 486 non- hydrogen atoms and 80 ordered water molecules per asymmetric unit (Wing, Drew, Takano, Broka, Takana, Itakura & Dickerson, 1980; Dickerson, Drew & Conner, 1981). A total of 5691 data have been collected to a resolution of 1.9 ~,. The structure has been previously refined by the procedure of Jack & Levitt (1978) which simultaneously minimizes con- formational energy and structure-factor differences. This method applies no geometrical constraints, but the energy minimization is equivalent to using a restrained geometry. The total number of parameters used in this refinement, including the individual atomic temperature factors, was therefore four times the number of atoms or 2264. The ratio of structure- factor data to parameters varied was less than 2.5 for this model. One problem with refinement of the unre- strained individual atomic thermal parameters is that at this resolution the atoms are not resolved and the electron density is smeared over the entire group. It i s n o t surprising then that a significant degree of random noise is introduced into these values.
Calculation of the classical R factor from the atomic isotropic model refined by the Jack-Levitt
U,j= ( T,j). (5 )
The tensors G#kS and H,jk~ are of the form given by Schomaker & Trueblood (1968) and are functions of the atomic coordinates. The partial derivatives of the above equation are used to form the product deriva- tives used in the least-squares matrix.
(OUo/OTm.)= 8,mgj. (6)
(OU#/OLm,,)= G#.. (7)
(OU#/OSm.)= H#m.. (8)
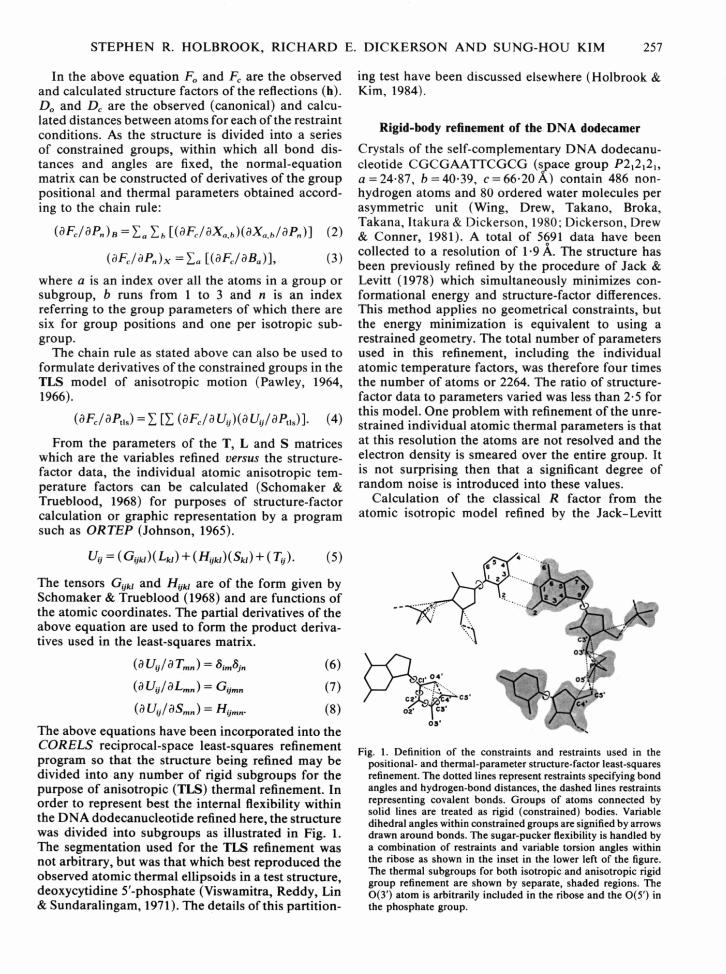
The above equations have been incorporated into the CORELS reciprocal-space least-squares refinement program so that the structure being refined may be divided into any number of rigid subgroups for the purpose of anisotropic (TLS) thermal refinement. In order to represent best the internal flexibility within the DNA dodecanucleotide refined here, the structure was divided into subgroups as illustrated in Fig. 1. The segmentation used for the TLS refinement was not arbitrary, but was that which best reproduced the observed atomic thermal ellipsoids in a test structure, deoxycytidine 5'-phosphate (Viswamitra, Reddy, Lin & Sundaralingam, 1971). The details of this partition-
~ ' " " " ".. ~t
. . . . . . ..........
Fig. 1. Definition of the constraints and restraints used in the positional- and thermal-parameter structure-factor least-squares refinement. The dotted lines represent restraints specifying bond angles and hydrogen-bond distances, the dashed lines restraints representing covalent bonds. Groups of atoms connected by solid lines are treated as rigid (constrained) bodies. Variable dihedral angles within constrained groups are signified by arrows drawn around bonds. The sugar-pucker flexibility is handled by a combination of restraints and variable torsion angles within the ribose as shown in the inset in the lower left of the figure. The thermal subgroups for both isotropic and anisotropic rigid group refinement are shown by separate, shaded regions. The 0(3') atom is arbitrarily included in the ribose and the 0(5') in the phosphate group.

258 ANISOTROPIC REFINEMENT OF THE DNA DODECAMER CGCGAATTCGCG
method was 26.4% for the entire 5691 data. In order to follow as closely as possible the previous refine- ment of the dodecamer structure for purposes of comparison, we decided to use only the data of resol- ution higher than 8 .A. This set of data contained 5599 reflections and the initial R value for the atomic isotropic model was 25.2%.
For the CORELS isotropic and anisotropic refine- ment the dodecanucleotide model was divided into phosphate, ribose and base subgroups as discussed under Methods and illustrated in Fig. 1. Each sub- group was initially assigned a group isotropic tem- perature factor corresponding to the average of the atomic isotropic temperature factors of the atoms in the group. These group isotropic temperature factors were then refined by the structure-factor least-squares method while holding the positional parameters con- stant. The 80 water molecules previously located were included in this isotropic refinement as O atoms, with individual isotropic thermal parameters. Unit weights were applied to the structure factors for the entire course of the refinement. After seven cycles of least- squares refinement all of the isotropic thermal param- eters had converged. One water molecule was removed from the model because its temperature factor exceeded 250 .~2, an arbitrary cutoff point.
Next, the positional parameters of each constrained group were refined for five cycles subject to the con- straint and restraint conditions shown in Fig. 1. Each constrained group had 3 variable translational param- eters, 3 variable rotational parameters, and the num- ber of variable internal dihedral angles indicated in Fig. 1. The restraints specifying base-base hydrogen bonds were assigned zero weight so as not to impose undue restrictions. The positions of the water molecules were held fixed.
The group isotropic thermal parameters which had not been varied during positional refinement were then allowed to refine for an additional three cycles (holding positions constant). At the end of these cycles one additional water molecule was removed from the model due to a temperature factor exceeding 250 ,~2, leaving a total of 78 waters.
Finally, the constrained anisotropic TLS thermal parameters were varied, while holding the positional parameters constant. Again each phosphate, ribose, and base was considered a rigid group with 20 independent variable thermal parameters or a total of 1400 parameters for the entire dodecamer. A total of eleven cycles resulted in convergence of both the thermal-parameter shifts and the R factor. Several additional cycles of isotropic refinement of the water temperature factors were conducted during the anisotropic refinement of the dodecamer itself. In retrospect, the same result for the anisotropic refine- ment may have been obtained in fewer cycles, but we utilized only fractions of the calculated shifts in order to assure convergence.
Table 1. Refinement results
No. of No. of No. of Correlation Model atoms data variables R coefficient
(A) Brookhaven (atomic isotropic)*
All data 566 5691 2264 28-6% 0-8983 ( No data < 8~,) 566 5599 2264 25.2 0.9604 (No data < 2~r) 566 2728 2264 19.5 0.9592
( B) CORELS group isotropict
(No data < 8,~) 564 5599 149 25.3 0.9619
( C) CORELS group anisotropic~t
(No data < 8~) 563 5599 1478 20-6 0.9776 (No data < 2tr) 563 2728 1478 14.9 0.9785
* The structure factors used were calculated from the coordinates and compared to observed amplitudes deposited at the Brookhaven Protein Data Bank.
t The starting coordinates were those deposited in the Brookhaven Protein Data Bank. The group isotropic thermal parameters and rigid-body posi- tional parameters were refined in alternate cycles as indicated.
~: The starting values of the 'TLS' parameters were calculated from the final group isotropic B values. During this step the water molecules were refined isotropically. The values shown are the results of several cycles of anisotropic refinement.
Results
The results of the isotropic and anisotropic thermal refinements are summarized in terms of number of variables, observations, R factors, and correlation coefficients in Table 1. Fig. 2(a,b) shows the R factor as a function of both (sin 0)/h and amplitude for both the isotropic and the anisotropic models. These plots show improved agreement of Fo with Fc for all resolution blocks except the very highest resolution. This is probably due to the low quality of data avail- able at high resolution where many Fo values are very weak.
The final group isotropic B values are given in Table 2. The R factor of 25.3% for the model with group isotropic thermal parameters is not significantly different from that of 25.2% calculated using the individual atomic isotropic temperature factors de- spite the fact that the former model has fewer than 10% of the variable thermal parameters of the latter. The average atomic isotropic results agree with those obtained here for group isotropic temperature factors in that the phosphates have larger B values than the riboses which in turn have larger B values than the bases, but the ratios of the average atomic isotropic values differ from the ratios of the group isotropic values we have determined.
The constrained-restrained positional refinement resulted in a small average shift in position of 0.11 A (r.m.s. shift 0.15 ,A). The only positional shifts greater than 0.5 ,~, were for C(5') of cytosine 1 (0.88 A), 0(5') of the phosphate of residue 2 (0.63 A), and C(5') of guanosine 10 (0.52 A). The sugar pucker remained quite similar to that observed in the model refined by the Jack-Levitt methods with many of the riboses adopting the C(l')-exo conformation. We tried a variety of weights for the restraint conditions down to the point of nearly relaxing them completely and

STEPHEN R. HOLBROOK, RICHARD E. DICKERSON AND SUNG-HOU KIM 259
Table 2. Final isotropic B values (/~k 2) B atomic isotropic B group isotropic B equivalent
Residue Phosphate Ribose Base Phosphate Ribose Base Phosphate Ribose Base
Strand one Cyt 1 42-6 29.6 40.5 27-2 45.2 34.0 Gua 2 58.8 36.8 22.0 75.0 36-0 19-1 100.3 31.5 24.2 Cyt 3 47.9 41.6 24.0 43.9 35.3 21.6 50.0 38.2 34.0 Gua 4 44.0 46.0 28.6 39.5 46.0 25.3 46-5 44.7 38.0 Ade 5 53.7 47.9 24.0 56.8 39-1 21.8 70.3 51.3 32.8 Ade 6 42.2 36.8 20.2 38.5 29.9 18.2 42.9 35.3 22-1 Thy 7 41.3 33.8 24.8 41.8 30.8 23.1 41.5 35.4 27-6 Thy 8 44.6 37.4 25.5 51.5 34.6 25.7 59.0 38.4 28.7 Cyt 9 51.7 50.3 31.9 51.3 48-7 27-9 68.1 45.6 34.3 Gua 10 60.1 51.0 32.0 63.8 53.9 25.5 86.1 55.2 31.8 Cyt I 1 58-6 47-0 25.5 57.4 45.4 24.0 61.7 44.8 27.9 Gua 12 52.2 45.3 36.5 62.7 42-0 34.4 62.3 45.5 38.4
Strand two C y t 1 49 .6 43 .6 60-4 46 .2 66 .4 49 .3 Gua 2 53.7 44.2 32.6 69.0 36.2 28.3 96.5 46.1 33.3 Cyt 3 43.4 34-4 27.3 39.8 27.0 23-0 46.5 29.5 26.0 Gua 4 49.7 36.0 22.2 43.1 30.2 20.9 50-0 31.6 25-5 A d e 5 45 .2 45 .6 30 .2 45 .0 41 .0 23 .8 50.8 44 .6 36"9 Ade 6 44.9 47.8 21.9 43.1 45.4 18.4 54.2 47.4 23.7 Thy 7 49.2 44.9 29.1 49.0 37.7 24.1 62.4 40.6 31-4 Thy 8 44-9 39.7 27-4 45.0 32.2 25.0 52-0 34.0 27.7 Cyt 9 56-2 50.9 28.2 53.8 42.6 28.5 62.6 41.5 35.2 Gua 10 56"9 45.0 25.4 55"3 45.2 22.5 72.0 54.0 30-1 Cyt 11 50.6 49.3 28.7 47.0 47.8 23.6 59.6 43.0 32.8 Gua 12 46.4 44.2 24.4 51.1 37.4 22.0 53.8 42.8 30.0
Averages 50 (5) 44 (5) 28 (5) 51 (10) 40 (8) 25 t6) 61 (16) 43 (8) 31 (6) Rat ios 1.80 1.57 1.00 2 .04 1.61 1.0O 1 .95 . 1.36 1 .00
0.50
t -.- ..... ' 0.40.
;." .. "~.0
0 .30 -
0 .20- ".. / "
0.10- ' .................... • '
0)06 0)10 0)14 0!18 0!22 (sin O)/A (,~, ')
(a)
1 '1- -
0.9-
~, 0 . 7 -
(~ 0 .5 -
0.3 - • '"= ...............
0"1- ' "
. . . . 1~ . . . . 2'0 . . . . 3b . . . . ,~ F (obs). (b)
Fig. 2 . (a ) T h e c lass ica l R fac to r is p lo t t ed v e r s u s (s in 0 ) / ~ for b locks c o n t a i n i n g a p p r o x i m a t e l y equa l n u m b e r s o f d a t a so r ted a c c o r d i n g to the d i f f rac t ion angle . T he plots are b a s e d o n d a t a b e t w e e n 1.9 a n d 8.0 A r e s o l u t i o n a n d i n c l u d e d a t a o f i n t e ns i t y less t h a n 2o'. T h e d i a m o n d s are f rom the a n i s o t r o p i c a l l y re f ined da t a set, the t r i ang les are f rom the d a t a af ter g r o u p i so t rop ic a n d p o s i t i o n a l r e f i n e m e n t , a n d the circles p lo t the o r ig ina l s t ruc-
t u r e - f ac to r d a t a as d e p o s i t e d in the P ro te in D a t a Bank . (b) The R fac tor v e r s u s ave rage a m p l i t u d e o f d i f f rac t ion in t ens i ty . The
s y m b o l s are as in ( a ) .
the results of the positional refinement were generally unchanged.
The final R value for the anisotropic refinement was 20.6% when the data less than 20" were included and 14.9% when these reflections were omitted. Application of the analytical form of the Hamilton R-factor test (Pawley, 1970) shows that the final R value obtained by anisotropic TLS refinement is sig- nificantly improved from both the starting atomic isotropic model (R -- 25.2% ) and the group isotropic model (R = 25.3%) at the 99.99% confidence level. We are therefore justified in drawing conclusions about the anisotropic modes of thermal vibration from the results of the TLS refinement.
Individual anisotropic thermal parameters were calculated for each atom from the final TLS matrices using equation (5). The equivalent B values obtained by averaging over the diagonal elements of the Uij for each atom and then over all atoms in the subgroup are shown in Table 2 and may be compared to their isotropic counterparts.
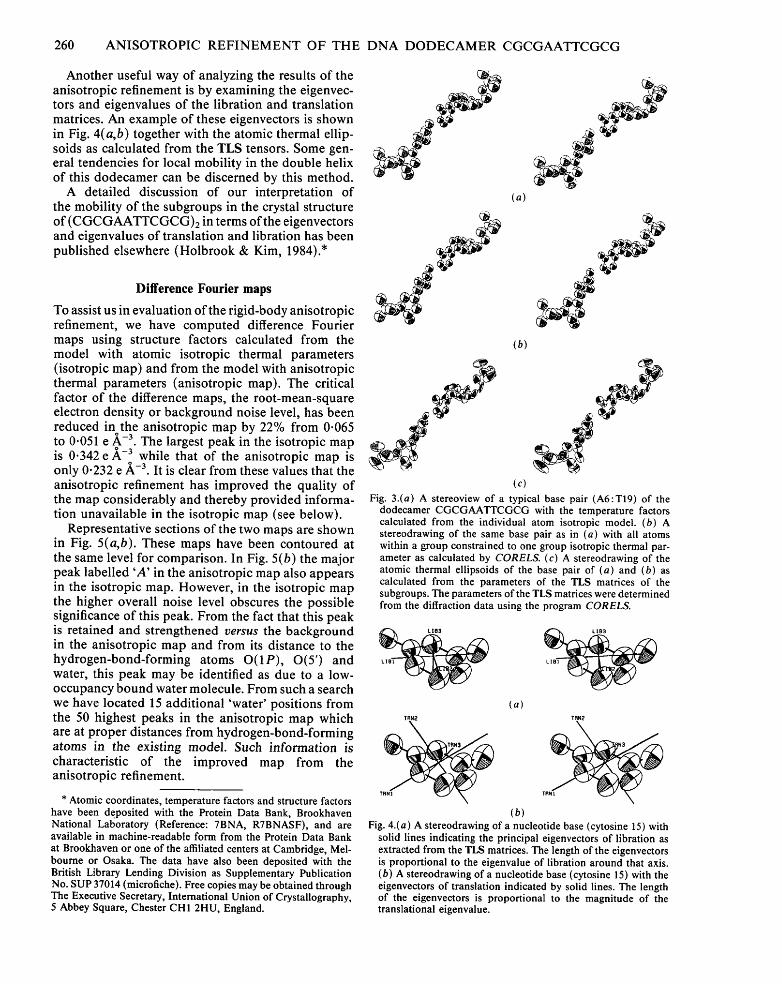
A stereo ORTEP drawing of a single base pair of the double-helical molecule is shown in Fig. 3(a-c) with the electron density distribution according to: (a) the individual atom isotropic model, (b) the con- strained group isotropic model, and (c) the segmented rigid-body anisotropic model. It can be seen that the group isotropic model (b) reproduces well the atomic isotropic model (a) even though it is determined by far fewer parameters. The amplitudes of the atomic ellipsoids determined from the segmented rigid-body anisotropic model (c) also follow the trend observed for the two isotropic models, (a) and (b), supporting the validity of this method.
260 A N I S O T R O P I C R E F I N E M E N T O F THE D N A D O D E C A M E R C G C G A A T Y C G C G
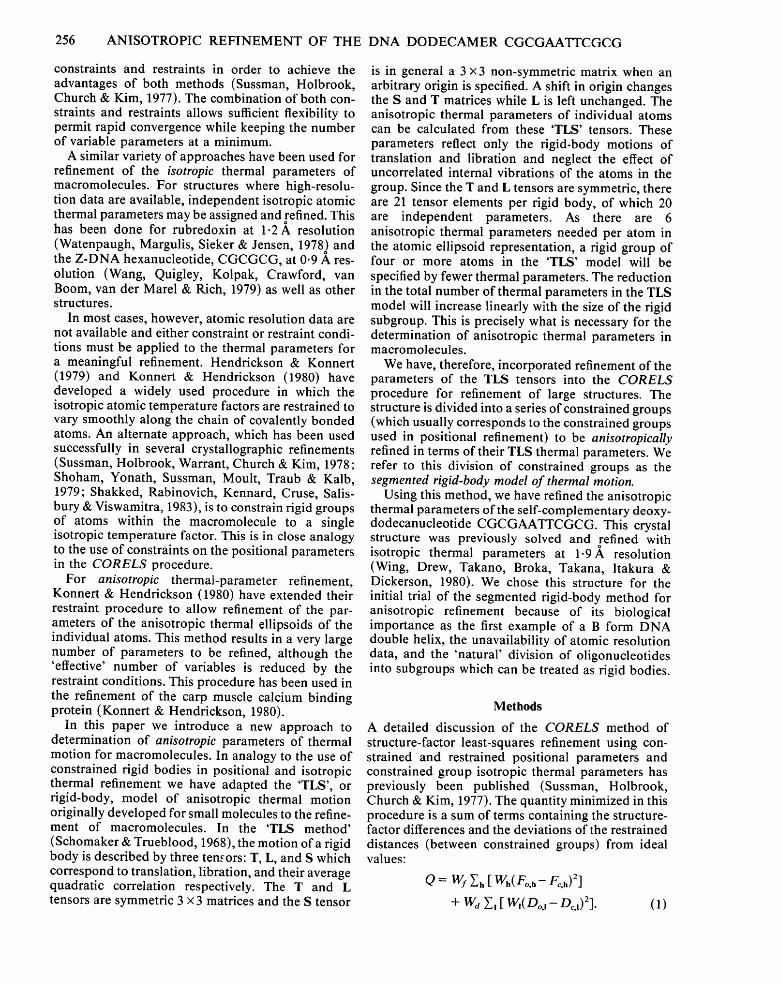
Another useful way of analyzing the results of the anisotropic ref inement is by examining the eigenvec- tors and eigenvalues of the l ibrat ion and t ranslat ion matrices. An example of these eigenvectors is shown in Fig. 4(a ,b) together with the atomic thermal ellip- soids as calculated from the TLS tensors. Some gen- eral tendencies for local mobil i ty in the double helix of this dodecamer can be discerned by this method.
A detai led discussion of our interpretat ion of the mobi l i ty of the subgroups in the crystal structure of ( C G C G A A T T C G C G ) 2 in terms of the eigenvectors and eigenvalues of t ranslat ion and l ibrat ion has been publ i shed elsewhere (Holbrook & Kim, 1984).*
Difference Fourier maps
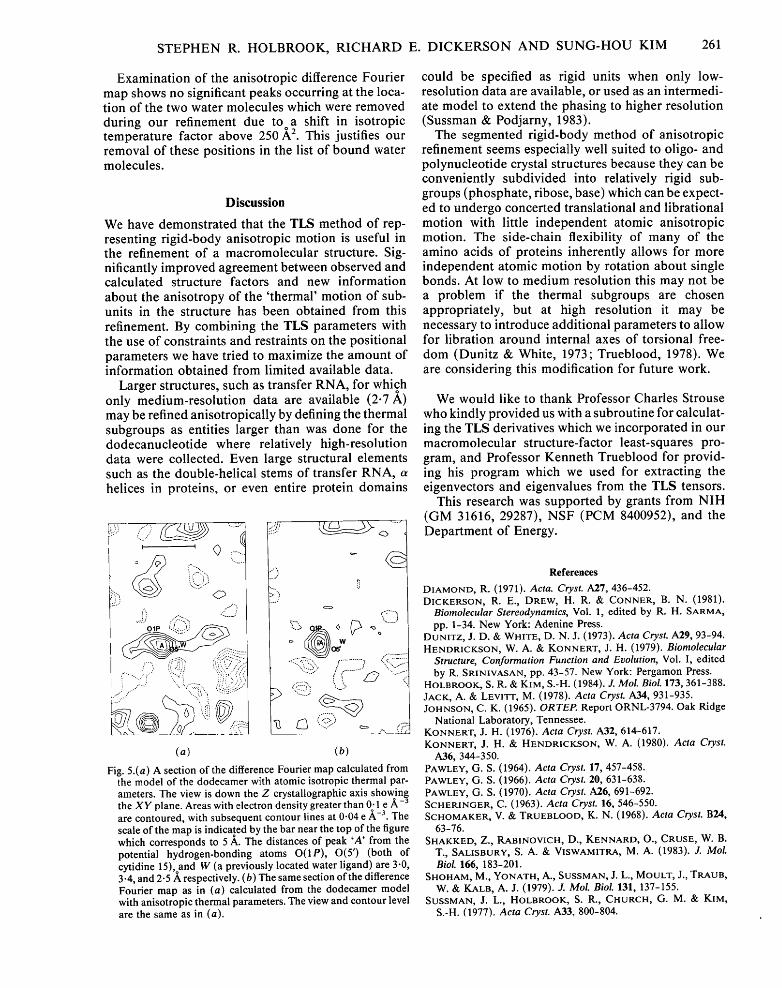
To assist us in evaluat ion of the r igid-body anisotropic refinement, we have computed difference Fourier maps using structure factors calculated from the model with atomic isotropic thermal parameters (isotropic map) and from the model with anisotropic thermal parameters (anisotropic map). The critical factor of the difference maps, the root-mean-square electron density or background noise level, has been reduced in the anisotropic map by 22% from 0.065 to 0.051 e ,~-3. The largest peak in the isotropic map is 0.342 e,~-3 while that of the anisotropic map is only 0.232 e ,~-3. It is clear from these values that the anisotropic ref inement has improved the quali ty of the map considerably and thereby provided informa- tion unava i lab le in the isotropic map (see below).
Representat ive sections of the two maps are shown in Fig. 5(a,b). These maps have been contoured at the same level for comparison. In Fig. 5(b) the major peak label led 'A ' in the anisotropic map also appears in the isotropic map. However, in the isotropic map the higher overall noise level obscures the possible significance of this peak. From the fact that this peak is retained and s trengthened v e r s u s the background in the anisotropic map and from its distance to the hydrogen-bond-forming atoms O(1P) , 0 (5 ' ) and water, this peak may be identified as due to a low- occupancy bound water molecule. From such a search we have located 15 addi t ional 'water ' posit ions from the 50 highest peaks in the anisotropic map which are at proper distances f rom hydrogen-bond-forming atoms in the existing model. Such informat ion is characteristic of the improved map from the anisotropic refinement.
* Atomic coordinates, temperature factors and structure factors have been deposited with the Protein Data Bank, Brookhaven National Laboratory (Reference: 7BNA, RTBNASF), and are available in machine-readable form from the Protein Data Bank at Brookhaven or one of the affiliated centers at Cambridge, Mel- bourne or Osaka. The data have also been deposited with the British Library Lending Division as Supplementary Publication No. SUP 37014 (microfiche). Free copies may be obtained through The Executive Secretary, International Union of Crystallography, 5 Abbey Square, Chester CH1 2HU, England.
A
A
(a)
(b)
(c) J
Fig. 3.(a) A stereoview of a typical base pair (A6:T19) of the dodecamer CGCGAATTCGCG with the temperature factors calculated from the individual atom isotropic model. (b) A stereodrawing of the same base pair as in (a) with all atoms within a group constrained to one group isotropic thermal par- ameter as calculated by C O R E L S . (c) A stereodrawing of the atomic thermal ellipsoids of the base pair of (a) and (b) as calculated from the parameters of the TLS matrices of the subgroups. The parameters of the TLS matrices were determined from the diffraction data using the program C O R E L S .
TRN2 (a)
(b)
LIBI ~ ~ , ~ ' ~
TRN~
Fig. 4.(a) A stereodrawing of a nucleotide base (cytosine 15) with solid lines indicating the principal eigenvectors of libration as extracted from the TLS matrices. The length of the eigenvectors is proportional to the eigenvalue of libration around that axis. (b) A stereodrawing of a nucleotide base (cytosine 15) with the eigenvectors of translation indicated by solid lines. The length of the eigenvectors is proportional to the magnitude of the translational eigenvalue.
S T E P H E N R. H O L B R O O K , R I C H A R D E. D I C K E R S O N A N D S U N G - H O U KIM 261
Examina t ion of the anisotropic difference Fourier map shows no significant peaks occurring at the loca- tion of the two water molecules which were removed during our ref inement due to a shift in isotropic temperature factor above 250/~2. This justifies our removal of these posit ions in the list of bound water molecules.
D i s c u s s i o n
We have demonst ra ted that the TLS method of rep- resenting r igid-body anisotropic motion is useful in the ref inement of a macromolecu la r structure. Sig- nificantly improved agreement between observed and calculated structure factors and new informat ion about the anisotropy of the ' thermal ' mot ion of sub- units in the structure has been obtained from this refinement. By combin ing the TLS parameters with the use of constraints and restraints on the posi t ional parameters we have tried to maximize the amount of in format ion obta ined from l imited avai lable data.
Larger structures, such as transfer RNA, for which only medium-reso lu t ion data are available (2.7 ,A) may be refined anisotropical ly by defining the thermal subgroups as entities larger than was done for the dodecanucleot ide where relatively high-resolut ion data were collected. Even large structural e lements such as the double-hel ical stems of transfer RNA, a helices in proteins, or even entire protein domains
| ! ('~ kl
./H ~ ~ ......
~.-,~
° . . _ ~ o ~ <:=:::
(a) (b)
Fig. 5.(a) A section of the difference Fourier map calculated from the model of the dodecamer with atomic isotropic thermal par- ameters. The view is down the Z crystallographic axis showing the X Y plane. Areas with electron density greater than 0.1 e ~-3 are contoured, with subsequent contour lines at 0.04 e ,~-3. The scale of the map is indicated by the bar near the top of the figure which corresponds to 5 A. The distances of peak 'A' from the potential hydrogen-bonding atoms O(1P), 0(5') (both of cytidine 15),oand W (a previously located water ligand) are 3.0, 3.4, and 2.5 A respectively. (b) The same section ofthe difference Fourier map as in (a) calculated from the dodecamer model with anisotropic thermal parameters. The view and contour level are the same as in (a).
could be specified as rigid units when only low- resolution data are avai lable, or used as an intermedi- ate model to extend the phasing to higher resolution (Sussman & Podjarny, 1983).
The segmented r igid-body method of anisotropic ref inement seems especial ly well suited to oligo- and polynucleot ide crystal structures because they can be convenient ly subdiv ided into relatively rigid sub- groups (phosphate , ribose, base) which can be expect- ed to undergo concerted t ranslat ional and l ibrat ional motion with little independen t atomic anisotropic motion. The s ide-chain flexibility of m a n y of the amino acids of proteins inherent ly allows for more independen t atomic mot ion by rotation about single bonds. At low to med ium resolution this may not be a problem if the thermal subgroups are chosen appropria te ly , but at high resolution it may be necessary to introduce addi t ional parameters to allow for l ibrat ion around internal axes of torsional free- dom (Duni tz & White, 1973; Trueblood, 1978). We are consider ing this modif icat ion for future work.
We would like to thank Professor Charles Strouse who k indly provided us with a subroutine for calculat- ing the TLS derivatives which we incorporated in our macromolecu la r structure-factor least-squares pro- gram, and Professor Kenne th Trueblood for provid- ing his program which we used for extracting the eigenvectors and eigenvalues from the TLS tensors.
This research was supported by grants from N I H (GM 31616, 29287), NSF (PCM 8400952), and the Depar tment of Energy.
References
DIAMOND, R. (1971). Acta. Cryst. A27, 436-452. DICKERSON, R. E., DREW, H. R. & CONNER, B. N. (1981).
Biomolecular Stereodynamics, Vol. 1, edited by R. H. SARMA, pp. 1-34. New York: Adenine Press.
DUNITZ, J. D. & WHITE, D. N. J. (1973). Acta Cryst. A29, 93-94. HENDRICKSON, W. A. & KONNERT, J. H. (1979). Biomolecular
Structure, Conformation Function and Evolution, Vol. I, edited by R. SRINIVASAN, pp. 43-57. New York: Pergamon Press.
HOLBROOK, S. R. & KIM, S.-H. (1984). J. Mol. Biol. 173, 361-388. JACK, A. & LEVITT, M. (1978). Acta Cryst. A34, 931-935. JOHNSON, C. K. (1965). ORTEP. Report ORNL-3794. Oak Ridge
National Laboratory, Tennessee. KONNERT, J. H. (1976). Acta Cryst. A32, 614-617. KONNERT, J. H. & HENDRICKSON, W. A. (1980). Acta Cryst.
A36, 344-350. PAWLEY, G. S. (1964). Acta Cryst. 17, 457-458. PAWLEY, G. S. (1966). Acta Cryst. 20, 631-638. PAWLEY, G. S. (1970). Acta Cryst. A26, 691-692. SCHERINGER, C. (1963). Acta Cryst. 16, 546-550. SCHOMAKER, V. & TRUEBLOOD, K. N. (1968). Acta Cryst. B24,
63-76. SHAKKED, Z., RABINOVICH, D., KENNARD, O., CRUSE, W. B.
T., SALISBURY, S. A. & VISWAMITRA, M. A. (1983). J. M o l .
Biol. 166, 183-201. SHOHAM, M., YONATH, A., SUSSMAN, J. L., MOULT, J., TRAUB,
W. & KALB, A. J. (1979). J. Mol. Biol. 131, 137-155. SUSSMAN, J. L., HOLBROOK, S. R., CHURCH, G. M. & KIM,
S.-H. (1977). Acta Cryst. A33, 800-804.

262 ANISOTROPIC REFINEMENT OF THE DNA D O D E C A M E R CGCGAATTCGCG
SUSSMAN, J. L., HOLBROOK, S. R., WARRANT, R. W., CHURCH, G. M. & KIM, S.-H. (1978). J. Mol. Biol. 123, 607-630.
SUSSMAN, J. L. & PODJARNY, A. D. (1983). Acta Cryst. B39, 495-505.
TRUEBLOOD, K. N. (1978). Acta Cryst. A34, 950-954.
VISWAMITRA, M. m., REDDY, B. S., LIN, G. H.-Y. & SUN- DARALINGAM, M. (1971). J. Am. Chem. Soc. 93, 4565-4573.
WANG, A. H.-J., QUIGLEY, G. J., KOLPAK, F. J., CR~AWFORD, J. L., VAN BOOM, J. H., VAN DER MAREL, G. & RICH, A. (1979). Nature (London), 282, 680-686.
WATENPAUGH, K. D., MARGULIS, T. N., SIEKER, L. C. JENSEN, L. H. (1978). J. Mol. Biol. 122, 175-190.
WING, R., DREW, H., TAKANO, T., BROKA, C., TANAKA, S., ITAKURA, K. & DICKERSON, R. E. (1980). Nature (London), 287, 755-758.
Acta Cryst. (1985). B41, 262-267
Real-Space Crystal Structure Solution. Crystal and Molecular Structure of Laminarabiose Octaacetate, C2sH38019
BY S. PI~REZ AND C. VERGELATI
Centre de Recherche sur les Macromoldcules Vdgdtales CNRS,* BP 68, 38402 Saint-Martin D'Hbres, France
AND V. H. TRANt
Laboratoire de Chimie, Groupe Macromol~cules Vdgdtales, Ddpartement de Recherche Fondamentale, Centre d'Etudes Nucldaires, 85X, 38041 Grenoble, France
(Received 14 February 1984; accepted 11 January 1985)
Abstract
The elucidation of a crystal structure on the basis of complete minimization of intramolecular and inter- molecular energy of packing has been applied to laminarabiose octaacetate. [Crystal data: Mr = 678.6, orthorhombic, P212~21, a = 10.379 (2), b = 22.943 (7), c=14.599 (4) A, Z = 4 , V = 3 4 7 6 . 4 ~ 3, Din= 1.30 (1), Dx = 1.297 M g m -3, h(Cu Ka)= 1.54178 A, /z(Cu K a ) = 0 . 9 1 mm -~, F(000)= 1432, room tem- perature, final R = 0.095 for 1660 observed indepen- dent reflexions.] The two D-glucose residues have the 4C~ pyranose conformation and are fl-(1 ~ 3) linked. The conformational angles ~p and ~ at the glycosidic linkage have the values -81.1 and 134.8 ° respectively. The present work establishes in an unambiguous man- ner the foundation of conformational analysis theory applied to the elucidation of crystal structures. It appears that intermolecular interactions in the crystal can be treated in good approximation with the intramolecular potential functions. When coupled with appropriate X-ray data, crystalline conforma- tions may be deduced without highly refined potential functions. As compared to what is faced in polymer crystallography, where the number of packing param- eters is reduced, finding a good starting point may represent the essential difficulty associated with the proposed methodology. Once a reasonable location
* Laboratoire Propre du CNRS, associ6 ~ l'Universit6 Scien- tifique et M6dicale de Grenoble, France.
f Present address: Laboratoire de Stockage et de Conservation des Denr6es Alimentaires, INRA, Centre de Recherche de Nantes, Chemin de la G6raudi6re, 44072 Nantes, France.
has been found for the molecule, the minimization procedure allows one to handle a reasonable number of parameters and yet yields only a few possible structural models. At this stage, the best packing models have to be checked against X-ray structure amplitudes.
Introduction
The prediction of crystal structure on the basis of non-bonded potential energy has received relatively little attention (Williams, 1969; Coiro, Giglio & Quagliata, 1972; Simonetta, 1974: Dauber & Hagler, 1980). This method may be of special use in the case of small molecules (Zugenmaier & Sarko, 1972; Leser & Rabinovich, 1978) or for rigid molecules with few rotatable substituents (Williams, 1972; Ramachan- dran & Shamala, 1976) and in the area of polymer structure determination (Kitaigorodskii, 1973; Zugenmaier & Sarko, 1976; Smith & Arnott, 1978) where the lack of diffraction data makes it imperative to predict suitable structural models from the stereochemistry of the repeating units.
In the field of biological molecules, with the exclusion of globular proteins, it is becoming clear that, owing to either the poor quality or the dimensions of the single crystals which can be grown, only a small number of reflexions can be obtained experimentally. In this particular situation, neither conventional direct methods, nor the methods that have been developed for protein crystallography can be applied with success.
O 1985 International Union of Crystallography 0108-7681/85/040262-06501.50