Embed Size (px)
Citation preview

WEEK 4SKELETONS AND MUSCLESOctober 4-October 8, 2004
Learning objectives
1. To compare and analyze the forearm bones of the human, bat, pigeon and cat.
2. To be able to identify the structural equivalencies of bones in the forearm of the human, bat, pigeon and cat.
3. To learn how to make and to interpret electromyography (EMG) recordings from your own muscles.
4. To understand the causal connection between motor unit recruitment, the magnitude of the EMG signal, and force generated during a skeletal muscle contraction.
5. To learn how antagonistic muscles control the movement of bones around joints.
Discussion questions
What is the distinction between a homologous and analogous structure? What types of evidence are useful in judging homology?
Are the cat’s paw and the human hand structurally equivalent? Functionally equivalent?
What are the functional similarities and structural differences between the wings of the bat and the pigeon?
What is the source of the signal detected by the EMG electrodes?
What physiological process(es) underlies the observed relationship between EMG response and force output?
What does the term “motor unit recruitment” mean?
When you are holding a heavy cup of coffee in your hand, would you expect your biceps and triceps muscle to be contracting vigorously? Explain. Would you expect your triceps muscle to be activated vigorously as you lower the same coffee mug down to the surface of a table?
Readings: Campbell et al. 6th edition: pp. 438-440, 495-496, and 1080-1086.
fall 2004, Lab 4-1

MUSCLES AND SKELETONS
In this week’s recitation and laboratory, you will investigate the vertebrate muscular-skeletal system from two perspectives. First, you will study the forelimb of 4 species of vertebrate (human, bat, cat and bird), and attempt to identify the homologous bones (i.e., structural
equivalents). Second, you will examine how skeletal muscles are able to generate graded forces and move skeletal elements around joints.
BEFORE CLASS
IN GROUPS DURING LAB
ASSIGNMENT
Prepare for this week’s lab and pre-lab quiz: attend recitation
read the lab handout and the following pages from your Campbell textbook (6th edition: pp. 438-440, 495-496, 1080-1086)
Half of the class will begin with Part I of lab, focusing on the comparative anatomy of vertebrate forelimb skeletons. This group will also complete the worksheet on muscle histology.
Half of the class will begin with Part II of lab, focusing on electromyography (EMG).
Groups will switch activities halfway through lab.
Your group should turn in the following at the beginning of lab next week:
Comparative anatomy worksheets 1- 3 (drawings)
Comparative anatomy worksheet 4 (questions)
EMG worksheet 5 with data printout
EMG worksheet 6 with data printout
Individually, you will need to turn in your muscle histology worksheet.
fall 2004, Lab 4-2
LAB OVERVIEW

similarity
homology analogy common ancestry convergent evolution
e.g. bee wing/bat wing
different functions similar functions divergent evolution parallel evolutione.g. chimp forelimb/bat forelimb e.g. bat forelimb/bird forelimb
Terrestrial vertebrates share many of the same skeletal features, despite looking quite different from one another. For example, the forelimbs of terrestrial vertebrates contain many of the same bones. This observation reflects that all vertebrates evolved from a common ancestor. Accordingly, the arms, forelegs, flippers and wings of different vertebrates are all variations on a common anatomical theme (i.e., they are all homologous, or structural equivalents that were passed on through common ancestry). As the forelimbs of each species assumed different functions (over evolutionary time), the bones were modified. In some cases, these modifications involved changes in the size or shape of specific bones; occasionally, specific bones were fused together or even lost.
In this exercise, you will compare the forelimb bones of 4 vertebrates: humans, cats, bats and birds. Your task will be to identify all the bones in the human forelimb and then to hypothesize which bones are homologous in the cat, bat and pigeon.
One reason it is difficult to judge homology is that sometimes structures have similar function. For example, both birds and bats can fly. It is possible — but not necessarily the case — that bird and bat forelimbs may be similar not because of common ancestry, but because of common function and similar natural selection. In other words, there may have been convergent evolution.
Ideally, you would judge homology by looking at a phylogeny, or family tree, of relationships among these organisms. When phylogeny is not available, one important clue for judging homology would be looking at bone development in each organism. When examining skeletons, however, one of the only tools available for judging homology is the structural equivalency of the bones. You can also use the general principle that during evolution it is more likely for a particular structure (i.e., a bone) to be lost than to evolve several different times. Also, common ancestry is a much more likely explanation for a complex, multi-part structure than convergent evolution.
fall 2004, Lab 4-3
PART I: Comparative anatomy of vertebrate forelimbs

Your textbook provides additional, excellent discussions of the principle of homology, including the relationship between analogy and homology. Be sure (as always) to read the suggested pages in Campbell before coming to lab.
Comparative Anatomy of Forelimb Procedure
Each lab group should obtain the complete skeleton of all four species. Each worksheet has a drawing of the human arm and hand bones (complete with labels) on the left side and an empty space on the right side. You should sketch the forelimb bones of the cat, bat and pigeon in this empty space (each on separate work sheets). [Note: you will lose points for sloppy sketches.] Then, you should identify the structurally equivalent bones in the human arm and the forelimb of the other species. A fourth worksheet asks you some questions about homology, structural equivalence, and function in the vertebrate forelimb. You should discuss and answer these questions as a group. Your group should hand in all 4 worksheets at the beginning of next week’s laboratory period.
Muscle Function
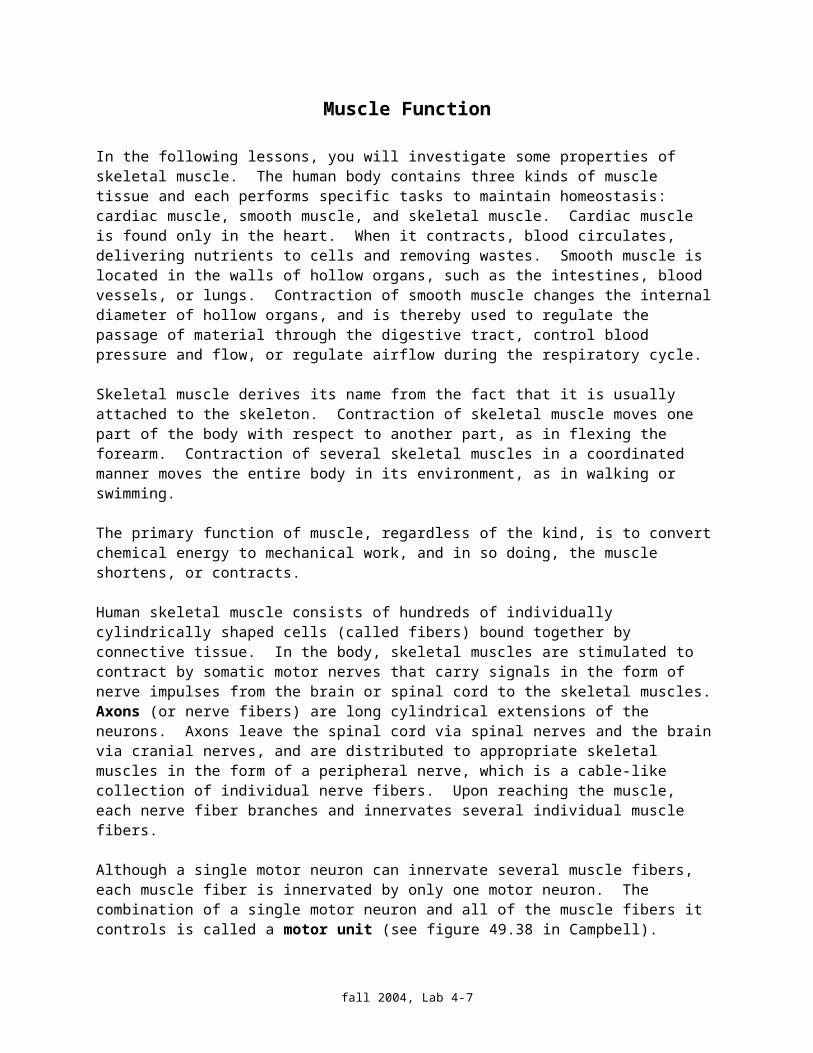
In the following lessons, you will investigate some properties of skeletal muscle. The human body contains three kinds of muscle tissue and each performs specific tasks to maintain homeostasis: cardiac muscle, smooth muscle, and skeletal muscle. Cardiac muscle is found only in the heart. When it contracts, blood circulates, delivering nutrients to cells and removing wastes. Smooth muscle is located in the walls of hollow organs, such as the intestines, blood vessels, or lungs. Contraction of smooth muscle changes the internal diameter of hollow organs, and is thereby used to regulate the passage of material through the digestive tract, control blood pressure and flow, or regulate airflow during the respiratory cycle.
Skeletal muscle derives its name from the fact that it is usually attached to the skeleton. Contraction of skeletal muscle moves one part of the body with respect to another part, as in flexing the forearm. Contraction of several skeletal muscles in a coordinated manner moves the entire body in its environment, as in walking or swimming.
The primary function of muscle, regardless of the kind, is to convert chemical energy to mechanical work, and in so doing, the muscle shortens, or contracts.
Human skeletal muscle consists of hundreds of individually cylindrically shaped cells (called fibers) bound together by connective tissue. In the body, skeletal muscles are stimulated to contract by somatic motor nerves that carry signals in the form of nerve impulses from the brain or spinal cord to the skeletal muscles. Axons (or nerve fibers) are long cylindrical extensions of the neurons. Axons leave the spinal cord via spinal nerves and the brain via cranial nerves, and are distributed to appropriate skeletal muscles in the form of a peripheral nerve, which is a cable-like collection of individual nerve fibers. Upon reaching the muscle, each nerve fiber branches and innervates several individual muscle fibers.
Although a single motor neuron can innervate several muscle fibers, each muscle fiber is innervated by only one motor neuron. The combination of a single motor neuron and all of the muscle fibers it controls is called a motor unit (see figure 49.38 in Campbell).
fall 2004, Lab 4-4

When a somatic motor neuron is activated, all of the muscle fibers it innervates respond to the neuron’s impulses by generating their own electrical signals that lead to contraction of the activated muscle.
The size of the motor unit arrangement of a skeletal muscle (e.g., 1:10, 1:50, or 1:3000) is determined by its function (flexion, extension, etc.) and location in the body. The smaller the size of a muscle’s motor units, the greater the number of neurons needed for control of the muscle, and the greater degree of control the brain has over the extent of shortening. For example, muscles that move the fingers have very small motor units to allow for precise control, as when operating a computer keyboard. Muscles that maintain the posture of the spine have very large motor units, since precise control over the extent of shortening is not necessary.
Physiologically, the degree of skeletal muscle contraction is controlled by:
1. Activating a desired number of motor units within the muscle, and2. Controlling the frequency of motor neuron impulses in each motor unit.
When an increase in the strength of a muscle’s contraction is necessary to perform a task, the brain increases the number of simultaneously active motor units within the muscle. This process is known as motor unit recruitment.
When a motor unit is recruited (or activate), the component muscle fibers generate and conduct their own electrical impulses that ultimately result in contraction of the fibers. Although the electrical impulse generated and conducted by each fiber is very weak (less than 100 microvolts), many fibers conducting simultaneously induce voltage differences in the overlying skin that are large enough to be detected by a pair of surface electrodes. The detection, amplification, and recording of changes in skin voltage produced by underlying skeletal muscle contraction are called electromyography.
Once you have lifted a light object, the brain recruits approximately the same number of motor units to keep the object up, but cycles between different motor units. The muscle fibers consume stored energy available in the muscle and generate a force by contracting. As the muscle fibers deplete this fuel source, more energy must be mobilized in order to continue contracting. By recruiting different motor units, motor units can relax and replenish their fuel sources.
Typical EMG results: the greater magnitude on the right is the result of higher motor unit recruitment.
fall 2004, Lab 4-5
Magnitude of EMG response(in mV)
(in mV)
Time (sec)
Time (sec)

This part of the lab studies the contractile properties of the tissues that move the skeleton — i.e., the skeletal muscles. You will study the cellular histology of skeletal muscle and compare it to cardiac muscle and smooth muscle tissue.
You will also use a noninvasive technique, electromyography (EMG), to monitor neural activity of muscles. We will use EMG to study how the brain (a) generates graded amounts of force in the muscles, and (b) causes bones to move around a joint.
Before discussing the methodological details of the exercises, we need to review three features of muscle anatomy and physiology. See your textbook (6th edition pp. 1084-1086) for more details.
Each muscle consists of thousands of cylindrically shaped cells (called muscle fibers) that are bound together by connective tissue. A muscle fiber contracts when it receives the appropriate amount of electrical stimulation. This electrical stimulation is usually provided by a motor neuron, which carries electrical signals from the brain, through the spinal cord, to each muscle fiber. Upon reaching the muscle, each motor neuron branches and innervates several different muscle fibers. The combination of a single motor neuron and all of the muscle fibers that it innervates is called a motor unit. Each muscle consists of many motor units.
It is important to realize that muscle fibers, like neurons, respond to electrical stimulation in an all-or-none manner. That is to say, individual muscle fibers cannot exhibit a graded response—whenever one receives the critical level of electrical stimulation, it contracts maximally. Given this observation, you should be wondering at this point how a whole muscle (e.g., the biceps) can generate graded amounts of force. After all, shouldn’t the muscle contract maximally every time it is stimulated?
The resolution to this conundrum is that each muscle consists of many motor units that differ greatly in size. When the brain wants a particular muscle to contract weakly, it causes a limited number of small motor units to contract. When the brain wants a muscle to contract more forcefully, it causes a greater number of motor units to contract. This process, called motor unit recruitment, enables muscle to generate graded amounts of force.
When the muscle fibers within a motor unit are stimulated by a motor neuron, they respond by generating their own electrical signal. These signals propagate across the surface of the muscle fiber, and then down into the center of the muscle fiber (via the transverse-tubules), where they activate the contractile machinery. You can record this electrical activity with surface electrodes (i.e., electrodes placed on the surface of the skin) coupled to recording equipment. You should realize, however, that your EMG will record neural activity from several motor units, and in some cases, from several muscles. Thus, the EMG signal should be viewed as the sum of all neural activity occurring in the muscles immediately below the surface electrodes.
EMG ACTIVITY 1 Relationship between the size of the EMG signal and force output
fall 2004, Lab 4-6
PART II: Muscle function and electromyography
This exercise examines the relationship between the magnitude of the EMG signal from your forearm flexors and the amount of force generated while clenching an object. The forearm flexors are the muscles on the inside of your forearm. Contraction of these muscles causes your fingers to curl and, hence, clench an object in your hand. To release your grip on the same object, you would relax your forearm flexors and contract your forearm extensors (i.e., the muscles located on the outside of your forearm).
Hypothesis generation
At this point, your group should generate a hypothesis about the relationship between the magnitude of the EMG signal and the force output of your forearm flexors (see worksheet 5). Your prediction should be stated graphically—that is, construct a bivariate (x-y) plot with the magnitude of the EMG signal on the Y-axis and the amount of force exerted on the X-axis. Indicate your prediction by drawing a line on this graph.
If you predict a direct linear relationship between the two variables, then draw a straight line with a positive slope.
If you predict an inverse linear relationship, then draw a straight line with a negative slope.
If you predict an asymptotic relationship, then draw such a line.
If you predict no relationship, then draw a horizontal line with no slope.
In addition to stating your hypothesis graphically, briefly write out your hypothesis. After you have completed these steps, test your hypothesis by performing an experiment.
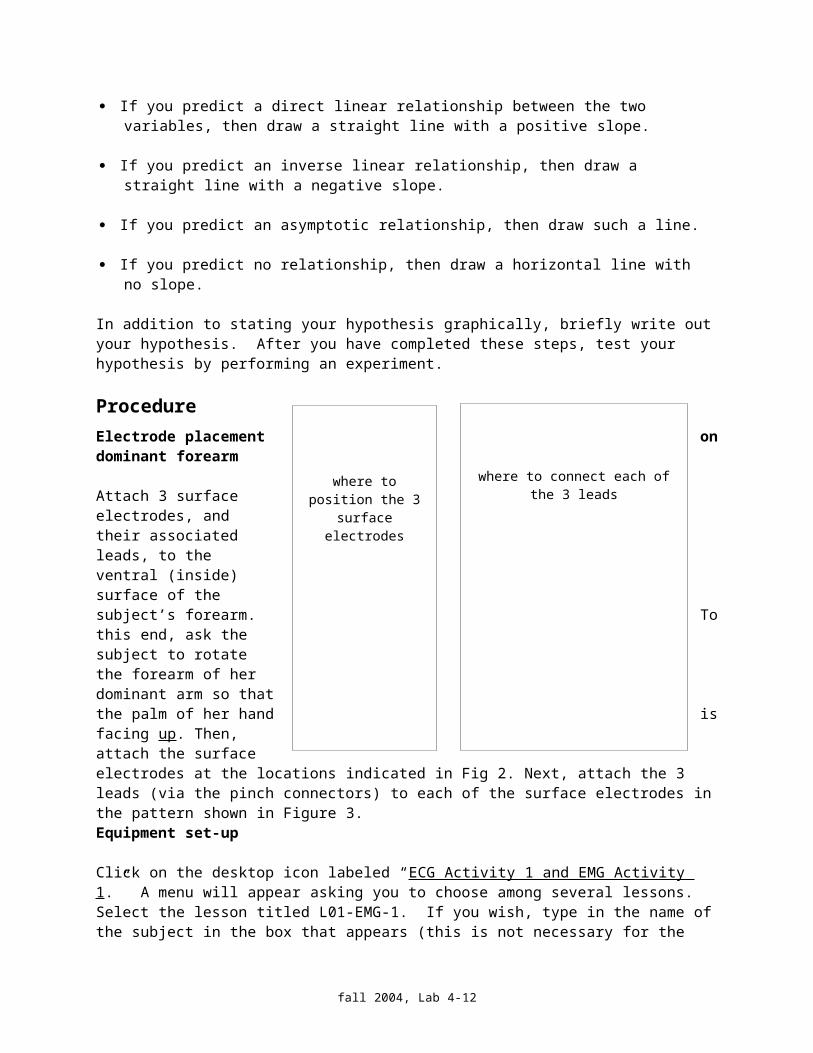
ProcedureElectrode placement on dominant forearm
Attach 3 surface electrodes, and their associated leads, to the ventral (inside) surface of the subject’s forearm. To this end, ask the subject to rotate the forearm of her dominant arm so that the palm of her hand is facing up. Then, attach the surface electrodes at the locations indicated in Fig 2. Next, attach the 3 leads (via the pinch connectors) to each of the surface electrodes in the pattern shown in Figure 3.Equipment set-up
Click on the desktop icon labeled “ECG Activity 1 and EMG Activity 1.” A menu will appear asking you to choose among several
fall 2004, Lab 4-7
where to connect each of the 3 leadswhere to position the 3 surface electrodes

lessons. Select the lesson titled L01-EMG-1. If you wish, type in the name of the subject in the box that appears (this is not necessary for the program to work). If someone with the same name has already used the program, click to reuse the name.
Next, a new screen should appear containing an empty window and a button labeled “CALIBRATE” in the upper left corner. Click on this button and follow the instructions carefully. This calibration procedure lasts 8 seconds and is critical for optimum performance. The computer needs to take an EMG reading while you clench your fist (i.e., activate your forearm flexors) maximally to set internal parameters of the program. You should see an EMG signal appear as soon as the subject begins clenching her fist—it should look like a cluster of vertical lines. Once this calibration procedure is completed, your group will be ready to run the experiment.
Experimental procedure
Before beginning the experiment, your subject should hold the dynamometer in her hand and place her forearm flat on the lab bench. Have the subject practice clenching her fist to varying degrees of intensity. She should become proficient at generating 7 different levels of clench intensity. One member of your group should become proficient at reading the hand dynamometer to quantify the amount of force she generates with each clench. After becoming proficient with these skills, your group will be ready to collect data.
Begin by clicking on the RECORD button. At this point, the subject should make the weakest fist clench for approximately 1.0 second. After the clench has been released, click on the SUSPEND button and record the amount of force (in kg) from the dynamometer in the appropriate place on Worksheet 5.
Next, click RESUME and record a second EMG response, but have the subject clench her fist for approximately 1.0 second a bit more forcefully this time. Click on the SUSPEND button immediately after the clench has been released, and record the amount of force from the hand dynamometer to the worksheet. Continue in this manner until you have recorded the EMG response and force output during an ascending series of successively more forceful clenches (7 clenches total).
You will notice that there are two windows on the data collection screen. The upper window contains the raw EMG signal, and the lower window contains the integrated EMG signal (i.e., a moving average of the EMG signal over time). The vertical axis of each window represents the magnitude of the EMG signal, and the horizontal axis represents real time (in seconds).
Analysis of the EMG results
Once you have recorded the EMG responses, click on the Stop button. You will be prompted, “Are you finished with both forearm recordings?” Click yes. Click Done. Next, select “Analyze current data file.” At this point, you need to record the highest integrated EMG value (in millivolts) (this is the P-P value) obtained for each fist clench (corresponding to dynamometer readings) and enter these values on Worksheet 5. [Why aren’t you recording delta T as you did for the ECG?] Using the scroll bar at the bottom of the window, center the part of the EMG that you would like to print in the window. Next, go to “print” in the drop-down menu under File. Next, click on the “setup” button and change the page setup from portrait to landscape and click ok. Then, print 4 copies (one for each member of your group). When your group is finished with EMG Activity 1, select “Quit” from the File Menu. DO NOT SAVE CHANGES.
fall 2004, Lab 4-8

You will need to plot your findings on the graph on your EMG worksheet, with EMG response on the x-axis and force output on the y-axis (don’t forget to always label all axes and include units). Finally, you need to explain your results on EMG worksheet 1. Did your results support your hypothesis? Provide a brief physiological explanation for your results at the bottom of the EMG worksheet. PLEASE note that you can NEVER “PROVE” a hypothesis. NEVER, EVER. Your data can support a hypothesis or not, but NEVER “prove.”
EMG ACTIVITY 2 Agonists and Antagonists
The muscles you activate while performing a specific movement (e.g., lifting a cup of coffee to your mouth) are referred to as the agonists. The muscles that oppose this movement are called the antagonists. Antagonist muscles are usually “silent” (i.e., not contracting) during a movement. These 2 sets of opposing muscles lie on opposite sides of joints and serve diametrically opposed functions—flexion (i.e., opening) vs. extension (i.e., closing) of the joint. The principles of flexion and extension are nicely explained and diagrammed in your textbook (see p. 1080, Fig. 49.30 in 6th edition), and examples are given for organisms with endoskeletons, such as the vertebrates, and for organisms with exoskeletons, such as the arthropods.
In this experiment, you will study the action of the muscles that flex and extend your elbow joint. Your biceps muscle flexes your elbow joint, and in so doing, brings your forearm towards your body.Use Worksheet 6 to describe your hypotheses and to summarize and interpret data for the exercise.
Procedure
Electrode placement
Ask the subject to flex her biceps muscle (e.g., lift something heavy). Palpate the biceps as she performs this movement to determine where the contraction is strongest (i.e., where the biceps feel the hardest). Attach one electrode at this location. Then, ask the subject to flex her triceps muscle (e.g., place her palm on the table and push downwards). Palpate the triceps as she performs this movement to determine where the muscle contracts maximally. Attach one electrode at this location. Then, attach four electrodes to her wrist.
Lead placement
You will need to use 2 sets of leads for this exercise. (Note that each set of leads contains a white, red and black connector).
fall 2004, Lab 4-9

Channel 1 leads from Biopac box. Attach: White connector to the electrode on the subject’s biceps muscle Red and Black connectors to 2 of the electrodes on the subject’s wrist.
Channel 2 leads from Biopac box. Attach: White connector to the electrode on the subject’s triceps muscle, Red and black connectors to the other 2 electrodes on the subject’s wrist.
Experimental Procedure
Open the “EMG Activity 2” program on the computer. Select Open from under the File menu and open “EMG Activity 2” from the Lab 4 folder. You do not need to calibrate the hardware for this experiment (you also won’t need to tell the program you are done collecting data and are ready to analyze the data). You should have your electrodes and leads attached, the computer program open, and be ready to perform two exercises:
A) lift a small weight (mortar) from the lab bench to your chin (with your elbow resting on the lab bench); and
B) do a backwards push up on the lower lab bench with your hands at your sides at your back (your instructor and/or TA can demonstrate this for you).
Single click on the Start button in the lower right corner of the window to begin recording data. Each data recording will proceed for a maximum of 30 seconds, so you should have the subject repeat each of the above exercises three times within the 30-second time period (the subject does not have to do all six in the same 30-second period; she can do three in a first run and three in a second run). Record the P-P values for each of the three repetitions on Worksheet 6.
Calculate average values for the three repetitions, and record these in Worksheet 6. Using the scroll bar at the bottom of the window, center the part of the EMG that you would like to print in the window. Next, go to “print” in the drop-down menu under File. Next, click on the “setup” button and change the page setup from portrait to landscape and click ok. Then, print 4 copies (one for each member of your group). When your group is finished, select Quit from the File Menu. DO NOT SAVE CHANGES.
Analyze your data and draw conclusions about whether your data support your hypothesis. Complete Worksheet 6. Remember that you can NEVER “PROVE” a hypothesis. NEVER, EVER. Your data can support a hypothesis or not, but NEVER “prove.”
fall 2004, Lab 4-10

You should turn in the following worksheets at the beginning of lab next week. Please turn in
one worksheet per group of four students, except for the muscle histology worksheet 7.
Part I of lab:
1. Comparative anatomy worksheets 1-3 (drawings)
2. Comparative anatomy worksheet 4 (answers to questions)
3. Muscle tissue histology worksheet 7
This is the only worksheet that needs to be completed and turned in individually.
Part II of lab:
4. Worksheet 5, EMG Activity 1: with written and graphical hypotheses, numeric and
graphical results, and evaluation of the hypothesis; attach data printout.
5. Worksheet 6, EMG Activity 2: with written hypotheses, numeric results, and evaluation
of the hypotheses; attach data printout.
fall 2004, Lab 4-11
Assignment (due at the beginning of lab next week)
Group members __________________________________________________________________________________
Day/Time/Instructor ___________________________________BC Bio 2003 Fall 2004
LAB 4, WORKSHEET 1: FORELIMB COMPARISON – HUMAN VS. BAT
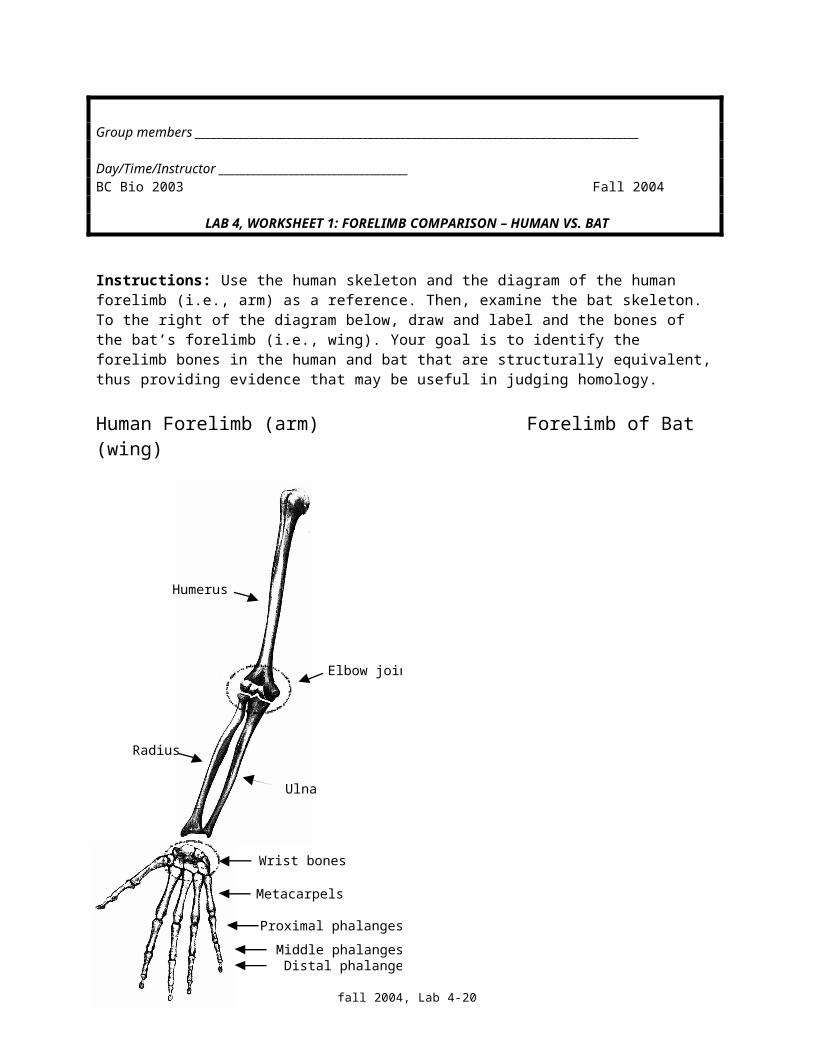
Instructions: Use the human skeleton and the diagram of the human forelimb (i.e., arm) as a reference. Then, examine the bat skeleton. To the right of the diagram below, draw and label and the bones of the bat’s forelimb (i.e., wing). Your goal is to identify the forelimb bones in the human and bat that are structurally equivalent, thus providing evidence that may be useful in judging homology.
Human Forelimb (arm) Forelimb of Bat (wing)
fall 2004, Lab 4-12
Humerus
Radius
Ulna
Wrist bones
Metacarpels
Proximal phalanges
Middle phalangesDistal phalanges
Elbow joint

Group members __________________________________________________________________________________
Day/Time/Instructor ___________________________________BC Bio 2003 Fall 2004
LAB 4, WORKSHEET 2: FORELIMB COMPARISON – HUMAN VS. PIGEON
Instructions: Use the human skeleton and the diagram of the human forelimb (i.e., arm) as a reference. Then, examine the pigeon skeleton. To the right of the diagram below, draw and label and the bones of the pigeon’s forelimb (i.e., wing). Your goal is to identify the forelimb bones in the human and pigeon that are structurally equivalent, thus providing evidence that may be useful in judging homology.
Human Forelimb (arm) Forelimb of Pigeon (wing)
fall 2004, Lab 4-13
Humerus
Radius
Ulna
Wrist bones
Metacarpels
Proximal phalanges
Middle phalangesDistal phalanges
Elbow joint

Group members __________________________________________________________________________________
Day/Time/Instructor ___________________________________BC Bio 2003 Fall 2004
LAB 4, WORKSHEET 3: FORELIMB COMPARISON – HUMAN VS. CAT
Instructions: Use the human skeleton and the diagram of the human forelimb (i.e., arm) as a reference. Then, examine the cat skeleton. To the right of the diagram below, draw and label and the bones of the cat’s forelimb. Your goal is to identify the forelimb bones in the human and cat that are structurally equivalent, thus providing evidence that may be useful in judging homology.
Human Forelimb (arm) Forelimb of Cat
fall 2004, Lab 4-14
Humerus
Radius
Ulna
Wrist bones
Metacarpels
Proximal phalanges
Middle phalangesDistal phalanges
Elbow joint
Group members __________________________________________________________________________________
Day/Time/Instructor ___________________________________BC Bio 2003 Fall 2004
LAB 4, WORKSHEET 4: FORELIMB COMPARISON – QUESTIONS
1. Do the bird, bat, and cat forelimbs have the same bones as the human forelimb? Explain.
2. How do the structures of the phalanges differ among the human, bird, bat, and cat?
3. Are the cat’s paw and the human hand structurally equivalent?
4. Do the same bones serve the same functions in the taxa you studied? Give an example.
5. Speculate on why these organisms share the same bones with different shapes rather than different bones with different shapes.
fall 2004, Lab 4-15

MA
GN
ITU
DE
OF
EM
G S
IGN
AL
(mV
)
AMOUNT OF FORCE (KG)
Group members __________________________________________________________________________________
Day/Time/Instructor ___________________________________BC Bio 2003 Fall 2004
LAB 4, WORKSHEET 5: VARIATION IN EMG SIGNAL WITH MUSCLE FORCE
1. HYPOTHESIS: Your group should generate a hypothesis about the relationship between the magnitude of the EMG signal and force output of your forearm flexors (left). See your lab manual for guidance. Write out your hypothesis in the space below also draw a graphical representation of your hypothesis on the graph below.
2.
fall 2004, Lab 4-16
HYPOTHESIS GRAPH

AMOUNT OF FORCE (KG)
MA
GN
ITU
DE
OF
EM
G S
IGN
AL
(mV
)3. Results (attach a LABELED copy of your EMG print out )
FOREARM CONTRACTION kg force from dynamometer EMG P-P (mV)
fist clench 1 (weakest)
fist clench 2
fist clench 3
fist clench 4
fist clench 5
fist clench 6
fist clench 7 (strongest)
4. Results Graph
5. Did your data support your hypothesis? Explain why or why not? (Don’t even think about using the word “prove” here!)
fall 2004, Lab 4-17

Group members ______________________________________________________________________________
Day/Time/Instructor ___________________________________BC Bio 2003 Fall 2004
LAB 4, WORKSHEET 6: Agonists and Antagonists
1. Which muscles do you expect to be active during: (1) Lifting a small weight from the lab bench to your chin (Flexion) and (2) Pushing down on the lab bench with your hand (Extension)? How will you use EMG recordings to test your hypothesis? Specifically state your predictions of EMG activity in relation to muscle movement.
2. Record the EMG readings during these movements in the table below. Repeat each action, either flexion or extension, three times and calculate average values. Print out a copy of your EMG records and attach them to this worksheet.
fall 2004, Lab 4-18

3. Was your hypothesis supported by your EMG data? Explain.
4. Explain the source of signals detected by the EMG electrodes.
5. What does the phrase “motor unit recruitment” mean?
fall 2004, Lab 4-19
Lab Part II continued: MUSCLE HISTOLOGY
To make connections between Labs 3 and 4, we will be examining the three types of muscle tissue that occur in our bodies: skeletal muscle, cardiac muscle and smooth muscle. Remember that muscle tissue is one of the four basic tissue types occurring in animals. (The other three types are epithelial, connective, and nervous tissue.)
Muscles are composed of many muscle cells that are also called muscle fibers. Skeletal and cardiac muscles are classified as striated muscles because their muscle fibers have the appearance of altering light and dark bands under the light microscope.
Most skeletal muscles are attached to the bones of the skeleton, enabling them to control body movement. (Can you think of an exception, where skeletal muscle is not attached to bone?) Note the very prominent striations in the photograph above. These fibers are large, multinucleate cells (several uninucleate cells fuse during formation of a muscle cell).
Cardiac muscle is found only in the heart and is responsible for moving the blood through the circulatory system. Cardiac muscle is similar to skeletal muscle, but its cells are uninucleate and branched, it has intercalated discs (see arrow in photograph above) that facilitate the coordinated contraction of cardiac muscle cells, it can generate its own action potentials, and its action potentials are of long duration.Smooth muscle is the primary muscle of surrounding internal organs and tubes such as the stomach, urinary bladder, and blood vessels. You looked at smooth muscle in Lab 3 in the artery and vein cross sections and in Lab 2 in the esophagus cross section. Smooth muscle fibers are small uninucleate cells without obvious banding patterns (smooth muscles still have actin and myosin, but they are not arranged in the same manner as in striated muscle). The nuclei of several smooth muscle fibers are labeled with “N” in the photograph above. Smooth muscle contracts with less tension, but over a greater range of lengths than skeletal muscle, and it has s
fall 2004, Lab 4-20
Skeletal muscle Smooth muscle Cardiac muscle

low contractions, but with more control over contraction strength than with skeletal muscle. In addition, smooth muscle has no sarcoplasmic reticulum; calcium ions instead enter the cytosol via the plasma membrane.
fall 2004, Lab 4-21

Name ________________________________Day/Time/Instructor ___________________________________BC Bio 2003 Fall 2004
LAB 4, WORKSHEET 7: MUSCLE HISTOLOGY
fall 2004, Lab 4-22

A. Smooth muscleMagnification ________________________
Striated or not? _______________________
Uni- or multi-nucleate? _________________
B. Skeletal muscleMagnification _______________________
Striated or not?______________________
Uni- or multi-nucleate? ______________
C. Cardiac muscle Magnification _____________________
Striated or not? ________________________
Uni- or multi-nucleate? _____________
D. Is cardiac more similar to skeletal muscle or smooth muscle? Explain.
E. What special feature is present only in cardiac muscle? What is the function of these structures?
Lab 4-1


![[PPT]Quality Improvement: Problem Solving - Saint …homepages.stmartin.edu/fac_staff/dstout/MEM650/Ch03... · Web viewTitle Quality Improvement: Problem Solving Subject PDCA Cycle](https://img.dokumen.tips/doc/110x75/5aeac4fc7f8b9a36698d7378/pptquality-improvement-problem-solving-saint-viewtitle-quality-improvement.jpg)


![[PPT]No Slide Title - Personal homepage directoryhomepages.stmartin.edu/fac_staff/dstout/MEM650/Ch11 Cost... · Web viewTitle No Slide Title Subject Quality Tools Author Donald E](https://img.dokumen.tips/doc/110x75/5ad5ca7f7f8b9a5d058d9d2d/pptno-slide-title-personal-homepage-costweb-viewtitle-no-slide-title-subject.jpg)

![[PPT]Chapter 2 Linear Programming Models: Graphical …homepages.stmartin.edu/fac_staff/dstout/MBA605... · Web viewTitle Chapter 2 Linear Programming Models: Graphical and Computer](https://img.dokumen.tips/doc/110x75/5abf5d4b7f8b9a3a428e1b85/pptchapter-2-linear-programming-models-graphical-viewtitle-chapter-2-linear.jpg)


![[PPT]Quality Improvement: Problem Solving - Saint …homepages.stmartin.edu/fac_staff/dstout/MEM650/Ch03 7 QC... · Web viewTitle Quality Improvement: Problem Solving Subject PDCA](https://img.dokumen.tips/doc/110x75/5b047a5d7f8b9a2e228de3d9/pptquality-improvement-problem-solving-saint-7-qcweb-viewtitle-quality.jpg)

