Embed Size (px)
Citation preview

2009 Student Survey
RESULTS
LOS ANGELES HARBOR CLOS ANGELES HARBOR COLLEGEOLLEGE

This page intentionally left blank.
2

FFALLALL 2009 2009
SSTUDENTTUDENT SSURVEYURVEY
RRESULTSESULTS
LOS ANGELES LOS ANGELES
HARBOR COLLEGEHARBOR COLLEGE
OFFICE OF INSTITUTIOOFFICE OF INSTITUTIONAL RESEARCHNAL RESEARCH
JULY 2010JULY 2010
3

BBOARDOARD OFOF TTRUSTEESRUSTEES
Mona Field, President
Georgia L. Mercer, Vice President
Kelly G. Candaele
Tina Park
Nancy Pearlman
Miguel Santiago
Sylvia Scott‐Hayes
Rodney D. Robinson, Student Trustee
DDISTRICTISTRICT AADMINISTRATIONDMINISTRATION
Dr. Tyree Wieder, Interim Chancellor
Dr. Adriana D. Barrera, Deputy Chancellor
John Clerx, Vice Chancellor for Educational Support Services
Gary Colombo, Vice Chancellor for Institutional Effectiveness
Marvin Martinez, Vice Chancellor for Economic and Workforce Development
Larry H. Eisenberg, Executive Director, Facilities Planning and Development
Camille A. Goulet, General Counsel
Jeanette Gordon, Chief Financial Officer/Treasurer
CCOLLEGEOLLEGE AADMINISTRATIONDMINISTRATION
Dr. Linda M. Spink, President
Luis M. Rosas, Vice President of Academic Affairs
Dr. Ann W. Tomlinson, Vice President of Administrative Services
Abbie L. Patterson, Vice President of Student Services
Bobby R. McNeel, Vice President of Economic & Workforce Development
Nestor Tan, Associate Vice President of Administrative Services
Dr. Kristi Blackburn, Dean of Academic Affairs
Dr. David M. Humphreys, Dean of Academic Affairs
David Ching, Dean of Admissions and Records & Evening Operations
Nina Malone, Dean of Student Life
Dr. Robert Richards, Associate Dean of Research & Planning
Mercy Yanez, Associate Dean of EOP&S and CARE
4

FFALLALL 2009 S2009 STUDENTTUDENT SSURVEYURVEY RRESULTSESULTS
TTABLEABLE OFOF CCONTENTSONTENTS
ACKNOWLEDGEMENTS .................................. 7
CAVEATS .......................................................... 8
INTRODUCTION .............................................. 8
GOALS AND PLANS .......................................... 9 Objective Feeling about Attending College Problems in Reaching Academic Goals
DEMOGRAPHICS ............................................. 11 Age Ethnicity Gender Class Status
BACKGROUND ................................................ 12 Length of Stay in the U.S. Educational Level of Family Members Marital Status Dependents Disability
FINANCIAL RESOURCES ................................. 15 Hours of Employment Changes to Employment Hours Additional Public Assistance Foster Care Eligibility for Financial Aid Additional Financial Aid Questions Cost of Text Books
COUNSELING INFORMATION & SERVICES ... 20 Use of Services Primary Purpose Education Plan Type of Appointment Satisfaction with Last Meeting Additional Counseling Questions
COLLEGE EXPERIENCE ................................... 24 Student Participation Computer Use Interaction with Instructors Participation in College Activities Hours on Various Activities
Improved Abilities Due to College Experiences Additional Hours on Campus College Educational Practices
CAMPUS FACILITIES AND SERVICES ............. 28
COMMENTS ................................................... 29 Highlights on What’s Best About LAHC Highlights on Suggested Changes to LAHC Additional Comments
SUPPLEMENTAL QUESTIONS Frequency of Use of Different
on Campus Services ................................... 35 Availability of Services ..................................... 36 Satisfaction with Services ................................. 37
FALL 2009 STUDENT SURVEY RESPONSES
5

Access to Online Course ................................... 39 Type of Internet Access .................................... 39
GOALS AND PLANS ........................................ 40 Highest Degree/Certificate Intend to Obtain Objective Feeling about Attending College Problems in Reaching Academic Goals
DEMOGRAPHICS ........................................... 42 Age Ethnicity Gender
BACKGROUND ............................................... 43 Length of Stay in the U.S. Educational Level of Family Members Marital Status Dependents Disability
FINANCIAL RESOURCES ............................... 46 Hours of Employment Changes to Employment Hours Additional Public Assistance Foster Care Eligibility for Financial Aid Additional Financial Aid Questions Cost of Text Books
COUNSELING INFORMATION & SERVICES ... 50 Use of Services Primary Purpose Education Plan Type of Appointment Satisfaction with Last Meeting Additional Counseling Questions
COLLEGE EXPERIENCE ................................... 54 Student Participation Computer Use Interaction with Instructors Participation in College Activities Hours on Various Activities
Improved Abilities Due to College Experiences Additional Hours on Campus College Educational Practices
CAMPUS FACILITIES AND SERVICES ............ 60
COMMENTS ................................................... 61 Highlights on What’s Best About LAHC Highlights on Suggested Changes to LAHC Additional Comments
APPENDIX
LACCD Fall 2009 Student Survey ..................... 64 LAHC Supplemental Questions ........................ 68
ONLINE SURVEY RESPONSES
FFALLALL 2009 S2009 STUDENTTUDENT SSURVEYURVEY RRESULTSESULTS
TTABLEABLE OFOF CCONTENTSONTENTS
6

AACKNOWLEDGEMENTSCKNOWLEDGEMENTS
T he Student Survey is a major undertaking and it takes the cooperation of the entire
college. We would like to especially thank the faculty members for their support by
taking class time and administering the survey:
We would also like to thank Dr. George Prather of the District Office and his staff for
sampling and coordinating with all the nine colleges; Ken Roberts and the mailroom staff
for the distribution and collection; and Juanita Naranjo and her staff for assisting with the
preparations and clean‐up.
Michael Agopian Nagy Bakhoum Eman Bermani Cassandra Betts Paula Brown Albert Campbell Katherine Campbell Daisy Carr John Coleman John Corbally Azzam Elshihabi Claude Fiddler Beverly Fridley Joan Fu Mani Gagrat Barbara Gallardo Catherine Garay Lisa Gaydosh Wallace Graves Willie Griffin Dennis Griffith Igor Grigoriev Jean Grooms Michael Hiscocks Fredrick Ho Danielle Holmes Jeffrey Hoppenstand Shiuling Huang Basil Ibe Gregory Jackson Gail Denise Jacobs Chelsea Jarecke Jane Kimball
Gerry Koehler Stacy Komai Marlene Koven Lorenz Krueger Terry Lawton Donald Lechman Stephen Lockwood William Loiterman Kendra Lynch Frank Ma Dee Masters Timothy McCord Paul McLeod Susan McMurray Andrea Miles Gary Miller Lane Moore Steven Morris Tissa Munasinghe Ruben Nadler Zhijun Ni Ryoko Luers Laxmi Pandey Joyce Parker Keith Plutchok Kenneth Poole Arturo Quesada Elena Reigadas Rey Rojo Danielle Roman Zahra Romero Susan Ross Farzaneh Saddigh
Janice Sandell Stanley Sandell Joyce Saxton Constance Schwartzman Elayne Sidley James Slama Kevin Smith Michael Song Donette Steele Susan Steele Carole Stevenson Kent Stoddart Daniel Strivewell Craig Sutherland Steven Swaim Bosco Tong Theresa Ursic Mario Valadez Kym Valvieja Marcela Vanharova Ruben Vega Nancy Vogel Randy Lynn Wade Antoinette Walsh Ann Warren Pamela Watkins Cheryl Watson Doris Webster Don Weems Mits Yamashita Florence Yates
7 Table of Contents

LOS ANGELES HARBOR COLLEGE FALL 2009 STUDENT SURVEY RESULTS
Los Angeles Harbor College participated in the Los Angeles Community College
District‐wide Student Survey in the fall of 2009. This survey is conducted biennially. It
is an important resource to gain a better understanding of current and specific needs
of our students as well as provide data for grants, program review, and other
assessment needs.
About 3,600 surveys were distributed to 138 credit sections. Outreach classes,
non‐revenue generating sections, work experience, and cooperative education were
excluded. Interest in specific occupational areas, highest level of education in the
family, financial aid, and changes in the number of work hours were among the new
questions included in this survey.
The main sections were Goals and Plans; Background; Financial Resources;
Counseling Information and Services; College Experiences; and Campus Facilities and
Services.
This report summarizes the responses from 2,586 students.
CCAVEATSAVEATS
The survey was conducted during October 2009 so any activities that have occurred after that period would not be reflected in the results.
The survey sampled sections, not students. Because of this, there is a possibility that the sample is not as representative as a sample of students would be. To correct for this, we have used a weighting procedure developed by Dr. George Prather of the LACCD Research Office.
The following types of classes were excluded from the survey: Outreach classes—at the time the survey was conducted, many of these classes
were not in session Non‐revenue generating sections Work Experience and Cooperative Education
Students who chose not to respond to certain questions were included in the “No Response” percentages. However, those who stopped responding to subsequent items were deleted from the calculations.
Harbor College added several questions the various services offered on campus. Harbor College also surveyed our online population. The sampling error of the survey is ± 5%. Our response rate was 72%. The District average response rate was 86.2%.
8 Table of Contents

LOS ANGELES HARBOR COLLEGE FALL 2009 STUDENT SURVEY RESULTS
GOALS AND PLANS
Table 1.a
What is your objective at this college?
Student
Survey
Percent
High school diploma or GED 1.6%
Certificate in a vocational program 4.8%
Associate degree and preparation for transfer to a 4‐
year college56.4%
Associate degree only 10.8%
Transfer preparation only 15.7%
Not seeking a degree/certificate or already have one 2.6%
Undecided 6.8%
No Response 1.4%
How do you feel about attending college?Strongly
AgreeAgree Disagree
Strongly
Disagree
No
Response
Being a college student has a great deal of personal
meaning to me 62.2% 32.3% 2.6% 1.3% 1.6%
Being enrolled in college has made me happy 43.7% 45.1% 5.1% 1.2% 5.0%
In my family, going to college is highly valued 57.0% 29.8% 6.0% 1.9% 5.3%
My family would be disappointed if I didn't go to college 42.5% 26.6% 17.6% 6.0% 7.3%
Would not go to college if another way to achieve goals 9.2% 18.6% 41.5% 25.1% 5.6%
Would not have enrolled in college if had a better
alternative 7.4% 17.2% 40.7% 29.2% 5.5%
Table 1.b
9 Table of Contents

LOS ANGELES HARBOR COLLEGE FALL 2009 STUDENT SURVEY RESULTS
GOALS AND PLANS
Have any of the following been a problem for you
in reaching your academic goals?
Not a
Problem
Minor
Problem
Moderate
Problem
Major
Problem
No
Response
Quality of high school preparation 49.0% 25.2% 15.8% 7.7% 2.4%
Study Skills 47.3% 26.7% 14.9% 8.7% 2.3%
Language difficulties 81.3% 7.8% 4.4% 3.9% 2.6%
Too much expected by instructor 52.7% 30.0% 11.3% 3.2% 2.8%
Financial factors 24.0% 22.1% 26.1% 25.5% 2.3%
Job obligations 35.8% 24.7% 21.9% 15.1% 2.6%
Family obligations 43.3% 25.2% 17.3% 11.6% 2.5%
Uncertainty about personal/career goals 46.5% 25.7% 16.5% 8.7% 2.6%
Motivation to study 63.7% 21.4% 7.7% 4.5% 2.7%
Other personal problems 52.8% 24.3% 12.7% 7.7% 2.5%
Cannot get classes I need 42.6% 22.8% 17.5% 14.6% 2.5%
Table 1.c
More than half (56.4%) intend to receive an associates degree and transfer to a 4‐year
university.
A majority (94.5%) find a great deal of personal meaning in their college attendance.
Eighty‐seven percent say that going to college is highly valued by family and 69% claim
that family would be disappointed if they did not attend college.
Financial factors, job obligations, followed by not able to get the classes needed are
the top three hindrances to achieving academic goals.
10 Table of Contents

LOS ANGELES HARBOR COLLEGE FALL 2009 STUDENT SURVEY RESULTS
STUDENT DEMOGRAPHY AND BACKGROUND
The table below shows demographic comparison of those who responded to the
survey and the fall 2009 student population.
The age groups of the 25‐34 and 35 and over were slightly under represented.
Conversely, the less than 20 and 20‐24 groups were slightly over represented. Thus
affecting the average age of respondents of 24.8 years old compared to the college
population of 26.2 years old.
Similar to the college‐wide population, Hispanics comprised the majority (48.9%) of
respondents, followed by Asian (19.3%), White (18.0%), and African American (13.9%). Note
that only these four ethnic categories are listed. Unknown and Decline to State categories
were excluded.
Almost 59% percent of respondents were female and 41% were male, while the
entire student body comprised of 61% females and 39% males.
Student Survey
Respondents
Fall 2009 Student
Population
AGE Under 20 36.1% 31.6%
20‐24 34.9% 32.1%
25‐34 16.4% 19.8%
35 and over 16.4% 19.8%
Average Age 24.8 26.2
ETHNICITY African American 13.9% 15.6%
Asian 19.3% 18.8%
Hispanic 48.9% 46.5%
White 18.0% 19.1%
GENDER Famale 58.8% 60.8%
Male 41.2% 39.2%
Table 2.a
11 Table of Contents

LOS ANGELES HARBOR COLLEGE FALL 2009 STUDENT SURVEY RESULTS
STUDENT DEMOGRAPHY AND BACKGROUND
Fifty‐four percent of respondents were continuing students and another 18% were first
time students.
Most (82.5%) of those surveyed claimed English as their primary language; Spanish as
second (10.5%), and Filipino (2.9%) as the third primary language.
STATUS
Student Survey
Percent
Concurrent High School Student 3.3%
First Time Student 18.0%
Former Concurrent Student This College 3.1%
Former Concurrent Student Another College 0.8%
New Transfer 9.9%
Continuing Student 53.5%
Returning Student 11.3%
LANGUAGE
Student Survey
Percent
Fall 2009 Student
Population Percent
English 82.5% 82.9%
Spanish 10.5% 10.4%
Filipino 2.9% 2.2%
Other 1.9% 1.9%
Japanese 0.2% 0.4%
Korean 1.1% 1.0%
Farsi 0.3% 0.3%
Chinese 0.3% 0.5%
Vietnamese 0.2% 0.2%
Armenian 0.1% 0.2%
Table 2.b
Table 2.c
12 Table of Contents

LOS ANGELES HARBOR COLLEGE FALL 2009 STUDENT SURVEY RESULTS
STUDENT DEMOGRAPHY AND BACKGROUND
Thirty‐one percent are first generation residents of the U.S.
More than 40% of respondents’ parents have had no college experience (42.7%
Fathers and 46.7% of Mothers).
Thirty‐two percent are first generation college students.
Twelve percent are be single parents.
Table 2.d
Table 2.e
Highest education level Father Mother Sibling
Elementary school or less (grades 1‐6) 9.0% 8.3% 2.0%
Middle School (grades 7‐8) 6.1% 6.2% 5.0%
Some high school/secondary school,
did not graduate12.8% 11.5% 8.6%
High School/Secondary School graduate 18.8% 16.8% 14.0%
Some college, no degree 13.7% 17.3% 17.2%
Two‐year college degree 7.5% 9.9% 8.5%
Four‐year college degree 10.7% 13.0% 14.4%
Advanced degree 9.1% 7.6% 9.2%
No response 12.3% 9.4% 21.1%
Time I have lived in US
Student
Survey
Percent
Less than five years 3.7%
Between five and ten years 7.0%
More than ten years, not born here 12.0%
Born here, but parents were not 30.8%
At least one parent born here,
grandparents not17.3%
All grandparents born here 28.1%
No response 1.2%
13 Table of Contents

LOS ANGELES HARBOR COLLEGE FALL 2009 STUDENT SURVEY RESULTS
STUDENT DEMOGRAPHY AND BACKGROUND
Marital Status
Student Survey
Percent
Single 85.4%
Married or
domestic partner 14.0%
No response 0.6%
Do you have dependent
children?
Student Survey
Percent
No 80.5%
Yes, 5 years old or younger 10.6%
Yes, 6‐18 years old 9.2%
Yes, over 18 years old 2.6%
Table 2.f
Table 2.g
Table 2.h
Marital Status: Single
5 years old or younger 150
6-18 years old 120
Over 18 years old 30
Total 300
Total All Respondents 2,578
Single Parent: 11.6%
14 Table of Contents

LOS ANGELES HARBOR COLLEGE FALL 2009 STUDENT SURVEY RESULTS
STUDENT DEMOGRAPHY AND BACKGROUND
If you have a disability, have you
informed the Disabled Students Office?
Student
Survey
Percent
Yes 5.4%
No 7.4%
No disability 81.5%
No response 5.6%
If you have a disability, please indicate
your disability.
Student
Survey
Percent
No disability 85.6%
Mobility impaired 0.7%
Visually impaired 0.6%
Hearing impaired 0.6%
Speech/language impaired 0.6%
Attention deficit disorder 2.3%
Acquired brain injury 0.4%
Learning disability 3.9%
Psychological disability 1.9%
Other disability 3.5%
Table 2.i
Table 2.j
15 Table of Contents

LOS ANGELES HARBOR COLLEGE FALL 2009 STUDENT SURVEY RESULTS
FINANCIAL RESOURCES
Table 3.a
Table 3.b
How many hours per week do you currently work?
Student
Survey
Percent
Forty hours or more 10.6%
20‐39 hours 23.8%
10‐19 hours 13.8%
Less than 10 hours 7.2%
I Don't work 43.7%
No response 0.9%
Have your hours changed over the past year?
Student
Survey
Percent
Was employed, now unemployed 19.6%
Decreased 20.7%
Increased 9.7%
No change 45.0%
No response 5.0%
16 Table of Contents

LOS ANGELES HARBOR COLLEGE FALL 2009 STUDENT SURVEY RESULTS
FINANCIAL RESOURCES
Although 33% are already receiving financial aid, 9.2% claim they are eligible but did not
apply and another 28.9% do not know if they are eligible to receive aid.
Forty‐four percent are not working, while another 44.8% are working part‐time (less
than 40 hours per week).
A little over 20% had their work hours decreased over the past year.
Another 19.6% lost their jobs in the past year.
Table 3.c
Table 3.d
Are you receiving money from any public assistance
program?
Student
Survey
Percent
Yes 9.0%
No 89.8%
No response 1.2%
Have you previously been in foster care?
Student
Survey
Percent
Yes 1.9%
No 96.8%
No Response 1.3%
17 Table of Contents

LOS ANGELES HARBOR COLLEGE FALL 2009 STUDENT SURVEY RESULTS
FINANCIAL RESOURCES
Table 3.e
Table 3.f
Are you eligible for financial aid?
Student
Survey
Percent
Yes, currently receiving aid 33.0%
Should be eligible but did not apply 9.2%
Eligible but not receiving aid for other reasons 6.9%
Not eligible, not taking enough units 1.2%
Not eligible, family income too high 12.4%
Not eligible, other reason 7.1%
Don't know if eligible 28.9%
No response 1.3%
If you applied, how did you learn about financial aid?
Student
Survey
Percent
Received information in class 5.0%
Received information from high school counselor 15.4%
Received information from college counselor 6.1%
Consulted college financial aid office first 7.7%
Other on‐campus information 3.1%
College website 3.0%
Government financial aid website 3.7%
Other website 0.7%
Other source of information 16.1%
No response 39.2%
18 Table of Contents

LOS ANGELES HARBOR COLLEGE FALL 2009 STUDENT SURVEY RESULTS
FINANCIAL RESOURCES
Twenty‐two percent receive financial aid information from either a high school (15.4%)
or college (6.1%) counselor.
Of those who did not apply for financial aid, 22% did not think they were qualified to re‐
ceive it.
The cost of text books seem to negatively affect students. Twenty percent take fewer
classes, 26.8% do not buy all the required books, and 34.3% do not purchase the text
books at the beginning of the term.
Table 3.g
If you did not apply for financial aid, why not?
Student
Survey
Percent
I did not think I would be eligible 22.0%
The application forms were too complicated 2.6%
I did not have the information about my family's income 2.7%
I did not want to reveal my family's income 0.2%
The money was not large enough to be worth the effort 1.0%
I don't like to receiving public assistance 1.3%
Other reason for not applying 16.7%
No response 53.4%
Are the costs of text books a problem for you?
Student
Survey
Percent
Yes, I take fewer courses as a result 20.0%
Yes, I don't buy all the required books 26.8%
Yes, I sometimes don't buy all of the required books at
the beginning of the term34.3%
No 25.8%
Table 3.h
19 Table of Contents

LOS ANGELES HARBOR COLLEGE FALL 2009 STUDENT SURVEY RESULTS
COUNSELING INFORMATION & SERVICES
I have not met with a counselor because…
Student
Survey
Percent
I'm taking ony a few individual courses and do not plan
to complete any program3.1%
I know what I need to take for my program 11.0%
I get program advice from my instructors 2.6%
It has never been convenient to meet with a counselor 13.1%
Seventy‐four percent claim to have met with a counselor. However, 47.9% do not have
a formal educational plan.
Of those who did not meet with a counselor, 13% claimed that it was never convenient
to meet with one.
Almost 60% met with a counselor within the past year.
Table 4.a
Table 4.b
Table 4.c
Have you ever met with a counselor?
Student
Survey
Percent
Yes 74.1%
No 25.3%
No response 0.7%
When did you last meet with a counselor?
Student
Survey
Percent
This semester 39.1%
Last semester 20.4%
Previous to last semester 18.5%
No response 22.0%
20 Table of Contents

LOS ANGELES HARBOR COLLEGE FALL 2009 STUDENT SURVEY RESULTS
COUNSELING INFORMATION & SERVICES
If you have met with a counselor, what was the primary
purpose of your most recent meeting?
Student
Survey
Percent
Approve study list only 6.6%
Prepare multi‐semester course plan 27.4%
Counseling for a personal problem 1.6%
Get information about transfer requirements 22.7%
Other reason 21.9%
No response 19.8%
Have you received counseling from any of the
following?
Student
Survey
Percent
EOP&S (Extended Opportunity Program & Services) 15.6%
International Students' director or counselor 4.3%
Disabled Students Programs and Services counselor 3.7%
Other special program 8.1%
An instructor 20.6%
Do you have a formal education plan designed for you
by a counselor and when was it done?
Student
Survey
Percent
Yes, created or updated in Summer/Fall 2009 22.2%
Yes, created or updated in Spring 2009 7.3%
Yes, created or updated in Summer/Fall 2008 3.9%
Yes, created or updated in Spring 2008 1.8%
Yes, created or updated prior to Spring 2008 4.8%
I do not have such plan 47.9%
No response 12.2%
Table 4.d
Table 4.e
Table 4.f
21 Table of Contents

LOS ANGELES HARBOR COLLEGE FALL 2009 STUDENT SURVEY RESULTS
COUNSELING INFORMATION & SERVICES
Was your last meeting with a counselor a "drop‐in" or
scheduled appointment?
Student
Survey
Percent
Drop‐in 41.1%
Scheduled 38.2%
No response 20.7%
Have you been able to follow the recommended list of
courses?
Student
Survey
Percent
Yes 55.0%
No, some of the courses have not been offered 11.8%
No, I have to complete some prerequisites first 11.8%
No, I have changed my mind about my program/goals 5.1%
No response 16.2%
Your opinion about your last meeting with a counselor:Strongly
AgreeAgree Disagree
Strongly
Disagree
No
Response
Getting to see a counselor for this meeting was easy 22.4% 39.3% 10.5% 6.7% 21.0%
There was enough time during this meeting for my
question or concern25.5% 38.4% 8.8% 4.4% 22.9%
I was satisfied with the outcome of the visit 26.0% 37.5% 8.6% 5.3% 22.6%
Table 4.g
Table 4.h
Table 4.i
Table 4.j
Satisfaction with Last Meeting with Counselor. Drop‐in Scheduled
Getting to see a counselor for this meeting was easy 31% 29%
There was enough time during this meeting for my question or concern 31% 31%
I was satisfied with the outcome of the visit 30% 32%
22 Table of Contents

LOS ANGELES HARBOR COLLEGE FALL 2009 STUDENT SURVEY RESULTS
COUNSELING INFORMATION & SERVICES
A good way to obtain counseling information (e.g.,
regarding courses to take or career or transfer
information) would be…
Strongly
AgreeAgree Disagree
Strongly
Disagree
No
Response
A one‐on‐one meeting with a counselor 71.5% 24.5% 1.0% 0.8% 2.1%
A group session or workshop 11.5% 46.0% 26.6% 9.4% 6.5%
A web site 12.9% 40.4% 28.6% 11.2% 6.8%
A video chat with a counselor 7.0% 28.3% 40.0% 17.6% 7.2%
A phone conversation with a counselor 10.0% 41.9% 29.2% 12.1% 6.8%
An e‐mail exchange with a counselor 11.9% 42.1% 26.7% 12.4% 6.8%
An online, interactive workshop with a counselor and
other students9.2% 31.1% 35.5% 17.1% 7.0%
In my opinion, it would be most helpful for a student to
meet with a counselor…
Strongly
AgreeAgree Disagree
Strongly
Disagree
No
Response
When first enrolling college 80.7% 16.3% 0.3% 0.4% 2.3%
When having academic problems with classes 60.8% 29.9% 2.8% 0.9% 5.5%
When planning to transfer 72.2% 20.8% 0.7% 0.7% 5.5%
When thinking about caerrer choice 63.1% 27.2% 3.6% 0.9% 5.1%
Other 33.6% 32.0% 4.5% 3.1% 26.8%
Table 4.k
Overall, students were satisfied with their most recent counseling appointment.
The level of satisfaction was about the same whether students met with a counselor
through drop‐in or by appointment.
Ninety‐six percent agree or strongly agree that one‐on‐one meeting with a counselor is
a good way to obtain information.
Table 4.l
23 Table of Contents
LOS ANGELES HARBOR COLLEGE FALL 2009 STUDENT SURVEY RESULTS
COLLEGE EXPERIENCES
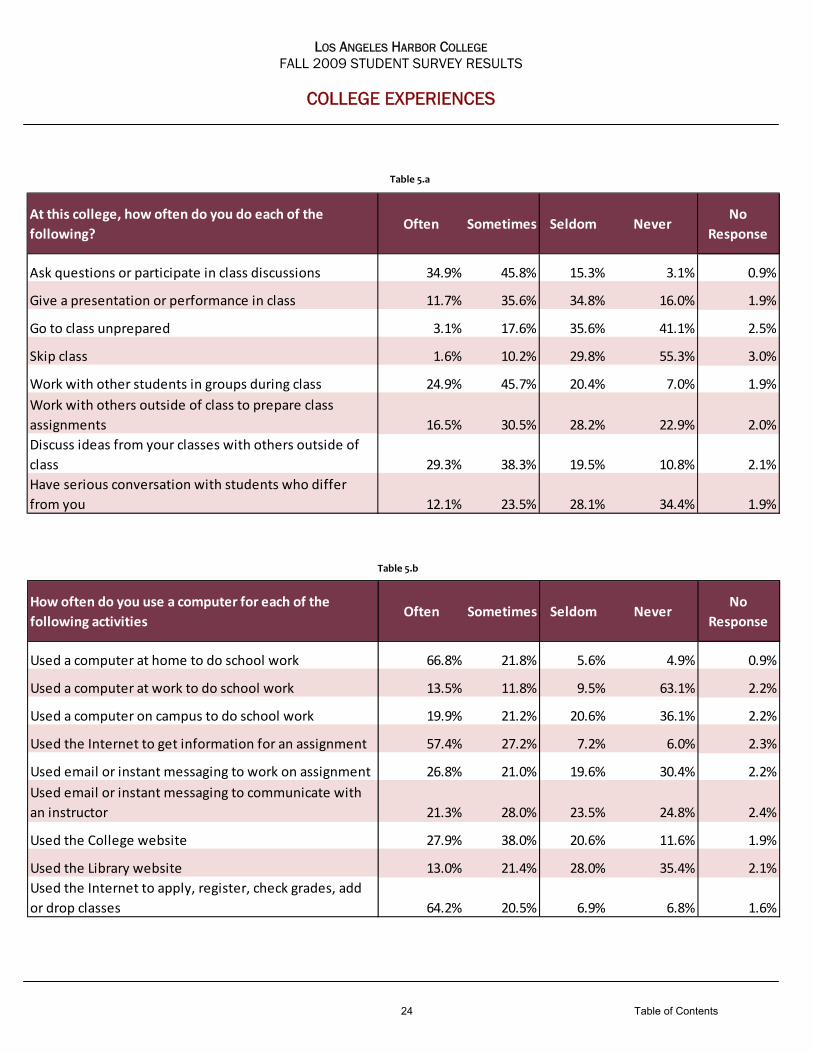
At this college, how often do you do each of the
following?Often Sometimes Seldom Never
No
Response
Ask questions or participate in class discussions 34.9% 45.8% 15.3% 3.1% 0.9%
Give a presentation or performance in class 11.7% 35.6% 34.8% 16.0% 1.9%
Go to class unprepared 3.1% 17.6% 35.6% 41.1% 2.5%
Skip class 1.6% 10.2% 29.8% 55.3% 3.0%
Work with other students in groups during class 24.9% 45.7% 20.4% 7.0% 1.9%
Work with others outside of class to prepare class
assignments 16.5% 30.5% 28.2% 22.9% 2.0%
Discuss ideas from your classes with others outside of
class 29.3% 38.3% 19.5% 10.8% 2.1%
Have serious conversation with students who differ
from you 12.1% 23.5% 28.1% 34.4% 1.9%
How often do you use a computer for each of the
following activitiesOften Sometimes Seldom Never
No
Response
Used a computer at home to do school work 66.8% 21.8% 5.6% 4.9% 0.9%
Used a computer at work to do school work 13.5% 11.8% 9.5% 63.1% 2.2%
Used a computer on campus to do school work 19.9% 21.2% 20.6% 36.1% 2.2%
Used the Internet to get information for an assignment 57.4% 27.2% 7.2% 6.0% 2.3%
Used email or instant messaging to work on assignment 26.8% 21.0% 19.6% 30.4% 2.2%
Used email or instant messaging to communicate with
an instructor 21.3% 28.0% 23.5% 24.8% 2.4%
Used the College website 27.9% 38.0% 20.6% 11.6% 1.9%
Used the Library website 13.0% 21.4% 28.0% 35.4% 2.1%
Used the Internet to apply, register, check grades, add
or drop classes 64.2% 20.5% 6.9% 6.8% 1.6%
Table 5.a
Table 5.b
24 Table of Contents

LOS ANGELES HARBOR COLLEGE FALL 2009 STUDENT SURVEY RESULTS
COLLEGE EXPERIENCES
During your attendance at this college have you
done any of the following?Yes No
No
Response
Participated in a community‐based or service
project as part of a class16.8% 82.4% 0.8%
Tutored or taught other students 14.9% 84.1% 1.0%
Attended a college sporting event, theater
production or musical performance26.3% 72.3% 1.4%
Attended a college club meeting 8.3% 89.6% 2.1%
Worked with instructors/college staff on activities
outside of class13.2% 85.5% 1.3%
How would you describe your interactions with
instructors?Often Sometimes Seldom Never
No
Response
I talk about educational/career plans with an
instructor10.9% 26.2% 29.3% 32.3% 1.4%
I discuss ideas with instructors outside of class 9.5% 21.6% 28.9% 38.2% 1.9%
I visit instructors during their office hours 6.6% 18.1% 31.1% 42.5% 1.8%
Table 5.c
Table 5.d
A majority (88.6%) often or sometimes used a computer at home to do school work,
while 56.7% seldom or never use a computer on campus for school work.
The Internet was widely used to get information on assignments (84.6%) and to apply,
register, check grades, add or drop classes (84.7%).
Conversely, the Library and College websites were not used as often. Sixty‐three
percent seldom or never use the Library site and 32.2% seldom or never use the College
site.
Less than 30% often or sometimes interact with their instructors by discussing career
plans, ideas outside of class, or visit during office hours.
A vast majority do not participate in activities outside the classroom such as community
service, attend college sporting events, and club meetings.
25 Table of Contents

LOS ANGELES HARBOR COLLEGE FALL 2009 STUDENT SURVEY RESULTS
COLLEGE EXPERIENCES
Table 5.e
Table 5.f
During the last regular week of school, how many
hours did you spend in each of the following
activities?
None 1 ‐ 5 6 ‐ 10 11 ‐ 20 21 ‐ 30 30 PlusNo
Response
Class preparation (studying, reading, writing,
rehearsing, doing homework)4.6% 41.2% 24.9% 15.4% 6.8% 6% 1.3%
Participation in college‐sponsored activities (clubs,
campus publications, student government,
intercollegiate or intramural sports, etc.)
78.9% 11.5% 3.4% 2.1% 1.0% 1% 2.0%
Family responsibilities 4.6% 20.3% 20.5% 19.3% 10.8% 22% 2.2%
Commuting (to school and/or work) 8.1% 49.5% 17.2% 10.2% 5.7% 7% 2.6%
Socializing, watching TV, other recreation 6.1% 39.5% 23.4% 15.0% 6.0% 8% 1.7%
How much have your experiences at this college
both in and out of class helped/improved your
ability to do the following?
Very
Much
Quite
a BitSome
Very
Little
No
Response
Acquire a broad general education 36.2% 36.4% 20.1% 5.7% 1.6%
Acquire job or work‐related knowledge and skills 22.7% 29.0% 28.6% 18.1% 1.7%
Write clearly and effectively 28.3% 36.8% 24.6% 8.1% 2.2%
Speak clearly and effectively 29.4% 35.8% 24.0% 9.0% 1.8%
Think critically and analytically 34.3% 38.3% 20.7% 4.8% 1.8%
Solve numberical problems 26.4% 31.7% 24.5% 14.8% 2.5%
Use computers and other information technology 29.1% 27.4% 25.2% 16.4% 2.0%
Work effectively with others 32.7% 33.5% 24.0% 8.2% 1.6%
Learn effectively on your own 35.5% 35.3% 21.6% 5.8% 1.8%
Understand yourself 36.4% 32.2% 20.7% 8.3% 2.4%
Understand people of other racial, cultural or
ethnic backgrounds34.4% 31.6% 22.0% 9.9% 2.1%
Develop a personal code of values and ethics 29.3% 30.3% 24.9% 13.2% 2.2%
Contribute to the welfare of your community 16.4% 21.9% 30.7% 28.9% 2.1%
Develop clearer career goals 33.5% 32.0% 21.8% 10.4% 2.4%
Get a job or advance your career 20.5% 21.7% 24.5% 31.0% 2.4%
Set educational goals and monitor your progress 34.4% 31.2% 22.0% 10.4% 2.0%
26 Table of Contents

LOS ANGELES HARBOR COLLEGE FALL 2009 STUDENT SURVEY RESULTS
COLLEGE EXPERIENCES
Table 5.g
Table 5.h
The top three areas where LAHC has helped students’ abilities are in acquiring a broad
general education (72.6%), thinking critically and analytically (72.6%), and learning
effectively on their own (70.8%).
Generally, respondents agree or strongly agree with the college’s education practices
(see Table 5.h).
Outside class/lab time, how many hous a week do
you spend on campus? (Include studying, work,
library, cultural and/or leisure activities.)
Student
Survey
Percent
None 33.7%
Three hours or less 30.1%
Three to six hours 17.0%
Six to nine hours 7.8%
Nine to twelve hours 4.5%
Twelve hours or more 5.6%
No response 1.3%
To what extent do you agree with the following
statements about education practices at this
college?
Strongly
AgreeAgree Disagree
Strongly
Disagree
Does Not
Apply
No
Response
Textbooks and reading materials are useful for the
courses42.1% 48.6% 6.0% 1.6% 0.7% 1.0%
Grading practices in the courses are fair 26.7% 62.7% 6.6% 1.2% 0.6% 2.2%
Tests cover the course material presented 29.4% 57.8% 6.9% 1.3% 1.0% 3.6%
The policies and penalties for cheating are
provided and are followed40.1% 48.9% 4.3% 1.0% 3.1% 2.6%
College publications clearly and adequately reflect
the college's policies and procedures (catalog,
schedule of classes, web site)
32.8% 55.2% 5.6% 1.5% 2.3% 2.6%
I received a course syllabus that describes the
course expectations, grading procedures and
learning outcomes the course should provide
54.0% 39.7% 2.8% 0.5% 0.7% 2.3%
Course syllabi are followed 44.7% 48.3% 3.4% 0.6% 0.9% 2.1%
I would encourage others to attend this college 45.7% 47.0% 3.7% 0.6% 1.0% 2.0%
27 Table of Contents

LOS ANGELES HARBOR COLLEGE FALL 2009 STUDENT SURVEY RESULTS
CAMPUS FACILITIES AND SERVICES
Campus Facilities and ServicesStrongly
AgreeAgree Disagree
Strongly
Disagree
Does Not
Apply
No
Response
I feel safe and secure on this campus 31.4% 58.5% 6.8% 1.9% 0.8% 0.5%
Campus buildings are clean and well maintained 29.6% 55.5% 10.1% 2.6% 0.9% 1.3%
Food service on this campus is sufficient 16.0% 43.2% 14.6% 6.9% 16.8% 2.5%
The restrooms on this campus are clean and well
maintained21.7% 52.8% 14.8% 6.2% 2.5% 1.9%
The grounds and public areas on this campus are
clean and well maintained26.3% 60.4% 8.2% 2.4% 1.1% 1.6%
The campus is free of safety hazards 24.1% 56.2% 11.4% 3.0% 2.1% 3.2%
The campus has adequate outside lighting after
dark17.8% 42.3% 18.5% 7.0% 12.4% 2.1%
Sufficient parking is available on campus 14.2% 34.4% 24.3% 19.7% 5.2% 2.3%
The parking lots are safe, well lighted, and well
maintained15.8% 45.0% 20.7% 8.4% 7.8% 2.4%
The college has made a good effort to reduce the
impact of construction on students19.1% 49.5% 17.4% 9.7% 3.0% 1.2%
Table 6.a
Almost 90% agree or strongly agree about feeling safe and secure on campus.
Despite the construction, 80% feel that the campus is free of safety hazards. While 68.6% state that the college has made good efforts to reduce the impact of construction.
Students are divided in their response to adequate parking on campus. Forty‐nine percent agree or strongly agree that that there is sufficient parking on campus, while 44% disagree or strong disagree.
Lighting seems to be an issue with most of the respondents. Twenty‐nine percent find the parking lot with inadequate lighting and 26% claim not enough outside lighting after dark.
28 Table of Contents

LOS ANGELES HARBOR COLLEGE FALL 2009 STUDENT SURVEY RESULTS
COMMENTS
Describe the one or two things you like BEST about this college:
Over 2,800 different comments were received and then categorized in the following topics:
The top three areas students like most about Harbor College are the faculty and staff (26.8%), buildings and facilities (15.4%), and location (12.2%).
FACULTY AND STAFF
BUILDINGS AND FACILITIES
LOCATION
Academics Diversity Parking
Buildings/Facilities Faculty/Staff Personal Reasons
Campus Size Food Schedule of Classes
Class Size General Security
Construction Sports Student Services
Cost Good Environment Technology
Course Offerings Lighting
Course Time of Day Location
I love my instructors, they seem to enjoy their job, and I'm always learning.
The instructors are very helpful and are always open to your ideals and concerns.
The teachers are very informative and are willing to help you when you ask.
The staff at this college are very helpful. Great teachers who care about you
personally not just academically. Teachers and staff are great and very
friendly!!! The staff are very knowledgeable.
I absolutely adore the new buildings. The remodeling made it a better
environment. The building maintenance.
The new technology building and the equipment that is available to me.
Buildings and the technology used to help the environment go green.
Easy access by bus. Easy commute.
It’s right off the freeway. Campus is close to home.
29 Table of Contents

LOS ANGELES HARBOR COLLEGE FALL 2009 STUDENT SURVEY RESULTS
COMMENTS
Describe the one or two things you like BEST about this college:
OTHER COMMENTS
This college has a good nursing program.
PACE program.
The architecture program here is great.
I love the child development center, the staff are amazing!
The culinary arts program.
The music program.
Harbor college allows high school students to take college classes on its campus.
The class discussions are great, especially in Political Science 1 and English 101.
My oceanography class.
It is not too big or overcrowded.
It is small and not intimidating.
I like the fact that the class sizes are relatively small and that it is rather easy to approach and speak with my professors.
I can get my general education for less money.
It's cheaper than being at a university.
The expenses aren't that high compared to other community colleges.
The way class times are scheduled.
Classes are always available.
I got into all the classes I needed and all my professors are knowledgeable and very nice.
The college offers the fire‐tech courses I need.
Classes in the weekend.
Online classes.
Classes given on Saturday.
I was introduced to diversity and to accept and embrace differences.
I like to see students from many countries.
Awesome pizza in the lounge.
The breakfast in the Café.
Healthy snacks and beverages at student bookstore.
Students are friendly.
People seem serious about learning.
I like how people hang out and socialize on campus.
Most students are open minded and are easy to talk to.
Good sense of community
Peaceful and safe environment.
I rarely have parking issues.
The parking and the campus feels safe at night.
The solar panels being installed, very green and supply shade for parking.
And the variety of classes that are available.
The classes fit my schedule.
They offer the classes I need at a perfect time.
I feel safe and secure at this campus.
I like the career center.
The library is very helpful.
Many resources for new students.
I like the life skills center.
Easy/ simple to sign up for classes.
The tutoring service.
The availability of Student Services and offices.
In addition, students like the diversity, the small campus size, and the friendly and
helpful environment that Harbor offers.
30 Table of Contents

LOS ANGELES HARBOR COLLEGE FALL 2009 STUDENT SURVEY RESULTS
COMMENTS
Describe the one or two things you like LEAST about this college:
A little over 2,200 comments were collected and categorized. The top three areas of concern were parking and traffic (22.6%), buildings and facilities (14.1%), and course offering (10.9%).
PARKING AND TRAFFIC
BUILDINGS AND FACILITIES
COURSE OFFERING
Other complaints were about the high cost of textbooks, the loss of summer and winter sessions, minimal activities and clubs on campus, lighting throughout the campus especially in the parking lots, and insufficient security patrolling at night.
Traffic congestions is a real big problem. Better traffic control. We need more parking and/or easy safe
cross walks from the park to the school.
Have more parking tickets dispenser available around campus.
The campus could use more parking.
More shade by the NEA building during summer.
The science building and equipment for science majors need to be updated.
I would like a water fountain to be put in place by the cafeteria.
Cleaner bathrooms in the older buildings. Have a bigger and better library, so students
would feel more comfortable studying there. More places for someone to study. More lounge.
Have more room for students, like opening more classes when a course is full already.
Bring back winter and summer sessions. More classes: I couldn't get a math class
this semester because it was full. I would like more language and cultural
classes.
More internet courses, more computer science courses.
Wider selection of classes and class times available.
More classes offered in the evening and weekend
More courses offered at the PACE program. I would like to see more night classes.
31 Table of Contents

LOS ANGELES HARBOR COLLEGE FALL 2009 STUDENT SURVEY RESULTS
COMMENTS
Describe the one or two things you like LEAST about this college:
OTHER COMMENTS
I would also like the bookstore to open later.
The math labs and learning center to be open a little later for the students.
Prolong library hours.
Resourced information/ bulletins/ announcement.
Business offices open longer.
The computer lab should expand.
Services for day students extended to evening classes, evening classes are excluded from a lot of services and we work during the day and penalized for it.
The number of activities like fairs, festivals guest, etc that need to be implemented on this campus.
More students/teachers activities.
I would like to see more college events such as drama, music career workshops.
I would like to have an animal career option in this college .
I would like to see a physical education program in this college.
Should have more performing arts programs.
More class activities.
More certified certificate programs.
More programs of educational enrollment.
More programs.
I would like to see more art and architectural design classes on campus.
Culinary arts program increase.
The culinary program to continue to grow and advance.
More vocational training.
Higher academic standards.
I would just like a greater diversity of performing art classes i.e more dance and singing classes.
More classes in the medical field like x‐ray tech, ultrasound and respiratory programs.
Less students in one class.
Seating in the classrooms.
Too much construction going on.
The prices of the books here is too high.
More books ordered at once…having a bigger supply.
Counselors to be more available.
It would be nice to have more tutors in the math lab.
More counselors because making an appointment take two months.
Financial aid and counseling should have longer hours all week.
The hours of operation for the bookstore.
Better lunch meals.
I'd like the cafeteria to serve more healthy food.
More variety of food in the student store.
Cafeteria with hot food for evening classes.
I would change the fact that there isn't much information given to us the students.
Printers in classes, internet access w/computers.
Need more ashtrays.
More info to students about events.
I would want the campus to be lit during night classes.
More lighting throughout campus.
Some of the classes on the schedules were not correct.
Email alerts on classes that are cancelled.
More classes spread at more times.
I wish that I felt safer walking all the way to my car by myself at night.
Don’t feel safe walking to class after night classes.
More outreach activities for career preparation.
More events to participate in.
Would like to see more group clubs out in the open.
More clubs for all departments of education.
More activities on campus.
The number of activities like fairs, festivals guest, etc that need to be implemented on this campus.
Information availability.
A clearer understanding of what needs to be taken at harbor college to transfer to other colleges.
Less time waiting for services.
More offices open on Fridays.
More computers that work.
More computers in the computer lab.
32 Table of Contents

Supplemental
Questions
33 Table of Contents

LOS ANGELES HARBOR COLLEGE FALL 2009 STUDENT SURVEY RESULTS
SUPPLEMENTAL QUESTIONS
In addition to the LACCD Student Survey, Harbor College also asked students to rate the
services offered on campus. Frequency of visit, availability of and satisfaction with the
services were asked. More than 2,500 students responded to the supplemental
questionnaire and their responses are reflected in the next few pages.
34 Table of Contents

LOS ANGELES HARBOR COLLEGE FALL 2009 STUDENT SURVEY RESULTS
SUPPLEMENTAL QUESTIONS
70.5%
10.9%
8.3%
35.7%
34.0%
7.6%
50.2%
7.4%
20.4%
26.7%
17.5%
12.5%
12.5%
11.7%
15.7%
9.4%
6.2%
15.3%
22.3%
13.9%
13.7%
15.8%
11.0%
12.1%
3.0%
47.2%
51.9%
38.0%
39.8%
64.9%
23.1%
71.2%
0.0% 20.0% 40.0% 60.0% 80.0% 100.0%
Bookstore
Bus Ofc
Career/Trans Cntr
Comp Labs
Food Svcs
Health Cntr
Library
Life Skills Cntr
Frequency of Use of Services
Never Once Ever Once a Semester MultipleTimes
The Life Skills Center offers mental health services such as crisis intervention and
student success workshops. It is interesting, however, that only 28.9% claim to have
used their services. Among the services listed, the Life Skills Center is the one that is
used the least, followed by the Health Center and the Career and Transfer Center.
Table 7.a
35 Table of Contents

LOS ANGELES HARBOR COLLEGE FALL 2009 STUDENT SURVEY RESULTS
SUPPLEMENTAL QUESTIONS
75.2%
41.4%
38.9%
50.1%
49.3%
38.9%
65.0%
33.0%
20.9%
20.0%
20.2%
21.8%
18.8%
15.8%
17.0%
14.8%
1.9%
2.4%
2.7%
1.7%
4.0%
2.1%
1.5%
1.9%
1.9%
36.2%
38.2%
26.5%
27.9%
43.1%
16.5%
50.2%
0.0% 20.0% 40.0% 60.0% 80.0% 100.0%
Bookstore
Bus Ofc
Career/Trans Cntr
Comp Labs
Food Svcs
Health Cntr
Library
Life Skills Cntr
Availability of Services
Not Applicable Not Available Usually Available
The Bookstore and the Library were the services most available to our students,
75.2% and 65.0% respectively. The remaining centers were also rated quite highly.
Table 7.b
36 Table of Contents

LOS ANGELES HARBOR COLLEGE FALL 2009 STUDENT SURVEY RESULTS
SUPPLEMENTAL QUESTIONS
44.0%
20.6%
20.7%
29.9%
25.0%
21.0%
40.3%
17.0%
46.1%
34.7%
32.0%
35.9%
32.6%
27.0%
37.1%
24.1%
7.3%
3.5%
3.6%
3.5%
9.9%
2.0%
3.2%
2.2%
2.6%
41.2%
43.7%
30.7%
32.5%
50.0%
19.4%
56.7%
0.0% 20.0% 40.0% 60.0% 80.0% 100.0%
Bookstore
Bus Ofc
Career/Trans Cntr
Comp Labs
Food Svcs
Health Cntr
Library
Life Skills Cntr
Satisfaction with Services
Not Applicable Dissatisfied Satisfied Very Satisfied
Except for food services offered on campus, most students were satisfied or very
satisfied with campus services. Almost 10% said they were dissatisfied with this the
food service.
Table 7.c
37 Table of Contents

Online Student
Responses
38 Table of Contents

LOS ANGELES HARBOR COLLEGE FALL 2009 STUDENT SURVEY RESULTS
ONLINE SURVEY
In the past, the LACCD Student Survey only included traditional students. Recently,
however, Harbor has recognized the importance of including the online student population
as enrollment in this type of instruction continues to climb.
So for the first time in the history of this survey, Harbor College extended the
questionnaire to its online students. We heard from 158 students. The response rate was
13%.
Dial‐up0.6%
DSL57.6%
Cable36.2%
Other3.1%
None2.5%
Chart 2.
What type of Internet access do you have at home?
A majority (82.2%) of students access their online class at home. The rest through work,
school, or by other means.
Ninety‐six percent are accessing using DSL or cable. While 1% still use dial‐up
connection.
Regarding their academic future, 28.8% intend to obtain a Bachelor’s Degree, 20.9% a
Master’s Degree, and another 9.2% intend to obtain a professional degree.
Similar to traditional students, online students are primarily taking courses at Harbor
College in order to obtain an Associate’s Degree and prepare to transfer to a four‐year
university(47.2%).
Home82.2%
Work8.0%
School8.6%
Other1.2%
Chart 1.
Where do you primarily access your online class?
39 Table of Contents

LOS ANGELES HARBOR COLLEGE FALL 2009 STUDENT SURVEY RESULTS
ONLINE SURVEY - GOALS AND PLANS
Table 8.a
Table 8.b
What is the highest degree or certificate that you
ever intend to obtain?
Online
Student
Survey
Percent
High School diploma or GED 6.1%
Certificate in a vocational program 2.5%
Associate Degree 10.4%
Bachelor's Degree 28.8%
Master's Degree 20.9%
Professional Degree (MD, Law, etc.) 9.2%
Not seeking a degree/certificate or already have
one2.5%
Undecided 4.3%
No response 15.3%
What is your objective at this college?
Online
Student
Survey
Percent
High school diploma or GED 0.0%
Certificate in a vocational program 3.7%
Associate degree and preparation for transfer to a
4‐year college47.2%
Associate degree only 8.0%
Transfer preparation only 19.6%
Not seeking a degree/certificate or already have
one2.5%
Undecided 3.7%
No response 15.3%
40 Table of Contents

LOS ANGELES HARBOR COLLEGE FALL 2009 STUDENT SURVEY RESULTS
ONLINE SURVEY - GOALS AND PLANS
How do you feel about attending college?Strongly
AgreeAgree Disagree
Strongly
DisagreeNo Response
Being a college student has a great deal of
personal meaning to me 60.7% 18.4% 1.2% 4.3% 15.3%
Being enrolled in college has made me happy 48.5% 31.9% 1.2% 2.5% 16.0%
In my family, going to college is highly valued 49.1% 25.2% 6.7% 3.7% 15.3%
My family would be disappointed if I didn't go to
college 29.4% 19.0% 29.4% 6.7% 15.3%
Would not go to college if another way to achieve
goals 4.9% 12.9% 42.9% 22.1% 17.2%
Would not have enrolled in college if had a better
alternative 7.4% 11.7% 39.9% 24.5% 16.6%
Table 8.c
Have any of the following been a problem for you
in reaching your academic goals?
Not a
Problem
Minor
Problem
Moderate
Problem
Major
ProblemNo Response
Quality of high school preparation 39.9% 17.8% 14.1% 9.8% 18.4%
Study Skills 46.0% 19.6% 9.8% 5.5% 19.0%
Language difficulties 71.8% 4.3% 2.5% 3.1% 18.4%
Too much expected by instructor 54.6% 16.0% 10.4% 0.0% 19.0%
Financial factors 18.4% 16.6% 24.5% 22.1% 18.4%
Job obligations 22.7% 20.2% 23.3% 16.6% 17.2%
Family obligations 26.4% 22.7% 17.8% 16.0% 17.2%
Uncertainty about personal/career goals 41.1% 18.4% 13.5% 9.2% 17.8%
Motivation to study 57.7% 16.6% 7.4% 1.2% 17.2%
Other personal problems 39.9% 21.5% 15.3% 3.1% 20.2%
Cannot get classes I need 20.9% 23.9% 14.7% 22.7% 17.8%
Table 8.d
41 Table of Contents

LOS ANGELES HARBOR COLLEGE FALL 2009 STUDENT SURVEY RESULTS
ONLINE SURVEY - STUDENT DEMOGRAPHY AND BACKGROUND
Financial factors, job obligations, and not being able to get the classes they need
are the top three reasons online students are unable to reach their academic
goals.
College enrollment gives personal meaning and happiness to a majority of online
students.
Demography of online students:
The average age is 32.3 years old while the average on‐campus student is 26.2
years old.
Seventy‐six percent of respondents were females.
Online Student
Survey
Respondents
Fall 2009 Student
Population
AGE Under 20 13.3% 31.6%
20‐24 22.2% 32.1%
25‐34 29.1% 19.8%
35 and over 35.4% 19.8%
Average Age 32.3 26.2
ETHNICITY African Amercian 10.1% 15.6%
Asian 17.7% 18.8%
Hispanic 35.4% 46.5%
White 13.9% 19.1%
GENDER Famale 75.9% 60.8%
Male 24.1% 39.2%
Table 9.a
42 Table of Contents

LOS ANGELES HARBOR COLLEGE FALL 2009 STUDENT SURVEY RESULTS
ONLINE SURVEY - STUDENT DEMOGRAPHY AND BACKGROUND
TIME IN UNITED STATES
Online
Student
Survey
Percent
Less than five years 1.2%
Between five and ten years 5.5%
More than ten years, not born here 17.2%
Born here, but parents were not 18.4%
At least one parent born here, grandparents not 11.7%
All grandparents born here 24.5%
No response 21.5%
Table 9.a
Table 9.b
Highest education level Father Mother Sibling
Elementary school or less (grades 1‐6) 9.8% 8.0% 1.2%
Middle School (grades 7‐8) 5.5% 6.1% 0.0%
Some high school/secondary school, did not
graduate6.1% 10.4% 10.4%
High School/Secondary School graduate 15.3% 22.1% 16.0%
Some college, no degree 14.1% 17.2% 16.0%
Two‐year college degree 7.4% 6.1% 6.1%
Four‐year college degree 9.8% 5.5% 14.1%
Advanced degree 8.0% 3.7% 8.0%
No response 23.9% 20.9% 28.2%
43 Table of Contents

LOS ANGELES HARBOR COLLEGE FALL 2009 STUDENT SURVEY RESULTS
ONLINE SURVEY - STUDENT DEMOGRAPHY AND BACKGROUND
Eighteen percent of online students are first generation U.S. residents
Almost 29% are first generation college students.
More than half (52.1%) are single.
Sixteen percent are single parents.
Marital StatusOnline Student
Survey Percent
Single 52.1%
Married or domestic partner 28.2%
No response 19.6%
Do you have dependent
children?
Online Student
Survey Percent
No 44.2%
Yes, 5 years old or younger 15.3%
Yes, 6‐18 years old 18.4%
Yes, over 18 years old 8.6%
Table 9.c
Table 9.d
44 Table of Contents

LOS ANGELES HARBOR COLLEGE FALL 2009 STUDENT SURVEY RESULTS
ONLINE SURVEY - STUDENT DEMOGRAPHY AND BACKGROUND
Table 9.e
If you have a disability, have you informed the
Disabled Students Office?
Online
Student
Survey
Percent
Yes 8.6%
No 4.3%
No disability 59.5%
No response 27.6%
Table 9.f
Of the small percentage who claim to have a disability, psychological followed by
other types of disabilities are the top two.
If you have a disability, please indicate your
disability.
Online
Student
Survey
Percent
No disability 52.1%
Mobility impaired 1.8%
Visually impaired 1.2%
Hearing impaired 1.2%
Speech/language impaired 0.0%
Attention deficit disorder 1.8%
Acquired brain injury 0.6%
Learning disability 1.8%
Psychological disability 2.5%
Other disability 4.9%
45 Table of Contents
LOS ANGELES HARBOR COLLEGE FALL 2009 STUDENT SURVEY RESULTS
ONLINE SURVEY - FINANCIAL RESOURCES
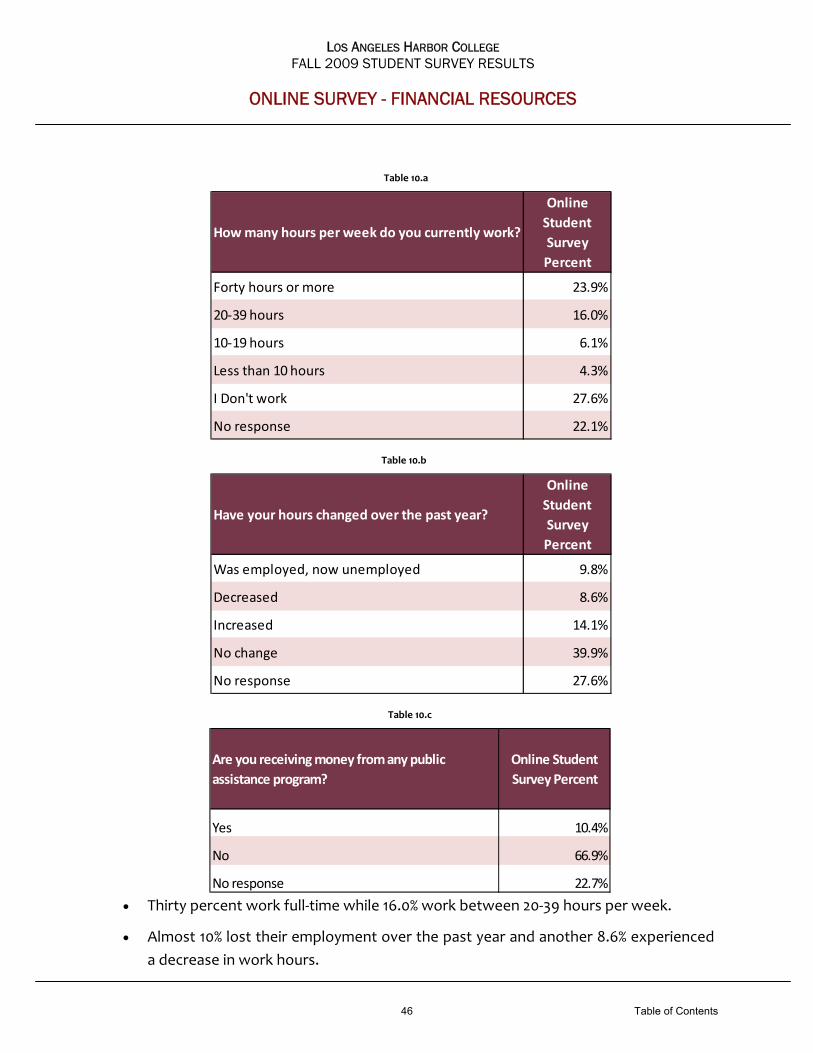
How many hours per week do you currently work?
Online
Student
Survey
Percent
Forty hours or more 23.9%
20‐39 hours 16.0%
10‐19 hours 6.1%
Less than 10 hours 4.3%
I Don't work 27.6%
No response 22.1%
Have your hours changed over the past year?
Online
Student
Survey
Percent
Was employed, now unemployed 9.8%
Decreased 8.6%
Increased 14.1%
No change 39.9%
No response 27.6%
Table 10.a
Table 10.b
Thirty percent work full‐time while 16.0% work between 20‐39 hours per week.
Almost 10% lost their employment over the past year and another 8.6% experienced
a decrease in work hours.
Are you receiving money from any public
assistance program?
Online Student
Survey Percent
Yes 10.4%
No 66.9%
No response 22.7%
Table 10.c
46 Table of Contents

LOS ANGELES HARBOR COLLEGE FALL 2009 STUDENT SURVEY RESULTS
ONLINE SURVEY - FINANCIAL RESOURCES
Table 10.d
Have you previously been in foster care?
Online
Student
Survey
Percent
Yes 0.6%
No 76.7%
No Response 22.7%
Almost 17% do not know if they are eligible for financial aid. Of that group, 14.7% did
not think they were eligible and another 12.3% had other reasons for not applying.
Table 10.e
Are you eligible for financial aid?
Online
Student
Survey
Percent
Yes, currently receiving aid 28.8%
Should be eligible but did not apply 1.8%
Eligible but not receiving aid for other reasons 2.5%
Not eligible, not taking enough units 2.5%
Not eligible, family income too high 17.2%
Not eligible, other reason 8.6%
Don't know if eligible 16.6%
No response 22.1%
47 Table of Contents

LOS ANGELES HARBOR COLLEGE FALL 2009 STUDENT SURVEY RESULTS
ONLINE SURVEY - FINANCIAL RESOURCES
Table 10.f
Table 10.g
If you applied, how did you learn about financial
aid?
Online
Student
Survey
Percent
Received information in class 1.8%
Received information from high school counselor 6.7%
Received information from college counselor 4.3%
Consulted college financial aid office first 8.6%
Other on‐campus information 3.7%
College website 4.9%
Government financial aid website 5.5%
Other website 2.5%
Other source of information 10.4%
No response 51.5%
If you did not apply for financial aid, why not?
Online
Student
Survey
Percent
I did not think I would be eligible 14.7%
The application forms were too complicated 1.2%
I did not have the information about my family's
income0.6%
I did not want to reveal my family's income 0.0%
The money was not large enough to be worth the
effort1.2%
I don't like to receiving public assistance 1.8%
Other reason for not applying 12.3%
No response 68.1%
48 Table of Contents

LOS ANGELES HARBOR COLLEGE FALL 2009 STUDENT SURVEY RESULTS
ONLINE SURVEY - FINANCIAL RESOURCES
Table 10.h
Are the costs of text books a problem for you?
Online
Student
Survey
Percent
Yes, I take fewer courses as a result 18.4%
Yes, I don't buy all the required books 19.6%
Yes, I sometimes don't buy all of the required
books at the beginning of the term30.7%
No 22.1%
The cost of textbooks affect almost 69% of online students. Thirty‐one percent do
not purchase all the required books at the beginning of the semester; 20% do not
purchase some of the required textbooks, and another 18% take fewer courses as a
result.
49 Table of Contents

LOS ANGELES HARBOR COLLEGE FALL 2009 STUDENT SURVEY RESULTS
ONLINE SURVEY - COUNSELING INFORMATION & SERVICES
Table 11.a
Have you ever met with a counselor?Online Student
Survey Percent
Yes 58.1%
No 14.4%
No response 27.5%
I have not met with a counselor because…Online Student
Survey Percent
I'm taking ony a few individual courses and do not
plan to complete any program2.5%
I know what I need to take for my program 6.1%
I get program advice from my instructors 0.0%
It has never been convenient to meet with a
counselor9.8%
Table 11.b
Table 11.c
When did you last meet with a counselor?Online Student
Survey Percent
This semester 20.9%
Last semester 17.8%
Previous to last semester 20.2%
No response 41.1%
Over half (58.1%) have met with a counselor.
Almost 59% have seen a counselor within the past year.
50 Table of Contents

LOS ANGELES HARBOR COLLEGE FALL 2009 STUDENT SURVEY RESULTS
ONLINE SURVEY - COUNSELING INFORMATION & SERVICES
Table 11.d
Table 11.e
Table 11.f
If you have met with a counselor, what was the
primary purpose of your most recent meeting?
Online Student
Survey Percent
Approve study list only 4.9%
Prepare multi‐semester course plan 14.1%
Counseling for a personal problem 1.2%
Get information about transfer requirements 27.0%
Other reason 12.3%
No response 40.5%
Have you received counseling from any of the
following?
Online Student
Survey Percent
EOP&S (Extended Opportunity Program &
Services)8.0%
International Students' director or counselor 1.2%
Disabled Students Programs and Services
counselor6.1%
Other special program 4.9%
An instructor 8.6%
Do you have a formal education plan designed for
you by a counselor and when was it done?
Online Student
Survey Percent
Yes, created or updated in Summer/Fall 2009 14.1%
Yes, created or updated in Spring 2009 7.4%
Yes, created or updated in Summer/Fall 2008 1.8%
Yes, created or updated in Spring 2008 2.5%
Yes, created or updated prior to Spring 2008 5.5%
I do not have such plan 33.7%
No response 35.0%
51 Table of Contents

LOS ANGELES HARBOR COLLEGE FALL 2009 STUDENT SURVEY RESULTS
ONLINE SURVEY - COUNSELING INFORMATION & SERVICES
Table 11.g
Table 11.h
Table 11.i
Have you been able to follow the recommended
list of courses?
Online Student
Survey Percent
Yes 35.6%
No, some of the courses have not been offered 13.5%
No, I have to complete some prerequisites first 5.5%
No, I have changed my mind about my
program/goals3.7%
No response 41.7%
Was your last meeting with a counselor a "drop‐
in" or scheduled appointment?
Online Student
Survey Percent
Drop‐in 22.1%
Scheduled 39.3%
No response 38.7%
Your opinion about your last meeting with a
counselor:
Strongly
AgreeAgree Disagree
Strongly
DisagreeNo Response
Getting to see a counselor for this meeting was
easy17.8% 30.7% 8.6% 4.9% 38.0%
There was enough time during this meeting for
my question or concern21.5% 30.1% 5.5% 2.5% 40.5%
I was satisfied with the outcome of the visit 23.9% 27.6% 4.3% 4.9% 39.3%
The primary purpose of the majority of students who have met with a counselor
was to get information about transfer requirements (27.0%).
Thirty‐four percent do not have a formal education plan.
52 Table of Contents

LOS ANGELES HARBOR COLLEGE FALL 2009 STUDENT SURVEY RESULTS
ONLINE SURVEY - COUNSELING INFORMATION & SERVICES
Table 11.j
Table 11.k
A good way to obtain counseling information
(e.g., regarding courses to take or career or
transfer information) would be…
Strongly
AgreeAgree Disagree
Strongly
DisagreeNo Response
A one‐on‐one meeting with a counselor 54.0% 12.3% 0.6% 1.2% 31.9%
A group session or workshop 10.4% 25.2% 23.3% 8.6% 32.5%
A web site 12.9% 31.3% 20.2% 3.7% 31.9%
A video chat with a counselor 8.6% 23.9% 28.2% 7.4% 31.9%
A phone conversation with a counselor 9.8% 33.1% 19.6% 5.5% 31.9%
An e‐mail exchange with a counselor 14.1% 37.4% 13.5% 3.1% 31.9%
An online, interactive workshop with a counselor
and other students9.8% 27.0% 22.7% 8.0% 32.5%
In my opinion, it would be most helpful for a
student to meet with a counselor…
Strongly
AgreeAgree Disagree
Strongly
DisagreeNo Response
When first enrolling college 57.7% 9.2% 1.8% 0.6% 30.7%
When having academic problems with classes 47.9% 17.2% 2.5% 0.0% 32.5%
When planning to transfer 55.2% 11.7% 0.0% 1.2% 31.9%
When thinking about caerrer choice 50.3% 14.7% 3.1% 0.6% 31.3%
Other 23.3% 20.9% 1.8% 0.6% 53.4%
53 Table of Contents

LOS ANGELES HARBOR COLLEGE FALL 2009 STUDENT SURVEY RESULTS
ONLINE SURVEY - COLLEGE EXPERIENCES
Table 12.a
At this college, how often do you do each of the
following?Often Sometimes Seldom Never
No
Response
Ask questions or participate in class discussions 38.7% 16.0% 6.7% 3.7% 35.0%
Give a presentation or performance in class 9.8% 24.5% 15.3% 16.0% 34.4%
Go to class unprepared 0.6% 9.8% 26.4% 27.0% 36.2%
Skip class 1.2% 6.7% 20.2% 35.6% 36.2%
Work with other students in groups during class 15.3% 29.4% 11.7% 8.6% 35.0%
Work with others outside of class to prepare class
assignments9.2% 17.2% 17.2% 20.9% 35.6%
Discuss ideas from your classes with others outside
of class19.6% 28.2% 9.2% 8.0% 35.0%
Have serious conversation with students who
differ from you4.9% 16.6% 15.3% 28.2% 35.0%
How often do you use a computer for each of the
following activities?Often Sometimes Seldom Never
No
Response
Used a computer at home to do school work 58.3% 4.9% 1.2% 1.2% 34.4%
Used a computer at work to do school work 17.8% 9.2% 6.1% 30.7% 36.2%
Used a computer on campus to do school work 8.0% 12.3% 11.7% 33.7% 34.4%
Used the Internet to get information for an
assignment52.8% 10.4% 1.8% 0.6% 34.4%
Used email or instant messaging to work on
assignment22.1% 9.2% 12.3% 21.5% 35.0%
Used email or instant messaging to communicate
with an instructor35.0% 19.6% 8.0% 3.1% 34.4%
Used the College website 38.0% 17.2% 4.9% 4.9% 35.0%
Used the Library website 17.2% 14.7% 11.7% 22.1% 34.4%
Used the Internet to apply, register, check grades,
add or drop classes56.4% 6.7% 1.2% 0.6% 35.0%
Table 12.b
One out of 5 online students often or sometimes use a computer on campus to do
school work.
54 Table of Contents

LOS ANGELES HARBOR COLLEGE FALL 2009 STUDENT SURVEY RESULTS
ONLINE SURVEY - COLLEGE EXPERIENCES
Table 12.c
Table 12.d
How would you describe your interactions with
instructors?Often Sometimes Seldom Never
No
Response
I talk about educational/career plans with an
instructor3.7% 18.4% 16.6% 24.5% 36.8%
I discuss ideas with instructors outside of class 3.1% 16.0% 16.6% 27.6% 36.8%
I visit instructors during their office hours 1.8% 17.8% 14.7% 28.8% 36.8%
During your attendance at this college have you
done any of the following?Yes No
No
Response
Participated in a community‐based or service
project as part of a class12.9% 50.9% 36.2%
Tutored or taught other students 8.6% 55.2% 36.2%
Attended a college sporting event, theater
production or musical performance13.5% 50.3% 36.2%
Attended a college club meeting 4.9% 58.9% 36.2%
Worked with instructors/college staff on activities
outside of class10.4% 53.4% 36.2%
Table 12.e
During the last regular week of school, how many
hours did you spend in each of the following
activities?
None 1 ‐ 5 6 ‐ 10 11 ‐ 20 21 ‐ 30 30 PlusNo
Response
Class preparation (studying, reading, writing,
rehearsing, doing homework)1.2% 19.6% 17.8% 13.5% 7.4% 4% 36.2%
Participation in college‐sponsored activities (clubs,
campus publications, student government,
intercollegiate or intramural sports, etc.)
58.3% 1.8% 1.2% 0.6% 1.2% 1% 36.2%
Family responsibilities 0.6% 6.1% 9.2% 17.2% 7.4% 23% 36.8%
Commuting (to school and/or work) 9.2% 33.1% 11.7% 3.1% 2.5% 4% 36.2%
Socializing, watching TV, other recreation 1.8% 28.8% 17.8% 8.0% 3.7% 4% 36.2%
55 Table of Contents
LOS ANGELES HARBOR COLLEGE FALL 2009 STUDENT SURVEY RESULTS
ONLINE SURVEY - COLLEGE EXPERIENCES
Table 12.f
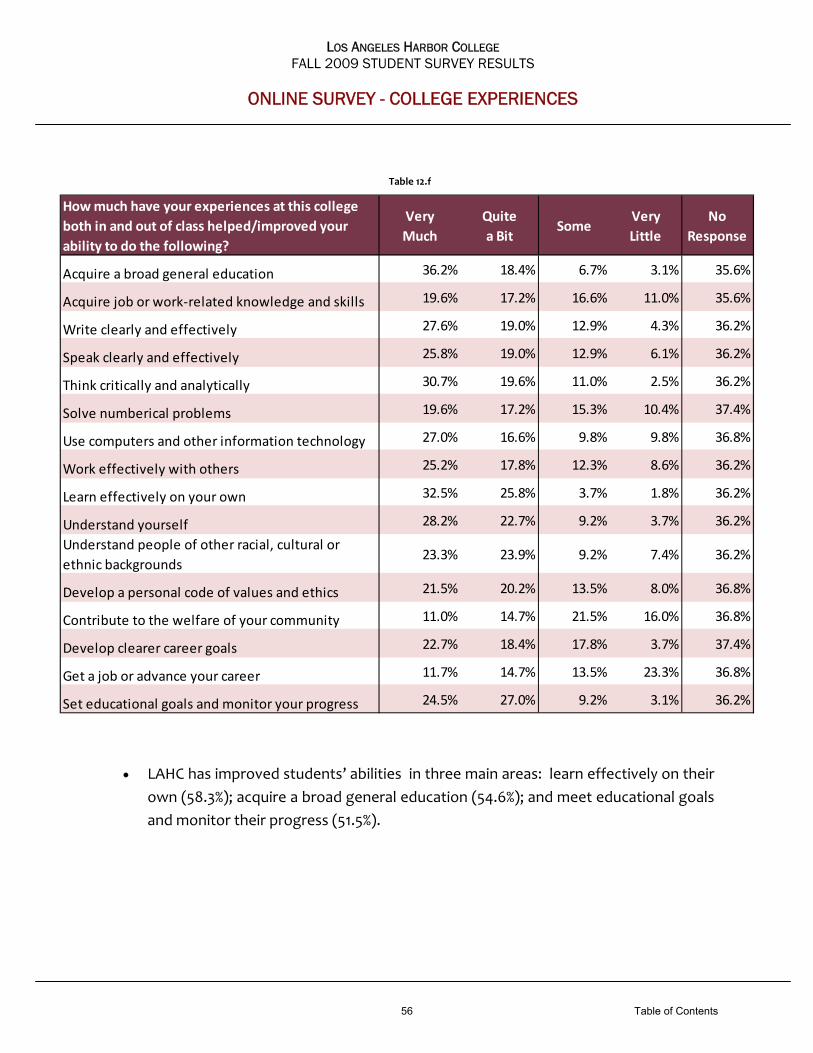
How much have your experiences at this college
both in and out of class helped/improved your
ability to do the following?
Very
Much
Quite
a BitSome
Very
Little
No
Response
Acquire a broad general education 36.2% 18.4% 6.7% 3.1% 35.6%
Acquire job or work‐related knowledge and skills 19.6% 17.2% 16.6% 11.0% 35.6%
Write clearly and effectively 27.6% 19.0% 12.9% 4.3% 36.2%
Speak clearly and effectively 25.8% 19.0% 12.9% 6.1% 36.2%
Think critically and analytically 30.7% 19.6% 11.0% 2.5% 36.2%
Solve numberical problems 19.6% 17.2% 15.3% 10.4% 37.4%
Use computers and other information technology 27.0% 16.6% 9.8% 9.8% 36.8%
Work effectively with others 25.2% 17.8% 12.3% 8.6% 36.2%
Learn effectively on your own 32.5% 25.8% 3.7% 1.8% 36.2%
Understand yourself 28.2% 22.7% 9.2% 3.7% 36.2%
Understand people of other racial, cultural or
ethnic backgrounds23.3% 23.9% 9.2% 7.4% 36.2%
Develop a personal code of values and ethics 21.5% 20.2% 13.5% 8.0% 36.8%
Contribute to the welfare of your community 11.0% 14.7% 21.5% 16.0% 36.8%
Develop clearer career goals 22.7% 18.4% 17.8% 3.7% 37.4%
Get a job or advance your career 11.7% 14.7% 13.5% 23.3% 36.8%
Set educational goals and monitor your progress 24.5% 27.0% 9.2% 3.1% 36.2%
LAHC has improved students’ abilities in three main areas: learn effectively on their
own (58.3%); acquire a broad general education (54.6%); and meet educational goals
and monitor their progress (51.5%).
56 Table of Contents

LOS ANGELES HARBOR COLLEGE FALL 2009 STUDENT SURVEY RESULTS
ONLINE SURVEY - COLLEGE EXPERIENCES
Table 12.g
To what extent do you agree with the following
statements about education practices at this
college?
Strongly
AgreeAgree Disagree
Strongly
Disagree
Does Not
Apply
No
Response
Textbooks and reading materials are useful for the
courses33.1% 27.0% 2.5% 1.2% 0.6% 35.6%
Grading practices in the courses are fair 25.2% 35.0% 3.7% 0.6% 0.0% 35.6%
Tests cover the course material presented 23.3% 36.2% 3.7% 0.0% 1.2% 35.6%
The policies and penalties for cheating are
provided and are followed37.4% 23.3% 1.8% 0.0% 1.8% 35.6%
College publications clearly and adequately reflect
the college's policies and procedures (catalog,
schedule of classes, web site)
31.9% 30.1% 0.6% 0.6% 1.2% 35.6%
I received a course syllabus that describes the
course expectations, grading procedures and
learning outcomes the course should provide
43.6% 19.6% 0.6% 0.0% 0.0% 36.2%
Course syllabi are followed 36.8% 25.8% 1.2% 0.0% 0.6% 35.6%
I would encourage others to attend this college 41.7% 22.7% 0.0% 0.0% 0.0% 35.6%
A small percentage of online students disagree or strongly disagree with the
usefulness of the textbooks and reading materials, fairness of the grading policy,
and the test covering the materials presented. However, for the most part, at least
half agree or strongly agree with the college’s educational practices.
57 Table of Contents

LOS ANGELES HARBOR COLLEGE FALL 2009 STUDENT SURVEY RESULTS
ONLINE SURVEY - CAMPUS FACILITIES AND SERVICES
Table 13.a
Campus Facilities and ServicesStrongly
AgreeAgree Disagree
Strongly
Disagree
Does Not
Apply
No
Response
I feel safe and secure on this campus 17.8% 30.1% 4.9% 1.8% 9.2% 36.2%
Campus buildings are clean and well maintained 17.2% 30.7% 5.5% 1.8% 9.2% 35.6%
Food service on this campus is sufficient 3.7% 24.5% 6.1% 6.1% 23.3% 36.2%
The restrooms on this campus are clean and well
maintained9.2% 28.2% 8.6% 6.7% 11.0% 36.2%
The grounds and public areas on this campus are
clean and well maintained14.1% 36.8% 3.7% 0.6% 8.6% 36.2%
The campus is free of safety hazards 9.8% 35.0% 8.0% 0.6% 10.4% 36.2%
The campus has adequate outside lighting after
dark7.4% 22.1% 13.5% 4.3% 16.0% 36.8%
Sufficient parking is available on campus 5.5% 17.2% 17.8% 11.7% 11.0% 36.8%
The parking lots are safe, well lighted, and well
maintained5.5% 22.1% 17.8% 6.1% 11.0% 37.4%
The college has made a good effort to reduce the
impact of construction on students8.0% 32.5% 8.0% 4.9% 10.4% 36.2%
There were mixed reviews about the campus facilities and services. The top rated
services are maintenance of the college grounds and public areas (50.9%),
cleanliness of the buildings (47.9%), and security on campus (47.9%). The least rated
areas are parking (22.7%), parking lot lighting and security (27.6%), and campus
lighting after dark (29.4%).
58 Table of Contents

LOS ANGELES HARBOR COLLEGE FALL 2009 STUDENT SURVEY RESULTS
ONLINE SURVEY - COMMENTS
Describe the one or two things you like BEST about this college:
Academics Diversity Parking
Buildings/Facilities Faculty/Staff Personal Reasons
Campus Size Food Schedule of Classes
Class Size General Security
Construction Sports Student Services
Cost Good Environment Technology
Course Offerings Lighting
Course Time of Day Location
Instructors are friendly and willing to help. Most of the teachers are knowledgeable
and friendly. They are genuinely concerned with what
has happened with my grades and are understanding when it comes to my back injury.
The new classrooms are very adequate. They have been needed for some time.
I like the technology in the new buildings! I also like the math lab!
Easy to get to (from freeway). Convenient and accessible. Midway between work and home. It is close to my house.
We received 114 comments from the online population. The responses were categorized into 22 different topics. The top three most mentioned areas are the faculty and staff (21.9%), buildings and facilities (15.8%), and location (16.7%).
FACULTY AND STAFF
BUILDINGS AND FACILITIES
LOCATION
The distribution of the classrooms and buildings between class hours are the best.
It's clean and safe.
The instructors and staff are very helpful.
I love how easy it is to see a counselor and get the answers you're looking for in a short amount of time.
59 Table of Contents

LOS ANGELES HARBOR COLLEGE FALL 2009 STUDENT SURVEY RESULTS
ONLINE SURVEY - COMMENTS
Describe the one or two things you like LEAST about this college:
There isn't enough parking. The traffic.
Some teachers are very reluctant to use e‐mail to communicate with students. This way of communication could be very efficient especially for people who have very busy schedules.
I would like the syllabus provided at the beginning of the semester to be followed instead of adding extra assignments at the last minute.
I would like to see more online classes along with more language classes.
I would like to see a greater variety of classes, a broader curriculum.
I'd like to see the winter and summer session resume.
There were 94 comments collected. The least favorite was parking (18.5%), faculty and staff (16.3%), followed by course offerings (10.9%).
PARKING
FACULTY AND STAFF
COURSE OFFERINGS
One of my instructors did not turn in the grades on time which resulted in me having to pay the $20.00 for the emergency transcript fee!
I e‐mailed the department chair and he never replied to my e mail! This almost resulted in me not being able to apply to a program, since the winter grade was posted late.
Offer additional online classes and use other resources for online courses such as Wiley Plus. I found for accounting, that this method of interactive tests is much more efficient
60 Table of Contents

This page intentionally left blank.
61 Table of Contents
Appendix
62 Table of Contents

This page intentionally left blank.
63 Table of Contents

LOS ANGELES HARBOR COLLEGE FALL 2009 STUDENT SURVEY RESULTS
APPENDIX
64 Table of Contents

LOS ANGELES HARBOR COLLEGE FALL 2009 STUDENT SURVEY RESULTS
APPENDIX
65 Table of Contents

LOS ANGELES HARBOR COLLEGE FALL 2009 STUDENT SURVEY RESULTS
APPENDIX
66 Table of Contents
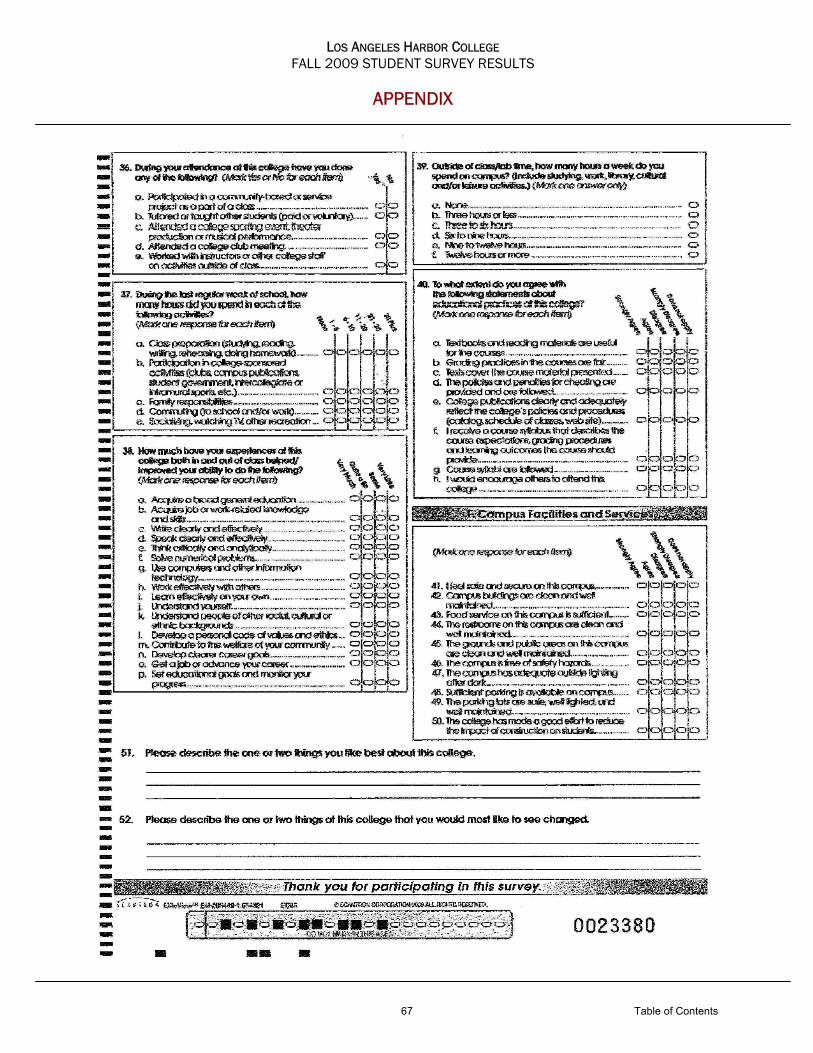
LOS ANGELES HARBOR COLLEGE FALL 2009 STUDENT SURVEY RESULTS
APPENDIX
67 Table of Contents

LOS ANGELES HARBOR COLLEGE FALL 2009 STUDENT SURVEY RESULTS
APPENDIX
68 Table of Contents

This page intentionally left blank.
69 Table of Contents

This page intentionally left blank.
70 Table of Contents

71