Embed Size (px)
Citation preview

arX
iv:a
stro
-ph/
0112
489v
1 2
0 D
ec 2
001
A NEW ERA IN COSMOLOGYASP Conference Series, Vol. ???, 2001T. Shanks & N. Metcalfe
Cepheids, Supernovae, H0, and the Age of the Universe
G.A. Tammann, B. Reindl, F. Thim
Astronomisches Institut der Universitat BaselVenusstrasse 7, CH-4102 Binningen, Switzerland
A. Saha
National Optical Astronomy Observatories950 North Cherry Ave., Tucson, AZ 85726
A. Sandage
The Observatories of the Carnegie Institution of Washington813 Santa Barbara Street, Pasadena, CA 91101
Abstract. The local expansion field is mapped using Cepheids, a com-plete sample of TF distances, and nearby cluster distances. The large-scale field is mapped using Cepheid-calibrated blue SNe Ia. These datagive H0(local) = 59.2± 1.4 [km s−1Mpc−1] and H0(cosmic) = 57.4± 2.3.The intermediate expansion field (1200 ≤ v ∼< 10 000 km s−1) is less wellcalibrated but fully consistent with H0 ≈ 60. H0 is therefore (nearly)scale-invariant (high-density regions excluded). – The P-L relation ofCepheids is based on an improved zero point of (m − M)LMC = 18.56.The slope of the P-L relation for P > 10d, as judged from OGLE data(Udalski et al. 1999) is flatter than anticipated, which tends to increasethe above values of H0 by 3.4 units. No significant metallicity effect onthe Cepheid distances seems to be indicated. For all practical purposesH0 = 60 is recommended with a systematic error of probably less than10%. – The corresponding expansion age is T = 15.7 ± 1.5 Gy (withΩm = 0.3, ΩΛ = 0.7), which compares well with the formation time of15± 2 Gy for the apparently oldest globular cluster M107.
1. Introduction
Cepheids and their P -L relation are the principal fundament of extragalacticdistances (Section 2). Cepheid distances are available of nine galaxies whichhave produced blue SNe Ia (Saha et al 2001 and references therein). Theirresulting, very uniform luminosities can be applied to 35 more distant SNe Ia(v ∼< 30 000 kms−1) to yield a first rate determination of the large-scale value ofH0 (Section 5). Details of the local expansion field are inserted in Section 3 andsome remarks on the not so local expansion field in Section 4. The expansion ageof the Universe is compared with independent age determination of old objectsin the Galaxy in Section 6. Results and conclusions are compiled in Section 7.
1

2 G.A. Tammann et al.
2. Cepheids and their P-L relation
2.1. The shape of the P-L relation
The available Cepheid distances, which are useful for the extragalactic distancescale beyond the Local Group, are compiled in Table 1. The majority is derivedfrom HST observations in V and I. All distances are based on the shape of theP -L relations by Madore & Freedman (1991)
MV = −2.76 log P − 1.46 (1)
MI = −3.06 log P − 1.87 (2)
As for the constant term see 2.2. Equations (1) and (2) yield apparent distancemoduli µV and µI which, with AB = 4.1EB−V , AV = 3.1EB−V , and AI =1.8EB−V , give the true moduli
µ0 ≡ (m−M)0 = 2.38µI − 1.38µV . (3)
It may be noted that equations (1) and (2) imply (V − I) ∝ 0.3 log P .It was recently suggested (Freedman et al. 2001) that the OGLE photometryof Cepheids in LMC (Udalski et al. 1999) required a shallower relation (V −I) ∝ 0.2 log P , that long-period Cepheids were therefore intrinsicly bluer than
Table 1. Adopted Cepheid Distance Moduli µ0[LMC at µ0 = 18.56].
Galaxy v220 ∆[O/H]∗∗ µ0 † Src.‡ Galaxy v220 ∆[O/H]∗∗ µ0 † Src.‡
NGC 224 LG +0.50 24.47 (08) 5 NGC 3982 1497 — 31.78 (14) 1CNGC 300 118 −0.15 26.68 (10) 5 NGC 4258 554 +0.35 29.55 (07) 5NGC 598 LG +0.30 24.64 (10) 5 NGC 4321 — +0.65 31.02 (07) 5NGC 925 790 +0.05 30.00 (04) 5 NGC 4414 660 +0.70 31.35 (15) 2CNGC 1326A 1338 ±0.00 31.26 (10) 5 NGC 4496A — +0.25 31.09 (10) 1CNGC 1365 1338 +0.45 31.42 (05) 5 NGC 4527 — — 30.73 (15) 3NGC 1425 1338 +0.50 31.73 (06) 5 NGC 4535 — +0.70 31.09 (05) 5NGC 2090 814 +0.30 30.50 (04) 5 NGC 4536 — +0.35 31.16 (12) 1CNGC 2403 365 +0.30 27.65 (24) 5 NGC 4548 — +0.85 31.09 (05) 5NGC 2541 802 ±0.00 30.48 (07) 5 NGC 4603 2323 — 32.67 (11) 6NGC 3031 141 +0.25 27.89 (07) 5 NGC 4639 — +0.50 32.09 (22) 1CNGC 3198 861 +0.10 30.90 (08) 5 NGC 4725 — +0.40 30.61 (06) 5NGC 3319 955 −0.10 30.85 (09) 5 NGC 5253 153 −0.35 28.06 (07) 1CNGC 3351 648 +0.75 30.04 (10) 5 NGC 5457 413 −0.13 29.36 (10) 5NGC 3368 802 +0.70 30.21 (15) 4C NGC 7331 1108 +0.15 30.96 (09) 5NGC 3621 495 +0.15 29.29 (06) 5 IC 4182 330 −0.10 28.42 (12) 1CNGC 3627 542 +0.75 30.28 (12) 1C
∗ Recession velocity corrected for Virgocentric infall (Kraan-Korteweg 1986). The velocities of the galaxiesin the Virgo cluster region (αM87 < 30) are not used in the following and are not shown.∗∗ ∆ log [O/H] = log [O/H]
Gal− log [O/H]
LMCderived from data given in Freedman et al. (2001)
† The errors in parentheses in units of 0.m01 are taken from the original sources. Some of them are unrealisti-cally small. If the errors of the apparent moduli in V and I are optimistically assumed to be ±0.m05, the errorsof (m −M)0 are
∼> 0.m15 from equation (3). – Consequently the reliable maser distance µ0 = 29.29 ± 0.08
of NGC4258 (Herrnstein et al. 1999) is still in statistical agreement with the distance shown here.‡ C means the galaxy distance is used for the luminosity calibration of SNe Ia.Sources: (1) Saha et al. 2001; (2) Thim 2001; (3) mean of Saha et al. 2001 and Thim 2001; (4) mean ofTanvir et al. 1999 and source (5); (5) Freedman et al. 2001 (Table 3, column 2; including (small) correctionsby excluding short-period Cepheids which may introduce selection bias); (6) Newman et al. 1999.

Cepheids, Supernovae, H0, and the Age of the Universe 3
0.0 0.5 1.0 1.5log P
0.0
0.2
0.4
0.6
0.8
1.0
1.2
1.4
(V-I
)0
(V-I)0 = (0.172±0.001) log P + 0.500±0.000σ = 0.07, N = 603 (P<10d)
(V-I)0 = (0.339±0.008) log P + 0.337±0.009σ = 0.05, N = 47 (P>10d)
Figure 1. A (V −I) vs. logP diagram of the fundamental-mode LMCCepheids adopted by Udalski et al. (1999). Color excesses from thatsource. Small symbols: P < 10d; large symbols: P > 10d.
anticipated, and that the corresponding increase of the internal absorption wouldlead to a “dramatic” decrease of ∼ 0.m14 on average of those Cepheid distancesin Table 1, which rely indeed on long-period Cepheids.
However, the data of Udalski et al. (1999) indicate a clear change of the(V − I) − log P relation near P = 10 days (Fig. 1), i.e. near the terminationpoint of the Hertzsprung progression. While the slope is approximately 0.2for P < 10d, it steepens to ∼> 0.3 for P > 10d. In fact the new data show
Cepheids with P > 10d to be redder than implied by equations (1) and (2). (Thisstatement holds if all Cepheid colors are consistently corrected by a constantLMC excess of EB−V = 0.1. The color excesses given by Udalski et al. arevariable and larger on average. Note that any possible overestimate of <EB−V >of the LMC Cepheids affects the apparent moduli µV and µI of external galaxies,but not the true modulus from equation (3). Therefore the Udalski et al. valuesof E(B − V ) are adopted in the following without consequences for the deriveddistances).
The change of slope of the color relation in Fig. 1 demands a correspondingchange of slope near P = 10d of the MV − log P or of the MI − logP relationor of both. Fits to the data for P < 10d and P > 10d give indeed significantlydifferent slopes (Fig. 2):
P < 10 days : MV = (−2.862 ± 0.002) log P − (1.43 ∓ 0.001); (4)
MI = (−3.034 ± 0.001) log P − (1.93 ∓ 0.001) (5)
P > 10 days : MV = (−2.487 ± 0.025) log P − (1.79 ∓ 0.030); (6)
MI = (−2.825 ± 0.019) log P − (2.12 ∓ 0.022) (7)
Here µ0LMC ≡ 18.56 is assumed (cf. 2.2). Compared to equations (1) and (2) the
equations (6) and (7) lead to smaller distance moduli by
∆µ(P > 10d) = −0.18 log P + 0.14. (8)

4 G.A. Tammann et al.
0.0 0.5 1.0 1.5log P
17
16
15
14
13
12
11m
V0
V
0.0 0.5 1.0 1.5log P
17
16
15
14
13
12
11
mI0
I
Figure 2. P -L relations in V and I of the fundamental-mode LMCCepheids adopted by Udalski et al. (1999). Symbols like in Fig. 1.
This is not because Cepheids are bluer here (they have (V − I) = 1.01 atlog P = 2 in either case even with the large EB−V values of Udalski et al.), butbecause the P -L relations are flatter for P > 10d than anticipated.
In the following the P -L relations of equation (1) and (2) are maintainedbecause the data of Udalski et al. (1999) extend to only P ≤ 30 days, while abouthalf of the Cepheids in more distant galaxies have longer periods. However,the effect of the equations (6) and (7) – on the assumption that they can beextrapolated to longer periods – is taken up again in Section 7.
2.2. The zero point of the P-L relation
It is customary to set the zero point of the P -L relation by adopting µLMC =18.50. It is time now to improve this value. LMC moduli are compiled in Table 2comprising a variety of methods with different, but poorly known systematicerrors. A unweighted mean of µ0
LMC = 18.56 is therefore adopted, which is usedthroughout this paper.
Red-clump stars and binaries were suggested to give rather low LMC mod-uli. Yet the most recent results agree statistically with the adopted value (cf.Table 1). Statistical parallaxes of Galactic RRLyr stars, which pose formidableproblems of sample selection, are given zero weight (cf. Walker 1999).
2.3. Metallicity effects of Cepheids?
The metal dependence of the P -L relation has so far not found a satisfactorysolution from observations (e.g. Gould 1994; Sasselov et al. 1997; Kennicuttet al. 1998). Theoretical models give only a small effect (Chiosi et al. 1993;Saio & Gautschy 1998; Sandage et al. 1999; Alibert & Baraffe 2000; see howeverCaputo et al. 2000). If the model dependencies in V and I from Sandage et al.(1999, Fig. 3) are inserted into equation (3) one obtains a metal correctionof ∆µ = −0.12∆[Fe/H] in formal agreement with −0.24 ± 0.16∆[O/H] fromKennicutt et al. (1998). The rather marginal evidence from Fig. 3 has, however,the opposite sign. Moreover, the seven galaxies with Cepheid distances and
Cepheids, Supernovae, H0, and the Age of the Universe 5
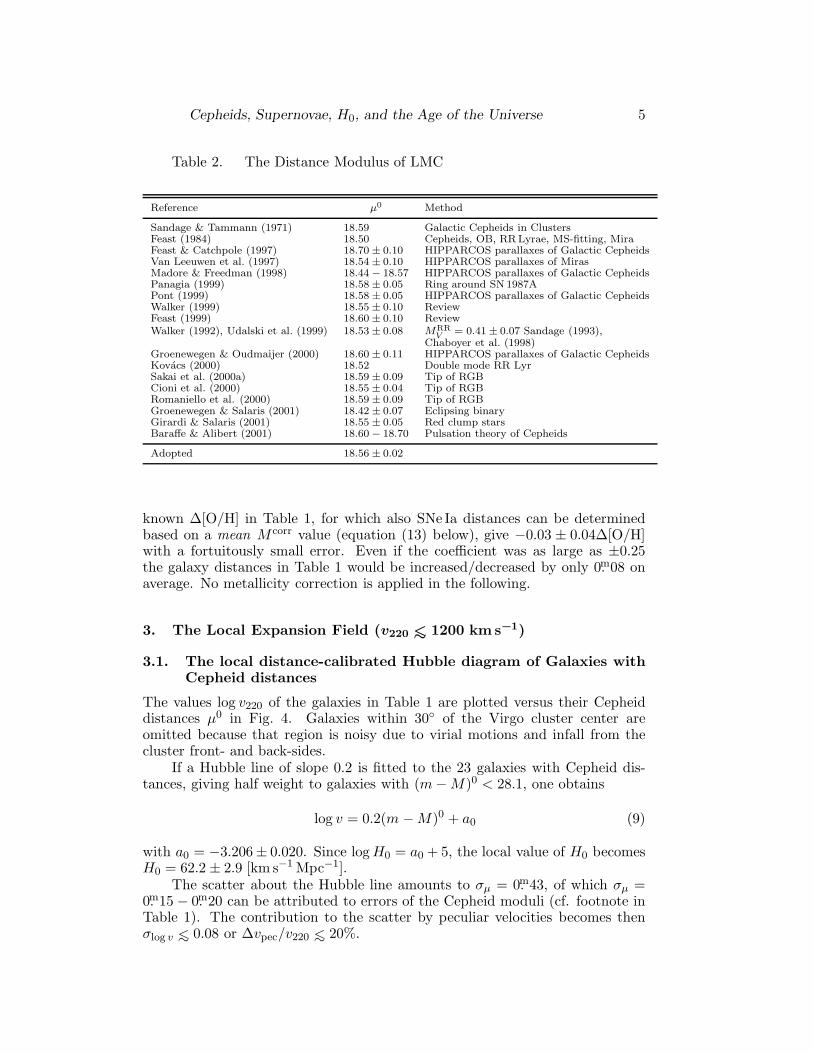
Table 2. The Distance Modulus of LMC
Reference µ0 Method
Sandage & Tammann (1971) 18.59 Galactic Cepheids in ClustersFeast (1984) 18.50 Cepheids, OB, RRLyrae, MS-fitting, MiraFeast & Catchpole (1997) 18.70 ± 0.10 HIPPARCOS parallaxes of Galactic CepheidsVan Leeuwen et al. (1997) 18.54 ± 0.10 HIPPARCOS parallaxes of MirasMadore & Freedman (1998) 18.44 − 18.57 HIPPARCOS parallaxes of Galactic CepheidsPanagia (1999) 18.58 ± 0.05 Ring around SN 1987APont (1999) 18.58 ± 0.05 HIPPARCOS parallaxes of Galactic CepheidsWalker (1999) 18.55 ± 0.10 ReviewFeast (1999) 18.60 ± 0.10 ReviewWalker (1992), Udalski et al. (1999) 18.53 ± 0.08 MRR
V= 0.41± 0.07 Sandage (1993),
Chaboyer et al. (1998)Groenewegen & Oudmaijer (2000) 18.60 ± 0.11 HIPPARCOS parallaxes of Galactic CepheidsKovacs (2000) 18.52 Double mode RR LyrSakai et al. (2000a) 18.59 ± 0.09 Tip of RGBCioni et al. (2000) 18.55 ± 0.04 Tip of RGBRomaniello et al. (2000) 18.59 ± 0.09 Tip of RGBGroenewegen & Salaris (2001) 18.42 ± 0.07 Eclipsing binaryGirardi & Salaris (2001) 18.55 ± 0.05 Red clump starsBaraffe & Alibert (2001) 18.60 − 18.70 Pulsation theory of Cepheids
Adopted 18.56 ± 0.02
known ∆[O/H] in Table 1, for which also SNe Ia distances can be determinedbased on a mean M corr value (equation (13) below), give −0.03 ± 0.04∆[O/H]with a fortuitously small error. Even if the coefficient was as large as ±0.25the galaxy distances in Table 1 would be increased/decreased by only 0.m08 onaverage. No metallicity correction is applied in the following.
3. The Local Expansion Field (v220∼< 1200 km s−1)
3.1. The local distance-calibrated Hubble diagram of Galaxies withCepheid distances
The values log v220 of the galaxies in Table 1 are plotted versus their Cepheiddistances µ0 in Fig. 4. Galaxies within 30 of the Virgo cluster center areomitted because that region is noisy due to virial motions and infall from thecluster front- and back-sides.
If a Hubble line of slope 0.2 is fitted to the 23 galaxies with Cepheid dis-tances, giving half weight to galaxies with (m−M)0 < 28.1, one obtains
log v = 0.2(m −M)0 + a0 (9)
with a0 = −3.206± 0.020. Since logH0 = a0 + 5, the local value of H0 becomesH0 = 62.2 ± 2.9 [km s−1 Mpc−1].
The scatter about the Hubble line amounts to σµ = 0.m43, of which σµ =0.m15 − 0.m20 can be attributed to errors of the Cepheid moduli (cf. footnote inTable 1). The contribution to the scatter by peculiar velocities becomes thenσlog v ∼< 0.08 or ∆vpec/v220 ∼< 20%.

6 G.A. Tammann et al.
-0.4 -0.2 0.0 0.2 0.4 0.6 0.8∆[O/H]
-1.5
-1.0
-0.5
0.0
0.5
1.0
1.5
Ri
Ri = (0.232±0.159) ⋅ ∆[O/H] + (-0.040±0.063)σ = 0.49 N = 21
Figure 3. The dependence of Cepheid distances on the metallicity∆[O/H] = [O/H]Gal− [O/H]LMC. Plotted are the residuals Ri from themean Hubble line in Fig. 4. Open symbols for galaxies with µ0 < 28.1are given half weight.
26 28 30 32 34(m−M)0
2.0
2.5
3.0
3.5
log
v 220
Ri
H0 = 62.2±2.9
Figure 4. The distance-calibrated Hubble diagram plotting log v220versus the Cepheid distance modulus of 23 galaxies. Open symbols aregiven half weight. The distance modulus residuals Ri are used in Fig. 3.

Cepheids, Supernovae, H0, and the Age of the Universe 7
26 28 30 32(m−M)0
2.0
2.5
3.0
log
v 220
mB=14.86Hi=24
mB=11.30Hi=112
log v = 0.2 ⋅ (m−M)0 + (-3.227±0.018)σ = 0.86 N = 92
(a) αM87>30o
H0 = 59.2±2.5
26 28 30 32(m−M)0
2.0
2.5
3.0
log
v 220
log v = 0.2 ⋅ (m−M)0 + (-3.344±0.039)σ = 1.18 N = 36
(b) αM87<30o
(H0 = 45.3±4.3)
Figure 5. The distance-calibrated Hubble diagram of a completesample of spiral galaxies with TF distances and with v220 <1000 km s−1. (a) Galaxies outside the Virgo region (αM87 > 30). Anapparently bright and an apparently faint galaxy and their respectiveindividual Hubble constants Hi are shown. (b) Galaxies within theVirgo region (αM87 < 30).
If the velocities v0 (corrected only to the barycenter of the Local Group)were used instead of v220 one would obtain H0 = 59.0 ± 2.9 with slightly largerscatter.
3.2. The local distance-calibrated Hubble diagram from the TF re-lation
The Tully-Fisher (TF) relation (M0B vs. 21-cm line width at 20% maximum
intensity) can be calibrated via 29 sufficiently inclined spiral galaxies from Ta-ble 1. Two galaxies, NGC 5204 and 5585, can be added with half weight on theassumption that they lie as companions of NGC5457 at the latter’s distance.One obtains then
M0B = −7.31 logw20 − (1.833 ± 0.095); σM = 0.53. (10)
The data of the individual galaxies are given by Federspiel (1999). The slope ofthe relation is taken from a complete sample of Virgo cluster members (Federspiel1999) and is in very good agreement with the calibrators used here.
The calibration in equation (10) is applied to a (nearly) complete, distance-limited sample of inclined (i ≥ 45) spirals with v220 < 1000 km s−1 and |b| >20, as compiled by Federspiel (1999); Virgo and UMa cluster members areexcluded as well as peculiar and HI-truncated galaxies. The resulting Hubblediagram of log v220 versus the TF distances of the 92 galaxies outside the Virgoregion (αM87 > 30) gives a mean value of H0 = 59.2 ± 2.5 (Fig. 5a); thelarge scatter of σ(m−M) = 0.86 is presumably due to observational errors of thelinewidths w20, which are compiled from various sources. Yet the scatter ofthe 36 galaxies within αM87 < 30 is still significantly larger (σ(m−M) = 1.18;Fig. 5b). This can only be explained by the enhanced influence of peculiar
8 G.A. Tammann et al.
10 12 14 16cutoff magnitude
50
55
60
65
70
75
H0
N=13
N=21N=34
N=53
N=72
N=82
N=92σ=0.69
σ=0.71σ=0.63
σ=0.67
σ=0.75
σ=0.78
σ=0.86
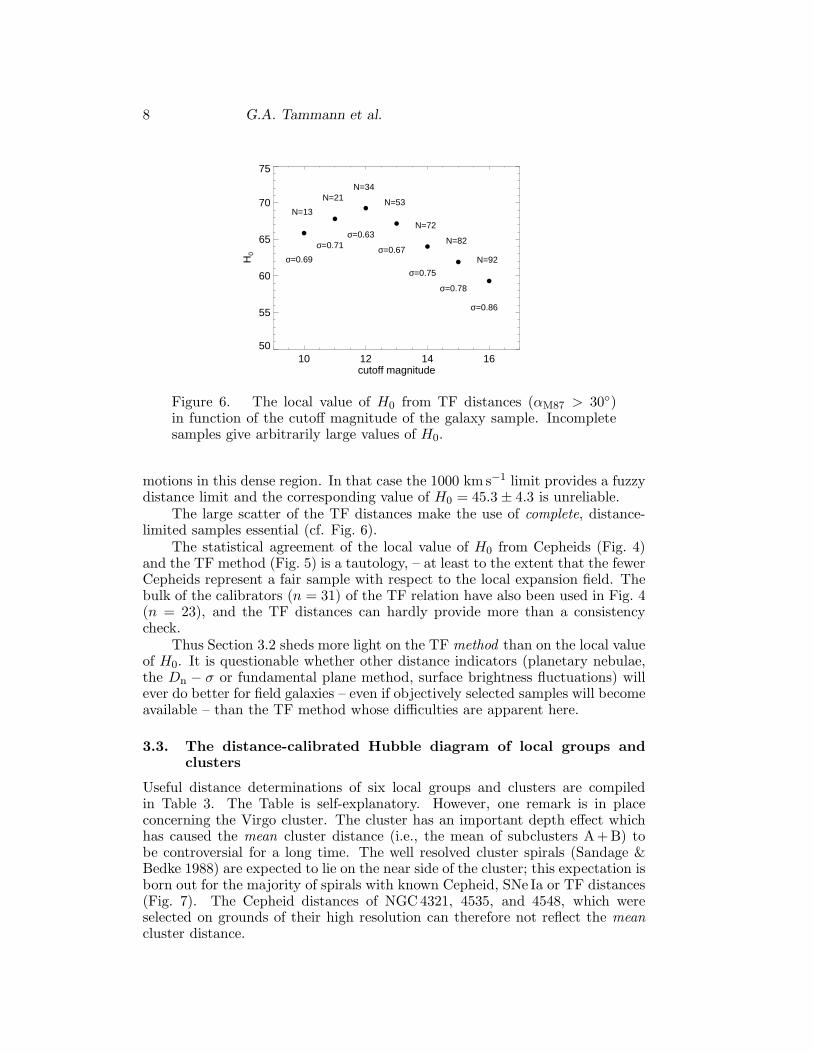
Figure 6. The local value of H0 from TF distances (αM87 > 30)in function of the cutoff magnitude of the galaxy sample. Incompletesamples give arbitrarily large values of H0.
motions in this dense region. In that case the 1000 km s−1 limit provides a fuzzydistance limit and the corresponding value of H0 = 45.3 ± 4.3 is unreliable.
The large scatter of the TF distances make the use of complete, distance-limited samples essential (cf. Fig. 6).
The statistical agreement of the local value of H0 from Cepheids (Fig. 4)and the TF method (Fig. 5) is a tautology, – at least to the extent that the fewerCepheids represent a fair sample with respect to the local expansion field. Thebulk of the calibrators (n = 31) of the TF relation have also been used in Fig. 4(n = 23), and the TF distances can hardly provide more than a consistencycheck.
Thus Section 3.2 sheds more light on the TF method than on the local valueof H0. It is questionable whether other distance indicators (planetary nebulae,the Dn − σ or fundamental plane method, surface brightness fluctuations) willever do better for field galaxies – even if objectively selected samples will becomeavailable – than the TF method whose difficulties are apparent here.
3.3. The distance-calibrated Hubble diagram of local groups andclusters
Useful distance determinations of six local groups and clusters are compiledin Table 3. The Table is self-explanatory. However, one remark is in placeconcerning the Virgo cluster. The cluster has an important depth effect whichhas caused the mean cluster distance (i.e., the mean of subclusters A+B) tobe controversial for a long time. The well resolved cluster spirals (Sandage &Bedke 1988) are expected to lie on the near side of the cluster; this expectation isborn out for the majority of spirals with known Cepheid, SNe Ia or TF distances(Fig. 7). The Cepheid distances of NGC4321, 4535, and 4548, which wereselected on grounds of their high resolution can therefore not reflect the meancluster distance.

Cepheids, Supernovae, H0, and the Age of the Universe 9
Table 3. Distances of local groups and clusters
Group/Cluster <v220> µ0 Method
South Polar gr.∗ 112 26.68± 0.20 Cepheids (1)a
M101 gr.∗ 405 29.36± 0.10 Cepheids (1)a, TRGBf
Leo∗ 652 30.21± 0.05 SNe Ia (2)b, Cepheids (3)a, TRGBf
UMa† 1060 ≥ 31.33± 0.15 TFc, LCd
Virgo‡ 1179 31.60± 0.20 SNe Ia (3)b, Cepheids (4)a, TFc, LCd, GCe
Fornax∗ 1338 31.60± 0.10 SNe Ia (3)b, Cepheids (3)a
∗ Group/cluster membership as defined by Kraan-Korteweg (1986)† Two separate agglomerations can be distinguished in the UMa cluster; the nearer, presumablymore nearly complete agglomeration with 18 TF distances is considered here (Federspiel 1999)‡ Cluster membership as defined by Binggeli et al. (1993)Sources: (a) Table 1; (b) SNe Ia calibration as in Section 5.4; (c) Federspiel (1999); (d) Luminosityclasses (Sandage 2001); (e) Globular Clusters (Tammann & Sandage 1999); (f) Kennicutt et al.(1998)
6o
8o
10o
12o
14o
16o
18o
Dec
linat
ion
(195
0)
30 31 32 33
SN1984A
SN1994D
SN1990N
NGC4321
NGC4535
NGC4548 NGC4639
30 31 32 33distance modulus µ0
12h00m
12h10m
12h20m
12h30m
12h40m
RA
(19
50)
SN1984A
SN1990N
SN1994D
NGC4321
NGC4535NGC4548
NGC4639
adopted
Figure 7. An illustration of the depth effect of the Virgo cluster.The position of cluster members is shown (declination [upper panel]and RA [lower panel] vs. µ0) with known Cepheid (triangles), SNe Ia(diamonds), or TF (circles) distances. The majority of the well resolvedgalaxies (open symbols) lie on the near (left) side of the cluster.

10 G.A. Tammann et al.
26 28 30 32(m−M)0
2.0
2.5
3.0lo
g v 2
20
M101 gr.
Leo
UMa
South Polar gr.
Virgo
FornaxH0 = 57.5±2.1
a0= -3.240±0.015, σ = 0.17, N = 6±10% boundaries
Figure 8. The distance-calibrated Hubble diagram for six localgroups and clusters from Table 3.
The Virgo cluster distance from the peak of the luminosity function ofglobular clusters (µ0 = 31.70 ± 0.30) is of particular interest because it is herethe only distance independent of Cepheids, being based on only Population IIobjects (RRLyr and Galactic globular clusters). Yet the method still lacks atheoretical understanding and does not seem to work for the Fornax cluster(Tammann & Sandage 1999).
The Hubble diagram of the six groups and clusters in Table 3 is shown inFig. 8. Giving half weight to the nearby South Polar group (NGC300) yieldsH0 = 57.5 ± 2.1.
The three determinations of the local value of H0 in 3.1 to 3.3 give aweighted mean of H0 = 59.2 ± 1.4.
4. The Intermediate Expansion Field
For the determination of the cosmic value of H0 the intermediate expansionfield (1200 ∼< v220 ∼< 10 000 km s−1) is irrelevant. The large-scale route throughSNe Ia is in any case superior and the most direct one (Section 5). Intermediate-size distances are only needed to study deviation from a smooth Hubble flow(e.g. the local CMB dipole motion). SNe Ia are not yet useful here because oftheir paucity.
Distance determinations of field galaxies beyond ∼ 1200 km s−1 are ex-tremely difficult because of incompleteness bias. Elaborate parametric or non-parametric methods have been developed to correct for this bias (e.g. Theureauet al. 1998; Federspiel et al. 1998; for a compilation cf. Tammann et al. 2000;Hendry 2001). The conclusion is 50 < H0 < 65.
Nevertheless usefull Hubble diagrams of clusters have been established usingrelative cluster distances, which can be fitted to nearby clusters with known

Cepheids, Supernovae, H0, and the Age of the Universe 11
distances (cf. Table 3) to yield distance-calibrated Hubble diagrams. (1) TheHubble diagram of first-ranked cluster galaxies by Sandage & Hardy (1973), iffitted to the brightest galaxies in the Virgo, Fornax (and Coma) clusters, givesH0 = 51±7. (2) Giovanelli et al. (1997) and Dale et al. (1999) have provided TFdistances of 71 clusters (v < 25 000 km s−1), using about 10 galaxies per cluster.These clusters define an impressively tight Hubble diagram with a scatter of onlyσ(m−M) = 0.11. Using the Fornax cluster as zero point one obtains H0 = 63±5.(3) Relative Dn − σ and fundamental plane distances have been derived for10 clusters (v < 10 000 km s−1) by Kelson et al. (2000). The ensuing Hubblediagram with σ(m−M) = 0.19 combined with the Coma cluster distance givesH0 = 66± 8. For details see Tammann (2001).
The routes through (1) and (2) go beyond what we have defined as the“intermediate” expansion field and reflect already on the large-scale value ofH0. It has been suggested (Sakai et al. 2000b) that method (2), if fitted toequation (10), leads to H0 ∼> 70. This is, however, a grave error, becauseequation (10) can only be applied to distance- or volume-limited samples, whilethe relative TF distances of distant clusters are based on only a few subjectivelyselected cluster members.
5. The Cosmic Expansion Field
5.1. The Hubble diagram of blue SNe Ia out to 30 000 km s−1
A sample of 35 blue SNe Ia with good B, V (and I) photometry, 1200 ≤ v220 ∼<
30 000 km s−1, and (B−V )0max ≤ 0.06 has been compiled by Parodi et al. (2000).Their residual magnitudes (at maximum light) from a mean Hubble line correlatewith the decline rate ∆m15 and the color (B−V )0max. If these dependencies areremoved one obtains corrected magnitudes mcorr
B,V,I , which define linear Hubble
lines (corresponding closely to an Ωm = 1 model) of the form
log v = 0.2mcorrB,V,I + cB,V,I (11)
with very small scatter σB,V = 0.m13, σI = 0.m12 (Parodi et al. 2000).The small scatter is most remarkable because it can be accounted for by pho-
tometric errors alone, leaving very little room for peculiar motions (vpec/V220 <0.06) and luminosity variations of SNe Ia, once they are corrected for ∆m15 andcolor. Yet the most important fact for the determination of H0 is that thesmall scatter provides indisputable proof for blue SNe Ia (corrected for ∆m15
and color) being by far the best distance indicators known, which at the sametime makes them insensitive to selection bias.
Nine of the 35 SNe Ia are corrected for Galactic absorption by more thanAV = 0.m2 (Schlegel at al. 1998). They lie significantly (0.m21± 0.04) above themean Hubble line defined by the remaining 26 SNe Ia, presumably because theirGalactic absorption is overestimated. The more reliable 26 SNe Ia with smallGalactic absorption yield the following constant terms in equation (11)
cB = 0.662 ± 0.005, cV = 0.661 ± 0.005, cI = 0.604 ± 0.005 (12)
with a reduced scatter of σm = 0.m11(!) in all three colors.

12 G.A. Tammann et al.
5.2. The luminosity calibration of SNe Ia
For nine local SNe Ia Cepheid distances are available (Saha et al. 2001). Afterstandard corrections (Parodi et al. 2000) for Galactic and internal absorptionand for decline rate ∆m15 and color (B−V ), they have the same intrinsic colors(B−V )0max as the distant SNe Ia. Their Cepheid-calibrated absolute magnitudesat maximum become (Saha et al. 2001):
<M corrB >= −19.56 ± .07, <M corr
V >= −19.53 ± .06, <M corrI >= −19.25 ± .09.
(13)
5.3. The cosmic value of H0
Transforming equation (11) gives
logH0 = 0.2MB,V,I + cB,V,I + 5 (14)
Inserting c from equation (12) and M from equation (13) yields H0(B) = 56.2±2.5, H0(V ) = 56.9 ± 2.3, and H0(I) = 56.8 ± 3.1.
If instead of a linear fit (Ω ≈ 1) the distant SNe Ia are fitted by an Ωm = 0.3,ΩΛ = 0.7 model (Carroll et al. 1992), the value of H0 is marginally increased by0.8 units, such that
<H0(B,V, I)>cosmic= 57.4 ± 2.3. (15)
5.4. Other evidence for the large-scale value of H0
Models of blue SNe Ia predict MB(max) = −19.5(±0.2) (Hoflich & Khokhlov1996; Branch 1998), which is in fortuitous agreement with the observed value inequation (13) which in turn leads to the value of H0 in equation (15).
Distances have been derived for an impressive number of clusters from theSunyaev-Zeldovich effect. Several reviews agree that the present data suggestH0 ≈ 60 (Mason et al. 2001; Rephaeli 2001; Carlstrom 2001).
The solution of H0 from a single lensed quasar is degenerate as to thedistance and lensing mass. Yet a combination of several such quasars restrictthe solution to a rather narrow window near H0 ≈ 55.
The fluctuation spectrum of the CMB does not yet give stringent limitson H0, but values near H0 = 60 are entirely consistent with multi-parametersolutions (Netterfield et al. 2001; Pryke 2001).
6. The Age of the Oldest Galactic Objects
The age test requires the oldest objects in the Universe to be younger thanthe expansion age. The latter becomes, with H0 = 60 ± 5, Ωm = 0.3, andΩΛ = 0.7, T = 15.7 ± 1.5 Gy. Various age determinations of very old objects inthe Galaxy are available, e.g. Th or U ages of metal-poor stars (e.g. Cowan et al.1999; Westin et al. 2000) or cooling times of White Dwarfs (for a compilationcf. Tammann 2001). The most stringent requirement comes probably fromglobular clusters. Sandage (1993) and Chaboyer et al. (2000) give 14.1±1.5 and11.7 ± 1.6 Gy, respectively, for several globular clusters (cf. also Gratton et al.1997; Heasley et al. 2000; Sneden et al. 2000), but note that M107 seems to

Cepheids, Supernovae, H0, and the Age of the Universe 13
26 28 30 32 34 36 38(m−M)0
2.0
2.5
3.0
3.5
4.0
4.5lo
g v 2
20H0 = 59.2 ±1.4
H0 = 57.4 ±2.3
Figure 9. A synoptic distance-calibrated Hubble diagram extendingover 11 magnitudes or a factor of 100 in recession velocity. The left-hand value of H0 based on Cepheids (large dots), TF distances (smalldots), and groups/cluster (squares) is independent of the right-handvalue of H0 based on SNe Ia (diamonds), except that all distances restultimately on Cepheids. The full drawn line corresponds to Ωm = 0.3,ΩΛ = 0.7.
be older. If 14 ± 2 Gy is adopted for the latter, and if ∼ 1 Gy is added for itsgestation time, a cosmic age of 15 ± 2 Gy is required. This requirement is wellmet by the above expansion age.
7. Results and Conclusions
A synopsis of the distance determinations in Sections 3 and 5 is shown in Fig. 9.The distance moduli of the SNe Ia are determined here from their apparentmagnitudes mcorr
B,V,I and the absolute magnitudes M corrB,V,I in equation (13). The
local expansion field extends into the cosmic expansion without any significantbreak.
If one choses to base the Cepheid distances of the SNe Ia-calibrating galaxieson the new P -L relations (eq. 7 & 8), they are reduced by 6% (cf. eq. 8), i.e.
H0(cosmic) = 60.8 ± 2.3. (16)
For all practical applications H0 = 60 can be used everywhere, except in nearbyhigh-density regions.

14 G.A. Tammann et al.
So far only statistical errors have been quoted. It comes as a surprisethat the largest source of systematic errors is in the shape of the P -L relation(6%), followed by the metallicity dependence of Cepheids and the photometricHST zero point in the crowded fields of SNe Ia-calibrating galaxies (4%). Thezero point of the P -L relation, the slope of the ∆m15 correction of SNe Ia andthe HST photometry may each contribute systematic 2-3% errors. Systematicerrors due to absorption corrections for the nearby, calibrating SNe Ia and thedistant SNe Ia are negligible, because the two sets have closely the same colors(<B − V >= −0.01 ± 0.01; cf. Parodi et al. 2000). Unless there is a conspiracyof the individual systematic errors, the total systematic error is < 10%.
The resulting expansion age of T = 15.7 ± 1.5 Gy (H0 = 60± 5, Ωm = 0.3,ΩΛ = 0.7) gives sufficient room for the oldest dated objects in the Galaxy.
Acknowledgments. The first three authors thank the Swiss National ScienceFoundation for financial support. G.A. T. and F. T. thank also the PRODEXprogramme of the Swiss Space Office for support.
References
Alibert, Y., & Baraffe, I. 2000, in: The Impact of Large-Scale Surveys on Pulsating StarResearch, eds. L. Szabados and D. Kurtz, ASP Conf. Ser. 203, p. 250
Baraffe, I., & Alibert, Y. 2001, A&A, 371, 592
Binggeli, B., Popescu, C.C., & Tammann, G.A. 1993, A&AS, 98, 275
Branch, D. 1998, ARA&A, 36, 17
Caputo, F., Marconi, M., Musella, I., & Santolamazza, P. 2000, A&A, 359, 1059
Carlstrom, J.E. 2001, this Conference
Carroll, S.M., Press, W.H., & Turner, E.L. 1992, ARA&A, 30, 499
Chaboyer, B., Demarque, P., Kernan, P.J., & Krauss, L.M. 1998, ApJ, 494, 96
Chaboyer, B., Sarajedini, A., & Armandroff, T.E. 2000, AJ, 120, 3102
Chiosi, C., Wood, P.R., & Capitanio, N. 1993, ApJS, 86, 541
Cioni, M.-R.L., van der Marel, R.P., Loup, C., & Habing, H.J. 2000, A&A, 359, 601
Cowan, J.J., et al. 2000, ApJ, 521, 194
Dale, D.A., Giovanelli, R., Haynes, M.P., Camusano, L.E., & Hardy, E. 1999, AJ, 118, 1489
Feast, M.W. 1984, MNRAS, 211, 51
Feast, M.W. 1999, PASP, 111, 775
Feast, M.W., & Catchpole, R.M. 1997, MNRAS, 286, L1
Federspiel, M., Tammann, G.A., & Sandage, A. 1998, ApJ, 495, 115
Federspiel, M. 1999, Ph.D. Thesis, Univ. of Basel
Freedman, W.L., et al. 2001, ApJ, 553, 47
Giovanelli, R., et al. 1997, AJ, 113, 22
Girardi, L., & Salaris, M. 2001, MNRAS, 323, 109
Gould, A. 1994, ApJ, 426, 542
Gratton, R.G., et al. 1997, ApJ, 491, 749
Groenewegen, M.A.T., & Oudmaijer, R.D. 2000, A&A, 356, 849
Groenewegen, M.A.T., & Salaris, R.D. 2001, A&A, 366, 752
Heasley, J.N., et al. 2000, AJ, 120, 879
Hendry, M. 2001, this Conference

Cepheids, Supernovae, H0, and the Age of the Universe 15
Herrnstein, J.R., et al. 1999, Nature, 400, 539
Hoflich, P., & Khokhlov, A. 1996, ApJ, 457, 500
Kelson, D.D., et al. 2000, ApJ, 529, 768
Kennicutt, R.C., et al. 1998, ApJ, 498, 181
Kovacs, G. 2000, A&A, 363, 1
Kraan-Korteweg, R.C. 1986, A&AS, 66, 255
Madore, B., & Freedman, W.L. 1991, PASP, 103, 933
Madore, B., & Freedman, W.L. 1998, ApJ, 492, 110
Mason, B.S., Meyers, S.T., & Readhead, A.C.S. 2001, ApJ, 555, L11
Netterfield, C.B., et al. 2001, ApJ, submitted (astro-ph/0104460)
Newman, J.A., et al. 1999, ApJ, 523, 506
Panagia, N. 1999, in: New Views of the Magellanic Clouds, eds. Y.-H. Chu, N. Suntzeff, J.Hesser, & D. Bohlender, IAU Symp. 190, p. 549
Parodi, B.R., Saha, A., Sandage, A., & Tammann, G.A. 2000, ApJ, 540, 634
Pont, F. 1999, in: Harmonizing Cosmic Distance Scales in a Post-Hipparcos Era, eds. D. Egret& A. Heck, ASP Conf. Ser. 167, p. 113
Pryke, C. 2001, this Conference
Rephaeli, Y. 2001, in: Matter in the Universe, ed. R. v. Steiger (Bern: ISSI), in press
Romaniello, M., Salaris, M., Cassisi, S., & Panagia, N. 2000, ApJ, 530, 738
Saio, H., & Gautschy, A. 1998, ApJ, 498, 360
Saha, A., Sandage, A., Tammann, G.A., Dolphin, A.E., Christensen, J., Panagia, N., & Mac-chetto, F.D. 2001, ApJ, 562, 314
Sakai, S., Zwitsky, D., & Kennicutt, R.C. 2000a, AJ, 119, 1197
Sakai, S., et al. 2000b, ApJ, 529, 698
Sandage, A. 1993, AJ, 106, 719
Sandage, A. 2001, AJ, in press (paper X of the Bias Series)
Sandage, A., Bell, R.A., & Tripicco, M.J. 1999, ApJ, 522, 250
Sandage, A., & Bedke, J. 1988, Atlas of Galaxies, (NASA: Washington)
Sandage, A., & Hardy, E. 1973, ApJ, 183, 743
Sandage, A., & Tammann, G.A. 1971, ApJ, 167, 293
Sasselov, D.D., et al. 1997, A&A, 324, 471
Schlegel, D., Finkbeiner, D., & Davis, M. 1998, ApJ, 500, 525
Sneden, C., et al. 2000, ApJ, 536, L85
Tammann, G.A. 2001, in: The Century of Space Science, eds. J. Blecker, J. Geiß, & M.C.E. Hu-ber, (Dordrecht: Kluwer), in press
Tammann, G.A., & Sandage, A. 1999, in: Harmonizing Cosmic Distance Scales in a Post-Hipparcos Era, eds. D. Egret & A. Heck, ASP Conf. Ser. 167, p. 204
Tammann, G.A., Sandage, A., & Saha, A. 2000, in: A Decade of HST Science, eds. M. Livio,K. Noll & M. Stiavelli, (Cambridge: CUP), in press (astro-ph/0010422)
Tanvir, N.R., Ferguson, H.C., & Shanks, T. 1999, MNRAS, 310, 175
Theureau, G., Hanski, M., Ekholm, T., Bottinelli, L., Gouguenheim, L., Paturel, G., & Teeri-korpi, P. 1997, A&A, 322, 730
Thim, F. 2001, Ph.D. Thesis, Univ. of Basel
Udalski, A., et al. 1999, AcA, 49, 201
Van Leeuwen, F., et al. 1997, MNRAS, 287, 955
Walker, A.R. 1992, ApJ, 390, L81
Walker, A. 1999, in: Post-Hipparcos cosmic candles, eds. A. Heck & F. Caputo, (Dordrecht:Kluwer), p. 125
Westin, J., Sneden, C., Gustafsson, B., & Cowan, J.J. 2000, ApJ, 530, 783