Embed Size (px)
Citation preview

ANEJO Nº 5. PLANEAMIENTO Y TRÁFICO
Proyecto de Trazado. Autovía A-49, del V Centenario. Vía de Servicio. Acceso al Centro Hospitalario de Alto Rendimiento de la Costa Occidental de Huelva Pág. nº 1
ANEJO Nº 5. PLANEAMIENTO Y TRÁFICO

ANEJO Nº 5. PLANEAMIENTO Y TRÁFICO
Proyecto de Trazado. Autovía A-49, del V Centenario. Vía de Servicio. Acceso al Centro Hospitalario de Alto Rendimiento de la Costa Occidental de Huelva Pág. nº 2
ÍNDICE
1. ANEJO Nº 5 PLANEAMIENTO Y TRÁFICO ............................................................................................................... 3
1.1. PLANEAMIENTO URBANÍSTICO ............................................................................................................................. 3
1.2. TRAFICO ............................................................................................................................................................... 4
1.2.1. ANÁLISIS DE LA OFERTA ............................................................................................................................... 4 1.2.1.1. Datos demográficos .................................................................................................................. 4
1.2.2. DATOS DE TRÁFICO ...................................................................................................................................... 5 1.2.2.1. Aforos de la Junta de Andalucía ................................................................................................ 5 1.2.2.2. Aforos del Ministerio de Fomento ............................................................................................ 5 1.2.2.3. Mapa de ubicación de las estaciones de aforo y localización de la zona de estudio ................ 6
1.2.3. EVOLUCIÓN DEL TRÁFICO ............................................................................................................................ 7 1.2.4. ANÁLISIS DE LA DEMANDA .......................................................................................................................... 8
1.2.4.1. Datos del hospital ..................................................................................................................... 8 1.2.4.1.1. Superficies ........................................................................................................... 8 1.2.4.1.2. Consultas e intervenciones. Número de camas .................................................. 8 1.2.4.1.3. Plazas de aparcamiento ....................................................................................... 8
1.2.4.2. ESTIMACIÓN DE LA DEMANDA ATRAÍDA O GENERADA ............................................................ 8 1.2.4.2.1. Estimación de hora punta ................................................................................... 8
1.2.5. CATEGORÍAS DE TRÁFICO PESADO A EFECTOS DE DIMENSIONAMIENTO DEL FIRME ................................. 9
1.3. NIVELES DE SERVICIO ............................................................................................................................................ 9
1.3.1. DEFINICIÓN DE NIVELES DE SERVICIO .......................................................................................................... 9 1.3.2. CLASE DE CARRETERA CONVENCIONAL Y VELOCIDADES DE PROYECTO ................................................... 10 1.3.3. METODOLOGÍA .......................................................................................................................................... 10 1.3.4. NIVEL DE SERVICIO. VÍA DE SERVICIO CLASE 1 ........................................................................................... 13 1.3.5. NIVEL DE SERVICIO. VÍA DE SERVICIO CLASE 2 ........................................................................................... 14 1.3.6. CONCLUSIONES .......................................................................................................................................... 14
APÉNDICE 1. PLANO DE PLANEAMIENTO. CLASIFICACIÓN DEL SUELO RURAL .............................................................. 15

ANEJO Nº 5. PLANEAMIENTO Y TRÁFICO
Proyecto de Trazado. Autovía A-49, del V Centenario. Vía de Servicio. Acceso al Centro Hospitalario de Alto Rendimiento de la Costa Occidental de Huelva Pág. nº 3
1. ANEJO Nº 5 PLANEAMIENTO Y TRÁFICO
1.1. PLANEAMIENTO URBANÍSTICO
1.1.1. INTRODUCCIÓN
El trazado de la Vía de Servicio de Acceso al Centro Hospitalario de Alto rendimiento de la Costa Occidental de Huelva, en la “Autovía del V Centenario” (A-49, enlace p.k. 117), ocupa terrenos del término Municipal de Lepe, exclusivamente.
En este apartado de Planeamiento Urbanístico se procede a realizar el análisis de la información relativa al planeamiento urbanístico vigente en la zona afectada por la actuación y a su confrontación con el trazado diseñado para la misma.
Se describe el instrumento de planeamiento urbanístico existente así como la clasificación del suelo que se contempla en el mismo.
Para la recopilación de la información urbanística necesaria se ha procedido a efectuar consulta al Ayuntamiento de Lepe, como queda reflejado en el correspondiente apartado de Organismos Afectados del presente documento, así como a la consulta de la información disponible en la página web de del Ayuntamiento de Lepe (http://www.lepe.es/ciudad/urbanismo/planeamiento-urbanistico).
1.1.2. PLAN URBANÍSITICO DE LEPE
En el cuadro siguiente se muestra las figuras de planeamiento vigente y su fecha de aprobación definitiva, así como la fecha de su publicación en el Boletín Oficial de la Provincia de Huelva.
MUNICIPIO PLANEAMIENTO URBANÍSTICO VIGENTE
TIPO (*) FECHA APROBACIÓN DEFINITIVA FECHA PUBLICACIÓN BOP
LEPE PLAN GENERAL DE ORDENACIÓN URBANA 29/07/2008 25/02/2009
En relación con la aprobación y tramitación del PGOU, a continuación se indican las fechas más relevantes:
- 23/09/2005 y 29/12/2005.- Aprobación definitiva PARCIAL (suelo urbano y urbanizable del núcleo de Lepe).
- 29/07/2008.- Aprobación definitiva en lo relativo al suelo no urbanizable y a sectores de suelo urbanizable del litoral.
- El acuerdo de aprobación definitiva de 23/09/2005 se publica en BOP Nº 43 DE 3 DE ENERO DE 2006.
- El acuerdo de aprobación definitiva de 29/12/2005, se publica, junto con las Normas Urbanísticas en BOP de Huelva Nº 39 DE 27/02/2006.
- El PGOU aprobado con fechas 23/09 y 29/12 entra en vigor el día 17 de marzo de 2006.
- El acuerdo de aprobación definitiva de 29/07/2008 y las Normas Urbanísticas se publican en BOP de Huelva Nº 38 DE 25/02/2009.
- El PGOU aprobado con fecha 29/07/2008 entra en vigor el día 17 de marzo de 2009.
1.1.2.1.1. Plan General de Ordenación Urbana
En el Capítulo primero. “Disposiciones generales” del Título segundo “Régimen urbanístico de la propiedad del suelo” de las Normas Urbanísticas, se encuentran los artículos que definen la clasificación y calificación del suelo, haciendo especial mención a los terrenos en los que está prevista la actuación objeto del presente proyecto.
Art. 10 Régimen urbanístico
El régimen urbanístico del suelo, de acuerdo con lo establecido por la legislación vigente, se define mediante:
a) La clasificación del suelo según su régimen jurídico.
b) La determinación y regulación de la estructura general y orgánica del territorio.
c) La calificación urbanística del suelo, con su división en usos globales.
Art. 11 Clasificación del suelo
1. El territorio ordenado por este Plan General de Ordenación se clasifica a efectos del régimen jurídico del suelo y de acuerdo con lo previsto en el artículo 7 de la Ley 6/1998, de 13 de abril, de régimen del suelo y valoraciones, y 44 de la Ley 7/2002, de 17 de diciembre, de Ordenación Urbanística de Andalucía, en suelo urbano, urbanizable y no urbanizable, distinguiendo en cada una de éstas las correspondientes categorías.

ANEJO Nº 5. PLANEAMIENTO Y TRÁFICO
Proyecto de Trazado. Autovía A-49, del V Centenario. Vía de Servicio. Acceso al Centro Hospitalario de Alto Rendimiento de la Costa Occidental de Huelva Pág. nº 4
No obstante, con base en el apartado segundo del último de los artículos citados, quedan excluidos de la clasificación de suelo los terrenos afectados por los Sistemas Generales del Centro Hípico y del Centro Hospitalario contemplados en el presente Plan General. A los efectos de la valoración y obtención de los mismos, estos suelos se adscriben al suelo no urbanizable.
2. La delimitación de estas clases de suelo se hace en el plano de Clasificación del Suelo a escala 1:10.000.
3. El suelo urbanizable pasará a urbano mediante la ejecución del planeamiento parcial, en su caso, a medida que se construyan todos los elementos de la urbanización prevista en el mismo y se cumplan las obligaciones de los propietarios y agentes actuantes incluidos en él.
Art. 12 Calificaciones urbanísticas
1. Por su función en la ordenación del territorio, el Plan General califica el suelo en sistemas y zonas.
2. Se califican como sistemas aquellos suelos de interés general, que permitirán conseguir los objetivos del planeamiento en materia de vialidad, espacios libres, dotaciones y servicios.
3. Se entiende por “zona” la extensión de suelo, continua o discontinua, sometida a un régimen uniforme, donde los particulares, de acuerdo con las respectivas especificaciones para el proceso de urbanización y edificación, y desglosadas las superficies resultantes de la aplicación de los estándares urbanísticos fijados, pueden ejercer sus facultades dominicales. Dentro de algunas de ellas se pueden distinguir subzonas, con el fin de establecer una gradación en la edificabilidad u ordenación de la edificación. Se entiende por “unidad de zona” toda superficie homogéneamente calificada por este Plan General y delimitada por suelos de diferente calificación urbanística
Como se desprende del plano 3. 1 b “Calificación del suelo no urbanizable”, y del plano incluido en el Apéndice nº 1, el uso del suelo sobre los que se asentará la actuación objeto del presente proyecto es de tipo “no urbanizables de carácter natural o rural, áreas de cultivo”, y se encuentra en su práctica totalidad dentro de la “zona de protección de la A-49”, a excepción de los extremos de la vía de servicio.
Fragmento del plano 3. 1 b Calificación del suelo no urbanizable.
1.2. TRAFICO
El objeto del presente anejo es evaluar el funcionamiento del tráfico en el futuro acceso al hospital Centro Hospitalario de Alto rendimiento (CHARE) de la Costa Occidental de Huelva situado en el término municipal de Lepe. Dicho acceso se realizará por medio de la construcción de una nueva vía de servicio bidireccional de la A-49, cuyo trazado discurre por la margen derecha de la autovía iniciándose en el enlace que conecta con la N-445 (PK 117+140) hasta llegar al hospital situado a la altura del P.K. 118+650.
1.2.1. ANÁLISIS DE LA OFERTA
1.2.1.1. Datos demográficos
Dada la estrecha vinculación del hospital con Lepe, se estima conveniente el analizar en primer lugar la evolución poblacional en los últimos años del municipio. Analizando el período comprendido entre el año 2008 y el 2014, se obtiene la siguiente gráfica:

ANEJO Nº 5. PLANEAMIENTO Y TRÁFICO
Proyecto de Trazado. Autovía A-49, del V Centenario. Vía de Servicio. Acceso al Centro Hospitalario de Alto Rendimiento de la Costa Occidental de Huelva Pág. nº 5
Tomando el año final y el inicial de la serie, de la gráfica anterior se deduce una tasa de crecimiento anual del 1,30%.
1.2.2. DATOS DE TRÁFICO
1.2.2.1. Aforos de la Junta de Andalucía
En la carretera comarcal HU-4400, no se disponen de ningún aforo realizado en los últimos años. Solamente es posible estimar que la IMD va a estar comprendida entre los 1.000 y los 2.000 vehículos diarios.
1.2.2.2. Aforos del Ministerio de Fomento
Para caracterizar el tráfico de la zona se recopilan los aforos que proporcionan las estaciones gestionadas por la red estatal (Ministerio de Fomento). Se han seleccionado tres estaciones. Dos de ellas en la autovía A-49 (E-323-0 y H-267-2) y otra de cobertura (H-81-3) ubicada en la carretera nacional que comunica la A-49 con Lepe.
En la siguiente tabla se recogen los principales datos de aforo para el año 2014:
AÑO 2008 2009 2010 2011 2012 2013 2014Pob. 25.041 28.886 26.763 27.241 27.214 27.406 27.054
Período %CREC2008-2009 15,35%2009-2010 -7,35%2010-2011 1,79%2011-2012 -0,10%2012-2013 0,71%2013-2014 -1,28%
PROMEDIO -1,25%2008-2014 -6,34%
IMD 1,30%PESADOS #¡DIV/0!
tasa media anual (07-13)
25.041
28.886
26.76327.241 27.214 27.406
27.054
y = 126,07x + 26582
23.000
24.000
25.000
26.000
27.000
28.000
29.000
30.000
2008 2009 2010 2011 2012 2013 2014
Pobl
ació
nEvolución de la población de Lepe
Pob. Lineal (Pob.)
Localización Tipo IMD IMDPESADOS %PESADOS Titularidad
E-323-0 A-49 114,9 Huelva ENLACE 113 A 117 Permanente 14.420 1.106 7,67% EstatalH-267-2 A-49 119 Huelva ISLA CRISTINA Secundaria 10.475 707 6,75% EstatalH-81-3 N-445 0,5 Huelva LEPE Cobertura 4.227 182 4,31% Estatal
p.k.Estación Carretera Provincia
Aforos 2014

ANEJO Nº 5. PLANEAMIENTO Y TRÁFICO
Proyecto de Trazado. Autovía A-49, del V Centenario. Vía de Servicio. Acceso al Centro Hospitalario de Alto Rendimiento de la Costa Occidental de Huelva Pág. nº 6
1.2.2.3. Mapa de ubicación de las estaciones de aforo y localización de la zona de estudio
En el siguiente gráfico se muestran la ubicación de las estaciones de aforo de la Red de Carreteras del Estado que se han considerado para la caracterización del tráfico actual:
Hospital de Alta Resolución costa Occidental de Lepe
(CHARE)
A-49
N-445
H-80-3
Zona del proyecto

ANEJO Nº 5. PLANEAMIENTO Y TRÁFICO
Proyecto de Trazado. Autovía A-49, del V Centenario. Vía de Servicio. Acceso al Centro Hospitalario de Alto Rendimiento de la Costa Occidental de Huelva Pág. nº 7
1.2.3. EVOLUCIÓN DEL TRÁFICO
A continuación se desarrolla la evolución histórica de la IMD y la proporción de pesados durante el período 2008-2014 en cada una de estas estaciones:
Autovía A-49
Estación E-323-0
Estación H-267-2
Carretera N-445
Estación H-81-3
AÑO 2008 2009 2010 2011 2012 2013 2014IMD 17.786 17.545 15.381 15.288 13.699 13.782 14.420
PESADOS 1.876 1.675 1.274 1.019 963 996 1.106%PESADOS 10,55% 9,55% 8,28% 6,67% 7,03% 7,23% 7,67%
Período %CREC2008-2009 -1,35%2009-2010 -12,33%2010-2011 -0,60%2011-2012 -10,39%2012-2013 0,61%2013-2014 4,63%
PROMEDIO -3,62%2008-2014 -17,81%
IMD -3,44%PESADOS -8,43%
EVOLUCIÓN DEL TRÁFICO EN LA ESTACIÓN E-323-0
tasa media anual (08-14)
17.786 17.545
15.381 15.28813.699 13.782 14.420
1.876 1.675 1.274 1.019 963 996 1.106
0
2.000
4.000
6.000
8.000
10.000
12.000
14.000
16.000
18.000
20.000
2008 2009 2010 2011 2012 2013 2014
IMD
Evolución de la Estación E-323-0
IMD PESADOS
AÑO 2008 2009 2010 2011 2012 2013 2014IMD 12.318 11.113 12.040 11.269 10.213 9.830 10.475
PESADOS 1.462 905 868 804 748 690 707%PESADOS 11,87% 8,14% 7,21% 7,13% 7,32% 7,02% 6,75%
Período %CREC2008-2009 -9,78%2009-2010 8,34%2010-2011 -6,40%2011-2012 -9,37%2012-2013 -3,75%2013-2014 6,56%
PROMEDIO -0,92%2008-2014 -5,74%
IMD -2,67%PESADOS -11,40%
EVOLUCIÓN DEL TRÁFICO EN LA ESTACIÓN H-267-2
tasa media anual (08-14)
12.31811.113
12.04011.269
10.213 9.83010.475
1.462 905 868 804 748 690 707
0
2.000
4.000
6.000
8.000
10.000
12.000
14.000
2008 2009 2010 2011 2012 2013 2014
IMD
Evolución de la Estación H-267-2
IMD PESADOS
AÑO 2008 2009 2010 2011 2012 2013 2014IMD 4.499 2.889 4.399 4.483 4.021 4.161 4.227
PESADOS 198 96 177 195 132 142 182%PESADOS 4,40% 3,32% 4,02% 4,35% 3,28% 3,41% 4,31%
Período %CREC2008-2009 -35,79%2009-2010 52,27%2010-2011 1,91%2011-2012 -10,31%2012-2013 3,48%2013-2014 1,59%
PROMEDIO 9,79%2008-2014 46,31%
IMD -1,03%PESADOS -1,39%
EVOLUCIÓN DEL TRÁFICO EN LA ESTACIÓN H-81-3
tasa media anual (07-13)
4.499
2.889
4.399 4.4834.021 4.161 4.227
198 96 177 195 132 142 182
0
500
1.000
1.500
2.000
2.500
3.000
3.500
4.000
4.500
5.000
2008 2009 2010 2011 2012 2013 2014
IMD
Evolución de la Estación H-80-3
IMD PESADOS

ANEJO Nº 5. PLANEAMIENTO Y TRÁFICO
Proyecto de Trazado. Autovía A-49, del V Centenario. Vía de Servicio. Acceso al Centro Hospitalario de Alto Rendimiento de la Costa Occidental de Huelva Pág. nº 8
1.2.4. ANÁLISIS DE LA DEMANDA
1.2.4.1. Datos del hospital
Con objeto de estimar la demanda de tráfico asociada al Hospital, en este apartado se recogen a continuación datos básicos referidos al mismo procedentes del Proyecto Básico y de Ejecución del Hospital de Alta Resolución de Especialidades "Costa Occidental" en Lepe.
1.2.4.1.1. Superficies
Tabla 1. Superficies útiles Uso destinado Sup. útil neta (m2)
Urgencias 922,03 Hospitalización polivalente 815,08 Hospitalización convencional 658,15 Área quirúrgica 840,07 Consultas externas 1.222,12 Educación sanitaria 62,06 Rehabilitación 328,27 Área diagnóstica 804,70 Apoyo clínico 426,86 Área no asistencial 2.193,30 Restauración 0,00 Pasillos planta alta 707,97 Pasillos planta baja 678,82 Pasillos sótano 806,51 Espera/pasillo planta baja 345,65 Instalaciones 184,00 Total superficie útil 10.995,59
Tabla 2. Superficies construidas Usos Sup. construida (m2)
Castillete 283,35 Planta alta 3.472,72 Planta baja 6.566,54 Planta sótano 3.099,33 Total superficie útil 13.421,94
1.2.4.1.2. Consultas e intervenciones. Número de camas
La zona de hospitalización tendrá, a su vez, dos áreas diferenciadas: una con 20 habitaciones de uso individual y otra con 20 habitaciones más individuales pero con posibilidades de uso doble, mientras que el bloque quirúrgico contará con 3 quirófanos y sala de reanimación.
Tabla 3. Número de camas anual semanal Nº
consultas intervenciones consultas intervenciones camas 83.000 3.000 1.596 58 60
1.2.4.1.3. Plazas de aparcamiento
El número de plazas de aparcamiento disponibles se reparten del siguiente modo entre personal del centro y los pacientes y acompañantes:
Tabla 4. Número de plazas de aparcamiento Nº plazas aparcamiento
Personal Pacientes y acompañantes total 67 196 263
25,48% 74,52% 100%
1.2.4.2. ESTIMACIÓN DE LA DEMANDA ATRAÍDA O GENERADA
En base a los datos anteriores se procede a estimar la demanda atraída o generada por el hospital. Para ello se aplica la metodología incluida en el Trip Generation Manual 8th Edition. Este manual proporciona estadísticas utilizadas en el cálculo de ratios de generación de vehículos para una amplia variedad de usos del suelo, basado en la experiencia de más de 4.000 estudios de generación de viajes.
Para el caso que nos ocupa, la parcela va a destinar a un único uso del suelo, que se corresponde con el código 610 (“Hospital 610”). Para dicho uso, este método contempla tres diferentes parámetros para estimar la generación de viajes: superficie construida, Nº de empleados y Nº de camas. Para estimar el número de empleados se ha considerado que existe una relación de 0,5 trabajadores/plaza de aparcamiento.
Tabla 5. Estimación del tráfico atraído y generado por el CHARE (Trip Generation)
(*) KSF2 = Units of 1.000 square feet.
De los tres parámetros considerados se adopta el que mayor número de viajes genera, que en este caso es la superficie construida. Por lo que se estima que la IMD generada y atraída por el hospital será de 2.383 veh/d.
1.2.4.2.1. Estimación de hora punta
Este método permite estimar las intensidades de hora punta de mañana y de tarde. La proporción (%) respecto a la IMD obtenida en anteriormente se muestra en la siguiente tabla:
Superficie 13.421,94 m2 610KSF2 Hospital 610 144,5 KSF2 16,5 2.383Nº de Camas 60 camas 610Beds Hospital 610 60 Beds 11,8 708
Nº empleados 140 empleados 610Employees Hospital 610 140 Employees 5,2 728
ratio veh/d (trip
IMDunidadCriterio de estimación ID (Trip generation) Uso de suelo (Trip
N(trip generation)
unidad
ANEJO Nº 5. PLANEAMIENTO Y TRÁFICO
Proyecto de Trazado. Autovía A-49, del V Centenario. Vía de Servicio. Acceso al Centro Hospitalario de Alto Rendimiento de la Costa Occidental de Huelva Pág. nº 9
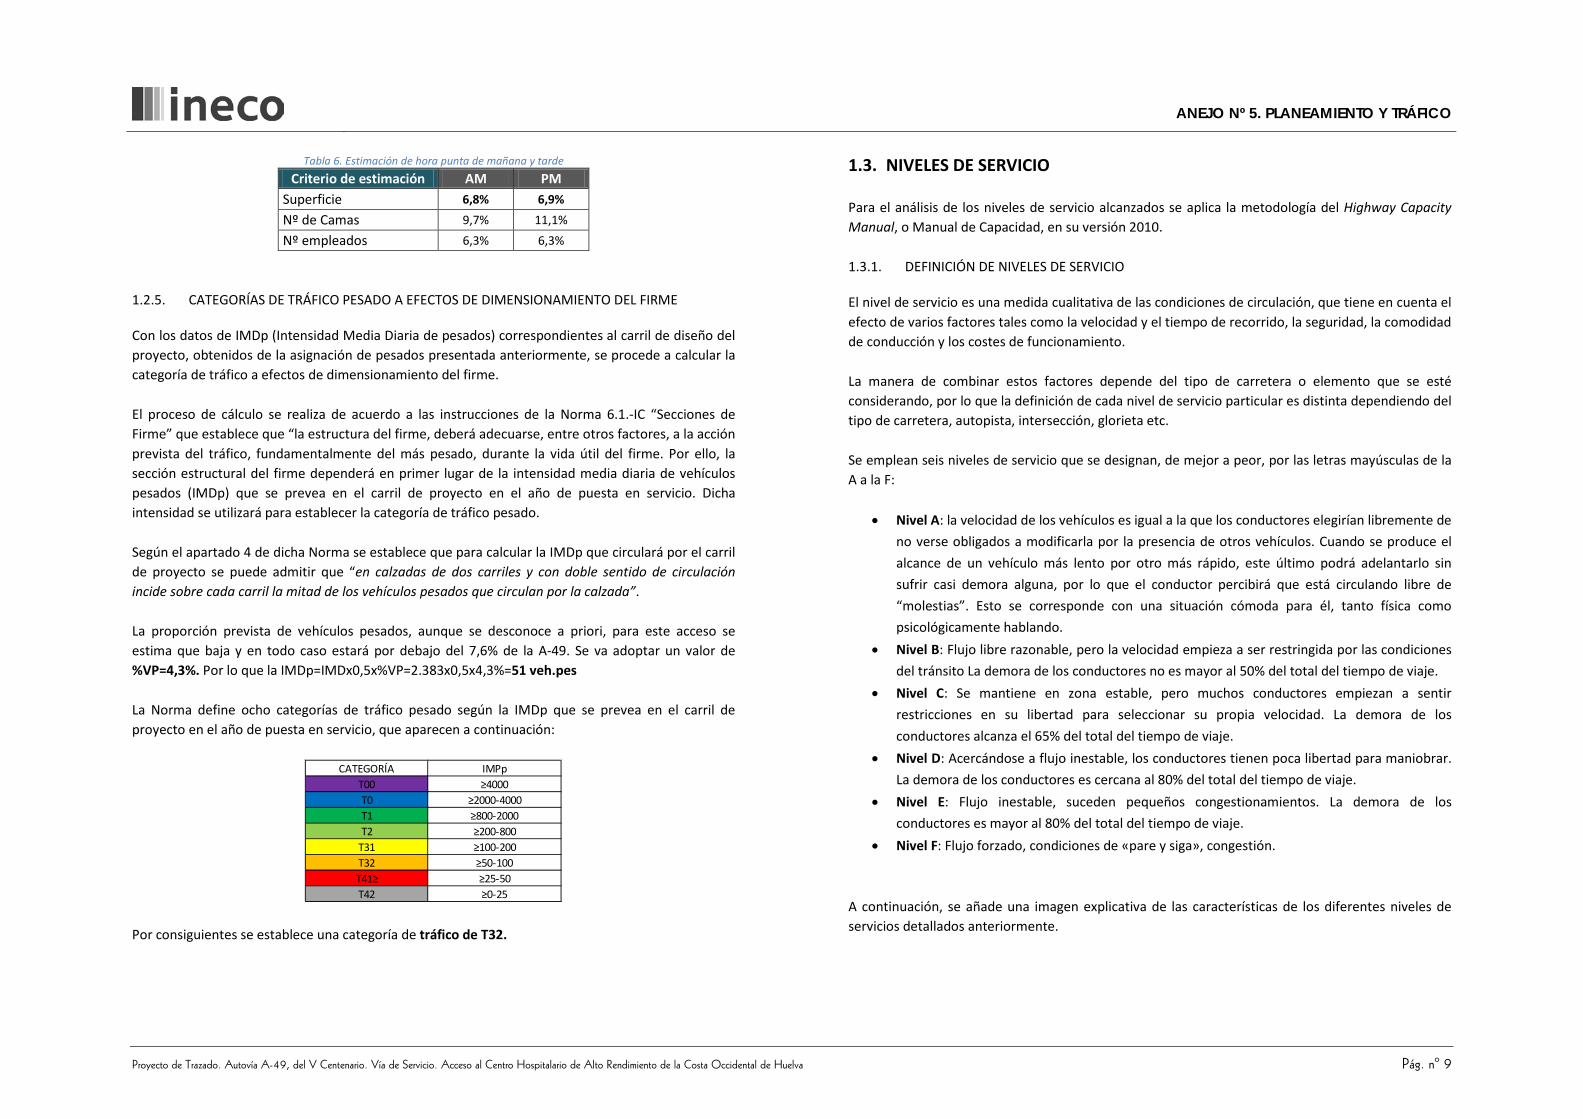
Tabla 6. Estimación de hora punta de mañana y tarde Criterio de estimación AM PM
Superficie 6,8% 6,9% Nº de Camas 9,7% 11,1% Nº empleados 6,3% 6,3%
1.2.5. CATEGORÍAS DE TRÁFICO PESADO A EFECTOS DE DIMENSIONAMIENTO DEL FIRME
Con los datos de IMDp (Intensidad Media Diaria de pesados) correspondientes al carril de diseño del proyecto, obtenidos de la asignación de pesados presentada anteriormente, se procede a calcular la categoría de tráfico a efectos de dimensionamiento del firme.
El proceso de cálculo se realiza de acuerdo a las instrucciones de la Norma 6.1.-IC “Secciones de Firme” que establece que “la estructura del firme, deberá adecuarse, entre otros factores, a la acción prevista del tráfico, fundamentalmente del más pesado, durante la vida útil del firme. Por ello, la sección estructural del firme dependerá en primer lugar de la intensidad media diaria de vehículos pesados (IMDp) que se prevea en el carril de proyecto en el año de puesta en servicio. Dicha intensidad se utilizará para establecer la categoría de tráfico pesado.
Según el apartado 4 de dicha Norma se establece que para calcular la IMDp que circulará por el carril de proyecto se puede admitir que “en calzadas de dos carriles y con doble sentido de circulación incide sobre cada carril la mitad de los vehículos pesados que circulan por la calzada”.
La proporción prevista de vehículos pesados, aunque se desconoce a priori, para este acceso se estima que baja y en todo caso estará por debajo del 7,6% de la A-49. Se va adoptar un valor de %VP=4,3%. Por lo que la IMDp=IMDx0,5x%VP=2.383x0,5x4,3%=51 veh.pes
La Norma define ocho categorías de tráfico pesado según la IMDp que se prevea en el carril de proyecto en el año de puesta en servicio, que aparecen a continuación:
Por consiguientes se establece una categoría de tráfico de T32.
1.3. NIVELES DE SERVICIO
Para el análisis de los niveles de servicio alcanzados se aplica la metodología del Highway Capacity Manual, o Manual de Capacidad, en su versión 2010.
1.3.1. DEFINICIÓN DE NIVELES DE SERVICIO
El nivel de servicio es una medida cualitativa de las condiciones de circulación, que tiene en cuenta el efecto de varios factores tales como la velocidad y el tiempo de recorrido, la seguridad, la comodidad de conducción y los costes de funcionamiento.
La manera de combinar estos factores depende del tipo de carretera o elemento que se esté considerando, por lo que la definición de cada nivel de servicio particular es distinta dependiendo del tipo de carretera, autopista, intersección, glorieta etc.
Se emplean seis niveles de servicio que se designan, de mejor a peor, por las letras mayúsculas de la A a la F:
• Nivel A: la velocidad de los vehículos es igual a la que los conductores elegirían libremente de no verse obligados a modificarla por la presencia de otros vehículos. Cuando se produce el alcance de un vehículo más lento por otro más rápido, este último podrá adelantarlo sin sufrir casi demora alguna, por lo que el conductor percibirá que está circulando libre de “molestias”. Esto se corresponde con una situación cómoda para él, tanto física como psicológicamente hablando.
• Nivel B: Flujo libre razonable, pero la velocidad empieza a ser restringida por las condiciones del tránsito La demora de los conductores no es mayor al 50% del total del tiempo de viaje.
• Nivel C: Se mantiene en zona estable, pero muchos conductores empiezan a sentir restricciones en su libertad para seleccionar su propia velocidad. La demora de los conductores alcanza el 65% del total del tiempo de viaje.
• Nivel D: Acercándose a flujo inestable, los conductores tienen poca libertad para maniobrar. La demora de los conductores es cercana al 80% del total del tiempo de viaje.
• Nivel E: Flujo inestable, suceden pequeños congestionamientos. La demora de los conductores es mayor al 80% del total del tiempo de viaje.
• Nivel F: Flujo forzado, condiciones de «pare y siga», congestión.
A continuación, se añade una imagen explicativa de las características de los diferentes niveles de servicios detallados anteriormente.
CATEGORÍA IMPpT00 ≥4000T0 ≥2000-4000T1 ≥800-2000T2 ≥200-800
T31 ≥100-200T32 ≥50-100T41≥ ≥25-50T42 ≥0-25

ANEJO Nº 5. PLANEAMIENTO Y TRÁFICO
Proyecto de Trazado. Autovía A-49, del V Centenario. Vía de Servicio. Acceso al Centro Hospitalario de Alto Rendimiento de la Costa Occidental de Huelva Pág. nº 10
Niveles de servicio-Descripción de circulación
Se exponen a continuación las diferentes metodologías a utilizar según las secciones anteriormente comentadas:
1.3.2. CLASE DE CARRETERA CONVENCIONAL Y VELOCIDADES DE PROYECTO
En primer lugar se va a establecer la clase de carretera convencional que corresponde al tramo de carretera proyectado de acuerdo a sus características.
El Manual de capacidad considera tres clases para el análisis de carreteras convencionales, dependiendo de su funcionalidad. Las clases consideradas son:
a) Clase I, tienen como función el facilitar la movilidad a velocidades relativamente altas, como las que forman la red principal interurbana.
b) Clase II, no tiene porqué facilitar el desarrollo de altas velocidades, bien por su función complementaria de las de categoría I, o por discurrir por terrenos accidentados, tener carácter turístico, etc.
c) Clase III, son las travesías de población y carreteras que discurren dentro de zonas urbanizadas.
En el caso que nos ocupa, la velocidad de proyecto de la vía de servicio es Vp=60 km/h. Como en este caso particular, a priori no está del todo claro cuál sería la clase de la carretera correspondiente, en principio se va a realizar el cálculo considerando las dos primeras clases (clase I y clase II).
1.3.3. METODOLOGÍA
En general, existen parámetros que se utilizan para evaluar el nivel de servicio desde dos puntos de vista:
• Velocidad media que es posible desarrollar en la vía (ATS). • Proporción del tiempo que se emplea siguiendo a otro vehículo (PTSF).
Para una carretera de clase II, el análisis se reduce a estudiar este último parámetro.
Los pasos de cálculo son los siguientes:
1) Estimar la velocidad libre de flujo FFS
En primer lugar, hay que estimar la velocidad libre de flujo mediante la siguiente fórmula:
Siendo:
- BFFS= Velocidad libre de flujo base (km/h). Este valor puede estimarse como la velocidad de proyecto Vp=60 km/h.
- fLS=Factor de reducción por anchura de carril (tabla 15-7 adaptada a km/h)
Tabla 15-7. fLS
Fuente: Elaboración propia a partir del HCM-2010
NIVEL DE SERVICIO
CONDICIONES DE FLUJO
Alta calidad de servicio. El tráfico fluye libremente con poca o ninguna restricción de velocidad o maniobra.
No hay demoras
El tráfico es estable y fluye libremente. La capacidad de maniobra se encuentra tan solo levemente restringida.
No hay demoras
Se mantiene en zona estable, pero muchos conductores empiezan a sentir restricciones en su libertad para seleccionar su propia velocidad, y la libertad de maniobra está restringida. Los conductores deben ser más cuidadosos en los cambios de carril.
Demoras mínimas
La velocidad disminuye ligeramente y aumenta la densidad. La libertad de maniobra se encuentra notablemente limitada.
Demoras mínimas
Proximidad de los vehículos entre sí, con poco espacio para maniobras. La comodidad de los conductores es escasa.
Demoras significativas
Tráfico muy congestionado con atascos, especialmente en áreas donde los vehículos confluyen.
Demoras significativas
D
E
F
C
DESCRIPCIÓN DE CIRCULACIÓN
A
B
≥0-0,6 ≥0,6-1,2 ≥1,2-1,8 ≥1,8≥2,7-3 10,30 7,73 5,64 3,54
≥3-3,3 8,53 5,96 3,86 1,77
≥3,3-3,6 7,57 4,83 2,74 0,64
≥3,6 6,76 4,19 2,09 0,00
Ancho arcén (m)
Anch
o de
car
ril (m
)
f LS - Reducción en la FFS (km/h)
ALS ffBFFSFFS −−=

ANEJO Nº 5. PLANEAMIENTO Y TRÁFICO
Proyecto de Trazado. Autovía A-49, del V Centenario. Vía de Servicio. Acceso al Centro Hospitalario de Alto Rendimiento de la Costa Occidental de Huelva Pág. nº 11
- fA=Factor de reducción por puntos de acceso (tabla 15-8 adaptada a km/h)
Tabla 15-8. fA
Fuente: Adaptación del HCM-2010
Según la expresión anterior la velocidad de flujo libre FFS viene expresada en km/h. Pero para poder operar con este parámetro hay pasarlos a mil/h dividiendo el valor entre 1,61.
2) Intensidades equivalentes (Vp=Vd+Vo)
A continuación, se determinan las intensidades en vehículos equivalentes que intervendrán en los cálculos, tanto para estimar la ATS como para determinar el PTSF. Si se define Vp el flujo equivalente por hora considerando ambos sentidos:
VPGp ffFHP
IHV⋅⋅
=
Siendo:
− Vp= Intensidad Horaria en vehículos ligeros equivalentes, correspondiente a la tasa del cuarto de hora de mayor tráfico, total de calzada, en veh/h.
− FHP=Factor de Hora Punta.
− fG= Factor de ajuste por pendiente para determinar el porcentaje de tiempo de seguimiento. Se pueden obtener de tabla 15-16 para el PTSF:
− ft=Factor de corrección debido al tipo de terreno (tabla 15-16).
Tabla 15-16. fG (PTSF)
Fuente: Highway Capacity Manual 2010
fVP=Factor de ajuste por el efecto de los vehículos pesados (tabla 15-19).
Siendo:
Pc el porcentaje de camiones, PR el de vehículos de recreo; Ec el equivalente de camiones y ER el equivalente de vehículos de recreo (tabla 15-18).
Tabla 15-18. Ec (PTSF)
Tipo de vehículo
Intensidad por sentido analizado
(veh/h)
Terreno Llano
Terreno Ondulado
Camiones, EC
≤100 1,1 1,9 200 1,1 1,8 300 1,1 1,7 400 1,1 1,6 500 1,0 1,4 600 1,0 1,2 700 1,0 1,0 800 1,0 1,0 ≥900 1,0 1,0
EVR todos 1,0 1,0 Fuente: Highway Capacity Manual 2010
06
121824
8,112,116,1
f A (Km/h)Densidad de accesos en ambas direcciones
(enlaces/Km)
0,04,0
Intensidad por sentido analizado
(veh/h)
Terreno Llano
Terreno Ondulado
≤100 1,00 0,73200 1,00 0,80300 1,00 0,85400 1,00 0,90500 1,00 0,96600 1,00 0,97700 1,00 0,99800 1,00 1,00≥900 1,00 1,00

ANEJO Nº 5. PLANEAMIENTO Y TRÁFICO
Proyecto de Trazado. Autovía A-49, del V Centenario. Vía de Servicio. Acceso al Centro Hospitalario de Alto Rendimiento de la Costa Occidental de Huelva Pág. nº 12
En todos los casos, analizando el sentido más cargado y considerando un reparto por sentidos de 50/50 en la hora punta y un terreno llano, el rango de intensidades por sentido va a ser inferior a 100 veh/h, por lo que entrando en las tablas correspondientes se tiene que ft=1,0 (tabla 15-16) y EC=1,1 (tabla 15-18).
Una vez calculada la intensidad horaria equivalente (Vp) se compara con la capacidad de una carretera de dos carriles, que es de 1.700 veh/h por sentido de circulación y de 3.200 veh/h para ambos sentidos. De esta forma se deben cumplir en la hora punta las premisas:
− Vp (ambos sentidos) <3.200 veh/h
− Vp*(Coef.reparto sentido más cargado) <1.700 veh/h/carril
Si no se cumplen ambas se continúa el estudio el nivel de servicio es el F (la intensidad rebasa la capacidad), en caso contrario, se continúa el estudio descomponiendo la intensidad en ambos sentidos en dos:
odp VVV +=
Cálculo de PTSF
El cálculo del porcentaje del tiempo siguiente a otro vehículo para el sentido de circulación determinado (d) vendrá dado por la siguiente fórmula:
++=
PTSFoPTSFd
PTSFdPTSFnpdd vv
vfBPTSFPTSF
,,
,,
Siendo:
− BPTSFd: Porcentaje de tiempo básico de persecución.
Para hallar el denominado porcentaje de tiempo básico de persecución (BPTSFd) en la dirección de análisis el Manual establece la siguiente ecuación:
( ))(1100bdva
d eBPTSF ⋅−⋅=
Donde a y b son coeficientes obtenidos a partir de la tabla 15-20 del Manual, entrando con la intensidad del sentido opuesto Vo (veh/h)
Fuente: Highway Capacity Manual 2010
− fnp,PTSF: El factor de ajuste (fd/np) se obtiene a partir de las tablas 15-21 y representa el efecto combinado del reparto por sentidos del tráfico y la proporción de zonas con prohibición de adelantamiento. Para un reparto del 50% la tabla sería la siguiente:
Nivel de servicio
Finalmente, el nivel de servicio queda determinado atendiendo a los criterios indicados la siguiente tabla:
Nivel de servicio
Clase II Porcentaje de tiempo circulando en cola detrás de un vehículos lento.
PTSF (%) A ≤40 B >35-55 C >55-70 D >70-85 E >85
F Si una o en ambas direcciones la demanda excede la capacidad
Intensidad opuestaVo (veh/h)
≤200 -0,0014 0,973400 -0,0022 0,923600 -0,0033 0,87800 -0,0045 0,833
1.000 -0,0049 0,8291.200 -0,0054 0,8251.400 -0,0058 0,821≥1,600 -0,0062 0,817
a b
Intensidad (veh/d) % de zonas con prohibición de adelantarVp=Vd+Vo 0 20 40 60 80 100
200 9,0 29,2 43,4 49,4 51,0 52,6400 16,2 41,0 54,2 61,6 63,8 65,8600 15,8 38,2 47,8 53,2 55,2 56,8800 15,8 33,8 40,4 44,0 44,8 46,61400 12,8 20,0 23,8 26,2 27,4 28,62000 10,0 13,6 15,8 17,4 18,2 18,82600 5,5 7,7 8,7 9,5 10,1 10,33200 3,3 4,7 5,1 5,5 5,7 6,1

ANEJO Nº 5. PLANEAMIENTO Y TRÁFICO
Proyecto de Trazado. Autovía A-49, del V Centenario. Vía de Servicio. Acceso al Centro Hospitalario de Alto Rendimiento de la Costa Occidental de Huelva Pág. nº 13
Parámetros e hipótesis de cálculo adoptados
Una vez expuesta metodología de cálculo a aplicar, se resumen a continuación las hipótesis de cálculo que se van a adoptar en los cálculos:
- Se establece un valor de la intensidad de hora punta del 6,9% de la IMD, que corresponde a la hora punta de la tarde.
Tabla 7. Porcentaje de la hora punta Weekday AM PM
16,5 1,12 1,14
K (IHP/IMD) 6,79% 6,91% Fuente: Trip Generation Manual 8th Edition
Con lo que la intensidad en hora punta será:
hvehIHPpm /165691,0383.2 =×=
- Se ha considerado un reparto por sentidos de 50% para la hora punta.
- El porcentaje de tramos de prohibición de adelantamiento adoptado es del 100%.
- El porcentaje de pesados estimado para la hora punta en el tramo objeto de estudio es de 4,3%. Adicionalmente, para considerar el efecto sobre el tráfico de las ambulancias, se ha asimilado a lo que el cálculo denomina “vehículos de recreo”, adoptando otro 4%.
- Se ha tomado un factor de hora punta (FHP) de 0,88.
- Terreno llano. Con lo que el valor de EC=1,1.
- Velocidad de proyecto, Vp=60 km/h (37,2 mi/h). Como el método limita a la velocidad de flujo libre (BFFS) al intervalo de valores entre 45 y 70 mi/h, se toma el valor mínimo de 45 mi/h.
- Clase de carretera: Clase I y II.
A continuación se recoge el cálculo detallado del nivel de servicio conforme al Manual de Capacidad 2010. Si se considera una clase I, el nivel de servicio obtenido en la vía de servicio sería D, mientras que si se considera que tiene clase II el nivel de servicio resultante sería A. Como se espera que no se alcancen velocidades altas (salvo en el caso de las ambulancias que acudan a urgencias), se pude concluir que la vía de servicio se ajustará más a una carretera de clase II y, por tanto, el acceso tendrá capacidad suficiente y funcionará adecuadamente (nivel A) durante la hora punta.
1.3.4. NIVEL DE SERVICIO. VÍA DE SERVICIO CLASE 1
HCS 2010: Two-Lane Highways Release 6.3 _________________Directional Two-Lane Highway Segment Analysis________________ Analyst CLASE 1 Agency/Co. INECO Date Performed 19/06/2016 Analysis Time Period Highway Autovía A-49. Acceso CHARE From/To N-445 (PK 117+140)- P.K. 118+6 Jurisdiction Analysis Year Description Vía de Servicio. Acceso al Centrnú·B __________________________________Input Data__________________________________ Highway class Class 1 Peak hour factor, PHF 0.88 Shoulder width 6.0 ft % Trucks and buses 4 % Lane width 12.0 ft % Trucks crawling 0.0 % Segment length 0.0 mi Truck crawl speed 0.0 mi/hr Terrain type Level % Recreational vehicles 4 % Grade: Length - mi % No-passing zones 100 % Up/down - % Access point density 0 /mi Analysis direction volume, Vd 82 veh/h Opposing direction volume, Vo 82 veh/h ____________________________Average Travel Speed______________________________ Direction Analysis(d) Opposing (o) PCE for trucks, ET 1.9 1.9 PCE for RVs, ER 1.0 1.0 Heavy-vehicle adj. factor,(note-5) fHV 0.965 0.965 Grade adj. factor,(note-1) fg 1.00 1.00 Directional flow rate,(note-2) vi 97 pc/h 97 pc/h Free-Flow Speed from Field Measurement: Field measured speed,(note-3) S FM - mi/h Observed total demand,(note-3) V - veh/h Estimated Free-Flow Speed: Base free-flow speed,(note-3) BFFS 45.0 mi/h Adj. for lane and shoulder width,(note-3) fLS 0.0 mi/h Adj. for access point density,(note-3) fA 0.0 mi/h Free-flow speed, FFSd 45.0 mi/h Adjustment for no-passing zones, fnp 2.4 mi/h Average travel speed, ATSd 41.1 mi/h Percent Free Flow Speed, PFFS 91.3 % _________________________Percent Time-Spent-Following_________________________ Direction Analysis(d) Opposing (o) PCE for trucks, ET 1.1 1.1 PCE for RVs, ER 1.0 1.0 Heavy-vehicle adjustment factor, fHV 0.996 0.996 Grade adjustment factor,(note-1) fg 1.00 1.00 Directional flow rate,(note-2) vi 94 pc/h 94 pc/h Base percent time-spent-following,(note-4) BPTSFd 11.0 % Adjustment for no-passing zones, fnp 52.6 Percent time-spent-following, PTSFd 37.3 % ________________Level of Service and Other Performance Measures_______________ Level of service, LOS D Volume to capacity ratio, v/c 0.06 Peak 15-min vehicle-miles of travel, VMT15 0 veh-mi Peak-hour vehicle-miles of travel, VMT60 0 veh-mi Peak 15-min total travel time, TT15 0.0 veh-h Capacity from ATS, CdATS 1641 veh/h Capacity from PTSF, CdPTSF 1693 veh/h Directional Capacity 1641 veh/h

ANEJO Nº 5. PLANEAMIENTO Y TRÁFICO
Proyecto de Trazado. Autovía A-49, del V Centenario. Vía de Servicio. Acceso al Centro Hospitalario de Alto Rendimiento de la Costa Occidental de Huelva Pág. nº 14
1.3.5. NIVEL DE SERVICIO. VÍA DE SERVICIO CLASE 2
HCS 2010: Two-Lane Highways Release 6.3 Analyst: CLASE II Agency/Co. INECO Date Performed 19/06/2016 Analysis Time Period Highway Autovía A-49. Acceso Hospital CHARE From/To N-445 (PK 117+140)- P.K. 118+6 Jurisdiction Analysis Year Description Vía de Servicio. Acceso al Centro Hospitalario de Alto Rendimiento (CHARE) __________________________________Input Data__________________________________ Highway class Class 2 Peak hour factor, PHF 0.88 Shoulder width 6.0 ft % Trucks and buses 4 % Lane width 12.0 ft % Trucks crawling 0.0 % Segment length 0.0 mi Truck crawl speed 0.0 mi/hr Terrain type Level % Recreational vehicles 4 % Grade: Length - mi % No-passing zones 100 % Up/down - % Access point density 0 /mi Analysis direction volume, Vd 82 veh/h Opposing direction volume, Vo 82 veh/h ____________________________Average Travel Speed______________________________ Direction Analysis(d) Opposing (o) PCE for trucks, ET 1.9 1.9 PCE for RVs, ER 1.0 1.0 Heavy-vehicle adj. factor,(note-5) fHV 0.965 0.965 Grade adj. factor,(note-1) fg 1.00 1.00 Directional flow rate,(note-2) vi 97 pc/h 97 pc/h Free-Flow Speed from Field Measurement: Field measured speed,(note-3) S FM - mi/h Observed total demand,(note-3) V - veh/h Estimated Free-Flow Speed: Base free-flow speed,(note-3) BFFS 45.0 mi/h Adj. for lane and shoulder width,(note-3) fLS 0.0 mi/h Adj. for access point density,(note-3) fA 0.0 mi/h Free-flow speed, FFSd 45.0 mi/h Adjustment for no-passing zones, fnp 2.4 mi/h Average travel speed, ATSd 41.1 mi/h Percent Free Flow Speed, PFFS 91.3 % _________________________Percent Time-Spent-Following_________________________ Direction Analysis(d) Opposing (o) PCE for trucks, ET 1.1 1.1 PCE for RVs, ER 1.0 1.0 Heavy-vehicle adjustment factor, fHV 0.996 0.996 Grade adjustment factor,(note-1) fg 1.00 1.00 Directional flow rate,(note-2) vi 94 pc/h 94 pc/h Base percent time-spent-following,(note-4) BPTSFd 11.0 % Adjustment for no-passing zones, fnp 52.6 Percent time-spent-following, PTSFd 37.3 % ________________Level of Service and Other Performance Measures_______________ Level of service, LOS A Volume to capacity ratio, v/c 0.06 Peak 15-min vehicle-miles of travel, VMT15 0 veh-mi Peak-hour vehicle-miles of travel, VMT60 0 veh-mi Peak 15-min total travel time, TT15 0.0 veh-h Capacity from ATS, CdATS 1641 veh/h Capacity from PTSF, CdPTSF 1693 veh/h Directional Capacity
1.3.6. CONCLUSIONES
De los resultados obtenidos se desprende que el funcionamiento del acceso al hospital va a ser adecuado, ya que tanto si, se considera que la vía de servicio es de clase I (con nivel de servicio C), como al considerarla de clase II (nivel de servicio A), estaría por debajo del nivel E requerido en el artículo 7.3.1. de la Norma 3.1-IC.
TABLA 7.1. Niveles máximos de servicio en el año horizonte. Apartado 7.3.1 de la Norma 3.1 IC
ANEJO Nº 5. PLANEAMIENTO Y TRÁFICO
Proyecto de Trazado. Autovía A-49, del V Centenario. Vía de Servicio. Acceso al Centro Hospitalario de Alto Rendimiento de la Costa Occidental de Huelva Pág. nº 15
APÉNDICE 1. PLANO DE PLANEAMIENTO. CLASIFICACIÓN DEL SUELO RURAL

A-49
AYAMONTE HUELVA
Centro Hospitalariode Alto Rendimiento
0+70
0
0+80
00+90
01+00
0
1+33
9.26
0+039.83
0+02
7.00
1+10
0
1+20
0
1+30
0
0+100
0+000
0+00
0
0+00
0
0+079.73
0+000.000+125.66
EJE - 2
EJE - 6
EJE - 4
EJE - 3
EJE - 7
P.K.1+170
ODT - 07Ø1800
P.K.1+018
ODT - 06Ø1800
P.K.0+922
ODT - 05Ø1800
P.K.0+732
ODT - 04# 2.5x2.5
A DEMOLEREXISTENTE
ODT 05EXISTENTE
ODT 04EXISTENTE
EJE 4
ODT - 08Ø1500mm
FINAL PROYECTO
ODT 06
A DEMOLER
ODT 03EXISTENTE
PLANEAMIENTO Y TRÁFICO
T7-H-5020/ AGOSTO 2016
inecoMINISTERIODE FOMENTO
GOBIERNODE ESPAÑA
SECRETARÍA GENERAL DE INFRAESTRUCTURASDIRECCIÓN GENERAL DE CARRETERAS
SECRETARÍA DE ESTADO DE INFRAESTRUCTURAS, TRANSPORTE Y VIVIENDA
DEMARCACIÓN DE CARRETERAS DEL ESTADO EN ANDALUCÍA OCCIDENTALACCESO AL CENTRO HOSPITALARIO DE ALTO
AUTOVÍA A-49 DEL V CENTENARIO. VÍA DE SERVICIO,PROYECTO DE TRAZADO Y CONSTRUCCIÓN
RENDIMIENTO DE LA COSTA OCCIDENTAL DE HUELVA/17-H-5020
A-49
N-445
LEYENDA DE CALIFICACIÓN DEL SUELO
ÁREAS DE CULTIVO
DOTACIONES COMUNITARIAS ENSUELO NO URBANIZABLE
BALSAS
ZONAS DE PROTECCIÓN DEINFRAESTRUCTURAS (CARRETERAS, CANALES)
NO URBANIZABLE

A-49
E-1A A-22
V a s c o g i l
A-49
AYAMONTE HUELVAHU-4400
0+00
0
0+100
0+20
0
0+30
0
0+40
0
0+50
0
0+60
0
0+70
0
INICIO PROYECTO
PROYECTO DE CONSTRUCCIÓNDE GLORIETAS EN ENLACE TIPO DIAMANTE
DE LA A-49 PK 117.100 TRAMO:
EJE - 2
ENLACE HUELVA NORTE-ENLACE LEPE OESTE
P.K.0+571
ODT - 03Ø1800mm
P.K.0+330
ODT - 02Ø1800mm
P.K.0+127
ODT - 01Ø1800mm
ODT 02EXISTENTE
ODT 00EXISTENTEA DEMOLER
ODT 01EXISTENTE
CAMINO DE ACCESOA FINCA
PLANEAMIENTO Y TRÁFICO
T7-H-5020/ AGOSTO 2016
inecoMINISTERIODE FOMENTO
GOBIERNODE ESPAÑA
SECRETARÍA GENERAL DE INFRAESTRUCTURASDIRECCIÓN GENERAL DE CARRETERAS
SECRETARÍA DE ESTADO DE INFRAESTRUCTURAS, TRANSPORTE Y VIVIENDA
DEMARCACIÓN DE CARRETERAS DEL ESTADO EN ANDALUCÍA OCCIDENTALACCESO AL CENTRO HOSPITALARIO DE ALTO
AUTOVÍA A-49 DEL V CENTENARIO. VÍA DE SERVICIO,PROYECTO DE TRAZADO Y CONSTRUCCIÓN
RENDIMIENTO DE LA COSTA OCCIDENTAL DE HUELVA/17-H-5020
LEYENDA DE CALIFICACIÓN DEL SUELO
ÁREAS DE CULTIVO
DOTACIONES COMUNITARIAS ENSUELO NO URBANIZABLE
BALSAS
ZONAS DE PROTECCIÓN DEINFRAESTRUCTURAS (CARRETERAS, CANALES)
NO URBANIZABLE
A-49
N-445