Embed Size (px)
Citation preview

And the Survey Says: Overview to 2010 Tompkins County
Youth Development SurveyICSD & Tompkins County
Presented by:
Kris Bennett, CCHY
Community Coalition for Healthy Youth c/o Tompkins County Youth Services Dept.320 W. ML King Jr./State St., Ithaca • 274-5310 • www.healthyyouth.org

Survey facts
• Adapted from existing survey by NY OASAS in 2008; given across NYS in late 2008; repeated in Tompkins in late 2010
• Locally, 6 Tompkins districts participated in Oct. 2010:– Dryden, Groton, Ithaca, Lansing, Newfield, Tburg.– Grades 6-12 (some districts surveyed only 7-12)– Total of 4,788 students, 82% participation rate– ICSD – 2,145 students, 79% participation rate

• 51% male, 49% female
• 65% White
• 10% Multi Racial
• 10% Asian American
• 7% Black/African American
• 8% Other
Participating ICSD students
Risk and Protective Factors
Risk and protective factors
Risk and protective factors are organized by
the domains where youth live & interact:
– Community– Family– School– Individual/peer

Risk factors
Conditions that increase the likelihood of a young person becoming involved in drug use, delinquency, teen pregnancy, school drop out, and/or violence

Protective factors (assets)Community opportunities for prosocial involvement
Community rewards for prosocial involvement
Family opportunities for prosocial involvement
Family rewards for prosocial involvement
Family attachment
School opportunities for prosocial involvement
School prosocial involvement
School rewards for prosocial involvement
Religiosity
Belief in the moral order
Social Skills
Conditions that buffer young persons from exposure to risk either by reducing the impact of the risks or changing the way the youth responds to risks
Why Risk & Protective?
• Research based
• By measuring risk and protective factors, risk factors that are elevated can be identified and targeted with prevention interventions and protective factors can be enhanced– Example: If academic failure is identified as an
elevated risk factor, mentoring and tutoring interventions can be provided

Risk & Protective Factors among ICSD students

Strong protective factors
Community• Opportunities for prosocial involvement
– ICSD 79%, Tompkins 79%
• Rewards for prosocial involvement– ICSD 38%, Tompkins 41%
• Translation:Young people say they have chances to participate in positive community activities and the community recognizes and encourages them to do their best.

Strong protective factors
School• School opportunities for prosocial involvement
– ICSD 88%, Tompkins 87%
• School rewards for prosocial involvement– ICSD 61%, Tompkins 60%
• Translation:
Youth say they have chances to participate meaningfully in important activities at school and that the school recognizes them for doing well.

Strong protective factors
Family• Family opportunities for prosocial involvement
– ICSD 60%, Tompkins 58%
• Family rewards for prosocial involvement– ICSD 58%, Tompkins 56%
• Translation:
Over half of ICSD youth report that their families notice and praise them when they do a good job; they also report that they enjoy spending time with their parents.

Strong protective factors
Individual/peer• Belief in a moral order
– ICSD 70%, Tompkins 70%
• Social skills– ICSD 66%, Tompkins 65%
• Translation: Most youth have strong beliefs in what is “right” or “wrong” and value honesty. They are socially competent with peers and have skills to resist negative peer pressure.
.
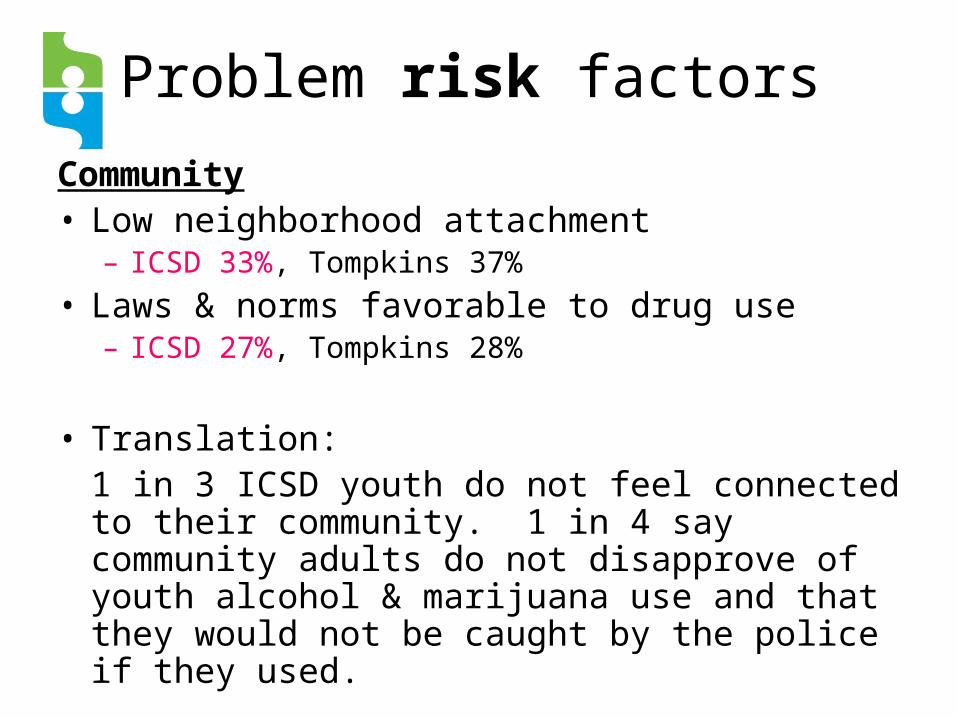
Problem risk factors
Community• Low neighborhood attachment
– ICSD 33%, Tompkins 37%
• Laws & norms favorable to drug use– ICSD 27%, Tompkins 28%
• Translation: 1 in 3 ICSD youth do not feel connected to their community. 1 in 4 say community adults do not disapprove of youth alcohol & marijuana use and that they would not be caught by the police if they used.
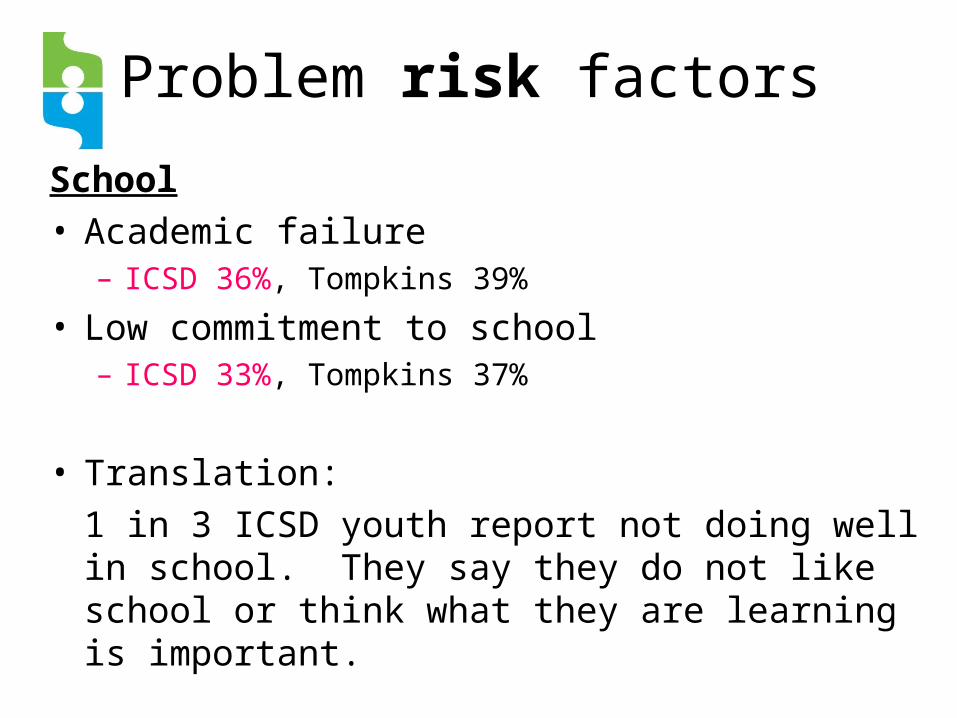
Problem risk factors
School• Academic failure
– ICSD 36%, Tompkins 39%
• Low commitment to school– ICSD 33%, Tompkins 37%
• Translation:
1 in 3 ICSD youth report not doing well in school. They say they do not like school or think what they are learning is important.

Problem risk factors
Family• Parental attitudes favorable to antisocial behaviors
– ICSD 49%, Tompkins 49%
• Poor family management– ICSD 42%, Tompkins 39%
• Translation:
Half of ICSD youth report low parental disapproval of youth fighting & petty crime. 4 in 10 say their families use inconsistent punishment & don’t provide clear expectations & monitoring.

Problem risk factors
Individual/Peer• Peer rewards for antisocial behaviors
– ICSD 49%, Tompkins 44% • Perceived risk of drug use
– ICSD 47%, Tompkins 42%
• Favorable attitudes to antisocial behaviors– ICSD 41%, Tompkins 39%
• Translation: Half of ICSD youth perceive low risk of harm from using drugs. They do not think it’s wrong to steal, cut school, pick a fight or ignore rules and think their friends do not think drug use is wrong .

Clickers
• You will be using an anonymous audience response device today to:
– Guess how students responded to certain survey questions
• You will have 10 seconds to record your answers.

Practice slide: Which of these activities have ICSD students spent the most time on in the past year?
Musi
c, d
ance
, art,
dra
ma
Wor
king
(pai
d job)
Soci
alizi
ng on in
tern
et
Doin
g hom
ework
Han
ging
out w
ith fr
iends
TV, v
ideo
s, c
ompute
r...
0% 0% 0%0%0%0%
100of5
1. Music, dance, art, drama
2. Working (paid job)
3. Socializing on internet
4. Doing homework
5. Hanging out with friends
6. TV, videos, computer, games

Out-of-school time for ICSD students (spend 3+ hrs./week)
M.S. H.S.
Homework 57% 72%
Hanging out with friends 61% 66%
TV, videos; computer or video games
46% 56%
Practicing music, dance; doing art or drama
40% 38%
Socializing on internet 26% 54%
Paid job 6% 25%

ICSD Substance Use

How many ICSD H.S.* students do you think have ever tried alcohol?
0% 0%0%0%10
0of5
1. 34%
2. 50%
3. 62%
4. 81%
*High school = students in grades 9-12 at IHS or LACS
Middle school = students in grades 6-8 at Boynton, DeWitt or LACS

ICSD Alcohol – lifetime use (experimentation)
By the end of middle school, 36% of ICSD students have tried alcohol By the end of high school, 78% have tried alcohol. ICSD rates exceed county rates for all grades except 11th and are higher than national peers for grades 10 & 12. rates. Note increases between grades 7 & 8 and 9 & 10.
National peers are from Monitoring the Future survey given annually to 50,000 students in gr. 8, 10, 12.
0%
10%
20%
30%
40%
50%
60%
70%
80%
6 7 8 9 10 11 12
ICSD County National
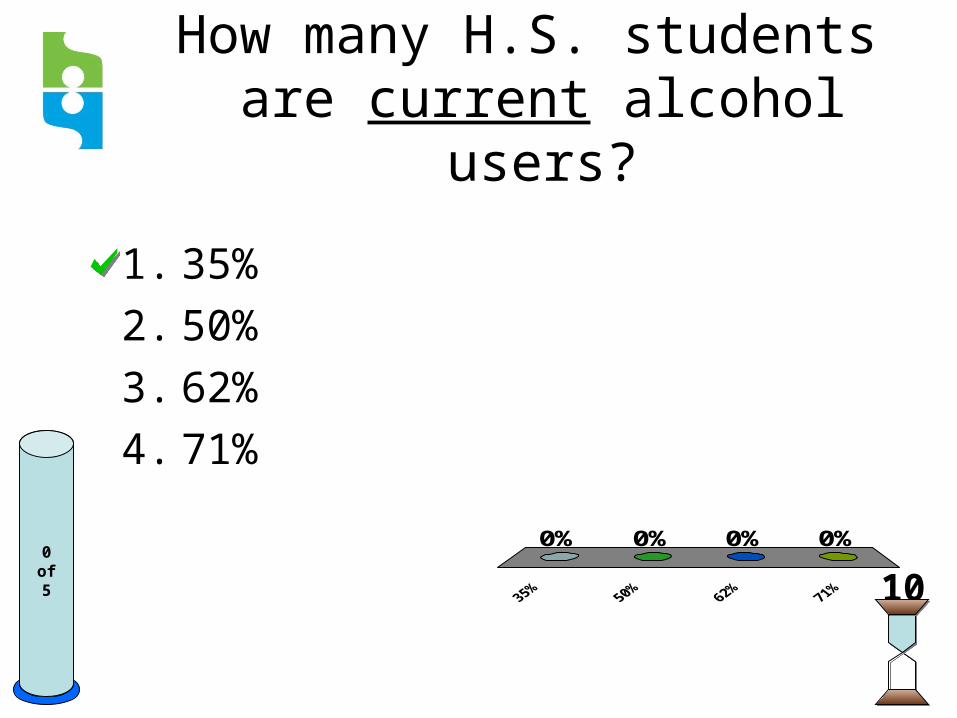
How many H.S. students are current alcohol users?
0% 0%0%0%
100of5
1. 35%
2. 50%
3. 62%
4. 71%

ICSD – 30 day alcohol use (current use)
ICSD student rates of current alcohol users exceed county rates for all grades and national rates for grades 10 & 12. Note increase between 8th & 9th grades.
0%
10%
20%
30%
40%
50%
60%
6 7 8 9 10 11 12
ICSD County National

11% of ICSD 9th graders use marijuana regularly. What’s the
rate for 12th graders?
0% 0%0%0%0of5 10
1. 15%
2. 21%
3. 27%
4. 33%

ICSD – 30-day marijuana use (current use)
ICSD rates for all grades except 6th are higher than county rate; grades 10 & 12 exceed national rates. Note increase between 7th & 9th grades.
0%
5%
10%
15%
20%
25%
30%
35%
6 7 8 9 10 11 12
ICSD County National

Is ICSD student use of cigarettes higher or lower than national peers?
Hig
her
Lower
0%0% 100of5
1. Higher
2. Lower

ICSD – 30 day use of cigarettes (current use)
ICSD 30-day cigarette use rates are less than national rates and, except for 6th grade, less than county rates.
0%
5%
10%
15%
20%
6 7 8 9 10 11 12
ICSD County National

30-day smokeless tobacco use (current use)
ICSD rates are lower than county peers for all grades. ICSD rates are lower than national rates. Use is higher in rural districts.
0%
2%
4%
6%
8%
10%
12%
6 7 8 9 10 11 12
ICSD County National

30-day use of other drugs by ICSD students
• Prescription pain relievers – 4% highest for 12th graders – 6% (ICSD)
• Heroin, meth, cocaine, ecstasy, LSD, hallucinogens – <1%
• Inhalants – 1% peaks at 3% in 8th grade (ICSD)

Which substance do ICSD students start using first?
Alc
ohol
Mar
ijuan
a
Cig
aret
tes
0% 0%0%10
0of5
1. Alcohol
2. Marijuana
3. Cigarettes

Age of first substance use
ICSD Tompkins
Alcohol 12.87 13.12
Regular alcohol use 14.54 14.60
Marijuana 13.80 13.92
Cigarettes 13.20 12.98
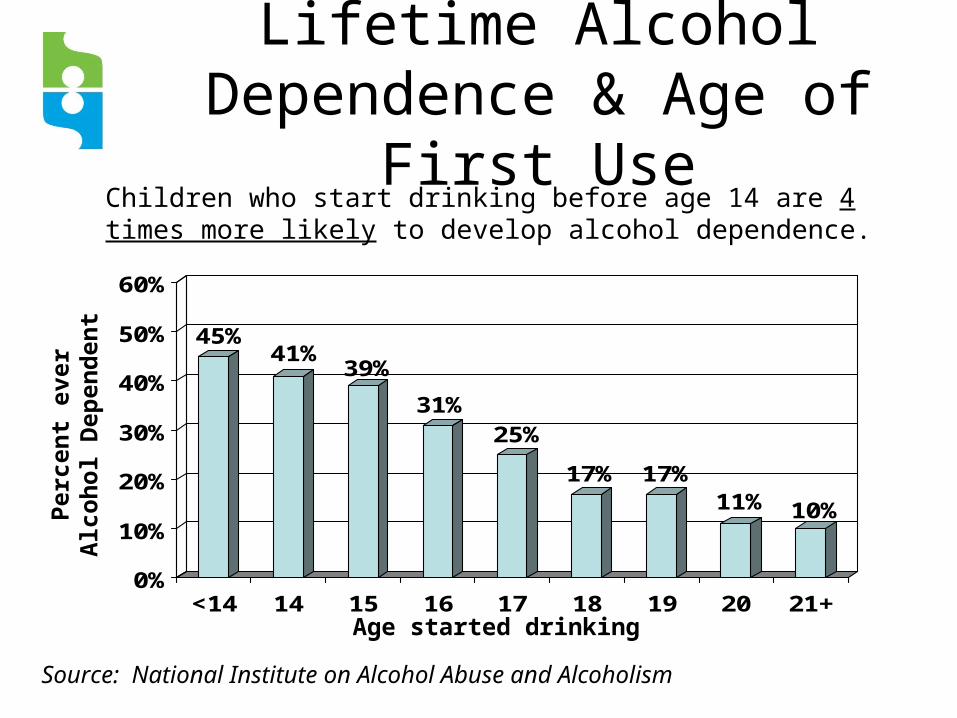
Lifetime Alcohol Dependence & Age of First Use
45%41%
39%
31%25%
17% 17%11% 10%
0%
10%
20%
30%
40%
50%
60%
<14 14 15 16 17 18 19 20 21+Age started drinking
Per
cen
t ev
er A
lco
ho
l D
epen
den
t
Source: National Institute on Alcohol Abuse and Alcoholism
Children who start drinking before age 14 are 4 times more likely to develop alcohol dependence.

Which do ICSD high schoolers say would be easier to get?
Cig
aret
tes
Mar
ijuan
a
0%0%10
0of5
1. Cigarettes
2. Marijuana

Ease of access (ICSD students) *
Middle school
High school
Alcohol 27% 68%
Marijuana 13% 56%
Cigarettes 16% 49%
*Would be very or sort of easy to obtain if desired

Who/what is the most common source of alcohol for ICSD youth?
Hom
e w
ith p
aren
ts’..
.
Hom
e w
ithout p
aren
...
Frie
nd 21
+
Frie
nd <
21
Bough
t w/ f
ake
ID
0% 0% 0%0%0%
100of5
1. Home with parents’ permission
2. Home without parents’ permission
3. Friend 21+
4. Friend < 21
5. Bought w/ fake ID

Alcohol sources (for ICSD students who drank in past year)
(choose 1 answer)
Friend < 21 27%
Friend age 21 + 17%
Home with parents’ permission 20%
Home without parents’ permission 9%
Sibling/other relative 7%
Bought with or without fake ID 2%

Marijuana sources (for ICSD students who used in past year)
(choose 1 answer)
Got it for free 41%
Bought it from friend or relative 29%
Bought it from dealer or stranger 13%
Got from home with or without parents’ knowledge
10%
Grew it myself 8%
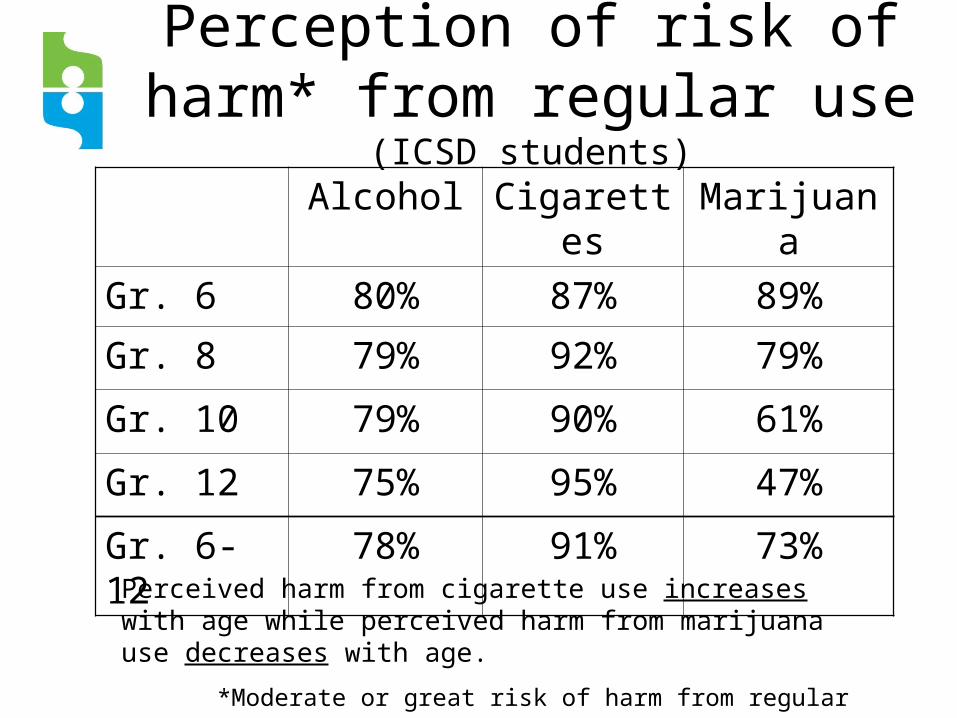
Perception of risk of harm* from regular use (ICSD students)
Alcohol Cigarettes Marijuana
Gr. 6 80% 87% 89%
Gr. 8 79% 92% 79%
Gr. 10 79% 90% 61%
Gr. 12 75% 95% 47%
Gr. 6-12 78% 91% 73%
Perceived harm from cigarette use increases with age while perceived harm from marijuana use decreases with age.
*Moderate or great risk of harm from regular use

Other ICSD survey data
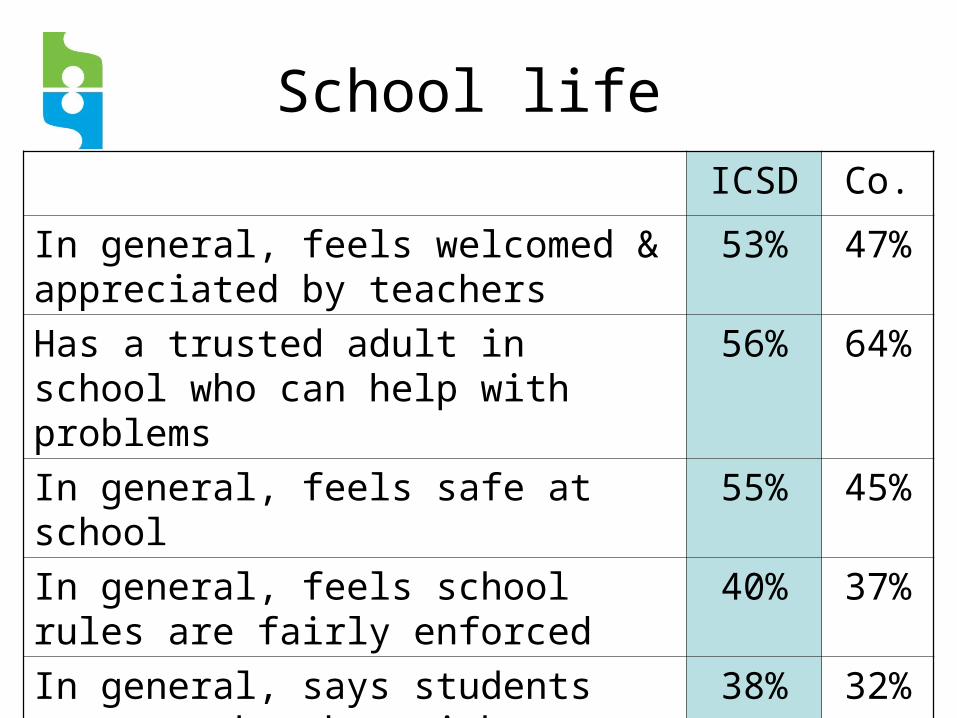
School life
ICSD Co.
In general, feels welcomed & appreciated by teachers
53% 47%
Has a trusted adult in school who can help with problems
56% 64%
In general, feels safe at school 55% 45%
In general, feels school rules are fairly enforced
40% 37%
In general, says students treat each other with respect
38% 32%

Bullying (in last 30 days at my school…)
ICSD Co.
Someone said something hurtful to me 29% 36%
Said something hurtful to another student 16% 17%
Has been insulted, embarrassed, harassed, or threatened – internet or text msg.
9% 9%
Was physically bullied 6% 6%

Depressive symptoms
ICSD Co.
All in all, I am inclined to think I am a failure.
16% 14%
Sometimes I think that life is not worth it. 24% 23%
In the past year, I felt depressed or sad on most days.
26% 27%
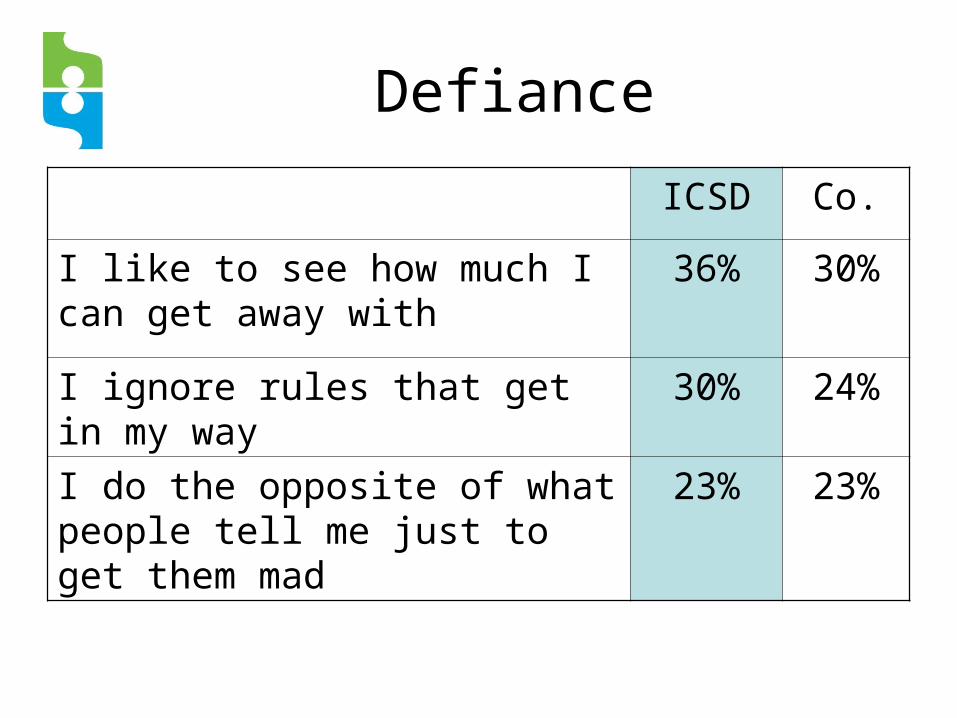
Defiance
ICSD Co.
I like to see how much I can get away with
36% 30%
I ignore rules that get in my way 30% 24%
I do the opposite of what people tell me just to get them mad
23% 23%

Use of cell phones (past 30 days)
ICSD
M.S.
ICSD
H.S.
Have a cell phone 64% 85%
To get on website to connect with friends
9% 17%
To talk/text at school when not supposed to
14% 45%
To talk/text/surf after parents thought they were in bed
12% 28%
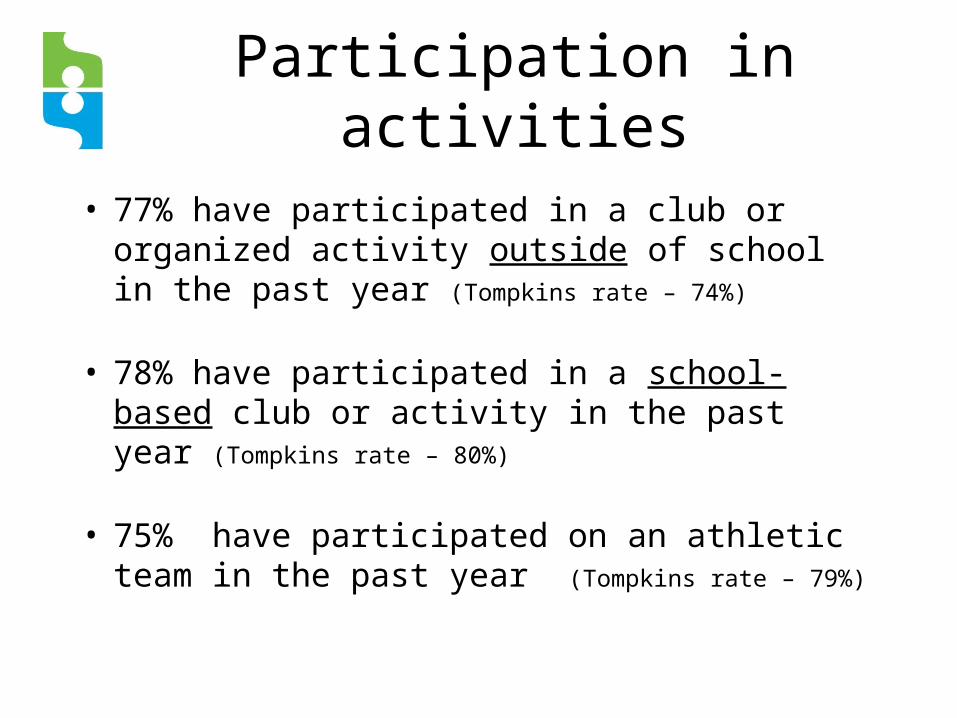
Participation in activities
• 77% have participated in a club or organized activity outside of school in the past year (Tompkins rate – 74%)
• 78% have participated in a school-based club or activity in the past year (Tompkins rate – 80%)
• 75% have participated on an athletic team in the past year (Tompkins rate – 79%)

What did ICSD students say is the biggest issue facing teens today?
Doin
g wel
l in s
chool
Fig
hting/
viole
nce
Dru
gs/al
cohol
Rel
atio
nship
s
Pee
r pre
ssure
/fitti
ng in
0% 0% 0%0%0%
100of5
1. Doing well in school
2. Fighting/violence
3. Drugs/alcohol
4. Relationships
5. Peer pressure/fitting in

Most important issues facing teens today
Peer pressure/fitting in 26%
Drugs & alcohol 25%
Doing well in school 13%
Relationships with friends/boyfriend/ girlfriend
11%
My family having enough $ to get by 9%
Getting a good job 6%
Fighting & violence 6%
Relationships with family 4%

Data reliability & use
• Surveys with inconsistent answers are removed from data set:– “How honest were you?”– Inconsistent answers– Fake drug
• Who uses data & how?

What parents, schools & communities can do to improve youth outcomes

Tell children you disapprove of their using alcohol or other drugs
ICSD students whose parents disapprove of their use of alcohol and marijuana have significantly lower 30 day use of these substances.
18%
55%
8%
47%
0%
10%
20%
30%
40%
50%
60%
Alcohol Marijuana
Parents disapprove Parents don't disapprove
30-day use

Keep track of children’s whereabouts
29%41%
9%
34%
9%
30%
54%
34%
87%
66%
0%
20%
40%
60%
80%
100%
Alcohol Marijuana Binge drink Like school Do bestwork
Yes No
30-day use
Students who reported that their parents know where they are and who they are with had much lower use rates and better connection to school than students who said their parents did not monitor their whereabouts.

Have clear family rules about alcohol and drug use
18%
39%
9%
24%
9%
23%
54%
39%
87%
72%
0%
20%
40%
60%
80%
100%
Alcohol Marijuana Binge drink Like school Do best work
Yes No
Students who reported that their family has clear rules about alcohol and drug use had much lower AOD use rates and better connection to school than students who said their families did not have clear rules.
30-day use

Spend time having fun
18%33%
9%21%
8%21%
57%
35%
89%
72%
0%
20%
40%
60%
80%
100%
Alcohol Marijuana Binge drink Like school Do bestwork
Yes No
30-day use
Students who said they had lots of chances to do fun things with their parents had much lower use rates and better connection to school than students who said they did not have chances to have fun with their parents.
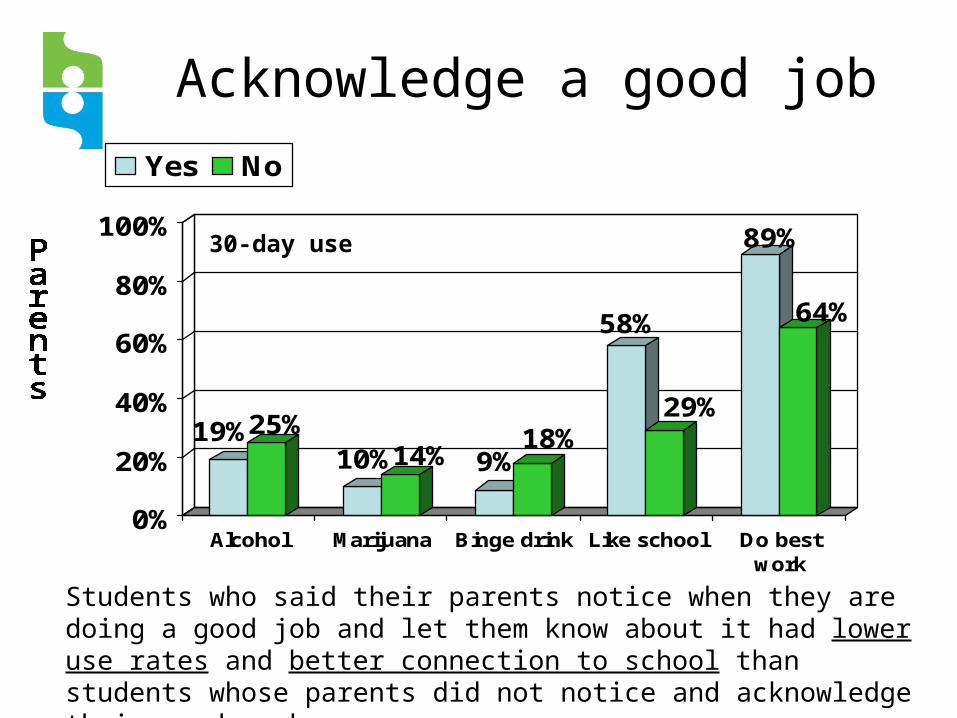
Acknowledge a good job
19%25%10%14% 9%
18%
58%
29%
89%
64%
0%
20%
40%
60%
80%
100%
Alcohol Marijuana Binge drink Like school Do bestwork
Yes No
30-day use
Students who said their parents notice when they are doing a good job and let them know about it had lower use rates and better connection to school than students whose parents did not notice and acknowledge their good work.
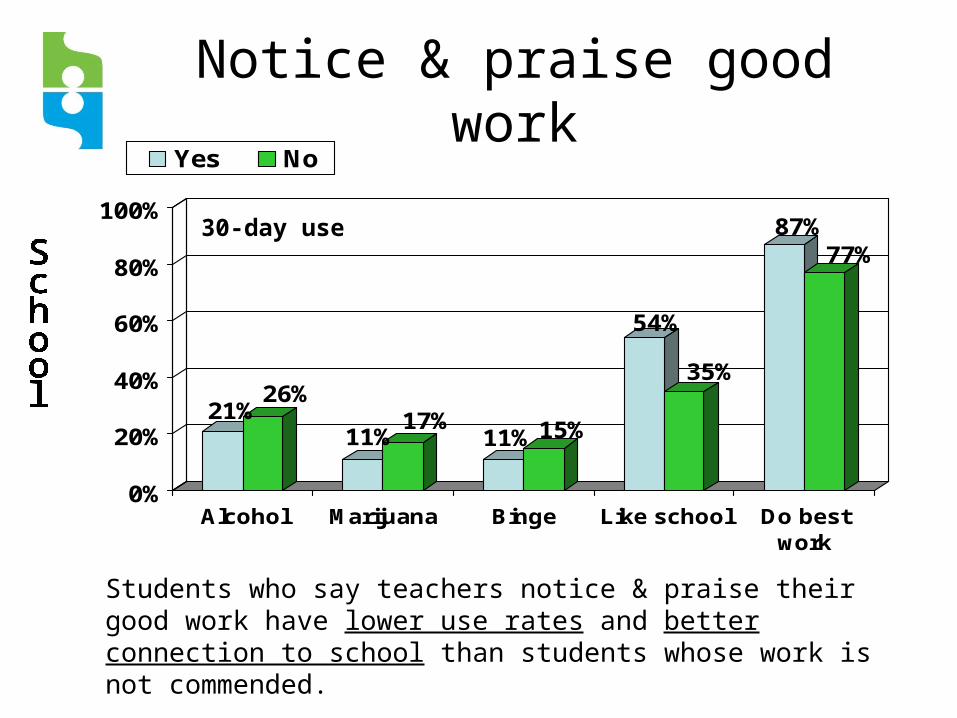
Notice & praise good work
21%26%
11%17%
11% 15%
54%
35%
87%77%
0%
20%
40%
60%
80%
100%
Alcohol Marijuana Binge Like school Do bestwork
Yes No
Students who say teachers notice & praise their good work have lower use rates and better connection to school than students whose work is not commended.
30-day use
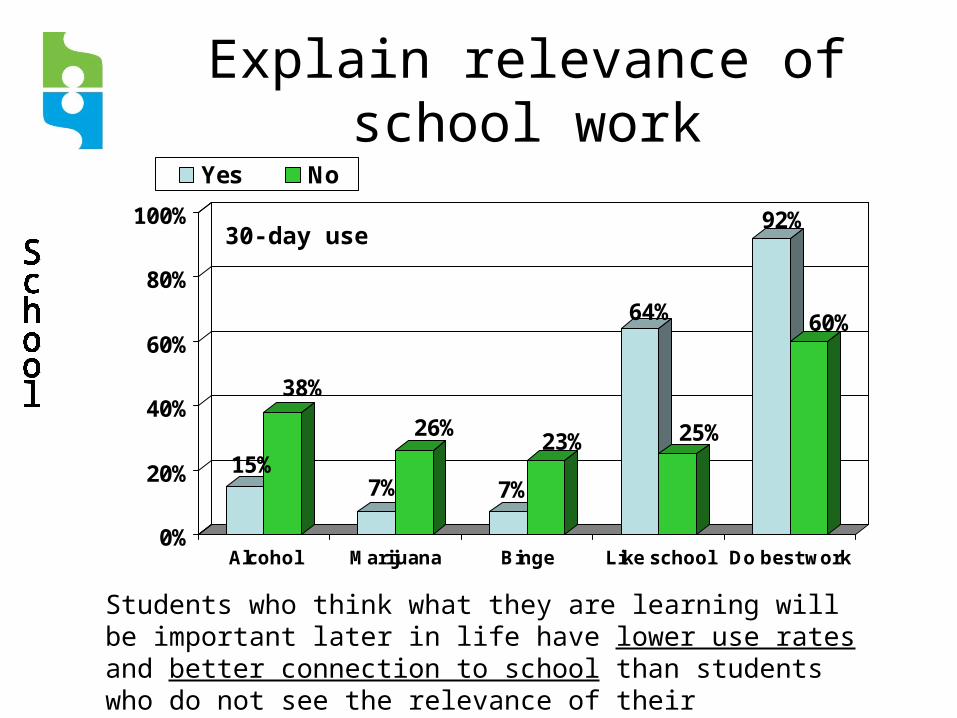
Explain relevance of school work
15%
38%
7%
26%
7%
23%
64%
25%
92%
60%
0%
20%
40%
60%
80%
100%
Alcohol Marijuana Binge Like school Do best work
Yes No
Students who think what they are learning will be important later in life have lower use rates and better connection to school than students who do not see the relevance of their schoolwork.
30-day use
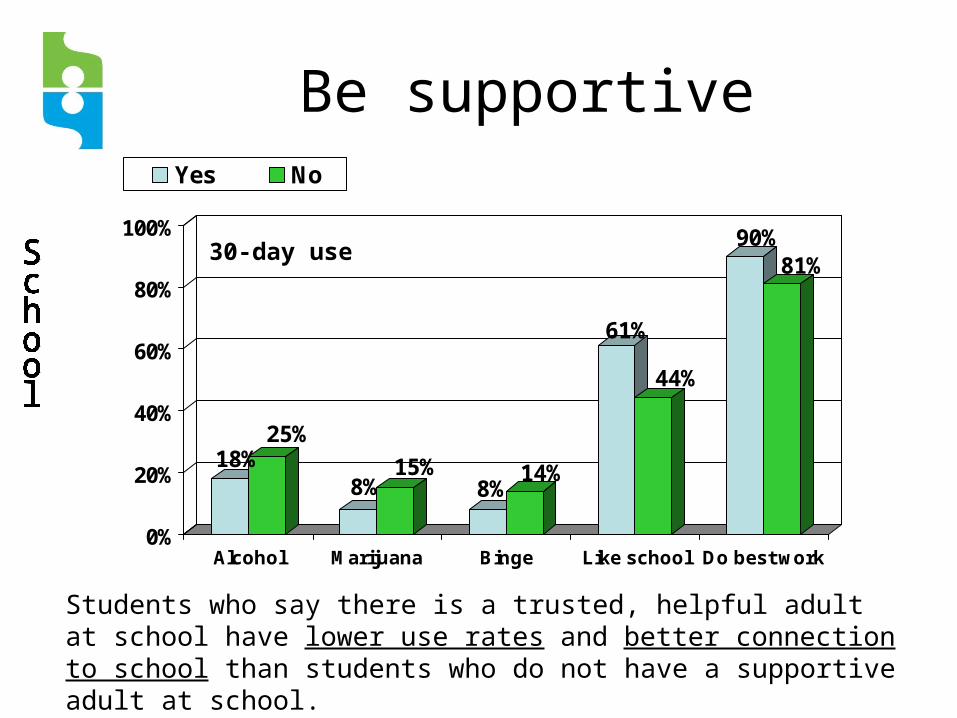
Be supportive
18%25%
8%15%
8%14%
61%
44%
90%81%
0%
20%
40%
60%
80%
100%
Alcohol Marijuana Binge Like school Do best work
Yes No
Students who say there is a trusted, helpful adult at school have lower use rates and better connection to school than students who do not have a supportive adult at school.
30-day use
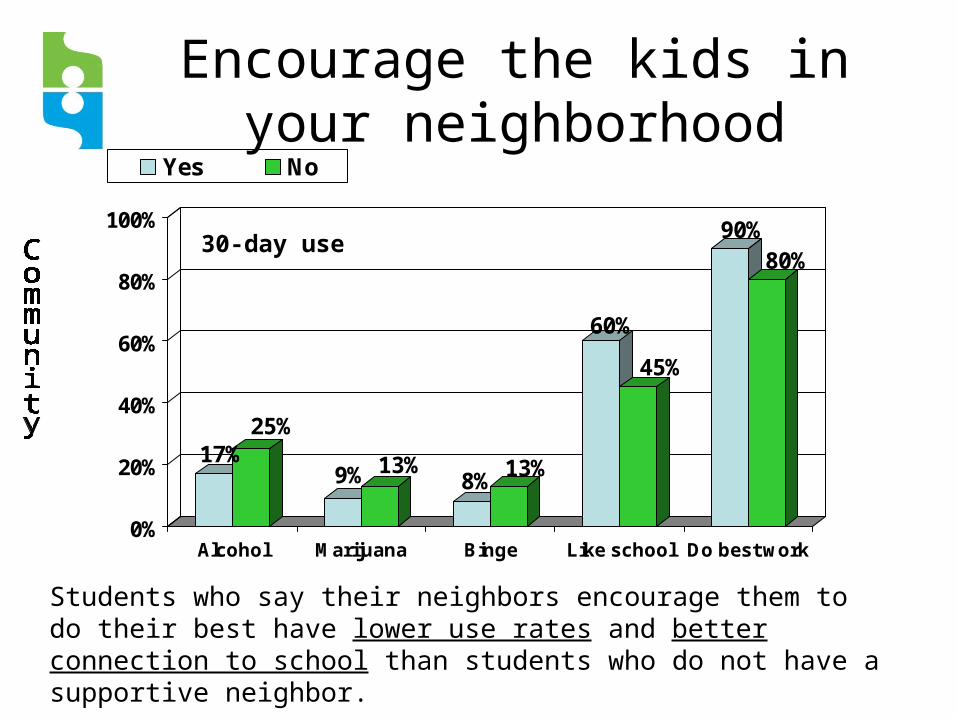
Encourage the kids in your neighborhood
17%25%
9% 13%8%
13%
60%
45%
90%80%
0%
20%
40%
60%
80%
100%
Alcohol Marijuana Binge Like school Do best work
Yes No
Students who say their neighbors encourage them to do their best have lower use rates and better connection to school than students who do not have a supportive neighbor.
30-day use

Who had higher past 30-day marijuana use rates: those who
participated in school or community activities…
0%0% 100of5
1. 10+ times
2. Never
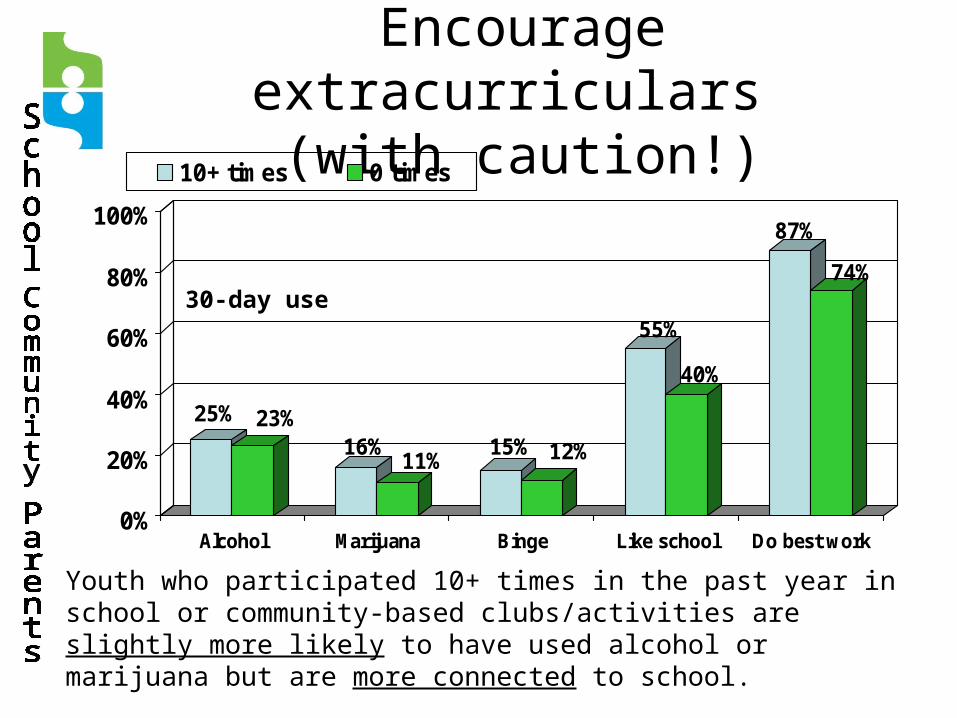
Encourage extracurriculars (with caution!)
25% 23%16%
11%15% 12%
55%
40%
87%
74%
0%
20%
40%
60%
80%
100%
Alcohol Marijuana Binge Like school Do best work
10+ times 0 times
Youth who participated 10+ times in the past year in school or community-based clubs/activities are slightly more likely to have used alcohol or marijuana but are more connected to school.
30-day use

Encourage high school team sports (with caution!)
40%
27%19% 23% 21%
16%
51%
38%
82%
70%
0%
20%
40%
60%
80%
100%
Alcohol Marijuana Binge Like school Do best work
Yes No
ICSD high school youth who participated on sports teams in the past year are more likely to have used alcohol (including binge use) but have a better connection to school.
Thank you!
• GIAC for hosting
• All of you for caring!

Questions & discussion
• Interested in helping with our work? CCHY would welcome members from the ICSD community (students, teachers, families, community members, ?!)
(see Travis or me!)
Community Coalition for Healthy Youth c/o Tompkins County Youth Services Dept.320 W. ML King Jr./State St., Ithaca • 274-5310 • www.healthyyouth.org