Embed Size (px)
Citation preview

PERCEPTION VERSUS PRODUCTION OF POLISH SPEECH: POZNAŃ
by
PAULINA BOUNDS
(Under the Direction of William A. Kretzschmar, Jr.)
ABSTRACT
This research is aimed at investigating the relationship between speech production and
perception of speech in Poznań, Poland. Never before used on Polish data, Preston’s ‘Draw a
map’ methodology (1989) was adjusted to measure the perception of speech varieties in Poland
and in Poznań. Another perceptual tool was the questionnaire method to use it in exploring
speech reported by the informants. The speech production tool used was the linguistic interview.
The research encompassed over 500 subjects among the three tools used. Perceptual maps
revealed that respondents indicated four main speech varieties with a high level of agreement,
and the rest of the maps were covered in low level shared perceptions. The perceptual
questionnaire showed that Poznań specific vocabulary is reported to be used by speakers across
demographic dimensions. The differences within the significant factor groups were small,
indicating continuous behavior. The interview task uncovered a tendency for all informants to
use some local vocabulary, although not at a high rate. The theoretical approach used, called
linguistics of speech, provided methods to link speech production and perception. Subjects
created perceptions about their local speech with the help of such cognitive mechanisms as
schema and gestalt to arrive with an observational artifact of ‘Poznań speech’. This way a
limited set of lexical items became a sign of an existing population of ‘Poznań speakers’ in a

defined ‘Poznań’ location. A model of the relationship between perception and production was
proposed as continuous reciprocal speech behavior.
INDEX WORDS: Perceptual Dialectology, Speech perception, Linguistic of speech, Polish
speech perception, Poznań speech

PERCEPTION VERSUS PRODUCTION OF POLISH SPEECH: POZNAŃ
by
PAULINA BOUNDS
M.A., Adam Mickiewicz University, Poland, 2005
A Dissertation Submitted to the Graduate Faculty of The University of Georgia in Partial
Fulfillment of the Requirements for the Degree
DOCTOR OF PHILOSOPHY
ATHENS, GEORGIA
2010

© 2010
Paulina Bounds
All Rights Reserved

PERCEPTION VERSUS PRODUCTION OF POLISH SPEECH: POZNAŃ
by
PAULINA BOUNDS
Major Professor: William A. Kretzschmar, Jr.
Committee: Lewis C. Howe Keith Langston Electronic Version Approved: Maureen Grasso Dean of the Graduate School The University of Georgia May 2010

iv
ACKNOWLEDGEMENTS
Moja podróż do Ameryki na studia doktoranckie z językoznawstwa była
fascynująca i pełna wrażeń. Brakuje mi słów żeby podziękować wszystkim ludziom, którzy
pomagali mi i inspirowali mnie w drodze do miejsca, w którym jestem dzisiaj. Chciałabym tutaj
zaznaczyć ich pozytywny wpływ i energię wysyłaną w moim kierunku.
Po pierwsze, chciałabym podziękować mojemu promotorowi profesorowi doktorowi
Kretzschmarowi za wsparcie i rady w moich przedsięwzięciach akademickich jak i tych poza
szkołą. Jego sposób uczenia zachęcił mnie do zejścia z utartych dróg językoznawstwa
i popchnął mnie w kierunku tych rzadko uczęszczanych, ale jakże fascynujących ścieżek. Jego
otwartość pozwoliła mi scalić moją polskość z tym czego nauczyłam się tu, w Ameryce
i stworzyć moją własną ścieżkę naukową.
Podziękowania należą się również pozostałym członkom komisji doktorskiej: doktorowi
Keith Langstonowi i doktorowi Chad Howe za konstruktywną dyskusję, która wpłynęła na
ostateczny kształt tej dyseratacji i skłoniła mnie do spojrzenia na języki polski z perspektywy
obcokrajowca.
Dziękuję moim przyjaciołom, tym z Aten z którymi spędzałam czas przez ostatnie parę
lat, czy to na zajęciach, w pracy, czy też ucząc się do egazminów. Szczególne podziękowania
należą się się Jacque Hettel, która wypleniła polską gramatykę z mojego angielskiego oraz
bardzo cierpliwie naprawiała angielskie przedimki w doktoracie. Z nią również rozważałyśmy
zagadnienia językoznawcze żwawo biegając w czasie aerobiku wodnego.

v
Bez wątpienia nie byłabym w stanie dotrzeć do tego miejsca bez wsparcia mojej rodziny.
Po pierwsze, chciałabym podziękować moim rodzicom za lata miłości i wsparcia i wtłaczania mi
do głowy przekonania że jestem w stanie przeprowadzić wszystko, co sobie zaplanuję i że mogę
zrobić to dobrze. Mojemu tacie dziękuję szczególnie za wysiłek, który włożył w nakłanianie
setek ludzi by wzięli udział w badaniach i za to, że sprawiał, że wielkie problemy zamieniały się
w małe sprawy, którymi nie warto się przejmować. Mojej mamie dziękuję, że nakłoniła swoje
psiapsiółki do nagrywanych rozmów ze mną. Również za wielogodzinne rozmowy przez telefon
o sprawach innych niż doktorat i przypominaniu, że studia doktoranckie to tylko pewien etap w
życiu, o tym, że nie można zapominać o życiu poza studiami, a wręcz trzeba go używać.
Mojej siorze Gośce i szwagroskiemu Wojtasowi dziękuję za miłość i wsparcie po tej
stronie oceanu i niesamowitą pomoc w budowaniu narzędzi do przeprowadzonej przeze mnie
analizy. Wojtkowi, który jest moim nowym guru statystyki i oprogramowania, dziękuję za
rozmowy o językoznawstwie z innego punktu widzenia, które dodały nowego wymiaru analizie
wyników. Mojej siorze dziękuję za to, że oswoiła Excela i że wysłuchiwała moich rozterek na
temat kierunku badań przez wiele wieczorów spędzonych na zakupach. Wasza obecność tutaj
zapewniła mi nie tylko rodzinną atmosferę, ale też pomogła mi znależć odpowiedzi na ogrom
pytań dotyczących doskonalenia moich badań.
Mojemu mężowi, Hołzikowi dziękuję za miłość, wsparcie i niekończącą się
cierpliwość w czasie długich studiów i samego pisania doktoratu. Jego wysiłek by wszystko
toczyło się bez zakłóceń, obiady pojawiające się na stole czy zawsze nakarmiona Kicia
pozwoliły mi skupić się na dokończeniu tej długiej podróży. Zawsze dbał o to żebym miała to
czego potrzebuję, czy to ciszę i spokój by pisać, czy wyjście do restauracji i kino gdy

vi
świętowaliśmy kolejny napisany rozdział, czy po prostu poranną kawę, która pomaga się
obudzić. Bez ciebie nie byłabym w stanie skończyć doktoratu, dziękuję.
Nie mogłabym przeprowadzić badań bez wszystkich ludzi, którzy w nich uczestniczyli.
Dlatego podziękowania należą się tym wszystkim, którzy brali udział w którejkolwiek z części
badań, czy to wywiadu, czy ankiety czy mapy. Dziękuję, że opowiedziliście mi o swoim życiu
i o tym jak używacie języka i jak go postrzegacie. Szczególne podziękowania należą się
profesorom z Uniwerstytetu Adama Mickiewicza : prof. dr habil. Tomaszowi Józefowi
Pokrzywniakowi, dr habil. inż. Markowi Marciniakowi i dr habil. Agacie Jakubowskiej za
zachęcenie swoich studnetów do wypełnienia map. Dziękuję członkom klubu AKS i jego
prezydentowi Jackowi Kowalskiemu za to, że zasiedli przed komputerami i wypełnili ankiety.
I również moich przyjaciółkom: Kasi Jardanowskej, Paulinie Dzidowskiej, Oli Brzostowskiej,
Ani Kaczmarek i Kasi Gierej za to że są i za rozpuszczanie wici i sprawienie że ludzie
wypełniali ankietę. Dziękuję.
Coming to America to pursue my education in linguistics has definitely been a wild and
exciting ride, and along the way many people helped and inspired me to arrive at the point where
I am today. There are not enough words or sentences to thank them all, but I will do my best to
acknowledge their positive influence and energy sent in my direction.
First of all, I would like to thank Dr. Kretzschmar for all the years of guidance and
support in my academic and work pursuits. His teaching pushed me to step off the familiar path
and venture into new, exciting, but unfamiliar, roads in linguistics. His openness allowed me to
fuse my Polishness into what I learned here and create my own path to follow.

vii
Many thanks go to the other members of the dissertation committee: Keith Langston and
Chad Howe for their constructive discussion along the way that influenced the final shape of the
dissertation and made me look at Polish from a foreign perspective.
To my friends, here in Athens who I enjoyed company of throughout the years, in
different classrooms, at different jobs and studying with for enormous amount of finals.
Especially, to Jacque Hettel who meticulously searched and destroyed Polish in my English and
fixed all those infamous articles in (the?) dissertation, and talked linguistics while cross country
skiing in water during hydrobics .
If it hadn’t been for my family, I would not have been able to reach this point. First of all,
I want to thank my parents for all of the years of love and support and imprinting the conviction
in me that I can do it and I can do it well. To my dad, for all the effort he put into getting
hundreds of people to participate in this research and to always making big problems turn into
very small and not worth worrying about. To my mom, for getting her girlfriends to talk to me
and for hours of talking on the phone about things other than the dissertation and making sure
that along the way I remembered that graduate school is only a phase and I still need to have a
life and enjoy it too.
To my sister Gośka and brother in law Wojtek for support and love on this side of the
ocean and tremendous help in developing tools for the analysis of this research. To Wojtek—my
new statistics and software guru, for conversations about linguistics from a foreign-to-me
perspective, which gave a different angle to the analysis. To Gośka, who not only transformed
Excel from a foe to a friend for me, but who also spent countless evenings shopping and listening
to me explaining: what do I want to do in this research? Their presence here provided not only
family base but also countless questions furthering this research.

viii
To my husband, Halsey for love and support and endless patience in this long process of
grad school and writing the dissertation. His effort to keep everything working, with dinner on
the table and our Kicia fed allowed me to focus on finishing this long journey. He always
provided me with what I needed, whether it was peace and quiet so I could write, dinner and a
movie so that we could celebrate another chapter written, or just a coffee in the morning to wake
up and start a day. I couldn’t do it without you, thank you.
This research would not be possible without participants who agreed to take part. Many
thanks to all the people who participated in the research, whether interview informants or
perceptual questionnaire and map respondents, for allowing me to ask them about their lives and
investigate their speech and perceptions. To professors at Adam Mickiewicz University: Tomasz
Józef Pokrzywniak, Marek Marciniak, and Agata Jakubowska who made their students draw on
the perceptual maps. To members of AKS club and its president Jacek Kowalski for getting on
their computers and filling in the perceptual questionnaire. And lastly to my girls: Kasia
Jardanowska, Paulina Dzidowska, Ola Brzostowska, Ania Kaczmarek, and Kasia Gierej for
being there for me and getting the news around and having people excited about filling in the
questionnaire. Thank you all.

ix
TABLE OF CONTENTS
Page
ACKNOWLEDGEMENTS ........................................................................................................... iv
LIST OF TABLES ........................................................................................................................ xii
LIST OF FIGURES ..................................................................................................................... xvi
CHAPTER
1 Theoretical Background ................................................................................................1
1.1. History of Poland .............................................................................................1
1.2. Polish Language ...............................................................................................3
1.3. History of Poznań Speech ................................................................................9
1.4. Research on Poznań Speech Conducted at Adam Mickiewicz University ....12
1.5. Enregisterment ...............................................................................................22
1.6. Perceptual Dialectology .................................................................................24
1.7. Pile Sorting ....................................................................................................32
1.8. Summary ........................................................................................................36
2 Linguistics of Speech ..................................................................................................37
2.1. Langue versus Parole ....................................................................................38
2.2. Complex Systems ..........................................................................................45
2.3. Non-linear Distribution ..................................................................................48
2.4. Continuity, Proximity, Scaling, and the Logical Aggregation.......................49
2.5. Speech Production and Perception.................................................................53

x
2.6. Gestalts and Schemas .....................................................................................55
3 Methodology and Fieldwork .......................................................................................61
3.1. Introduction ....................................................................................................61
3.2. Methodology ..................................................................................................69
3.3. Summary ......................................................................................................103
4 Perceptual Maps - Results .........................................................................................104
4.1. Perceptual Map of Poland ............................................................................104
4.2. Perceptual Map of Poznań ...........................................................................148
4.3. Preliminary Observations.............................................................................156
5 Perceptual Questionnaire - Results ...........................................................................164
5.1. Methodological Notes ..................................................................................164
5.2. Results ..........................................................................................................167
5.3. Preliminary Observations.............................................................................197
6 Linguistic Interview - Results ...................................................................................202
6.1. Subjects and Methodological Notes .............................................................202
6.2. The Corpus ...................................................................................................207
6.3. Conversation - Results .................................................................................208
6.4. Elicitation - Results ......................................................................................238
6.5. Preliminary Observations.............................................................................250
7 Conclusions – Two Sides of the Same Coin .............................................................253
7.1. The Perceptual Maps....................................................................................253
7.2. The Perceptual Questionnaire ......................................................................255
7.3. The Linguistic Interview ..............................................................................258

xi
7.4. Two Sides of the Same Coin ........................................................................260
REFERENCES ............................................................................................................................268
APPENDICES
A Perceptual Map Task ................................................................................................285
B Various techniques used to indicate speech varieties in Poland ..............................290
C Email send out to ask for filling in the online perceptual questionnaire ..................298
D The list of Poznań and general Polish words used in the perceptual questionnaire.300
E Screenshots of the online perceptual questionnaire..................................................305
F Interview Schedule ...................................................................................................307
F.1. General Questions ........................................................................................307
F.2. Daily Life .....................................................................................................308
F.3. Schools .........................................................................................................309
F.4. Closing Question .........................................................................................310
G List of all labels used on perceptual map of Poland with frequency indicated ........312
H Miscellaneous Poznań words used in the conversation part of the interview ..........310
I Cues for target words used in the elicitation part of the interview ...........................312

xii
LIST OF TABLES
Page
Table 3.1.: The population of the cities displayed on the map of Poland ......................................73
Table 3.2.: The Perceptual Maps Respondents ..............................................................................77
Table 3.3.: The distribution of techniques used by the informants to indicate speech varieties in
the ‘Perceptual map of Poland’ task. .............................................................................................81
Table 3.4.: Age distribution among questionnaire respondents .....................................................96
Table 3.5.: Education level distribution .........................................................................................97
Table 3.6.: Occupation distribution ...............................................................................................98
Table 3.7.: Distribution among city divisions ................................................................................99
Table 3.8.: Residency distribution ...............................................................................................100
Table 3.9.: Interview Informant’s demographic information ......................................................102
Table 4.1.: Distribution of label tokens among 4 semantic groups and four regions ..................144
Table 4.2.: The highest frequency labels in each group and region ............................................145
Table 4.3.: Some of the descriptive labels about Poznań speech.................................................155
Table 5.1.: New distribution of demographic information ..........................................................166
Table 5.2.: Token distribution for age factor for Poznań words ..................................................168
Table 5.3.: Token distribution for age factor for general Polish words .......................................170
Table 5.4.: Distribution of tokens for gender for Poznań words .................................................172
Table 5.5.: Token distribution for education for Poznań words ..................................................173
Table 5.6.: Token distribution for occupation for general Polish words .....................................173

xiii
Table 5.7.: Token distribution for birth place, childhood and residency for Poznań words ........175
Table 5.8.: Token distribution for childhood in Poznań for general Polish words ......................176
Table 5.9.: Token distribution for age in formal situation for Poznań words ..............................180
Table 5.10.: Token distribution for age in casual situations for Poznań words ..........................181
Table 5.11.: Token distribution for age in family situations for Poznań words ...........................182
Table 5.12.: Token distribution for age in casual situation for general Polish words .................183
Table 5.13.: Token distribution for age in family situation for general Polish words .................184
Table 5.14.: Token distribution for gender in formal situation for Poznań words ......................185
Table 5.15.: Token distribution for gender in formal situation for general Polish words ...........186
Table 5.16.: Token distribution for birthplace in formal situation for Poznań words .................187
Table 5.17.: Token distribution for childhood in Poznań in formal and casual situations for
Poznań words ...............................................................................................................................188
Table 5.18.: Token distribution for residency in Poznań in formal, casual and family situation for
Poznań words ...............................................................................................................................190
Table 5.19.: Token distribution for birthplace in family situation for general Polish words .......191
Table 5.20.: Token distribution for childhood in Poznań in formal situation for general Polish
words.. ..........................................................................................................................................192
Table 5.21.: Token distribution for residency in Poznań in casual and family situation for general
Polish words .................................................................................................................................193
Table 5.22.: Token distribution for childhood in city divisions in formal, casual and family
situations for Poznań words .........................................................................................................195
Table 5.23.: Token distribution for city divisions in formal situation for general Polish words .197
Table 6.1.: Interview Informant’s demographic information ......................................................202

xiv
Table 6.2.: Top ten content nouns for Informant F1 ....................................................................210
Table 6.3.: Top ten content words for Informant F2 ....................................................................212
Table 6.4.: Top ten content words for Informant F3 ....................................................................213
Table 6.5.: Top ten content words for Informant F4 ....................................................................214
Table 6.6.: Top ten content words for Informant F5 ....................................................................216
Table 6.7.: Top ten content words for Informant M1 ..................................................................221
Table 6.8.: Top ten content words for Informant M2 ..................................................................222
Table 6.9.: Top ten content words for Informant M3 ..................................................................223
Table 6.10.: The frequency of Poznań words and rate per thousand of Poznań words in the
conversational part of the interview for each informant ..............................................................225
Table 6.11.: Top frequency Poznań words in conversation .........................................................228
Table 6.12.: Other Verbs category of types .................................................................................230
Table 6.13.: Food Vocabulary for Poznań words in conversation ...............................................232
Table 6.14.: Descriptions of People and Their Behaviors for Poznań words in conversation ....233
Table 6.15.: Family and Friends Vocabulary for Poznań words in conversation ........................234
Table 6.16.: Vocabulary About Poznań for Poznań words in conversation ................................234
Table 6.17.: Overlapping Types of Words for Conversational and Elicitation Parts of the
Interview ......................................................................................................................................237
Table 6.18.: Frequency of Poznań Words for the Elicitation Part of the Interview ....................239
Table 6.19.: All Types of Poznań Words That Appeared in the Elicitation Part .........................240
Table 6.20.: Target Words for Elicitation ....................................................................................245
Table 6.21.: Percentage of the Poznań Words Each Informant Used in the Elicitation Part of the
Interview ......................................................................................................................................246

xv
Table 6.22.: Comparison of the Number of Informants Using Poznań Words to the Number of
Those Words ................................................................................................................................247
Table 6.23.: Comparison of low frequency words in the elicitation part with their perception in
the perceptual questionnaire ........................................................................................................249
Table 6.24.: Comparison of high frequency words in the elicitation part with their perception in
the perceptual questionnaire ........................................................................................................250
Table G.1.: List of all labels used on Poland map with frequency indicated ..............................312
Table H.1.: Miscellaneous Poznań words used in the conversational part of the interview ........319

xvi
LIST OF FIGURES
Page
Figure 1.1.: Polish dialects division (Urbańczyk 1962) ...................................................................5
Figure 1.2.: Hoenigswald’s (1966) triangle of concern ...............................................................25
Figure 1.3.: Preston’s (1987) map of production and perception for Hawaiian respondents ........30
Figure 3.1.: Maps depicting the perception of the South in Preston (1997:318) and transformed
Preston’s map from Kretzschmar (2009:195). ...............................................................................65
Figure 3.2.: Blank map in Preston’s “Draw a map” from Preston (1989:26). ...............................70
Figure 3.3.: The map of Poland used for the ‘Perceptual map of Poland’ task .............................72
Figure 3.4.: The map of Poznań used in the ‘Perceptual map of Poznań’ task .............................75
Figure 3.5.: Original map by Informant POZ_F_073 and the same map processed in Adobe
Photoshop CS2. ..............................................................................................................................80
Figure 3.6.: Map of Informant POZ_F_073 in .txt format.............................................................82
Figure 3.7.: Sum of results for all respondents from Wielkopolska with country border added ...83
Figure 3.8.: Results from all respondents in 2D and 3D view .......................................................85
Figure 3.9.: Word Definition .........................................................................................................90
Figure 3.10.: Social situations ........................................................................................................91
Figure 3.11.: Mainstream Polish word definition ..........................................................................92
Figure 3.12.: Wrong definition options..........................................................................................93
Figure 3.13.: Other words options .................................................................................................94
Figure 3.14.: Residency question ...................................................................................................99

xvii
Figure 4.1.: Spreadsheet map .......................................................................................................105
Figure 4.2.: 2D and 3D view of the data ......................................................................................107
Figure 4.3.: Legend changed from numerical values to percentage ranges .................................108
Figure 4.4.: Spreadsheet of all the results ....................................................................................109
Figure 4.5.: Frequency of responses of all respondents ...............................................................111
Figure 4.6.: All of the results in 2D view ....................................................................................112
Figure 4.7.: All of the results in 2D view with some cities .........................................................113
Figure 4.8.: All of the results in 3D view ....................................................................................114
Figure 4.9.: Spreadsheet of Poznań residents ..............................................................................116
Figure 4.10.: 2D view of Poznań residents’ results .....................................................................117
Figure 4.11.: 3D view of Poznań residents’ results .....................................................................118
Figure 4.12.: Spreadsheet of Wielkopolska residents’ results .....................................................120
Figure 4.13.: 2D view of Wielkopolska residents’ results ...........................................................121
Figure 4.14.: 3D view of Wielkopolska residents’ results ...........................................................122
Figure 4.15.: Spreadsheet of Other respondents ..........................................................................124
Figure 4.16.: 2D view of Other residents’ results ........................................................................125
Figure 4.17.: 3D view of Other residents’ results ........................................................................126
Figure 4.18.: Spreadsheet of female results .................................................................................128
Figure 4.19.: 2D view of female results .......................................................................................129
Figure 4.20.: 3D view of female results .......................................................................................130
Figure 4.21.: Spreadsheet of male results ....................................................................................132
Figure 4.22.: 2D view of male results ..........................................................................................133
Figure 4.23.: 3D view of male results ..........................................................................................134

xviii
Figure 4.24.: Distribution of all the labels ...................................................................................139
Figure 4.25.: Distribution of labels from The West .....................................................................140
Figure 4.26.: Distribution of labels from The North ....................................................................140
Figure 4.27.: Distribution of labels in The East ...........................................................................141
Figure 4.28.: Distribution of labels in The South ........................................................................141
Figure 4.29.: Spreadsheet of all the results for Poznań ................................................................148
Figure 4.30.: 2D view of all the results for Poznań .....................................................................149
Figure 4.31.: 3D view of all of the results for Poznań .................................................................150
Figure 4.32.: Spreadsheet of Poznań residents for Poznań map. .................................................151
Figure 4.33.: Spreadsheet of Wielkopolska residents for Poznań map........................................152
Figure 4.34.: Spreadsheet of Other residents for Poznań map .....................................................153
Figure 4.35.: Labels assigned to Poznań speech ..........................................................................154
Figure 4.36.: Self identified Kashubian population (www.kaszubia.com). .................................161
Figure 4.37.: The sum of all respondents with circled area of self-identified Kashubian
population. ...................................................................................................................................162
Figure 6.1.: A-curve distribution of Informant F1 speech ...........................................................209
Figure 6.2.: A-curve distribution of Informant F2 speech ...........................................................211
Figure 6.3.: A-curve distribution of Informant F3 speech ...........................................................214
Figure 6.4.: A-curve distribution of Informant F4 speech ...........................................................215
Figure 6.5.: A-curve distribution of Informant F5 speech ...........................................................217
Figure 6.6.: A-curve distribution of Informant M1 speech ..........................................................219
Figure 6.7.: A-curve distribution of Informant M2 speech ..........................................................219
Figure 6.8.: A-curve distribution of Informant M3 speech ..........................................................220

xix
Figure 6.9.: Distribution of rates of Poznań words for All Informants ........................................226
Figure 6.10.: Poznań words in conversation ................................................................................227
Figure 6.11.: Distribution of Informants According to the Number of Poznań Words in
Elicitation .....................................................................................................................................239
Figure 6.12.: Poznań words in elicitation ....................................................................................244
Figure 7.1.: Production division of Polish dialects (Urbańczyk 1962) ........................................263
Figure 7.2.: Perceptual view of all of the results in 2D ...............................................................263
Figure A.1.: The perceptual map of Poland template ..................................................................287
Figure A.2.: The perceptual map of Poznań template .................................................................288
Figure B.1.: Areas indicated by lines around them ......................................................................290
Figure B.2.: Areas indicated by lines colored in Adobe Photoshop ............................................291
Figure B.3.: Areas indicated only by labels. ................................................................................292
Figure B.4.: Areas indicated only by labels colored in Adobe Photoshop. .................................293
Figure B.5.: Areas indicated by mixed techniques ......................................................................294
Figure B.6.: Areas indicated by mixed techniques colored in Adobe Photoshop........................295
Figure B.7.: Areas indicated by shading. .....................................................................................296
Figure B.8.: Areas indicated by shading colored in Adobe Photoshop .......................................297
Figure E.1.: Screenshot of the question about the Poznań word use ..........................................305
Figure E.2.: Screenshot of an indication of social situation of use. .............................................305
Figure E.3.: Screenshot of the question about general Polish word use. .....................................305
Figure E.4.: Screenshot of the question about other word use.....................................................306
Figure E.5.: Screenshot of the social situation indication for other word....................................306

1
CHAPTER 1
THEORETICAL BACKGROUND
The research proposed in this dissertation is concerned with speech in the city of Poznań,
in Poland, and the ways in which people perceive it. In order to situate Poznań speech, a
background of the condensed history of Poland, and the region of Wielkopolska will be given in
tandem with changes in the language, which occurred simultaneously. Moreover, a concise
description of language varieties spoken in Poland will be outlined.
1.1. HISTORY OF POLAND
The origins of contemporary Poland can be found in the West Slav tribes whose
homeland was discussed over the years by various scholars and, depending on the interpretation
of the archeological data, it can be placed in multiple places in Europe. A Polish scholar, Hanna
Popowska-Taborska (1991), has compiled research on various theories about the original home
of the Slavs, and summarizes three main directions prevailing over the years (as cited in Barford
2001):
After many decades of investigations and debate on the prehistory of the Slavs
modern linguists have come almost at the same time to three extremely different
theories which derive the ancestors of the Slavs:
• from the region to the west of the middle Dniepr,
• from the area between the Oder and Vistula rivers,
• from the territory to the south of the Carpathians, in the Danube valley
(37)

2
Whichever theory we choose to follow further migration and divisions of the tribes
showed that after the Slavs expanded their territories, subtribes were created of the West Slavs,
East Slavs, and South Slavs. Those three groups moved all around central and eastern Europe
and became cradles for nations in various parts of the continent. Out of the West Slavs, the
Polanie, Wiślanie, Pomorzanie, and Mazowszanie became the foundation for the Polish nation.
The Polanie are the tribe that provided the basis not only for what today is considered the
Wielkopolska province, but also the foundation of Poland, since it was in Poznań where the first
capital was located. Moreover, it was in Wielkopolska where the baptism of Poland was
performed on Mieszko I, Chief of Polanie, in 966 and later the coronation of Bolesław the Brave
as the first king of Poland in 1024, establishing Poland as a kingdom (Biskupski 2000: 7-9,
Barford 2001:261-267).
Between the 12th and 14th centuries Poland was divided into provinces and maintained
separate reigns. Such a weakening of power made Poland more susceptible to attacks from other
nations, such as the Tartar or Prussian invasions and power struggles between the provinces. The
years between the 14th and 16th centuries mark the reunification of Poland and more or less
successful unions with countries around Poland. Only the union with Lithuania (1386 - 1795)
gave Poland domination in central east Europe as the Polish Commonwealth. This era was also
described as the “Golden Age” in the artistic sphere of Polish writers, poets, and architects.
Moreover, Jagiellonian University in Kraków was founded in 1364, as the second university in
central Europe. After the death of the last Jagiellonian king, the parliament (Sejm) elected a new
monarch, Stefan Batory (Davies 1982: 61-106). Although his rule was very successful, after his
death the next century was not peaceful for Poland, since the Swedes, Turks, and Muscovites
invaded it. The number of invasions was so great that it came to be known as the “Deluge.”

3
Poland was ruined after a whole century of wars, and the government was non-existent, with
political power struggles and alliances with the neighboring states. The years between 1772 and
1795 mark the time of the three Partitions of the country between Prussia, Austria, and Russia.
When the Third Partition happened in 1795, Poland vanished from the political maps of Europe
until the end of World War I (Biskupski 2000: 15-19). Moreover, soldiers were fighting side by
side with Napoleon Bonaparte in hope of regaining their country’s independence. On November
11, 1918, General Piłsudski proclaimed Polish Independence and became the Head of State. The
twenty years between the wars marked the time of establishing a government and uniting Poland
once again, after the provinces had been divided for 123 years (Biskupski 2000: 21-58).
After World War II, Poland enjoyed true independence only for a short time before the
domination of the Soviet Union was forced upon it for over 40 years. Over this period of time
Poland experienced various events: such as riots in 1968, 1970, and 1976, or 1978 election of
Karol Wojtyła as Pope John Paul II, the rise of Solidarity in 1980, 1981 state of martial law
proclamation, and finally the fall of communism and Lech Wałęsa sworn as a first non-
communist president in December of 1990 (Biskupski 2000). In 1999, Poland joined NATO, and
in 2004 the country became a part of the European Union.
1.2. POLISH LANGUAGE.
When it comes to the language of Poland during the course of history, it can be said that
it was developing alongside and very often served as the last resort where Polish identity could
be preserved, especially during the time of the Partitions. Around the 16th century the royal
government and the Catholic Church took great measures to unify the language into one national
variety. Between the mid 16th century and beginning of the 20th century the national, standard
variety of Polish became the speech of clergy, aristocracy, the nobles, and a small part of

4
laborers and farmers (Davies 1982). The dialects originating in the tribal languages now became
folk dialects spoken mainly by farmers. The differences between the standard variety and the
folk dialects became more and more distinct, and with the Industrial Revolution and influx of
farmers into the cities, the urban varieties also become more defined. Since the beginning of the
20th century up to the present, there have been some changes happening in the language caused
by the migration of a large amount of speakers from East part of the country to the West when
the boundaries changed after World War II. Additionally, equal access to education, the demise
of illiteracy and compartmentalization of various speech types with social class and location also
aided in stimulating change in the language of Poland.1
Modern Polish dialectology started with a publication by Nitsch (1915), and the dialect
divisions that he proposed have been followed ever since with little modification. The map of
dialect divisions was adopted and updated after World War II by Urbańczyk (1962), and this
map is presented in Figure 1.1.
1 The information provided in this part is based on ; http://www.gwarypolskie.uw.edu.pl/index.php?option=com_content&task=section&id=2&Itemid=82 The website is directed by Dr. Halina Karaś, the Director of Polish Language History and Dialectology Department at the University of Warszawa.

5
Figure 1.1. Division of Polish dialects (Urbańczyk 1962) adopted from
http://www.gwarypolskie.uw.edu.pl/index.php?option=com_content&task=section&id=2&Itemi
d=82
We can see that on the map there are six main divisions:
1. Dialects of Greater Poland (Dialekty Wielkopolski)
2. Dialects of Lesser Poland (Dialekty Małopolski)
3. Dialects of Masovia (Dialekty Mazowieckie)
4. Dialect of Silesia (Dialekt Śląski)

6
5. Kashubian Dialect (Kaszuby)
6. New Mixed Dialects (Nowe Dialekty Mieszane)
Each of these dialects has features associated with them, some of which we described as
unique, while others overlap.
1.2.1. DIALECTS OF GREATER POLAND.
The phonetic and morphological features of the dialects of Greater Poland, which are
different from other dialects of Poland or general Polish, are illustrated below on the basis of a
few examples2
1. Lack of mazurzenie in which laminal retroflex or “hushing” consonants are replaced
with alveolar.
:
2. Interlexical voicing of voiceless consonants before voiced consonants and vowels, for
example las urósł ‘woods grew’ into laz u
3. Diminutive morphemes typical only for this dialect -yszek, -iszek, -yszko, -iszko,
-uszek, -aszek , for example kamyszek ‘stone’ = kamyczek (standard Polish),
głowyszka ‘head’ = główeczka (standard Polish), słonyszko ‘sun’ = słoneczko
(standard Polish).
rósł.
4. Adjectival morphemes –ity, -aty different that in standard Polish -isty, -asty , for
example wodnity ‘watery’ = wodnisty, liściaty ‘leafy’ = liściasty.
1.2.2. DIALECTS OF LESSER POLAND
1. Mazurzenie, in which laminal retroflex or “hushing” consonants are replaced with
alveolar. Therefore, consonants rendered as cz, sz, ż, and dż are switched to c, s, z,
2 The features of Polish dialects described are in my translation and based on: http://www.gwarypolskie.uw.edu.pl/index.php?option=com_content&task=section&id=2&Itemid=82 The website is directed by Dr. Halina Karaś, the Director of Polish Language History and Dialectology Department at the University of Warszawa.

7
and dz respectively. For example standard Polish żaba ‘frog’ becomes zaba,
szczególnie ‘in detail’ becomes scególnie
2. Interlexical voicing of voiceless consonants before voiced consonants and vowels, for
example las urósł ‘woods grew’ into laz u
3. Forms of 1st Person Plural in Present Tense are different than in general Polish, as
mogymy ‘we can’ = możemy, muszymy ‘we have to’ = musimy.
rósł.
4. Some verbs are conjugated differently than in general Polish. Instead of the -ę, -esz,
conjugation, the -m, -sz conjugation is used. For example, gwizdom ‘I whistle’ =
gwiżdżę, klaskosz ‘You clap’ = klaszczesz.
1.2.3. DIALECTS OF MASOVIA
1. Mazurzenie.
2. Interlexical devoicing of voiced consonants before voiced consonants and vowels, for
example przód osobny ‘separate front’ = przót o
3. Changing the form of numeral dwie ‘two’ in female gender Nominative and
Accusative into male gender dwa, as in dwa żony ‘two wives’ as opposed to dwie
żony.
sobny.
4. Infinitive with the –ić ending more than with –eć ending for the same verbs, for
example siedzić ‘to sit’ = siedzieć.
1.2.4. DIALECT OF SILESIA
1. Mazurzenie.
2. Interlexical voicing of voiceless consonants before voiced consonants and vowels, for
example las urósł ‘woods grew’ into laz urósł.

8
3. Instead of derivational morpheme for adjectives –any, morpheme –anny is used as in
for example, miedzianny ‘copper’ = miedziany.
1.2.5. KASHUBIAN DIALECT.
The issue with Kashubian is the fact that although on the map it is indicated as a dialect
of Polish, in 2005, the Polish government established a law that gives Kashubian the status of a
regional language3
1.2.6. NEW MIXED DIALECTS.
. The origins of it can be found in the Slavic group, in the Pomeranian
subgroup (Barford 2001). The speakers of it have been under the strong influence of Polish and
German throughout the centuries and are mostly bilingual Polish-Kashubian speakers. Although
the two languages have been in close contact for centuries, Kashubian is virtually
incomprehensible to monolingual Polish speakers, and the debate among scholars remains
whether it should be considered a dialect of Polish or a separate language (Lorentz 1935,
Miodunka 1987). There has been only one grammatical book published so far on Kashubian, and
the efforts to systematically describe the language are still continuing.
The terrain covered by this term is referred to as the ”regained land,” which means that
after World War II, those lands became part of Poland, although before the war they were in
Germany4
3 This information is from the official website of Kaszuby:
. On the other hand, our Eastern territory was trimmed, and therefore people who lived
there before the war moved across the country to the new region. Since this area is fairly new
and made out of a mixture of speakers from various parts of Poland, the differences are even as
http://pl.kaszubia.com/ 4Information presented here about New Mixed Dialects are taken from the following website http://www.gwarypolskie.uw.edu.pl/index.php?option=com_content&task=section&id=2&Itemid=82 The website is directed by Dr. Halina Karaś, the Director of Polish Language History and Dialectology Department at the University of Warszawa.

9
small as a village or town, if a particular group of speakers from one place migrated to the same
location. Therefore, the description of features for the whole region is not feasible with the state
of the current research in that area. This very concise description of the dialectal variation of
Poland serves as an introduction to the discussion of Poznań speech. Poznań as the capital of
Wielkopolska province, and the biggest city there, has an interesting history and developed its
own urban speech.
1.3. HISTORY OF POZNAŃ SPEECH
Gruchmanowa (1999) describes the origins of the urban speech of Poznań as follows:
Polszczyzna mieszkańców miast, zwana także gwarą miejską, wiąże się ściśle z
historią danego regionu, w szczególności zaś z rozwojem i strukturą społeczną
samego miasta.
The Polish of city dwellers, also called the urban dialect, is connected tightly with
the history of a given region, especially with the development and social structure
of the city itself.5
Poznań of the early 20th century was a town that had been ruled by Germans for over 100
years, where more Germans resided than Poles. Teaching of the Polish language was banned in
elementary schools, and the part of Poznań society who held the most power, wealth, and
education was German. The town did not have Polish speakers with higher education, and most
of its residents were involved in trading and commerce. Such a social and cultural situation
influenced the evolution of the local language. Already at the beginning of the 20th century, the
first publications by Biliński (1922) and Tomaszewski (1927) addressed the mistakes made by
Poznań speakers, this statement was cited in Gruchmanowa:
(1999:20)
5 All Polish quotations throughout all the chapters are my translations.

10
Są wielkie nierówności oczywiście, nie każdy mówi jednakowo, zależy to od
stopnia wykształcenia, od dłuższego lub krótszego oddziaływania niemczyzny, od
tego, czy się wyższe wykształcenie zdobywało w języku ojczystym, czy obcym,
czy się stykało wiele z władzami niemieckiemi.
There is lot of unevenness, of course, not everybody speaks the same way, it
depends on the level of education, on the longer or shorter time of the influence of
German, whether you received higher education in the native language or foreign,
and whether you were in a close contact with the German authorities. (1999:21)
From this description cited by Gruchmanowa, and the description of features associated
with Poznań speech, we can see that the influence of German on Polish in Poznań was
tremendous and left a mark on every level of the language, with phonological, morphological,
and syntactic alterations. However, 1945 marks a significant change in the history of the town.
After the end of World War II, industry in Poznań started to develop, which in turn triggered a
transformation in the social strata. Many Poznań dwellers changed their occupations from
merchants to heavy industry workers. Economic improvements gave way to the development of
a higher education system and a new group in society–the intelligentsia. The intelligentsia group
was characterized by members who were highly educated, wealthy, and were often involved in
the political life of the community. Economic change also facilitated the migration of people
from rural to urban areas. As a consequence, Poznań received an influx of speakers from
neighboring villages who brought with them their own varieties of speech, and they also had to
adjust to the dialect that they encountered in the city. This historical and social situation has
influenced the development of the speech of Poznań:

11
Stanowi ona jednakże jedną z warstw codziennej, potocznej polszczyzny
Poznania. Znamienna jest bowiem nie tylko dla środowiska niewykształconego
(głównie pochodzenia wiejskiego), lecz także dla części inteligencji w
określonych przedziałach wiekowych: pokolenie starsze (powyżej 60 lat) z
dawnymi poznańskimi cechami oraz średnie (35-60 lat) kontynuujące w różnym
stopniu i zakresie przejęte z otoczenia, zwłaszcza rodzinnego, nawyki językowe z
okresu międzywojennego.
The urban dialect of Poznań] is one of the many levels of casual, everyday Polish
speech in Poznań. It is characteristic not only for the low educated community of
speakers (coming mainly from the rural areas), but also for parts of the
intelligentsia group in certain age cohorts: the older generation (above sixty years
old) displaying the archaic features of the Poznań speech and the middle
generation (thirty five to sixty years old) continuing in the different degree and
extent the language habits acquired their environment, especially from their
family, from the interwar period. (Gruchmanowa 1999:24)
From the above description, a picture emerges of the complexity in the speech of the
Poznań community. The country’s history and culture shaped the society of the town, giving way
to a mixture of influences: German language, urban merchant speech, rural speech, labor
workers’ jargon, and the cultured speech of the intelligentsia. Each historical event and
individual experience of the speakers added to the shape of the contemporary speech in Poznań.
The review of research presented below focuses on the description of the urban speech of
modern-day Poznań.

12
1.4. RESEARCH ON POZNAŃ SPEECH CONDUCTED AT ADAM MICKIEWICZ
UNIVERSITY.
Adam Mickiewicz University in Poznań, Poland, has been the cradle for research on the
urban dialect of Poznań for over twenty years. Gruchmanowa, together with Walczak, Witaszek-
Samborska, and Piotrowicz, were the crucial team of researchers who have investigated Poznań
speech throughout the years.
1.4.1. SPEECH PRODUCTION RESEARCH ON URBAN DIALECT OF POZNAŃ
Gruchmanowa was the first individual to publish a contemporary compilation of articles
concerning the speech of Poznań residents. She also defined the type of speech in which she was
interested:
Pogranicze stylu potocznego polszczyzny ogólnej i dialektów ludowych stanowi
miejska polszczyzna potoczna zwana na ogół gwarą miejską. Uważa się ją za
społeczną odmianę języka i przypisuje warstwie niewykształconej, głównie
ludności wiejskiej osiadłej w miastach i jej potomkom, którzy nie weszli do
warstwy inteligencji...Jednakże w Poznaniu, jak wykazują zebrane materiały
językowe, cechy dialektu wielkopolskiego, miały i mają szeroki zasięg społeczny
(obejmują również warstwy inteligenckie).
The area overlapping the casual general Polish style and rural dialects makes a
casual urban speech known as urban dialect. This speech is considered a social
type of language variety used by uneducated group of speakers and their
descendents, migrated mainly from rural areas, and living in the city but never
entering the intelligentsia group…However in Poznań, as the research indicates,
13
the features of Wielkopolska province dialect had and still have a vast scope in the
society (it includes also the intelligentsia). (1987:8)
This speech is a compilation of various types and styles of Polish. Not only the rural
dialects, jargons and casual speech add to the mix, but also the spoken national language has its
influence on the shape of urban speech in Poznań. Thus, we can think about the speech of
Poznań as a complex entity, which can be described through the linguistic features that it
possesses:
Opisane w poszczególnych rozdziałach zjawiska językowe charakterystyczne dla
polszczyzny Poznania nie oznaczają, iż są one wyłącznie poznańskie czy
wielkopolskie. Wiele cech ma szerszy zasięg geograficzny...Przedstawiona w
obecnej formie problematyka ukazuje nam specyfiką polszczyzny Poznania w
powiązaniu z dziejami regionu, miasta i przeobrażeniami społeczno-
gospodarczymi. Nie jest to jednakże pełne opracowanie polszczyzny Poznania.
The description of linguistic phenomenon in the following chapters as
characteristic of Poznań speech does not mean that they are solely features of
Poznań or Wielkopolska. Many features have a broader geographical
application…The following presentation is concerned with the speech of Poznań
in connection with the history of the region, the city and its socio-economic
developments. However, we do not claim to present the full picture of Poznań
speech. (Gruchmanowa 1987: 12)
Poznań speech possesses features in every linguistic dimension that are specific to this
community. Gruchmanowa (1999) describes phonetic, morphological, syntactic, and lexical
features of Poznań speech in detail; however, only a few examples are presented below:

14
1. Upraszczanie grup spółgłoskowych: bardziej » barzej, drży » dży,
bliższy » bliszy.
2. Dźwięczne z w wyrazach zapożyczonych: zerweta
3. Godnyh uwagi jest kilka formacji słowotwórczych. Do jednej z nich
należy zdrabniający przyrostek: –oszek zamiast –aszek: roboszek, oraz -iszczko:
dzieciszczko
4. Zgrubienia nacechowane ekspresywnie: -ol (ogólnopolskie –al) Bartol
(Bartal)
5. Słowo posiłkowe być. Odmiana...z udźwięczoną grupą spółgłoskową
jezdem, jezdeśmy.
6. Dla trybu rozkazującego charakterystyczne są takie gwarowe cechy
fonetyczne: -przejście –aj w –ej: dej, wyrzucej.
7. Czas przeszły czasowników wyraża się za pomocą konstrukcji zostać +
bezokolicznik (niem. bleiben + bezokolicznik), na przykład: On został stać.
8. Powszechnie używa się w Poznaniu zwrotu czekać za kimś, kalkującego
niemiecką konstrukcję warten auf jemand
9. W obrębie warstwy germanizmów przeważają właściwe zapożyczenia
wyrazowe: afa, bana, blubrać, szabel .
10. Kalki znaczeniowe z niemieckiego ... powstają w wyniku dosłownego
tłumaczenia świętojanka (niem. die Johannisbeere), macoszka (niem.
Stiefmütterchen).

15
1. Simplifications of consonant clusters, [as for example] bardziej » barzej
‘more’, drży » dży ‘shivers’ bliższy » bliszy ‘closer’.
2. Voicing of consonants in borrowings z [instead of s, for example] zerweta
instead of serweta ‘table cloth’.
3. There are s few morphemes worth mentioning [that either do not exist in
general Polish or have a different form from those in general Polish] One of them
is a diminutive morpheme –oszek instead of –aszek roboszek ‘insect’ instead of
robaszek, and –iszczko: dzieciszczko ‘baby’ [- non existent in general Polish ].
4. Expressive augmentative morpheme –ol instead of general Polish –al as in
Bartol instead of Bartal ‘Bartholomew’.
5. Auxiliary to be conjugated [in present tense] with voiced consonant
formation, jezdem instead of jestem ‘I am’, jezdeśmy instead of jesteśmy ‘we are’
and so on.
6. For imperative there are characteristic patois features: –aj morpheme [for
general Polish] changes into –ej, as in dej [instead of daj ‘give’], wyrzucej
[instead of wyrzucaj ‘throw away’].
7. Past tense is expressed by a construction borrowed from German bleiben +
infinitive ‘became + infinitive’, as in On został stać ‘He became to stand (He
stood)’.
8. Commonly used is the construction of Czekam za tobą ‘I wait for you’
[instead of Czekam na ciebie] a calque from German expression warten auf
jamand ‘to wait for someone’, in which general Polish preposition na was
changed into za and required case change from Accusative to Instrumental.

16
9. Among the layer of German words, the leading group is made of
borrowings from German, [as for example]: afa ‘monkey’ [(German der Affe)],
bana ‘tram’ [(German die Bahn)], blubrać ‘to talk nonsense’ [(German
blubbern)], szabel ‘green beans’ [(German schabel)].
10. Semantic calques from German, in which the word was translated exactly
from German, for example świętojanka ‘black currant’ (German die
Johannisbeere), macoszka ‘violet’ (German Stiefmütterchen). (24-69, numbering
mine).
This short list depicts only some features of Poznań speech, and they are used by
different groups of speakers in Poznań. The group of scholars lead by Gruchmanowa was
interested in describing the features of the speech of people from the intelligentsia. All research
described by Witaszek-Samborska (1985) was conducted based on questionnaire and audio data.
She used 64 respondents who filled in the questionnaire, and 43 of them were also recorded. All
of the informants were part of the intelligentsia group based on their education level: high school
diploma or college degree. When residency was considered, respondents who were either native
to the city or lived in Poznań for at least 30 years were included. Age division was established in
three ways: 1) the oldest generation, 60 to 80 years old (2 recorded, 7 recorded and
questionnaire, and 4 questionnaire only); 2) the middle generation,: 35 to 59 years old (3
recorded, 12 recorded and questionnaire, 8 questionnaire only); and 3) the youngest generation,
20 to 34 years old (6 recorded, 13 recorded and questionnaire, 7 questionnaire only) (Witaszek-
Samborska 1985:9). Although the researchers analyzed the data that was gathered on all
language levels, for example phonological, morphological and syntactic, the most relevant

17
analysis for this dissertation is lexical level. In the research group, the primary interest of
Witaszek-Samborska is the lexical layer of Poznań speech:
Podejmując próbę fragmentarycznego zestawienia regionalnego słownictwa
poznańskiej inteligencji (pełne opracowanie nie jest możliwe do momentu
ukazania się słownika polszczyzny poznańskiej) posłużono się tu metodą
kwestionariuszową, bowiem materiał pochodzący z nagrań jest pod względem
słownictwa przypadkowy i nie pozwala na wyciągnięcie wniosków w sprawie
stopnia zakorzenienia wyrazów o graniczenym zasięgu terytorialnym.
In an attempt to create a fragmentary description of regional lexicon of Poznań
intelligentsia (the full description is not possible untill the creation of a dictionary
of Polish speech in Poznań) the questionnaire has been used because the data
obtained from the recordings is coincidental when it comes to the lexicon and it
does not allow to assert results concerning the entrenchment level of regionally
restricted lexemes (1987: 336).
She divides the lexemes into two groups: native Polish and loan words from German.
Within native words there are three subgroups: 1) regional lexemes, which are permitted in
casual speech; 2) Wielkopolska province dialect lexemes, which are normally not permitted in
cultured speech; and 3) Poznań colloquial lexemes, which are connected to the city’s realities,
often restricted to a specific social group. Within the German loanwords there are four groups: 1)
old loan words, which are known in general Polish but considered archaic except for Poznań and
the Wielkopolska province, 2) contemporary loan words, 3) calques, and 4) semantic calques.
All of the above categories are represented in the speech of Poznań residents. The three main
conclusions are the following:

18
1) Najliczniejszą grupę, zarówno wśród słownictwa rodzimego jak i
germanizmów, stanowią wyrazy recesywne w przekroju pokoleniowym. Im
młodszy respondent, tym mniej prawdopodobne, że będą używać gwary. Liczne
są także wyrazy znane biernie, lecz nie używane przez współczesnych
wykształconych poznaniaków, 2) Słownictwo najsilniej zakorzenione,
przekazywane z pokolenia na pokolenie, to przede wszystkim nazwy
przedmiotów i zjawisk związanych z najbliżczym otoczeniem człowieka, a więc
funkcjonujących głownie w sytuacjach domowych, rodzinnych, oraz 3)
Najbardziej charkterystyczne dla Poznania i Wielkopolski wyrazy bywają
świadomie używane (z zabarwieniem żartobliwym) w celu stylizacyjnym.
1) The biggest group of words, native and German loanwords combined, are those
which are recessive in regard to the age of the respondents. The younger the
respondent, the less likely is he or she to use a urban speech. Also numerous are
expressions that are passively known, but not used by contemporary highly
educated Poznanians, 2) The vocabulary with the strongest prevalence, passed on
from one generation to another is the one connected with objects and actions
happening within the closest ambience of the speakers, therefore functioning
mostly in home or family situations,3) Vocabulary items that are most
characteristic for Poznań and Wielkopolska tend to be used consciously as humor,
for stylistic purposes (Witaszek-Samborska 1987:346).
The picture emerging from this research shows that Poznań vocabulary is mostly used by
the oldest generation in the most intimate family situations and as a humorous stylistic device.
As much as this research seems to be describing the speech of Poznań, one note needs to be

19
made about the methodology employed. The questionnaire used in this study asked the
respondents if they used a given word and then to give a definition of it. Such an approach was
considered by Witaszek-Samborska (1987) to measure speech production and reflect the usage of
Poznań words among the speakers contained within the sample.
1.4.2 SPEECH PERCEPTION RESEARCH ON URBAN DIALECT OF POZNAŃ
The above study was concerned with the production of Poznań speech, but the
researchers also conducted a survey to explore the perception of the city’s speech by its
residents. Witaszek-Samborska and Piotrowicz (1998) conducted a survey among 150 native
residents of Poznań. Those informants were asked four questions:
1. Czy istnieje, Twoim zdaniem, coś takiego jak gwara poznańska? Jeśli tak, to
czym się różni od języka mieszkańców innych miast? 2. Gdzie, kiedy, w jakich
okolicznościach stykasz się z gwarą poznańską? 3. Czy sam (sama) posługujesz
się gwarą poznańską? Jeśli tak, to dlaczego, kiedy, w jakich sytuacjach? 4. Czy
mówienie po poznańsku jest czymś nagannym, wstydliwym? Spróbuj uzasadnić
swoją odpowiedź.
1. In your opinion is there something like a dialect of Poznań? If yes, what makes
it different from the language of the residents of other towns? 2. Where, when and
in what circumstances do you encounter the dialect of Poznań? 3. Do you use the
dialect of Poznań? If yes, then why, when, and in what type of situations? 4. Is
using the dialect something negative, shameful? Provide explanations for your
answers. (1998: 198)
Question one revealed that the majority of respondents reported Poznań speech to exist,
and only four participants reported opposing views. Moreover, it appears that Poznań residents

20
taking part in the survey noticed differences between their speech and other Poles on every level
of the language, although the most prominent were the differences in the lexicon and prosody.
Half of the respondents (75) made a comment about Poznań words being different from those in
other parts of Poland, and 40 respondents made a comment about differences in the intonation,
the ”singing” nature of Poznań speech (1998:195). Two of the most common responses for
question two were those in which the respondents encountered the dialect mostly in
conversations at home and hearing it during special interest shows on the radio or television.
They also said that very often they used the dialect-specific lexical items in jokes. Concerning
question three, more than half of the respondents denied using the dialect. Those who said that
they used it, again, most commonly attributed it to family, casual, and humorous situations, with
only a few who reported using the dialect all of the time across all social situations. Question
four was the basis for an interesting pattern. Respondents from the oldest age group expressed
the most tolerance toward the dialect, but the youngest informants had negative categorical
statements:
Jeżeli dana osoba potrafi mówić tylko gwarą, no to wstyd.
If a person can only speak the dialect, well then, shame on him (1998:198).
However, overall,
Poznaniacy deklarują daleko idącą tolerancję w stosunku do gwary miejskiej, są z
niej nawet dumni, choć doskonale zdają sobie też sprawę, że nie zawsze i
wszędzie można jej używać...Niespodziewanie też okazało się, że w poglądach na
język swego regionu poszczególne pokolenia poznaniaków nie różnią się. Cieszy
a nawet zaskakuje, że widzą jej historyczny i kulturoznawczy charakter. Zgodnie

21
z oczekiwaniami ani płeć, ani zawód czy poziom wykształcenia nie wpływały na
udzielane odpowiedzi.
Poznań residents declare a high level of tolerance toward the urban dialect, they
are even proud of it, although they understand that it should not be used at all
times in all types of situations…Surprisingly, it turned out that in the views on the
language of their own region various generations of Poznań residents are not
different from one other. It is pleasing that the residents see the social and
historical influence that the dialect had. Just as expected, gender, occupation, or
education were not a significant factor in explaining the variation in attitudes
toward the dialect (Witaszek-Samborska and Piotrowicz 1998: 200).
To sum up, the research done in Poznań revealed that people living there not only
actively used the dialect, but also they were aware of its existence and oftentimes were proud of
it. This kind of attitude might be accounted for by a concept most recently referred to as
“enregisterment,” which is defined by Remlinger as:
the recognition of the relationship between specific linguistic features and certain
cultural values...These values are tied to people through notions that link language
use to beliefs about “authentic” local identity and the uniqueness of the dialect;
speakers’ local authenticity is, in part, based on the use of enregistered
features…speakers rely on enregistered features to perform this identity for locals
as well as for outsiders (2009:119).
This notion connects speech with beliefs about speech. At the same time it leads
to the process of depicting the nature of such a relationship.

22
1.5. ENREGISTERMENT.
The origins of this notion can be found in Silverstein’s (1995, 2003) Orders of
Indexicality where he describes the process by which linguistic features first are correlated with
social identity, then an ideology is attached to such a correlation, and finally the indexical
meaning becomes perceived as meaningful according to another ideology. The idea of
enregisterment was first suggested in an article by Asif Agha (2003). Soon after, Barbara
Johnstone, Jennifer Andrus, and Andrew E. Danielson (2006) proposed blending Agha’s idea of
enregisterment with Michael Silverstein’s orders of indexicality (Adams, 2009:115).
Johnstone et al.’s (2006, 2009) research documents the process of enregisterment in
which linguistic features originally connected with a social class were transferred to a place to
indicate local pride in the speech of Pittsburgh. What is interesting in every study done on the
enregisterment, whether in Pittsburgh (Johnstone 2009), the Upper Peninsula of Michigan
(Remlinger 2009), England (Beal 2009), or Wisconsin (Remlinger et al. 2009), is that in order
for the third level of indexicality to appear there had to be an economic change in which the
speech of the social class originally connected with linguistic features could be reapplied to a
place. On the second level of indexicality certain linguistic features have been attached to a
social class, very often a working class, as for example copper miners in Michigan, or steel
factory workers in Pittsburgh. It was only when the economic change happened, and the locality
was exposed to tourism, that the social group could have been “freed” from the one-to-one
correlation between class and linguistic features; this relationship transferred onto the mental
concept of the place (Johnstone at el. 2006). Moreover, Johnstone makes a valid point that,
“sociolinguists interested in understanding the patterns of variation and change in the speech
community need to pay attention not just to people’s talk but to the metapragmatic activities in

23
which they create and circulate ideas about how they talk” (2006:99). Such an observation
emphasizes the importance not only for speech production, but also the way speakers think about
their speech.
The idea of enregisterment is appealing in many ways, but there is a premise that could
receive more attention. Namely, the indexical meaning asserted by the residents in all the studies
described above (Johnstone 2009, Beal 2009, Remlinger et al. 2009) is based on a very limited
number of linguistic features, for example vocabulary and idiomatic expressions:
The emergence of Pittsburghese as a stable, dictionary-like list of words and
phrases, and its emerging use in the making of explicit social identity claims,
have gone hand in hand with the emergence of “the Burgh” as a place to identify
with, and these processes have been driven in large part by economic change.
(Johnstone at el.2006: 99, emphasis mine)
I believe that this part of the theory should be investigated in-depth in order to explain in
what way speakers are able to make a firm claim about their identities based on very limited
amounts of linguistic features.
Lastly, the concept of place in the enregisterment approach is interesting also, as it is not
referring to a specific geographical location but to a mental concept that people create and
attribute to it the characteristics of belonging to Pittsburgh:
Understanding the geographical, linguistic and historical contexts in which
attention to and talk about dialect emerges and circulates enables interactional
sociolinguists and students of folk linguistics to understand the ebb and flow of
such activities over time. (Johnstone at el. 2009:99)

24
Based on this quotation, it seems that mental concepts such as Pittsburgh speech could be
put onto perceptual maps in the way proposed by Preston in his “Draw-a-map methodology”
(1989).
1.6. PERCEPTUAL DIALECTOLOGY.
Preston (1989) marks the main interests of ethnography of speaking as those concerned
with speakers’ beliefs about people's speech in various places, the standard and other varieties of
language, respondents' perceptions of the differences in speech between local speakers and other
locations, imitations of other’s speech, and anecdotal stories about the reason and origin of those
perceptions (4). He lays down the fundamental distinction between two types of meaning of the
notion of perception:
Perception, of course, might be understood in two ways. First, microlinguistically-
i.e. how are linguistic categories (at any level) which demonstrate considerable
variation processed at all...Second, macrolinguistically (ethnographically)-i.e.
what are the ordinary speaker's understandings of language variation?...Where
does an ordinary speaker believe language differences exist geographically?...It is
this macrolinguistic perspective on language perception which is taken in these
studies. (1989:2)
We can see here that the study of perception in folk linguistics is not the same as what
other linguists might understand this term to mean. What Preston is describing as perception is
speakers’ beliefs and knowledge about others’ speech. It is what the speakers think about the
people speaking varieties perceived as similar or different. This definition will be used in the
proposed research. However, one major component is missing in Preston’s description of the
perception of speech, namely how such concepts are created. He redefined a model describing

25
the way language study is exercised in his later publication of Folk Linguistics (2000) together
with Niedzielski in which he establishes the relation of folk linguistics to other approaches for
the study of language in their reinterpretation of Hoenigswald’s (1966) triangle, wherein he lays
out the main concerns of language study, shown in Figure 1.2.
Figure 1.2. Hoenigswald’s (1966) triangle of concern.
This triangle is a model (originally created in 1966, and containing only a, b, and c)
which is aimed at showing three approaches to language study. Hoenigswald explains this
triangle, as a) what goes on (understood here as language in the center of interest for theoretical

26
linguistics), b) how people react to what goes on, and c) what people say about all this (1966:20).
Sections b and c are what speakers say about their language. Preston and Niedzielski expand on
the b and c notions by adding b’ and c’ which are the subconscious layers of speech. They
describe details of those layers in the following manner:
1. What people say about what is said;
2. What people say about how it is done;
3. What people say about how they react to what is said; and
4. What people say about:
a) Why they say what they do, and
b) Why the react the way they do” (2000:30).
The above notions emphasize the importance of studying the underlying subconscious
nature of speech perception; however, they do not address the question of how the perceptions
are developed into notions that people can discuss. This model never gets into the issue of how
people create perceptions about other people’s speech with partial information or with no
information at all (see below in Chapter 2). Furthermore, Preston (1989) raises an issue which
puts emphasis on the importance of speech perceptions in the study of language:
Even if such popular views of language, particularly those of language variation,
are not primary contributors to rule-making and modification, they are not a bit
the less interesting. As a part of a speech community's set of beliefs about
language and use, they are essential knowledge for an approach to linguistics
which emphasizes societal and interactional context. (1989:3)
He emphasizes the value of beliefs about language in the social context of speech.
Therefore, it could be expected that sociolinguistics would be a great venue to discuss the issue

27
of speech perception. However, as Preston says, “there is a limited tradition among its
[sociolinguistics], adherents of folk linguistics collection and interpretation” (2000:30). He lists
Feagin (1979), Macaulay (1977), and Labov (1966) as those who included folk linguistics in
their research. However, he comments on Labov that his “use of folk-linguistic data is
enterprising, for he tries to show how they are consistent with and shed further light on variable
performance data and subjective reaction test results” (2000:31). From this account it seems that
in linguistic research there has not yet been an approach that would combine the study of
language and its perception. And even more importantly, through such research, the importance
of both facets of language would be recognized as crucial to our understanding of speech (see
below in Chapter 2).
Another important issue which has been discussed by Preston (1989) is the way he
developed the methodology of “Draw-a-map:”
Exactly what detail fieldwork map for such a task should contain is difficult to
determine. In a trial run using a blank outline map of the entire country, a number
of respondents agreed they could not perform the task. The difficulty in
determining the proper amount of detail may be further complicated by the
general social and educational characteristics of the respondents. (1989:25)
The amount and type of details put on a map is crucial for the study of perceived dialect
divisions, as depending on it the outcome of the results might be different:

28
Many could not escape the notion that state lines were dialect boundaries, a fact
which supports the conclusion that nonlinguists' impressions of the position of
dialect boundaries are historical-political, not linguistic...Perhaps a map with
major rivers, cities, and mountain would have prevented this sort of response.
(Preston 1989:25)
In the research conducted by Preston (1989) using the ”Draw-a-map” methodology, he
used a map with only state lines on it, to be filled by respondents from Hawaii, Michigan,
Indiana, New York, and New York City. The respondents were asked to draw areas of regional
speech on the map and label them. In the second part of the task, they were asked to rate speech
in states in regard to two features of “Correct” and “Pleasant”. The way the individual maps were
converted into result maps with areas of agreement involved establishing the threshold of how
many mentions of a region will make it enough to create a generalization. In the Hawaiian part of
the study, the number high enough for an area to show up on the results map was five
respondents out of 35 (1989: 29). When deciding on a generalization of the areas included on the
results map, Preston “follows the lines of greatest agreement, creating bundles of perceptual
isoglosses” (1989:28). So, what he is creating are isoglosses surrounding categorical entities on
the map. Let us remember that his study involved 35 respondents; thus, five of them represent
only 14% of the data. This means that what the results map shows as salient perceptual areas
might be a result of a 14% level of agreement. Of course, in data presentation we need to make
some arbitrary decisions, but in this case the impression is wrongly created, in which The South
and New England appear as equally salient areas, but the latter was indicated by the respondents
6 times and the former 33 times out of 35 possible (1989:26).

29
In the part of his study surveying Hawaiian respondents, Preston’s main concern is how
the areas drawn on the maps can be compared to traditionally drawn isoglosses (Kurath 1949,
Shuy 1967). Since in the process of establishing each border of speech areas he is not only
approximating between the differences shown by the individual speakers, he is also constantly
comparing boundaries drawn for speech production with the results he received (1989:28).
However, earlier he firmly asserted that, “in the hand-drawn maps presented in the following
studies, there is no suggestion that the correspondences to production dialect facts are the
primary goals of the investigation” (1989:19). The way Preston (1989) is researching perceptual
maps seems as he might want to situate himself in a position to other research done in
dialectology, but he could have shown how the perceptual maps can be studied on their own.
Preston (1989) continues the discussion concerned with the comparison of perceptual
maps to production maps. He describes his position toward classic dialectology in the following
words:
Though there is a long-standing tradition of criticism of earlier dialectologists'
over-concern with rural, uneducated speech and their failure to systematically
characterize important social characteristics of their respondents, there is, as well,
agreement that dialect boundaries which support real lexical, phonological, and
morphological differences have been substantiated in their work. (1989:119)
Such an approach allows him to use the maps of features of speech distribution as an
example to compare with his results. One of the contrasts that he notices is that the respondents
perceived a lot more detail in the distribution of speech in the west. The second observation is
that the perceptual isoglosses do not correspond to the production isoglosses. We have to keep in
mind that the traditionally drawn isoglosses are mainly concerned with the situation in the

30
eastern part of the United States. Figure 1.3 shows Preston’s combined map of production and
perception isoglosses for Hawaiian respondents, in which we can see that they do not match.
Figure 1.3. Preston’s (1987) map of production and perception for Hawaiian respondents.
This poses a question of the purpose of such a comparison. Preston describes the relation
between the two kinds of maps in the following manner:

31
These several points of comparison between perception maps and other maps of
cultural and linguistic facts suggest that dialect perception may be generated by
linguistic differences, popular culture caricatures, and local identification
strategies. On the other hand, that variety perception is different from general
popular culture or production dialect boundaries seems unquestionable.
(1989:122)
However, he never addresses the issue of how such strategies come about and what
mechanisms make them interact with each other to produce these types of results. In a close
analysis of the results of the perceptual maps, he notices two opposite notions appearing
together: the caricaturistic linguistic features which are compelling for the speakers in
determining the areas described as having a “dialect,” and large areas unaccounted for by any of
the speakers. “This space suggests that respondents have no experience with an area, that an area
has no caricaturistic linguistic features or stereotypes, or that an area has no popular cultural
notoriety” (1989:121). His reasoning is interesting, but what if speakers who do not have any
experience with a certain place or speech of that location were still able to create very definite
perceptions? Preston does not address the nature and process which could be responsible for
those two opposing mechanisms.
Lastly, Preston points to the limitations of map drawing methodologies using the
following words:
There is little that can be done to improve the instrument which elicits a hand-
drawn map. The potentially damaging influence of state lines and other such
information on the map which the respondents actually use has been discussed,

32
but some inclusion is necessary, and, in fact, state lines often turn out to be salient
perceptual (though rarely production) boundaries. (1989:125)
However, there has been another technique developed, in a way, as an alternative to what
Preston established, by Susan Tamasi (2003). The technique is called pile sorting.
1.7. PILE SORTING
Tamasi (2003) took the task of measuring linguistic perception in a slightly different
direction than Preston (1989) by adopting the method of pile sorting index cards representing
states and social and linguistic traits for linguistic research. She designed five tasks for the
informants to complete. First, they were asked to sort 50 index cards with the names of states on
them into piles of groups that the speakers perceived as having similar speech. Second, they were
given another 23 linguistic and social characteristics on index cards and asked to attach them to
the piles created earlier. Third, they listened to four speech samples from Illinois, Georgia,
Missouri, and New Jersey as an example of a matched-guise experiment and again were asked to
attribute the social and linguistic features listed on the index cards. Fourth, they were interviewed
with three questions aimed at eliciting their attitudes toward speech varieties in the United States
and the tasks themselves. Fifth, they completed a questionnaire collecting their demographic
information. Her methodology revealed several findings. Her research upheld the notion that
people do associate language with location (Preston 1989, Gould and White 1986). None of her
respondents found the aim of the task unusual. They also had no problem in constructing the
piles made out of states. Moreover, Tamasi notes that, “what I find most interesting is that even
when they [the participants] had never heard a speaker from a particular state, they still were able
to categorize the speech there” (2003:94). Unfortunately, this notion is never further developed.
Although we are not able to determine whether statements made by informants (they were

33
recorded while performing the tasks, and encouraged to “think out loud”) stating that they have
never met people from certain locations were actually true, they were assumed to be of this
nature. Using this method she revealed patterns of perception emerging from the informants’
responses.
Tamasi uncovered an important finding in her research:
nonlinguists organize language into regions that are not spatially constrained. So,
while respondents easily associated language and location, spatial orientation was
not a large part of their decision-making process, as would seem natural.
Accordingly, this finding reveals limitations in the methodology used in
traditional Prestonian perceptual studies, which take areal congruity for granted
(2003:94).
This is extremely important in light of Preston’s (1989) findings, in which perceptions
were continuous. We can see that the issue of people’s perceptions is not only complex in nature,
but also different levels of it can be revealed by different methodologies. It is hard not to agree
with Tamasi’s (2003) statement, but I believe that there might be another way of looking at her
work and Preston’s. For one, although her pile sorting method revealed discontinuous speech
regions, we have to keep in mind that the unit she chose to work with is a geopolitical one (i.e.
states), and it is also a sharply defined item. The respondents did not have a chance to cut it in
pieces or to put the same state in more than one pile. Although nobody asked for such an option,
there was no instruction provided to leave any index cards out of the pile sorting. Thus, her
methodology made people choose in a categorical manner, either a given state is similar to
another or not. While Preston’s method makes people draw lines on maps, I believe that his

34
biggest drawback is in the presentation of the results, since through creating generalizations the
variability in the data is lost.
Overall, Tamasi described a pattern of folk views on language in the following words:
In general, we view language variation through a large number of categories that
stem from a complex network of information. Included in this network are
regional, social, linguistic, and personal information…all of these bits of
information link together to form one cohesive system that underlies folk
linguistic perceptions. (2003: 166)
Such an approach is describing a cohesive system in our brain that is composed out of
multiple layers of information, and it may be seen as made out of multiple cohesive systems. The
emphasis is on the fact that the system underling perception is complex and multifaceted. Thus,
she states that, “in other words, people think of language as a very large number of
discriminations that cover a wide range of issues, and they are commonly able to maintain that
many distinctions in their thoughts, attitudes, and discussions of speech” (2003:171). This
research established new ways of doing perceptual studies in linguistics and was consequently
adopted in another study concerned with the way Germans perceive their speech.
1.7.1. PILE SORTING IN GERMANY
Tamasi’s (2003) methodology was adapted in a modified version by Kennetz (2008) to
investigate the nature of linguistic perceptions in Germany to see if the “linguistic wall,” as he
calls it, still exists in the mind of German respondents. His modification was that instead of using
state boundaries as a unit on the index card he chose to use 55 cities from Germany and a few
from Austria and Luxemburg:

35
Even if in reality there may be strong linguistic differences between the dialect of
the city and the dialects of the surrounding countryside, German
informants…made strong connections between cities and language variety. Social
scientists studying cultural geography, such as Zelinsky (1992) and Gould and
White (1986), also show cities as representatives of cultural centers or hearths and
find them to be important in understanding the spatial perception of the layperson.
(2008:96)
In his research, Kennetz found that some of the results and trends were similar to
Tamasi’s results, as for example the complexity of the perceptions noticed by Tamasi (2003,
cited earlier), and that German respondents had used similar linguistic and social features to
describe language variation. On the other hand,
In contrast to Tamasi’s results, in almost every case the piles respondents made in Task 1
were geographically continuous, and this too may have been a result of the strong regional
traditions that are well-established and still well-maintained in an old world country like
Germany (2008:227).
This is an interesting finding, and one that should be investigated in depth, especially in
the context of the social and cultural history of the country, as he pointed out that “the linguistic
differences informants make between eastern and western varieties are certainly indications of
existing social and cultural tensions as both West and East wrestle with the consequences and
realities of living together” (2008:229). As he affirms, such tensions are not unique to Germany
but can be found in various other countries. It seems that Poland is not an exception, as
Witaszek-Samborska (1985, cited earlier) makes an important comment regarding the influence
on speech in the Wielkopolska province by the history between Germany and Poland.

36
Another point that Kennetz states similarly to Tamasi is that “a lack of specific
information influences non-linguists’ perceptions of speech. The greater the distance from the
home locality, the less the informant can say about the language there, resulting in less and less
consensus among informants” (2008:227). This statement seems to be furthering Tamasi’s
comment on the subject matter (cited earlier) in noticing the relationship between the distance
and the degree of consensus coming out of an apparent lack of information. Overall, Kennetz
states that, “the results from this study suggest that the ‘wall in the mind’ is still a major factor in
language perception” (2008:228). He utilized various methodologies and approaches to account
for the perceived differences in speech on both sides of the wall in Germany, and it seems that
social and cultural tensions between the West and East are still true for the German respondents
as they emerge in their perceptions.
As I have indicated throughout this chapter, methodologies and theoretical approaches
previously used have been valuable in setting up my study. In the next chapter, the
methodological framework, under the name of The Linguistics of Speech (Kretzschmar 2009),
will be introduced to create a background for research proposed in the dissertation.
1.8. SUMMARY
In this chapter I have described theories and methodologies that, in my opinion, lay down
the main direction for my study. I have not described all the research done in the area of
perceptual dialectology, sociolinguistics, or cognitive science, as I wanted to address in greater
detail the works that are directly connected to the proposed study. In the next chapter, I will
explain the foundations of the linguistics of speech (Kretzschmar 2009) as the theory I want to
implement in my research.

37
CHAPTER 2
THE LINGUISTICS OF SPEECH
This chapter is aimed at describing the theoretical foundation of the research proposed in
this dissertation. In her review of The Linguistics of Speech, Anderson gives an overview of the
approach in the following words:
This book makes a convincing call for a focus on the linguistics of speech (i.e.
parole in Saussurean terms). Kretzschmar explains that this is not a matter of
ceasing to pay attention to linguistic structure (i.e. langue), but of redressing the
balance between the two. The book provides compelling evidence, largely drawn
from linguistic survey research and from corpus linguistics, that research methods
today are easily up to the task of coping with sufficient quantities of parole for a
sturdy analysis. This is therefore a plea to look to the linguistics of speech to
investigate the relationship between speech and structure, to reconsider
problematic areas in linguistic structure with input from speech, and to tackle
real-life linguistic problems such as those stemming from contrasting attitudes to
language. (Anderson 2009)
As we can see in the review above, the heart of linguistics of speech is described as
focused on speech and a proposal of one of the ways we can use contemporary technical
solutions to aggregate speech data to be able to describe this human behavior.

38
2.1. LANGUE VERSUS PAROLE
In The Linguistics of Speech (2009), Kretzschmar introduces another view of how
linguistic analysis can be approached: “This book tries to build a model for language, call it ‘the
linguistics of speech,’ which does not begin with academic linguistics where it is today. It starts
with Saussure and with the range of views about language available to him about 1900” (29). In
order to understand the foundations of this approach, the main points about Saussure have to be
highlighted. It seems that, “if there is any shared understanding among contemporary linguists,
Saussure’s “celebrated dichotomy between langue and parole: must be its foundation”
(Kretzschmar 2009:32). Indeed, such a distinction between language and speech, in which
langue is considered to be a structured system and parole to be a aggregation of what people say.
In Saussure’s time, the lack of technology did not allow for compilations of large amounts of
speech data to use in the exploration of parole. However, langue, being an abstraction from each
particular speaker to a collection of speakers in a speech community, was more appealing and
feasible to him. The issue of parole versus langue approached and discussed in various ways
continues through the history of linguistics, with scholars such as Weinreich et al. (1954), Labov
(1994, 2001), Chambers (2003), Milroy (1980) or Eckert (2000) providing commentaries on
these subjects. One of the issues upon which Saussure posits comments and a solution are the
difficulties connected with studying speech:
One solution only, in our view, resolves these difficulties. The linguist must take
the study of linguistic structure as his primary concern, and relate all other
manifestations of language to it. Indeed, among so many dualities, linguistic
structure seems to be the one thing that is independently definable and provides
something our minds can satisfactorily grasp. (1916:9)

39
Such a comment was perfectly reasonable for Saussure because in his view linguistic
structure is not inherent to each speaker but is instead a “social product of our language faculty,”
which happens in a collectivity of speakers in society; it can be abstracted from individual,
variable speech to norms, or rules, for a group of speakers (1916:9-10). Looking at it this way,
the researchers are allowed to aggregate subjects into communities and make generalizations
about their speech. We need to keep in mind Kretzschmar’s comment about studying linguistic
structure:
The preference for linguistic structure is not a given but instead a decision, a
choice that both clarifies the relationship of language study to other modes of
study and other sciences, and allows linguistics to be a science because it controls
through subordination the other relevant variables in the model. (Kretzschmar
2009:43)
If we consider this comment to be valid, then we can be very clear about the way we
want to perform research. This way of looking at linguistic surveys opens the door for a
discussion about what each choice implies. It does not matter whether we choose linguistics of
speech or linguistics of linguistic structure as long as we are straightforward about the choice and
what assumptions are carried with it.
It seems that what Saussure was mostly interested in was to form an idea about language
to provide linguistics a place among the physical science disciplines. The only way that this was
possible in his time was to create a model of language with rules and variables, which can be
applied at a high level of abstraction. Such a model allows for talking about the general rules and
laws of language while trimming off the issues not fitting into the model. However, as
Kretzschmar points out, “the choice of linguistic structure is not inevitable, not ‘natural’ in the

40
sense that it corresponds to an inborn faculty or property of species; it is the nucleus of an
argument to create a science of linguistics, one based on a model with particular premises and
with a definite arrangement of its variables” (2009:44). Now when we are equipped with
technology solutions that Saussure could only dream about, we are capable of investigating
speech as a behavior with all its overwhelming frequencies and inherent variation.
If we agree to disagree and allow for more options in linguistics than just
linguistic structure, the alternative approach described by Saussure is speech; he defines it in
detail as “the sum total of what people say, and it comprises (a) individual combinations of
words, depending on the will of the speakers, and (b) acts of phonation, which are also voluntary
and are necessary for the execution of the speakers’ combinations of words” (1916:19). Seeing
speech as such, with variability as an inherent characteristic and virtually endless combinations
of variables, Saussure was not willing to take the path of parole. His unwillingness was probably
caused on one hand by the fact that it was close to impossible to manage speech data, and
therefore speech might have been perceived as useless. On the other hand, he is clear about the
fact that speech is the basis for everything; we can only talk about langue because we have
parole. Without speech we would not be able to form any descriptions, models, or rules of
langue. He emphasizes the difference between language and speech in the following words, cited
by Kretzschmar:
The homogeneity of linguistics structure arises from seeing language as a
“collective phenomenon”, while “there is nothing collective about speech. Its
manifestations are individual and ephemeral. It is no more than an aggregate of
particular cases…Language in its totality is unknowable, for it lacks homogeneity.
(2009:45)

41
This distinction based on the collective nature of langue and parole seems to be crucial,
as the essence of those two entities is complementary. There is no way for either of them to
possess the nature of the other. As Saussure points out, “that is the first parting of the ways that
we come to when endeavoring to construct a theory of language. It is necessary to choose
between two routes which cannot be taken simultaneously. Each must be followed separately”
(1916:39).
After establishing a relationship between langue and parole, Saussure goes on to describe
speech in regard to the notion of dialect and language. Under the linguistics of speech, what
people say is the only subject of study. Terms such as “dialect” or “language” are not considered
to have any boundaries but instead exist on a continuum. Therefore, as he points out, “between
dialects and languages there is a difference of quantity, not of nature” (1916:43). Saussure does
not talk about the dialect boundaries put on maps by linguists. What is important for him are
linguistic features, and only having those features as the main descriptive tool allows us to
provide, still imperfect, description of people’s speech. He says, “there are no natural dialects,
but only natural dialect features. Or – which comes to the same thing – there are as many dialects
as there are places” (1916:200).
Another observation made by Kretzschmar (2009) is that there are no naturally
occurring boundaries between the segments of speech. Saussure comments on this notion in the
following words: “a language does not present itself to us as a set of signs already delimited,
requiring us merely to study their meanings and organization. It is an indistinct mass, in which
attention and habit alone enable us to distinguish particular elements” (1916:101). If there are no
naturally occurring limits to the elements of speech, we have to have some sort of mechanism to
allow us to establish and agree on the elements that we devise. Kretzschmar states, “These are
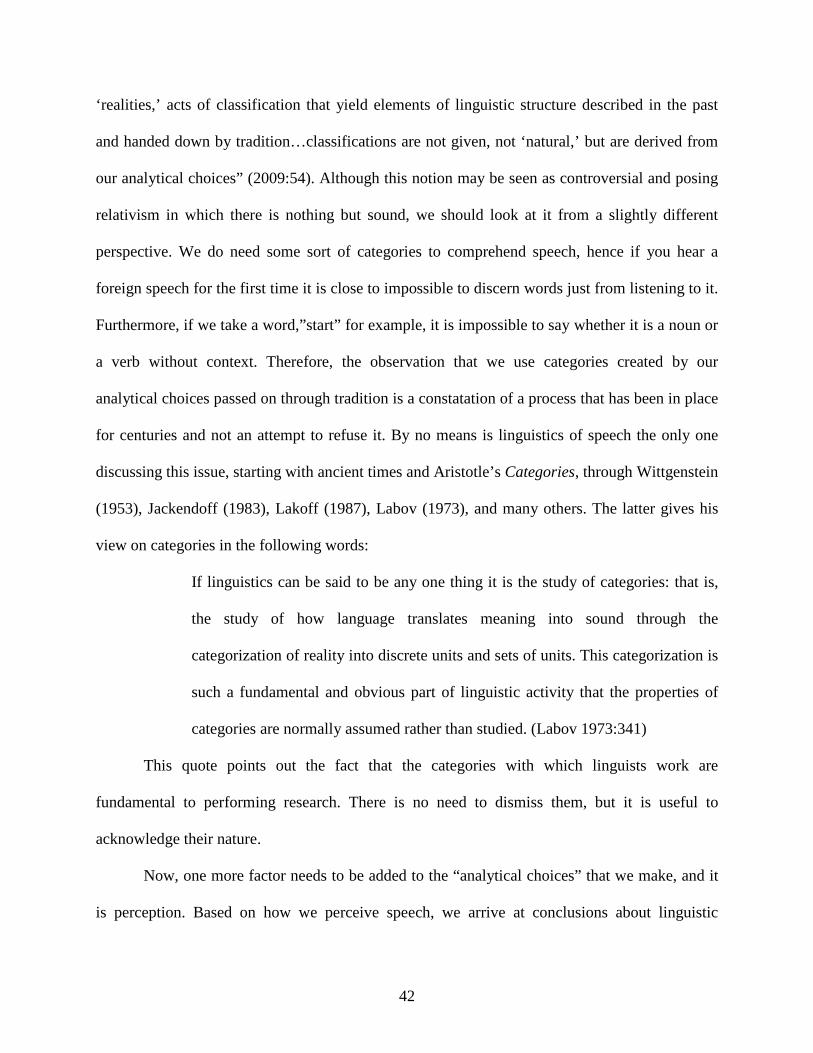
42
‘realities,’ acts of classification that yield elements of linguistic structure described in the past
and handed down by tradition…classifications are not given, not ‘natural,’ but are derived from
our analytical choices” (2009:54). Although this notion may be seen as controversial and posing
relativism in which there is nothing but sound, we should look at it from a slightly different
perspective. We do need some sort of categories to comprehend speech, hence if you hear a
foreign speech for the first time it is close to impossible to discern words just from listening to it.
Furthermore, if we take a word,”start” for example, it is impossible to say whether it is a noun or
a verb without context. Therefore, the observation that we use categories created by our
analytical choices passed on through tradition is a constatation of a process that has been in place
for centuries and not an attempt to refuse it. By no means is linguistics of speech the only one
discussing this issue, starting with ancient times and Aristotle’s Categories, through Wittgenstein
(1953), Jackendoff (1983), Lakoff (1987), Labov (1973), and many others. The latter gives his
view on categories in the following words:
If linguistics can be said to be any one thing it is the study of categories: that is,
the study of how language translates meaning into sound through the
categorization of reality into discrete units and sets of units. This categorization is
such a fundamental and obvious part of linguistic activity that the properties of
categories are normally assumed rather than studied. (Labov 1973:341)
This quote points out the fact that the categories with which linguists work are
fundamental to performing research. There is no need to dismiss them, but it is useful to
acknowledge their nature.
Now, one more factor needs to be added to the “analytical choices” that we make, and it
is perception. Based on how we perceive speech, we arrive at conclusions about linguistic

43
features, and “thus perception is a necessary element of speech, because without it there could be
no linguistic features” (Kretzschmar 2009:54). Taking perception into account opens another
explanation of how we can deal with dialects under the linguistics of speech:
Since there are no natural dialects, then, the inventories of linguistic features that
we collect constitute dialects because we so name them, and they are useful
because they help us to conceive of “the primary and natural phenomenon of
differentiation into independent areas.” (2009:48)
Such a statement has its foundation in the notion previously discussed in which the
categories that we create do not occur naturally in the world around us, but it is us who create
them to comprehend the world. Such a statement leads us to the foundational statement for the
linguistics of speech, in which the relation between what we know about speech and what we
perceive of it is established:
To say that “boundaries…get lost in transitions” is actually to say that there are no
“natural” dividing lines between linguistic systems, that natural language and
dialect, as we perceive them, are characterized by continua transitions. This
finding is a central, foundational fact for the linguistics of speech, that language
behavior is continuously variable across geographical and social space.
(Kretzschmar 2009:57)
Speech is seen as a continuum without boundaries; the boundaries between languages, or
in other words linguistic systems, are only a perception of our minds. What is really happening is
that from locality to locality people share some linguistic features and differ in others. The
further away we are geographically or socially, the less we might have in common when it
comes to the linguistic features. However, it will never be the case that speakers on one side of a

44
line will speak in exactly one way and those on the other side are in a different way. The
boundaries, or isoglosses, are generalizations created by our perceptions and facilitated by the
methodologies used to study speech. Now, the last issue remains: how will research be different
using the premises of the linguistics of speech? Kretzschmar summarizes it in the following
manner:
Under the linguistics of speech the analyst will not describe the collectivity of the
language of the group as a system or structure, but will instead describe the
linguistic behavior of the group according to the presence or absence in it of
particular linguistic features. (2009:61)
We can see that research from this perspective is focused not on arriving at rules and laws
for the collectivity of speakers but instead on creating a description of what speakers actually
say. Those two approaches are mutually exclusive under the provisions of the linguistics of
speech, because they are opposite in nature. Rules and laws are categorical entities and come
with deductive types of reasoning in which first we hypothesize about language, and more often
than not we do find what we already assumed will happen. However, a description of what
speakers actually say is not categorical in nature and uses induction as a way of reason in which
we let patterns emerge from the data. Saussure chose the linguistics of linguistic structure as the
only way to make linguistics into a scientific discipline. Nonetheless, as will be described in
further detail below, Kretzschmar explains how the linguistics of speech is a scientific approach
for studying the speech of individuals. Moreover, Anderson describes in her review the place of
corpus linguistics in the linguistics of speech:
It is particularly good to see corpus and dialectological methods brought together
as part of a more encompassing theoretical model, given that the connections are

45
evident but rarely emphasised. This is a model which marries the textual with the
social, and as such can only help the explanatory power of both approaches.
Kretzschmar sets out the methods of Firthian linguistics and Neo-Firthian corpus
linguistics, grounded in the fundamental assumption that meaning is use, and
demonstrates how the behavior of variants is similar regardless of the dimension
in which they are considered (e.g. distribution of sounds in geographical space as
revealed by survey data, distribution of words in text types as revealed in
corpora). Again, there is ample evidence from corpora. (Anderson 2009)
The compilation of various methods of study, and combining approaches such as corpus
linguistics and dialectology together, makes the linguistics of speech diverse and lets it explore
meaning in contextual use even further. Such a comparison sets up the groundwork for a detailed
discussion of the notion of complex systems, as proposed by Kretzschmar.
2.2. COMPLEX SYSTEMS
The linguistics of speech has its foundation in parole, described by Saussure in the
1900’s. Since then scientific research in various fields, for example cognitive anthropology,
neuroscience, or psychology, arrived at new solutions and compelling evidence for the
explanation of world phenomena. One of those notions is complexity theory, a notion used in
physical science to describe the workings of emergent order in non-equilibrium systems. The
notion of complex adaptive systems is presented here in an opposition to an equilibrium system,
which is a closed, low-energy system. As an example of an equilibrium system, we can put a ball
into a big bowl, and it will roll around for some time and then rest down on the bottom when the
energy is exhausted. The order of the ball’s position has been established, and “it has become
static, low-energy system”. However, “nonequilibrium systems by definition are open, and

46
exchange energy and matter in a dynamic fashion. They very often show order” (Kretzschmar
2009:178). This can be best illustrated by the example given by Kretzschmar (2009) of a creation
of a whirlpool when a bathtub drains. The whirlpool will be there while the drain remains open
and we add water to the tub, which asserts its openness as a system. Also, the self-organizing
order that emerges will be there regardless of the circumstances; it does not matter whether it is
Monday or Tuesday in Poland or the United States. The whirlpool will be there if there is water
in the tub and the drain is open. Moreover, we do not need to stir the water to create the
whirlpool. If we provide the conditions required for a complex system to operate, it will behave
accordingly.
Moreover, “complex systems, also known as complex adaptive systems, share a number
of characteristics besides being open, dynamic, and not at equilibrium” (2009:147). Among those
characteristics is the idea that complex systems contain a large number of components, and they
show self-organizing emergent order. Thus speech is a perfect example of use for complex
system theory as it possesses an immense number of elements—not only the segments of speech
categorized by linguists, as for example phonemes, morphemes, words, or sentences, but also the
number of speakers inherently variable in their linguistic behavior. However, speakers are
agents, so they facilitate the complex system without being a part of it in the same way that
pronunciation, words, etc. are in the system. In other words, speech is a kind of a tool humans
can operate. Speakers are agents who use speech for their own purposes and exercise control bias
in what they choose to say, when, and how. Therefore, they are part of the complex system, but
not in the same way as speech is. Speakers put the speech into motion, depending upon what
type of control bias they exercise.

47
The self-organizing emergent order comes from the operation of chance among the
elements and interactions between them. We need to take note that the chance here is considered
to be a formal idea of randomness. Therefore random processes happening in the complex
adaptive systems result in emergence of patterns and clusters (Kretzschmar 2009:179).
Another feature that has to be mentioned is the fact that complex systems are not equal to
chaos theory.1
From this description, an image of speech as a complex system emerges. Kretzschmar
states that speech as a complex system has the following characteristics:
In complex systems variation in the interaction of the connections between
elements causes the emergent order to appear or change. Such a change must be immense; one
element will not be enough to make the change. It might be considered only as an initiation of
change in the cycle. Only after a great amount of interconnections between elements change,
then the order might be different. Those interconnections are also dependent on bias. In the case
of speech, bias is exercised through every individual’s linguistic choices made while speaking.
a) Speech is open and dynamic, as opposed to a static structure; b) speech
includes a very large number of interactive components/agents, as opposed to a
hierarchical arrangement of types; c) speech shows emergent order, as opposed to
rule-bound relations; d) the distribution of units in speech is non-linear, as
opposed to an assumption of random use or normal distribution; e) speech has the
property of scaling, as opposed to homogenous unity. (2009:252)
1 Chaos is sensitive to small changes in the initial conditions, “the butterfly effect.” Complex systems are not. Their cycles are stable, “not determined by the butterfly effects that creates the initial condition” (Kretzschmar, 2009:149). This difference is crucial in the context of how order emerges in complex systems, namely it is “the result of the interaction of the density of interconnection of many elements and the control bias that exists in the system” (2009:150). The notion of the density or immense amount of elements, and control bias are central in this description. Complex systems do not react to the “butterfly effect.”

48
As points 1, 2, and 3 have been discussed above, non-linear distribution and the property
of scaling will be addressed below.
2.3. NON-LINEAR DISTRIBUTION.
“Gaussian statistics are linear by nature, so observed effects are always proportional to
their causes” (Kretzschmar 2009:179). When such a linear regression is presented on the graph,
it takes the shape of a straight line. Moreover, Gaussian estimates work in short time periods, in
which case more spread out, longer cycles are not accounted for by the analysis. In turn, such a
short time period does not account for very infrequent and frequent variants—turning them into
non-occurrences and non-variable categories. On the other hand, complex systems have non-
linear, exponential, or logarithmic distributions. This means that, “while the emergence of order
is common…the particular structures that emerge are inherently not predictable” (Kretzschmar,
2009:179). The notion of the asymptotic hyperbolic curve comes from Zipf’s Law (1949),
improved by Mandelbrot’s (1982) insight:
If one counts the frequency of words in any large text and then puts the
frequencies in descending order, there is an inverse relationship between each
frequency and its rank…Mandelbrot’s improved formula yields a curve on the
logarithmic plot, in which the top ranked words have a lower slope than expected
in Zipf’s Law, and the lower-ranked words also deviate but now with a steeper
slope. (Kretzschmar 2009:190)
The reformulation added a so called “bump” in the curve, which indicates that we are not
talking about a “pure” inverse function of rank and frequency, but instead real-world phenomena

49
where the exact shape of the curve responds to variables in the situation, defined by Mandelbrot
as “defined and finite, and one of the limits is positive” (1982:343). Such a curve showing
rank/frequency distribution can be easily observed in the linguistics of speech as type/token
distribution. This distribution can be seen in multiple examples presented in The Linguistics of
Speech (2009), which are based on data collected in the Linguistic Atlas of the Middle and South
Atlantic States. It does not matter what element of speech we are considering, whether a
phoneme or word, the shape of the curve remains unchanged. Even if we decide to look into
subsamples of the data, the distribution remains constant. However, the amount of detail may
change.
2.4. CONTINUITY, PROXIMITY, SCALING, AND THE LOGIC OF
AGGREGATION.
Following the notion of continuity in speech presented by Saussure (1916), the linguistics
of speech has adopted the notion that speech is a continuous string of sounds without naturally-
bounded units. However, the long tradition of categorization of speech into discreet units is still a
useful way to talk about speech. This issue (discussed in more detail in section 2.1) is important
to note in the discussion about speech because although it is a continuous behavior, we do extract
concrete entities to be investigated in the research. Because of the continuous nature of speech,
context is crucial in its description: not only the context of speech segments, but also context of
the behavior itself, such as who we talk to, in what situation, and the purpose of the conversation.
Proximity between speakers (whether geographical or social) plays an important role too.
Speakers communicate mostly to others who are close to them, geographically and socially.
Therefore, proximity has to be taken into account while observing speech behavior. We know
more about our local communities, and we have more dense and multiplex interactions with

50
people sharing our locale. What level of involvement in the life of the community and its
members we want to invest is not the same for every speaker. Some may opt out, as shown by
Eckert (2000) in her Detroit study of “jocks and burnouts.” The control bias allows us to project,
build, and keep an identity in the way we want it, either consciously or not as shown by LaPage
et al. (1985). No matter what choice we make and how we make it, proximity plays a role.
Because although “burnouts” opted out, we can suspect that they knew more about their locale
than a speaker from the South. The more distance, geographic and social, there is between
speakers, the less common linguistic experiences and information they have. Through distance
the differences “creep in,” and that is why the speech of Athens, Georgia is different in some
aspects from the speech of Rome, Georgia). Therefore, the linguistics of speech proposes to start
gathering speech data from a local group of speakers and then compare them to another near by
group in order to aggregate the data.
The focus on small communities already exercised by the Milroys (1987, 2003) in
Belfast, or in the aforementioned study conducted by Eckert (2000) are the types of locales that
the linguistics of speech approach advocates. If we aggregate data from one community to
another and work our way up, it will create a comprehensive set of speech data. Furthermore,
“complex systems have a property of scaling, or nesting” (Kretzschmar, 2009:179). Such a
property means that the shape of the curve does not change when we zoom in or out from the
data, just the details under scrutiny change. Thus, we cannot make generalizations about a bigger
region based on the speech of a local town or that a pattern present on the state level will have a
one-to-one correspondence with a locality in that state: “Barbara and Ronald Horvath have

51
demonstrated the idea of what they call ‘scale dependency’ in speech by pointing out that the
variation in speech looks different depending on how the observer groups the data” (Kretzschmar
2009:237).
Their study was concerned with /l/ vocalization in Australia and New Zealand. The
Horvaths (2001) used 312 speakers from nine localities. It turned out that the percentages of the
/l/ vocalization on various levels of aggregation did not correspond to each other. In other words,
the percentage established for the regional level is not found on the national or local levels. It is
simply impossible to predict higher levels of scale from the lower ones, or vice versa. However,
if frequency distributions were graphed, all of them would have a constant shape—A-curves.
The only difference would be the ranking of specific variants. Some would have a higher or
lower rank from level to level, and some would not appear at all on particular levels. The notion
of scaling explains one more issue, as presented by Kretzschmar:
In the linguistics of speech, however, since we do not assume the existence of
langue, we must abandon the notion of representative speakers and fall back on
what we understand about populations. We must treat each speaker as merely an
individual user of language, and we must rely on randomized sampling in order to
get some idea of the totality of speech in any regional or other group of speakers
we study (2009:109).
The issue of a representative speaker is an ongoing discussion in the linguistic field with
various approaches appearing throughout the years. Chomsky (1965) stated his position in a
famous quote:
Linguistic theory is concerned primarily with an ideal speaker-listener, in a
completely homogeneous speech-community, who knows its language perfectly

52
and is unaffected by such grammatically irrelevant conditions as memory
limitations, distractions, shifts of attention and interest, and errors (random or
characterized) in applying his knowledge of the language in actual performance.
(3)
The assumption that this quote is based on is that every speaker possesses the complete
knowledge of his or her own speech; therefore it is perfectly reasonable to use one person as
representative speaker of however large a community suited the study. Such an assumption
initiated a discussion about the nature of the speakers under investigation in sociolinguistic
research. Various voices raised that issue, as for example Tagliamonte (2006) discussed the
development of sampling in sociolinguistics as staring with random sampling (Shuy et al. 1968
in Detroit) and moving away from such a practice because of the unfeasible nature of such a
practice when it came to time and money. Other solutions were offered, like the ethnographic
approach (Labov et al. 1968, Eckert 2000, or Wolfram et al. 1995), or social networks used by
the Milroys (1987). However, it seems that the most widespread sampling technique in modern
sociolinguistics is stratified random sampling, in which one “1) identifies in advance the types of
speakers to be studied; and 2) seeks out a quota of speakers who fit the specified categories”
(Tagliamonte 2006:23). Such an approach was used in multiple studies (Trudgill 1974,
Chambers 1973, Poplack 1989).
Now, the underlying assumption here is framed in the words of Sankoff (1988), as it is
not a quest for “the sample [to] be a miniature version of the population, but only that we have
the possibility of making interferences about the population based on the sample” (900). These
two types of assumptions, one by Chomsky in which one person can represent everyone and
second in which a group of speakers can represent a bigger population, are at odds with each

53
other and are opposite to the assumptions of the linguistics of speech. This opposition comes
from the fundamental, starting point of where the linguistics of speech is rooted, and that is
inductive research. In such an approach we can come up with the features that we want to ask
people (in the interviews for example) and go ‘blind’ into the community to allow the obtained
data describe the community.
Judgment sampling, on the other hand, starts with deduction, allowing for identification
of speakers in advance and finding a quota to fill it in. Moreover, as indicated earlier in this
section, the linguistics of speech assumes that there is no one-to-one correspondence between
various levels of features, which means that from individual speakers’ behaviors we are not able
to predict the behavior of a group of speakers or vice versa. This was illustrated by the research
done by the Horvaths (2001) in Australia and New Zealand. On top of that, in an exact contrast
to the Chomskyan ideal speaker, the linguistics of speech sees every individual as “inherently
unpredictable and variant” (Kretzschmar 2009:252). Therefore, while researching and analyzing
results, in the linguistics of speech framework we need to recognize the issues connected with
the notion of the individual speaker: scale and method of aggregation of data.
2.5. SPEECH PRODUCTION AND PERCEPTION
As much as the previous sections were concerned with speech production, there is
another side of speech behavior that has to be taken into account, namely speech perception:
Constraints upon what we say are not only determined by accident of birth but are
also to some degree a matter of choice. We choose our words according to how
we perceive them, or how we believe that others will perceive them. Every
conversation is to some extent an exercise in such psychological brinksmanship.
(Kretzschmar 2009:218)

54
Perception is present in speech in various forms, one of them being the perception of
speech on local and national levels. Gould and White (1986) have established that there are
differences in the perceptions of local surroundings between speakers from the same
neighborhood, based on the research done by Ladd (1967), in which children from the same
neighborhood in Boston were asked to draw a map of their locale. The maps were substantially
different from one another, depending what type of feature was most important to them, since
some children emphasized their immediate surroundings and others ethnical divisions within the
neighborhood. Moreover, when maps on the national level were constructed depicting speakers’
levels of desirability for a specific place in Britain and North America (Gould and White 1986),
it turned out that they were similar and different at the same time. On one hand, the national
perceptual representations were different as they carried the “local domes” of preference; on the
other, except for those “local domes,” the national preferences are very similar. “Thus it is
possible and useful to talk about national preferences, at the same time that ‘local domes’
consistently appear in the data, and at the same time that we know that individual spatial
perceptions are likely to be very different from each other” (Kretzschmar 2009:227). No
individual’s map matched the national map exactly, and from no national map were we able to
predict the shape of an individual’s map.
The differences between speakers in their perceptions of speech can be clearly seen in the
research performed by Preston (1989) and discussed in detail in Chapter 1. The respondents
could not agree where the South dialect’s boundaries existed, although most of them indicated
that such a speech variety is present in their perception. What Preston did was to create
generalizations and averages, but “when means and averages are applied to ratings by
individuals, the result does not describe a shared mental image but instead a picture that few

55
individuals and no localities actually possess” (Kretzschmar 2009:231). In the study of
perception, the way data is aggregated and analyzed appears to be the crucial component in
revealing the emergent order of a complex system. Since speech production and perception are
part of the same complex system, “speech is the result of the application of speech perception to
speech production…The state of speech production influences perception, and perception
influences following production (as control bias)” (Kretzschmar, 2009:253). If we look at speech
this way, we can see it is a series of states of perception and production resulting in an emergent,
self-organizing order.
Speech perception takes advantage of the natural occurrence of the A-curve, in which the
top ranked variants receive the label “normal” in the speaker’s perception. Those top ranked
items thus become observational artifacts (Günther 1996) and are seen as constituting the system
of categories:
Thus the existence of actual coherence in speech production may not be
perceived, while language users, linguists included, may conceive coherence that
is an artifact of the mechanics of perception, coherence that does not actually exist
in speech production” (Kretzschmar 2009:259).
This observation is something that has to be accounted for in any type of analysis, as it
rejects coherence as a given attribute of speech. Perceptions are still an important component of
our linguistic behavior because they not only constrain our choices in speech, but also reveal
how our lack of information is filled with perceptions to create gestalts.
2.6. GESTALTS AND SCHEMAS
Another important issue is the notion of gestalts and schemas. Both come from cognitive
science and are two mechanisms that can account for the way we create our perceptions. Our

56
mind prefers patterns and complete entities. Thus, one of the mechanisms with which it is
processing the information received from the world is by creating cognitive wholes–gestalts. We
are then able to create a perceptual, finite concept out of interrupted and incomplete information.
Such a method explains, for example, why we are able to have an opinion about the speech of
speakers that we have never heard or seen before (Kretzschmar, 2009:222). A closely related
notion to gestalts is prototype theory, which was established in the 1970s in the field of cognitive
anthropology, started mainly by Eleanor Rosch (1978). In her study, subjects attributed as many
features as they deemed fit to three levels of taxonomies. One of the nine concepts chosen was
“bird.” Now, three levels of taxonomies for this concept were “bird” » “passerine” (or other
types of birds) » “bluejay,” “robin.” and so on. When features were averaged it turned out that
the average, prototypical bird possessed all the features of a passerine. This way “passerine” was
considered a prototypical bird. The averaging happening in this process created a prototype,
which was cut off the reality and moved to the abstraction level of passerine. Moreover, the
averaging created an impression that this is what every speaker pointed to, when in fact some
speakers denoted other types of birds. Another study done in an attempt to provide boundaries
for a definition of a word was conducted by Labov (1973) in his quest to define a “cup.” After
measuring the responses to a picture cue and a question (What do you call this?) in four settings,
in which the cup-object would have “Neutral” purpose, “Coffee,” “Food,” and “Flower” (vase)
purpose, he arrived with the following conclusion:
The definition we have presented….is obviously not the essence of a cup, or
limited to essential attributes. There is no question of a handle or a saucer being
an essential attribute to a cup…One cannot separate an essential attribute from the
object, and cups without handles are common enough. In our definition,

57
properties such as these play an important role circumscribing the outer range of
regular usage, which varies with their presence or absence. Our ability to
recognize a cup depends upon our ability to recognize such accident. (1973: 87-
88)
This observation points to the weakness of prototypical averaging, which leaves out the
variation and those features that are rare. Therefore, although the idea of prototypes was a
breakthrough, there is a fundamental discrepancy between it and the premises of the linguistics
of speech. As described by Kretzschmar (2009:222), prototypes are detached from the individual
speaker; they are an abstraction from him. In this approach, the main focus is on the inherent
variability and unpredictability of an individual. For that reason, cognitive anthropology comes
to play, as Kretzschmar is adopting schema theory into the linguistics of speech approach:
Schema theory is not about objects with particular, established characteristics (of
which an individual is a concrete example, and a prototype is an abstract
example), but about abstract specifications for what might be relevant in what
comes to be recognized as a category of experience. (Kretzschmar, 2009:222)
This concept, known also as a “frame,” “scene,” “scenario,” or “script” have been used
for long time. The first mentions of such an idea can be attributed to Kant (1781). More recently,
Mandler (1984) described schema as “abstract representations of environmental regularities”
(1984:55). Each experience that we gain in our lives leaves a mark and helps to formulate such a
schema. Therefore, we recognize the world in the realm of schemas. Moreover, schema creation
and processing is not only a framework for various types of experiences of our lives, but at the
same time it is a mechanism with which we parse and designate to a specific schema all the input
of our existence. “Most, if not all, of the activation processes occur automatically and without

58
awareness on the part of the perceiver-comprehender” (Mandler 1984:56). On top of that,
schemas have “slots” for features, which can be filled in with concrete details. The number of
slots depends on the speaker and his or her types of previous experiences, and to some extent the
information for one slot can determine the rest of the slots.
The A-curve distribution of speech gives the top ranked variants preference as candidates
for schemas: “Individuals develop their own cognitive schemas, but cultural schemas also exist
and can be described and measured by survey research” (Kretzschmar 2009:223). Because both
types of schemas are present in the minds of the respondents, when asked about their perceptions
about speech, part of the results will be different from the rest, as every individual experience is
different. But there will be some overlap, as we do share cultural schemas to some degree.
Individual schemas are made out of slots for characteristics out of which a pattern is created.
Cultural schemas “‘average’ the ratings by the individuals…except that now…slots for relevant
characteristics within schema, are the target for analysis, and not fixed characteristics
themselves” (Kretzschmar, 2009:223). Such an approach to analysis is more flexible than the
prototype approach.
When using schemas we do not always have all the information needed to fill in the
“slot” with a certain feature. Nonetheless, we do need a mechanism to help fill in the gaps. Such
a mechanism is described as a gestalt, originally used by the Berlin School in psychology in the
late 19th and early 20th century. Since then it has been a part of various disciplines as for example
psychology, anthropology or cognitive science. It also found its way into linguistics, especially
into cognitive linguistics, in the work of Lakoff (1987), Evans and Green (2006), or Grice
(1989). The use of the gestalt mechanism that is adapted by the linguistics of speech is described
by Evans and Green (cited in Kretzschmar 2009) as important “because they allow unconscious

59
perceptual mechanisms to construct wholes or ‘gestalts’ out of incomplete perceptual input”
(2009:186). Therefore, gestalt theory will be playing an important role in the research conducted
on speech perception, since it is a way to account for lack of experience and information to
create a definite perception.
The last point on the subject of how the external world is connected with our internal
organization of what goes on around us is suggested by Kretzschmar in the following words:
We still need to know about perceptions of speech, at least in order to consider
how they might be a reflection of distributions of speech data as it is actually
produced. We must be aware, however, that the lack of information (especially
about speech beyond one’s local area) and our perceptual habit for making
configurational wholes on the basis of incomplete and interrupted information,
will constrain the perceptions that speakers report. (2009:236)
This citation puts together all the crucial components connected with speech production
and perception and shows a model of accounting for the relationship between the two. The
comprehensive, but not exhaustive, description of The Linguistics of Speech was aimed at
depicting the ways its premises will be used in the research of this dissertation. The approach
itself is a compilation and transplantation of ideas which have been used not only in linguistics,
but also anthropology, psychology, mathematics, and neuroscience. The linguistics of speech is
another approach in the field of linguistics that is not trying to replace existing methods and ideas
but instead proposes an alternative on the spectrum. The ideas adopted and transplanted from
other fields and approaches are combined together and adjusted for speech purposes. This is
where the gist of this approach is, in the innovative combination of ideas for linguistic survey
methods.

60
Research performed in perceptual dialectology, and research previously done in Poznań
at the Adam Mickiewicz University are the closest to what the goal for my investigation into
Poznań speech is. However, there are specific issues not accounted for or underdeveloped by
those approaches and those will be discussed in the light of solutions proposed by Kretzschmar
(2009) in The Linguistics of Speech in the next chapter.

61
CHAPTER 3
METHODOLOGY AND FIELDWORK
This chapter outlines and explains the methodology used to discuss the relationship
between speech perception and production. It also highlights the innovations and advances used
in the proposed research.
3.1. INTRODUCTION
This section introduces methods used in this research to explore Poznań speech to see
what people think about it. The methodologies used in the past have revealed trends in
perception and production, but there is room for improvement. Consequently, methods never
before used on Polish data are used to advance research in this area. In Chapter 1, previous
research was described; however, each study had some underdeveloped components. Therefore,
an approach proposed by Kretzschmar in The Linguistics of Speech (2009), and described in
detail in Chapter 2, will be presented as an alternative account. Below, I address in detail all of
the underdeveloped issues in the research presented in the literature review in conjunction with
the linguistics of speech model.
3.1.1. LINGUISTICS OF SPEECH: THE ALTERNATIVE
3.1.1.1. POZNAŃ RESEARCH
In the study conducted by Witaszek-Samborska et al. (1987), part of their methodology
was composed of a questionnaire. The purpose was to measure speech production, but the
questionnaire was created in such a way that measuring it was impossible. The respondents were
given a list of words considered by the researchers to be dialect lexemes and were then asked if
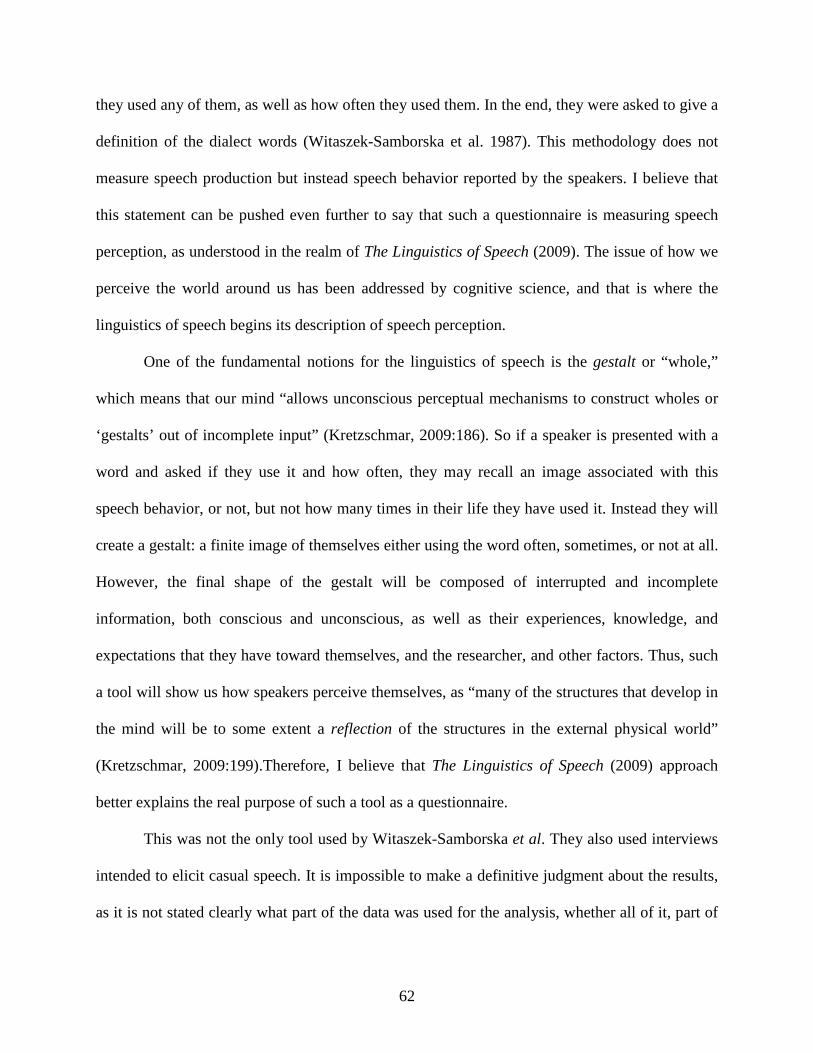
62
they used any of them, as well as how often they used them. In the end, they were asked to give a
definition of the dialect words (Witaszek-Samborska et al. 1987). This methodology does not
measure speech production but instead speech behavior reported by the speakers. I believe that
this statement can be pushed even further to say that such a questionnaire is measuring speech
perception, as understood in the realm of The Linguistics of Speech (2009). The issue of how we
perceive the world around us has been addressed by cognitive science, and that is where the
linguistics of speech begins its description of speech perception.
One of the fundamental notions for the linguistics of speech is the gestalt or “whole,”
which means that our mind “allows unconscious perceptual mechanisms to construct wholes or
‘gestalts’ out of incomplete input” (Kretzschmar, 2009:186). So if a speaker is presented with a
word and asked if they use it and how often, they may recall an image associated with this
speech behavior, or not, but not how many times in their life they have used it. Instead they will
create a gestalt: a finite image of themselves either using the word often, sometimes, or not at all.
However, the final shape of the gestalt will be composed of interrupted and incomplete
information, both conscious and unconscious, as well as their experiences, knowledge, and
expectations that they have toward themselves, and the researcher, and other factors. Thus, such
a tool will show us how speakers perceive themselves, as “many of the structures that develop in
the mind will be to some extent a reflection of the structures in the external physical world”
(Kretzschmar, 2009:199).Therefore, I believe that The Linguistics of Speech (2009) approach
better explains the real purpose of such a tool as a questionnaire.
This was not the only tool used by Witaszek-Samborska et al. They also used interviews
intended to elicit casual speech. It is impossible to make a definitive judgment about the results,
as it is not stated clearly what part of the data was used for the analysis, whether all of it, part of

63
it or in some other configuration throughout all of the research. That is why, keeping in mind the
underlying perceptual nature of the questionnaire, the results will be treated as presented by the
researchers.
3.1.1.2. ENREGISTERMENT
Johnstone’s (2009) treatment of enregisterment seems to work nicely based on the data
she presents from Pittsburgh. However, I believe that there is an aspect underdeveloped in this
approach: namely how the residents of Pittsburgh are able to construct an image of the local
speech based on a handful of words and phrases. Here, Kretzschmar’s (2009) approach gives an
explanation to account for such a phenomenon. As cited before, gestalt is an important
mechanism in the workings of our brains. In addition, the A-curve distribution found in speech
production is the foundation of our perceptions (Kretzschmar 2009:208). This happens because
the top ranked variant in our production is registered and matched with schemas in our mind as a
“normal” variant for a particular type, and other variants receive different characteristics. Once
that happens, and we have connected a particular variant as belonging to a schema, we are prone
to assume that in such a case there must be an object with those characteristics–an “observational
artifact.” For example, if a speaker hears a variant of speech “Picksburgh” for “Pittsburgh”
(Johnstone 2009:170) from speakers who he can group in his schema, as for example Pittsburgh
residents, he can then arrive with a conclusion that since people from Pittsburgh use this variant
“there must be such a thing as [Pittsburghese], an object with particular characteristics”
(Kretzschmar, 2009:206).
Using this process, we have created an observational artifact based on our perceptions.
As we can see, the “gestalt” theory contributes the notion that we do not need comprehensive
information to create such wholeness as Pittsburghese. All we need is partial information. In

64
sum, the linguistics of speech is able to explain how the speech of Pittsburgh came to exist in the
perceptions of the speakers being interviewed. We should keep in mind that it does not exist in
every person’s perceptions (Johnstone et al.2006).
3.1.1.3. PERCEPTUAL DIALECTOLOGY.
As much as perceptual dialectology furthered the discussion about individual beliefs
regarding language, I believe that there are still issues that can be explained here in more detail,
and the linguistics of speech is the best method for this task. Preston (2000) describes in detail all
the factors that have to be in place and play a role in establishing our perceptions about language.
Although it might not be his ultimate goal to explain the origins of our perceptions, I think it is
important to note that The Linguistics of Speech (Kretzschmar 2009) explains in detail how
perceptions are created with the use of the gestalt theory described above while keeping in mind
that “lack of information (especially about speech beyond one’s local area) and our perceptual
habit for making configurational wholes on the basis of incomplete and interrupted information,
will constrain the perceptions that speakers report” (199). This statement addresses how we
create the perceptions in our minds, and it also opens up a discussion for how to interpret the
results of perceptual maps.
In Figure 3.1, we can see the original four maps created by Preston (1997), depicting
various levels of consensus about the location of southern speech, and below Kretzschmar’s
(2009) map, which is the result of a transformation of Preston’s maps of the South. Those maps
show that no matter what level of agreement we decide is significant, not everyone will be
satisfied with the answer. It is up to us as researchers to decide what level of agreement we want
to talk about when describing a location as having a particular type of speech associated with it.
Moreover, it is also important in a discussion of perceptual maps to not only consider levels of

65
agreement of the subjects, but also take note of the vast disagreement that the maps depict. Only
by talking about those two sides of perception will we develop a fuller image of the nature of
speech perception.

66
Figure 3.1. Maps depicting the perception of the South in Preston (1997:318) and a transformed
version of Preston’s map from Kretzschmar (2009:195).
Thus, we should remember that “when means and averages are applied to ratings by
individuals, the result does not describe a shared mental image but instead a picture that few
individuals and no localities actually possess” (Kretzschmar, 2009:195). Nonetheless, as
suggested by Kretzschmar, the respondents in Preston’s study had no trouble pointing out not
only the South but also other areas as possessing distinct speech, and therefore it appears that
what they do share is a schema of speech type.

67
Schemas are the basis for the perceptual model within the linguistics of speech. Now the
question remains of how can we better account for the relationship between speech production
and perception rather than just pointing out the differences between production isoglosses and
perception isoglosses like those done by Preston (1989). Kretzschmar affirms that the perceptual
and production models within his approach are not in conflict with each other: “We have to keep
in mind that it is not a one-to-one correspondence between what we experience linguistically and
what we perceive” (Kretzschmar, 2009:210). The emergent order in speech production gives us a
basis to perceive and create order within our perceptions, a schema and a gestalt:
We do not just perceive the emergent order that exists and reify it, but rather we make use
of our perception of emergent order when we create our own patterns on the basis of it. The key
point is that it requires a definite cognitive act in order to conceive speech patterns, and in turn to
use those patterns either for reception or transmission of speech (Kretzschmar, 2009:210).
Thus, perception and production patterns can be seen as two facets of speech, in which
one is different from the other, but neither can exist alone. The last point concerning perceptual
dialectology is that the linguistics of speech opens the door to further research in perception and
shows the connection between speech production and perception.
3.1.1.4. PILE SORTING
In Tamasi’s (2003) study she created a new methodology as a reaction to Draw-a-map
limitations. As Kretzschmar (2009) says, “Tamasi’s research shows us that we should understand
Preston’s regional generalizations…as smoothed interpretive abstractions from the evidence,
rather than as evidence of cognitive regularities” (196). The issue discussed above explains how
the speakers were able to sort into piles the states that they have virtually no information about
and even less knowledge about the speech of those areas. Again, this can be explained by gestalt

68
theory, because when we have incomplete information about speech, speakers, or location, we
can fill in the gaps by guessing, assuming, and approximating to create a complete mental image
of a speech variety. On the other hand, there might be a bias present in the methodology, as the
subjects might have been convinced that they have to sort all of the cards whether they knew
how or not. Furthermore, Tamasi (2003) discovered with the use of the pile sorting method that
perception can be discontinuous. This type of observation was not feasible in Preston’s (1987)
research, because the perceptual map method allows only for an uninterrupted area to be
depicted on the map1
The linguistics of speech approach proposes an explanation for how our perceptions are
being created. The base for this claim is not an abstract model but instead is a physical
distribution of tokens in speech in the shape of A-curves. What goes beyond this is a proposition
of what might be happening in our minds based on the research done in physical science. What
this approach emphasizes tremendously is the focus on the community and individual, already
. However, what are obscuring the results are the generalizations used to
present the results as bundles of perceptual isoglosses. A final note on the importance of the
findings both by Preston and Tamasi is offered by Kretzschmar in the following words: “while
people may have a cultural speech type schema, the extent to which individuals share or average
the characteristics that fill out the schema, in order to create prototypes as instantiations of the
schema, is sharply limited” (2009:199). Therefore, the more people agree on an area, the more
such an area is restricted geographically. Only when we acknowledge that each individual
perception is variable, and only to some small extent overlaps with other speakers’ perceptions,
can we describe the results of perceptual tasks for what they are: the aggregation of schemas
created out of incomplete information and the speaker’s approximations.
1 Of course, logically people could draw discontinuous areas on the map, there was no indication in the task not to, but such a behavior was unlikely.

69
noticed in research done by the Milroy’s (1987, 1992, 2003), Eckert (2000), and Heath (1983).
Linguistics of speech starts with the inherently variable individual and shows how the
distribution of speech gives the foundation for the creation of cognitive schemas. Since each
individual has different A-curve distributions from other speakers, distinct schemas are generated
based on them. Those schemas are the basis for perceptions about speech created with the use of
gestalt mechanisms to arrive with an observational artifact, in this case a conviction on the part
of speakers that speech varieties are objects with defined characteristics. This process starting
with an individual’s speech culminating in a defined “speech variety” demonstrates to us that
perceptual studies are inherently important in our understanding of speech, and only investigated
together can they give us a more detailed description of our behavior.
3.2. METHODOLOGY
3.2.1. QUESTIONS
Having addressed underdeveloped issues in the various approaches, and arriving at a set
of assumptions based on the linguistics of speech, a methodology was developed in order to
answer the following questions:
1. In what way do the respondents see speech variation in Poland?
2. Do they perceive that the city of Poznań has a distinct dialect?
3. If they do, how do Poznań residents perceive their speech?
4. What speech do Poznań residents actually produce?
To answer Questions 1 and 2, Preston‘s (1989) perceptual map methodology was used. In
order to account for Question 3, a newly designed perceptual questionnaire was distributed
through email. Finally, to give an explanation to Question 4, linguistic interviews were

70
conducted. Below is description of all the steps needed in order to arrive at the final shape of the
designed tools.
3.2.2. PERCEPTUAL MAPS
3.2.2.1 MAP OF POLAND
The first type of methodology used was Preston’s (1989) “Draw-a-map” technique. I had
to decide how to use this method to best fit Polish data and obtain reliable results. I decided to
change and adjust the original shape of the map proposed by him, displayed in Figure 3.2.
Figure 3.2. Blank map in Preston’s “Draw a map” from Preston (1989:26).

71
As we can see, the divisions of the map are the state lines, which might be appropriate for
US research. As Preston (1989) points out, the amount of information provided on the map is
crucial to the type of responses that we want to receive. Some of his respondents were not able to
perform the task when the map did not carry any information on it, and on the other end of the
spectrum he reports a unique behavior some of his subjects exhibited:
Many could not escape the notion that state lines were dialect boundaries, a fact
which supports the conclusion that nonlinguists' impressions of the position of
dialect boundaries are historical-political, not linguistic...Perhaps a map with
major rivers, cities, and mountain, would have prevented this sort of response.
(1989:25)
Therefore, I have decided that it might be more useful for the proposed research to
indicate cities on the map instead of other administrative divisions. Moreover, as indicated in the
previous studies in cultural geography by Gould and White (1986) and Zelinsky (1992), cities
may be considered as carrying the value of cultural centers and therefore play a major role in
spatial perceptions. Another reason for choosing only cities and not other natural features was
that I was interested in the perception of the speech of the cities, especially Poznań. I wanted to
see if the respondents would perceive the speech of Poznań as distinct from other places,
therefore it was necessary to have the city on the map. I put 13 major cities on the map of
Poland, as displayed in Figure 3.3.

72
Figure 3.3. The map of Poland used for the ‘Perceptual map of Poland’ task.
All of those cities are distributed in a regular pattern across the country. Table 3.1
presents the population of each of the cities on the map and their rank in population size.

73
Table 3.1. The population of the cities displayed on the map of Poland.
RANK CITY POPULATION 1 WARSZAWA 1 700 500 2 ŁÓDŹ 778 200 3 KRAKÓW 773 100 4 WROCŁAW 632 200 5 POZNAŃ 581 200 6 GDAŃSK 456 700 7 SZCZECIN 415 700 9 LUBLIN 354 200 10 KATOWICE 334 200 11 BIAŁYSTOK 287 400 18 TORUŃ 205 800 21 OLSZTYN 175 240 22 RZESZÓW 173 130
The maps were black and white for technical reasons; a lot of details would potentially
disrupt the comprehension of the task. I wanted to keep a balance by providing enough detail for
easy geographical orientation and not obscure it with too much information.
The instructions used were again adopted from Preston (1989). The original wording was
as follows:
It’s well known that people in different parts of the country speak English
differently. Draw boundaries around the speech areas of the US as you know them
on the above map and write inside the area the label you use to identify that kind
of speech, the area, or speakers of that variety. If you use more than one label,
give all you use. If this map is not detailed enough for you to indicate some of the
things you know about speech in a particular area, use the back to draw such a
smaller area and label it. If you have any comments about what you have done,
please write them down on the back of the page as well.

74
I have adopted this instruction and arrived with a version appropriate to the type of data
that I was aiming at collecting.
Ludzie w różnych częściach Polski mówią w różny sposób. Zaznacz obszary na
mapie Polski, gdzie ludzie mówią inaczej. Jak nazywasz te obszary? Jak
nazywasz ludzi, którzy tam mieszkają i ich sposób mówienia? Jeżeli masz wiele
określeń na obszar, ludzi lub ich sposób mówienia - podaj wszystkie. Jeżeli ta
mapa nie jest dość szczegółowa, narysuj dokładniejszą mapę (regionu, miasta) na
ostatniej stronie. Wszelkie komentarze zapisz proszę również na ostatniej stronie.
It is known that in various parts of Poland people speak in different ways. Draw
areas in Poland where people speak in different ways. What do you call those
areas? What do you call the people who live there and their way of speaking? If
you use more than one name, write them all. If this map is not detailed enough
draw another one (of a region or a city) on the last page. If you have any
comments, put them on the last page as well.
As suggested by Preston (pc), I have avoided using words like dialect, accent, slang, or
others that could trigger negative connotations. As I am not able to project and foresee all
possible outcomes of people’s perceptions of the given wording, I was aiming at the most neutral
way to phrase the instructions. Through this map I wanted to see if people perceived the speech
of Poznań to be different from the speech in other parts of Poland. However, I decided to take it
one step further and ask them if they saw variation in the speech within the city limits.

75
3.2.2.2. MAP OF POZNAŃ.
I wanted to be able to say something about the perception of the speech in the city itself,
to answer parts of Question 2 and 3 as posed earlier. In order to do that, I designed a map of
Poznań, as can be seen in Figure 3.4.
Figure 3.4. The map of Poznań used in the ‘Perceptual map of Poznań’ task.
The map of Poznań includes main administrative divisions, the biggest transportation
routes, and the Warta River and lakes as points of reference. As this map is in a different scale
than the map of Poland, I decided to provide more details on it. Again, for technical reasons no

76
colors were used on the map, and that is why I did not include additional topographical
information. The various sizes of the font for the names of the administrative divisions
correspond to hierarchical relations between the types of the divisions. So while Jeżyce, Stare
Miasto, Nowe Miasto, Grunwald and Wilda are the five main divisions of the city, they are
composed of subdivisions indicated in a smaller font. The instructions for this map were similar
to the ones used for the map of Poland:
Czy w różnych częściach Poznania ludzie mówią inaczej?Jeśli uważasz, że tak, to
zaznacz na mapie jak nazywasz te obszary oraz jak nazywasz ludzi, którzy tam
mieszkają i ich sposób mówienia.
Do you think that people living in various parts of Poznań speak in different way?
If yes, please describe those areas and people who speak this way.
Those instructions allowed the respondents to provide me with information about their
perceptions of speech used in the city.
Each printed package contained four pages. The consent form and demographic questions
were on the first page, the “perceptual map of Poland” task was on the second page, the
“perceptual map of Poznań” task was on the third page, and the fourth was blank for comments
(see Appendix A). I believe that although there might have been a small potential for interaction
between the two maps, as they were contained in one package, and therefore subjects could
assume that they should be interested in putting something about Poznań speech onto the Poland
map, I think that the results for both maps can be deemed reliable and without bias.
The task also asked for demographic information. The respondents gave their age,
gender, occupation, education, and place of birth. Also, the subjects indicated where they had

77
lived until adolescence. Such demographic information was repeated in the other tools used in
this study. It allowed me to address and compare the samples in similar manners, so as to reveal
trends in variation.
3.2.2.3. SUBJECTS
The informant sample was collected by convenience through snowball sampling. All of
the respondents were students at Adam Mickiewicz University in Poznań. The perceptual map
was sent through email to Poland and printed out. Then, the respondents filled in a paper version
of the tasks. This way of conducting and distributing the task proved to be productive as it
resulted in 215 completed perceptual packages. Table 3.2 shows the distribution of the
informants, according to gender and place of upbringing.
Table 3.2. The Perceptual Maps Respondents.
Female Male Total
N % N % N %
Poznań residents 32 69% 14 31% 46 21%
Wielkopolska residents 74 69% 33 31% 107 49%
Other residents 38 61% 24 39% 62 30%
Total 144 71 215
The age group was the same for all respondents, and also the occupation category was
composed of either students or white collar workers. I did not ask for demographic information
about their parents. Moreover, the respondents had the same level of education, high school, as

78
they were all in the process of gaining their higher educations. Thus, the categories of gender and
place of birth/upbringing were the only ones that showed variation in the answers.
3.2.2.4. PROCESSING.
Once I collected the maps from Poland and Poznań, I processed them so I could observe
patterns emerging from my data. I invented an innovative method to transform the data into
quantifiable spreadsheets. Most of the process was automated, which allowed for minimal
influence from the researcher and thus avoidance of bias. The aim was to achieve a
representation of the perceptions of speech varieties with their inherently variable nature.
First, I scanned the maps. In Adobe Photoshop CS2, I colored the circled areas and erased
any other information from the scan: for example the cities, administrative divisions, or any
comments left by the respondents. Figure 3.5. shows the map of Poland with drawing by the
Informant POZ_F_073, and then the same map processed in Adobe Photoshop CS2. Cardinal
direction of North has been added for clarity.

79

80
Figure 3.5. Original map by Informant POZ_F_073 and the same map processed in Adobe
Photoshop CS2.

81
Not all subjects actually put circles on the maps; some of them shaded areas or just put
labels on, and sometimes they mixed and matched those techniques. If there were not areas with
a line around them but some other technique used, I decided to color only the areas covered by
the other types of information, as for example labels or shading. It seems that there is no other
way to choose, since we are not able to tell what area the informant meant to indicate if there are
only labels on the map. The examples illustrating different types of practices used by the
informants and the areas they were transformed into are presented in the Appendix B. As the
sample showed, most of the informants used circled areas. However, there were some individuals
who put solely labels on the maps, or shading. The exact distribution is presented in Table 3.3.
Table 3.3. The distribution of techniques used by the informants to indicate speech varieties in
the ‘Perceptual map of Poland’ task.
Type of technique % N Line around an area only 60% 130 Label only 25% 54 Shading only 7% 15 Mix of techniques 8% 16 Total 100% 215
I used the PICtoASCII program2
2 This software is free and it has been developed by Dr. Sefer Bora Lisesivdin at Gazi University in Turkey. The program is available at his home page :
, which converts bitmaps into ASCII symbols. This
program allows saving such a converted bitmap in a .txt format in which various colors
http://sites.google.com/site/sblisesivdin/other-stuff/programs/pictoascii

82
correspond to different symbols, and white space is white space. Such a converted map of
Informant POZ_F_073 in a .txt format with cardinal direction of North is displayed in Figure 3.6.
Figure 3.6. Map of Informant POZ_F_073 in .txt format.

83
Then, using the Find and Replace function in Microsoft Word, I inserted tab
delimitations in order to be able to open such maps in a Microsoft Excel spreadsheet. I used
formulas to count all the symbols in the cells. This way I was able to add all the maps together,
for example by respondents from Wielkopolska. This type of formula resulted in a spreadsheet
containing numbers distributed in the shape of Poland, in which each number corresponds to
how many respondents from a given set indicated some sort of speech in that particular cell,
corresponding to a respective area on the map. Figure 3.7 shows such a spreadsheet for all
respondents from Wielkopolska. For clarity reasons, the country boundaries have been added and
cardinal direction of North has been added as well.
Figure 3.7. Sum of results for all respondents from Wielkopolska with country border added.

84
Having data in such a format, I created charts using Microsoft Excel program from the
sums of maps in various configurations. An example of such a chart is displayed in Figure 3.8.

85
Figure 3.8. Results from all respondents in 2D and 3D view.
Although the maps are smoothing the data through the statistics used to create them, I
believe that it is still a useful way of displaying the results, as it is showing all the levels of
agreement3
3 The 2D view is using colors as an indication of differences while 3D view is showing the same results emphasizing the differences through latitude, also this view allows to better show geographically restricted areas which in 2D view are only points.
. In so doing, interpreting such a tool brings better results because the agreement
levels do not obscure how salient and agreed upon the areas really are. This method is in
opposition to Preston’s (1989) method used to display results, in which he made his decisions in
a categorical manner as the regions displayed as salient were chosen based on whether at least

86
five respondents agreed upon a region. Such areas are products of generalizations and obscure
the real agreement levels of the subjects. Thus, I believe that the method proposed here
represents the data in a more accurate manner.
I also collected and grouped together all the descriptions the subjects gave for the regions
indicated on the maps. This way I compiled a set of the most common names for regions and
many names showing up only a few times or just once. This follows the idea of the A-curve
distribution proposed by Kretzschmar (2009). This issue will be discussed further in the next
chapter.
3.2.3. PERCEPTUAL QUESTIONNAIRE
3.2.3.1 PILOT
In the research done in Poznań by Gruchmanowa and Witaszek-Samborska (1987), a
questionnaire was used to measure speech production. As I explained in Section 3.1.1, such a
method needs to be improved and instead applied to the measurement of speech perception, not
production. I have designed an online perceptual questionnaire to determine what people think
about the words considered Poznań specific and how they perceive themselves using them.
I used the only dialect dictionary published on Poznań speech, so far, by Gruchmanowa
et al. (1999). I created a list of 250 entries from the dictionary that were not characterized as old
fashioned, archaic, or going out of use and designed a pilot study to narrow down the number of
lexemes. I provided a definition for each word and gave an alternate considered to be from
mainstream Polish,4
4 By general or mainstream words I understand here words that can be found in a Polish dictionary. Further discussion about the status of mainstream or general Polish words and Poznań words is presented in Chapter 5
and I asked ten subjects in my pilot study to designate whether they would
use a particular word. I established four social situations that they could choose as a
circumstance in which they see themselves using a particular word: I use it with family, I use it

87
with friends, I use it at work, and I use it in school. Moreover, I asked them to let me know if
any of the definitions provided required additional explanation. I planned to use about 100 items
for the final questionnaire, so I started with words that everyone used and went down until I
arrived with about a hundred items, which means that the final set includes words which at least
6 people told me they used. Based on the feedback I received, I improved some of the
definitions and changed the social situations of use to I use it in formal situations (with
strangers, with superiors), I use it in informal situations (with friends, with acquaintances), and I
use it in conversations with family. I decided to make the categories more general, as the subjects
had trouble deciding what type of interactions I had in mind. So when thinking about work, for
example, they often asked me if I meant talking to coworkers vs. superiors, giving a formal
presentation, or chit-chatting during lunch break.
By making the categories more general, I let the respondents use whatever type of
experiences they desired to create their perceptions. I maintained the distinction between
informal situations and family conversations, mainly to see if there was a perceived difference
between the two. Also as the research indicates (La Page 1985), we have a variety of repertoires
that we use in the way we see best fit the situation. In the pilot version of the questionnaire I did
not use any categories related to frequency with which respondents see themselves using the
words. It was categorical—a subject either reports that he uses the word or not. The feedback I
received, literature, and various consultations suggested that having relative frequencies to
describe the situations of use would allow more discussion about the perceptions of the words
chosen. Therefore, the relative frequencies that were offered were usually, sometimes, and I
don’t use it. One other label, humorously, is not a category of frequency of use but rather of
judgment. This category can be seen as possessing two qualities at the same time. On the one

88
hand, it may be seen as qualitative measure as a judgment whether something is humor or not.
On the other hand, quantitative nature is also present if we understand that humor is rare. In this
sense it could be seen as less frequent than usually and sometimes.
Purposely, I have not used always in place of usually and never in place of I don’t use it
in order to avoid making an impression of definiteness. Moreover, I have added humorously as a
category for three reasons.
1. This way of using words has been mentioned in the literature (Witaszek-Samborska
1987).
2. I have received feedback about such a usage in the pilot study and casual
conversations.
3. I wanted to test my own perception that people do actually use those words in jokes.
4. Those labels allowed me to investigate the subjects’ perceptions about the way they
see themselves using words offered in the online questionnaire.
3.2.3.2. ONLINE QUESTIONNAIRE
Having incorporated changes and improvements prompted by the pilot version of the
questionnaire, I arrived with a set of 101 lexical items to be used in my study. I wanted the
questionnaire to be available to as many subjects as possible. Therefore, I decided that it should
be done via the Internet. I contacted the Survey Research Center at the University of Georgia and
they designed, hosted, and administered my online apparatus survey. The questionnaire was
available to participants online for 10 months. The subjects were recruited by convenience and
snowball sampling. I sent out an email to all my Poznań contacts and asked them to send it to
whomever they could. The email I sent is presented in the Appendix C.

89
Initially, it turned out that the questionnaire containing 101 words was too long and it
took more than 15 minutes to complete. That is why it was divided into three parts, each
containing 33, 34, and 34 lexical items. When the original 101 words were divided into three
groups, a random function in Microsoft Excel was used so that each word had an equal chance to
end up in one of the groups. As for semantic divisions, words were not chosen from the
dictionary with any specific groups in mind, and in the process of narrowing down the number
during the pilot study the frequency was the deciding factor for inclusion. The full list of the final
101 words is presented in the Appendix D. The range of topics covered by the words was vast:
people description, food names, clothes, transportation, kinship terms, utensils in the kitchen,
names of fruit and vegetables, professions, names of holidays, household equipment, and
idiomatic expressions just to name some. The number of words per group varied, and the words
were assigned to groups by the random formula in Microsoft Excel, therefore there was no
control over an equal distribution of words out of the categories. However, the results of all
respondents are considered together, therefore giving equal representations of the terms. The way
the subjects chose which group they worked with was by choosing digits 1, 2, or 3 when
prompted by the question:
Proszę wybrać jedną z następujących cyfr.
Please choose one of the following digits.
There was no explanation of why they should choose one group over another, and there
was no indication to go back to the questionnaire and fill in the other parts of it. This random
distribution turned out to be similar as 33% chose Group 1, 25% Group 2, and 42% Group 3.
It was important to assert that the questionnaire was not filled in over and over again by a
small number of subjects. Therefore, I used filters provided by Microsoft Excel to see if there

90
were subjects with exactly the same demographic information and completed more than one of
the parts of the questionnaire. I have found eight people who shared the same demographic
information and filled in more than one part of the questionnaire. However, since there is not a
uniquely identifiable marker for each subject, there is no way to be absolutely certain that they
were the same individuals. This quality check reinforces the strength of the diversity of the
sample, because it showed that there might possibly be only a few subjects who filled in the
questionnaire more than once.
The information was presented in the following way. After accepting the consent form,
providing demographic information, and choosing the groups of words that they would work
with, every individual was presented with each concept in a repeated manner. Screenshots
showing the views discussed below are presented in the Appendix E.
First, they were given a definition of a word, the Poznań lexeme, and two options to
choose from: I use it or I do not use it. An example is given in Figure 3.9.
Jakich wyrażeń używają Państwo aby nazywać danie zrobione z mięsa gotowanego i galaretki? [What expressions do you use to call a dish made out of boiled meat and gelatin?] Galart
Nie używam [I don’t use it]
Używam [I use it]
Figure 3.9. Word definition.
If the respondent chose the option I use it, they were taken to the next screen exploring
the social situations in which they claim to use it. Figure 3.10 illustrates such a screen.
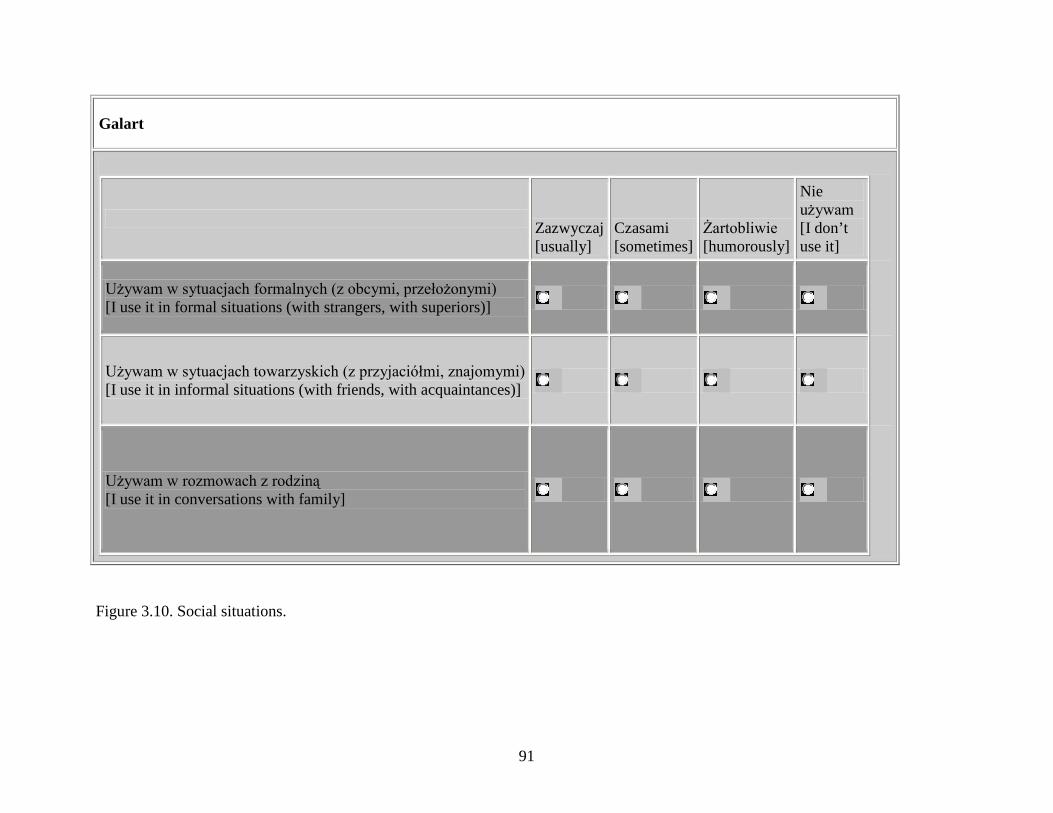
91
Galart
Zazwyczaj [usually]
Czasami [sometimes]
Żartobliwie [humorously]
Nie używam [I don’t use it]
Używam w sytuacjach formalnych (z obcymi, przełożonymi) [I use it in formal situations (with strangers, with superiors)]
Używam w sytuacjach towarzyskich (z przyjaciółmi, znajomymi) [I use it in informal situations (with friends, with acquaintances)]
Używam w rozmowach z rodziną [I use it in conversations with family]
Figure 3.10. Social situations.

92
The way the radio buttons worked was that for each situation the respondent had to give a
response, but they could not give multiple responses for one situation. The next screen takes the
respondent to the mainstream Polish counterpart lexeme, to which they were taken immediately
if they chose I do not use it on the first screen. This sequence was repeated for all lexical items.
The screen for the mainstream Polish word is presented in Figure 3.11.
Jakich wyrażeń używają Państwo aby nazywać danie zrobione z mięsa gotowanego i galaretki? [What expressions to you use to call a dish made out of boiled meat and gelatin?] Galaretka z mięsa
Nie używam [I do not use it]
Używam [I use it]
Figure 3.11. Mainstream Polish word definition.
The sequence of screens described above was repeated for the mainstream Polish
lexeme. Then, the respondents had a chance to provide their own alternative words, as they were
asked if they used some other words to refer to the item indicated. They were also given an
opportunity to indicate if the definition I provided was appropriate or not. If they could not
remember the definition, they were presented with the following screen in Figure 3.12.

93
Figure 3.12. Wrong definition options.
Having such an option helped to reveal possible bias. If the respondents did not
understand the items in the same way I did, they were able to indicate it. Without this component
of the questionnaire, it would have been difficult to determine if the participants had different
concepts corresponding with the proposed lexemes. Lastly if the informants chose to specify
additional alternate lexemes, they were presented with the following screen in Figure 3.13.
Czy używają Państwo również innego wyrażenia? [Do you use another expression?]
Tak [Yes]
Nie [No]
Jeśli pytanie/definicja nie odpowiada według Pana/Pani to proszę tu zaznaczyć. [If the definition/question is not proper in your opinion please check this box]

94
Inne [Other]:
Zazwyczaj [usually]
Czasami [sometimes]
Żartobliwie [humorously]
Nie używam [I don’t use it]
Używam w sytuacjach formalnych (z obcymi, przełożonymi) [I use it in formal situations (with strangers, with superiors)]
Używam w sytuacjach towarzyskich (z przyjaciółmi, znajomymi) [I use it in informal situations (with friends, with acquaintances)]
Używam w rozmowach z rodziną [I use it in conversations with family]
Figure 3.13. Other words options.

95
Having a screen set up this way, respondents were able to write down as many answers as
they wanted in the text box and provide the social situations in which they reported themselves
using it. They could either put multiple words into the text box and indicate their social situation
use, or using their Internet browser’s back and next functions fill it in separately for each word.
The sequence of the screens was repeated for each item and transferred to a Microsoft
Excel spreadsheet as each screen was submitted. Respondents were asked to create a password to
be able to go back to an unfinished questionnaire and complete it. They were not able to go back
to the completed questionnaire and edit it. In the subsequent analysis, I did not take into account
the possible effects of participants requiring more than one session to complete the questionnaire.
If the questionnaire was unfinished, it was still included in the data, except for those that were
empty throughout or those having only demographic information filled in and nothing else.
3.2.3.3. SUBJECTS
As mentioned earlier, the sample subjects were obtained through snowball sampling, as
the email was passed on from one person to another. I received 301 questionnaires. After taking
into account the data from empty questionnaires, and the one respondent who did not agree with
almost all of the definitions provided by me5
The demographic information gathered at the beginning of the task allowed for
describing the obtained sample. The first collected was age; I established five age groups: 18 to
30, 31 to 40, 41 to 50, 51 to 60, and 60+. Taking previous research on Poznań speech (Witaszek-
Samborska 1985) into account, I decided to have age groups in about ten-year divisions (except
, I ended with 282 respondents. Empty
questionnaires were those which had only up to the demographic information section filled in
and no responses for the lexical items; there were 18 of them.
5 I have a suspicion that she must have misread the option, as she has provided all the answers and checked that option on every single word

96
for the youngest and the oldest group), as opposed to 20 year divisions to see if variation
attributed to age (Millroy et al 2003, Labov 1972) was present in such age cohorts. It turned out
that the age group 41 to 50 was very small compared to the other groups (only eighteen
respondents). Therefore, I decided to divide this cohort among the two neighboring ones. I
divided this age group into two and changed the age categories into 18 to 30, 31 to 45, 46 to 60,
and 60+. The distribution of the respondents among those groups is presented in Table 3.3.
Table 3.4. Age distribution among questionnaire respondents.
Age % N 18-30 34% 97 31-45 23% 64 46-60 24% 68 60+ 19% 53
The next category was gender. The distribution here emerged similar enough for analysis
to be performed with 57% (N=162) women and 43% (N=120) men. Next was the category of
education. Here, I used a three-way distinction between elementary, which indicates completion
of elementary school; high school, which indicates graduation from high school or some other
vocational school; and higher, which indicates college or university degrees having been
obtained. This three-way scale is common in Poland in any type of administrative practices,
government forms, and research, as in example Gruchmanowa (et al. 1987), or Witaszek-
Samborska (1985, 1987). The distribution for this characteristic is uneven, as presented in Table
3.5.

97
Table 3.5. Education level distribution.
Education level % N Elementary 1% 2 High School 15% 38 Higher 84% 234
Having such a sample, I will only discuss the results obtained from the highly educated
people group earlier described by Witaszek-Samborska (1985). Therefore, the final number of
respondents used for the analysis will be 2726
We can see a direct correlation between education and occupation, as the distribution for
occupation is also uneven. I have chosen a three-way distinction when it comes to occupation:
blue collar worker, white collar worker, and student. Although the categories may seem
outdated, those perceived groups seem to remain alive in the minds of my respondents, because
when in the perceptual map tasks demographic section, informants were asked to provide their
occupation, white collar worker and student were the most prominent. It may be the case that
socialistic jargon has not yet had a chance to diminish in the minds of Poles. I added the category
student, as I wanted to provide an option for them to have a category to select. The distribution is
presented in Table 3.6.
. This allows me to have a balanced sample of
speakers between the tasks, as the respondents represented in the perceptual map task are also
included in the description of such a social group. And as it will be shown, the interview
informants are also a similar group.
6 The details concerning exclusion will be provided in Chapter 5.
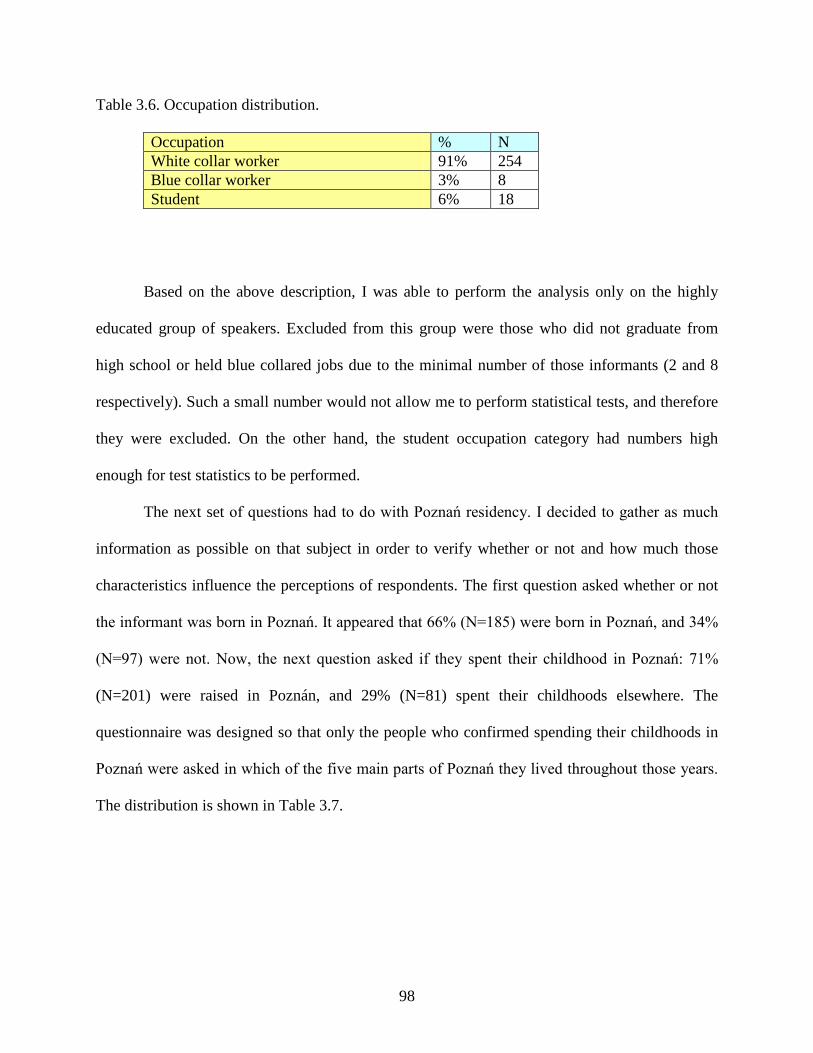
98
Table 3.6. Occupation distribution.
Occupation % N White collar worker 91% 254 Blue collar worker 3% 8 Student 6% 18
Based on the above description, I was able to perform the analysis only on the highly
educated group of speakers. Excluded from this group were those who did not graduate from
high school or held blue collared jobs due to the minimal number of those informants (2 and 8
respectively). Such a small number would not allow me to perform statistical tests, and therefore
they were excluded. On the other hand, the student occupation category had numbers high
enough for test statistics to be performed.
The next set of questions had to do with Poznań residency. I decided to gather as much
information as possible on that subject in order to verify whether or not and how much those
characteristics influence the perceptions of respondents. The first question asked whether or not
the informant was born in Poznań. It appeared that 66% (N=185) were born in Poznań, and 34%
(N=97) were not. Now, the next question asked if they spent their childhood in Poznań: 71%
(N=201) were raised in Poznán, and 29% (N=81) spent their childhoods elsewhere. The
questionnaire was designed so that only the people who confirmed spending their childhoods in
Poznań were asked in which of the five main parts of Poznań they lived throughout those years.
The distribution is shown in Table 3.7.

99
Table 3.7. Distribution among city divisions
Poznań division % N Stare Miasto 23% 46 Nowe Miasto 16% 32 Jeżyce 18% 36 Grunwald 28% 56 Wilda 15% 30
The distribution is similar with only two divisions receiving higher numbers. It seems
that such a distribution is an accident of the data and the way the sample was obtained. The last
question concerned with residency was presented in the following manner displayed in Figure
3.14.
Jak długo mieszkacie Państwo w Poznaniu? [How long have you been living in Poznań?]
Mniej niż 2 lata [Less than 2 years]
2-5 lat [2-5 years]
5-15 lat [5-15 years]
powyżej 15 lat [More than 15 years]
całe życie [All my life]
Figure 3.14. Residency question.

100
It should be noted that the respondents were allowed to check more than one field here;
however, they did not seize that opportunity. The distribution of residency is not even, with over
70% of the informants living in the city for more than 15 years. The details can be seen in
Table 3.8.
Table 3.8. Residency distribution.
Years of residency in Poznań % N Below 2 years 3% 9 2-5 years 5% 13 5-15 years 13% 37 Over 15 years 26% 74 All my life 52% 149
From the description above, the sample emerged to be mainly composed of long-time
Poznań residents who were born and raised in the town. They also received at least a high school
diploma or graduated from a university. They are well balanced when it comes to gender and
age. All of those characteristics will be considered when discussing the perceptions that this
sample of people had about the lexical items considered characteristic of Poznań speech. The
original 301 questionnaires received were reduced to 282 after the empty ones were deleted, and
for the purpose of the analysis presented in Chapter 5, the sample will be reduced to 272 after the
exclusion of blue collar workers and those who did not graduate from high school.

101
3.2.4. LINGUISTIC INTERVIEW
3.2.4.1. PROTOCOL
Linguistic interviews were conducted in order to have a tool with which a relationship
between speech perception and speech production patterns could be established. The sample was
obtained through snowball sampling. I have adopted linguistic interview protocols from
“Roswell Voices” (2006). This project was a community-based study in which informants were
encouraged to talk about their lives in the community and the culture and history of the place
itself. This kind of approach for interviews seemed to be the best fit for the study in Poznań. I
used the questions from “Roswell Voices” protocol and added some of my own to accommodate
different cultural elements. I added questions about the customs and dishes typical for Catholic
and Polish traditions, for example Christmas Eve dinner, All Saints Day, Easter Sunday and
Monday traditions, and meals. Moreover, I have exploited the topics of cultural events in
Poznań: for example the Independence Day/Saint Marcin Parade and pastries made especially for
this occasion, folk festivals, Malta Theater Festival, International Trade Fair, and various events
happening at the Old Market Square in downtown Poznań. The full linguistic interview protocol
is available in the Appendix F. In the interviews I encouraged storytelling with open-ended
questions in order to get as much spontaneous speech as possible. However, at the end of each
interview I spent a few minutes on eliciting lexical items from the perceptual questionnaire, I
called it a ‘word quiz’. I chose 20 lexical concepts from the final version of the questionnaire and
used the definitions previously established. In the interviews I used a slightly different technique
than in the perceptual questionnaire, because I read the description of the lexeme and asked the
informant to tell me what words they used. I did not provide any context or hints as to what types
of words I wanted to hear. When asked about it, I tried to be as general as possible. The

102
informants were allowed to provide as many answers as they wanted, and if they did not know
the meaning of a particular item, they were not required to come up with one. By doing things in
this manner, I wanted to check if the informants would say Poznań words and were able to recall
them without a specific context.
3.2.4.2. SUBJECTS
As I mentioned earlier, the subjects were obtained through snowball sampling. The
sample consisted of eight interviews: three men and five women. Table 3.9 shows all of the
informants with their characteristics.
Table 3.9. Interview Informant’s demographic information.
Informant ID Age Gender Education Occupation Native Poznań resident Yes/No
F1 27 Female Higher Administrative assistant
Yes
F2 32 Female Higher Executive Yes F3 54 Female High school Accountant Yes F4 55 Female Higher Lawyer Yes F5 60 Female High school Housewife Yes M1 27 Male Higher IT Specialist No M2 30 Male Higher Store Manager Yes M3 62 Male Higher Theater
Director Yes
All of the informants except for one were born and raised in Poznań and spent their lives
in the city. They all could be described as part of the highly educated group as suggested by
Witaszek-Samborska (1985).

103
The interviews yielded about 10 hours of recorded speech. I transcribed all of them using
standard Polish spellings. Such a collection represents a corpus of 80,783 words. I looked at the
transcripts in two ways. First, I divided the transcripts into two parts: conversation and
elicitation. Those two groups of transcripts were considered separately. Second, I wanted to see
how many of the lexemes described as specific to Poznań speech were used by the informants. In
order to do that, I explored the transcripts to establish a set of words considered to be local. This
allowed me to analyze the speech of Poznań residents in regard to their usage of the local
lexemes.
3.3. SUMMARY.
In this chapter, I have presented the methodology that I used in my research on
perception and production. The three tools were designed to compensate for shortcomings of the
methods used in previous surveys, while making advances never before used on such data. I have
shown what type of logic was behind the conceptual framework for the methods of previous
studies of a similar nature and what types of biases have been prevented more or less
successfully. Having this background established, I will continue on to the analysis of the results
of the first perceptual tool, namely the perceptual maps.

104
CHAPTER 4
PERCEPTUAL MAPS – RESULTS
This chapter presents results from the first task given to the respondents, namely
perceptual maps. It adds more details regarding the methodological solutions used in this
research, and it poses explanations of the outcomes. This chapter also describes the cognitive
premises of the labeling practices employed while drawing the perceptual areas on the maps.
4.1. PERCEPTUAL MAP OF POLAND
4.1.1. TECHNICAL SOLUTIONS
The first task that the respondents were asked to complete was the perceptual map of
Poland. As explained in Chapter 3, the instructions were made as open-ended as possible in order
to encourage as much information to be put on the map as deemed necessary by each informant.
To display the results, I used three different views provided by Microsoft Excel. As I have
described in the previous chapter, the second to last stage of the results map was a spreadsheet
with numbers assigned to specific cells. Each number corresponded to how many of the
respondents indicated this particular area as having some sort of accent linked to a specific cell
in a spreadsheet. Although numbers aligned themselves in the shape of Poland, the boundary
around the country was added in this case to make the view clearer. An example of such a map is
presented in Figure 4.1.

105
Figure 4.1. Spreadsheet map.
I used such a view as one of the methods for displaying the data.1
Another way of
displaying the data was in 2D and 3D, as can be seen in Figure 4.2. below.
1 Additionally, Microsoft Excel offers multiple charts for presenting the outcomes. However, the 3D surface chart proved to be the only one useful for my results. Unfortunately, as the 3D feature seemed at first very exciting, it turned out that the third dimension is false. The value for Z is assigned to each pair of X and Y, and the thickness of each layer is arbitrary, no matter what the range between each level is.

106

107
Figure 4.2. 2D and 3D view of the data.
In order to avoid any ambiguity regarding the clarity of the results, I will be using a third
alternative view, which is a two-dimensional view of the 3D map. On such a map, the
differences are indicated by the disparities in colors: the darker the area, the more informants
agreed upon the location. Unfortunately, Microsoft Excel does not provide enough shades of
grey to account for the ten-level division of the data, which is why I had to use some of the blues
and greens. I have chosen to show the differences between the data at every 10 percent mark,

108
indicated by the color. Although each sample has a different number of subjects, ranges for each
of the ten levels are in the same colors as indicated on the legend.
Figure 4.3. Legend changed from numerical values to percentage ranges.
As we can see in Figure 4.3, each level covers 10 percent of the data. The maximum
number on that particular map is 34, so the range between each level is 3.4. If on another map the
maximum number would be, for example, 75, the range would be 7.5—in order to create 10
levels, each covering 10 percent of the data. This way of presenting the results makes
comparisons between the maps feasible, as it complies with the property of scaling, as discussed
in Chapter 2. For convenience, the ranges originally indicated by the end numbers were switched
to the corresponding percentage ranges as indicated on the figure.

109
4.1.2. MAP OF POLAND IN THE PERCEPTION OF POZNAŃ STUDENTS
4.1.2.1. THE SUM OF ALL RESPONDENTS
Having data prepared in the manner described above, I was able to explore it in depth. I
had 215 maps. When I created a formula which added across all of the maps, the Microsoft Excel
spreadsheet had a distribution of numbers, which is presented in Figure 4.4.
Figure 4.4. Spreadsheet of all the results.

110
As the result of this type of processing we can see that the numbers place themselves in
the shape of Poland. The cells are not ideal squares, so all the numbers can be visible, and this
makes the shape of Poland somewhat stretched. However, it is still a good depiction of the
original shape. There was no variation in the alignment of the original boundaries when maps
were added together. However, because they were present in every map, the boundaries caused a
false”wall” of 100% of agreement around the country. Therefore in the worksheets for each map
the boundaries were removed. The symbols corresponding to the boundaries are different from
any of the symbols indicating colors for the indicated speech areas. Therefore, the area indicated
by the numbers corresponds to the surface of the map of the country minus the boundary.
Two points need to be made about the distribution of this map. There are only a handful
of cells which carry numbers over 200, indicating areas where almost every informant circled
something, with only one cell with 213, 215, and 216, all close to each other. The number 216
appeared because some respondents indicated a region within a region in which case such a map
was treated as two maps, but there were only four instances of that. The other important
observation is that there are only a few numbers below 10 on this map that are within the borders
of Poland, as determined by the task itself. There are large areas of numbers in the teens
accounting for speech varieties, but no zeros or single digits. This observation is very important,
as this way of displaying the data makes it visible. The charts will be obscuring the lowest
frequencies because of the fact that there are only ten ranges of data displayed. Furthermore,
most of the area is covered by numbers located somewhere between the highest and the lowest
values. This distribution follows that of the A-curve. If we were to plot a chart displaying the
frequency rank of each number on the map, it would be in the shape of an asymptotic hyperbolic
curve as can be seen in Figure 4.5.

111
Figure 4.5. Frequency of responses of all respondents.
What the figure shows is the relationship between the scores presented in the spreadsheet
view earlier. Therefore, we can see that score 1 (on the x-axis) has appeared on the spreadsheet
twenty one times (on y-axis), and the score 166 appeared once on the spreadsheet. .
Now, the same data transformed into a chart emphasizes the boundaries within the
spectrum, even more than on the spreadsheet view. Figure 4.6 displays a 2D view of the same
map.

112
Figure 4.6. All of the results in 2D view.
The darkest areas of the map are where the highest numbers were located, and white
areas are where 10% or fewer of the informants indicated anything on the map. We can see that
there are four main areas where at least 40% or more of the subjects circled something on the
map; each of those areas is in the North, South, East, and West of Poland. There is a vast surface
around the epicenters with less than 30% of the respondents perceiving any speech variety there .
The dramatic difference between the little amount of area that many subjects indicated, and a
large surface that not many of them agreed upon, is sharpened by this view. Now, as I indicated

113
in the previous chapter, I put the major cities on the map to see if people would respond and use
them as focal points of various types of speech. Figure 4.7 shows the map in 2D view with some
of the major cities indicated.
Figure 4.7. All of the results in 2D view with some cities.

114
It seems that Poznań, in the eyes of the respondents, has some sort of particular type of
speech. Another city clearly pointed out is Katowice in the South. Warszawa, although visible in
the East, does not receive the same type of level of agreement as the previous two. In the North,
the situation seems to be different. The area specified the most is not around any major city. It
may be an indication of a speech pattern present in the area but not strongly associated with the
surrounding towns. A similar situation can be observed in the South, where the mountain region
of Poland received the most recognition out of all.
Now, if we look at the same map in the 3D perspective, the differences in altitude may
reinforce the previous observations. Such a view is presented in Figure 4.8.
Figure 4.8. All of the results in 3D view.

115
This view emphasizes the differences between the regions dramatically. We can see the
peaks of agreement and valleys of lack of agreement. The data portrayed is still the same, but
this angle gives insight into how much the opinion of each respondent differs from one another:
the mountains do exist but are scarce, and the deepest valleys are in short supply. What prevails
the most is the existence of vast plains of low-level agreement.
4.1.2.2. THE SUM OF POZNAŃ RESPONDENTS.
In the previous study performed in the area of perceptual dialectology, Preston (1989)
and Tamasi (2003) have indicated that the subject’s place of residence has influence on his views
about the speech around him. Moreover, Kretzschmar (2009) explains this relationship as having
to do with geographical proximity and is a nonlinear function. According to this idea, people
know the most about their local surroundings and not as much about places far away from them.
This comes from the idea that they have the most information and experience with their locale
and less experience or incomplete information about more distant places. Therefore, the place of
residence might be seen as playing the main role in a subject’s perception of speech close to him
and far away from him.
For those reasons I chose to ask my respondents about their place of birth and residences
up through their adolescent years. According to their answers, I divided them into three groups:
Poznań, Wielkopolska, and other parts of Poland. We have to keep in mind that except for the
schemas created based on their upbringing, all of the subjects are students in Poznań, and this
experience might have also triggered new perceptions. The first maps that will be described are
those of the Poznań respondents.

116
Figure 4.9 presents the Excel spreadsheet with the results of the Poznań residents. This
sample contained 46 maps. We can see that there are no zeroes within the country’s boundaries.
However, there are vast single digit areas and limited values above 40.
Figure 4.9. Spreadsheet of Poznań residents.

117
This tendency seems to be similar to the results previously seen in the sum of all
respondents in section 4.1.2.1. Figures 4.10 and 4.11 show the 2D and 3D view of the data.
Figure 4.10. 2D view of Poznań residents’ results.

118
Figure 4.11. 3D view of Poznań residents’ results.
A few important notes need to be made about the results. First of all, the South of Poland
appears the strongest in the perception of the respondents. It is the biggest area, and it reaches the
highest level of agreement, even in the range of 80% to 90%. Second, Poznań shows to be very
prominent, but the highest number of the subjects’ agreement covers a very limited area--the
further away from the epicenter, the lower the percentage. Thirdly, the shape of the map does not
differ substantially from the one displaying all of the results. It has similar areas that stand out.

119
The characteristic in which this map differs concerns the levels of agreement about the
perception of those with the highest elevation. Poznań received more attention from the native
residents, which confirms the idea that people care more about their own surroundings than
distant areas. However, the fact that the speech of people in the South and area around the town
Białystok received such high scores indicates that except for distance, there are other factors
influencing perception. This issue will be discussed further.
4.1.2.3. THE SUM OF WIELKOPOLSKA RESPONDENTS
The next group that I excerpted from the sample was composed of subjects born and
raised in the Wielkopolska province, but not in Poznań itself. This sample contained 107 maps.
Wielkopolska province is the second largest in Poland in terms of area and third most densely
populated. I wanted to see if there were differences in the perception of Poznań and other areas if
the respondents were not native to the area but lived relatively close to it. The numerical map is
shown in Figure 4.12.

120
Figure 4.12. Spreadsheet of Wielkopolska residents’ results.
This map shows a very limited area with single digit results. The rest of the country is
covered with numbers in the mid and higher ranges, with the highest scores’ cells most restricted
out of all the maps so far. This distribution is seen even more clearly in the 2D and 3D views
presented in Figure 4.13 and Figure 4.14.

121
Figure 4.13. 2D view of Wielkopolska residents’ results.

122
Figure 4.14. 3D view of Wielkopolska residents’ results.
The two views show somewhat different results than from the previous group. What is
immediately noticeable is the fact that the peak around Białystok is not present on this map.
Also, the speech variety in the North is not perceived as unanimously as before, even the range
in the South is more restricted. However, there is less white space. It may indicate that because
the group of subjects was relatively more dispersed in their residences as opposed to Poznań
residents, their perceptions are more dispersed too and therefore cover more ground. By this

123
token, we can also propose that they have a basis for comparison, as they were born and raised
somewhere outside of Poznań, and now they have been in Poznań for some time. On top of that,
the base of the mountain for Poznań is very similar in size to the one designated by native
Poznań residents. However, the agreement level never reaches the highest scores and stays in the
70% to 80% range. Just the same as the former group, the area around Warszawa received a low
to moderate recognition in the range 30% to 40%. A general observation emerging from the
comparison of the map by Poznań residents and Wielkopolska residents is that the latter group
has a more dispersed perception of speech around the country, and the highly agreed upon areas
are extremely restricted.
4.1.2.4. THE SUM OF OTHER RESPONDENTS.
The last group of respondents was those raised outside of the Wielkopolska province. The
sample contained 62 maps. This group is the most diverse in their residency, as their native areas
vary in distance from Poznań and Wielkopolska from a few miles to a few hundred. Again, all of
them are studying in Poznań, so we can assume that their experiences are at least of a dual base,
as they were raised in one part of Poland and now they live or commute to another part of the
country. Figure 4.15 shows the number view of the results map.

124
Figure 4.15. Spreadsheet of Other respondents.
In some respects this map shows a different type of pattern than in the other maps. For
one, there are large areas covered by single digits and a few zeros, the biggest out of all result
maps. Although there are also clusters of the highest scores, as in the previous cases, their
distribution is slightly different. The clusters are surrounded by mid-range numbers, but there are

125
fewer clusters embedded in the smaller numbers covering large areas. This distribution can be
seen even more clearly in the 2D and 3D views in Figure 4.16 and 4.17.
Figure 4.16. 2D view of Other residents’ results.

126
Figure 4.17. 3D view of Other residents’ results.
As can be seen on the maps, especially on the 3D view, there is belt of white space
dividing Poland into the North from the South just below Poznań. Also, there are barely any
speech areas indicated to the west of Poznań. It seems that the epicenter in the East is not exactly
the same, because the most perceived speech variety moved upward into the surroundings of
Białystok instead of Warszawa, in comparison to the previous maps. The perception about the
speech in and around Poznań, as well as in the North and South, are similar to those seen

127
previously: Poznań received high scores even into the 80% to 90% range of agreement. This area
of high agreement covering Poznań is the biggest out of the three groups of informants. One
possible rationale for this observation is that the subjects recently moved to the city and added
some new perceptions about Poznań speech to those they previously possessed. Again, the only
area receiving the highest scores is located in the South of Poland. The darkest region is smaller
than in Poznań resident’s perception but bigger than those of the Wielkopolska province group.
Moreover, the area surrounding Katowice is the largest and darkest of all. All of those dark areas
can be explained in the framework of the “local dome” by Gould and White (1986), in which the
local surroundings and areas with high populations and knowledge about them receive the most
recognition from the respondents. One problem is Warszawa. Although it is the biggest city in
Poland, it did not receive much recognition. It might be that Warszawa gets any type of
recognition at all, not so much because people think it has a particular speech variety, but
because many people believe that such a big city “should” have some sort of special speech.
As I have indicated earlier, the place of residency of the informants has been
demonstrated by previous research (Preston 1989, Tamasi 2003, Kretzschmar 2009) to be crucial
for the type of perception held by the respondents. I also wanted to explore if there is variation
when gender is taken into account. Although there was no indication in the literature that gender
might play a role in the variation of speech perception, this was the only other demographic
factor where my respondents showed variation in responses. Therefore, it is pertinent to discuss
two maps generated according to the gender division.

128
4.1.2.5. THE SUM OF FEMALE RESPONSES.
The first map presents the numerical results for combined maps of all females from the
sample, regardless of their residency. The sample contained 134 maps. Figure 4.18 displays the
result.
Figure 4.18. Spreadsheet of female results.
This tendency is similar to those previously seen in which there are no zeroes within the
boundaries of the country, and there is a very restricted area containing single digit scores and
the highest scores, and a vast surface of midrange numbers. This distribution follows the A-curve

129
shape, just as demonstrated earlier in Figure 4.5. In order to discuss shapes of the perceived
speech districts, 2D and 3D views are presented in Figures 4.19 and 4.20.
Figure 4.19. 2D view of female results.

130
Figure 4.20. 3D view of female results.
Female respondents seemed to circle the regions in the South the most while
simultaneously giving fair amounts of their attention to Poznań and its surroundings.
Interestingly, these women placed the North region at level of 50% to 60%. Furthermore, in the
eastern side of the country, the region around Warszawa is indicated lower at 30% to 40%. A
little further east below Białystok there is a hill, better observed at the 3D view, surrounding
small towns like Biała Podlaska, Siedlce, and Siemiatycze that are all around or below 70,000

131
inhabitants. Although it needs to be noted that the consensus is not high, as it falls below 50%, it
is still the highest in the region and is restricted to a very small area with no major city as an
epicenter. This might be explained by the notion of “local domes” introduced by Gould and
White (1986), in which people show their preferences on the local level, which does not translate
into national preferences. There is also a small district around the city of Katowice with a very
high level of agreement, which indicates that a lot of the female subjects circled the city itself.
The white space covering the lowest level of agreement, or more accurately disagreement,
emerged in the West and in the middle part of eastern Poland, which is consistent with the
previous maps.
4.1.2.6. THE SUM OF MALE RESPONSES
In order to make any type of comparisons between the results based on gender divisions,
Figure 4.21 presents the numerical map of the results for male respondents. This sample
contained 81 maps.

132
Figure 4.21. Spreadsheet of male results.
Compared to the female respondents’ map, there are more single digit areas, and they are
located more in the center of the country, as well as in the West. There are only a handful of cells
with numbers higher that 60, all located in the South. The 2D and 3D views are presented below
in Figures 4.22 and 4.23.

133
Figures 4.22. 2D view of male results.

134
Figure 4.23. 3D view of male results.
It appears that on all levels the speech variety in the South is covering a larger area than
in the perception of the female respondents. Moreover, the area for Katowice is bigger and
darker. The Poznań district reached the 80% to 90% level, higher than for females in this study,
and the same level as residents of Poznań and other parts of Poland. The area that it covers is
somewhere in between the biggest area indicated by residents of other parts of Poland and the

135
smaller area denoted by Poznań residents. In the east, the Warszawa surroundings are more
restricted, and there are no mountains or small towns like those indicated by the women. Instead,
Białystok receives some recognition. In the north, the speech perception distribution is similar.
The white valley is bigger for males in the West and larger for females in the mid-eastern part of
the country. Moreover, male respondents did not indicate many speech areas in the Northeast.
From the above description, it seems that although the differences in the results are not
drastically different between the males and females, they are comparable to the differences and
similarities described between the groups of speakers with various residency backgrounds.
4.1.3. PRELIMINARY OBSERVATIONS
After the analysis and comparison of the maps discussed above, there are a number of
more general observations to be made about the nature of these maps. The most general, and
maybe obvious, observation is that the maps simultaneously demonstrate similarities and
differences. Another general statement can be made that the technical solutions used to analyze
the data make a difference in the way the data can be presented and, by the same token,
analyzed. As I have shown, if we look at the result maps in the form of a spreadsheet filled with
numbers, some of the information is harder to see because we are overwhelmed with
information. A good example of this would be that it is hard to clearly see the peak areas of
agreement immediately. However, those types of maps show that the low frequency answers are
present in the data, and that the maps are filled with them. On top of that, the spreadsheets show
the background of the study, where the results come from, without obscuring it. On the other
hand, the 2D view of the map shows the results in a very clear and appealing way, using colors.
This way of presenting the data shows gradation, although smoothed and averaged by statistics.
It is easy to imagine all of the individual maps layered on top of each other with differences

136
translated into colors. However, the white areas are obscuring the view in such a way that they
might suggest no data in those spots. The 3D view can reinforce and add a dramatic effect while
showing the differences. It also shows restricted peaks which in 2D view are just black dots, as
for example in Figure 4.16, or 4.20. It is a very clear and straightforward way to look at the
variations in the altitude of agreement. I also believe that a topographical representation is easier
and more appealing to understand than color gradation. However, all the high altitude areas
obscure the rest of the view. Overall, the logic behind the use of this sort of methodology and
technology was to avoid generalizations and creation of arbitrary perceptual isoglosses.
Moreover, using three different views of the data, I was able to emphasize the versatility of the
information presented and observe the tendencies in the results. Those trends are presented
below.
1. Subjects associate, in their perceptions, speech varieties with geographical region.
Although it might sound like stating the obvious, it is important to note that subjects
had no problems indicating where they thought various speakers and their speech
were located on the map. Such a statement was also asserted in previous research by
Tamasi (2003:133).
2. The more subjects agreed on a perception of a speech variety belonging on the map,
the more geographically restricted such an area was. No matter what type of group of
subjects was analyzed, the darkest areas were the smallest ones on the maps. This
indicates that subjects are inherently variable and such variability translates into an
immense amount of disagreement and very restricted overlapping agreement.

137
3. The opposite relation is also true. Therefore, the smaller the level of agreement, the
bigger the area indicated on the map. However, it does not mean that the lowest range
0%-10% is the largest area covered. This observation leads to the next point.
4. The way the distribution of responses operates is according to the A-curve. The data
indicates that people do not agree on a specific area more than they do agree. When
their responses are aggregated, the whole map is covered with high, mid, and low
numbers. Out of the entire sample, there will be some people who will indicate an
area not perceived by somebody else, and vice versa, thereby filling in the gaps
between high frequency regions. This way, in the number-filled spreadsheet, we do
not get many zeroes within the boundaries of the country, and we do not get many
high numbers. As it was shown in Figure 4.5, the results plotted in the chart are in an
A-curve distribution. Moreover, the high frequency areas are an indicator of the
shared overlapping cultural schemas.
5. For the sample of subjects in question, the emergent order seems to compose four
main perceptual areas; they are located in the South, North, East, and West. The
southern area in all maps received the highest scores, having the city Katowice
marked consistently in the darkest colors. Second was the western region surrounding
Poznań. Although, the northern and eastern regions were not indicated on the same
levels as the other two, in some cases the eastern areas of Warszawa and Białystok
received high scores; while in the north, none of the cities present on the map
received high scores.
6. The division into four main areas of perceived speech varieties was similar for all
residency groups and between genders.

138
Overall, the results showed us that this tool allows for the respondents to reveal their
perceptions about variation in Polish speech. Except for the areas circled on the maps,
respondents also put names of the varieties and people who use them on the maps. The results of
the analysis of the labeling patterns employed by the informants are presented in the next section.
4.1.4. LABELS USED ON THE MAP OF POLAND
In the previous section I demonstrated that out of the responses given by the subjects,
four areas emerged as the most prominent. In order to draw a full picture of the informants’
perceptions about speech varieties in Poland, I have collected all the labels that were put on the
maps and grouped them. As the four epicenters appeared to roughly correspond to regions
labeled by me as South, North, East, and West, I have continued this division in grouping the
labels. The full list of all labels is available in the Appendix.
When I have put all the labels and their frequencies into a table, a graph presents their
distribution in Figure 4.24.

139
Figure 4.24. Distribution of all the labels.
As can be seen in Figure 4.24, the distribution follows an A-curve, as expected under the
premises of linguistics of speech.2
When four groups of labels were plotted on the charts, they presented the same
distribution, asserting the property of scaling as described in Kretzschmar (2009). Figures 4.25
through 4.28 display the results.
Not all of the respondents labeled the maps, some of them
labeled only a few areas but not others, and some of them gave multiple names. Therefore,
although 215 maps were processed, the highest frequency was 116 for ślązacy ‘Silesians.’ For
reasons of clarity, every eighth label is shown on the chart.
2 The data was taken raw, without any grouping or lemmatization for the A-curve. If it was grouped or lemmatized, the shape of the A-curve would not change, but some of the items would change their place on the curve.

140
Figure 4.25. Distribution of labels from The West.
Figure 4.26. Distribution of labels from The North

141
Figure 4.27. Distribution of labels in The East.
Figure 4.28. Distribution of labels in The South.

142
Again, for clarity reasons only the North has all of the labels; the other graphs have every
other label listed on the X-axis. As evident from those examples, depending on what level of
details we choose to display, the shape of the distribution is consistent:
Each subsample shows the same non-linear distribution, though again there are
differences in the order of the frequencies for particular items, and not every term
is on every list…The A-curve distribution, in every case, scales perfectly from
subsample to subsample. (Kretzschmar 2009:166)
If we compare the chart containing all of the labels to the other four subsamples, all of the
labels are there. The only difference is in their placement on the A-curve. Therefore, gwara
kaszubska ‘Kashubian patois’ on the graph of all labels together (Figure 4.24) is 161st in the
ranking (out of 269 types), but on the graph displaying the results from the North (Figure 4.26.)
it is third. Moreover, it does not belong to the other groups; therefore, it is not on any of the other
graphs.
When I grouped the labels according to their geographical association, I analyzed what
type of labels the informants were providing. The pattern that emerged was composed of four
semantic groups:
1. Geographical names
2.
, in which the subjects labeled the area according with the name
of the region: for example Wielkopolska, or used town/city names, as Poznań, Kielce,
or some other description of the region, as for example góry ‘mountains,’ wschód
Polski ‘East of Poland.’
Names of people, in which informants gave names of groups of people living in an
area, very often based on the geographical names: for example poznaniacy
‘Poznanians’, ślązacy ‘Silesians,’ or gave a characteristics describing the people, for

143
example szaleni kierowcy ‘crazy drivers’ (for people in the west), and głupi
warszawiacy ‘stupid Warszawians.’ Another strategy was to use nicknames for
people living in certain areas, for example pyry, pyrusy, pyrole ‘tater people’ (for
people from Poznań), scyzorki ‘pocket knives’ (for people from Kielce), legioniści
‘legion people’ (people from Warszawa, fans of local soccer team named Legia
Warszawa ‘Warszawa legion’).
3. Features of speech
4.
, in which respondents gave a characteristic of the local speech: for
example naleciałości z rosyjskiego ‘influences from Russian’ (about east region),
zaciąganie ‘drawl’ (about east region). Moreover, the names for speech varieties, as
for example góralszczyzna ‘the speech of mountain highlanders,’ śląski ‘Silesian
language.’
Dialect labels
Labels describing each region were divided into the four groups listed above. Table 4.1
shows the distribution of tokens among the groups in the regions.
, a category which I extracted from the previous group. All of the
instances in which words dialect, patois, language, or accent were used are included
in this group.

144
Table 4.1. Distribution of label tokens among 4 semantic groups and four regions.
The West The East The South The North % N % N % N % N
Geographical names
21% 61 35% 66 23% 129 39% 131
Names of people
47% 131 39% 72 50% 289 36% 120
Features of speech
6% 16 9% 16 5% 26 10% 33
Dialect labels 26% 73 17% 32 22% 128 15% 52
Total 100% 281 100% 186 100% 572 100% 336
An immediate pattern emerges from this table in which most of the tokens belong to the
group of labels describing people; only in the North, geographical names are slightly more
numerous. If we were to combine the first two groups together as non-linguistic descriptions and
the last two as linguistic, the non-linguistic terms cover about 70% of the items in each region.
Now, if we look at the top ranked variants in each region for each semantic category,
another pattern emerges. The results are presented in Table 4.2.

145
Table 4.2. The highest frequency labels in each group and region
The West The East The South The North Geographical names
Wielkopolska [Greater Poland]
Mazowsze [Masovia]
Śląsk [Silesia]
Kaszuby [Kashubian]
Names of people
Poznaniacy [Posnanians]
Warszawiacy [Warszawians]
Górale [Highlanders]
Kaszubi [Kashubian]
Features of speech
Zawołanie ‘tej’ i ‘nie’ [Call to people ‘tej’ and question tag ‘nie’]
Wymowa warszawska [Warszawian pronounciation]
Góralszczyzna [the speech of highlanders]
Kaszubski [the speech of Kashubian]
Dialect labels Gwara poznańska [Poznań patois]
Gwara mazowiecka [Mazowsze patois]
Gwara śląska [Silesian patois]
Gwara Kaszubska [Kashubian patois]
In the West, two main concepts are connected with the province of Wielkopolska and the
major city in it, Poznań: 1) the speech and the people speaking it are labeled using the concept of
the town, 2) while geographically the whole province is accounted for. In the East,
geographically the whole province is pointed to and the speech is labeled this way as well.
However, the people most recognized are the residents of Warszawa, just as their features of
speech. Note that on the perceptual maps, Warszawa never received high scores, nor did the
region. In the South, the province of Silesia is most accounted for, and the speech there is labeled
as such. However, the people most recognized are Górale, and so are the features of their speech.
Interestingly, Górale live in the mountains, but Silesia is a region around Katowice further north.
Therefore, this distinction is not the same as the previous ones in which we had a name of the
province and the major city of that province. Those two regions are adjacent to each other, and
through the gestalt mechanism they were blended together into one entity by the respondents.

146
Lastly, in the North everything is about the Kashubians--the name of the region, speech, and the
people--but there is no indication of a major city, just as no major city received high scores on
the maps.
Taking into account that we can judge the perceptions of the respondents only to the
extent that the data allows us, we can make some general observations.
1. Most of the respondents readily gave labels, which indicates that they do
associate their perceptions with a somewhat defined term, and it was not an
obscure idea to categorize what they think about speech variation in Poland. Same
observation was made in earlier research by Tamasi (2003:127).
2. The way to create categories appeared to emerge into semantically cohesive
groups. Two of them concerned linguistic features, as the names of the speech
varieties and the way they are spoken. The other two were non-linguistic features
concerned with the geographical location and the people who live there.
3. An overwhelming majority of tokens belong to the non-linguistic groups across
all regions. This may indicate that the perception of speech is not really concerned
with speech per se.3
3 We should take into account that there is a possibility of a bias caused by the wording of the instruction (see Appendix A). However, until further research is conducted with another type of wording of the instruction, it cannot be proven.
Following Kretzschmar (2009), we can explain this
phenomenon on the basis of the notion of schemas. The labels produced by the
informants are the evidence for what type of schemas the respondents have
associated with speech variation in Poland. Schemas provide slots for specific
characteristics to be filled in, for example a schema for “speech type.” Now, every
person fills in those slots according to their own experiences and information
gained. Very often there is not enough input to create a comprehensive image of a

147
concept; it is then when we use gestalt mechanism to fill in the gaps. This is how
we arrive with a defined concept, which is not based on full information and
experience but more likely on our lack of knowledge and experience. Therefore,
the fact that the majority of the labels are not concerned with linguistic features
demonstrates the gestalt mechanism. Using people’s names and geographical
names is part of the strategy of using incomplete information to fill in the wholes
and create a gestalt, as the subjects do not have enough linguistic information to
constitute a “truly” linguistic schema, in a sense that only linguistic information
would be used to create it.
4. The proportion of tokens between the groups also shows upon what types of
information the respondents placed the most importance. Labeling groups of
people and naming geographical regions seemed to be the most accurate depiction
of their perceptions of speech varieties in Poland. This observation is in line with
previous research by Tamasi (2003) and echoes Gould and White’s (1996)
findings in which the impressions of the same geographical location may not be
separated from their social perceptions of that area.
This part of the study showed us how the perception of Polish speech is not only
manifested in circled areas on the map, but also in labeling strategies used by the respondents.
Moreover, while respondents were asked to give a description of the speech variety, most of their
answers were concerned with non-linguistic characteristics. Now, once they have asserted that
they do perceive a particular speech variety connected with Poznań, the next section presents the
results connected with the way subjects saw variation within the city limits.

148
4.2. PERCEPTUAL MAP OF POZNAŃ
The second part of the perceptual task performed by the respondents was to circle areas
of speech variation within the city limits. If the subjects did not perceive such a variation, they
were asked to leave the map blank. Out of 215 maps, only 34 informants indicated any
differentiation in the speech within Poznań. Figure 4.29 shows the numerical spreadsheet of all
the results combined. For comparison with the original map of Poznań, refer to Figure 3.4 in
Chapter 3.
Figure 4.29. Spreadsheet of all the results for Poznań.

149
The figure displays the results in a manner similar to those previously seen, in which we
have a few clusters of high scores, a fair amount of mid-range numbers, and a lot of single digit
numbers. The amount of single digit numbers can be attributed not only to the lack of perception,
but also to the low number of maps in the sample. Figure 4.30 and Figure 4.31 display the 2D
and 3D view of the data.
Figure 4.30. 2D view of all the results for Poznań.

150
Figure 4.31. 3D view of all of the results for Poznań.
There seem to be two prominent parts of Poznań perceived as having speech varieties
different than the rest of the city. However, only a small fragment appears to receive the highest
marks. Most of the city is covered in a very low 10% to 20% level of agreement, and there are
areas that fall below 10%. The 3D view is helpful, as it displays those areas and therefore
indicates the boundaries of the city.
As I have indicated, the number of the responses was low, so dividing them into three
subsamples, as it was done for the map of Poland, was not plausible. Nonetheless, as a

151
preliminary basis for future research, I now present numerical spreadsheets of informants from
Poznań, Wielkopolska, and other parts of Poland in Figures 4.32 through 4.34 in order to touch
on an issue of perception about the city itself.
Figure 4.32. Spreadsheet of Poznań residents for Poznań map.
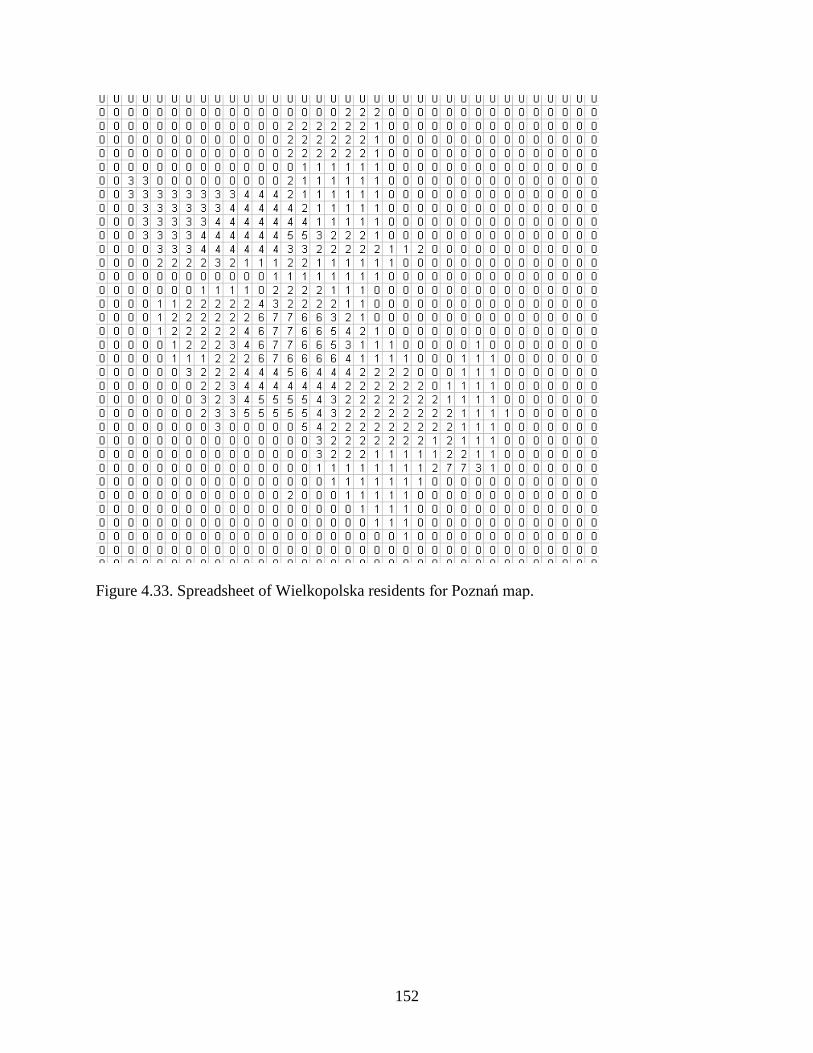
152
Figure 4.33. Spreadsheet of Wielkopolska residents for Poznań map.

153
Figure 4.34. Spreadsheet of Other residents for Poznań map.
Just as an observation, we can see from the comparison of those three spreadsheets that
the regions indicated by the respondents of Poznań are similar to the other subjects, but they are
not exactly the same. It would be an interesting follow-up study to focus on the issue of the
perceived differences in speech within the city.
The map of Poznań had a more detailed description of its administrative divisions than
the map of Poland, as well as some topographical details. So again, I was interested in what type
of labels the subjects assigned to Poznań speech. All of the labels with their frequencies are
plotted on a graph presented in Figure 4.35.

154
Figure 4.35. Labels assigned to Poznań speech.
The distribution still follows the A-curve shape; it is not as smooth as the other, as there
is not that much data. We can see that the first few labels with the highest scores are the
geographical names of the city’s administrative divisions. The labels were not as easily divisible
into categories as the ones for Poland. Many of them were longer descriptions of the speech of
Poznań. All labels are seen in the Figure 4.35. However, because some of them are long, they do
not appear in full length on the graph. Therefore, some of the longer examples are presented in
the Table 4.3.

155
Table 4.3. Some of the descriptive labels about Poznań speech.
Labels in Polish Labels translated Tu się zaciąga po poznańsku Here is where people drawl Poznań style Wiocha - tu ludzie mówią jak na wsi Village - here people speak like villagers Artyści - język górnolotny przez nich samych nie zrozumiały
Artists - conceited language that even they do not understand
Bardzo dużo wulgaryzmów i mowy ulicznej
A lot of vulgarity and street talk
Szczątkowe użycie gwary przez młodszych oraz starsi mieszkańcy używają gwary dużo
Scarce usage of the patois by the younger speakers and older residents use a lot of patois
Wśród młodzieży specyficzny slang Among teenagers a particular slang
We can see that the subjects were concerned with the way people speak and gave their
opinions about it. The labels concerned mainly three subdivisions in Poznań: Stare Miasto,
Jeżyce, and Wilda. Labels describing those districts cover 84% of the data. Those areas are also
the ones that showed up in the darkest colors on the density map, which combines all of the
maps.
As I have shown in Section 4.1.2, the informants have a strong perception that a specific
speech variety for Poznań exists, and it is not unfamiliar to them. They showed it on the maps of
Poland, and in their labels. However, when asked about the specifics within the city limits, only a
handful of them had some ideas to put on the paper. Such a lack of information makes me
inclined to suggest that the mental concept of a specific speech variety of Poznań does exist, but
it is limited to a general description of the city or the region.4
4 The literature does not indicate that there are differences in speech within the cities. However, I wanted to see what the results concerning perception will show, which is why I decided to ask the respondents.
It does not go substantially into the
city districts. The above descriptions of the areas circled on the maps of Poland and Poznań, and
the labels used to describe the speech varieties, leads me to the discussion and conclusion about
the relationship between the regions appearing on the maps and the naming patterns.

156
4.3. PRELIMINARY OBSERVATIONS.
In the analysis leading to this section I have shown charts, tables, and maps displaying
the perceptions about various speech types in Poland. In Section 4.1.3 of this chapter, I suggested
observations about the nature of the perceptual maps, and in Section 4.1.4 I described the pattern
emerging in the labeling process of the maps. Therefore, it is time to connect those two groups of
claims in order to arrive with a description of the results.
This is the first time the perceptual map tool has been used for Polish, so there is not any
previous research to which I could compare my results. However, research done in perceptual
dialectology constitutes a point of reference in the following discussion. I have used the tool
developed by Preston (1989) and adjusted it to better fit Polish data. As much as the tool was
only minimally altered, I believe that presentation and consideration of the results differs
tremendously. As discussed in Chapter 1, Preston (1989) has established the most prominent
regions perceived by his respondents using generalizations, as he “follows the lines of greatest
agreement, creating bundles of perceptual isoglosses” (1989:28). This way of presenting data is
mostly concerned with what people agree on and creating an impression that the agreement is
unanimous, when in fact no more than a 14% level of agreement is needed (5 out of 35 subjects)
for an area to appear as salient on the results map. The three views in which I used to show the
results allow the reader to see the workings of the data while not obscuring the nature of the
results. Namely, there are no neat boundaries and easily defined perceptual regions. I think that
the best way to describe the theoretical difference in this approach is that when it comes to the
results, Preston is talking about the agreement between the subjects, while what I have shown is

157
that there is more disagreement between the subjects than common ground. In light of such a
statement, we should review the observations made about the nature of the results presented
earlier.
First, the subjects did not see any difficulties in associating the idea of a speech variety
with a geographical location and assigning a label to it. In such a simple statement we can see
how the mechanisms of schema, gestalt, and A-curve can be used to explain the workings of the
data. The fact that informants circled and labeled the maps may indicate that they do have a
schema of a “speech variety” associated with Poland. Some of them might be cultural, based on
what they were taught in school, what movies and books they read, what they were told by
others, and multiple other factors. Some of them might be individual, based on who were the
people they talked to all their lives, which part of Poland they grew up in, how many various
speakers they were exposed to, and other variables. If we follow this line of explanation, we can
think of those schemas as being filled in with features to create a gestalt, wholeness, a definite
object, or in the words of Günther and Kretzschmar, an ”observational artifact.” Then, the A-
curve present in the speech distribution would be the basis for our own observations about
language (conscious or not): what is most common would become “normal,” what is in the tail of
the curve would become “different, or unusual.” Therefore, our observations are seen as not
complete or comprehensive, yet they are the basis for creating a perceptual schema. This is a
way in which we can see why after so many steps and tremendous amount of factors influencing
the process of approximating, guessing, and assuming, what subjects arrive with in the end is
very variable and uniquely individual.
On the other hand, some of the factors and schemas overlap and create a degree of
similarity. This mechanism accounts for what was seen on the perceptual maps described earlier.

158
The more speakers agree on an area, the more geographically restricted such an area is. This
observation reinforces the fact that each individual is unique in his or her own perceptions, and
only a small fraction of it overlaps with other people, most probably based on (to some degree) a
shared cultural schema. Moreover, taking the aforementioned results into account, what we
really are looking at on the maps is the degree to which subjects perceived things differently and
did not agree with one another. The same correlation was seen in the distribution of the labels.
Only a few labels received high marks, and they were in some ways the obvious choices, naming
a region and its people based on the geographical name, which all children are taught in school.
This small number of labels is probably a result of the workings of a cultural schema. On the
other hand, the immense amount of individual responses counterweights the results, showing the
variability between speakers.
One more feature of the schemas is revealed by the labeling results for the map of
Poland. When analyzed, the labels fell into four categories: two characterized as linguistic and
two as non-linguistic. Putting away for a moment the bias of the researcher’s perceptions, having
such a division may be a sign of slots for a “speech type” schema—a non-linguistic feature slot
and a linguistic feature slot—in order to make such an observation a fundamental claim. Such
observations were made previously in research conducted by Tamasi (2003) and Gould and
White (1986). On top of that, what makes this distribution even more interesting is that most of
the tokens are within the non-linguistic category while the subjects were asked about linguistic
variation. I believe it can be stated that the non-linguistic group of characteristics is more
important and easily employed by the informants than the linguistic one. Of course such a
statement must be made with two things in mind. First of all, there is a possibility of a bias

159
toward the non-linguistic features because of the wording of the instructions. And second of all,
it is probably not in everyone’s competence to know how to name specific linguistic terms, as a
professional linguist would do.
Lastly, the aim of the task was to explore perceptions of speech in Poland and Poznań.
On the maps of Poland, four main areas arise from the data located in the South, North, East, and
West. The two most prominent cities showing up in the darkest colors were Katowice in the
South and Poznań in the West. This distribution confirmed that the informants have a strong
opinion about the existence of some particular speech variety in Poznań. Therefore, as such
opinion was hoped for by the researcher, the map of Poznań was presented to the subjects.
However, only a fraction of the respondents have preconceived notions about differences in
speech within the city. It indicates that subjects have some sort of perceptual schema on the
national level about the speech in Poznań and its surroundings, but on a more local scale most of
them do not have the same perception or do not want to share it. Following the premises of
linguistics of speech, we need to take the notions of distance, information, and population into
account in the discussion of the perceptual distribution:
The effects of distance and population strongly influence the information that
people have about places, which in turn is subject to evaluation according to
numerous interconnected schemas and sub-schemas. Given the exponential effect
of proximity, what people really know is their local surroundings, and they do not
agree on their mental images even of local neighborhoods. (Kretzschmar
2009:192)
The evidence supporting the last part of this citation is visible in the fact that although
there were only 34 people giving labels to the speech varieties in Poznań, most of the labels were

160
one-time occurrences, as each person had his own “mental images of the local neighborhood,”
while in the perception of other informants Poznań is visible but not on the same level of
agreement. It is important to note that the three factors--distance, information, and population—
work together, and depending on the situation they may carry various weightings. For example,
Katowice is pretty distant from Poznań or Wielkopolska. Therefore, information and population
probably had a bigger influence on making it the most prominent city in the South. On the other
hand, the region in the mountains, which is consistently the darkest color, probably owns the
highest recognition mostly to the information factor, as population is not high and distance might
be a contributing factor only for the sample of respondents from the other parts of Poland. It
needs to be noted that this is the winter and summer sport and leisure destination with heavily
promoted folk culture of the ‘highlanders’ (Górale). In addition, the area in the North is
recognized by the majority of informants as being Kashubian. What is interesting is that the map
presented on the official Kaszuby website (Figure 4.36) is not close to the perceptual images of
the subjects, as seen before (compare to Figures 4.7, 4.10, 4.13, 4.16, 4.19, 4.22).

161
Figure 4.36. Self identified Kashubian population (www.kaszubia.com).
This also gives another piece of evidence that our perceptions are not a one-to-one
reflection of reality, as the subjects’ image puts Kaszuby further south, most probably based on
the lack of information, as it is quite far away and has a lower population. To make the
comparison even more clear, Figure 4.37 presents the results from all 215 respondents with
circled area corresponding to the self identified Kashubian population presented in Figure 4.36.

162
Figure 4.37. The sum of all respondents with circled area of self-identified Kashubian
population.
As we can see, the difference is substantial. This finding gives a foundation for further
discussion about the differences between what people perceive and how that relates to physical
locations. As Kretzschmar points out “region is then necessarily a complex multidimensional
construct, and the physical and behavioral characteristics of regional culture always exist in a
dynamic, self-aware relationship with the perceptions of participants”(2010:8). In the case of
Kashubian, respondents not only placed the area in a different spot than the self-identified

163
inhabitants live, but also named the region using the name of those speakers and not the
geographical and administrative name, which would be Pomeranians. This practice is unique to
this group, as all other top choices were directly connected with the geographical and
administrative names for regions in Poland. The issue of lack of one-to-one correspondence
between physical location and placing perceptions on the map is described by Kretzschmar
(2009) as a cognitive mechanism in which we rely on incomplete information about the speech
variety and whatever we do not know we fill in with what we guess, assume, or we are
convinced more or less that we know to create a defined object. In this case the respondents had
some information about Kashubian speech, and maybe speakers. They probably knew that it is
somewhere up North, but not exactly where. Therefore, they had some information and the gaps
were filled in by guessing, assumption, and approximation. This way the region called
Kashubian is close to the physical location (it was not indicated in the South or East), but it is not
exactly where the self-identified Kashubian speakers live.
One of the main goals of the perceptual map task was to establish the foundation for a
discussion about speech in Poznań. As the results show, subjects have a mental image of speech
particular to the city, and the next chapter will investigate their perceptions of the specific
features of Poznań speech.

164
CHAPTER 5
PERCEPTUAL QUESTIONNAIRE – RESULTS
This chapter presents results from the second task given to the respondents, namely the
perceptual questionnaire. The primary goal of this section is to add more details regarding the
methodological solutions used in this study while providing explanations of the outcomes.
5.1. METHODOLOGICAL NOTES.
In Chapter 3, the subject sample obtained through the perceptual questionnaire was
described and explained. As noted in Section 3.2.3.3, the number of respondents with elementary
educations and/or performing blue-collar jobs was extremely low, 10 subjects. For the purpose of
the analysis, it is not possible to sustain this small group of subjects as a separate entity, as it
would give a false impression of comparability with the other groups. Therefore, the 10 subjects
were excluded from the analysis.
Another issue that needs to be addressed is the scope of this dissertation. The large
amount of data received allows me to perform an immense number of calculations, and the
possibilities are close to endless. However, in the process of preparing this dissertation I focused
only on some of the types of results that are immediately relevant to the research questions
established initially. Therefore, the two primary streams of information in which I am interested
are:

165
1. Who is using/not using Poznań words and mainstream Polish words,
according to the demographic information?
2. What is the distribution of tokens in the social situations of use by the
speakers’ demographic backgrounds, for Poznań words and mainstream
Polish words?
The answers to those questions should provide us with information about the perception
of the Poznań words and mainstream Polish lexemes, and it will be addressed in depth in the
following sections. However, more details have to be provided about the subjects in order to
have a full understanding of the demographics of the sample.
5.1.1. SUBJECTS
I needed to make sure that the research sample of this study was not filled in by only 30
or 40 people repeatedly. In order to do that, filters provided by Microsoft Excel were used to see
if there were subjects with exactly the same demographic information who completed more than
one of the parts of the questionnaire. I have found eight such people. However, since there is not
a uniquely identifiable marker for each subject, there is no way to be absolutely certain that they
were the same individuals. This quality check reinforces the strength of the diversity of the
sample, because it showed that there were only a few subjects who might have possibly filled in
the questionnaire more than once.
The unevenness in the distribution of education and occupation lead to the exclusion of
the subjects belonging in the elementary education category and the blue collar occupation
category.

166
This decision made it possible to make sure that the sample has only two-way distinctions
in the occupation and education demographic factors instead of the planned three-way
distribution. The fact that 10 subjects have been excluded from the sample has influenced the
distribution of tokens.
5.1.1.1 DEMOGRAPHIC INFORMATION.
The change in the number of subjects has influenced three demographic groups of
information: education, occupation, and distribution among city divisions. The three new
distributions are presented in the Table 5.1.
Table 5.1. New distribution of demographic information.
Demographic category
Level in a category Old distribution
New distribution
% N % N Education level High school 15% 38 15% 38 Higher 84% 234 85% 234 Occupation White collar worker 91% 254 93% 254 Student 6% 18 7% 18 City divisions Stare Miasto 23% 46 23% 44 Nowe Miasto 16% 32 14% 27 Jeżyce 18% 36 19% 36 Grunwald 28% 56 29% 56 Wilda 15% 30 15% 30
As we can see in these distributions, the changes are not large, but they are worth
mentioning. In the other demographic categories, the changes are less than one percent. This
change in the sample results in 272 subjects.

167
5.2. RESULTS.
The online perceptual questionnaire was designed to ask respondents indirectly about
what they thought about the way they used their speech. By reporting their speech behaviors,
they shared what types of perceptions they have about the lexical items associated with Poznań
speech and mainstream Polish. All of the issues discussed in this and following sections are
solely concerned with perception, or in other words the image that the subjects have in mind
about those words and about their speech behavior connected with the lexemes. We can also
describe the perception as the beliefs, opinions and knowledge about others and their speech. In
no way are we able to determine their speech behavior based on this tool, as we are not recording
speech. Instead, it is a self-report constructed from whatever information and experience the
informants can recall while using a cognitive mechanism called gestalt to create a unified image
of the subject using given words. Moreover, the creation of such a schema might be influenced
by speakers’ perception about the task at hand, how they see their role in it and what type of
participation they want to project. The two types of questions, which will direct us in the
description of the perception of the lexical items, are concerned with the demographic
information and social situations of use.
5.2.1. QUESTION 1
As indicated above in Section 5.1, Question 1 deals with the description of the subjects:
1. Who is using/not using Poznań words and mainstream Polish words,
according to the demographic information?
The way the data was gathered allows us to look at the distribution of tokens in
accordance with the demographic information along the division of I use (this) word / I do not
use (this) word. Each demographic factor will be discussed separately, first describing the

168
perception of lexemes regarded as specific to Poznań speech. Additionally, the same type of
information will be provided for mainstream Polish words for comparison. This way of looking
at the data will reveal the common and rare trends in the subjects’ behaviors when performing
such a perceptual task. Moreover, it needs to be noted that the analysis designed in this way
describes the data from the speakers’ perspective. However, the data could be analyzed from the
opposite perspective of particular words, and sets of words. Trends described this way would
focus on which words are reported to be used and which not, and by which types of speakers.
This work is beyond of the scope of this dissertation, but presents an avenue for future research.
One more note needs to be made about the two types of lexical items used in this description. For
one, the words labeled as Poznań or local items refer to those indicated by Gruchmanowa (1999)
as specific to Poznań but not exclusive to Poznań. They may appear in other parts of the country.
On the other hand, those labeled as general or mainstream Polish words refer to words found in
general Polish dictionaries.
5.2.1.1. AGE
The first demographic category to be considered is age. In Table 5.2, we can see the
distribution of the tokens among age cohorts for Poznań words.1
Table 5.2. Token distribution for age factor for Poznań words.
AGE USE NOT USE % N % N
18-30 64.9% 1462 35.1% 789 31-45 69.9% 989 30.1% 426 46-60 64.7% 1085 35.3% 593 60+ 62.8% 782 37.2% 463
TOTAL 66% 4318 34% 2271
1 In this table and all others following for clarity reasons, the dependent variable is given on X-axis, and the independent variable is given on Y-axis.

169
Statistical analysis shows that age distribution is significant (χ2 = 16.903 at 3 degrees of
freedom [df], and p<.001). First of all, this table presents the overall distribution of tokens in the
division between I use it and I do not use it. It shows that 66 % of the Poznań words were
reported as used and 34% as not. The differences between the age groups are small, which
indicates that perception is a continuous behavior with small incremental changes. Therefore,
although there are differences between groups within a factor, we need to keep in mind that they
are not large. In this light, among the age groups, subjects between 31 and 45 years old reported
the most positive answers for using Poznań words, second is the youngest group, third the older
group, and the smallest number is reported by the oldest generation. This trend is very interesting
in light of the previous study by Witaszek-Samborska (1987, 1998), in which age was also
significant. In the study conducted by her in observing speech production through a
questionnaire method, the younger the respondent was, the less they knew about the lexical
items. She claimed that the questionnaire method was measuring speech production. However, as
I have indicated in Section 1.1.2, according to the premises laid forth by linguistics of speech, the
questionnaire tool is measuring the reported speech—the perception of speech. Therefore,
despite whether we take her results as measuring speech production or speech perception, we can
see that the results obtained in this linguistic inquiry are in opposition, because the two most
numerous groups of responses are covered by the two youngest groups, not by the oldest groups
as asserted by Witaszek-Samborska (1987, 1998). It needs to be noted that the social profile of
the speakers used by Witaszek-Samborska (1987) is similar to the one presented here (see
Section 1.1.2). Moreover, in her perception research, Witaszek-Samborska (1998) found that
over half of the respondents denied that they used Poznań words when asked (see section 1.1.3.).
But in the results presented here, over 60 percent of the subjects said that they used them.

170
Again, in her research it was the oldest respondents who expressed the most tolerance toward
using the local words, which is in opposition to the results presented here.
The group of speakers that is the most likely to report usage of Poznań words is that of
the 31 to 45 year old age group, since this is the only group which had values higher than the
average (69%) of use and lower than the average of not using Poznań words (30%). In sum, the
31 to 45 year old age group leads the rest regarding the perception of Poznań words, although we
need to keep in mind that this lead is small. To arrive with a fuller image of speech in Poznań in
general, we need to compare the previous results to the answers given for the mainstream Polish
counterparts.
Age distribution for general Polish words was significant (χ2 = 26.980 at df=3, p<.001).
As can be seen in Table 5.3, constructed for general Polish words, the proportion between
individuals reporting using and not using them was 78% using mainstream Polish words and
22% not using them.
Table 5.3. Token distribution for age factor for general Polish words.
AGE USE NOT USE % N % N
18-30 77% 1749 23% 528 31-45 77% 1119 23% 340 46-60 83% 1212 17% 246
60 77% 772 23% 237 Total 78% 4852 22% 1351

171
When it comes to age, it was the 46 to 60 year olds who claimed using the most general
Polish words, 83%, while in all other groups it was 77%. Once again, we need to emphasize that
as much this factor is significant, the differences are not substantial. This age group is only a
little more likely to report using general Polish words. One interesting difference between the
distribution of Poznań and mainstream Polish words was that if we compare Table 5.3 to the
Table 5.2, we can see that the 46 to 60 year olds have the same type of distribution for general
Polish words as the 31 to 45 year olds have for Poznań words. It is interesting that the
distributions for both types of words are similar enough to each other, although the leading group
of speakers is different.
5.2.1.2. GENDER
In the research previously conducted on the perception of Poznań speech, Witaszek-
Samborska made an interesting conclusion regarding gender:
Zgodnie z oczekiwaniami ani płeć, ani zawód czy poziom wykształcenia nie
wpływały na udzielane odpowiedzi.
Just as expected, neither gender, nor occupation, nor education was a significant
factor influencing the answers (1998: 200).
However, in the study presented here those factors were considered as crucial for
accounting for the distribution of the tokens. Gender was significant for Poznań words
(χ2= 41.338 at df=1, p<.001). This finding is in opposition to the results obtained by Witaszek-
Samborska (1987, 1998), which indicated that gender was not significant for the results
distribution.

172
Table 5.4. Distribution of tokens for gender for Poznań words.
GENDER USE NOT USE % N % N
FEMALE 62% 2473 38% 1486 MALE 70% 1845 30% 785
TOTAL 66% 4318 34% 2271
As we can see here, males perceived themselves using the Poznań items more than
females did. Their percentage value is above the average, while the females’ is below. The
difference in the percentage is only 8%, therefore we can say that men are more likely to see
themselves using Poznań words, but this category is indicating the continuous nature of our
perceptions. As such, both genders perceived themselves using Poznań words and are just
slightly different. Also, if we look at the proportion between the frequency of negative answers
for both genders, we can see that females did not perceive themselves using Poznań words
somewhat more than males. It needs to be noted that for gender the chi-squared statistic was not
a significant factor for general Polish words. Therefore, this factor is not discussed.
5.2.1.3. OCCUPATION AND EDUCATION.
As it was explained in detail in Section 5.1.1, two of the factors originally with the three-
way divisions were excluded (elementary education and blue collar worker occupation) and
converted into two-way divisions. When chi-squared test statistics were performed, the
occupation factor for Poznań words was not significant; therefore it will not be discussed here.
This result confirms the findings of Witaszek-Samborska (1998). However, the education
category for Poznań words was significant (χ2 = 19.672 at df=1, p<.001). Education was not
significant in Witaszek-Samborska’s (1987, 1998) research. The distribution for education for
Poznań words is presented in Table 5.5.

173
Table 5.5. Token distribution for education for Poznań words.
EDUCATION USE NOT USE % N % N
HIGH SCHOOL 72% 639 28% 247 HIGHER 65% 3679 35% 2024 TOTAL 66% 4318 34% 2271
This table indicates that people who perceived themselves as using Poznań words more
than the average were those with only a high school diploma. Although the number of answers is
multiple times smaller for high school graduates than for collage graduates, the percentage
proportion shows that this group is still more likely to declare themselves using Poznań words.
The difference between the percentage scores was slight. Interestingly, for general Polish words
the situation was reversed: education was not significant by the chi-squared statistic, but
occupation was..
Occupation was also significant for general Polish words (χ2 = 22.346 at df=1, p<.001).
The results of the occupation distribution for general Polish words are presented in Table 5.6.
Table 5.6. Token distribution for occupation for general Polish words.
OCCUPATION USE NOT USE
% N % N WHITE COLLAR WORKER 79% 4528 21% 1209 STUDENT 70% 324 30% 142 Total 78% 4852 22% 1351

174
As we can see, the highest value for the perception of using mainstream Polish words is
attributed to the white collar workers. Interestingly, students saw themselves using general Polish
words less than the average and declared not using them more than the average. The difference
between the percentages is modest, just as in the previous category. Provided that occupation and
education would be significant for both sets of words, we would be able to make direct
comparisons. However, it seems that students were less willing to see themselves as using
mainstream Polish words, and at the same time people with high school diplomas perceived
themselves using Poznań words more.
5.2.1.4. BIRTH PLACE, CHILDHOOD, AND RESIDENCY.
The three characteristics that are interconnected with the idea of where a person was born
and how long they have lived in a specific community are the place of birth, childhood, and
residency. It has been posited that these topics may have influence on the speech perception of
individuals (Kretzschmar 2009).
First off, for Poznań words, all three categories were significant: place of birth (χ2 =
86.786 at df=1, p<.001), place of upbringing (χ2 = 81.796 at df=1, p<.001), and residency (χ2 =
83.913 at df=4, p<.001). Table 5.7 presents the token distribution for all three factors regarding
Poznań words.

175
Table 5.7. Token distribution for birth place, childhood and residency for Poznań words.
BORN IN POZNAŃ USE NOT USE % N % N
YES 69% 3037 31% 1339 NO 58% 1281 42% 932 TOTAL 66% 4318 34% 2271 CHILDHOOD IN POZNAŃ
USE NOT USE % N % N
YES 69% 3261 31% 1475 NO 57% 1057 43% 796 TOTAL 66% 4318 34% 2271 RESIDENCY IN POZNAŃ
USE NOT USE % N % N
LESS THAN 2 YRS 58% 122 42% 90 2-5 YRS 53% 138 47% 121 5-15 YRS 58% 530 42% 389 ABOVE 15 YRS 63% 1097 37% 634 ALL LIFE 70% 2431 30% 1037 TOTAL 66% 4318 34% 2271
The percentage proportion between birthplace and childhood category is nearly the same,
with those who were born and raised in Poznań seeing themselves as using the local words more
than the average.2
2 Further tests would have to be conducted to confirm whether a portion of the respondents were born and spent their childhood in Poznań.
It seems that there is a relationship between the length of residency and
perception of use: the longer one lives in Poznań, the more he sees himself using Poznań words.
The life-long residents are the only group of informants who have a percentage of use higher
than the average. Despite all of this, what is most surprising is that people who lived in Poznań
for less than two years get the same results as those living five to 15 years, and more than those
whose residency is between two and five years. What also needs to be noted is that the variation
between the highest percentage score and the lowest for birth place and upbringing in the Poznań
category is 9%, and for the residency 17%. We can see that the difference for birth place and
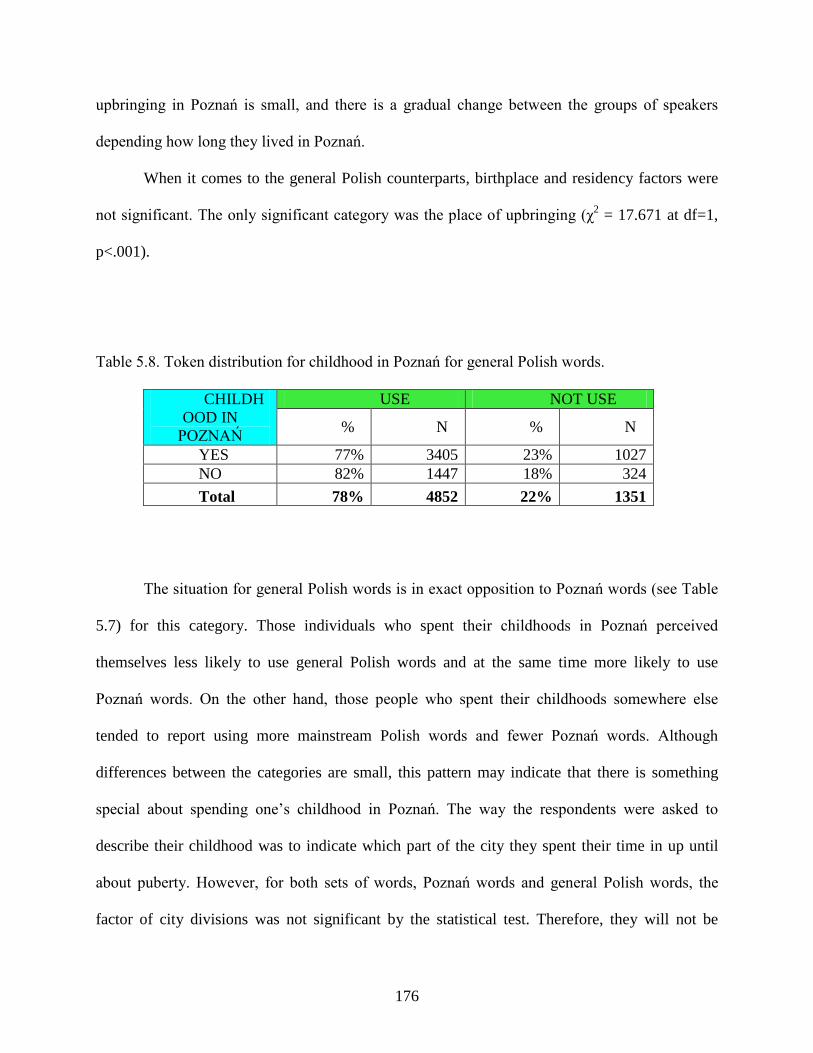
176
upbringing in Poznań is small, and there is a gradual change between the groups of speakers
depending how long they lived in Poznań.
When it comes to the general Polish counterparts, birthplace and residency factors were
not significant. The only significant category was the place of upbringing (χ2 = 17.671 at df=1,
p<.001).
Table 5.8. Token distribution for childhood in Poznań for general Polish words.
CHILDHOOD IN
POZNAŃ
USE NOT USE
% N % N
YES 77% 3405 23% 1027 NO 82% 1447 18% 324 Total 78% 4852 22% 1351
The situation for general Polish words is in exact opposition to Poznań words (see Table
5.7) for this category. Those individuals who spent their childhoods in Poznań perceived
themselves less likely to use general Polish words and at the same time more likely to use
Poznań words. On the other hand, those people who spent their childhoods somewhere else
tended to report using more mainstream Polish words and fewer Poznań words. Although
differences between the categories are small, this pattern may indicate that there is something
special about spending one’s childhood in Poznań. The way the respondents were asked to
describe their childhood was to indicate which part of the city they spent their time in up until
about puberty. However, for both sets of words, Poznań words and general Polish words, the
factor of city divisions was not significant by the statistical test. Therefore, they will not be

177
discussed. Addressing all of the above factors concludes this part of the analysis, and before we
move on to Question 2, we should summarize what we have discovered so far.
5.2.1.6. PRELIMINARY OBSERVATIONS.
For now we have investigated factors gathered in the demographic part of the
questionnaire and connected them with the distribution of the subjects’ perceptions of using/not
using Poznań and mainstream Polish words. Only two factors were not statistically significant
for Poznań words: occupation and the city divisions categories. For general Polish words it was
gender, education, birthplace, length of residency, and the city divisions categories. All other
factors were significant, and thus a description of the patterns emerging from them follows.
For Poznań words, age turned out to be significant, as in the study previously conducted
on the same type of highly educated sample by Witaszek-Samborska (1987, 1998). However, the
relationship between the age groups was not the same as previously reported. In the present
study, the 31 to 45 year old group was leading in the perception of use, rather than the oldest
group. This means that the 31 to 45 year olds were more likely to use Poznań words than any
other group. A similar situation was true for general Polish words in which the 46 to 60 year olds
were the only group reporting using the most mainstream Polish words, being at odds with all the
other age groups. In a way, the 31 to 45 year olds played the same role in the perception of
Poznań words as the 46 to 60 year olds did for general Polish words. Not only for age category,
but for all significant factors we have to keep in mind that the differences between the percentage
scores were small, showing gradual changes from one group to another rather than categorical
distinctions. Such a distribution should be expected under the provisions of linguistics of speech
(Kretzschmar 2009), in which all facets of human behavior such as speech and its perception are
seen as a continuum with incremental changes causing a difference in the bigger scale.

178
When it comes to gender, it was the males who were more likely to perceive themselves
as using Poznań words than the group of females who participated in the questionnaire. Gender
was not a significant factor for general Polish words. The education category was significant
only for Poznań words in which the high school graduates saw themselves using it slightly more
than the collage graduates and the average. On the other hand, the occupation category was
significant for mainstream Polish words but not for Poznań words. This category revealed that
white collar workers are seeing themselves more as general Polish word users than students.
The next three categories had to do with where subjects were born and lived. What was
most revealing for Poznań words was that it was those who were born or spent their childhood in
Poznań who reported using the words more than the other group, and the average. Although the
difference in percentage was small, it appears that those participants who did not spend their
childhoods in Poznań were more likely to use more mainstream Polish words, while the reverse
was true for the other group who was brought up in Poznań. Therefore a tendency can be
described in which those informants brought up in Poznań are more likely to perceive themselves
as using more Poznań words and fewer general Polish than the other group. Furthermore, for the
residency category for Poznań words, small incremental changes between the groups indicate
that the longer you live in Poznań, the more likely you are to report the use of the local words,
with the exception of two to five year residents. This factor was not significant for general Polish
words. In a similar fashion, the city division factor, which described where the residents spent
their childhoods within the city limits, was not significant for both sets of words. All these
factors demonstrate only one side of the trends and patterns emerging from the data. Further
analysis will provide more information leading to the arrival of a model describing not only
speech perception but also its connection to speech production.

179
5.2.2. QUESTION 2.
In the section concerned with the answer to Question 1, we have discussed what types of
speakers perceived themselves as using Poznań/general Polish words and what types of speakers
reported not using the Poznań/general Polish words. Now, the other type of question that will be
addressed here is:
2. What is the distribution of tokens in the social situations of use by the speakers’
demographic background, for Poznań and mainstream Polish words?
In other words, those informants who indicated use of Poznań words and general Polish
words were asked to specify in which types of social situations they saw themselves using them
(for details see section 3.2.3.2). The three-way division for social situations was formal, casual,
and with family. The four-way relative frequency was usually, sometimes, humorously, and I do
not use it. Such a contingency table had to be collapsed into one row so that demographic
information could be linked to it. This way we have twelve categories (formal/usually,
formal/sometimes, formal/humorously, formal/I do not use it, casual/usually, casual/sometimes
and so forth), and we can consider them in regard to the demographic factors previously
established. For reasons regarding clarity the results will be discussed first by demographic
information, second according to the social situation, and thirdly by the Poznań/general Polish
division. Lastly, the occupation and education categories were not significant for either sets of
words as determined by the chi-squared statistics, therefore they will not be discussed.
5.2.2.1. AGE
The first piece of demographic information provided by the subjects was age. For all
social situations the chi-squared test asserted significance: formal situation (χ2 = 96.238 at df=9,

180
p<.001), casual situation (χ2 = 190.238 at df=9, p<.001), and family situation (χ2 = 113.344 at
df=9, p<.001). Table 5.9 presents the token distribution for age in a formal situation for Poznań
words.
Table 5.9. Token distribution for age in formal situation for Poznań words.
AGE FORMAL / USUALLY
FORMAL / SOMETIMES
FORMAL / HUMOROUSLY
FORMAL / NOT USE
% N % N % N % N 18-30 25% 390 19% 292 15% 234 41% 643 31-45 23% 244 23% 241 18% 191 35% 369 46-60 15% 164 19% 209 17% 190 49% 533 60 20% 168 23% 190 23% 187 34% 275 Total 21% 966 21% 932 18% 802 40% 1820
The average distribution of tokens for each of the categories regarding rate is nearly the
same for the first three groups, while I do not use it received 40% of answers. If we look
separately at the relative frequencies, we can see that the youngest group of speakers was most
likely to report using Poznań words usually in the formal situations. For sometimes it was the 31
to 45 year olds, and those informants above 60 years old saw themselves using it the most.
Interestingly, for the humorously category it was the oldest speakers who led in usage reporting,
while the second highest score belongs to the 31 to 45 year olds. In the I do not use it column,
the group leading in the perception of not using Poznań words in formal situations was the 46 to
60 year olds. Interestingly enough the oldest group reported the fewest number of negative
responses. So, although in the previous section it was the 31 to 45 year olds who claimed to use
the most Poznań words, as described in section 5.2.1.1, the oldest group perceived itself as being

181
composed of humorous users and people who reported not using it the least. The next social
situation under investigation is the casual interaction.
Table 5.10. Token distribution for age in casual situations for Poznań words.
AGE CASUAL / USUALLY
CASUAL / SOMETIMES
CASUAL / HUMOROUSLY
CASUAL / NOT USE
% N % N % N % N 18-30 43% 668 33% 509 22% 346 3% 41 31-45 41% 431 33% 345 25% 261 2% 17 46-60 23% 258 31% 338 41% 449 5% 56 60 32% 261 34% 279 31% 253 3% 27 Total 36% 1618 33% 1471 29% 1309 3% 141
This distribution reveals a few immediately emerging tendencies. The averages for each
column are different from the previous situation, because the perception of denying the use of
Poznań words in casual situations dropped down from 40% to 3%. Furthermore, the youngest
group had the highest occurrence for the usually frequency, and at the same time it had the
lowest score for the humorously frequency. Although the difference between the highest and the
lowest percentage value is not more than 20%, this may indicate that the youngest speakers
perceived themselves using Poznań words usually in casual situations, but humorous usage is not
appropriate or desired for such a setting. Just the opposite trend is true for 46 to 60 year olds who
claimed to use local words usually in casual situations the least, but at the same time they
reported the highest usage situation as humor. It looks like for those speakers Poznań words are
more appropriate as jokes in casual situations. It turns out that the 31 to 45 year olds were the
most similar to the youngest group, as they saw themselves using it usually but not less so

182
humorously. Overall, although not a tremendous difference, in casual situations the usual usage
and low usage as humor was perceived as most desired by the two youngest generations in
opposition to the two older age groups.
The last social situation established for the age factor for Poznań words was
conversations with family. Table 5.11 presents the distribution.
Table 5.11. Token distribution for age in family situations for Poznań words.
AGE FAMILY / USUALLY
FAMILY / SOMETIMES
FAMILY / HUMOROUSLY
FAMILY / NOT USE
% N % N % N % N 18-30 44% 687 33% 517 20% 311 3% 47 31-45 42% 445 33% 351 24% 249 1% 8 46-60 28% 305 38% 420 32% 348 2% 26 60 35% 290 37% 306 24% 193 3% 28 Total 38% 1727 35% 1594 24% 1101 2% 109
Overall, the distribution between the frequencies is very similar to the one previously
seen. Again, the two youngest groups display nearly the same allocation of percentages in the
cells, not only between each other but also in respect to the previous situation–casual. This time
46 to 60 year olds, although still leading in the report of using Poznań words humorously, had
increased scores for usually and sometimes by lowering the percentage of humorously. A similar
situation can be observed for the oldest group, in which some of the humorously score was
moved to the other categories, making this group have the same score for the humor category as
the 31 to 45 year olds. One last note needs to be made here that although differences were
indicated between the frequency of usually and sometimes, the nature of those terms is similar,

183
and the percentage scores for them are close also. The humorously category is different in nature
as it does not refer to a frequency of use, but more a manner of using the word. Still the
percentage for it is also similar to the other categories. This type of distribution is an indication
that the behavior captured by this method is continuous for the speakers, and although the
differences between them are present, since each individual is variable, they are more gradual,
small increments that we observe, not categorical behavior.
When it comes to mainstream Polish words regarding the age category, only casual and
family situations were significant: casual (χ2 = 52.124 at df =9, p<.001), and family (χ2 = 35.333
at df=9, p<.001).
Table 5.12. Token distribution for age in casual situation for general Polish words.
AGE CASUAL / USUALLY
CASUAL / SOMETIMES
CASUAL / HUMOROUSLY
CASUAL / NOT USE
% N % N % N % N 18-30 59% 1041 36% 627 2% 41 3% 53 31-45 52% 587 43% 487 2% 20 2% 27 46-60 61% 883 32% 461 4% 59 2% 35 60 61% 583 33% 318 3% 32 3% 24 Total 59% 3094 36% 1893 3% 152 3% 139

184
Most of the tokens are in the usually and sometimes categories. It seems that the rate of
usually is nearly the same for all age groups, although 31 to 45 year olds had a somewhat lower
score of 52%. On the other hand, the same group had a slightly higher score for the sometimes
category. What is really interesting is that the humorously group received any scores at all, and
there were some answers denying using general Polish words in casual situations. Moreover, this
time there were almost twice as many usually responses than sometimes, indicating a slightly
different perception of those two frequency categories. It seems that usually was more
appropriate in the perception of the respondents.
In family situations, for mainstream Polish words, the distribution is presented in Table
5.13.
Table 5.13. Token distribution for age in family situation for general Polish words.
AGE FAMILY / USUALLY
FAMILY / SOMETIMES
FAMILY / HUMOROUSLY
FAMILY / NOT USE
% N % N % N % N 18-30 59% 1046 35% 613 2% 44 3% 59 31-45 52% 583 43% 487 2% 21 3% 30 46-60 60% 866 34% 487 3% 42 3% 43 60 61% 584 34% 326 2% 23 3% 24 Total 58% 3079 36% 1913 2% 130 3% 156
The pattern in which the percentages are distributed is nearly the same as for the casual
situation. We can see that 31 to 45 year olds had the lowest percentage for the usually frequency
and the highest for sometimes. It seems that for general Polish words the oldest generation
perceived using it the most in a usually manner, while for Poznań words it was the youngest

185
group. With the sometimes rate for mainstream Polish words, it was the 31 to 45 year olds who
perceived using it the most in family situations, while for Poznań words it was the 46 to 60 year
olds. Again, the differences in percentages between the age groups are small. Therefore the
trends discussed above should be treated as continuous behaviors.
5.2.2.2. GENDER
The statistical test for Poznań words for gender was only significant for formal situations
(χ2 = 137.619 at df=3, p<.001). The pattern for females seems to be that they perceived
themselves as using the Poznań words slightly more usually in formal situations, but not as much
sometimes or as humor.
Table 5.14. Token distribution for gender in formal situation for Poznań words.
GENDER FORMAL / USUALLY
FORMAL / SOMETIMES
FORMAL / HUMOROUSLY
FORMAL / NOT USE
% N % N % N % N FEMALE 22% 559 17% 446 14% 364 47% 1203 MALE 21% 407 25% 486 22% 438 32% 617 Total 21% 966 21% 932 18% 802 40% 1820
Male respondents indicated using Poznań words more often than females sometimes and
as humor, but not usually. Overall, it is intriguing that first of all, only formal situations were
significant, and that within them it was the female respondents who reported using Poznań words
with the highest type of frequency of usually. Interestingly, in all other frequencies of use the
situation is opposite. At the same time, males are less likely not to use Poznań words. Moreover,
when Question 1 was concerned, it was males who used slightly more Poznań words than

186
females. Therefore out of the subsample of people reporting the usage of Poznań words, it seems
that in formal situations it was females who used it slightly more if usually and sometimes were
combined, but not if we look at the percentages for I do not use it, in which they reported it 47%
of the times and males 32%.
For general Polish words in regard to gender, the formal situation was also the only one
significant (χ2 = 32.222 at df=3, p<.001). The results are presented in Table 5.15.
Table 5.15. Token distribution for gender in formal situation for general Polish words.
GENDER FORMAL / USUALLY
FORMAL / SOMETIMES
FORMAL / HUMOROUSLY
FORMAL / NOT USE
% N % N % N % N FEMALE 72% 2298 19% 614 2% 65 7% 216 MALE 68% 1426 25% 512 3% 54 4% 93 Total 71% 3724 21% 1126 2% 119 6% 309
Just as was seen in the age category, the distribution between the columns changes
tremendously when we move from Poznań words to general Polish words. Here, most of the
tokens are contained in the usually and sometimes groups. Once again, the usually percentage
score is over three times bigger than sometimes, which may indicate that speakers had a different
perception for those two frequency types when it came to general Polish words. Although the
discrepancy between the percentages between the two genders is small, the tendency for females
seems to be that they perceived themselves as using Poznań and general Polish words usually in
formal situations more than males; while males perceived themselves as more frequent users of
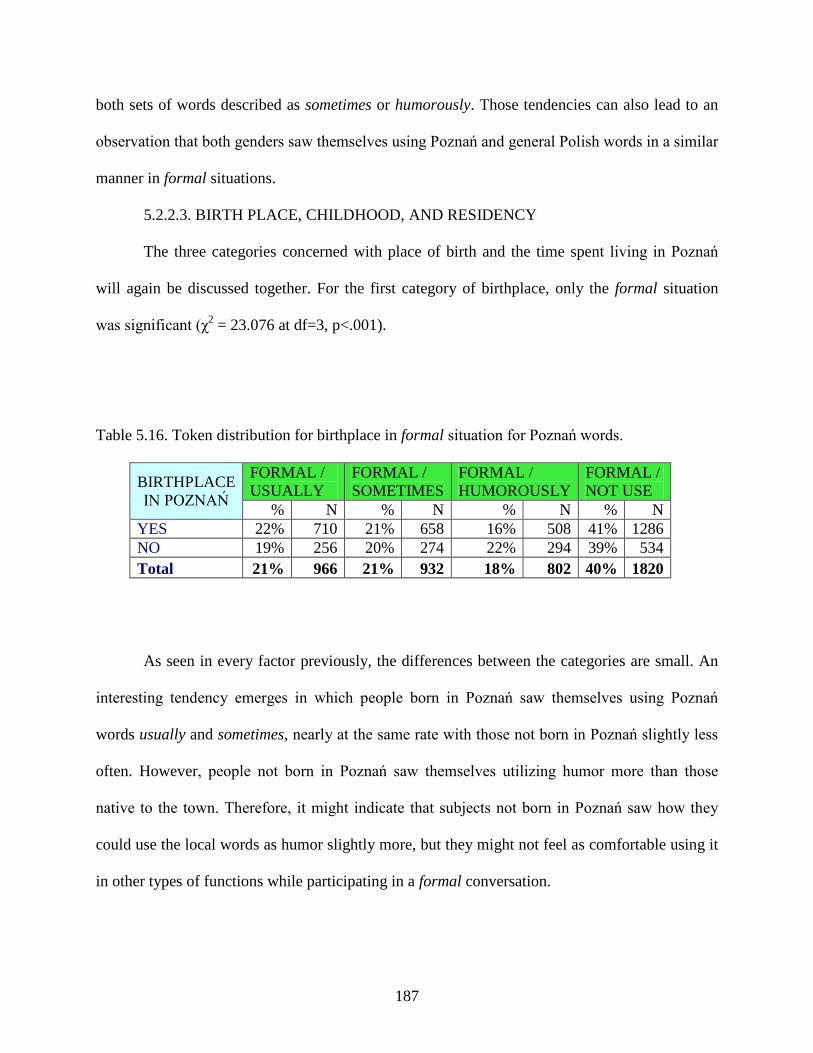
187
both sets of words described as sometimes or humorously. Those tendencies can also lead to an
observation that both genders saw themselves using Poznań and general Polish words in a similar
manner in formal situations.
5.2.2.3. BIRTH PLACE, CHILDHOOD, AND RESIDENCY
The three categories concerned with place of birth and the time spent living in Poznań
will again be discussed together. For the first category of birthplace, only the formal situation
was significant (χ2 = 23.076 at df=3, p<.001).
Table 5.16. Token distribution for birthplace in formal situation for Poznań words.
BIRTHPLACE IN POZNAŃ
FORMAL / USUALLY
FORMAL / SOMETIMES
FORMAL / HUMOROUSLY
FORMAL / NOT USE
% N % N % N % N YES 22% 710 21% 658 16% 508 41% 1286 NO 19% 256 20% 274 22% 294 39% 534 Total 21% 966 21% 932 18% 802 40% 1820
As seen in every factor previously, the differences between the categories are small. An
interesting tendency emerges in which people born in Poznań saw themselves using Poznań
words usually and sometimes, nearly at the same rate with those not born in Poznań slightly less
often. However, people not born in Poznań saw themselves utilizing humor more than those
native to the town. Therefore, it might indicate that subjects not born in Poznań saw how they
could use the local words as humor slightly more, but they might not feel as comfortable using it
in other types of functions while participating in a formal conversation.

188
The next category connected with where the subjects spent their lives was a question
about childhood. The respondents indicated whether they spent their childhoods up to and around
puberty in Poznań or not. Formal and casual situations were significant: formal (χ2 = 36.102 at
df=3, p<.001), casual (χ2 = 16.608 at df=3, p<.001). The distribution for both situations for
Poznań words is presented in Table 5.17.
Table 5.17. Token distribution for childhood in Poznań in formal and casual situations for
Poznań words.
CHILDHOOD IN POZNAŃ
FORMAL / USUALLY
FORMAL / SOMETIMES
FORMAL / HUMOROUSLY
FORMAL / NOT USE
% N % N % N % N YES 23% 770 22% 732 16% 555 39% 1327 NO 17% 196 18% 200 22% 247 43% 493 Total 21% 966 21% 932 18% 802 40% 1820
CHILDHOOD IN POZNAŃ
CASUAL / USUALLY
CASUAL / SOMETIMES
CASUAL / HUMOROUSLY
CASUAL / NOT USE
% N % N % N % N YES 37% 1261 32% 1086 28% 943 3% 113 NO 31% 357 34% 385 32% 366 2% 28 Total 36% 1618 33% 1471 29% 1309 3% 141
The distribution of the tokens for formal situations looks similar to the distribution of
tokens when birthplace was considered. Here also those informants not brought up in Poznań
saw themselves using it less usually or sometimes than those who spent their childhood in
Poznań but more as humor. On the other hand, in casual situations those who said No to this
question reported using it more sometimes and humorously than those individuals brought up in
Poznań. Although differences were small, such a tendency may indicate that those subjects born

189
and up brought in Poznań saw themselves using local words more often with usually or
sometimes rates than others, while the speakers who did not spent their childhoods in Poznań felt
more inclined to use these words as humor in formal and casual situations.
The last demographic factor in this group had to do with the length of the subject’s
residency in Poznań. The chi-squared test statistic revealed that formal, casual, and family
situations were significant: formal (χ2 = 36.028 at df=12, p<.001), casual (χ2 = 67.367 at df=12,
p<.001), and family (χ2 = 53.972 at df=12, p<.001).

190
Table 5.18. Token distribution for residency in Poznań in formal, casual and family situation for
Poznań words.
RESIDENCY IN POZNAŃ
FORMAL / USUALLY
FORMAL / SOMETIMES
FORMAL / HUMOROUSLY
FORMAL / NOT USE
% N % N % N % N LESS THAN 2 YEARS 23% 32 25% 34 19% 26 33% 46 2-5 YEARS 19% 27 16% 22 19% 27 46% 65 5-15 YEARS 21% 120 19% 113 17% 99 43% 253 ABOVE 15 YEARS 17% 196 21% 244 21% 244 40% 458 ALL LIFE 24% 591 21% 519 16% 406 40% 998 Total 21% 966 21% 932 18% 802 40% 1820
RESIDENCY IN POZNAŃ
CASUAL / USUALLY
CASUAL / SOMETIMES
CASUAL / HUMOROUSLY
CASUAL / NOT USE
% N % N % N % N LESS THAN 2 YEARS 33% 46 39% 54 25% 35 2% 3 2-5 YEARS 33% 47 38% 53 28% 39 1% 2 5-15 YEARS 41% 241 31% 182 24% 141 4% 21 ABOVE 15 YEARS 28% 319 34% 391 35% 407 3% 31 ALL LIFE 38% 965 31% 791 27% 687 3% 84 Total 36% 1618 32% 1471 29% 1309 3% 141
RESIDENCY IN POZNAŃ
FAMILY / USUALLY
FAMILY / SOMETIMES
FAMILY / HUMOROUSLY
FAMILY / NOT USE
% N % N % N % N LESS THAN 2 YEARS 45% 62 32% 44 22% 30 1% 1 2-5 YEARS 38% 53 35% 49 25% 35 3% 4 5-15 YEARS 41% 241 35% 207 20% 118 3% 19 ABOVE 15 YEARS 31% 351 37% 421 29% 337 3% 38 ALL LIFE 40% 1020 35% 873 23% 581 2% 47 Total 38% 1727 35% 1594 24% 1101 2% 109
Overall, the average values for each group were similar to what we have seen before,
where in formal situations about 40% of tokens belong to I do not use it category, which in turn
casual and family situations drop down to below 5%. The overall averages for casual and family
situations were again very similar to each other. All differences between the cells in the form of

191
percentages were small, and none of the frequency categories seem to be displaying a neat
increase or decrease in value in relation to the length of the residency. We cannot describe the
distribution in which the longer you live in Poznań the values go down or up. The group which
led in the report of using Poznań words as humor was made up of participants who had lived in
Poznań for more than fifteen years: they had the highest percentage for humorously in each
social situation out of all the residency groups. The rate of usually received a peculiar
distribution, because the group having the highest percentage in each situation was different. In
formal it was the life long residents, in casual those individuals living five to fifteen years in
Poznań, and in family conversations it was the informants who had lived less than two years in
Poznań. The latter group also received the highest scores for formal and casual situations when
they reported using Poznań words sometimes. In conversations with family, it was those subjects
with greater than fifteen years of residency who took the lead for the sometimes rate. All of the
aforementioned groups led in their reports in a particular category, however we have to keep in
mind that the other groups were not far away with their scores.
Now turning to the general Polish words set, we can see that for the birthplace category
only the family situation was significant (χ2 = 18.753 at df=3, p<.001).
Table 5.19. Token distribution for birthplace in family situation for general Polish words.
BIRTHPLACE IN POZNAŃ
FAMILY / USUALLY
FAMILY / SOMETIMES
FAMILY / HUMOROUSLY
FAMILY / NOT USE
% N % N % N % N YES 56% 1948 38% 82 2% 112 3% 3457 NO 62% 1131 33% 48 3% 44 2% 1821 Total 58% 3079 36% 130 2% 156 3% 5278

192
A tendency emerges in which people not born in Poznań claimed to use mainstream
Polish words slightly more than the other group with usually frequency. This observation is in
opposition to native-born Poznanians perceiving themselves using general Polish words
sometimes more than the other group. When the childhood category is concerned, for mainstream
Polish words only the formal situation was significant (χ2 = 16.461 at df=3, p<.001).
Table 5.20. Token distribution for childhood in Poznań in formal situation for general Polish
words.
CHILDHOOD IN POZNAŃ
FORMAL / USUALLY
FORMAL / SOMETIMES
FORMAL / HUMOROUSLY
FORMAL/ NOT USE
% N % N % N % N YES 69% 2566 23% 843 2% 80 6% 226 NO 74% 1158 18% 283 2% 39 5% 83 Total 71% 3724 21% 1126 2% 119 6% 309
The pattern for general Polish words is different than the respective distribution for
Poznań words in formal situations. Here, subjects who did not spend their childhoods in Poznań
perceived themselves using more mainstream words than the other group with the rate usually.
They claimed not using general Polish words less than those brought up in Poznań. The situation
is reversed for people who spent their childhood years in Poznań. They reported using
mainstream Polish words more than the other group in two categories: usually and sometimes. If
we compare their distributions for Poznań words, we can see that those participants brought up in
Poznań used both sets of words sometimes more than the other group.

193
The last category connected with living in Poznań for general Polish words is the
residency factor. Casual (χ2 = 41.239 at df=12, p<.001) and family (χ2 = 39.288 at df=12,
p<.001) situations were significant.
Table 5.21. Token distribution for residency in Poznań in casual and family situation for general
Polish words.
RESIDENCY IN POZNAŃ
CASUAL / USUALLY
CASUAL / SOMETIMES
CASUAL / HUMOROUSLY
CASUAL / NOT USE
% N % N % N % N LESS THAN 2 YEARS 69% 121 27% 48 3% 6 1% 1 2-5 YEARS 69% 142 26% 54 3% 6 2% 5 5-15 YEARS 60% 460 36% 280 2% 16 2% 15 ABOVE 15 YEARS 61% 854 34% 476 3% 41 2% 26 ALL LIFE 56% 1517 38% 1035 3% 83 3% 92 Total 59% 3094 36% 1893 3% 152 3% 139
RESIDENCY IN POZNAŃ
FAMILY / USUALLY
FAMILY / SOMETIMES
FAMILY / HUMOROUSLY
FAMILY / NOT USE
% N % N % N % N LESS THAN 2 YEARS 64% 113 31% 55 3% 6 1% 2 2-5 YEARS 69% 142 26% 53 2% 5 3% 7 5-15 YEARS 60% 463 36% 276 2% 14 2% 18 ABOVE 15 YEARS 61% 856 34% 471 2% 32 3% 38 ALL LIFE 55% 1505 39% 1058 3% 73 3% 91 Total 58% 3079 36% 1913 2% 130 3% 156
Overall, the distribution between the two situations is very similar. Once again, when
general Polish was concerned the humorously category was not perceived as appropriate,
although low (3%) frequency occurred. The two groups of speakers who lived in Poznań the

194
shortest led in the report of using the general Polish words the most in both situations for the
usually rate. However, for Poznań words it was five to fifteen year residents in the casual
situation, and in family conversations it was those living less than two years in Poznań who made
the biggest marks. The latter group also received the highest scores for formal and casual
situations when they reported using Poznań words sometimes. For general Polish words it is the
life long residents who had the highest scores. For both sets of words in family and casual
situations the differences are small, following the nature of perception as a continuous behavior.
5.2.2.4. CITY DIVISIONS
When the respondents gave a positive answer to the birthplace and childhood questions,
they were asked in which of the five main city parts they spent their childhood years. This is the
last piece of demographic information provided by the informants. When test statistics were run
for the set of Poznań words, the following social situations were significant: formal (χ2 = 49.351
at df=12, p<.001), casual (χ2 = 46.223 at df=12, p<.001), and family (χ2 = 52.381 at df=12,
p<.001). Distributions for all three social distributions are presented in Table 5.22.

195
Table 5.22. Token distribution for childhood in city divisions in formal, casual and family
situations for Poznań words.
POZNAŃ CITY DIVISIONS
FORMAL / USUALLY
FORMAL / SOMETIMES
FORMAL / HUMOROUSLY
FORMAL / NOT USE
% N % N % N % N STARE MIASTO 23% 183 24% 193 18% 144 36% 289 NOWE MIASTO 25% 117 27% 125 14% 66 33% 154 JEZYCE 24% 142 23% 137 15% 88 38% 223 GRUNWALD 23% 226 18% 177 18% 177 40% 393 WILDA 19% 102 18% 100 15% 80 49% 268 Total 23% 770 22% 732 16% 555 39% 1327
POZNAŃ CITY DIVISIONS
CASUAL / USUALLY
CASUAL / SOMETIMES
CASUAL / HUMOROUSLY
CASUAL / NOT USE
% N % N % N % N STARE MIASTO 40% 326 31% 251 26% 210 3% 25 NOWE MIASTO 44% 202 34% 157 22% 100 1% 4 JEZYCE 38% 229 29% 173 29% 173 3% 20 GRUNWALD 34% 337 33% 324 28% 276 4% 44 WILDA 30% 167 33% 181 33% 184 4% 20 Total 37% 1261 32% 1086 28% 943 3% 113
POZNAŃ CITY DIVISIONS
FAMILY / USUALLY
FAMILY / SOMETIMES
FAMILY / HUMOROUSLY
FAMILY / NOT USE
% N % N % N % N STARE MIASTO 43% 350 34% 277 20% 165 2% 16 NOWE MIASTO 44% 203 35% 162 20% 92 1% 6 JEZYCE 41% 242 31% 182 27% 158 2% 12 GRUNWALD 36% 350 38% 368 23% 223 4% 39 WILDA 33% 184 37% 205 28% 157 1% 6 Total 39% 1329 35% 1194 23% 795 2% 79
When we look at the overall averages, once more the distribution of tokens between the
social situations and categories of use is aligned in a manner seen before. In formal situations
almost 40% of the tokens were perceived as not being used by the respondents, while in casual
and family situations the not use category dropped down to single digits. This trend seen in all
the previous factor groups may indicate that the respondents had a stronger sense of

196
appropriateness for Poznań words in casual and family situations and a weaker one for formal
situations. Now if we look at each column category, we can see that the differences between the
city divisions are small in each frequency group. For usually, in all social categories, respondents
who spent their childhoods in Nowe Miasto led in the report of using Poznań words. The same is
true for this group and the sometimes rate in formal and casual situations. In family situations the
new leader is a group of respondents who indicated Grunwald and Wilda. An intriguing tendency
emerges for childhood residents of Wilda. It seems that they do share a perception about how
and when to use Poznań words. First off, they have the lowest scores for the usually rate across
all situations. Secondly, they lead in the perception for humorously in the casual and family
situations but not in the formal setting. In the formal setting they have low or the lowest scores
for all three categories of use and the highest percentage for the not use column. Therefore, it
seems that they might have perceived themselves using Poznań words as humor in casual and
family situations, but the formal setting was not reported as the best choice for them. However, it
needs to be noted that those groups leading in the report of using Poznań words have the others
following them closely, as the differences in percentages are small.
For general Polish words the only social situation significant for the city divisions factor
was formal (χ2 = 37.050 at df=12, p<.001).
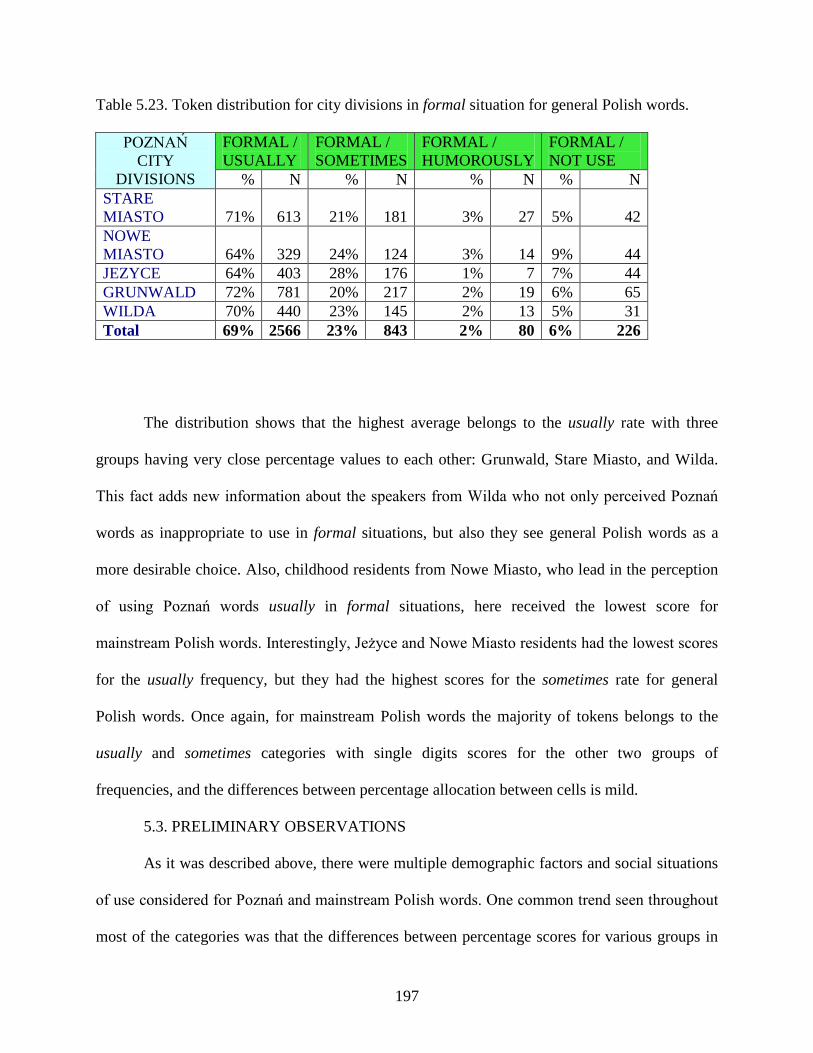
197
Table 5.23. Token distribution for city divisions in formal situation for general Polish words.
POZNAŃ CITY
DIVISIONS
FORMAL / USUALLY
FORMAL / SOMETIMES
FORMAL / HUMOROUSLY
FORMAL / NOT USE
% N % N % N % N STARE MIASTO 71% 613 21% 181 3% 27 5% 42 NOWE MIASTO 64% 329 24% 124 3% 14 9% 44 JEZYCE 64% 403 28% 176 1% 7 7% 44 GRUNWALD 72% 781 20% 217 2% 19 6% 65 WILDA 70% 440 23% 145 2% 13 5% 31 Total 69% 2566 23% 843 2% 80 6% 226
The distribution shows that the highest average belongs to the usually rate with three
groups having very close percentage values to each other: Grunwald, Stare Miasto, and Wilda.
This fact adds new information about the speakers from Wilda who not only perceived Poznań
words as inappropriate to use in formal situations, but also they see general Polish words as a
more desirable choice. Also, childhood residents from Nowe Miasto, who lead in the perception
of using Poznań words usually in formal situations, here received the lowest score for
mainstream Polish words. Interestingly, Jeżyce and Nowe Miasto residents had the lowest scores
for the usually frequency, but they had the highest scores for the sometimes rate for general
Polish words. Once again, for mainstream Polish words the majority of tokens belongs to the
usually and sometimes categories with single digits scores for the other two groups of
frequencies, and the differences between percentage allocation between cells is mild.
5.3. PRELIMINARY OBSERVATIONS
As it was described above, there were multiple demographic factors and social situations
of use considered for Poznań and mainstream Polish words. One common trend seen throughout
most of the categories was that the differences between percentage scores for various groups in

198
the respective factors were not big; they usually oscillated around no more than 20%. Such a
distribution was expected under the provisions of linguistics of speech, which asserts that speech
as a behavior and all its features is a continuum with gradual changes. Moreover, what was
common across the social situations was that the frequency categories of usually and sometimes
oftentimes received scores similar to humorously. Those two groups of categories are in some
ways similar to each other in nature, and in some ways different. We can look at humorously as
possessing a qualitative nature to be used as a judgment. On the other hand, we can look at this
category as possessing a quantitative nature in the sense that a word used as humor is used less
frequently than usually or sometimes.
When it comes to age and social situations it seems that the youngest group of speakers
had a perception of themselves in which they use Poznań words the most with the usually rate in
formal and casual situations, and the same rate was high for them in casual and family situations
for general Polish words. Moreover, in the casual situation for Poznań words it seems that not
only was it more preferred for them to use the words usually, but at the same time it was more
likely for them to not use them as humor.
In formal situations, for local words it is the 31 to 45 year olds who perceived themselves
using them the most with the sometimes rate. They also scored second in the humorously
category in formal situations for Poznań words. This group showed the same pattern for casual
situations as the youngest group, in which they perceived that the usually usage is more
appropriate than humor. For general Polish words, this group sees itself using those words
sometimes very often in family situations. Moreover, in both casual and family situations, they
had a very low score for the usually rate.

199
The next older group of 46 to 60 year olds leads in the perception of not using Poznań
words in formal situations. However, the opposite trend is true for them in casual settings, since
they declared using local words as humor the most. In family situations this group has increased
scores for usually and sometimes, and thus lowering the percentage of humorously. The oldest
group in formal situations sees themselves using Poznań words the most as humor. Moreover, in
casual situations the score for humor was lower for this group. It seems that for general Polish
words the oldest generation perceived using it the most with a usually rate.
When it comes to gender, it seems that females reported themselves as using Poznań and
general Polish words usually in formal situations more than males; while males perceived
themselves as more frequent users of both sets of words described as sometimes or humorously.
Those patterns may indicate that both genders reported using Poznań and general Polish words in
a similar manner in formal situations.
The next category had to do with birthplace in Poznań. For local words in formal
situations, people not born in Poznań saw themselves using humor more than those native to the
town. At the same time, they claimed to use mainstream Polish words more than the other group
with usually frequency. Therefore, it might indicate that subjects not born in Poznań saw how
they could use Poznań words as humor, but they might not have felt comfortable using them in
other types of functions while participating in formal conversations, and that is when they chose
mainstream Polish words.
When the category of spending childhood in Poznań was concerned, it turned out that
those not brought up in Poznań saw themselves using Poznań words less usually or sometimes
than those who spent their childhoods in Poznań, but more as humor in formal situations. On the
other hand, in casual situations the relationship was reversed. Such a pattern may indicate that

200
those individuals born and brought up in Poznań saw themselves using local words more often
with usually or sometimes rate than the other group. For general Polish words in formal
situations, subjects who did not spend their childhoods in Poznań perceived themselves using
more mainstream words than the other group with the rate usually.
In the residency category in conversations with family, it is those subjects above 15 years
of residency who took the lead for the sometimes rate. They also reported using Poznań words as
humor the most out of all groups. For general Polish words, the two groups of speakers who
lived in Poznań the shortest led in the perception of using the most usually rates in family and
casual situations. However, for Poznań words in casual situations it was the five to 15 years
residents, and in family conversations it was those living less than two years in Poznań, who
made the biggest mark. The latter group also received the highest scores for formal and casual
situations when they reported using Poznań words sometimes, while for general Polish words it
was the lifelong residents who had the highest scores.
The last demographic category covered the issue of in which part of the city the
respondents spent their childhoods. It seems that two parts of the city played the biggest role in
the distribution of tokens for this category in both sets of words. The first one was Wilda. The
childhood residents of that part of the city shared a perception about how and when to use
Poznań words: that was not with the usually rate in any situations, but humorously in the casual
and family situations only. In the formal setting they had the highest percentage in the not use
column. Therefore, it seems that they might have perceived themselves using Poznań words as
humor in casual and family situations, but in the formal setting it was not reported as the best
choice for them. Adding to that picture is the fact that they also tend to see general Polish words
as a more desirable choice for formal situations. The second city division is Nowe Miasto; here

201
the childhood residents are the leaders in the perception of using Poznań words across all social
situations with the usually frequency. At the same time, they received low scores for this
frequency for general Polish words, indicating that they saw themselves using Poznań words
more than mainstream Polish.
This chapter concludes the discussion of perceptual tools used and gives way to the other
side of the study, namely speech production. Analysis of linguistic interviews will be presented
next, in Chapter 6.

202
CHAPTER 6
LINGUISTIC INTERVIEW – RESULTS
This chapter presents results from the last task presented to the respondents, namely the
linguistic interview. This section adds more details regarding the methodological solutions used
in the research while providing explanations of the outcomes.
6.1. SUBJECTS AND METHODOLOGICAL NOTES
Chapter 3 gave a brief description of the subjects used in the interviews (section 3.2.4.2).
Below, Table 6.1 replicates the subjects’ descriptions that were provided in Table 3.8.
Table 6.1. Interview Informant’s demographic information.
Informant ID Age Gender Education Occupation Native resident Yes/No
F1 27 Female Higher Administrative assistant
Yes
F2 32 Female Higher Executive Yes F3 54 Female High school Accountant Yes F4 55 Female Higher Lawyer Yes F5 60 Female High school Housewife Yes M1 27 Male Higher IT Specialist No M2 30 Male Higher Store Manager Yes M3 62 Male Higher Theater
Director Yes

203
As we can see, the female group is bigger. Informant F1 is native to Poznań.1
1 All of the description is based on the information given by the informants during the interview.
She was
born, raised, and lived there all her life. Except for living in Ireland for a year when she was 25,
she has not left the city or her community throughout her life. She lives in the same house that
she was born in. She received higher education but does not work in her specialty; instead she
works as an administrative assistant in an accountant firm. Her mother is Informant F3,who was
born just outside the city limits but moved into her present home when she was a little girl and
lived all her life in it. She attempted to get her higher education but never graduated, and for over
fifteen years she has worked as an accountant. Again, except for a few holiday trips and a move
to Bydgoszcz for a few years when she got married, she has been living in the same place with
her three-generation family. Informant F2 has moved several times throughout her life, but it has
always been within a few-mile radius of the city. Her parents and husband are also native to
Poznań. She got her higher education in business, and now she is the executive at her family’s
business, a printing house. Informant F4 is native to Poznań. She lives in her childhood
neighborhood and changed her profession from a judge to a defense attorney. The change was
not an easy choice for her, but political pressures during the communist regime did not allow her
to perform her duties in the manner she wanted to, so she decided to become a defense attorney.
During the communist era as a judge, she opposed the influence from the government and
provided fair trials for some of the Solidarity members, for which she was recognized by the
United States, and she was made an honorary citizen of Atlanta. Nowadays, she enjoys her work
and bicycle rides around Poznań. Informant F5 is a native resident of Poznań, with multiple
family generations living in the city. Soon after high school she married her present husband and
never pursued higher education, choosing the occupation of a caretaker for her family instead.
Her father and grandfather were prominent figures in Poznań and contributed to many

204
innovations in the city. For example, her father designed and supervised the construction of an
artificial lake, Lake Malta, in the city, the cradle for artistic and athletic venues in Poznań, with
theatric festivals, concerts, international rowing competitions, an artificial skiing slope, and a
year-round bobsledding track. She is very proud of her family’s history and seems to be the
keeper of the family stories, which she was willing to share in abundance. The entire group is
deeply interested and excited about the life of their community and is happy to be living there.
All of the women, when asked if they would like to live somewhere else, energetically refused
and boasted about Poznań’s best attractions. For the group of men, this situation was similar, but
there was one informant who was not quite as thrilled to be living in the city.
There were three male subjects, two born and raised in Poznań and one who moved to the
city eight years prior to get his higher education. Informant M2 was born and raised in Poznań
and is now working as a store manager. Although he has fond memories of the city and takes
advantage of the cultural scene offered by Poznań, he has become bored with life in this
community and is ready to move to another big city in Poland and explore what Poznań does not
provide for him anymore. He is the only one out of the whole sample who perceives the city as
boring and claims that he has done it all and seen it all, and there is nothing with which Poznań
can surprise him. Informant M1 expresses the exact opposite attitude. He moved to Poznań from
a small town and has been in love with the city ever since. He admits that he considers Poznań to
be his home now. Since he graduated, he has been is working in a marketing company exploring
the issue of eye tracking in website design. This company is one of a handful of its kind in the
country. He considers himself lucky to have this job, to be getting married to a wonderful Poznań
girl, and to have the exciting prospect of spending the rest of his life in this city. In the interview,
he not only shared his childhood memories connected with his hometown, but he also repeatedly

205
named things he likes about the city. He described the multiple activities that it offers, which he
would like to try one day. Informant M3 is a native resident whose family has lived for
generations in the city. His mom lives in the same apartment building in which she was born. He
is the director of a theatre in Gniezno, which is about twenty miles away from Poznań,
commuting to work. His journey with the theatre started in elementary school; however, what he
is mostly known for in the Poznań community is the fact that he was one of the cofounders of
Teatr Ósmego Dnia ‘Theatre of the Eighth Day’. This theatre, established in the 1970s, was very
progressive and maneuvering in the communist era to show plays not within the canon of the
Communist Party. Nowadays, still considered one of the best theatres in the city, the troupe has
stayed true to its progressiveness, but the informant is not connected with it anymore. Since his
family has lived in the city for generations, he shared a lot of stories in which his ancestors took
part in historical events in the city. Throughout the whole interview his fascination with the city
and its speech is clearly visible, and he praises himself as an expert on Poznań speech. He even
offers short monologues in the Poznań dialect. As it turned out, the group of men, although
smaller in numbers, is no less variable than the women. Just as the women did, the men exhibited
their knowledge about the city and their connections to it. All subjects expressed their ideas and
opinions not only about living in Poznań, but about their lives in general. They were able to do
that because the interview was designed to create a venue for them to talk in volume. The exact
protocol is provided in the Appendix F, but here a more general description of the flow of the
questions is described.
After collecting demographic information such as age, education, occupation, and
residency, subjects were asked about their favorite ways of spending free time, as well as their
hobbies. This question received various answers. Some of the informants spent a lot of time

206
describing what they loved to do, such as gardening, sailing, cooking, hiking, and almost
unanimously reading books. Once that topic was exhausted I asked them to tell me what was the
latest news in Poland. The two main topics were sports and politics. Sports were a popular topic
because the Polish national soccer team was in the European Championship in 2008, for the first
time in about 30 years. Depending on the time of the interview, the reactions were different:
before the game and after, when it was obvious that we were going home. Politics was a hot
topic since that year a new prime minister from the opposition was elected, bringing to an end
the rule of the twin Kaczyński brothers (one as the president and the other as the prime minister).
After that, we moved on to childhood memories. Here the scope of answers varied; some
subjects talked a long time about their families and funny stories from childhood, others focused
on family traditions or school. Within this topic, I asked informants about their traditional family
dishes for Christmas and Easter, or other special occasions. The last part was concerned with the
local community of Poznań. If the informants did not mention anything about it before, they
were asked directly about their opinions concerning Poznań and what their experiences living in
the city were like. They were also asked if their families’ histories intertwined with the history of
the city.2
The word quiz was introduced at the end of the interview. The goal of this part was to
obtain speech material for a direct comparison with the perception results of the questionnaire. In
the perceptual questionnaire, I arrived with a little over 100 items. I chose 20 items out of those.
In the perceptual questionnaire respondents were presented with a screen giving them a
definition of the word and the word itself (see Figure 3.9). However, in the interview I gave a
After the conversational part of the interview was over, the interviewees were asked to
participate in a word quiz.
2One note should be made here that I attempted to ask all the questions established in the protocol; however, not all of them received an answer, or sometimes the length of the response varied tremendously.

207
definition of a word and did not provide any answers or context (see Appendix I). Informants
were allowed to give as many answers as they wanted, or even none at all. I only asked once if
they use any other words, and did not push for more. The detailed description of the words will
be provided in Section 6.4.
6.2. THE CORPUS
Overall, once transcribed, the interviews yielded a corpus of 80,707 words. I have
divided each interview into two parts: conversational and elicitation. The elicitation corpus
contained 10,592 words and the conversational corpus had 70,115 words.
The next task was to establish the dialect items specific for Poznań speech. After
diligently studying literature on the topic, I read through all the transcripts to look for those
lexical items. When I arrived with the list of words, I went back to the literature and looked for
confirmation of my judgment. The first source was the dialect dictionary (Gruchmanowa et al.
1999). Out of the 253 types of words that singled out for the analysis, 84 were found in this
dictionary. Therefore other sources were consulted, starting with Gruchmanowa et al. 1987 (22
words), Witaszek-Samborska et al. 1985, 1987, 1998 (58 words), and also Internet resources
such as the official Poznań website and others3
3 Following websites were consulted:
(77 words). After consulting those sources, the
number of unaccounted words went down to twelve. I decided to keep them in, since the
overwhelming majority of my judgments were confirmed in the literature. Having done this, a
list of 253 dialect words was established with 955 tokens. When added up, 55% of tokens
(N=527) were contained in the conversational part of the interview, and 45% (N=429) in the
http://www.bibliotekawszkole.pl/inne/gazetki/71/index.php http://www.poznan.pl http://www.poznanczyk.com/index.html http://www.tutej.pl/cms.php?i=8382 http://www.man.poznan.pl/~m02_001/konkurs/gwara.htm http://www.republika.pl/ulapok/gwarapoz.html http://miasta.gazeta.pl/poznan/1,36004,97846.html http://pl.wikipedia.org/wiki/Wikipedysta:Radomil/Galeria_Radomi%C5%82a_1

208
elicitation section. In the conversational corpus there was a rate of eight Poznań items per
thousand words. This means that in the conversational part you could expect a Poznań lexeme
every 125 words, which roughly translates into 2 or 3 Poznań words per standard page of
transcript. The following sections will present the results of each part separately. As is indicated
by the quantity of words in the corpus, the overwhelming majority of the interview contained the
conversational part.
6.3. CONVERSATION—RESULTS
As the previous section described, the interviews were primarily aimed at getting the
informants to speak as much as possible (as suggested in literature, for example Tagliamonte
2006, Kretzschmar 2006) . The analysis focused mainly on discussing the lexical items deemed
specific to Poznań speech, as the main research question for this tool was to check if people in
the sample were using dialect words in their conversations. The rate of dialect words per
thousand words in the conversational part, and the fact that 55% of the tokens are present in the
conversational part of the interview, indicated that people do use local words in everyday
conversation. What needs to be emphasized is that every speaker had some tokens in his or her
speech; there was no one individual who did not have any. Their rates and numbers varied, as
will be described below, but all of them uttered dialect words in casual conversation without any
pressure from the interviewer to elicit specific words.
In order to fully understand the patterns of occurrences in the sample, we need to first
look closer at the individual interviews. To do this, we will examine the distribution of words in
each interview and the list of top ranked content (lexical) words. The group described first is the
female interviewees.

209
6.3.1. FEMALE GROUP
As indicated in Kretzschmar (2009), speech falls into the A-curve distribution no matter
what aspect of speech we examine. The A-curves were presented before in Chapter 4, and it is
only appropriate here to show the distribution of the speech in the conversational part of the first
out of five female interviews, with Informant F1. Figure 6.1 presents the A-curve distribution of
all of F1’s speech in the conversational part of the interview.
Figure 6.1. A-curve distribution of Informant F1 speech.
As we can see, her speech follows the A-curve distribution. For clarity reasons, only
every 100th label is present on the graph. F1 did not have dialect words with high numbers of
tokens--the highest was 18 for the lemma fajny ‘pretty’. All other dialect words had single digit

210
frequencies. Now, if we were interested in what the most frequently used words were, which in
turn can tell us about the subjects most discussed by F1, we need to look for the top-ranked
content words. As corpus studies show, the most frequent words appearing at the top of the A-
curve are function words (Kretzschmar 2009, Baker 2006). Function words are defined as
belonging to a ”…closed grammatical class each consisting of a small number of high frequency
words (pronouns, determiners, conjunctions, prepositions), these categories tend not to be subject
to linguistic innovation” (Baker, 2006:53).
Content words, as opposed to function words, are those which belong to open categories
in speech, such as nouns, verbs, adjectives, and so on. In Table 6.2, the top 10 lemmatized nouns
are presented for Informant F1.
Table 6.2. Top ten content nouns for Informant F1.
TOP 10 CONTENT WORDS INFORMANT F1 WORD FREQUENCY
PRZYKŁAD [example] 36 POZNAŃ [Poznań] 25
ROK [year] 25 PRAWDA [truth] 24 LUDZIE [people] 13
MAMA[ mom] 13 SENS [sense] 13
DOM [home] 12 LICEUM [high school] 11
POCZĄTEK [beginning] 9

211
We can see that Informant F1 was quite often giving examples, as this lexeme ranked the
highest. Also, she talked a lot about Poznań and the passing times, using the lemma years. She
referred to more personal subjects as her mom and home, as well as to more general statements
about people. High school appeared the most frequently out of the names for each stage of her
education, since she shared the most stories about that period of her life. Informant’s F2 speech
displays the same distribution, as can be seen in Figure 6.2.
Figure 6.2. A-curve distribution of Informant F2 speech.

212
The top ranked nouns overlap partially with the previous informant, as can be seen in
Table 6.3.
Table 6.3. Top ten content words for Informant F2.
TOP 10 CONTENT WORDS INFORMANT F2 WORD FREQUENCY
POZNAŃ [Poznań] 21 ZASADA [rule] 12
LICEUM [high school] 11 MAMA [mom] 11
TATA [dad] 9 HISTORIE [stories] 8 RODZICE [parents] 8
STUDIA [the studies] 8 WIELKANOC[Easter] 8
MAZURKI[Easter cakes] 7 PRACA[work] 7
Poznań takes the lead in this interview, and the next lemma zasada ‘rule’, is a part of an
expression w zasadzie literally meaning ‘in rule’, but closer in function to ‘indeed’.4
In her
interview she discussed both high school and studying at the university. The stories she told
revolved very often around her mom, dad, and parents together. She gave a detailed description
of their Easter traditions and special caramel Easter cakes that she is a known to be the expert of
making in her family. F3 has similar top-ranked nouns, as displayed in Table 6.4.
4 This word functions like a discourse marker. Therefore, such words are not easily categorized as content or function words. For this reason an eleventh item was added to the list.
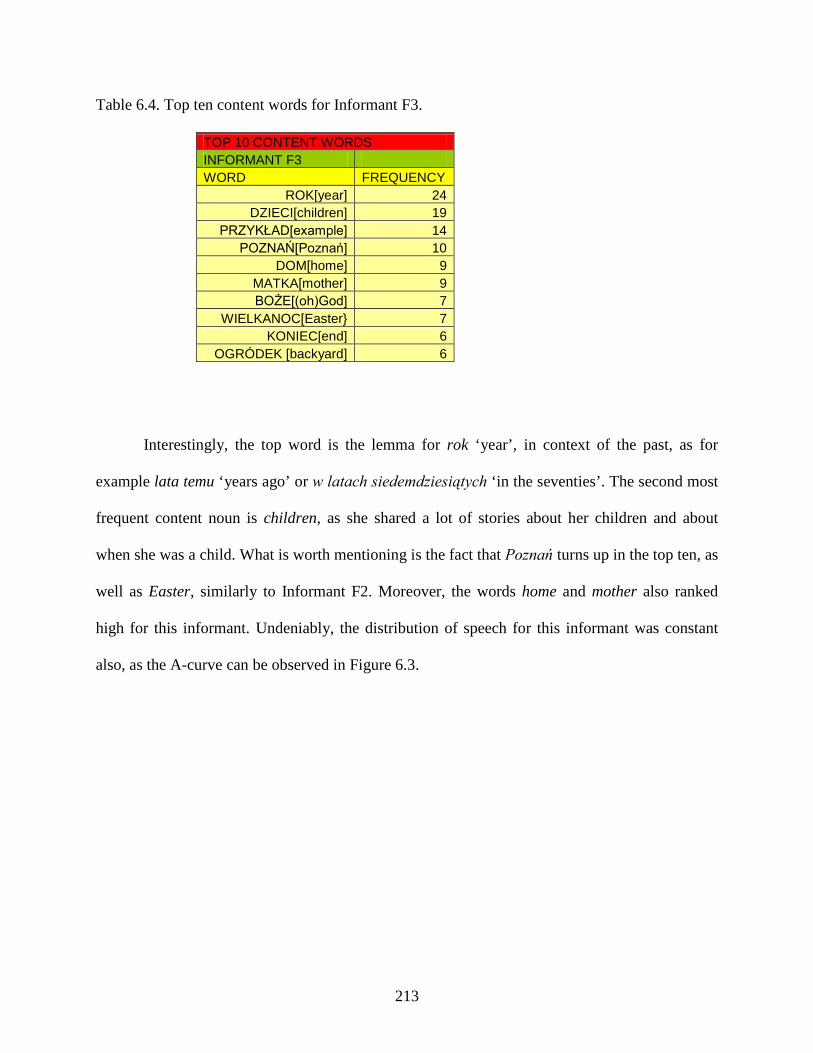
213
Table 6.4. Top ten content words for Informant F3.
TOP 10 CONTENT WORDS INFORMANT F3 WORD FREQUENCY
ROK[year] 24 DZIECI[children] 19
PRZYKŁAD[example] 14 POZNAŃ[Poznań] 10
DOM[home] 9 MATKA[mother] 9 BOŻE[(oh)God] 7
WIELKANOC[Easter} 7 KONIEC[end] 6
OGRÓDEK [backyard] 6
Interestingly, the top word is the lemma for rok ‘year’, in context of the past, as for
example lata temu ‘years ago’ or w latach siedemdziesiątych ‘in the seventies’. The second most
frequent content noun is children, as she shared a lot of stories about her children and about
when she was a child. What is worth mentioning is the fact that Poznań turns up in the top ten, as
well as Easter, similarly to Informant F2. Moreover, the words home and mother also ranked
high for this informant. Undeniably, the distribution of speech for this informant was constant
also, as the A-curve can be observed in Figure 6.3.
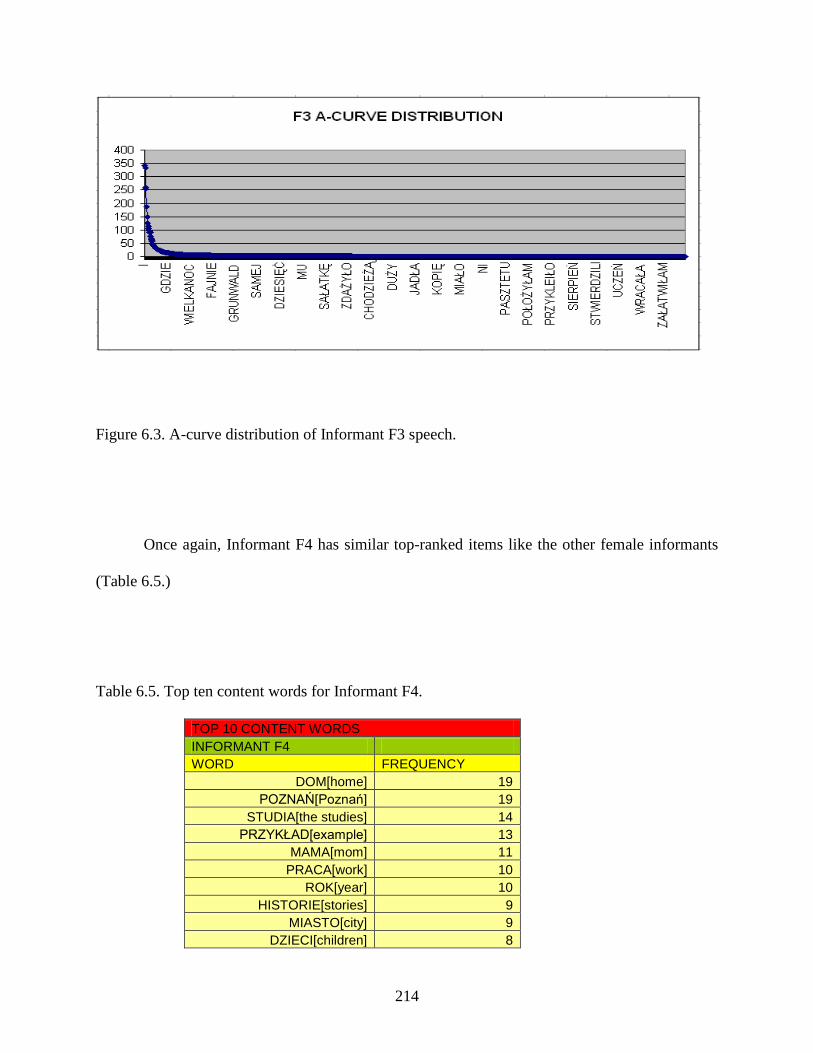
214
Figure 6.3. A-curve distribution of Informant F3 speech.
Once again, Informant F4 has similar top-ranked items like the other female informants
(Table 6.5.)
Table 6.5. Top ten content words for Informant F4.
TOP 10 CONTENT WORDS INFORMANT F4 WORD FREQUENCY
DOM[home] 19 POZNAŃ[Poznań] 19
STUDIA[the studies] 14 PRZYKŁAD[example] 13
MAMA[mom] 11 PRACA[work] 10
ROK[year] 10 HISTORIE[stories] 9
MIASTO[city] 9 DZIECI[children] 8

215
This informant has words of home and Poznań at the top of the list. Interestingly enough,
she shared a lot of stories about times she was studying, as well as her work. Both of those items
show up in the list. While sharing stories, she gave examples that were sometimes connected
with her mother. The shape of the distribution is constant, as can be seen in Figure 6.4.
Figure 6.4. A-curve distribution of Informant F4 speech.
The last female in this group, except for sharing some of the top nouns with the other
women, adds new items. Her family circle extends, as she not only has a mother, father, and
children as seen before, but she also has a grandfather (Table 6.6).
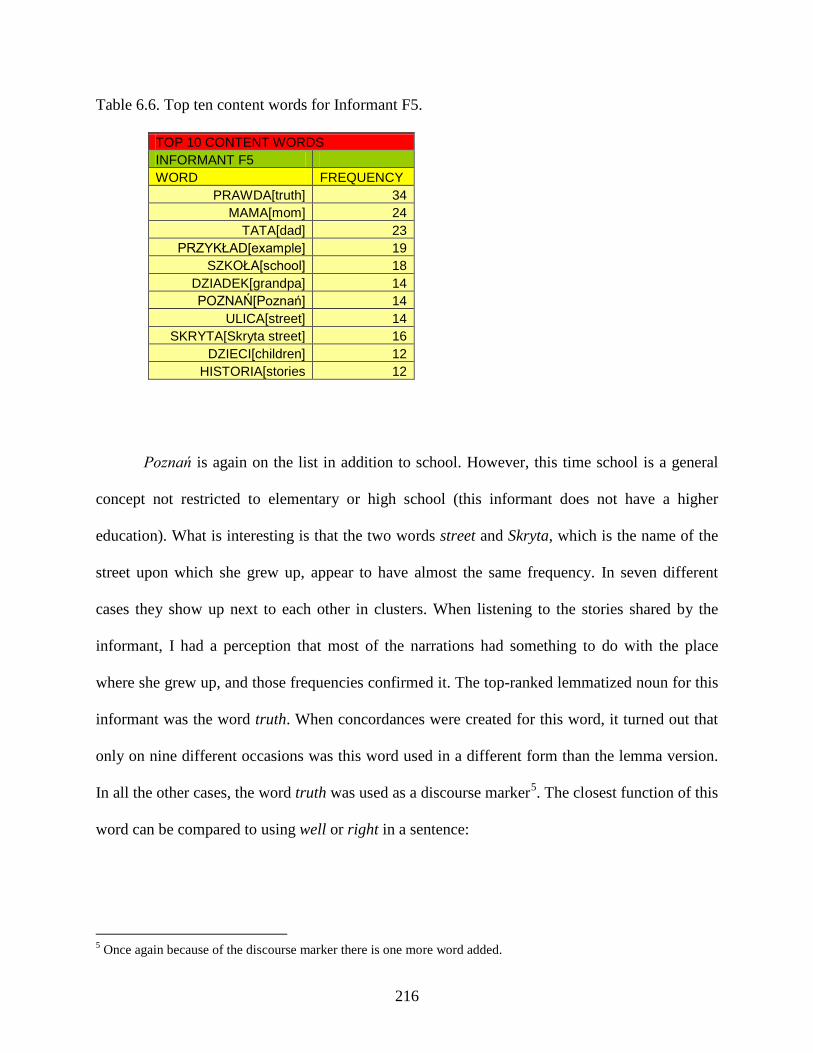
216
Table 6.6. Top ten content words for Informant F5.
TOP 10 CONTENT WORDS INFORMANT F5 WORD FREQUENCY
PRAWDA[truth] 34 MAMA[mom] 24
TATA[dad] 23 PRZYKŁAD[example] 19
SZKOŁA[school] 18 DZIADEK[grandpa] 14 POZNAŃ[Poznań] 14
ULICA[street] 14 SKRYTA[Skryta street] 16
DZIECI[children] 12 HISTORIA[stories 12
Poznań is again on the list in addition to school. However, this time school is a general
concept not restricted to elementary or high school (this informant does not have a higher
education). What is interesting is that the two words street and Skryta, which is the name of the
street upon which she grew up, appear to have almost the same frequency. In seven different
cases they show up next to each other in clusters. When listening to the stories shared by the
informant, I had a perception that most of the narrations had something to do with the place
where she grew up, and those frequencies confirmed it. The top-ranked lemmatized noun for this
informant was the word truth. When concordances were created for this word, it turned out that
only on nine different occasions was this word used in a different form than the lemma version.
In all the other cases, the word truth was used as a discourse marker5
. The closest function of this
word can be compared to using well or right in a sentence:
5 Once again because of the discourse marker there is one more word added.
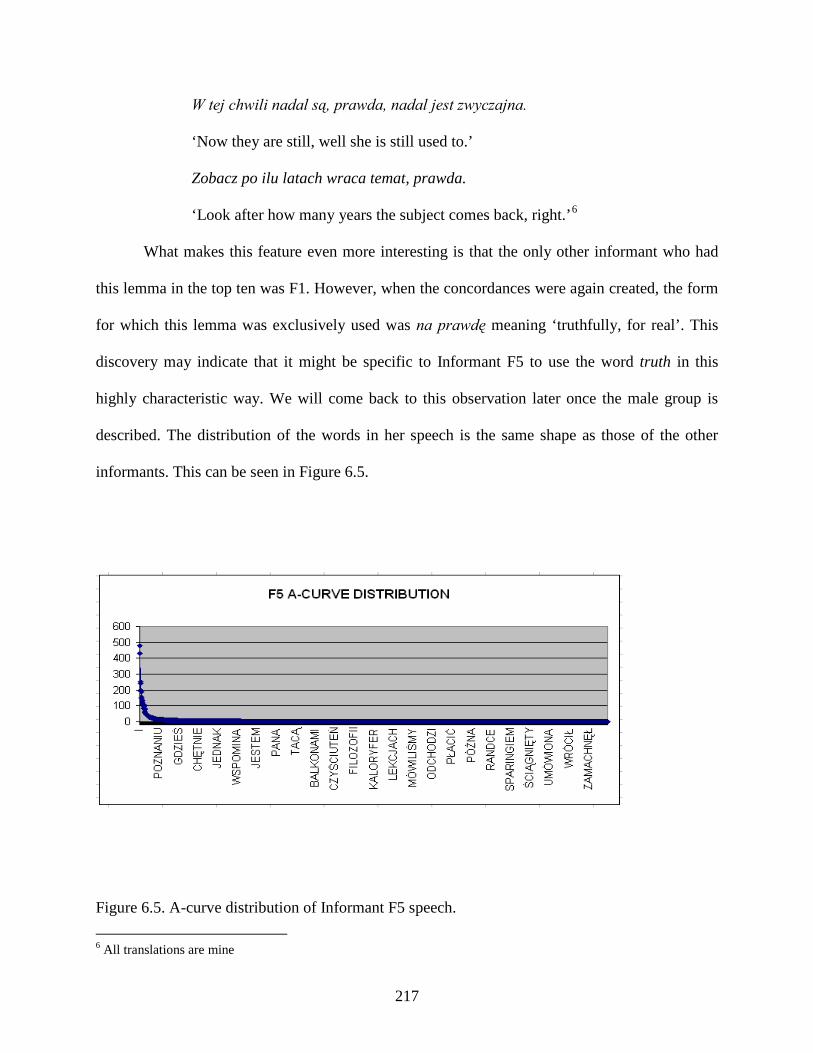
217
W tej chwili nadal są, prawda, nadal jest zwyczajna.
‘Now they are still, well she is still used to.’
Zobacz po ilu latach wraca temat, prawda.
‘Look after how many years the subject comes back, right.’6
What makes this feature even more interesting is that the only other informant who had
this lemma in the top ten was F1. However, when the concordances were again created, the form
for which this lemma was exclusively used was na prawdę meaning ‘truthfully, for real’. This
discovery may indicate that it might be specific to Informant F5 to use the word truth in this
highly characteristic way. We will come back to this observation later once the male group is
described. The distribution of the words in her speech is the same shape as those of the other
informants. This can be seen in Figure 6.5.
Figure 6.5. A-curve distribution of Informant F5 speech. 6 All translations are mine

218
As we have seen in this group of female informants, the A-curve distribution is a constant
shape of their speech, a property of speech as a complex system (Kretzschmar 2009). We have
also seen that when top ranked nouns are taken into consideration, they show us the most talked
about topics in the interview. The common ground that has emerged for the women appears to be
the stories about family, their homes, and education. Such common ground is probably the result
of the questions asked, but also indicates that informants talked about those topics. Now, the
variability of the speakers showed in the fact that although asked the same questions, top ranked
words turned out to be partially different for each speaker. Moreover, Poznań appears on
everyone’s list as an evidence of the importance of this local dome, in Gould and White’s (1986)
terms. Worth mentioning is also the fact that although there is common ground, each interviewee
is different from the other, as they have words showing up not shared with other women or have
the same terms in different frequency rankings. Let’s now investigate in what way the group of
men was similar and different from the women.
6.3.2. MALE GROUP
The group of males is smaller than the females as it consists of only three individuals. All
of the distributions for their speech are following the A-curve shape, as can be seen in Figures
6.6, 6.7, and 6.8.

219
Figure 6.6. A-curve distribution of Informant M1 speech.
Figure 6.7. A-curve distribution of Informant M2 speech.

220
Figure 6.8. A-curve distribution of Informant M3 speech.
The shape of the distribution is consistently the same under the provisions of linguistics
of speech. Even if the amount of tokens is different between the informants, the self organization
of the frequency ranking remains constant.

221
Table 6.7. Top ten content words for Informant M1.
TOP 10 CONTENT WORDS INFORMANT M1 WORD FREQUENCY
PRZYKŁAD[example] 50 LATA[years] 38
PRAWDA[truth] 28 RZECZY[things] 26
RODZICE[parents] 20 DOM[home] 19
MAMA[mpm] 16 POZNAŃ[Poznań] 15
CZŁOWIEK[human] 12 POLSKA[Poland} 12
GÓRY[mountains] 12
Almost all nouns in Table 6.7, the top ten lemmatized nouns for Informant M1, have
previously appeared in the females’ data. The four exceptions are: things, human, Poland and
mountains. Interestingly, the informant uses the word human, man as a way of talking about
himself in an impersonal, 3rd person manner:
…przez to właśnie nauczył się człowiek szacunku
‘...indeed you (man, human) learned respect through this.’
We can see that the topics around which the conversation revolved were mainly
connected with the close circle of family, but also he discussed more distant topics involving
Poland, and he furnished an abundance of examples. He also gave a lot of stories about hiking in
the mountains which he considers as his favorite hobby. Moreover, the use of the word truth is in
the manner presented by female Informant F1, as truthfully, for real.7
7 This item is not easily categorized as content or function word having the function of a discourse marker, therefore eleventh item was added to the list.
Informant M2 shows an
interesting pattern in his top rankings, as presented in Table 6.8.

222
Table 6.8. Top ten content words for Informant M2.
TOP 10 CONTENT WORDS INFORMANT M2 WORD FREQUENCY
PRZYKŁAD[example] 19 SZKOŁA[school] 15
HISTORIE[stories] 13 POZNAŃ[Poznań] 11
RZECZY[things] 11 LICEUM[high school] 10
KLASA[class] 9 ROK[year] 9
DOM[home] 8 PODSTWÓWKA[elementary school] 7
We can see that except for the terms seen in other tables connected with home--Poznań,
telling stories and lots of examples--we can distinguish a group of nouns revolving around the
notion of school. They are school, high school, elementary school and class (in the meaning of a
group of people who are attending the same school). This pattern shows us what most of his
stories were about. Interestingly enough, his attitude toward Poznań was negative. He was the
only informant who did not like the city, found it boring, and wanted to move away. However,
Poznań still shows up in fourth place. Although we are not able to determine his attitude from
this type of list, the main topics still float to the top of the frequency table. The last informant in
this sample group was M3.

223
Table 6.9. Top ten content words for Informant M3.
TOP 10 CONTENT WORDS INFORMANT M3 WORD FREQUENCY
PRZYKŁAD[example] 31 RZECZY[things] 24
PANI[madam] 20 TEATR[theater] 19
LATA[years] 15 ÓSMEGO[eighth] 14
DNIA[day] 13 MAMA[mom] 12
POZNAŃ[Poznań] 12 PRAWDA[truth] 8 SPOSÓB[way] 8
One immediate pattern appeared in the frequency list of the top ten nouns he used during
the interview. As mentioned in the previous section, this informant is the director of a theatre and
a cofounder of the Theatre of the Eighth Day. It should come as no surprise that all of the
components of this name appeared in the top ten most frequent nouns. In addition, the word
theatre is top ranked. Moreover, this informant was giving lots of examples, and a feature of
Polish politeness emerged in the table in the form of madam. Since he is an person older than
me, and on top of that the interview was our first meeting, it was only appropriate to use the
highly formal form of madam and sir in our conversation. This informant used the word truth in
his interview a few times8
Ja też to robię marynowaną, prawda w winie z czosnkiem.
, and when the concordances were run for this word it appeared that six
out of eight times, this word was used in the same manner as Informant F5 used it, in the
function of well, or right:
‘I also do it marinated, well
8 Once again this word is a discourse marker; therefore one more word was added to the list.
in wine and garlic.’

224
It is an interesting observation that the only two people who used this word in such a
function are those in the oldest age group. Therefore, only after analyzing all of the speakers in
the sample we can see that this particular use of word truth is not restricted to one speaker. Of
course the sample is not big enough to make any general statements regarding this occurrence,
but it may indicate an emerging pattern.
Overall, the group of males has similar top-ranked items to one other and the females.
However, each one of them was talking in substantial volume about a topic specifically
important to them: for example M1 about Poland, M2 about school, and M3 about theatre.
Poznań once again was consistently appearing in the tables, as well as some reference about
family.9
6.3.3. POZNAŃ WORDS IN CONVERSATION
Throughout the whole sample the shape of the distribution of the tokens remained
constant and followed the A-curve, confirming the assumptions laid out by The Linguistics of
Speech. Now, as we have a slightly more detailed picture of what the interviews contained, let us
move on in describing the patterns associated with the items specific to Poznań speech.
The conversational part of the interviews yielded a corpus of 70,115 words with 527
tokens of dialect words. The rate of those items was eight per 1,000 words. Table 6.10 presents
the frequency of Poznań words and the rate for each informant.
9 Just as indicated earlier, the questions set up in the protocol influenced the commonality of the answers. However, speakers still showed their variability in the fact that they also have unique lexical items in their top ten lists.

225
Table 6.10. The frequency of Poznań words and rate per thousand of Poznań words in the
conversational part of the interview for each informant.
INFORMANT NUMBER OF POZNAŃ WORDS
RATE PER 1000 OF POZNAŃ WORDS
F1 94 7 F2 58 10 F3 89 13 F4 18 3 F5 62 6 M1 93 6 M2 22 3 M3 91 12 TOTAL 527 8
When we look at the values for the rate, we can see that there are only three speakers who
have a rate that is higher than the average: F2, F3, and M3. The rest of the informants fall below
the average, with the lowest score of three for F4 and M2. Informant F1 is also right below the
average; although when we look at her frequency of dialect words, it is the highest in the sample.
However, she spoke a lot in that part of the interview, and that is why her rate is not as high as
what might have been expected by looking solely at the frequency. Although no claims beyond
the sample can be made, we should make a note that not all of the speakers contributed to the
average in a similar manner. In other words, there are a small number of speakers who have very
high rates and thus push the average higher, while the majority falls right below the average or
considerably below the average. If we rank the informants from the highest to the lowest score
for the rate, their distributions appears in the following shape presented in Figure 6.9.

226
Figure 6.9. Distribution of rates of Poznań words for All Informants.
Of course, because of the extremely small sample, the distribution is not smooth. The rate
for all informants is normally distributed, not in a shape of an A-curve. If the rate sample was
distributed in the A-curve shape, that would mean that there are only very few with high scores
and multiple speakers with very low scores. As we have seen so far, this is not the case. All
speakers use Poznań words, there exists more of them with scores around the average and only
two with really low scores. Therefore, normal linear distribution indicates that informants do use
Poznań words, while A-curve would indicate that majority of them barely does. Now, we suspect

227
that if an A-curve for Poznań words was created out of rates for speakers from all over the
country, then Poznań speakers would be on top of the curve, and majority of the other informants
would fall into the tail of the A-curve.
The whole interview had 253 types of dialect words; the conversational part of the
interview covered 178 of those types. This observation yields an average of three tokens per
type. Most of the words had low frequencies, as illustrated in Figure 6.10.
Figure 6.10. Poznań words in conversation.

228
We can see an A-curve, in which there are only a small number of types that have high
token frequencies, and a majority of types receive only single digit frequencies. To be more
detailed, seven types received frequencies higher than single digits (Table 6.11.), 101 types are
one time occurrences, and 70 types have a frequency of more than one but less than ten.
Table 6.11. Top frequency Poznań words in conversation.
Poznań word Frequency fajny [pretty, OK] 94 se [self] 32 kuzaj [cousin] 21 facio [man] 13 słodkie [sweets] 11 oglądnąć [to look at] 10 godać [to talk] 10
The top most frequently used words for conversation do not belong in one semantic
group; some of them are nouns (cousin, man, sweets), verbs (to look at, to talk), or adjectives
(pretty)10. The word se ‘self’ is a part of a verb, as in the English example she saw herself .
However, in Polish the general word for this reflexive part of the verb is się ‘self,’ while in the
local speech of Poznań it is se ‘self.’11
10 The word ‘fajny’ has a meaning of cool in general Polish, however in Poznań speech it means pretty, OK, and this meaning is indicated here.
The set of words in the table above can be considered as
the most common words that are particular to Poznań speech. Four out of seven are in the
Poznań dictionary (Gruchmanowa et al. 1999), fajny ‘pretty,’ and godać ‘to talk’ were indicated
in other sources (except for facio ‘man’). What is interesting is that although those words were
11 This is not just a phonetic variation; this word would be spelled in this way, not się ‘self’

229
present somewhere on the list of local words in different sources, in the article by Witaszek-
Samborska (1987), which lists ranking of groups of words used by her respondents, none of
those in Table 6.11. She established three groups of Poznań words used by more than 70% of her
respondents, 50%-70%, and 10%-50% of the speakers. None of the items appearing in the top of
the A-curve were contained in any of the groups established by her. This indicates that those
words went unnoticed in the previous study, maybe because of different topics in the
questionnaire and interviews. Another explanation is offered by linguistics of speech, in which
we notice that the set of seven words will be mostly in the lower part of the A-curve for the
whole corpus. This indicates that speakers not only pay attention to the top of the curve, but also
to the other parts of it, including the tail, where most of the Poznań words live in general speech.
In other words, the A-curve distribution offers speakers a way to categorize variants. The top of
the curve with top ranked variants is most likely to be chosen for the ‘usual, common’ category,
and then those lower on the curve are the base for other types of the categories. From the data, it
seems that speakers perceive the tail of the curve, and based on it, create schemas about Poznań
speech.
Now, the types of local lexical items were not easy to categorize into mutually exclusive
and well defined groups. However, I made an attempt to sort them into semantic categories. Four
groups that stood out when all types were considered were Food Vocabulary, Descriptions of
People and Their Behaviors, Family and Friends, and Vocabulary About Poznań. After
completing such categorization, one more group was added: this time a grammatical one
accounting for verbs, called Other Verbs. After completing this indexing of lexical items, 71
types were not accounted for and were left under the Miscellaneous category presented in the

230
Appendix H. Therefore, 107 types of words in the conversation part of the interview fell into the
categories listed above. The most numerous group of types was Other Verbs. It contained 47
lexical types (Table 6.12.)
Table 6.12. Other Verbs category of types.
Other Verbs Frequency Se12 32 oglądnąć[ to look at] 10 godają[ top talk] 10 kumam[ to understand] 8 kazała[to tell somebody to do something] 7 obkrajała[to cut out] 4 latałam[run around] 4 olał[not to care] 3 wisi[not to care] 3 szlajam[to walk/go] 2 poobjeżdżać[ to visit] 2 spieprzyłam[ to mess up] 2 obalę[to fall down] 2 czekają za prezentami[ to wait for presents] 2 chlali[they drank] 2 ziuziać[ to rock] 1 żarły[they ate] 1 zaciągawszy[to drawl] 1 wyzywałem[to yell] 1 wytrzepałam[ to be out of something] 1 wymyśleć[to come up with] 1 wyłanczano[ to turn off] 1 wyjechana[ to be out/gone] 1 widzi mi się[I like it] 1 szpeknę[ to look, check] 1 spiknęły[to meet] 1 sklepali[to make] 1 skakać w gumę[to play in rubber] 1 rzuciłam[to throw words] 1 pyto[to ask] 1 przeskrobało[make trouble] 1
12 Although this word is more of a verbal element than a verb on its own terms, it seems that this category is the closest to fit.

231
pójdymy do gemizy[go to the bar] 1 oporządzić[take care] 1 odwidziało[to change mind] 1 nabijałem[make fun of something/somebody] 1 mosz[here you go] 1 mazgnęłam[to splash] 1 łaziliśmy[to go/walk] 1 łapią[to catch/understand] 1 jadą po swoim[talk our own way] 1 gnieździliśmy się[to be crowded] 1 dostałem w ciże[to be spanked] 1 chycnij[go see something] 1 hajtają[to get married] 1 bujaliśmy[to hang out] 1 brylowałem[to have ease with doing things] 1 bajdurzyli[to tell stories] 1
As can be seen in this table, the group of verbs is not restricted to one type of activity to
which the subjects would refer. Moreover, 32 types out of the 47 for this group are one-time
occurrences. Such a distribution leads to the observation that although the local Poznań words
are present in the speech of the subjects, they are not common. When they do appear, the verbs
found in the corpus revolve around everyday topics without any particular specialization. When
the rest of the categories are considered, the situation is different. In the semantic categories the
vocabulary is connected with certain parts of life for the informants, and the names of those
groups correspond to the general parts of the interview.
The biggest group in the semantic categories is the Food Vocabulary which covers 27
types and the specific words are presented in Table 6.13.

232
Table 6.13. Food Vocabulary for Poznań words in conversation.
Food Vocabulary Frequency słodkie[sweets] 11 placki[pies] 7 polewka[special kind of soup] 6 pyry[potatoes] 4 pierzynkę[blanket or cream] 4 makiełki[poppy seed dessert] 4 żarcie[food] 3 szabelek[green beans] 3 pychotka[delicious] 2 pomarańczko[orange] 2 metka[raw sausage] 2 fefer[savory] 2 za masłem się stało[to get butter] 1 w kance[in a special container to bring milk in] 1 szlagzana[whip cream 1 szare kluski[potato dumplings] 1 szare jaja[casserole with eggs] 1 suszu[dried fruit] 1 rąbanka[type of raw sausage] 1 obkłada[tu put things on a sandwich] 1 kunfektów[candy] 1 korbola[apple wine] 1 gzik[ cottage cheese dish] 1 gryza[bite] 1 fefelkiem[ savory] 1 ćwierćfunta[quarter pound] 1 chochla[ladle] 1
This group of words, anchored in the kitchen, lists mostly the names of dishes and types
of food. Not all of them are traditional Poznań dishes, unfamiliar in other parts of Poland, as for
example gzik ‘cottage cheese dish with green onions.’ But there are some food items which are
known elsewhere under different names: for example szabelek ‘green beans’ in Poznań, and
elsewhere they are known as fasolka szparagowa ‘green beans’. As well, there is the famous

233
Poznań word for ‘potatoes’ pyry, which in general Polish is ziemniaki ‘potatoes,’ kartofle
‘potatoes,’ or grule ‘potatoes’ in other parts of Poland.
The next category is concerned with people and what we think about them and the way
they behave. Table 6.14 presents the results for Descriptions of People and Their Behaviors.
Table 6.14. Descriptions of People and Their Behaviors for Poznań words in conversation.
Descriptions of People and Their Behaviors Frequency fajną[cool pretty] 94 spłukany[be broke] 6 na focha[to be mad] 5 rojber[bad behaved child] 3 obleśnym[disgusting] 3 ciamajdą[someone who is not good at anything] 3 wrednie[malicious] 2 miał stracha[to be afraid] 2 jęczy[to whine] 2 gnębiła[to nag] 2 zrywam boki[laugh out loud] 1 zgrywać się[to play around] 1 wstawiona[tipsy] 1 świr[crazy person] 1 ramoli[do something slowly] 1 odbąbać[do something with the least amount of effort] 1 obskurnym[sleazy] 1 matoły[dumb people] 1 mają ubaw[to have fun] 1 luj[jackass] 1 galara[fear] 1
This category covers 21 types and is the second biggest semantic category. Most of the
words have somewhat negative qualities to them, describing people who are not very intelligent,
doing things slowly and not well, and are sleazy, crazy, nagging, malicious, disgusting, and mad.

234
Only a handful of words in this group are connected with positive qualities like laughter, play,
and being pretty. Such a distribution may indicate that the local words are used more often to
provide descriptions in a colorful and more expressive way regarding the negative side of human
appearances and behaviors.
The next two categories that covered six lexical types each were Family and Friends and
Vocabulary About Poznań. Both are presented in Table 6.15 and Table 6.16 below.
Table 6.15. Family and Friends Vocabulary for Poznań words in conversation.
Family and Friends Frequency kuzaj[cousin] 21 facio[man] 13 kumpel[friend] 7 stary[father] 2 dziecinko[baby] 2 psiapsiółek[female friends] 1
Table 6.16. Vocabulary About Poznań for Poznań words in conversation.
Vocabulary About Poznań Frequency Ceglorzu[name of the ship engine factory] 8 blubry[Poznań speech/talking without sense] 5 na berwinie[ part of Poznań] 2 bambrów[rednecks] 2 u Matysiaków[name for nosy neighbors] 1 sztyngrze[shift at the factory] 1
The names for members of the family and friends are not numerous, but they do show a
few examples of names for extended members of these social groups. Vocabulary connected

235
with Poznań talks about Ceglarz which is a local name for the ship engine factory in the city with
full name of Zakłady Hipolita Cegielskiego ‘Hipolit Cegielski Factory,’ and the shift that the
employees work on. Interestingly, the word bambrów ‘rednecks’ was originally used to reference
the first settlers in Poznań area who came from Germany, from the area around Bamberg. The
word bamber still carries this meaning of the natives of Poznań; however with time it started to
denote people, with the closest English translation as rednecks. The way the informants used this
word in the interview was in such a context, which is why this translation is present in the table.
From those five groups of words we can see that when subjects used Poznań words, some
of them were not easily categorized, hence the set of words labeled as Miscellaneous in the
Appendix H. However, when semantic categories were established, the topics covered by them
revolved around food, people, and the city. Partially those topics overlapped with the most
common ones discussed in the interviews: Poznań, family, and education. Here, the scale is
different. When each conversation was converted into an A-curve distribution, Poznań words did
not appear high on the curve but instead appeared in the tail. However, when the A-curve of
Poznań words was presented (Figure 6.10), a few of them were very frequent (Table 6.11) and a
lot of them were less frequent and appeared in the tail. The observation about the distribution of
local words in the conversational part of the interview is that Poznań words appear, but not very
often. When they are used, they revolve contextually around the immediate surroundings of the
informants, the people, whether the discussion is regarding family, activities at home such as
cooking, and the city in which they live. This observation confirms the assertion made by Gould
and White (1986), and reiterated in Kretzschamar (2009), that we know more about our closest
surroundings. This observation is also in line with the previous observation by Witaszek-
Samborska:

236
Słownictwo najsilniej zakorzenione, przekazywane z pokolenia na pokolenie, to
przede wszystkim nazwy przedmiotów i zjawisk związanych z najbliżczym
otoczeniem człowieka, a więc funkcjonujących głownie w sytuacjach domowych,
rodzinnych.
The vocabulary with the strongest prevalence, passed on from one generation to
another, is the one connected with the objects and actions happening within the
closest ambience of the speakers, therefore functioning mostly in family
situations. (1987:346)
Interestingly, when the informants spoke about those people who were within the closest
ambiance, most often they used local words to describe the negative qualities and behaviors of
these individuals. Except for the semantic categories, the verb group reinforces the above
observation, since the verbs used are distributed among various activities and are not restricted to
any one type of human behavior.
When the number of types was compared between the conversational and elicitation parts
of the interview, an interesting correlation emerged. Almost exclusively, each type was
associated with one part of the interview but not the other. There are only eleven exceptions
(Table 6.17), in which those types received tokens in both parts of the interview.
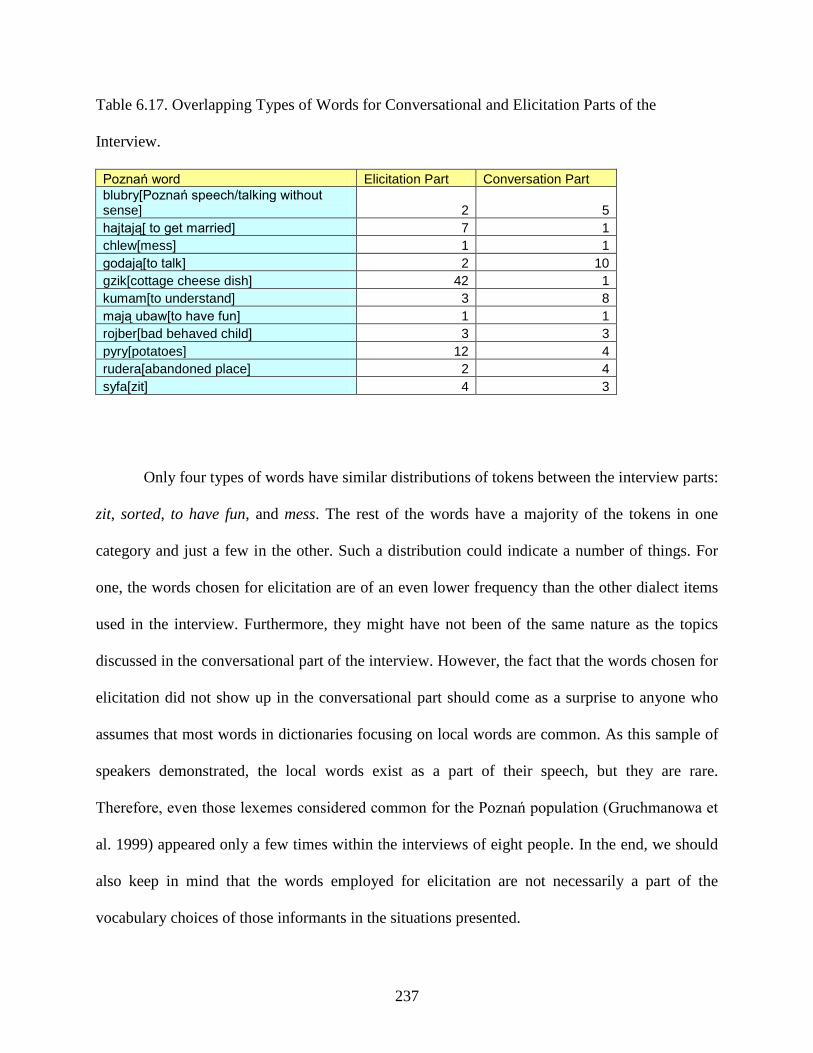
237
Table 6.17. Overlapping Types of Words for Conversational and Elicitation Parts of the
Interview.
Poznań word Elicitation Part Conversation Part blubry[Poznań speech/talking without sense] 2 5 hajtają[ to get married] 7 1 chlew[mess] 1 1 godają[to talk] 2 10 gzik[cottage cheese dish] 42 1 kumam[to understand] 3 8 mają ubaw[to have fun] 1 1 rojber[bad behaved child] 3 3 pyry[potatoes] 12 4 rudera[abandoned place] 2 4 syfa[zit] 4 3
Only four types of words have similar distributions of tokens between the interview parts:
zit, sorted, to have fun, and mess. The rest of the words have a majority of the tokens in one
category and just a few in the other. Such a distribution could indicate a number of things. For
one, the words chosen for elicitation are of an even lower frequency than the other dialect items
used in the interview. Furthermore, they might have not been of the same nature as the topics
discussed in the conversational part of the interview. However, the fact that the words chosen for
elicitation did not show up in the conversational part should come as a surprise to anyone who
assumes that most words in dictionaries focusing on local words are common. As this sample of
speakers demonstrated, the local words exist as a part of their speech, but they are rare.
Therefore, even those lexemes considered common for the Poznań population (Gruchmanowa et
al. 1999) appeared only a few times within the interviews of eight people. In the end, we should
also keep in mind that the words employed for elicitation are not necessarily a part of the
vocabulary choices of those informants in the situations presented.

238
Lastly, if we look at the distribution of tokens for gzik ‘cottage cheese dish’ in the
conversational and elicitation part, we can see that this illustrates a sharp disconnection between
the topics arising during the interview. In the elicitation part gzik has the highest frequency, in
fact as will be shown in the next section every informant gave that answer, but in the
conversational part this word only shows up once. It is caused by the topics aroused during the
conversation. Although food was heavily discussed, it was mainly revolving around special
occasions like Christmas and Easter. However, gzik is not a special dish, it is an everyday meal.
Most probably, if the topic would concern local dishes, this term would appear more often in the
conversation.
6.4. ELICITATION--RESULTS
As described in the previous section, the elicitation part of the interview was designed
with the intention of checking the knowledge of the informants about some of the words
previously used in the perceptual questionnaire. Although there were only twenty concepts
introduced in the elicitation section, the subjects actually used more than that since the data
indicates 86 types of words were used. The elicitation part of the interview yielded a 10,592
word corpus with 429 dialect tokens of dialect words. The detailed breakdown of the frequency
of dialect lexemes for each informant is presented in Table 6.18.

239
Table 6.18. Frequency of Poznań Words for the Elicitation Part of the Interview.
INFORMANT NUMBER OF POZNAŃ WORDS
F1 68 F2 57 F3 57 F4 41 F5 29 M1 69 M2 28 M3 80
We can see that the highest number of Poznań words belongs to Informant M3, and
Informant M1 is second with Informant F1 right behind him. At the end, we have F5 and M2.
The distribution of the informants according to the number of Poznań words is presented in
Figure 6.11.
Figure 6.11. Distribution of Informants According to the Number of Poznań Words in
Elicitation.

240
Once again, we can see that the distribution follows a normal shape: in which we have
speakers who used a lot of local words, a few who used very few words, and mostly those in the
middle. It is Informant M3 who is the leader in this part of the interview; although in the
conversational part he was a very close second place (Figure 6.9). On the other end of the
spectrum, Informant M2 has the lowest scores for both parts of the interview. If there were more
subjects in the sample, the shape of the distribution would be smoother. Such a distribution
shape, once again tells us that most of the speakers are using Poznań words more than just a
little. As in Figure 6.9, the distribution was normal and not an A-curve, because the latter would
indicate very low usage by most of the informants.
Now that we have seen the distribution of people when the frequency of Poznań words is
concerned, we need to explore the local lexemes. Table 6.19 presents all 86 types of words with
their corresponding frequencies.
Table 6.19. All Types of Poznań Words That Appeared in the Elicitation Part.
POZNAŃ WORD FREQUENCY gzik[ cottage cheese dish] 42 marudzi[to whine] 23 modra kapusta[red cabbage] 19 ramiączko[strap] 19 galart[meat dish] 17 gziczek[cottage cheese dish] 16 kundel[mix breed dog] 15 tytce[bag] 15 szneka z glancem[type of pastry] 13 pyry[potatoes] 12 statki[dishes] 12 naramki[straps] 11 podstawek[saucer] 11 ostrzytko[sharper] 10 podkoziołek[holiday the day before Ash Wednesday] 10

241
kawiorek[type of bread] 9 wilgne[damp] 9 zakluczam[ to lock] 8 akuratny[sorted] 7 hajtają[to get married] 7 kawiorka[type of bread] 7 ostrzałka[sharpener] 5 chęchy[abandoned place] 4 chichrają[ to laugh] 4 febrą[ cold sore] 4 maruda[ whiner] 4 mędzi[ to nag] 4 odkluczam[ to unlock] 4 syfa[ zit] 4 zimno[ cold sour] 4 bryzgała pyry[ to spit sour milk on potatoes] 4 burek[ mixed breed dog] 4 dziupla[ dope house] 4 gadżet[ zit] 3 kajzerka[ type of bread] 3 kejter[ mixed breed dog] 3 kenerek[ mixed breed dog] 3 kiejter[ mixed breed dog] 3 kumam[ to understand] 3 pateraka[ things poorly done] 3 ploży[ to like] 3 rojber[ bad behaved child] 3 spodek[ saucer] 3 zbańczyć[ lose money] 3 zimne nóżki[ meat dish] 3 bajzel[ mess] 2 blaza[ skin condition] 2 blubry[ Poznań speech/top make no sense] 2 chajcherstwo[things poorly done]] 2 chaszcze[abandoned place] 2 godają[ to speak] 2 jesteśmy spłukani[ to have no money 2 nie mam siana[ to have no money] 2 no bryndza[ bad times] 2 ostrzydełko[sharpener] 2 rudera[ abandon house] 2 smęci[ to bore] 2 babińcem[ females] 2 bejmów[ money] 2 brechają się[ to laugh] 1 być polanym[ to laugh] 1 byłam spłakana[ to laugh] 1 chlew[ mess] 1

242
czepialski[ nagger] 1 Drożdżówka z kruszanką[ type of pastry] 1 kibelek[toilet] 1 kwiczą[ to laugh] 1 lachają się[to laugh] 1 mają ubaw[ to have fun] 1 meduza[zit] 1 melina[dope house] 1 no zoba[ look!] 1 nudzi[ to bore] 1 oszczytko[sharpener] 1 przylozł[ to come] 1 skomle[ to whine] 1 speluna[rotten place] 1 szczerzą zęby[to laugh] 1 sznyka z glancem[type of pastry] 1 szrot[junk yard] 1 turlają [to roll around] 1
The words that were the targets for elicitation (based on the questionnaire) are
highlighted in yellow. Twenty-one concepts were selected from the questionnaire, three concepts
had two optional answers: zakluczam/odkluczam ‘to lock/unlock,’ gzik/gziczek ‘cottage cheese
dish,’ and kawiorek/kawiorka ‘type of bread,’ which makes 24 Poznań words. However, notice
that there are 25 concepts in the table because two targets did not turn out: bręczy ‘to nag,’ and
skorupy ‘dishes.’ Moreover, sznyka, oszczytko, and kiejter are just phonologically different from
their original concepts of szneka, ostrzytko, and kejter. Most of the other word types in the table
are various responses to the questions aimed at eliciting the original 21 items. However, nine
types of words (highlighted in green) are not connected with the elicitation cues but were instead
a part of the conversation going on in that part of the interview. Moreover, it is interesting to note
that although only 24 forms were targeted, 48 more types appeared as alternative answers. All of
those answers are considered Poznań words in various publications on the topic (as explained in
detail in Chapter 1). All of the respondents gave more than one answer for some of questions

243
established for elicitation (the list of all the cues for specific concept is presented in Appendix I).
It seems that two cues were not as successful as the others. First one was for the target concept of
bręczy ‘to nag,’ and the other one was the cue for word skorupy ‘dishes,’ both of which did not
receive any of the target answers. However, both of those concepts received other answers which
also constitute Poznań speech. The group for bręczy is comprised of words translated as ‘to nag,’
or ‘to whine,’ while the group for skorupy contains words translated as ‘dishes.’ As the results
presented in Table 6.19 indicate, the speakers had more than one word for a concept that they
were asked about. Not all of them responded to all of the cues asked, but more often than not
they gave more than one answer for a question. Two questions resulted in no target answers
given, which might be an indication that the cues were not clear enough or that those words are
not common enough for the speakers recall in such a situation. Moreover, the elicitation part
shows us that the set of Poznań words obtained in this section of the interview also follows the
A-curve pattern (Figure 6.12). However, this time it was a different type of conversation, and
most of the target words are in the top or upper middle of the curve with only a few in the tail.

244
Figure 6.12. Poznań words in elicitation.
We can see a difference in the steepness of the A-curve in this part of the interview
compared to the conversational part (Figure 6.10). In the conversational part there were only a
few words with high frequency and a lot of with single digits. In the elicitation part, there are
more high and mid frequency words and an abundance of single digit numbers. This difference
shows us the difference in the type of conversation, but the similarities tell us that there still will
be three groups of frequencies: high, mid, and low. What changes is the proportion between
them. Now, let’s look closely at the set of targeted Poznań words and what kinds of results were
obtained during the elicitation. Table 6.20 lists all of the targets that the cues were intended to
elicit.

245
Table 6.20. Target Words for Elicitation.
TARGET WORDS AKURATNY[sorted] BRĘCZY[to nag] CHĘCHY[ abandoned place] CHICHRAJĄ SIĘ[ to laugh] FEBRA[ cold sore] GALART[meat dish] GZIK[cottage cheese dish] GZICZEK[cottage cheese dish HAJTAJĄ[to get married] KAWIORKA[type of bread] KAWIOREK[type of bread] KEJTER[mix breed dog] MODRA KAPUSTA[red cabbage] NARAMKI[strap] ZAKLUCZAM[to lock] ODKLUCZAM[to unlock] OSTRZYTKO[sharpener] POKOZIOŁEK[holiday a day before Ash Wednesday] SPODEK[saucer] SKORUPY[dishes] SZNEKA Z GLANCEM[type of pastry] TYTKA[bag] WILGNE[damp] ZBAŃCZYĆ[lose money]
On average, 47% of the 24 words listed above were used during the elicitation part of the
interview. Each informant contributed to this mean in different ways, and the results are
presented in Table 6.21.

246
Table 6.21. Percentage of the Poznań Words Each Informant Used in the Elicitation Part of the
Interview.
INFORMANT
PERCENT OF DIALECT WORDS USED IN THE ELICITATION
F1 65% F2 52% F3 57% F4 39% F5 35% M1 35% M2 30% M3 65%
No one used more than 65% of the words, and the two people who used the words the
most were the youngest female and the oldest male informants. The average was 47%, and the
group of informants (F1, F2, F3 and M3) was above the average. The rest of the informants fell
below the average. What we see based on this table is that the group of people in this sample is
variable; some individuals had more knowledge about the targeted Poznań words and responded
to the questions more often than the others, but all of them used at least some of the targeted
words. When we compare the group of speakers to the group of words that they used, on various
levels of agreement a reversed proportion emerged. In other words, if the number of words used
by the subjects increased, then the number of members of that group decreased.

247
Table 6.22. Comparison of the Number of Informants Using Poznań Words to the Number of
Those Words.
HOW MANY INFORMANTS USE THE WORD HOW MANY WORDS AT LEAST ONE INFORMANT USES THE WORD 22 AT LEAST HALF OF THE INFORMANTS USE THE WORD 12 90% OF THE INFORMANTS USE THE WORD 5 ALL INFORMANTS USE THE WORD 1
This simple correlation, displayed in Table 6.22, shows us that the more informants agree
on using local words in the interview, the more restricted the set of the words they produced was.
If we have at least one person using the word, the group of items covered was 22 out of 24 items,
which is 92%. However, if we want to find one word that every informant knew, there is only
one: gzik ‘dish made out of cottage cheese, green onions and radish.’ Gzik was the only lexeme
common for every informant during elicitation. But in order to have a more comprehensive
picture about the targeted words, we need to explore not only their production but also the
perception of them during a different part of this study.
Now, as emphasized previously, the elicitation part of the interview was based on the
perceptual questionnaire. Twenty one concepts were chosen, and the same definitions were used
as on the questionnaire. On average, 47% of items were named by the informants during the
elicitation exercise. The same group of words was perceived by 63% of the questionnaire
respondents to be something that they used.13
13 We should keep in mind that the data from the elicitation was based on eight interviews, and the data from the questionnaire was based on 272 responses.
This substantial difference in percentages between
self-reports and elicitation was previously noticed by Bailey (1997) in the comparison of
elicitation results from the Texas portion of the Linguistic Atlas of the Gulf States (LAGS) and a

248
self- report study of Grammatical Investigation of Texas Speech (GRITS). In the results, GRITS
received 20% to 30% higher scores for a particular lexical item than LAGS. The explanation
provided for such a distribution is that the lexical item under investigation (fixin to and might
could) are very low frequency and therefore cannot be expected to turn up often in the
conversation, and at the same time they are extremely difficult to elicit (Bailey 1997:57). The
latter part of the explanation turned out to be true for bręczy ‘to nag’ and skorupy ‘dishes.’ On
top of that, the observation about low frequency of such words is once again confirmed by the A-
curve distribution, in which we can see that the words in the tail do not go unnoticed for the
speakers. Those words in the tail for everyday speech are registered by the speakers, and when
evoked from the memory through schema and gestalt process they reflect to some degree the
image of speech production.
Now if we look into the details of this distribution, we can compare specific items. Table
6.23 displays all of the words uttered during the elicitation part of the interview that received
25% or fewer responses in comparison to their perceptions in the questionnaire.

249
Table 6.23. Comparison of low frequency words in the elicitation part with their perception in
the perceptual questionnaire.
As we can see, nine items out of 24 (three of the 21 concepts had two alternative
answers) were not provided as answers, or they were given by one fourth of the informants or
fewer. In all of those cases the perception was higher than the real usage, sometimes as
overwhelmingly as 0% usage when 75% of the questionnaire respondents claimed they used the
word. This observation may indicate that there is indeed a difference between what we say and
what we perceive ourselves to say. Moreover, those results emphasize the fact that this way of
eliciting words without giving the answer to the interviewees is different from seeing the
definition and the answer at the same time. Having said that, we should keep in mind that the fact
that some of the target words were not produced does not mean that the respondents never use
them. Results described above refer only to the data that was actually produced. We can assume
that context does not play a crucial role here, as it was not provided in both methods. If we look
at the other end of the spectrum, in which 75% or more informants gave the targeted answers to
the question, and compare it to the perception of it, we notice some fascinating results.
BRĘ
CZY
[to
nag
]
SKO
RU
PY
[d
ishe
s]
CH
ĘCH
Y
[aba
ndon
ed
plac
e]
ZBAŃ
CZY
Ć
[to lo
se
mon
ey]
WIL
GN
E
[dam
p]
KAW
IOR
EK
[type
of b
read
]
SPO
DEK
[s
auce
r]
AKU
RAT
NY
[s
orte
d]
GZI
CZE
K
[cot
tage
ch
eese
dis
h]
USED IN THE ELICITATION 0% 0% 0% 13% 23% 25% 25% 25% 25% PERCEIVED AS USED IN THE QUESTIONNAIRE 75% 32% 76% 63% 28% 51% 90% 56% 35%

250
Table 6.24. Comparison of high frequency words in the elicitation part with their perception in
the perceptual questionnaire.
GAL
AR
T [m
eat d
ish]
GZI
K [c
otta
ge
chee
se
dish
]
HAJ
TAĆ
[to
get
m
arrie
d]
SZN
EKA
Z
GAL
NC
Ą
[type
of
past
ry]
MO
DR
A KA
PUST
A
[red
cabb
age]
USED IN THE ELICITATION 88% 100% 75% 88% 88% PERCEIVED AS USED IN THE QUESTIONNAIRE 85% 80% 50% 65% 91%
Interestingly, as seen in Table 6.24, the relationship between use and perception is almost
unanimously reversed. The frequency-of-use values are higher than the perception of use of
those words, except for red cabbage. The four words listed here are the only items that have
higher values for usage than for perception. All others have a reverse proportion, which is
reflected in the overall higher percentage of the perception of the dialect words (63% as opposed
to 47% of usage).
This comparison of a set of words specifically targeted in the interview and used in the
questionnaire shows us that there are differences in the way informants used this restricted group
in the interview, as well as how other subjects reported their speech behavior in the
questionnaire. Having described those results, we can now move on to the preliminary
observations about the relationships involving the data.
6.5. PRELIMINARY OBSERVATIONS.
The interview task was set up as a tool to give a point of reference to the perception task
used in this study. The amount of speech data gathered was not enormous. However, it revealed
some patterns in the speech behavior of the eight speakers in question. The corpus created out of

251
the transcripts of the interviews was divided into two parts in which the conversation section and
elicitation of Poznań words were separated. In the conversational segment the amount of local
items was higher than during the word quiz (55% and 45% respectively). Moreover, all
informants used some Poznań words in both parts; there was no individual who did not use any
of the local items. However, we need to keep in mind that Poznań words constitute only a small
part of the whole speech of the informants. The analysis was focused on the Poznań words set,
but it needs to be emphasized that for most of the time informants were using words from what
was here called general Polish. Therefore, we should keep in mind that Poznań words give a
unique dimension to the speech of the informants, but do not give a full picture of their speech.
Mainstream Polish words give Poznań speakers common ground with all other Polish speakers.
Therefore, when we take into consideration the A-curve distributions of the speech of each
individual speaker, what we seen (as in Figure 6.1 through 6.8.) is that most of the items are
general Polish. Moreover, they occupy the top ranked positions, with only a few Poznań items
climbing out of the tail of the A-curve. In the end, Poznań words are those which make the
speech of the informants different from other speakers’.
In the conversational part of the interview, the shared topics of the stories told by the
informants revolved around family, the Poznań community, and education. However, each
informant had a set of frequently occurring nouns indicating some special interest topic of their
own choosing. The protocol established the foundation for the common topics to appear in the
top part of the A-curve. However, it should be noted that the questions asked were the same for
all informants, and despite that the speakers showed variation, since they had their own
individual top ranked lexical items not shared with other informants. This observation one more
time indicates the inherent variability in speakers’ speech.

252
Furthermore, out of the 253 types of Poznań words, two thirds of them were covered in
this part of the interview. Interestingly, the types used in the conversational part of the interview
and those in the elicitation did not overlap except for a small set: eleven to be exact. Five
semantic groups and one grammatical category were established for the Poznań words in the
conversational part of the interview; most of the tokens fell into those categories. A pattern
emerged in which Poznań words were mostly used to talk about food, to describe people, to
discuss family, and to talk about the Poznań community; the grammatical category contained
verbs. Such a distribution indicated that local words were used for discussing everyday topics,
and the allocation of Poznań words is not restricted to one specific domain.
The elicitation part of the interview was primarily focused on providing definitions of
concepts, with the hope of eliciting a specific set of 24 words. Although the interviewer provided
no answers, the informants used 47% of the concepts. This number might seem high.
Nonetheless when compared to the same set of words used in the perceptual questionnaire, 63%
of the items were perceived to have been used. Therefore, a distinction between perception and
local vocabulary usage was established. In addition, the group of speakers who used Poznań
items the most was the same for both parts of the interview. It constituted of three females
(Informant F1, F2, and F3) and Informant M3. The remaining group fell under the average in
their local speech use.
All in all, the analysis established for this task will be used to give more perspective and
insight into the workings of the perception of speech and its relation to the speech behavior
presented in the concluding chapter.

253
CHAPTER 7
CONCLUSIONS – TWO SIDES OF THE SAME COIN.
This journey started with my curiosity for what people in Poznań think about their speech
and how they use it. Those two sides of the story were explored through two perceptual tasks and
one production task. With about 500 participants overall, I had an excellent opportunity to
observe the way people see themselves using Poznań speech and how they actually use it. The
sections below summarize the findings and emphasize the most important patterns emerging
from the data.
7.1. THE PERCEPTUAL MAPS.
This task was performed by 215 subjects who circled and described on a map what types
of speech people possess in Poland, and, on a separate map, in Poznań. Maps displaying
aggregated perceptions revealed patterns of those views. No matter which way the sample was
divided, either by the place of birth or gender, the four main epicenters of highest agreement
emerged in The South around Silesia and the mountain region, The West in the Wielkopolska
region, The North close to the seaside, and The East around the capital city, Warszawa. Only in
the South and in the West did two major cities, Katowice and Poznań, receive scores higher than
an 80% agreement level of some sort of speech variety located there. There were 13 cities on the
map, and except for Poznań and Katowice no other city was contained within an area of higher
than 50% agreement about a speech type existing there. Most of those cities were located in
areas of a 20% to 30% range of agreement. The four epicenters emerging from the data did not
have the same level of recognition from the respondents, and they were not the same size.

254
The area that received the highest score, in the 90% to 100% agreement range, was a
region in the South, attributed to the mountain range where the highlanders live. However, there
were actually two smaller areas that people identified, and once those groups were put together it
created the long but thin belt of high level of agreement in the South. Therefore, such a pattern
indicates that people agreed with each other in smaller areas, but only the aggregation of the
results creates the high level area of agreement. The situation in the North was different since the
maximum level of agreement here only reached the 50% to 60% range. The epicenter was not
located at any major city in the area or any of the cities indicated on the original map. Moreover,
as was shown in Chapter 4 (see Figure 4.37), the highest level of perception in that area was
connected with the speech variety designated as Kashubian. However, when compared to the
self-identified area of Kashubian speakers, it was further south and did not match.
Surprisingly, in the East the biggest Polish city and the capital, Warszawa, received the
lowest level of agreement out of the four epicenters, only in the 30% to 40% range. The
respondents only weakly indicated any type of speech specific to Warszawa on the map. In the
West, subjects asserted that they do have a definite perception of Poznań speech surrounding the
area around the city; the range of agreement oscillated between 60% and 90%. The largest area
of the highest agreement, in the 80% to 90% range, was designated by respondents born and
raised outside of Wielkopolska province, not the native population.
When all subjects were presented with a choice to distinguish between speech varieties
within the city, only 16% declared any type of perception about the speech within Poznań’s
boundaries. Most of the time they used the administrative limits or the names of city divisions to
indicate variation in speech.

255
Moreover, the respondents not only put circles or shading on the areas they perceived as
different, but they also labeled them. Those labels, like other features of speech, followed the A-
curve distribution. Interestingly, an order emerged in which labels describing Polish speech
varieties fell into two groups: non-linguistic and linguistic features. The non-linguistic group was
overwhelmingly bigger than the other set of labels and was based mainly on geographical names
attributed to the regions and the people living there1
Overall, the perceptual task allowed us to assert that the perception of a speech variety
specific to Poznań does exist, and greater insight into this construct was developed by using a
perceptual questionnaire.
. What was intriguing was the fact that
sometimes the main city served as a descriptor, sometimes the name of the whole region, and, in
the case of the South, two regions were put together as one area (Silesia and mountain region
where the “highlanders” live).
7.2. THE PERCEPTUAL QUESTIONNAIRE.
The perceptual questionnaire was set up in such a way that the respondents were able to
demonstrate how they see themselves using Poznań speech words and general Polish lexical
items. The analysis of the results provided by the 272 participants was aimed at answering two
types of questions. The first type asked about the characteristics of those subjects who claimed to
use the words in both groups. The overall percentage of items perceived by the subjects as
something they used themselves was 66% for Poznań words and 78% for general Polish. The
demographic categories, which were significant for both groups of words, were age, place of
birth, and childhood. In all those groups of factors there were differences in percentage
distribution. However, those differences were not tremendous. The range between the highest
1 The instruction given for the task listing non-linguistic features first and linguistic features last might have influenced the answers. However, it cannot be proved until further research.
256
percentage and the lowest was never higher than 20%. Such a distribution of result shows us that
the significant categories operate more like a continuum than categorical distinctions. Keeping
this in mind we can describe Poznań speech as perceived to be used by people across all age
categories, with 31 to 45 year olds slightly more inclined to do so and the oldest generation
somewhat less. This finding is at odds with previous research done by Witaszek-Samborska
(1987, 1999), in which she also used a sample of highly educated speakers. Her results
characterized the oldest members of the community as having the most positive attitude
regarding the speech of Poznań. And on top of that, age was the only significant factor in her
study. It appears that while 31 to 45 year olds can be said to be slightly different from the other
groups in the perception of themselves as Poznań speech users, it is the 46 to 60 year olds for the
mainstream Polish words who are in a slight lead from the other groups.
Now, not only people who were born and spent their childhoods in Poznań used more
local words, but at the same time they saw themselves using fewer general Polish words. Those
born and raised outside the city reported using slightly more mainstream Polish words, than the
natives. Furthermore, the longer one lives in the city, the more inclined to use Poznań words one
is. However, the percentages are similar between the groups.
Overall, if we wanted to describe speakers who perceive themselves the most as Poznań
speech users, we would have to say that they are between the ages of 31 and 45, male, who were
born, raised, and lived all their lives in the city. However, we need to keep in mind that those
characteristics have just slightly higher scores than the counterpart features.
The group who indicated use of words from Poznań or general Polish was asked to check
what type of social situations they use them in. The significance for both Poznań and general
Polish words was calculated for each demographic factor in conjunction with a social situation.

257
Although many observations were made about this significance in section 5.3., the most
important one is that there are perceived differences in use between social situations even as
general as formal, casual, and family situations. Nonetheless, once again the differences within
and between those groups should be considered as placed on a continuum with small changes
from one factor to another, not as an either/or distribution.
When age is considered, again the 31 to 45 year old group acts a little differently than the
others when it comes to Poznań words, while 46 to 60 year olds are oftentimes a special group
using general Polish words. Although there are no zero scores for any situations in any age
group, a tendency seemed to emerge in which the notion of usually and sometimes was in
opposition to humorously.2
One general trend involving gender was that females perceived themselves using Poznań
and general Polish words more in the usually category. Men on the other hand, more often
Although those categories were not originally set up to serve such a
purpose, it seems that this is how the speakers perceived them. For example, in casual situations
the proportion between the two youngest groups of speakers and the two oldest groups is
reversed in the usually and humorously categories. What needs to be noted is that usually and
sometimes categories are similar to each other, and although some differences in percentage
scores appear across factor groups, they are not great. Once again, those two notions seem to live
on a continuum. Humorously, on the other hand is a qualitative measure while usually and
sometimes are quantitative. Therefore, the special qualitative use rises to the same scale of
responses as the quantitative measures. We can also add one more dimension to the humorously
response as being quantitative in nature, as speakers use humor less often than usually and
sometimes. This way humorously can have a similar nature to the other two categories.
2 Since the choices for the frequencies were given in such a manner that there was only one choice, their scores are inherently interconnected. However, the pattern which emerged shows the shape of the perception of the respondents.

258
reported using those words sometimes. Once again the difference in percentages was small.
Another interesting relation was observed regarding place of birth and childhood. Namely, those
individuals born and raised in Poznań saw themselves using Poznań words in formal situations
usually or sometimes, while non-native Poznanians reported humorously usage more. On top of
that, natives of the city thought themselves less likely to use general Polish words in formal
settings than those not brought up in Poznań.
The interesting observation that this part of the study elicited was the fact that some
patterns did not comply with the research previously conducted, and new insights were added to
it. More demographic categories describing people who took part in this task were significant
than in the previous study (Witaszek-Samborska 1987, 1999). Subjects reported using Poznań-
specific words in all social situations, with all given frequencies across the spectrum of
demographic factors. The differences between the percentages given in the tables were small,
and the difference between the highest and the lowest scores in any factor group was no more
than 20%. This type of distribution indicates that the perception of usage of both groups of words
is a continuum. How much this perception is a reflection of the actual usage can only be
determined by comparing it to actual recorded speech, which was the aim of the last task
presented to the subjects.
7.3. THE LINGUISTIC INTERVIEW.
Linguistic interviews were conducted to create a tool that would provide perspective for
the perceptual part of the study. Eight interviews were conducted, and although they did not
render as much data as the perceptual tools, interviews were still a useful way to analyze what
people in Poznań actually say. The analysis of the corpus created out of the transcripts revealed
interesting patterns. First and foremost what needs to be emphasized is that every single subject
259
used some Poznań words in both parts of the interview, the conversational and elicitation
sections. There were more tokens of Poznań words in the conversational part, and interestingly
enough each part had its own word types, with a marginal overlap. Analysis of the top ten nouns
for each conversation revealed that the subjects talked a lot about Poznań, family, and education,
but also each participant reflected his or her own special interest in the frequency of the nouns
used during the interview. The emergence of such a pattern was heavily influenced by the
protocol questions asked. However, although speakers were asked the same questions, they still
showed variability in the responses, hence the top ranked words did not match completely
between speakers.
When Poznań words occurring in this part of the interview were grouped into semantic
and grammatical categories, they revolved around food, people, family, and Poznań. The
grammatical category of verbs did not have any one specific commonality; instead it covered
everyday life. The top Poznań words which showed up at the top of the A-curve are those that
should be considered the marked features of Poznań speech. Some of them are present in the
dictionary (Gruchmanowa et al. 1999), but some of them are only found in more obsolete
sources. It seems that the set of words which emerged as the most common Poznań words is not
completely overlapping with the most common lexical items proposed in previous research
(Witaszek-Samborska 1987). Another interesting finding was that in the conversational part of
the interview the word gzik ‘cottage cheese dish’ appeared only once. But when the same word
was elicited in the last part of the interview, it was the only one that every informant knew. This
type of distribution does not show that the word gzik is absent in the speech of Poznań residents,
but that the topics discussed during the interview did not facilitate this word use. So, marked
260
features in Poznan speech appear to come in two kinds, those that people use most often across
text types and topics, and those that may not be very common but are closely associated with
Poznan for a specific text type or topic.
The elicitation part of the conversation revealed that the informants were aware of
Poznań words, but they produced them at lower rates3
7.4. TWO SIDES OF THE SAME COIN.
than the questionnaire respondents
perceived them to exist. Such a direct comparison between the items used and perceived leads to
the discussion of the importance of the connection between speech perception and production
and the eventual construction of a model that accounts for the interaction between these two
components of language behavior.
As mentioned before, the goal of this dissertation was to explore the production and
perception of Poznań speech. Chapters 1, 2, and 3 outlined the reasons why I chose to use
linguistics of speech as my theoretical framework, since the previous research in Poznań and in
perceptual dialectology did not provide me with satisfactory interpretation of methods. My
findings are different from those published by Witaszek-Samborska (1987), a study conducted
twenty years ago. This in turn may indicate that we are witnessing a change in the attitude
toward Poznań’s local speech. We should keep in mind that when Witaszek-Samborska (1987)
was conducting her research, the political, economic, and cultural situations in Poznań, and the
whole country, were very different. Communism was still strong, and uniformity in every aspect
of life was an ideology forced upon Polish citizens for decades. The situation has changed
tremendously. Now as a democratic and free country we can enjoy whatever differences we
want; this new way of life facilitates closer community ties and promotes local pride. However,
3 There is no way to assert that just because the informants did not produce a certain target word, they do not use it in their life.

261
probably the biggest difference between this study and Witaszek-Samborska (1985, 1987, 1998)
is the recognition that the methodology used serves a different purpose. She thought that her
tools were measuring speech production while actually, because they relied only on self reports
of speech, they were measuring perception. I chose to use the questionnaire method as a way to
measure perception and not speech production. Although Preston’s (1989) “draw-a-map” method
is undoubtedly the foundation of what we know today about speakers’ perceptions of speech,
there were a lot of assumptions about speech production which influenced the interpretation of
the results. The linguistics of speech was presented as the model that can account for and explain
the relationship between speech production and perception. One of my favorite metaphors used
by Kretzschmar (2009) is a description of the relationship between the linguistics of speech and
the linguistics of linguistic structure being two sides of one coin. As an extension, I would like to
transfer this metaphor to the relationship between speech production and speech perception.
The sections above presented the results of each task separately, and that gave us a view
of perception and production patterns independently, as a head or tail, hence the metaphor. As
we have seen, perception had a strong presence in both perceptual tasks; subjects had no trouble
assigning their perceptions to the maps and filling them in the questionnaire form. The
perceptual maps revealed that people do associate speech with geographical location.
Furthermore, as the linguistics of speech asserts, the perceptual data follows the A-curve
distribution, in which the highest and the lowest values reside in the two ends of the curve. The
high scores are the darkest areas on the maps and indicators of shared cultural schemas. It can be
suggested that as linguistics of speech predicted, the results indicated that people did not keep
information about language separate from non-linguistic information: linguistic and non-
linguistic schemas that overlap are based on the notions that a majority of individual speakers

262
learn through the course of their lives because they are participating in a shared culture. The
highest frequency labels associated with the cultural schemas present on the map of Polish
speech varieties suggest that, what people know about speech is not linguistic but instead is
knowledge gained in school, or more generally because of living in Poland, since they gave
geographical names the most. However, until further research is conducted in which the
instruction question could be given in a reversed order, those observations are preliminary.
This observation opens the door for an interpretation in which subjects created schemas
for the labeling of speech varieties using geographical knowledge, as their awareness of
linguistic details was scarce or non existent. When the labels for the Poznań map were analyzed,
the administrative name divisions were at the top of the A-curve distribution, displaying a similar
trend. The perceptual map of Poland can reveal even more about our perceptions of speech when
compared to the traditionally drawn isoglosses attributed to speech production. The two maps are
shown in Figure 7.1. and 7.2. below.

263
Figure 7.1. Production division of Polish dialects (Urbańczyk 1962).

264
Figure 7.2. Perceptual view of all of the results in 2D.
When we compare those two maps we can see that the areas of high level of agreement
on the two maps do not match. However, when we look at the area covered by low level of
agreement we can see more similarities between the two maps. This suggests that the production
isoglosses of the traditional map are not entirely created based on speech production but are
partially a manifestation of researchers’ perceptions based on limited production input.
Moreover, production isoglosses are not in line with the premises in linguistics of speech. Speech
behavior seen as continuum cannot be discussed very well as boundaries of words or dialect, and

265
that is what the isoglosses proposed. The perceptual map of Poland shows the continuous
behavior of our perceptions and offers an alternative view on what we know about speakers’
behavior.
Moreover, the claim made by Kretzschamar (2009), in which individuals are inherently
variable and therefore we can never be fully satisfied in trying to find a consensus in perception
patterns, is clearly seen in the data and the comparison above. As opposed to Preston’s (1989)
results, this study shows that if we do not use generalizations in the presentation of the results,
what we really are looking at is the amount of disagreement between the individual speakers.
Each person creates schemas based on their personal experiences. Some of those experiences are
shared by people, as we attend the same schools, read the same books, watch the same movies,
and speak to the same people, among other factors. The fact that those experiences are highly
variable plays a role in creating a definite image of an entity, such as a “speech variety.” This
high level of variability in our cognitive schemas is translated into vast areas of very high
disagreement about those “speech variety” locations. By the same token, some schemas are
partially shared since they are cultural in nature. The shared cultural schemas connected to the
perception of Polish speech varieties are translated into high level of agreements about areas
having some sort of speech variety associated with them. The issue here is not whether those
schemas are discontinuous, like in the study presented by Tamasi (2003), or more like the circles
created by a gestalt mechanism. Instead, it emphasizes the issue that people do not agree with
each other very much in their perceptions of speech, as opposed to the generalizations that give
the impression of agreement as presented in Preston (1989). And lastly, the more people agree on
an area having some sort of “speech variety” present, the more restricted such an area is. This
pattern was displayed on every single results map.

266
As Kretzschmar (2009) emphasizes, since perceptions are based on incomplete
information, they can only reflect reality to some degree. Therefore, even though the Kashubian
variety was recognized by a majority of speakers, its placement does not reflect the exact
physical area where people who identify themselves as speakers of this variety actually live. The
lack of a one-to-one correspondence between perception and reality was seen even more
drastically in the epicenter of the South where two adjacent areas were named interchangeably as
one, and the area indicated by the highlanders’ place of living moved from one end of the belt of
agreement to another in the subsamples. This indicates that most of the speakers had some sort of
perception of a speech variety for the highlanders (or Kashubians), but their ideas of where
exactly such a variety is spoken was variable, and only when aggregated together did they show
up as a large area of high level of agreement.
Another issue discussed in linguistics of speech was scale. We have seen in the results
maps that if we look at the subsamples, the result maps are similar. However, each one is
slightly different and is not an exact replica of the other. The same goes for each individual map
used in the process. The feature of scale as asserted by Kretzschmar (2009) tells us that although
we can zoom in and out of the data with the distribution shape constant, we cannot predict one
level from another. Such a claim can be seen if we compare the results maps of Poland and
Poznań. On the map of Poland, the Poznań speech variety was confirmed across the whole
sample and subsamples, and nowhere did it fall below the 70% to 80% of agreement range.
There is no way we could have predicted that only 16% of the same respondents would indicate
any difference in the speech within the city limits. Just as well, we were not able to predict how
the national preference would look like from the Poznań map.

267
In the interpretation of results from the other perceptual task, further claims of the
linguistic of speech were confirmed. First of all, speakers’ behaviors regarding the way they see
themselves using Poznań and general Polish words appeared to be a continuum. Multiple factors
were significant. But when the distribution within them was explored, it was clear that the
differences were small. Therefore, we can talk about the tendencies of groups of speakers more
than any clear-cut oppositions or boundaries between groups. This is the type of distribution that
we should expect under the provisions of linguistic of speech, in which not only speech
production but also perception is seen as a serious of continuous behaviors. The differences
between groups of subjects can be attributed to the inherent variability of speakers in their
experiences, as aforementioned, and the various input results in different shapes of perceptual
schemas. Such a mechanism was seen in the behavior of the 31 to 45 year olds who differed
slightly from other groups across factors for Poznań words, or the 46 to 60 year olds who showed
themselves as a special group when using general Polish words. Moreover, the frequency
categories in social situations displayed similar characteristics in which the scores received were
alike, but there seemed to be a different nature of schema employed when it comes to the
frequencies of usually, sometimes, and humorously. As much as usually and sometimes were
perceived in an almost the same manner, humorously played the role of a differentiator. It can be
seen in one of the examples in the reported behavior of informants who were native born and
non-native born in Poznań where the latter group asserted the most usage of Poznań words in
formal situations as humor but not the other categories, while the other group’s behavior was
opposite. Overall, the behavior reported by the respondents in the questionnaire appeared to be a
continuum in which various cultural and individual schemas were used, as outlined by linguistics
of speech.
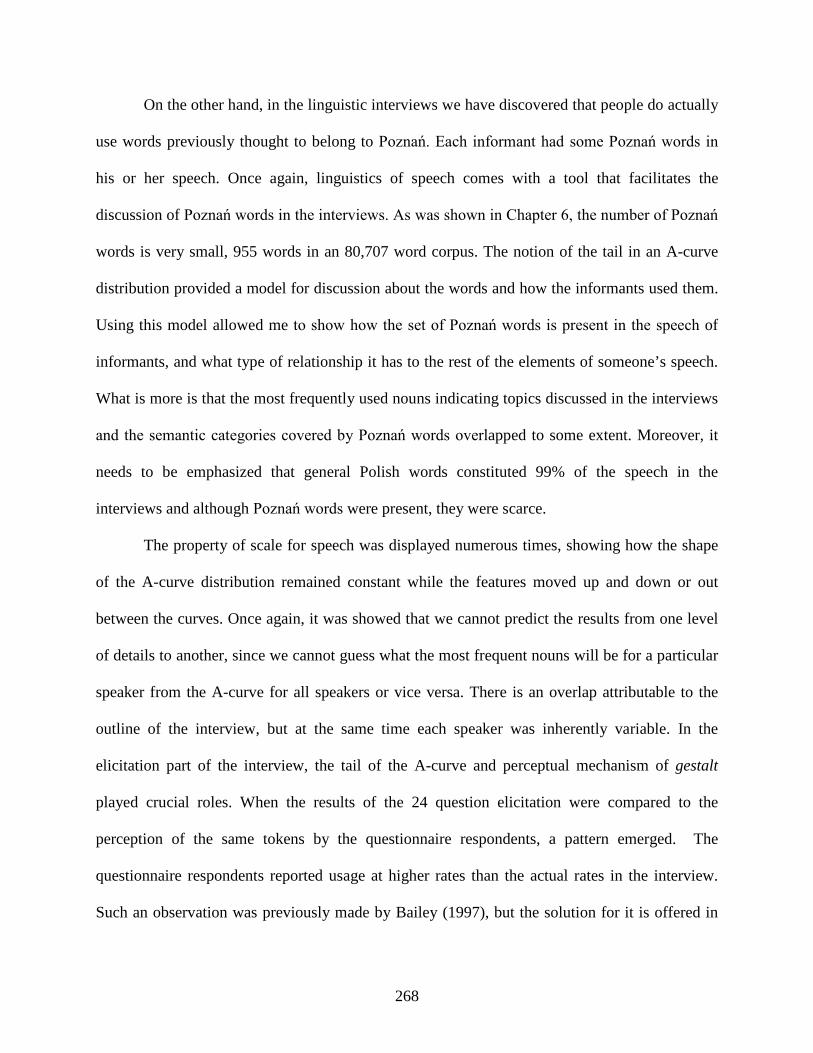
268
On the other hand, in the linguistic interviews we have discovered that people do actually
use words previously thought to belong to Poznań. Each informant had some Poznań words in
his or her speech. Once again, linguistics of speech comes with a tool that facilitates the
discussion of Poznań words in the interviews. As was shown in Chapter 6, the number of Poznań
words is very small, 955 words in an 80,707 word corpus. The notion of the tail in an A-curve
distribution provided a model for discussion about the words and how the informants used them.
Using this model allowed me to show how the set of Poznań words is present in the speech of
informants, and what type of relationship it has to the rest of the elements of someone’s speech.
What is more is that the most frequently used nouns indicating topics discussed in the interviews
and the semantic categories covered by Poznań words overlapped to some extent. Moreover, it
needs to be emphasized that general Polish words constituted 99% of the speech in the
interviews and although Poznań words were present, they were scarce.
The property of scale for speech was displayed numerous times, showing how the shape
of the A-curve distribution remained constant while the features moved up and down or out
between the curves. Once again, it was showed that we cannot predict the results from one level
of details to another, since we cannot guess what the most frequent nouns will be for a particular
speaker from the A-curve for all speakers or vice versa. There is an overlap attributable to the
outline of the interview, but at the same time each speaker was inherently variable. In the
elicitation part of the interview, the tail of the A-curve and perceptual mechanism of gestalt
played crucial roles. When the results of the 24 question elicitation were compared to the
perception of the same tokens by the questionnaire respondents, a pattern emerged. The
questionnaire respondents reported usage at higher rates than the actual rates in the interview.
Such an observation was previously made by Bailey (1997), but the solution for it is offered in

269
linguistics of speech: namely, words in the tail of the A-curve. Those words with low frequencies
are very often one-time occurrences and are still perceived by the speakers as present in their
speech and that of others. The A-curve distribution allows for some variants to be categorized as
normal based on the top ranked items, and other type of categories based on the items in the
other parts of the curve. Now, when presented with an opportunity to evoke such a perception
(while filling in the questionnaire), the gestalt mechanism helps to fill in the missing gaps with
other information available about the concept in question. This mechanism allows the speakers to
see themselves more often than not as using Poznań words. We should remember that the answer
was given on the screen during the online questionnaire, so the informants did not have to come
up with the Poznań or general Polish word on their own. The situation is different for an
interview, in which an informant is only given a definition and has to pull out of his or her
memory some answer. Here, the A-curve also is present, and that is why there were multiple
answers to one question, depending on which A-curve speakers decided to employ, the one for
Poznań words or general Polish words only or a mix of the two. However many words that
informants were able to recall in direct questioning, Poznań words were still a small fraction in
the whole body of the interview. Therefore, the answers mostly remain in the tail of the A-curve
created out of the whole interview. We can see on the example of gzik ‘cottage cheese dish’ how
the type of the topics, or in other words the text types (the recurrent situations which each have
their own frequencies of use of linguistic characteristics), plays a crucial role in the kind of
words we hear people use. In the conversational section, the word gzik was used once, because
although there was a lot of discussion about food, it was connected with special occasions like
Christmas or Easter. Gzik is not a special dish. It is an everyday meal. On the other hand, when
this word was elicited in the interview, it was the only item that every informant used. We can

270
see that here perception played its role, as the definition for the dish was immediately obvious to
the informants, and sometimes I did not even had to finish saying the definition before the
answer was given. Gzik proved to have a strong presence in the perception of the informants, but
not in the speech production. If the topics during the interview were different and involved
talking about typical everyday food, the frequency of it would be higher. What needs to be
emphasized here is that this type of relationship tells us that both sides of speech are not
categorical; they are more or less type of entities. We have seen that although gzik is the one
lexical item recognized by everyone, all of the informants differed in the number of local items
they were uttering. There are no clear cut boundaries that we could draw. For example, “women
say gzik”, or “the oldest members of the community use Poznań words”. What we are looking at
is a behavior as a continuum in which some informants used more local words and some of them
used less. This example is the beginning of many interconnections between speech perception
and production. So far, we have seen the two sides separately, and explanations for their
mechanics were offered. However, just like for the coin metaphor, only when the two sides are
connected is when the stamped piece of metal becomes a coin and embodies the power of
currency.
There are multiple processes accounting for the connection between these two linguistic
processes. For one, linguistics of speech tells us that speech operates based on the A-curve
distribution, and the top-ranked variants receive the status of usual or normal. However, we need
to keep in mind that the subjects’ minds can have multiple A-curves on different scales. We have
seen the A-curves in the analysis of every part of the research and on different scales. What the
data shows us is that there is an A-curve for the speech of Poznań, which exists as the tail of the
curve for general Polish words. Out of those A-curves, schemas are being created for the whole

271
spectrum, from usual to rare for various situations. We have seen that in every social situation
and for every relative frequency there were answers given; some of them had high frequencies
residing on the top of the curve and some of them were one-time occurrences in the tail. No
matter where they were located, these lexemes were present in the speech production and
perception. Now, having those A-curves in our minds, whether for general Polish or local speech
or both, we can create something out of them in order to categorize and understand the world.
This process employs the gestalt mechanism and produces a configurational object, called
observational artifact. As explained by Günther (et al.1996), an observational artifact invokes
the notion that an object can be created out of ideas or perceptions. In this case, subjects created
an observational artifact named “Poznań speech” out of incomplete information, based on the
Poznań items present in the tail of an A-curve, and other experiences in the community. In this
way “Poznań speech” becomes an object that can be put on a map, as was seen in the results of
the perceptual maps. Each subject can decide how much he or she wants to participate in this
activity. If we look at the process of creating the observational artifact in this research, it can be
shown to start in the interviews. Every person used some Poznań words, and those words mostly
showed up in the tail of an A-curve of their overall word usage. On top of that, when asked about
specific tokens from the local vocabulary, informants used almost half of the targeted items. In
contrast, when respondents were confronted with the same 24 items on the computer screen with
the definition and an answer, they created a complete image of themselves using such lexical
items. This image was connected with various social situations and made out of incomplete
information for low frequency words. This resulted in a higher percentage of perception for the
specific group of Poznań words than in the actual usage. The process does not end here as
respondents not only created an image of themselves using Poznań words, but they went a step

272
further and used schemas and gestalt mechanisms and created observational artifacts. Thus the
schema provided a framework for “Poznań speech” slots for features, as for example: place,
speakers, vocabulary. This partial information was completed by using a gestalt mechanism
through guessing, assuming, and approximation in order to achieve an answer to complete the
questionnaire. Now, the situation arises in which subjects assume that since there is such an
entity as “Poznań speech,” which they created in their minds, there must be speakers of it—along
with location, vocabulary, and other features that they see to be important. Such a manifestation
of observational artifacts was seen on the perceptual maps where the schema of “Poznań
speech” received a particular geographical location designated by lines or shading, a name, and a
description of their speakers. Moreover, as was indicated earlier, since the labeling practices are
scarcely linguistic, they show us how much more information than just speech surrounding us we
integrate in those cognitive mechanisms. Now, the last link from perception back to production
can be seen in the fact that when enough speakers create an observational artifact of Poznań
speech with positive intentions, this may in turn lead to more actual usage of Poznań words.
Such a positive attitude is present in the results presented in the questionnaire where 66% of
Poznań words were reported as used by highly educated speakers. To some extent a comparison
between the results of Witaszek-Samborska (1987) and the ones provided here can suggest that
there might be a change in attitude toward the local speech and the frequency of use happening
in this area. Another explanation can be suggested by Bailey (1997), where he observes that self-
reported method can indeed be more accurately depicting real usage of rarely occurring words.
In this case, Poznań words are such low frequency words residing in the tail of the speakers’ A-
curve speech. In the end, connecting the two sides of one coin showed us that perception has its

273
roots in production and perceptions are not created out of nothing: people actually use some
Poznań words, which in turn can amplify the amount of words being used in the local
community.
Here the process of enregisterment is fully addressed. Johnston at el. (2006, 2009)
documents the process of enregisterment in which linguistic features originally connected with a
social class were transferred to a place to indicate local pride in the speech of Pittsburgh.
However, in the original thesis the issue of very limited input to create local pride of the
community based on speech was never fully explained. Now, if we think about the
enregisterment model as creating a schema of “Poznań speech” using gestalt mechanisms based
on the low frequency items from the tail of A-curve distribution, we can see how linguistics of
speech offers a solution. On top of that, when a schema is invoked and is then perceived as an
observational artifact of “Poznań speech,” the assumption is that there must also exist speakers
and vocabulary items of such a construct. Therefore, it only takes a word or a few of those
considered to be Poznań-specific uttered by a speaker to be perceived by others as belonging to
the group of “Poznań speakers”.
To come back to the metaphor, both sides of human behavior, such as speech, are
inseparable like the two sides of the coin. One cannot exist without the other and loses its
meaning when separated from its complement. Both sides are important, and when they are
treated separately it shows us something about people’s speech behavior, just like the two
opposing sides of a coin. However, only when both sides are considered together are they able to
reveal deeper meanings about why we say what we say and why we do not. The relationships
connecting them together are complex and need more research to reinforce the claims proposed
here.

274
Future research could be directed toward collecting even more production data to
establish a stronger basis for comparing speech with perception. Moreover, the perceptual
questionnaire has been analyzed from the perspective of speakers’ characteristics. However, in
future research the perspective can be reversed to look at the specific words and describe which
were perceived to be used by the speakers in the relationship to the items produced in speech.
When it comes to perceptual maps, we definitely need more data from other parts of Poland to
see if the perceptions are dramatically different or similar in the minds of people from the other
regions. It would also be interesting to see if residents of other cities have perceptions about
differences in speech within those cities or smaller regions, especially, those areas that received
such high recognition on the map like Katowice or the mountain area. Also, there is the
opportunity for research regarding the low dome of agreement around Warszawa, which remains
a puzzle at this stage of analysis. It is surprising that this city, the biggest city in Poland, which is
closer than the mountain region, received such a low level of agreement that there was a dialect
there. The three factors of population size, distance, and information are crucial in establishing
the strength of perception of a place (Kretzschamar 2009, Gould and White 1986), but they do
not explain why Warszawa was not recognized at least as much as the Kashubian region.
Therefore, more data needs to be gathered to see if this tendency is common around the country
or not. Venturing into various parts of Poland would allow for a more comprehensive image of
speech perceptions in the country and establish a base for comparison, so the following puzzle
could be solved. After the presentation of a paper4
4 Paper entitled “Perception and production of dialect in Poznań” presented during 40th Poznań Linguistic Meeting, September 2-5 2009, Poznań, Poland.
concerned with preliminary findings from this
study, more specifically the perceptual maps, I was approached by Dennis Preston, and he asked

275
me, “Where is the Eastern dialect?5
The research indicated that the speech in Poznań is a complex entity and is not easily
quantifiable. From one tool to another new dimensions of speakers’ behavior were revealed. The
relationship between what people say and how they see themselves using Poznań speech
emerged as multidimensional. Poznań respondents showed that they not only care about their
local speech, but also use it in their life. The methods of linguistics of speech allowed for an in-
depth treatment of both facets of the speech behavior. It also offered alternative ways of
conducting research in linguistics, successfully used in other parts of the humanities.
I was convinced that people will indicate the Eastern dialect
on the map. Interesting.” I was too, but it is not there.
5 The dialect that he was referring to is perceived as connected with the area of Eastern Poland occupied by the Russian empire in the 18th century. The influence of Russian in that area is perceived to have carried on until the present.

276
BIBLIOGRAPHY
Adams, Michael. “Enregisterment: A Special Issue.” American Speech 84.2 (2009):115-
118.Print.
Anderson, Wendy June. Rev. of The Linguistics of Speech, by William Kretzschmar. Linguist
List 20.3995 (2009).Print.
Aristotle. The Categories. The Complete Works of Aristotle, The Revised Oxford Translation.
Ed. J.Barnes. Trans. J.L.Acrill. Princeton, NJ: Princeton University Press, 1984.3-
24.Print.
Bailey, Guy, and Tom Wikle and Jan Tillery. “The effects of methods on results in
dialectology”. English World-Wide 18:1 (1997):35-63. Print.
Baker, Paul. Using corpora in discourse analysis. London, New York: Continuum, 2006. Print.
Barford, P.M. The Early Slavs. Ithaca, New York: Cornell University Press, 2001. Print.
Beal, Joan C. “Enregisterment, Commodification and Historical Context: “Geordie” versus
“Sheffieldish””. American Speech 84.2 (2009):138-157.Print.
Biliński, Józef. Błędy językowe [Lingustic errors]. Poznań: PWN, 1992.Print.
Biskupski, M.B. The History of Poland. Westport, Connecticut: Greenwood Press, 2000. Print.
Chambers, J. K. Sociolinguistic theory. 2nd ed. Oxford: Blackwell,2003.Print.
---. “Canadian raising.” Canadian Journal of Linguistics 18(1973):113-135.Print.
Chomsky, Noam. Aspects of theory of syntax. Cambridge MA: MIT Press,1965.Print.
Davies, Norman. God’s Playground. History of Poland in two volumes. Volume I. The Origins to
1795. New York, NY: Columbia University Press, 1982.Print.

277
---. God’s Playground. History of Poland in two volumes. Volume II.1795 to the Present. New
York, NY: Columbia University Press, 1982.Print.
Eckert, Penelope. Linguistic Variation and Social Practice. Oxford: Blackwell,2000.Print.
Evans, Vyvyan, and Melanie Green. Cognitive Linguistics: an Introduction. Edinburgh:
Edinburgh University Press, 2006.Print.
Feagin, Crawford. Variation and change in Alabama English. Washington, D.C.: Georgetown
University Press, 1979.Print.
Gould, Peter, and Rodney White. Mental Maps. 2nd ed. Boston: Allen & Unwin,1986.Print.
Grice, Paul. Studies in the Way of Words. Cambridge, MA: Harvard University Press,1989.Print.
Gruchmanowa, Monika, and Bogdan Walczak. Słownik Gwary Miejskiej Poznania [The
Diccionary of Urban Speech of Poznań]. Poznań: PWN,1999.Print.
Gruchmanowa, Monika, Małgorzata Witaszek-Samborska, and Małgorzata Żak-Święcicka.
Mowa Mieszkańców Poznania[The Speech of Poznań Residents]. Poznań: Wydawnictwo
Poznańskie, 1987.Print.
Günther,R.,L.Levitin, B.Schapiro, and P.Wagner. “Zipf’s Law and the Effect of Ranking on
Probability Distributions.” International Journal of Theoretical Physics 35(1996):395-
417.Print.
Heath, Shirley Brice. Ways with Words: language, life and work in communities and classrooms.
New York: Cambridge University Press,1983.Print.
Hoenigswald, Henry.1966. “A Proposal for the study of folk-linguistics.” Sociolinguistics. Ed.
William Bright. The Hague: Mouton,1966.16-26.Print.

278
Horvath, Barbara, and Ronald Horvath. “A Multilocality Study of a Sound Change in Progress:
The Case of /l/ Vocalization in New Zealand and Australian English.” Language
Variation and Change 13(2001):37-58.Print.
----.“A Closer Look at the Constraint Hierarchy: Order, Contrast and Geographical Scale.”
Language Variation and Change 15(2003):143-170.Print.
http://en.kaszubia.com/kashubians/history/maps
http://linguistlist.org/pubs/reviews/get-review.cfm?SubID=2228417
http://miasta.gazeta.pl/poznan/1,36004,97846.html
http://pl.wikipedia.org/wiki/Wikipedysta:Radomil/Galeria_Radomi%C5%82a_1
http://www.bibliotekawszkole.pl/inne/gazetki/71/index.php
http://www.man.poznan.pl/~m02_001/konkurs/gwara.htm
http://www.poznan.pl
http://www.poznanczyk.com/index.html
http://www.republika.pl/ulapok/gwarapoz.html
http://www.staypoland.com/miasta.htm
http://www.tutej.pl/cms.php?i=8382
http://www.kasprzyk.demon.co.uk/www/history/PostWar.html
http://www.gwarypolskie.uw.edu.pl/index.php?option=com_content&task=view&id=28&Itemid
=56
Jackendoff, Ray. Semantics and Cognition. Cambridge, MA: MIT Press,1983.Print.
Johnstone, Barbara, and Scott Kiesling.2008. “Indexicality and Experience: Exploring the
Meanings of /aw/-monophthongization in Pittsburgh.” Journal of Sociolinguistics
12(2008):5-33.Print.

279
Johnstone, Barbara, Jennifer Andrus, and Andrew E.Danielson. ”Mobility, Indexicality, and the
Enregisterment of “Pittsburghese”.” Journal of English Linguistics 34.2(2006):77-
105.Print.
Johnstone, Barbara. “Pittsburghese Shirts: Commodification and the Enregisterment of the Urban
Dialect.” American Speech 84.2(2009):157-176.Print.
Kant, Immanuel. Critique of Pure Reason. Trans. N.K.Smith. London: Macmillian,
(1781)1929.Print.
Kennetz, Keith E. “German and German Disunity: An Investigation into the Cognitive Patterns
and Perceptions of Language in Post-Unified Germany.” Diss. University of
Georgia,2008.Print.
Kretzschmar, William A., Claire Andres, Rachel Votta, and Sasha Johnson. Roswell Voices I and
II. Atlanta: Roswell Folk and Heritage Bureau,2006.Print.
Kretzschmar, William. The Linguistics of Speech. Cambridge: Cambridge University
Press,2009.Print.
---.Forthcoming. ”Language and Region.” The Cambridge Handbook of Sociolinguistics. Ed.Raj
Mesthrie.2010:1-32.Print.
Kurath, Hans. A Word Geography of the Eastern United States. Ann Harbor: University of
Michigan Press,1949.Print.
Labov, William, Paul Cohen, and Clarence Robins et al. “A study of non-standard English of
Negro and Puerto Rican speakers in New York City. Final report.” Co-operative
Research Report 3288, vol.I. US Regional Survey,1968.Print.
Labov, William. Sociolinguistic Patterns. Philadelphia: University of Pennsylvania
Press,1972.Print.

280
---. “The boundaries of words and their meanings.” New Ways of Analyzing variation in English.
Eds.C.-J.Bailey and R.W. Shuy. Washington, DC: Georgetown University
Press,1973:340-73.Print.
---. Principles of Linguistic Change. Vol 1. Cambridge: Blackwell,1994.Print.
---. Principles of Linguistic Change. Vol 2. Cambridge: Blackwell,2001.Print.
---. The Social Stratification of English in New York City. Arlington, VA: Center for Applied
Linguistics,1966.Print.
Ladd, Florence.1967. “A Note on ‘the World Across the Street’.” Harvard Graduate School
Regional Studies 12(1967):47-8.Print.
Lakoff, George. Women, Fire, and Dangerous Things: What categories Reveal about the mind.
Chicago: University of Chicago Press,1987.Print.
LaPage, R.B., and Andrée Tabouret-Keller. Acts of Identity. Cambridge: Cambridge University
Press,1985.Print.
Lorentz, Friedrick, Adam Fischer, and Tadeusz Lehr-Spławiński. The Cassubian Civilization.
London: Faber and Faber Limited, 1935.Print.
Macaulay, Ronald. English with and accent. London and New York: Rutledge,1977.Print.
Mandelbrot, Benoit. The Fractal Geometry of Nature. San Francisco: Freeman,1982.Print.
Mandler, George. Mind and Body: the Psychology of Emotion and Stress. New York:
Norton,1984.Print.
Milroy, James. Linguistic Variation and Change. Oxford: Blackwell,1992.Print.
Milroy, Lesley, and Gordon. Sociolinguistics. Method and Interpretation. Oxford:
Blackwell,2003.Print.

281
Milroy, Lesley. 1987. Language and social networks 2nd ed. Cambridge: Basil
Blackwell,1987.Print.
---. Language and Social Networks. Oxford:Blackwell,1980.Print.
Miodunka, Władysław. Language and Nation. Warszawa, Kraków: PWN, 1987. Print.
Nitsch, Kazimierz. Dialekty Języka Polskiego[Dialects of Polish Language]. Wrocław: Zakład
im. Ossolińskich,1915.Print.
Poplack, Shana, and Sali Tagliamonte.1989.”There’s no Tense Like the Present: Verbal –s
Inflection in Early Black English.” Language Variation and Change. 1.1(1989):47-
84.Print.
Popowska-Taborska, Hanna. Wczesne dzieje Słowian w świetle ich języka [ Early History of the
Slavs in the light of their language]. Wrocław: Zakład narodowy im. Ossolińskich, 1991.
Print.
Preston, Dennis, and Nancy A. Niedzielski. Folk Linguistics. New York: Mouton De
Gruyter,2000.Print.
Preston, Dennis. 1997. “The South: The Touchstone.” Language Variety in the South Revisited.
Ed.C. Bernstein, T. Nunnally, and R. Sabino. Tuscaloosa: University of Alabama
Press,1997:311- 351.Print.
---. Perceptual Dialectology. Nonlinguists’ Views of Areal Linguistics. Providence: Fortis
Publications,1989.Print.
Remlinger, Kathryn, Joseph Salmons, and Luanne von Schneidemesser. “Revised Perceptions:
Changing Dialect Perceptions in Wisconsin and Michigan’s Upper Peninsula.” American
Speech 84.2(2009):176-192.Print.

282
Remlinger, Kathryn. “Enregisterment in Michigan’s Keweenaw Peninsula.” American Speech
84.2(2009):118-137. Print.
Rosch, Eleanor. “Principles of categorization.” Cognition and Categorization. Eds. Eleanor
Rosch and Barbara B. Lloyd. Hillsdale, NJ: Lawrence Erlbaum Associates,1978:27-
48.Print.
Sankoff, David. “Problems of Representativeness.” Sociolinguistics: An International Handbook
of the Science of Language and Society.Eds. Ulrich Ammon, Norbert Ditmar and Klaus
J.Mattheier. Berlin: Walter de Gruyter,1988: 899-903.Print.
Saussure, Ferdinand de. Course in General Linguistics. Trans. Roy Harris. LaSalle, IL: Open
Court, (1916) 1986.Print.
Shuy, Roger, Walt Wolfram, and Riley William. Field Techniques in an Urban Language Study.
Washington, DC: Center for Applied Linguistics,1968.Print.
Shuy, Roger. Discovering American Dialects. Champlain IL: National Council of Teachers of
English,1967.Print.
Silverstein, Michael. “Shifters, Linguistic Categories, and Cultural Description.” Language,
Culture, and Society: A book of Readings, 2nd ed.. Ed. Ben G. Blount. Prospect Heights,
Ill: Waveland, 1995:187-221.Print.
Silverstein, Michael. “Indexicality Order and the Dialectics of Sociolinguistics Life.” Language
and Communication 23(2003):193-229. Print.
Tagliamonte, Sali. Analyzing sociolinguistic variation. Cambridge: Cambridge University
Press,2006.Print.
Tamasi, Susan. “Cognitive Patterns of Linguistic Perceptions.” Diss. University of
Georgia,2003.Print.
283
Tomaszewski, Adam. Błędy językowe uczniów poznańskich [Linguistic errors of Poznań
students]. Poznań: Język Polski,1927.Print.
Trudgill, Peter. The Social Differentiation of English in Norwich. Cambridge: University of
Cambridge Press,1974.Print.
Urbańczyk, Stanisław. Zarys dialektologii Polskiej[The Outline of Polish Dialectology].
Warszawa: Ossolineum,1962.Print.
Weinreich, Uriel, William Labov, and Marvin I. Herzog. “Empirical Foundations for a Theory of
Language Change.” Directions for Historical Linguistics. A symposium. Ed. W.P.
Lehmann and Yakov Maliel. Austin: University of Texas Press,1954:95-188.Print.
Witaszek-Samborska, Małgorzata, and Anna Piotrowicz. 1998.”Gwara poznańska w odczuciu
poznaniaków.[Poznań dialect in the attitudes of Poznań residents]”. Synchroniczne i
diachroniczne aspekty badań polszczyzny vol. IV: Materiały VI Kolokwium
Językoznawczego. Ed. Mirosława Białoskórskaj. Gniezno 26-28 września:
Szczecin,1998: 193 – 201. Print.
Witaszek-Samborska, Małgorzata.1985. „Regionalizmy fonetyczne w mowie inteligencji
poznańskiej.[Phonetic features of Poznań dialect in the speech of intelligentsia].” Slavia
Occidentalis XLII, 1985: 91 – 104.Print.
---. „Regionalizmy leksykalne w mowie inteligencji poznańskiej.[Lexical features of Poznań
dialect in the speech of inteligentsia].” Studia Polonistyczne XIV/XV, 1987: 335 –
347.Print.
Wittgenstein, Ludwig. Philosophical Investigations. Trans. G.E.M. Anscombe. Oxford:
Blackwell,(1953) 1968.Print.

284
Wolfram, Walt, and Shilling-Estes Natalie. “Moribund Dialects and the Endangerment Canon:
the Case of the Ocracoke Brogue.” Language 71(4)(1995):696-721.Print.
Zelinsky, Wilbur. The cultural geography of the United States. Englewood Cliffs, N.J.: Prentice
Hall,1992.Print.
Zipf, George. Human Behavior and the Principle of Least Effort. Cambridge, MA: Addison
Wesley,1949.Print.

285
APPENDIX A
PERCEPTUAL MAP TASK.
Badanie Lingwistyczne [Linguistic Survey]
Paulina Bounds
University of Georgia
Zgoda na udział w badaniu lingwistycznym.
Zapraszam Państwa do wzięcia udziału w badaniu naukowym zatytułowanym ‘Gwara poznańska’, przeprowadzanym przez Paulinę Bounds z Wydziału Językoznawstwa na University of Georgia (nr tel w USA +1404 232 0241) pod kierunkiem Dr Williama A. Kretzschmara (nr tel w USA +1706 542 2246). Celem tego badania jest wzbogacenie naszej wiedzy o języku i kulturze Poznania. W dłuższej perspektywie, może to przynieść większe zrozumienie społeczności poznańskiej, oraz roli, którą odgrywa w niej język. Jeśli chodzi o osobiste zyski dla Państwa, to mają Państwo okazję dowiedzieć się czegoś nowego o swojej mowie, gdy zapoznają się Państwo z wynikami tego badania. Badanie to będzie wykorzystane w rozprawie doktorskiej badaczki.Nie muszą Państwo brać udziału w tym badaniu. Mogą Państwo przerwać wypełnianie map w dowolnym momencie bez podawania powodu i bez żadnych konsekwencji. Wyniki badań będą upublicznione, w tym także opublikowane w Internecie. Chcę żeby wielu badaczy oraz zainteresowani językiem i kulturą Poznania mogli zapoznać się z wynikami tego badania. To badanie jest anonimowe i wypełnienie go zajmie Państwu około 15 minut. Nie powinni Państwo odczuwać żadnego dyskomfortu ani stresu w czasie badania. Nie ma również żadnego ryzyka związanego z udziałem w tym badaniu. Poprzez wypełnienie tych map zgadzacie się Państwo na powyższe warunki. Dodatkowe pytania lub problemy dotyczące Państwa praw jako uczestników badania prosimy kierować na adres: The Chairperson, Institutional Review Board, University of Georgia, 612 Boyd Graduale Studies Research Center, Athens, Georgia 30602-7411; Telefon (706) 542-3199; Adres E-Mail [email protected]
[Consent Letter for Map Survey You are invited to take part in a research study titled 'Gwara poznańska' (Dialect of
Poznan), which is being conducted by Paulina Bounds, of the Linguistics Department of the University of Georgia (404 232 0241) under the direction of Dr. William A. Kretzschmar (706 542 2246). This research will be used in the doctoral dissertation of the researcher. The reason for this research is to increase our understanding of the language and culture in Poznan. The research is not intended to benefit you personally. You do not have to take part in this study. You

286
can refuse to participate or stop taking part at any time without giving any reason and without penalty or loss of benefits to which you are otherwise entitled.The result of the survey will be made public, including publication on the Internet. I (Paulina Bounds) intend that researchers and members of the general public will be able to see the results of the survey, in order to learn more about the language and culture of Poznań. However, the results will not be individually identifiable. The survey will be anonymous; it should take you about 15 minutes to complete it. You should feel no discomfort during this study and there are no known risks for participation. Paulina Bounds and Dr. Kretzschmar will be happy to answer any further questions about the research that you may have, now or during the course of the project. By completing the survey you agree to the above terms.Additional questions or problems regarding your rights as a research participant should be addressed to The Chairperson, Institutional Review Board, University of Georgia, 612 Boyd Graduate Studies Research Center, Athens, Georgia 30602-7411; Telephone (706) 542-3199; E-Mail Address [email protected]]
1. Podaj proszę informacje o sobie:
Wiek: 18 – 30____ 31 – 40____ 41-50_____ 51-60_____ 60+______
Płeć: Mężczyzna______ Kobieta______
Wykształcenie: Podstawowe____ Średnie_____ Wyższe_____
Zawód wykonywany: ________________________________
Miejsce urodzenia __________
Gdzie spędziłeś/łaś większość dzieciństwa (do wieku dojrzewania)?
[1. Please give this information about yourself:
Age: 18 – 30____ 31 – 40____ 41-50_____ 51-60_____ 60+______
Sex: Man______ Female______
Education: Elementary____ High school_____ Higher_____
Occupation: ________________________________
Where were you born? __________
Where did you live through your childhood?]
2. Instrukcje:
Ludzie w różnych częściach Polski mówią w różny sposób. Zaznacz obszary na mapie Polski,
gdzie ludzie mówią inaczej. Jak nazywasz te obszary? Jak nazywasz ludzi, którzy tam mieszkają
i ich sposób mówienia? Jeżeli masz wiele określeń na obszar, ludzi lub ich sposób mówienia -
podaj wszystkie. Jeżeli ta mapa nie jest dość szczegółowa, narysuj dokładniejszą mapę (regionu,
miasta) na ostatniej stronie. Wszelkie komentarze zapisz proszę również na ostatniej stronie.

287
[2. Instructions:
It is known that in various parts of Poland people speak in different ways. Draw areas in Poland
where people speak in different ways and describe them. If you use more than one name, write
them all. If this map is not detailed enough draw another one on the last page . If you have any
comments, put them on the last page as well.]
Figure A.1. The perceptual map of Poland template.

288
3. Czy w różnych częściach Poznania ludzie mówią inaczej?Jeśli uważasz, że tak, to zaznacz na
mapie jak nazywasz te obszary oraz jak nazywasz ludzi, którzy tam mieszkają i ich sposób
mówienia.
[3. Do you think that people living in various parts of Poznań speak in different way?
If yes, please describe those areas and people who speak them.]
Figure A.2. The perceptual map of Poznań template.

289
4. Miejsce na komentarze i narysowanie dodatkowych map. [4. Please put your comments and draw any additional maps on this page.]

290
APPENDIX B
VARIOUS TECHNIQUES USED TO INDICATE SPEECH VARIETIES IN POLAND.
Figure B.1. Areas indicated by lines around them.

291
Figure B.2. Areas indicated by lines colored in Adobe Photoshop.

292
Figure B.3. Areas indicated only by labels. .

293
Figure B.4. Areas indicated only by labels colored in Adobe Photoshop.

294
Figure B.5. Areas indicated by mixed techniques.

295
Figure B.6. Areas indicated by mixed techniques colored in Adobe Photoshop.

296
Figure B.7. Areas indicated by shading.

297
Figure B.8.: Areas indicated by shading colored in Adobe Photoshop

298
APPENDIX C
EMAIL SEND OUT TO ASK FOR FILLING IN THE ONLINE PERCEPTUAL
QUESTIONNAIRE.
„Drodzy Państwo! Czy redyska jest smaczniejsza od rzodkiewki? Czy pyra jest
szlachetniejsza od pospolitego kartofla?Na te i inne pytania mogą sobie Państwo
odpowiedzieć wypełniając poniższą ankietę.A przy okazji pomożecie mi również
Państwo ukończyć studia:)Nazywam się Paulina Stelmach Bounds, a ta ankieta będzie
jednym z ważnych elementów mojej pracy doktorskiej o mowie poznańskiej, którą piszę
na University of Georgia w Stanach Zjednoczonych. Wcześniej ukończyłam studia na
UAM, teraz od dwóch lat przygotowuję dysertację. Proszę o wypełnienie ankiety, zajmie
to Państwu około 15 minut. Jeszcze dzisiaj wyślijcie również tego maila swoim
znajomym i pozwólcie im przy okazji znaleźć odpowiedź na odwieczne pytanie:
kawiorek czy kawiorka? Dziękuję bardzo za Wasz czas poświęcony na wypełnienie
ankiety i przesłanie maila znajomym.
Pyra Poznańska,
Paulina Stelmach Bounds
Proszę kliknąć w poniższy link: http://src.ibr.uga.edu/surveys/gwara/intro.htm”
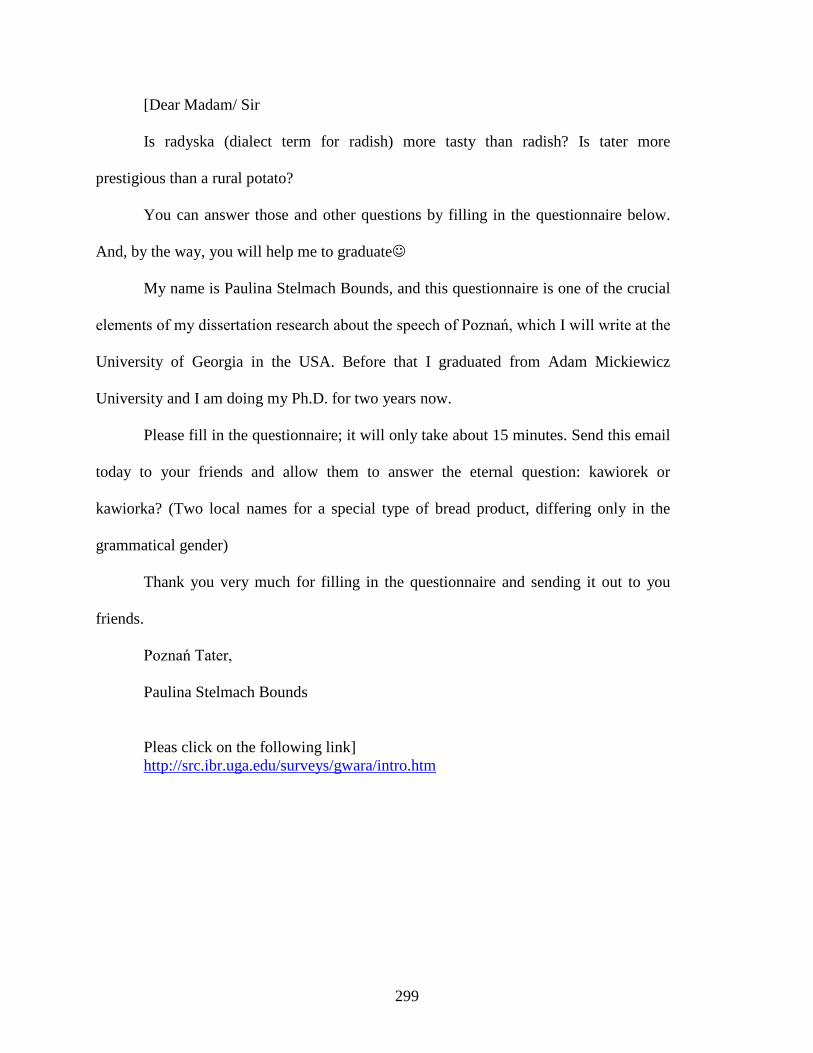
299
[Dear Madam/ Sir
Is radyska (dialect term for radish) more tasty than radish? Is tater more
prestigious than a rural potato?
You can answer those and other questions by filling in the questionnaire below.
And, by the way, you will help me to graduate
My name is Paulina Stelmach Bounds, and this questionnaire is one of the crucial
elements of my dissertation research about the speech of Poznań, which I will write at the
University of Georgia in the USA. Before that I graduated from Adam Mickiewicz
University and I am doing my Ph.D. for two years now.
Please fill in the questionnaire; it will only take about 15 minutes. Send this email
today to your friends and allow them to answer the eternal question: kawiorek or
kawiorka? (Two local names for a special type of bread product, differing only in the
grammatical gender)
Thank you very much for filling in the questionnaire and sending it out to you
friends.
Poznań Tater,
Paulina Stelmach Bounds
Pleas click on the following link] http://src.ibr.uga.edu/surveys/gwara/intro.htm

300
APPENDIX D
THE LIST OF POZNAŃ AND GENERAL POLISH USED IN THE PERCEPTUAL
QUESTIONNAIRE.
1.1Ajzol [metal item] 1.2.Metalowy przedmiot [metal item] 2.1.Akuratny [sharp] 2.2.Porządny [sharp] 3.1.Babol [buggy] 3.2.Gil[buggy] 3.3.Smark[buggy] 4.1.Badejki [swimsuit] 4.2.Kąpielówki [swimsuit] 5.1.Bana [train] 5.2.Pociąg [train] 6.1.Bejm [money] 6.2.Pieniądz [money] 7.1.Blubra [to talk nonsense] 7.2.Plecie trzy po trzy [to talk nonsense] 8.1.Brachol [brother] 8.2.Brat [brother] 9.1.Bręczy [ to nag] 9.2.Narzeka [to nag] 10.1.Bryle [glasses] 10.2.Okulary [glasses] 11.1.Chachmęci [to not tell the whole truth] 11.2.Nie mówi całej prawdy [to not tell the whole truth] 12.1.Chęchy [obscure places] 12.2.Zarośla [obscure places] 13.1.Chichrają się [to laugh] 13.2.Kielczą się [to laugh] 13.3.Śmieją się [to laugh] 14.1Chochla [ladle] 14.2.Łyżka wazowa [ladle] 15.1Churchla [to cough] 15.2.Kaszle [to cough] 16.1.Ćmik [cigarette] 16.2.Papieros [cigarette]

301
17.1.Drabka [ladder] 17.2.Drabina [ladder] 18.1.Drzaźni [to irritate] 18.2.Drażni [to irritate] 19.1.Dynks [a thing] 19.2.To coś [a thing] 20.1.Dziabka [mattock] 20.2.Motyka [mattock] 21.1.Farfocle [shreds] 21.2.Strzępy [shreds] 22.1.Febra [cold sore] 22.2.Opryszczka [cold sore] 23.1.Flepy [documents] 23.2.Dokumenty [documents] 24.1.Futrujemy [to feed] 24.2.Karmimy [to feed] 25.1.Fyrtel [surroundings] 25.2.Okolica [surroundings] 26.1.Mamy galara [to be afraid] 26.2.Boimy się [to be afraid] 27.1Galart [boiled meat and gelatin] 27.2.Galaretka z mięsa [boiled meat and gelatin] 28.1.Gilganie [to tickle] 28.2.Łaskotanie [to tickle] 29.1.Gira [leg] 29.3.Noga [leg] 30.1.Glajda [mud] 30.2.Błoto [mud] 31.1.Gorąc [hot] 31.2.Upał [hot] 32.1.Do góry [upstairs] 32.2.Na górę [upstairs] 33.1.Gwiazdor [Santa Clause] 33.2.Święty Mikołaj [Santa Clause] 34.1.Gzik [cottage cheese with green onions] 34.2.Gziczek [cottage cheese with green onions] 34.3.Ser z warzywami [cottage cheese with vegetables] 35.1.Hajtają [to get married] 35.2.Pobierają [to get married] 36.1.Jabzo [apple] 36.2.Jabłko [apple] 37.1.Kapnął [to understand] 37.2.Zorientował [to understand] 38.1.Kanar [controller] 38.2.Kontroler [controller] 39.1.Katana [jacket]

302
39.2.Kurtka, marynarka [jacket] 40.1.Kawiorek [French roll] 40.2.Kawiorka [French roll] 40.3.Bułka paryska [ French roll] 41.1.Kazała [to order someone] 41.2.Pozwala [to order someone] 42.1Kejter [mixed breed dog] 42.2.Mieszniec [mixed breed dog] 43.1.Kielonek [glass shot] 43.2.Kieliszek [glass shot] 44.1.Klunkry [clutter] 44.2.Graty [clutter] 45.1.Kopystka [wooden spoon] 45.2.Nabierka [wooden spoon] 45.3.Drewniana łyżka [wooden spoon] 46.1.Kromka [end slice of bread] 46.2.Piętka [end slice of bread] 47.1.Kumpela [friend] 47.2.Koleżanka [friend] 47.3.Kumpel [friend] 47.4.Kolega [friend] 48.1.Kuzaj [cousin] 48.2.Kuzyn [cousin] 49.1.Papcie [slippers] 49.2.Laczki [slippers] 49.3.Kapcie [slippers] 50.1.Lajsnęłaś [to get something for yourself] 50.2.Zafundowałaś [ to get something for yourself] 51.1.Lump [clothes] 51.2.Ciuch [clothes] 52.1.Ma wypite [ under the influence] 52.2.Jest pod wpływem alkoholu [ under the influence] 53.1.Modra kapusta [red cabbage] 53.2.Czerwona kapusta [red cabbage] 54.1.Mus [must] 54.2.Konieczność [must] 55.1.Na szagę [diagonally] 55.2.Na ukos [diagonally] 56.1.Namolny [nagging] 56.2.Uprzykrzony [nagging] 57.1.Się napaliłem [to desire] 57.2.Zapragnąłem [to desire] 58.1.Nastrugaj [to peel] 58.2.Naobieraj [to peel] 59.1.Naramka [shoulder stripe] 59.2.Ramiączko shoulder stripe]

303
60.1.Nieusłuchane [misbehaved] 60.2.Niegrzeczne [misbehaved] 61.1.Obkładamy chleb [to make a sandwich] 61.2.Przygotowujemy kanapkę [ to make a sandwich] 62.1.Odkluczamy [to open with a key] 62.2.Odmykamy kluczem [to open with a key] 63.1.Ogarnął się [put together] 63.2.Oporządził się [put together] 64.1.Ostrzytko [sharpener] 64.2.Temperówka [sharpener] 65.1.Pałka [chicken leg] 65.2.Udko [chicken leg] 66.1.Parówa [hot weather] 66.2.Parno [hot weather] 67.1.Penerstwo [rednecks] 67.2.Margines [rednecks] 68.1.Pierdołki [trifles] 68.2.Drobiazgi [tifles] 69.1.Plyndze [potato pancakes] 69.2.Placki ziemniaczane [potato pancakes] 70.1.Podkoziołek [madri gras] 70.2.Ostatki [marti gras] 71.1.Podstawek [saucer] 71.2.Talerzyk [saucer] 72.1.Pomarańczko [orange] 72.2.Pomarańcza [orange] 73.1.Pora [leek] 73.2.Por [leek] 74.1.Poruta [embarrassment] 74.2.Wstyd [embarrassment] 75.1.Posiepane [to cut into pieces] 75.2.Pośrumpane [to cut into pieces] 75.3.Postrzępione [to cut into pieces] 76.1.Przepękaj [to hold on] 76.2.Przetrzymaj [to hold on] 77.1.Pyra [potato] 77.2.Ziemniak [potato] 78.1.Rajwach [commotion] 78.2.Zamieszanie [commotion] 79.1.Zrobiłam [to make] 79.2.Zasłałam [to make] 80.1.Rojber [scapegrace] 80.2.Łobuziak [scapegrace] 81.1.Rozmymłany [scruffy] 81.2.Rozchełstany [scruffy] 82.1.Rżnij [to pretend]

304
82.2.Udawaj [to pretend] 83.1.Siora [sister] 83.2.Siostra [sister] 84.1.Słodkie [sweets] 84.2.Ciasto [sweets] 85.1.Stwory [animals] 85.2.Zwierzęta [animals] 86.1.Skorupy [dishes] 86.2.Naczynia [dishes] 87.1.Szneka z glancem [Danish] 87.2.Drożdżówka z lukrem [Danish] 88.1.Sznupa [face] 88.2.Gęba [face] 89.1.Szuszwol [scruffy] 89.2.Obdartus [scruffy] 90.1.Świgaj [to throw] 90.2.Rzucaj [to throw] 91.1.Tej! [hey] 91.2.Ty! [hey] 92.1.Tytka [bag] 92.2.Torba [bag] 93.1.Unorane [dirty] 93.2.Upypłane [dirty] 93.3.Uszmodrane [dirty] 93.4.Ubrudzone [dirty] 94.1.Wilgne [damp] 94.2.Wilgotne [damp] 95.1.Wmłócił [to eat] 95.2.Pożarł [to eat] 96.1.Wparował [to run into] 96.2.Wtargnął [to run into] 97.1.Wuchta [lots] 97.2.Mnóstwo [lots] 98.1.Wygnajewo [outskirts] 98.2.Przedmieście [outskirts] 99.1.Wyro [bed] 99.2.Łóżko [bed] 100.1.Zbańczyliśmy [to bankrupt] 100.2.Zbankrutowaliśmy [to bankrupt] 101.1.Ździebko [a little] 101.2.Troszkę [a little]

305
APPENDIX E
SCREENSHOTS OF THE ONLINE PERCEPTUAL QUESTIONNAIRE.
Figure E.1.: Screenshot of the question about the Poznań word use.
Figure E.2.: Screenshot of an indication of social situation of use.
Figure E.3.: Screenshot of the question about general Polish word use.

306
Figure E.4.: Screenshot of the question about other word use.
Figure E.5.: Screenshot of the social situation indication for other word.

307
APPENDIX F
INTERVIEW SCHEDULE.
F.1. GENERAL QUESTIONS.
1 ‘How long have you lived here?’
Jak długo to mieszkasz?
2. ‘Have you ever lived outside of Poznań?’
Czy mieszkałaś kiedyś poza Poznaniem?
3. ‘Have you ever lived outside of Poland?’
Poza Polską?
4. ‘Did you have a chance to get to school?’
Jakie otrzymałaś wykształcenie?
5. ‘How long have you been at your job?’
Jak długo pracujesz w swojej obecnej pracy?
6. ‘What do you like to do in your free time?’
Co robisz w wolnym czasie?
7. ‘Does your family still live here?’
Czy twoja rodzina nadal mieszka w Poznaniu?
8. ‘What is your group of friends like?’
Opowiedz mi o swoich przyjaciołach.
9. ‘Why do you like living here?/Why don’t you like living here?’
Czy lubisz tu mieszkać/czy nie lubisz tu mieszkać?

308
10. ‘Tell me about some recent news in Poland.’
Opowiedz mi, co się ostatnio dzieje w Polsce?
F.2. DAILY LIFE.
11. As a child, what types of chores were you expected to do around the home?
Jako dziecko, czy miałaś jakieś obowiązki?
12. Were there chores assigned to the boys and chores assigned to the girls?
Czy były one rozdzielone między chłopców i dziewczynki?
13. What was your home like? Can you give us a tour in words?
Jak opisałabyś swój dom? Możesz mnie po nim oprowadzić?
14. Were there any special activities that you remember from your family life?
Czy pamiętasz jakieś specjalne wydarzenia z życia rodzinnego?
15. Did you help around the house?
Czy pomagałaś w domu?
16. Did you help cooking in the kitchen?
Czy pomagałas gotować?
17. What were your favorite dishes to make?
Jakie były twoje ulubione dania?
18. How did you make them?
Jak się je robi?
19. What didn’t you like to help your parents with in the kitchen?
W czym nie lubiłaś pomagać w kuchni?
20. What did you get for lunch?
Co najcześciej dostawałaś na drugie śniadanie?
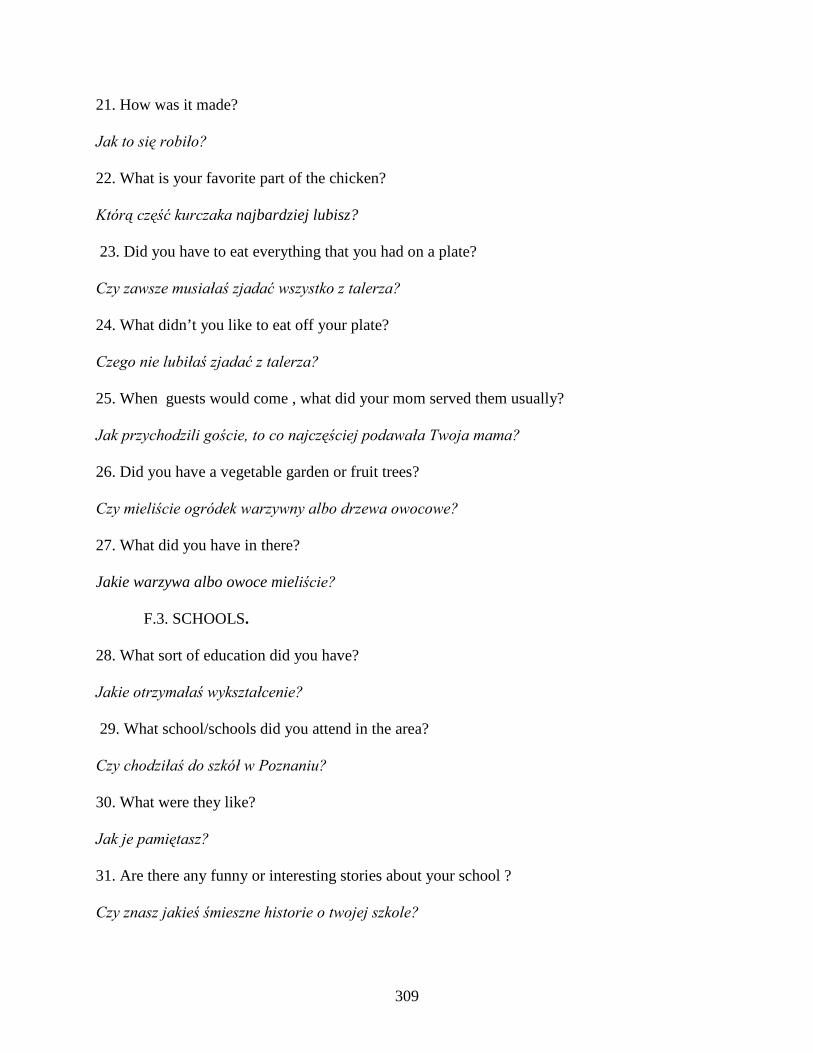
309
21. How was it made?
Jak to się robiło?
22. What is your favorite part of the chicken?
Którą część kurczaka najbardziej lubisz?
23. Did you have to eat everything that you had on a plate?
Czy zawsze musiałaś zjadać wszystko z talerza?
24. What didn’t you like to eat off your plate?
Czego nie lubiłaś zjadać z talerza?
25. When guests would come , what did your mom served them usually?
Jak przychodzili goście, to co najczęściej podawała Twoja mama?
26. Did you have a vegetable garden or fruit trees?
Czy mieliście ogródek warzywny albo drzewa owocowe?
27. What did you have in there?
Jakie warzywa albo owoce mieliście?
F.3. SCHOOLS.
28. What sort of education did you have?
Jakie otrzymałaś wykształcenie?
29. What school/schools did you attend in the area?
Czy chodziłaś do szkół w Poznaniu?
30. What were they like?
Jak je pamiętasz?
31. Are there any funny or interesting stories about your school ?
Czy znasz jakieś śmieszne historie o twojej szkole?

310
32. Any stories of favorite teachers or school events?
Jakieś historie o ulubionych nauczycielach albo wydarzeniach w szkole?
33. Were there different groups of students at school? (Names for those groups.)
Czy były różne grupy ludzi w szkole? Jak się nazywały?
34. What made a person a member of one group or the other?
Na jakiej podstawie było się członkiem takiej grupy?
35. Did the students have favorite places to "hang out" or favorite activities after school?
Czy uczniowie mieli jakieś ulubione miejsca żeby spędzać czas ?
36. Has this changed for your children? (names, places).
Czy to się zmieniło jeśli chodzi o twoje dzieci?
37. Are you interested in Poznań history?
Czy interesujesz się historią Poznania?
38. Do you have any family stories that emphasize local history?
Czy masz jakieś opowieści rodzinne związane z historia Poznania?
39. Has anybody form your family worked In Ceglarz?
Czy ktoś z twojej rodziny pracował w Ceglarzu?
40. Does Poznań have any special celebrations or yearly events?
Czy są w Poznaniu obchodzone jakieś specjalne rocznice?
41. What are they like?
Jak one wygladaja?
F.4. CLOSING QUESTION.
42. Can you think for a moment about any key historical moments connected with our town that
you would like to comment on for future generations to have/remember?

311
Czy chciałabyś przekazać jakąś historię związaną z naszym miastem dla przyszłych pokoleń?
43. Is your family history intertwined in any way with Poznań history?
Czy historia Pańskiej rodzina przeplata się w jakiś sposób z historią Poznania?

312
APPENDIX G
LIST OF ALL LABELS USED ON PERCEPTUAL MAP OF POLAND WITH
FREQUENCIES INDICATED.
Table G.1.List of all labels used on Poland map with frequency indicated LABEL FREQUENCY ślązacy [Silesians] 116 górale[highlanders] 106 kaszuby[Kashubia] 75 kaszubi[Kashubians] 68 gwara śląska[Silesian patois] 53 śląsk[Silesia] 52 gwara poznańska[Poznań patois] 42 poznaniacy[Poznanians] 39 gwara góralska[highlanders’ patois] 34 wielkopolska[Great Poland] 31 wielkopolanie[Great Poland residents] 27 gwara kaszubska[Kashubian patois] 26 mazury[Masuria] 23 Warszawiacy[warsawians] 20 hanysy[people from Silesia] 18 mazowsze[Masovia] 17 podhale[highlands] 16 Kujawy[lowlands] 15 pyry[tater] 13 gwara wielkopolska[Great Poland patois] 13 górale[highlanders] 13 pyry poznańskie[Poznań taters] 11 kujawiacy[lowlanders] 11 podhale[lowlands] 11 kaszubski [Kashubian] 10 mazowszanie[masurian] 10 gwara podhalańska[highlanders’ patois] 10 Pyrlandia[taterland] 9 Kaszubowie[Kashubians] 9 Mazurzenie[masurian] 9 kresy wschodnie[eastern edges] 9

313
dolny śląsk[lower Silesia] 9 górny śląsk[upper Silesia] 9 język kaszubski[Kashubian language] 8 Pomorze[Pomeranian] 8 Mazurzy[masurian] 8 Poznaniaki[Poznanians] 7 Pomorzanie[Pomeranians] 7 Warmia[warmia] 7 Śledziki[herrings] 7 gwara mazowiecka[mazovian patois] 7 gwara warszawska[Warsaw patois] 7 Kresowiacy[easternians] 7 Małopolska[lower Poland] 7 Góralszczyzna[highlander language] 7 gwara śląska[Silesian patois] 6 Góralska[highlander] 6 Bambry[rednecks] 5 dialekt kszubski[Kashubian dialect] 5 Kaszubska[Kashubian] 5 Warszawiaki[Warsaw people] 5 gwara małopolska[lower Poland patois] 5 Krakowiacy[krakov people] 5 Pyrusy[taters] 4 Poznańska[poznanian] 4 Pałuki[?] 4 gwara mazurska[masurian patois] 4 gwara wschodnia[eastern patois] 4 dialekt mazowiecki[Masovian dialect] 4 Podlasie[podlasie] 4 Łemkowie[lemks] 4 Gory[mountains] 4 Śląska[Silesian] 4 Ślązaki[Silesians] 4 zawołanie tej I nie[‘hey’ and ‘no’ call] 3 Opolszczyzna[opole region] 3 ostrów wielkopolski[Great Poland Ostrów] 3 Bażanty[pheasants] 3 Cebulorze[onion people] 3 krakowsko-poznańska[krakovian-poznanian] 3 kaszubski język[Kashubian language] 3 Krzyżactwo[Teutonic knights] 3 ściana wschodnia[eastern wall] 3 Wschód[east] 3 kresy [edge] 3 wschód Polski[eastern Poland] 3

314
Mazowieckie[mazovia] 3 Białostocczyzna[białystok region] 3 Ślunzaki[Silesians] 3 gwara krakowska[krakovian patois] 3 Podkarpacie[mountain region] 3 Bambrzy[rednecks] 2 Poznań[Poznań] 2 Wronki[wronki] 2 dialekt wielkopolski[great Poland dialect] 2 gwara poznaśko-krakowska [poznanian-krakovian patois] 2 mówią śpiewnie[they speak like singing] 2 dialekt mieszany[mixed dialect] 2 Pyrole[tater people] 2 Kujawianie[lowlandars] 2 gwara kujawska[lowlander patois] 2 Mazurska[masurian] 2 Borowiacy[woods people] 2 Suwalszczyzna[Suwałki region] 2 Kaszubianie[Kashubians] 2 Kresowianie[east edge people] 2 Warszawa[Warsaw] 2 Scyzoryki[pocket knives] 2 mowa warszawska[Warsaw speech] 2 Polska B[Poland B] 2 Warszawska[warsawian] 2 Lubelszczyzna[lublin region] 2 Podlasie[podlasie] 2 Krakowianie[krakovians] 2 Zakopane[zakopane] 2 Krakowska[krakovian] 2 język śląski[Silesian language] 2 Ślaski[Silesia] 2 dialekt śląski[Silesian dialect] 2 akcent śląski[Silesian accent] 2 Małopolskie[Lower Poland] 2 unosząca się intonacja[rising intonation] 1 Wungrowiec[wągrowiec] 1 wymowa w Poznaniu, wymowa poznańsko-krakowska[Poznań annunciation, Poznanian-Krakovian annunciation] 1 poznań i okolice[Poznań and surroundings] 1 Pyrocy[tater people] 1 gwara miasta Poznania[Poznań city patois] 1 mowa warszawsko poznańska[Poznań Warsaw 1

315
speech] Gwara[patois] 1 gwara pałucza[Pałucz patois] 1 szaloni kierowcy[crazy drivers] 1 mniejszość bałkańska[Balkan minority] 1 ludzie ze Lwowa, Kresów[people from Lvov, eastern edges] 1 okolice Poznania[Poznań surroundings] 1 Jonki[Jonki] 1 Łużyczanie[residents of Łużycze] 1 język polski z dużą ilością zapożyczeń niemieckich[Polish language with a lot of borrowings from German] 1 z akcentem niemieckim[with German accent] 1 Kaliszanie[residents of Kalisz] 1 Lipniaki[residents of Lipki] 1 gwara lubuska[lubuska patois] 1 Bory[woods] 1 Krajna[krajna] 1 Łęczyca[Łęczyca] 1 gwara małopolska[Lower Poland patois] 1 gwara szamotulska[Szamotuły patois] 1 dialekty mieszane[mixed dialects] 1 Wielkopolskie[Great Polish] 1 dialekt wielkopolski[Great Poland dialect] 1 Grabów nad Prosną[Grabów upon Prosna] 1 gwary mieszane[mixed patois] 1 Zgermanizowana[Germanized] 1 Kaliszanie[residents of Kalisz] 1 Opole[Opole] 1 Chazacy[residents of Rawicz area] 1 Lubuszanie[residents of Lubusz] 1 Szczypiory[green onions] 1 Kujawski[Kujawy-like] 1 zawołanie jo![yo!calling] 1 Kaszeby[kashubian] 1 Kaszub[kashubian] 1 gwara,niektórzy językoznwcy uważają za odrebny język[patois, some linguistics consider it a separate language] 1 borne sluinowo-gwara ślaska[borne sulinowo-silesia patois] 1 po kaszubsku[in Kashubian] 1 mowią po kaszubsku[they speak Kashubian] 1 Warmiacy[residents of Warmia] 1

316
Karpiowie[Karpiowie] 1 Paprykarze[paprikas people] 1 Kocienicy[Kocienicy] 1 gwara kaszubska[Kashubian patois] 1 Kocienie[Kocienie] 1 Kurpie[Kurpie] 1 dialekt pomorski[Pomeranian dialect] 1 Pomorski[Pomeranian] 1 Kaszebe[Kashubian] 1 Mazurski[masurian] 1 Białostocki[białystok-like] 1 Warszafka[Warsaw] 1 Wieśniacy[villagers[ 1 Polacy zza Buga[Poles from across Bug] 1 Seplenią[they lisp] 1 śpiewna mowa[singing speech] 1 Legioniści[legion people] 1 głupi warszawiacy[stupid Warsaw] 1 wymowa warszawska[Warsaw pronunciation] 1 na mazowszu wymowa warszawska[in Masovia warsaw pronunciation] 1 Pograniczanie[the border people] 1 praga pólnoc[Praga North] 1 Kurpiowie[residents of Kurpie] 1 ludzie z Podlasia[people from Podlasie] 1 Rodowici Warszawianie mówią inaczej[native Warsawians speak differently] 1 Zaciaganie[drawl] 1 Karpie[karps] 1 Lubelska[lublin-like] 1 naleciałości z rosyjskiego-wschód[interferences from Russian-East] 1 Rosjanie[Russians] 1 Cwaniaki[street smart] 1 Kielce[Kielce] 1 Kresowcy[people from the eastern region] 1 okolice warszawy[Warsaw surroundings] 1 gwara podlaska[Podlasie patois] 1 gwara tatrska[tatar patois] 1 gwara mazowiecka-łowicka[Masovia-łowicz patois] 1 gwara kijowska[Kiev patois] 1 Biłoruski [Belarusian] 1 Litewski[Lithuanian] 1 Ukraińcy[Ukrainians] 1

317
naleciaości wschodnie[eastern interferences] 1 Mówią śpiewnie[they speak like singing] 1 zaciagają ze wschodnim akcentem[drawl with an eastern accent] 1 Dialect białostocki[Białystok dialect] 1 elementy języka ukraińskiego i rosyjskiego[elements of Ukrainian language and Russian] 1 Kurpia[Kurpia] 1 Lubelszczyzna[Lublin region] 1 Radom[Radom] 1 Przemyskie[Przemyśl region] 1 wschód kraju[east of the country] 1 wymowa warszawsko-krakowska[Warsaw-Krakov pronunciation] 1 Mazowiacy[residents of Masovia] 1 gwara kresowa[border patois] 1 ludzie ze wschodu[people from the east] 1 ludzie tu mieszkający zaciągają[people living here drawl] 1 ściana wschodnia[eastern wall] 1 Warsiawiaki[warsawians] 1 Mongolia[Mongolia] 1 dialekty wschodnie[eastern dialects] 1 Gozole[?] 1 gwara kresowa[border patois] 1 Cepy[flail] 1 Kargule[kargule] 1 lachy ogoleckie[?] 1 ci z południa[those from the south] 1 okolice Zakopanego[Zakopane surroundings] 1 Bukowina Tatrzańska-charakerytyczna mowa[bukowina tatrzańska characteristic speech] 1 Bieszczady [bieszczady mountains] 1 Kamionka[kamionka] 1 opolskie-gwara pochodzenia niemieckiego[opole surroundings-patois of German origin] 1 mieszkańcy Galicji[Galicja residents] 1 język góralski[highlanders language] 1 Podhalanie[residents of Podhale] 1 dialekt małopolski[lower Poland dialect] 1 akcent góralski[highlander accent] 1 mowa krakowska[krakovian speech] 1 Juhasy[mountain people] 1

318
gwara kresowiaków[border people patois] 1 Bojkowie[Bojkowie] 1 język łemkowski[lemko language] 1 Hanysi[people from Silesia] 1 gwara sudecka[Sudety mountains patois] 1 Małopolanie[lower Poland residents] 1 Krakowiaki[krakovians] 1 Lasowiacy[Lasowiacy] 1 gwara przemyska[Przemyśl patois] 1 Pogórze[Pogórze] 1 Beskid[Beskidy mountains] 1 gwara rzeszowska[Rzeszów patois] 1 Śląszczyzna[Silesian] 1 Żywieczczyzna[Żywiec speech] 1 Śląskie[Silesia] 1 obszary górskie[mountain region] 1 dialekt góralski[highlander dialect] 1 gwara podhalańska[Podhale patois] 1 gwara małopolska[lower Poland patois] 1 Małopolanie[lower Poland residents] 1 mieszkańcy śląska[Silesia residents] 1 południe Polski[south of Poland] 1 Krakusy[Krakovians] 1 Śląska[Silesian] 1 Podkarpacie[podkarpacie] 1 wyjątkowa melodyjność[special musicality] 1 górale gadajo[highlanders talk] 1 Świętokrzyskie[Świętokrzyskie] 1 Podhalańczycy[residents of Podhale] 1 Dolnoślązacy[lower Poland residents] 1 Lublinianie[Lublin residents] 1 Podhalańska[podhale speech] 1 Harnasie[highlanders] 1

319
APPENDIX H
MISCELLANEOUS POZNAŃ WORDS USED IN THE CONVERSATIONAL PART OF THE
INTERVIEW.
Table H.1. Miscellaneous category of Poznań words used in the conversation part of the interview za każdy raz[every time] 1 Won[away] 1 wiaro[people] 1 w skakankę [jump ropes] 1 Tutej[here] 1 Szpachetkami[boards] 1 święcone[blessed food] 1 Stówę[hundreds] 1 sram siam[blah blah] 1 słoik pienina[a jar of pienina] 1 Przygawostki[stories] 1 po krzokach[in the bushes] 1 Pierdołek[stuff] 1 od czapy[nonsense] 1 Niesztampowe[unusual] 1 nie starczyło mi czasu[I did not have enough time] 1 nie ma wogóle przeproś[no excuses] 1 na pniu[on the stump] 1 Maciupkie[little bitty] 1 Łeb[head] 1 Łazienkowa[bathroom] 1 Kiblu[toilet] 1

320
Kefar[stench] 1 Katusze[torture] 1 Ino[well] 1 Harmontce[harmonica] 1 Gościem[guest] 1 Gładziuteńkie[smooth] 1 Frycowe[loss] 1 Fika[jump] 1 Dziewuchami[girls] 1 Chowie[to hide] 1 Chlew[mess] 1 Chętkę[to want] 1 Chabety[clothes] 1 Buta[shoe] 1 Blałki[hooky] 1 Bibeloty[stuff] 1 Bajer[awesomeness] 1 Wóziczek[stroller] 2 we bramie[in the gate] 2 w szafki[in the cabinets] 2 w robocie[at work] 2 w papę[in the face] 2 Składzik[pantry] 2 rzut kamieniem[close by] 2 Różniste[various] 2 po spacerku[after the walk] 2 Moskami[sword] 2 Masakra[massacre] 2 koniec końców[in the end] 2 Gacie[underpants] 2 Dworzu[outside] 2 Chatty[house] 2 Syfa[zit] 3 Papcie[slippers] 3 Pałę[an F] 3 Oblany[failed] 3 na ogródku[in the garden] 3 Kliki[clicks] 3 Gites[great] 3 szlag trafił[get 4

321
annoyed] Rudera[abandon house] 4 Praska[chest of drawers] 4 Papie[face] 4 Maluteńka[little] 4 Leci[passes by] 6 Siku[pee] 7 Prawdaż[right] 7 Gwiazdor[santa clause] 8

322
APPENDIX I
I.1. CUES FOR TARGET WORDS IN THE ELICITATION.
Those are cues for target words used in the elicitation part of the interview with the target
words. The numbers indicate which items they were in the original questionnaire, compare
APPENDIX G.
2.Jakich wyrażeń używają Państwo aby określić kogoś kto jest porządny i staranny?
How do you call someone who is sorted out?
2.1.Akuratny
9.Jeśli ktoś narzeka i marudzi to powiemy, że ta osoba:
If someone is whining and nagging, we will say that he is:
9.1.Bręczy
12.Jakich wyrażeń używają Państwo aby nazywać miejsce zaniedbane, opuszczone, porośnięte
krzakami?
How do you call an abandoned place?
12.1.Chęchy

323
13.Jak ludzie reagują na dobry żart?
How do people react to a good joke?
13.1.Chichrają się
22.Jakich wyrażeń używają Państwo aby nazywć bolesny pęcherzyk wychodzący na twarzy,
najczęściej wokół ust, gdy mamy obniżoną odporność?
How do you call a poainful spot on your face, most commonly around the lips, when our
immunity is low?
22.1.Febra
27.Jakich wyrażeń używają Państwo aby nazywać danie zrobione z mięsa gotowanego i
galaretki?
How do you call a dish made out of cooked meat and gelatin?
27.1Galart
34.Jakich wyrażeń używają Państwo aby nazwać biały twaróg wymieszany ze szczypiorkiem,
rzodkiewką itp.,najczęściej jedzony z ziemniakami?
How do you call a dish made out of cottage cheese and green onions, usually served with
potatoes?
34.1.Gzik
34.2.Gziczek
324
35.Jeśli dwoje ludzi wchodzi w związek małżeński to powiemy, że się :
If to people are getting married, we will say that they:
35.1.Hajtają
40.Jak nazywa się długą pszenną bułkę?
How do you call a long wheat bread?
40.1.Kawiorek
40.2.Kawiorka
42.Jak nazywa się psa, często wielorasowego?
How do you call a mix breed dog?
42.1Kejter
53.Jakich wyrażeń używają Państwo aby nazwać kapustę głowiastą o liliowoczerwonych
liściach?
How do you call a cabbage with red leaves?
53.1.Modra kapusta
59.Jakich wyrażeń używają Państwo aby nazwać część bluzki bez rękawów, która przytrzymuje
ją na ramionach?
How do you call the thing that holds a sleeveless shirt on your shoulders?
59.1.Naramka

325
62.Jeśli otwieramy zamek kluczem, to:
If we open a lock with a key we:
62.1.Odkluczamy
64.Jak nazywa się ostrze w oprawce, służące do temperowania ołówków?
How do you call a thing to sharpen pencils?
64.1.Ostrzytko
70.Jakich wyrażeń używają Państwo aby nazwać obchodu ostatniego dnia karnawału?
How do you call the holiday on the last day of the carnval, the night before Ash Wednesday?
70.1.Podkoziołek
71.Jakich wyrażeń używają Państwo aby nazwać mały okrągły talerzyk, który stawiamy pod
filiżankę?
How do you call a round little plate that you put under the cup?
71.1.Podstawek
86.Jak nazywamy elementy zastawy stołowej?
How do you call any part of china?
86.1.Skorupy

326
87.Jak nazywamy okrągłą lukrowaną drożdżówkę spiralnie skręconą w kształcie muszli ślimaka?
How do you call a pastry which looks like a spiral snail’s shell with icing on it?
87.1.Szneka z glancem
92.Jak nazywamy pojemnik, zazwyczaj używany do przechowywania, przenoszenia czegoś?
How do you call a container that you can carry things in?
92.1.Tytka
94.Jeśli coś jest nasiąknięte wodą to powiemy, że jest:
When something is soaked with water, we will say that it is:
94.1.Wilgne
100.Jeśli stracimy wszystkie pieniądze to:
If we lose all our money, then we:
100.1.Zbańczyliśmy