Embed Size (px)
Citation preview
ESTIMATION OF AGRICULTURAL ASSISTANCE USING PRODUCER AND CONSUMER SUBSIDY EQUIVALENTS:
THEORY AND PRACTICE
Carmel Cahill and Wilfrid Legg
CONTENTS
Introduction and historical background . . . . . . . . . . . . . . . . . . . . . . . . . . 14
1 . The concept of PSE and CSE . . . . . . . . . . . . . . . . . . . . . . . . . . . . . 15 A . Producer and consumer subsidy equivalents . . . . . . . . . . . . . . . 15 B . Assumptions underlying the calculation of PSEs/CSEs . . . . . . . 20
II . The measurement of PSEs and CSEs . . . . . . . . . . . . . . . . . . . . . . . 21 A . Policy coverage . . . . . . . . . . . . . . . . . . . . . . . . . . . . . . . . . . . . 22 B . Commodity and country coverage . . . . . . . . . . . . . . . . . . . . . . 22 C . Choice of reference price . . . . . . . . . . . . . . . . . . . . . . . . . . . . . 24
1 . Homogeneity . . . . . . . . . . . . . . . . . . . . . . . . . . . . . . . . . . 25 2 . Point of measurement . . . . . . . . . . . . . . . . . . . . . . . . . . . . 26
D . Choice of domestic price . . . . . . . . . . . . . . . . . . . . . . . . . . . . . 26 E . Consistency and comparability . . . . . . . . . . . . . . . . . . . . . . . . .
111 . PSEs and other measurement concepts . . . . . . . . . . . . . . . . . . . . . . 27 A . Measurements of assistance . . . . . . . . . . . . . . . . . . . . . . . . . . 28 B . 29
Issues in the application of PSEs and CSEs . . . . . . . . . . . . . . . . . . . 31 A . The interpretation of PSEs and CSEs . . . . . . . . . . . . . . . . . . . 31
1 . Exogenous changes in PSEs . . . . . . . . . . . . . . . . . . . . . . . 32 2 . The treatment of supply control . . . . . . . . . . . . . . . . . . . . 33
agricultural policy reform and the Uruguay Round . . . . . . . . . . .
A comparison of alternative measures of assistance . . . . . . . . . IV .
B . PSEs and CSEs in the Ministerial Trade Mandate. monitoring of 34
V . Conclusions . . . . . . . . . . . . . . . . . . . . . . . . . . . . . . . . . . . . . . . . . . 35
Bibliography . . . . . . . . . . . . . . . . . . . . . . . . . . . . . . . . . . . . . . . . . . . . . . 40
This paper was written by Wilfrid Legg and Carmel Cahill but draws extensively on work carried out in the Agricultural Policies Division of the Directorate for Food. Agriculture and Fisheries. in particular by Matthew Harley. Luis Portugal and Kazuyuki Tsurumi . Many former colleagues have also been involved in the development of this work . The authors have received helpful comments on an earlier draft from other colleagues in the Directorate and in the Economics and Statistics Department and from lan Lienert and David Blandford .
INTRODUCTION AND HISTORICAL BACKGROUND
The use of the Producer and Consumer Subsidy Equivalent (PSE/CSE) method to estimate assistance to agriculture was initially developed by Professor Tim Josling for the Food and Agriculture Organisation of the UN in the early 1970s', although the theoretical basis may be found in the work of, in particular, Max Corden2. It was adopted by the OECD in implementing the 1982 Ministerial Trade Mandate3.
The implementation of this mandate required: i) Estimates of the sources of assistance on a commodity-by-commodity
basis in OECD countries; and ii) A method for assessing the impact of a progressive and balanced
reduction in assistance upon domestic and international markets, which would permit the incorporation of inter-commodity linkages and would allow an assessment of the different ways in which agricultural policy objectives could be met.
The measurement of assistance using the PSE/CSE method fulfilled the first requirement, while the development of the MTM model, described elsewhere in this volume, was developed to fulfil the second.
The choice of the PSE/CSE method was determined by a number of consid- erations. Principal among these was the necessity to capture in a single, all- inclusive measure the transfers to farmers from agricultural policies, implemented with a wide range of often complex and inter-related instruments. Specifically, the PSE incorporates explicitly all domestic agricultural policy measures directly or indirectly affecting trade which would not be captured by measuring trade barriers alone, the role of domestic policies in trade distortions being central to the Ministerial mandate. Secondly, the calculation of PSEs and CSEs was perceived as being practically feasible given the availability of data and resources. The method has the potential to generate comparable results across countries, commodities and through time, which are easily understood by policy-makers.
PSEs and CSEs were initially calculated for a set of OECD countries compris- ing Australia, Austria, Canada, the EEC, Japan, New Zealand and the United States for the period 1979 to 198 1. The calculations were carried out within the context of the preparation of comprehensive country reviews of the effects of national policies on agricultural trade4. Subsequently, this work was extended to
14

include Sweden and Finland5, while reports on Norway and Switzerland are being prepared.
The Ministerial Trade Mandate study was completed in May 19876 and a new mandate was issued requiring the monitoring of the reform of agricultural policies according to a set of principles and guidelines defined by Ministers7. In implementing this part of the mandate, the PSE and CSE estimates were updated to cover the period 1982 to 1986 and have subsequently been updated to 1989.
The coincidence of a parallel discussion on measuring assistance and the consideration of an "aggregate measure of support" as one of the possible approaches in the Uruguay Round trade negotiations has meant that considerable examination of the method of calculation continues within OECD, both a t the broad conceptual level and at the practical level of choice of data series.
Parts I and II of this paper consider the concepts and the actual meaurement of PSEs and CSEs. Part Ill briefly describes PSEs in relation to other measures of assistance while Part IV examines some of the main issues involved in the application of PSEs and CSEs. Part V draws some conclusions as to the role of PSEs and their future development.
1. THE CONCEPT OF PSE AND CSE8
Despite the complexity and variety of policy instruments designed to achieve agricultural policy objectives (as well as the often confusing nomenclature to describe the same policy in different countries), they ultimately provide assis- tance to the owners of factors of production engaged in the agricultural sector. A variety of measurement concepts have been developed to estimate assistance, the choice of which depends on the purpose of the measurement, the level of refinement, the detail desired and the availability of data.
A. Producer and consumer subsidy equivalents
The PSE is an indicator of the value of the transfers from domestic consum- ers and taxpayers to producers resulting from a given set of agricultural policies, at a point in time
g. Thus the PSEs are aggregate measures of the total monetary
value of the assistance to output and inputs on a commodity-by-commodity basis, associated with agricdtural policies.
Five categories of agricultural policy measures are included in the OECD calculations of PSEs:
All measures which simultaneously affect producer and consumer prices (Market Price Support);
i)
15

All measures which transfer money directly to producers (Direct Pay- ments) without raising prices to consumers; All measures which lower input costs (Reduction in Input Costs) with no distinction being made between subsidies to capital and those to other inputs; Measures which in the long term reduce costs but which are not directly received by producers (General Services); Finally, other indirect support (Other), the main elements of which are sub-national subsidies (i.e. measures funded nationally by Member states in the case of the EC or regionally in the case of other countries) and taxation concessions.
The calculation of PSEs acknowledges the fact that policies which deliver assistance to producers do so by transferring income from either consumers or taxpayers. Market price support policies deliver assistance through consumer- provided transfers which create a wedge between domestic and world market prices and are measured as the difference between these two sets of prices, multiplied by the quantity that is subject to those measures. In most OECD countries, market prices are raised by these policies, but the converse can be the case from time to time, especially in developing countries. All other measures deliver assistance by budget-provided transfers and do not create a wedge between domestic and world market prices. They are measured from budgetary data.
PSEs can be expressed in three ways: i) as the total value of transfers to the commodity produced; ii) as the total value of transfers per unit of the commodity produced; and iii) as the total value of transfers as a percentage of the total value of production including transfers. The value of production can be measured at domestic prices (as in the OECD calculations) or at world prices. The expression of these transfers as total, per unit or percentage amounts depends on the type of comparisons being made. Clearly, the total PSE for a commodity and country will reflect not only the rate of assistance but also the quantity of agricultural produc- tion. It is also a useful measure to monitor changes in quantities produced arising from supply control measures because an effective supply control policy will reduce or stabilise output which will be reflected in the total PSE measure. The per unit PSE, when expressed in a common currency, allows comparisons between countries and over time of the rate of assistance to a particular commodity. Percentage PSE measurements allow comparisons between countries, commodi- ties and over time of the levels of assistance relative to the value of production.
In algebraic form, where the level of production is Q,, the domestic market price is Pd, the world price is Pw, direct payments are D, levies on producers are L and all other budgetary-financed support is B, the PSE expressions, as measured by OECD, are:
16
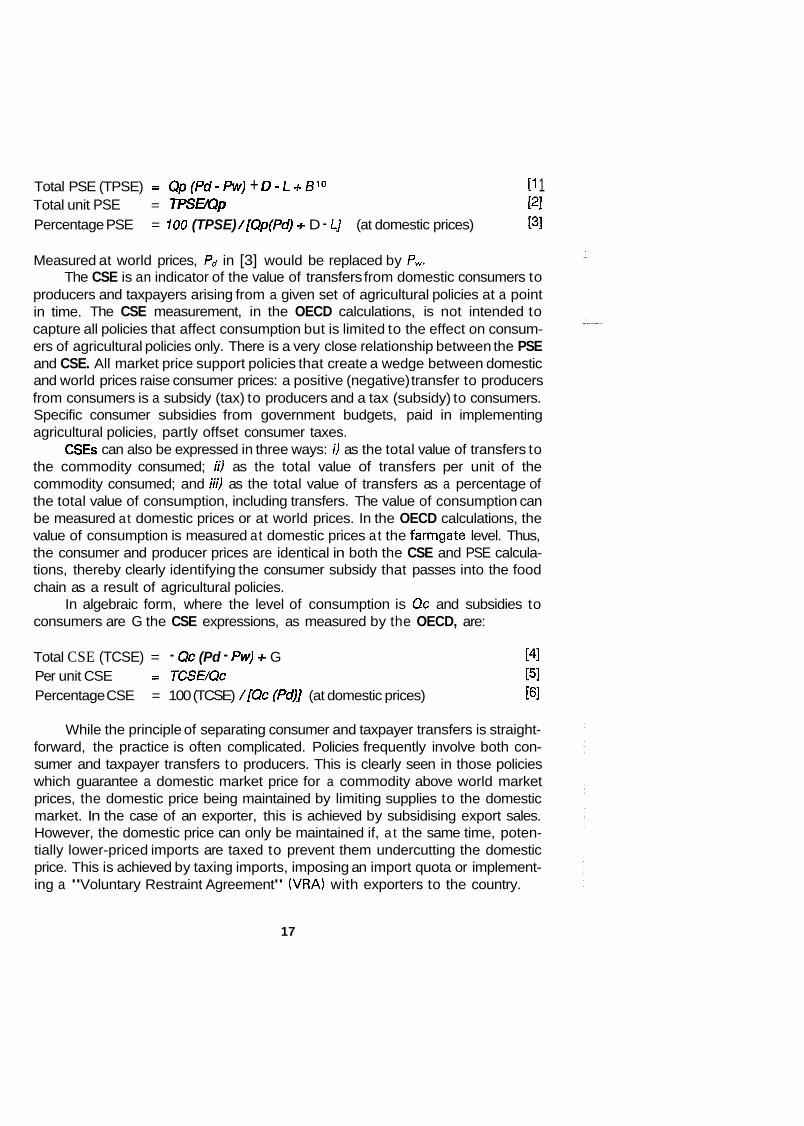
Total PSE (TPSE) = Op (Pd - Pw) + D - L + B l 0 11 1 Total unit PSE = TPSUQp PI Percentage PSE = 700 (TPSE) /[Qp(Pd) + D - L] (at domestic prices) PI
Measured at world prices, Pd in [3] would be replaced by P,. The CSE is an indicator of the value of transfers from domestic consumers to
producers and taxpayers arising from a given set of agricultural policies at a point in time. The CSE measurement, in the OECD calculations, is not intended to capture all policies that affect consumption but is limited to the effect on consum- ers of agricultural policies only. There is a very close relationship between the PSE and CSE. All market price support policies that create a wedge between domestic and world prices raise consumer prices: a positive (negative) transfer to producers from consumers is a subsidy (tax) to producers and a tax (subsidy) to consumers. Specific consumer subsidies from government budgets, paid in implementing agricultural policies, partly offset consumer taxes.
CSEs can also be expressed in three ways: i) as the total value of transfers to the commodity consumed; ii) as the total value of transfers per unit of the commodity consumed; and iii) as the total value of transfers as a percentage of the total value of consumption, including transfers. The value of consumption can be measured at domestic prices or at world prices. In the OECD calculations, the value of consumption is measured at domestic prices a t the farmgate level. Thus, the consumer and producer prices are identical in both the CSE and PSE calcula- tions, thereby clearly identifying the consumer subsidy that passes into the food chain as a result of agricultural policies.
In algebraic form, where the level of consumption is Qc and subsidies to consumers are G the CSE expressions, as measured by the OECD, are:
Total CSE (TCSE) = - Qc (Pd - Pw) + G [41 Per unit CSE = TCSE/Qc [51 Percentage CSE = 100 (TCSE) /[Qc (Pd)] (at domestic prices) 161
While the principle of separating consumer and taxpayer transfers is straight- forward, the practice is often complicated. Policies frequently involve both con- sumer and taxpayer transfers to producers. This is clearly seen in those policies which guarantee a domestic market price for a commodity above world market prices, the domestic price being maintained by limiting supplies to the domestic market. In the case of an exporter, this is achieved by subsidising export sales. However, the domestic price can only be maintained if, a t the same time, poten- tially lower-priced imports are taxed to prevent them undercutting the domestic price. This is achieved by taxing imports, imposing an import quota or implement- ing a "Voluntary Restraint Agreement" (VRA) with exporters to the country.
17

In both cases, the consumer usually pays a price which enables the domestic producer price to be maintained above that on world markets. However, in the case of an exporter, there is a budget outlay (export subsidy) whereas in the case of an importer, there is a budget inflow (import tax receipt) or an additional transfer to importing agents and export suppliers (import quotas, VRAs).
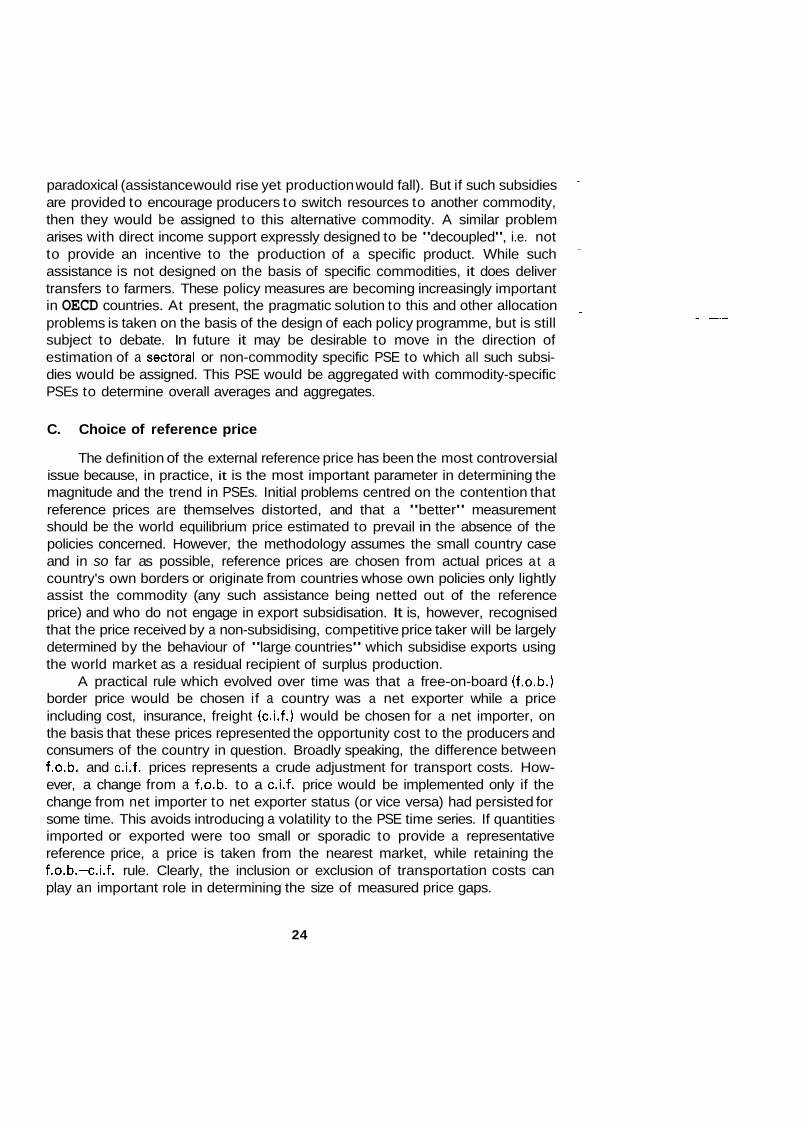
For a given level of domestic price maintained above that on the world market, the per unit rate of PSE from these policies is measured by the price gap, irrespective of whether the country is an exporter or importer. Although the total PSE is the per unit PSE multiplied by the quantity produced, irrespective of which part is provided by consumers and by taxpayers, the method has the potential to break down the sources of transfers to producers between consumers and tax- payers. Further, it avoids equating assistance to agriculture with budgetary out- lays on agricultural subsidies. This point is illustrated in Chart A which is confined to the analysis of market price support for an importing country (a) and deficiency payments for an exporting country (6). The analysis can easily be extended, mutatis murandis, to exporting and importing countries, respectively.
In Chart A(a), production is 01, consumption is Q2, the supported domestic price is P d and the world price is P,. The Area A is the transfer to producers (Total PSE), the area A+B is the transfer from consumers (Total CSE) and the area B is the transfer to budgets (import tax) or to importer agenciedexport suppliers (import quota, VRA).
Whether the country is an importer of the commodity in question [as shown in the Chart A(a)], or an exporter, the market price ( P d ) is the price received by producers and paid by consumers and P, is the world price. The rate of PSE (the price gap Pd-pw) is the same, whereas the total PSE depends on the relevant quantities. The budget effects are also radically different between the importing (budget inflow) and exporting (budget outlay) cases.
In the case of agricultural support through deficiency payments, [Chart A(b)] consumers pay the world price (f,) while producers are guaranteed the price ( p d ) .
If the country is either an importer or an exporter of the commodity, area A is the transfer to producers (total PSE) provided by budgets and there is no area B provided by consumers (CSE is zero).
Many policies are implemented as integrated packages of various instru- ments and consideration of the joint effect of the measure avoids double-count- ing. For example, some countries provide protection at the border in the form of both tariffs and quotas, but at any one time it is possible that only one measure is responsible for the observed price effects. If the quota is filled, this is an indication that the tariff is not high enough to restrain imports at the level of the quota or less, and the quota is therefore the restrictive measure. The quota is the measure which allows the internal price to be maintained, and the tariff becomes a device for ensuring that some of the economic rent (in the form of the difference
18

P
Pc
PW
CHART A
SOURCES OF TRANSFERS TO PRODUCERS
a) Importing country: Market price support
Dm Sm
\ Dm
0 Q1 Q2 Q
b) Exporting country: Deficiency payments
P
Pd
Pw
/ Dx /
sx
/
0 0 1 0 2 Q
19

between import and domestic selling prices) from the quota goes to the govern- ment rather than to importers. The effect of the tariff is not additive to that of the quota. If the quota is the binding constraint, the removal of the tariff would not affect internal prices. On the other hand, if the quota were to be relaxed, there would be a point at which, given the level of the tariff, the quota would no longer be filled - the tariff would then become the effective restraint on imports.
From the foregoing analysis, the level of transfers from policies that maintain producer prices above the level on the world market can, in principle, be derived from either the measurement of the domestic/world price gap or from budgetary data. The price gap, multiplied by the levels of production and consumption, results in the total PSE and total CSE respectively, arising from market price support policies. The budget outlays on export subsidies, divided by the quantities exported, result in the equivalent price gap. The budget revenue derived from import taxes for an importing country, divided by the quantity imported, also results in an equivalent price gap. In each case, additional assistance provided by budgets generates the PSE resulting from other agricultural policies.
-
~~
B. Assumptions underlying the calculation of PSEs / CSEs
The essential characteristics underlying the calculation of PSEs and CSEs are a downward-sloping demand and upward-sloping supply curve which determine equilibrium prices that reflect the private and social benefits and costs. Specifi- cally, prices in the world market are assumed to express the opportunity costs to domestic producers and consumers of a given commodity.
PSEs and CSEs are measures of producer and consumer transfers respec- tively, not incentives to production and consumption. The observed levels of commodity production and consumption are taken for the calculation while domestic and world prices are the bases for the calculations of the actual transfer of the market price support element of the PSE. In practice, domestic prices are often distorted by agricultural policies and may not reflect the social benefits and costs. Also, world prices are often distorted by agricultural and non-agricultural policies. But those prices determine the actual transfers that take place, whether as a result of an import tax, export subsidy, deficiency payment or an array of other domestic policies.
PSEs and CSEs are measured within a partial equilibrium framework. In other words, prices and quantities in the rest of the economy are assumed to be constant and not affected by adjustments in agricultural markets. The partial equilibrium nature of the calculations means that neither macro-economic policies affecting the agricultural sector (in particular the effect of changes in exchange rates) nor the effects of assistance to agriculture on the rest of the economy are measured. This latter issue is dealt with in the WALRAS study which is discussed
20

elsewhere in this volume. Nevertheless, changes in exchange rates will alter the world price of commodities when expressed in domestic currencies which will, in turn, affect the gap between domestic and world prices. But no attempt is made to estimate the magnitude of the effect of changes in exchange rates, for example in comparison with some base-year exchange rate. The observed exchange rate is a parameter in the calculations of PSEs and CSEs which determines the actual transfers that occur.
A specific aspect of the partial equilibrium assumption is that the measure- ment of PSEs and CSEs assumes zero substitutability in production and consump- tion. This means that no cross-commodity effects are incorporated in the calcula- tions based on observed prices and quantities. In effect, per unit PSEs measure the actual price gap for the marginal units produced plus the implicit price gap represented by any reduction in input costs (i.e. the assumed shift in the supply curve at the actual quantity supplied). Similarly per unit CSEs represent the actual (but negative) price gap for the marginal units produced plus any per unit subsi- dies given to consumption as part of agricultural policy.
The calculation of PSEs and CSEs assumes the small-country case. In other words no account is taken of the effect of any country's policies on the world market price. In reality implementation of policies in some large OECD countries influences the level of world prices. Therefore, if a policy were altered it may result in offsetting changes in world prices which partially "compensate" producers or consumers (in terms of the price gap) for that policy change. However, in so far as changes in world prices for a commodity affect all countries for which calculations are made, this maintains the correct relative level of assistance. Moreover, any calculation of what the "policy-free" world price would be requires an initial estimate of assistance as an essential input into a modelling exercise. It is important to bear in mind that the PSEs and CSEs measure the transfers to the agricultural sector from the rest of the economy arising from agricultural policies with a given set of prices and making adjustments for a "policy-free" world price would lead to incorrect transfer calculations.
The measurement of PSEs and CSEs assumes homogeneity in terms of the commodities produced and consumed. This applies both to the commodities defined for reference (world) price purposes and domestic commodities.
II. THE MEASUREMENT OF PSEs AND CSEs
This section outlines some of the problems arising in the application of a relatively simple concept to a large number of countries and commodities. It indicates the evolution of a number of guidelines - many of which were deter- mined by practical considerations.
21

A. Policy coverage
From the outset, policy coverage was intended to include "all measures which influence production, consumption and trade". Resource constraints and data availability produced a pragmatic working classification of policies to be covered. A major concern was to minimise differences in coverage and hence maximise consistency in an exercise where consistency across a large number of countries was critical to its acceptability.
As regards coverage, social security spending, central administration (except R&D , inspection services and extension costs) and those subsidies specific to food-processing and distribution which do not provide transfers to agricultural producers were specifically excluded.
A number of key problems emerged during the course of the calculations:
i)
ii)
iii)
Only policies specific to agriculture are included in the calculations. Policies which convey a subsidy to all users in the economy are excluded. This rule, for example, means that transport subsidies which are global in the United States are excluded whereas they are included in the case of Canada where the policy specifically targets western grain producers. Data availability results in somewhat uneven coverage and hence incon- sistent treatment for a number of policies. Most affected have been credit subsidies, sub-national expenditures and taxation concessions. However, the importance of these items in those countries for which the data are available (or which are willing to make estimates) led to the retention of these items in the calculations. Storage costs and export subsidies, which can sometimes represent a significant part of agricultural budgets, are already included in the mea- surement of price gaps. The unit price gap multiplied by the relevant level of production results in the total PSE due to market price support and this includes both quantities exported and taken into government stocks.
B. Commodity and country coverage
The first requirement is to define the set of commodities of most relevance to OECD countries in terms of production and trade. The second requirement concerns the ease or practicability of computation. The result of this process has been the definition of a standard list of commodities which covers the main temperate-zone products (see Table 1). Within the standard list, a commodity is included in each country if it accounts for at least one per cent of the total value of agricultural production as measured a t the farm gate. Commodity coverage for the
22

Table 1. Producer subsidy equivalents - Country and commodity coverage
Australia Austria Canada EEC Finland" Japan New Zealand
United Sweden States
Wheat Coarse grainsc
Maize Barley oats Sorghum
Rice Soy abeans Other oilseeds Sugar* Milk Beef and veal Pigmeat
X
X
X
X
X
Xb x x X X
X x x X X
x x x x X X
X
X X
x x X
x x X
X x x X X
X x x X X
X X X
X X X
X X
X
X
X
X
X
X
X x X X X
X X x x X X X X X
X X x x X X X X X
Poultry meat X x x X X X X X
Sheepmeat X X X X X X
Wool X X X
Eggs X X x x X X X X X
x Indicates that the commodity is included for the country calculations. a] A calculation is also made for rye in Finland. bJ Wheat and rye. cl Coarse grains include those cereals relevant for each particular country. dl In white sugar equivalent andlor rawlbeetlcane sugar as appropriate to each country.
latest calculaiions (1986-89) varies between 65 per cent of the total value of agricultural production (Japan) and 85 per cent (Canada), with most countries situated in the upper half of the range. The main commodities excluded are fruit and vegetables, wine and olive oil.
A large proportion of assistance that is not provided by market price support and direct payments is not commodity specific. In the absence of specific informa- tion, allocation is according to the shares of commodities in total value of produc- tion or shares in total value of sub-groups (e.g. pesticide subsidies will be allocated only to crops). This arbitrary method may lead to some misallocation of assistance and to some volatility in PSE elements which a priori would be expected to be rather constant, e.g. R&D subsidies which by this method will fluctuate with the level of production of a commodity.
A specific problem arises in assigning assistance provided as an incentive to withdraw resources from a commodity either permanently or long-term. To assign such assistance to the commodity from which resources are removed would be
23
paradoxical (assistance would rise yet production would fall). But if such subsidies are provided to encourage producers to switch resources to another commodity, then they would be assigned to this alternative commodity. A similar problem arises with direct income support expressly designed to be "decoupled", i.e. not to provide an incentive to the production of a specific product. While such assistance is not designed on the basis of specific commodities, it does deliver transfers to farmers. These policy measures are becoming increasingly important in OECD countries. At present, the pragmatic solution to this and other allocation problems is taken on the basis of the design of each policy programme, but is still subject to debate. In future it may be desirable to move in the direction of estimation of a sectoral or non-commodity specific PSE to which all such subsi- dies would be assigned. This PSE would be aggregated with commodity-specific PSEs to determine overall averages and aggregates.
-
~~ ~ -~~~ ~~ -
C. Choice of reference price
The definition of the external reference price has been the most controversial issue because, in practice, it is the most important parameter in determining the magnitude and the trend in PSEs. Initial problems centred on the contention that reference prices are themselves distorted, and that a "better" measurement should be the world equilibrium price estimated to prevail in the absence of the policies concerned. However, the methodology assumes the small country case and in so far as possible, reference prices are chosen from actual prices at a country's own borders or originate from countries whose own policies only lightly assist the commodity (any such assistance being netted out of the reference price) and who do not engage in export subsidisation. It is, however, recognised that the price received by a non-subsidising, competitive price taker will be largely determined by the behaviour of "large countries" which subsidise exports using the world market as a residual recipient of surplus production.
A practical rule which evolved over time was that a free-on-board (f.o.b.) border price would be chosen if a country was a net exporter while a price including cost, insurance, freight (c.i.f.1 would be chosen for a net importer, on the basis that these prices represented the opportunity cost to the producers and consumers of the country in question. Broadly speaking, the difference between f.o.b. and c.i.f. prices represents a crude adjustment for transport costs. How- ever, a change from a f.o.b. to a c.i.f. price would be implemented only if the change from net importer to net exporter status (or vice versa) had persisted for some time. This avoids introducing a volatility to the PSE time series. If quantities imported or exported were too small or sporadic to provide a representative reference price, a price is taken from the nearest market, while retaining the f.o.b.-c.i.f. rule. Clearly, the inclusion or exclusion of transportation costs can play an important role in determining the size of measured price gaps.
24
1. Homogeneity
The choice of reference price should in principle be the opportunity cost at a country's border of the commodity in question. Hence, the product chosen should be representative of domestic production. In several cases, however, there is a lack of homogeneity between domestic production and that available on world markets. Partly this is due to domestic policies which hinder the transmission of world price signals and thus minimise the competitive environment. Partly, there is
markets, particularly for livestock products. In addition, there are often distribu- tion costs involved between the world price (at the border) and the producer price (at the farm gate). This problem is overcome by the use of technical coefficients and price adjustments, which convert prices of products on world markets to those of commodities that are equivalent to domestic production.
This results in country-specific or individual reference prices because quality and definitional problems make it difficult for the homogeneity rule to hold for a large number of countries vis-i-vis one given external price. Despite these difficul- ties in the case of a number of products this approach does result in de fact0 reference prices which are similar.
Attempts have been made to establish acceptable common reference prices, thereby ensuring that the price comparison for each country would be based on the same reference price. This price should, therefore, be representative of pro- duction in each country or of a sufficiently large proportion of production that it could be used as the basis of the estimate for the entire production. Unfortu- nately, few products proved sufficiently homogeneous for the single common reference price approach to work. Such was the case for wheat, where a detailed investigation revealed that very wide price differences exist between different types and grades of wheat, that differences between grades fluctuate significantly and that the production mix is very different from country to country. These elements, plus the fact that price comparisons are sometimes made at levels of processing (or value-added) which differ across countries, explain why specific reference prices were adopted for this commodity.
On the other hand a common reference price was adopted in the case of milk - one of the most heavily assisted commodities. The price calculation is based on a comparison of farm-gate prices of raw milk with the New Zealand farm-gate price, adjusted for the higher fat content of New Zealand milk, serving as the external reference price. A common reference price is used as milk is considered to be a homogeneous commodity, whereas the dairy products produced - and traded - are very diverse. The New Zealand milk price is used because it is the least assisted of all OECD countries and is adjusted for transport costs based on milk products equivalents to each country (and hence effectively converted to a
usually a greater level of product transformation in commodities available on world ~ -~ ~ ~~~
25

c.i.f. price). This adjusted price is considered to represent the opportunity cost of milk in each domestic market. It has not been possible to adopt a common reference price for any other sector. Although as an interim solution there is a common reference price for net-importing countries in the beef sector, the exis- tence of segmented markets (the presence or absenceof foot and mouth disease, wide quality differentials, etc.) have, to date, rendered the problem of finding an acceptable common reference price virtually intractable.
The problem of homogeneity has therefore generated on-going discussion about the question of quality adjustments. These have been strongly championed by countries who perceive that the domestically produced commodity has special characteristics and is not capable of being produced elsewhere. In the case of Japan, the external reference price for rice is adjusted upwards (by around 50 per cent) to reflect a differential between Japanese rice and imported rice on the basis of a quality premium observed during a period in the 1960s when imports were permitted.
-
-
~~~~ - ~~ ~ ~ ~ ~ ~ - ~ ~
2. Point of measurement
The PSE is designed to measure transfers to primary agriculture and not to the processing and distribution sectors. Hence specific subsidies to these sectors are excluded. Concentration on primary agriculture demands that prices used to estimate the price gaps be observed as close to primary production as possible (with adjustments for handling costs and commercial margins if the prices quoted are not a t the farmgate level). This presents computational difficulties when the traded commodity is semi- or highly-processed (e.g. sugar). The comparison between domestic wholesale prices and the border price generates price gaps which are then converted to their equivalents at the primary sector level using appropriate technical (yield or conversion) coefficients. For example, the compari- son of the prices for domestic and world market sugar can be converted into the sugar-beet or cane equivalents, using the ratio between the price for refined sugar and the producer price for beet or cane sugar. Unless there is explicit evidence to the contrary, the transfer implied by a price gap is assumed to accrue to primary producers, an assumption which depends on the relevant elasticities of supply and demand and which may not hold if the processing and distribution sectors, because they have monopolistic or oligopolistic structures, succeed in capturing a part of the transfers.
D. Choice of domestic price
Domestic prices are measured as close to the farm-gate as possible and as close to the raw or primary commodity as possible. They are actual observed or
26
realised prices and not administratively-set support prices. This ensures the mea- surement of actual transfers in cases where producer prices may diverge signifi- cantly from support prices. The domestic prices used to calculate price gaps are not always identical to those used to calculate the value of domestic production, due to the different levels of transformation of farm and traded agricultural commodities. In these cases, price gaps are converted to their farm-gate equivalents.
E. Consistency and comparability
Growing interest in PSES/CSES in the context of the Uruguay Round negotia- tions has brought issues of consistency and comparability across countries to the forefront. Both data availability and quality vary significantly across countries and this has implications for comparability. Data on a range of subsidies including tax and interest rate concessions to farmers and sub-national/provincial expenditures are not comprehensively considered in all countries, such items being heavily dependent on the investment individual countries have been willing to make to provide the data. An ideal method of measurement can be identified for many types of policy, but data are not always available. No remedy exists for this kind of problem except the constant attempt to extend coverage or upgrade the data. In the meantime, the degree of comparability of PSEs across countries and commodities must be treated with caution.
111. PSEs AND OTHER MEASUREMENT CONCEPTS
Measures of assistance have their roots in international trade theory. Histori- cally, the most common forms of assistance have been trade barriers, particularly tariffs, designed to protect higher-priced domestic production from cheaper imports.
The predominance of trade barriers and the resulting distortions to the amount and direction of trade focused attention on measuring the gaps generated between domestic and world prices for agricultural commodities. The range of concepts to measure assistance are all closely related as derivatives, refinements or extensions to measurements of domestic/external price gaps. All of the com- monly used measures’ l, which are outlined below, estimate assistance to produc- tion. Although the corresponding calculation can be derived for consumption, only in the case of the CSE is this systematically estimated. These measures should be viewed as complementary rather than as alternatives in that they each serve to draw attention to the different effects of a set of policies.
27

A. Measurements of assistance
The simplest and most widely used measure is the nominal rate of protection (NRP), which only takes account of trade barriers, and measures the wedge between domestic and world prices. It is defined as the percentage difference between the domestic market price (pd) and the world price (P,) of a given commodity, measured in a common currency:
NRP = [(Pd- Pw)/Pw]. 100 171 More extensive than the NRP, in terms of its policy coverage, the nominal
rate of assistance (NRA) (or the so-called "price adjustment gap"12) takes account of all policies which raise prices received by domestic producers. It is defined as the percentage difference between the unit gross returns to produc- ers ( R d ) -which is the market price received by producers plus any other subsidies or taxes on output, including deficiency payments - and the world price (P,) of a given commodity, measured in a common currency. The NRP measures the wedge between domestic producer and world prices. The more the assistance is provided through domestic market price support and trade measures, the closer the NRP will be to the NRA. The NRA in effect measures the difference between the "output incentive price" and the world price:
NRA = [(Rd - Pw)/Pw]. 100 181
Neither the NRP nor the NRA includes any border protection or assistance on inputs. Therefore, in order to give a better indication of the distortion of produc- tion incentives arising from trade measures, it is necessary to account for policies that affect both output and inputs. The effective rate of protection (ERP) is the percentage difference between the value added per unit of output at domestic prices (VAd) and the value added at world prices (VA,) measured in a common currency. Value added is measured as the difference between the value of final output and the cost of inputs - in each case at the set of domestic or world prices, respectively. Thus, the ERP is:
ERP = [(VAd - VAW)/VAW]. 100 [91 However, the ERP only takes into account policies that affect output and
inputs through trade barriers. A more extensive measure is the effective rate of assistance (ERA), which is the percentage difference between the value added per unit of output measured by including assistance on all outputs and inputs (assisted value added, AVA) and the value added at world prices (VA,) measured in a common currency. The ERA thus takes into account both the assistance on the domestic production and the inputs used and it measures the assistance to the activity rather than to the product itself. The ERA is a more comprehensive measure of the distortion of incentives to the value-adding factors in an activity
28

resulting from all policies that affect the sector. Because it measures the "net" assistance to the activity, it gives an indication of the extent to which resources will be attracted to the sector:
ERA = [(AVA - VAW)/VAW]. 700 U01
B. A comparison of alternative measures of assistance
Alternative means of assistance are illustrated in Chart B, which depicts the case of a country importing a commodity in which P, is the world price, P d is the domestic market or producer price, P, is the consumer price (in certain cases), Pjd
and PI, are the domestic and world prices, respectively, of an input and DO and SS are the domestic demand and supply curves, respectively. In the case of a country exporting a commodity, mutatis mutandis, the analysis below is also applicable. The measures of assistance are expressed here as ratios which, when multiplied by 100, give the percentage values.
CHART E
GRAPHICAL ILLUSTRATIONS OF ALTERNATIVE MEASURES OF ASSISTANCE
S' s
Pd
Pc
Pw
Pid Piw
Producer incentive price
Producer price
Consumer price
World price
Domestic input price World input price
0 Qi Qz Q; Q
29
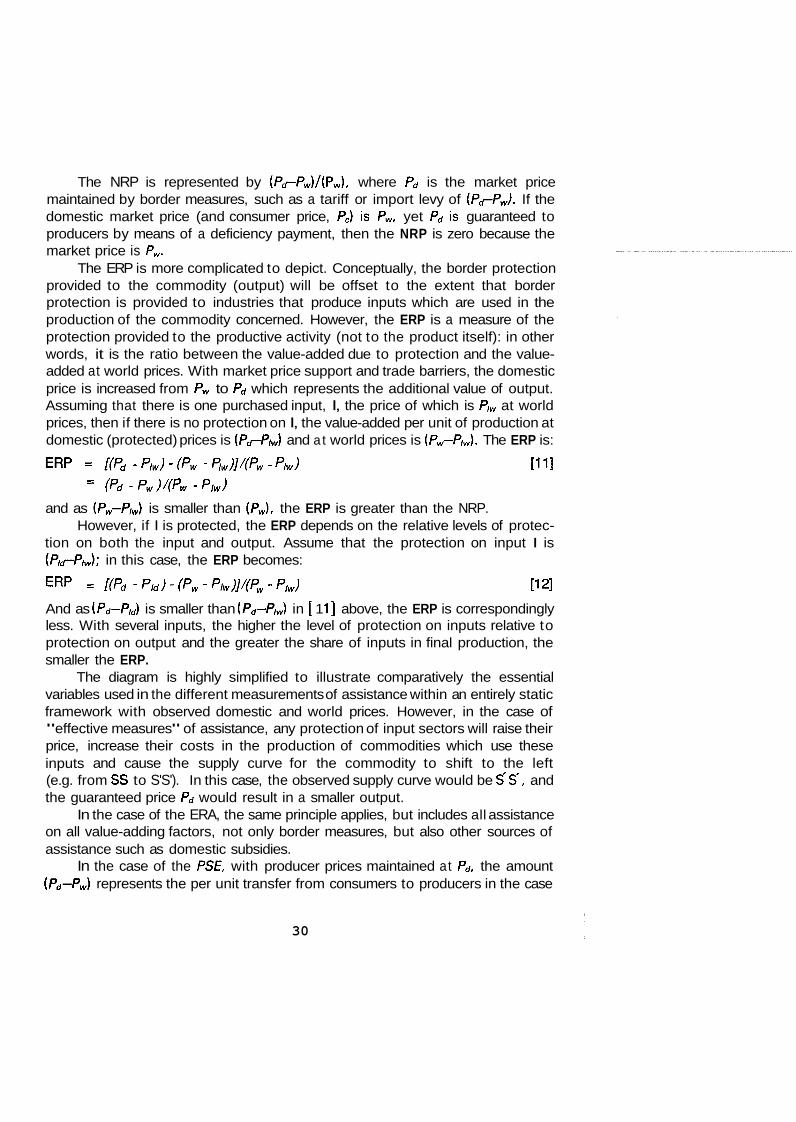
The NRP is represented by (Pd-Pw)/(Pw), where Pd is the market price maintained by border measures, such as a tariff or import levy of (P,p,). If the domestic market price (and consumer price, P,) is P,, yet Pd is guaranteed to producers by means of a deficiency payment, then the NRP is zero because the market price is P,.
The ERP is more complicated to depict. Conceptually, the border protection provided to the commodity (output) will be offset to the extent that border protection is provided to industries that produce inputs which are used in the production of the commodity concerned. However, the ERP is a measure of the protection provided to the productive activity (not to the product itself): in other words, it is the ratio between the value-added due to protection and the value- added at world prices. With market price support and trade barriers, the domestic price is increased from P, to Pd which represents the additional value of output. Assuming that there is one purchased input, I, the price of which is A, at world prices, then if there is no protection on I, the value-added per unit of production at domestic (protected) prices is (P,P,,) and a t world prices is (PW-Plw). The ERP is:
ERP = [(pd - PIW) - (Pw - F;w)J/(Pw - PIW) [I 11 = (pd - pw )/(pw - plw)
and as (PW-P/J is smaller than (P,), the ERP is greater than the NRP. However, if I is protected, the ERP depends on the relative levels of protec-
tion on both the input and output. Assume that the protection on input I is (P/,,-flw); in this case, the ERP becomes:
ERP
And as (Pd-P\d) is smaller than (Pd-P/w) in [ 1 11 above, the ERP is correspondingly less. With several inputs, the higher the level of protection on inputs relative to protection on output and the greater the share of inputs in final production, the smaller the ERP.
The diagram is highly simplified to illustrate comparatively the essential variables used in the different measurements of assistance within an entirely static framework with observed domestic and world prices. However, in the case of "effective measures" of assistance, any protection of input sectors will raise their price, increase their costs in the production of commodities which use these inputs and cause the supply curve for the commodity to shift to the left (e.g. from SS to S'S'). In this case, the observed supply curve would be S'S', and the guaranteed price Pd would result in a smaller output.
In the case of the ERA, the same principle applies, but includes all assistance on all value-adding factors, not only border measures, but also other sources of assistance such as domestic subsidies.
In the case of the PSE, with producer prices maintained at Pd, the amount (Pd-Pw) represents the per unit transfer from consumers to producers in the case
= [(pd - pld) - (Pw - PIW)J/(PW - PIW) [I 21
30
of market price support (border measures) or the transfer from budgets in the case of deficiency payments (market and world prices are both P w ) . Any protec- tion (tax) on domestic inputs that raise their prices to the agricultural-using sector ( P / d - P / w ) are not measured in the PSE calculations. However, there is an exception to this rule: an estimation is made of the "excess feed costs" which are the taxes (or subsidies) on livestock producers as a result of market price support for animal feeds. With respect to any domestic subsidies (or taxes) that lower (raise) the prices of inputs to producers, such as fertiliser and credit subsidies, or infrastruc-
' tural measures, these can be depicted conceptually by a shift in the supply curve: therefore, the observed supply curve SS (including subsidies) would be, for example, S'S' in the absence of those input subsidies. Thus the producer price would have to be higher than the observed price in order to bring forth the supply 0, in the absence of subsidies and Pd' can be considered the implicit or "incen- tive" producer price. (Pd ' -Pd) therefore represents the per unit value of input subsidies transferred from government budgets. The per unit PSE is therefore ( P d ' - P w ) , the total PSE is ( P d ' - P w ) . Q ' and the percentage PSE is [ ( P d ' - P w ) / ( P w ) ] . 700, if measured at world prices and [ ( f d ' - f w ) / ( P d ' ) ] . 700, if measured a t domestic prices including all subsidies.
The CSE measures the transfers paid as taxes (received as subsidies) by consumers in implementing agricultural policies. Only transfers that raise the market prices above those on the world market and any other subsidies to consumers paid as an integral part of agricultural policies, are included. In terms of the diagram, if Pd is maintained by border measures, which raise the domestic market price to both producers and consumers, the per unit CSE is ( P d - P w ) and the total CSE is ( P d - P w ) . 0 2 . In the case of the importing country depicted, QZ is greater than 01, but the converse would be the case for an exporting country. If there are additional budget subsidies to consumers, then this would mean that the consumer price is lower than the producer price, which would offset to some extent market price support measures. For example, in the diagram, (Pd-Pc).Q2' would, conceptually, represent a subsidy and (PC-Pw).Q2' a tax on consumers.
IV. ISSUES IN THE APPLICATION OF PSEs AND CSEs
A. The Interpretation of PSEs and CSEs
As PSEs and CSEs are now the leading indicators of assistance to agriculture in OECD countries, it is pertinent to outline what the measured "transfers" actually can be used for. Of particular importance, is the extent to which they can be compared between commodities, countries and through time in evaluating policy changes and in the specific negotiating context of the GATT.
31
Firstly, it is relevant to relate the concepts of PSE and CSE to other measure- ments of assistance. The PSE attempts to include all policies that are specifically designed to benefit the agricultural sector, but it does not (at this stage) include those policies designed to benefit sectors outside agriculture that nevertheless impinge on it. In order to include the latter policies, it would be necessary to move towards an ERA-type measure.
However, in order to avoid double-counting in aggregate and average PSEs, a calculation is made of the "excess feed cost" which is an adjustment to the PSE calculation for all animal products to take account of the effect of market price support for feedgrains and oilseeds used in animal feed. The effect is to make an adjustment to livestock products which brings the measure for these products close to an ERP/ERA. The difficulties which have been experienced in carrying out the excess feed cost calculation illustrate the magnitude of the data problems which would be encountered in a full estimate of "effective rates of production assistance" for all countries and commodities. In particular it is neces- sary to collect detailed information on input volumes and values by commodity. Work within OECD (the Feed Utilisation Matrix) provides this kind of data for animal feed using a consistent method but is not yet complete. Similar information would be required concerning all inputs, in addition to which it would be necessary to calculate the level of implicit or explicit taxes or subsidies on non-agricultural inputs.
Secondly, as far as data sources permit, the policy coverage of the PSEs and CSEs is the same for all countries. All policies are measured in monetary terms in national currencies and aggregated for each commodity. No judgement is made in the calculation as to whether a given policy instrument has more or less effect on production, consumption or trade. In other words, the production impact of a unit of currency transfer provided from one policy is considered the same as a currency unit provided from another policy. A dollar of research and development expendi- ture is equal in the calculations to a dollar of market price support.
The same level of PSE between countries, commodities and years indicates the same level of transfer but the composition of the transfer can be very different. Knowledge of the composition of the PSE and CSE, particularly the extent to which assistance is provided by market price support and deficiency payments, is important for the reform of policies and negotiations. This is because different policies can have varying effects on production, consumption and trade, even when they provide the same level of assistance.
1. Exogenous changes in PSEs
Attempts to use the PSE or CSE as indicators of whether assistance has been reduced or whether commitments to reduce assistance have been
32

respected, have highlighted a number of issues. The main problem encountered has been that external reference prices, and hence PSEs, may change significantly without any change in domestic policy having occurred. Reference prices may change as a result of an exchange rate change, a change in the trade practices of a large country or a non-policy related change in the supply and demand condi- tions prevailing in world markets (such as adverse weather conditions). In prac- tice, the impact of such changes on PSEs has often been so large as to offset or reverse the impact of changes in domestic support prices or budget-based subsidies.
Wide fluctuations in PSEs for the most part reflect the existence of transmis- sion barriers which isolate domestic prices from world prices so that the former are unresponsive to the latter. In practice, this is the principal explanation for volatility in PSEs. An ad valorem tariff for example would result in a much more stable level of PSE as domestic prices responded to world prices although the absolute level of PSE could be high. On the other hand, mechanisms such as import quotas, variable import levies and export subsidies prevent the transmis- sion of world price changes to domestic prices. Since such measures insulate domestic markets from world price developments and are mirrored in fluctuations in PSEs, such fluctuations are an indicator that the domestic market signals are distorted and lead to inefficient resource allocation decisions.
The evaluation of policy reform in the OECD monitoring process would be enhanced if PSE changes from year to year were disaggregated into policy and non-policy components. Work is currently underway to develop a method which can be applied systematically to all the countries, at least for the market and producer price support component of the PSE (currently accounting for around 75 per cent of the total PSE for the OECD but with variations between countries). Conceptually this would involve calculating PSEs on the basis of the previous year's world reference price, as a means of isolating the impact on the market price support element (or deficiency payment element) of changes in domestic support prices.
2. The treatment of supply control
Whether a PSE adequately reflects the impact of supply control measures has been a major concern in recent years given the increasing importance of such controls in OECD countries. Interest in the issue has resulted in a request by some countries that the PSE be adjusted. The adjustment suggested by some commen- t a t o r ~ ' ~ is to give "credit" to "large" countries implementing supply controls, because by doing so they contribute to firmer world prices and thus reduce the domestic/external price gap. However, any change in world price affects the price gap for all countries and no "credits" are given, nor could be, as the PSE measures the actual transfers for any policy that influences the level of world
33
price. One way to measure the credit for both large and small countries imple- menting supply control policies would be to establish, with the appropriate elas- ticities of supply, the guaranteed price which would bring forth the same output as achieved with the supply control, the price gap being the difference between the observed world price and this notional price. But this, again, would understate the actual transfers. Moreover, consumers continue to pay the observed, higher price. Nevertheless, insofar as the quantity is reduced, the total PSE measure is reduced when multiplied by any given price gap, although not the percentage PSE except as a result of world prices changing - which is common to all countries.
Dissatisfaction with the ability of the PSE to reflect the impact of a supply control measure arises from a basic misunderstanding about the concept which aims to measure transfers, not the distortions to production. To the extent that a supply control stabilises or reduces production the effect is correctly captured within the PSE, in overall terms, directly through the volume of production. Thus, the total PSE is smaller than it would have been had production continued to increase. In terms of the transfer measurement there is no need to estimate the level of production which would occur in the absence of the supply control.
The difficulty arises in attempting to use the PSE as a measure of trade distortion. Clearly there may be a significant difference between the trade effect of an open-ended market price support programme and one operated in conjunction with a supply control. Although the level of PSE may be the same, there is clearly a difference between the trade impact of a domestic price increase granted to a supply-managed commodity and that of an increase granted within an open- ended support system. Various ideas have been put forward which, beginning with the basic PSE data, would result in a derived indicator which would not measure transfers or assistance but rather the "production incentive" or the "trade distortion equivalent" (TDE)14. The TDE attempts to identify the hypotheti- cal "shadow" price which would have brought forth the actual level of production occurring under the supply control and the price gap is measured by reference to this hypothetical shadow price. Thus, the TDE, recognising that the PSE and CSE are essentially measures of transfers, attempts to convert them into a measure of trade distortion by the application of coefficients to the various component elements of PSEs and CSEs, varying between 0 and 1, depending on the assumed degree of trade distortion associated with a given measure.
B. PSEs and CSEs in the Ministerial Trade Mandate, monitoring of agri- cultural policy reform and the Uruguay Round
The original objective of the PSE calculations was to be a vehicle whereby analytically difficult problems posed by the mandate delivered by the Ministerial Council in 1982 could be solved. Before any analysis of the impact of a balanced and gradual reduction in protection could be undertaken, it was necessary to
34
construct some measure of assistance. As the exercise evolved attention focused increasingly on the PSE as a measure of assistance and the vehicle for an intense mutual scrutiny of a wide range of policies thought to affect agricultural trade among the Member countries of the OECD. PSEs and CSEs are thus now widely compared across commodities, countries and through time.
The development of the PSE and CSE calculations within the OECD has led to the collection and dissemination among the Member countries of a large volume of policy information capable of being summarised in a single indicator representing the value of agricultural policy-related transfers to producers of agricultural com- modities. The measurement effort itself has fostered improved understanding of the relationships between domestic policy and border measures. The notion of subsidies to agriculture as entirely budget-based has been demonstrated to be extremely misleading; on the contrary, transfers from consumers account for the major share of the total PSEs. The 1987 Ministerial Council of the OECD specifi- cally required the improvement of quantitative indicators of assistance. This new mandate has been implemented through an annual monitoring of policy changes with a view to determining to what extent the reform of agricultural policy is being implemented in the direction desired by Ministers. The PSE/CSE is an essential element in this monitoring process and in analysing alternative policy measures. In a different context, but as a monitoring device, the PSE is used in the Canada- U.S. Free Trade Agreement where it forms the basis for the calculation of subsidy equalisation on grains to trigger the relaxation of Canadian import licenses.
In the Uruguay Round, the explicit inclusion of domestic policy in the agricul- ture negotiation was at least partially inspired by the analysis which has been carried out in OECD on the basis of PSEs/CSEs15. The initial United States proposal in 1987 called for an elimination of all trade-distorting subsidies (both domestic measures and border measures) and envisaged a specific role for the PSE both as a preliminary means of identifying the subsidies to be eliminated and a vehicle for supervising or monitoring their removal. The EC's proposal for an Aggregate Measure of Support is derived from the OECD PSE. The proposals of the Cairns Group of so-called "fair trading" countries also contains a specific role for PSE or related measures. The mid-term review of the Uruguay Round, com- pleted in April 1989, reiterated the role of an aggregate measurement of support' 6.
V. CONCLUSIONS
The measurement of agricultural assistance using the concept of PSEs and CSEs was developed and has evolved as a response to the needs of policy- makers. As a result, the process needed to be straightforward, easily understood
35

and feasible, if it was to indicate to policy-makers the levels of transfers arising from the implementation of agricultural policies.
The PSE/CSE concept provides a rational framework to examine, in a struc- tured and consistent manner, all of the policies affecting agricultural production, consumption and trade. In calculating the monetary transfers that result from agricultural policies, it has enabled a more rigorous and disciplined assessment of those policies than would be provided by a purely qualitative assessment.
Nevertheless, the simplicity of the PSE and CSE measure defines the limits of the concept. In particular, it is not a measure which can provide answers to every question that is being asked of it. The measure is most meaningful as an indicator of relative, not absolute, levels of transfers and in showing the transfers resulting from changes in policies. As an aggregate measure, in which the transfers from each policy are equally weighted in the calculation, it is not useful as an indicator of the different production, consumption or trade incentives of specific policies. It is valuable as a measure of the transfers between consumers, taxpayers and producers, but it does not cast much light on the effects on net incomes of particular groups in the economy, because it is not a welfare measure. As it does not include the effects of non-agricultural policies on the agricultural sector, it is not a measure of the resource incentives of policies. Finally, although changes in PSEs and CSEs due to world price movements are indicators of domestic market insulation in countries where those movements arise from changes in exchange rates or "large country" policies, the PSEs are only a rough indicator of the degree of market ~rientation'~ and may have only a limited role in a negotiating con text.
That being said, no alternative measure of assistance is immune from the effects of "exogenous changes" and no other measure, given the techniques and data available, has the range of coverage and practicality of the PSE. While the Effective Rate of Assistance is a better indicator of the incentive effects of policies, the market price support element of the PSE is a guide to the degree of price distortion. In any event, there are formidable data problems to overcome in moving towards an ERA measure.
The work on the measurement of agricultural assistance using PSEs and CSEs is constantly evolving in the light of ongoing discussions within OECD and theoretical developments. Their evolution reflects new insights into the methods of calculation, developments in policies, data availability and the questions to which the PSEs and CSEs are required to contribute answers. PSEs and CSEs are now, or will shortly be, calculated for virtually the whole of the OECD area, for around three-quarters of agricultural production and for the most recent year.
The future directions of the work include expanding the policy, commodity, and country coverage, and improving the timeliness and quality of the data used for the PSE and CSE calculations. A number of areas could usefully be explored. Firstly, in order to identify the incentive effects of agricultural policies more
36
precisely, the PSE could be developed to approximate more closely an effective rate of assistance measure. This would, however, require an expansion of resources and data and is not feasible in the short-term. Secondly - and this is already being explored - the components of the PSE could be examined in terms of their effects on production, consumption and trade. This is crucial to the debate on moving towards alternative methods of support to farmers which are, as far as possible, "production neutral" or least-distorting to resource allocation. Thirdly, in conjunction with modelling developments, the PSEs may be estimated for particu- lar groups of farms or regions in terms of both the overall level of transfers and the effects of those transfers on their incomes. This is important information in any discussion of alternative methods of support.
37
1. 2. 3. 4. 5. 6. 7. 8.
9.
10.
NOTES
FAO (1 973, 1975) for details.
Corden (1957, 1966, 1971, 1974). OECD (1982). OECD (1 987a) for the series of country studies.
OECD (1 988, 1989). OECD (1 987b). OECD (1 9874. While the PSE/CSE concept was specifically developed to estimate assistance to the agricultural sector, it can be applied to measure assistance to other sectors of the economy. For example, it has been used to measure assistance to the coal industries in OECD countries (Steenblik and Wigley). The term assistance is used in the broadest sense to encompass the range of policy measures, although other terms - support, protection and transfers - are conventionally employed in this context.
The concept of PSE should be interpreted with care. The PSE is one of several "indica- tors" which measure asistance to producers. Broadly speaking it measures the gross costs to consumers and taxpayers which are transferred as benefits to the agricultural sector. However, as such the PSE does not attempt to be a welfare measure: there are costs associated with the transfer mechanisms, some of the benefits of programmes may be captured by consumers (such as research and development or inspection services), by import suppliers or food processors, the producer "deadweight" losses are not captured in net income and part of the transfer to producers simply offsets the price-depressing effects of policies in all countries on world market prices. The original concept of the PSE (as used in the FAO study and in the first OECD studies) defined the "subsidy equivalent" as the level of income (or revenue) necessary to "compensate" producers for the removal of the policy. However, if agricultural policies were removed, the level of world prices and the conditions of production that would result in an "ex post" level of compensation would be different from that calculated "ex ante". In effect, "compensation" introduces a dynamic element into a static method of calculation in which it is implicitly assumed that the price elasticities of demand and supply at the current level of production and con- sumption are zero and that the levels and mix of inputs remains unchanged. The level of compensation is more clearly understood in the context of a modelling exercise, using the appropriate elasticities, than in the definition of the PSE itself, which focuses on the static measure of aggregate transfers. Readers are referred to the articles on the MTM and WALRAS models elsewhere in this volume for illustrations of how the PSEs/CSEs can be used in both partial and general equilibrium frameworks.
Other budgetary-financed support, B, is, for historical reasons, not included in the denomi- nator of the PSE expressed as a percentage of the total value of production including
38
transfers. This follows the method outlined by Josling (FAO, 1975) who expressed assistance (transfers) as a percentage of the output value to producers adjusted for "direct producer receipts". The adjusted producer value concept is meaningful in that it expresses the net cash value to producers of the commodity in question. Given that B is a more significant category in the OECD calculations than those undertaken in FAO, the
11.
12. 13. 14. 15. 16.
17.
percentage PSE exceeds 100 in some cases. Nevertheless, it is a straightforward matter ~ ~~
to include B in the denominator and recalculate the percentage PSE. In most instances, the predominance of market price support and direct payments in overall transfers results in only small reductions in the recalculated percentage expressions.
The measures are only briefly outlined in this section. A fuller discussion of the methods of calculation may be found in Strak (1982). Miller (1 986). Tangermann et al. (1 987). McClatchy (1 987).
GATT (1 986). In the context of the negotiations and policy reform the Production Entitlement Guarantee has been proposed (International Agricultural Trade Research Consortium, 1 989). The PEG is defined as a "pre-set fixed limit on the quantity of production eligible to receive support payments. Providing that this limited quantity is less than the quantity which would be produced without support, then the producers' incentive price is the market price. Consumers and users pay the free-market price and farmers receive the free-market price for any production in excess of the PEG quantity. The PEG limit should apply at both the national and the farm levels. Actual production is not controlled either at the national or farm level. Farmers are free to decide how much to produce above the supported quantity". Under a PEG scheme all border and domestic support measures would be eliminated and the level of income transfers to farmers would be determined by specifying a notional fixed domestic support price (which defines the rate of support actually paid and could be derived from PSE calculations) and a fixed limit on the quantity of production on which support payments are made. "Market orientation" may be characterised by i) the narrowing of the gap between domestic and world prices and ii) the closer alignment between movements in domestic and world prices. This means that there is a greater degree of price transmission between these markets. The PSE, being a "static" measure at a point in time is a good indicator of the price gap, but not of the degree of price transmission over time. Nevertheless, the data for the PSE calculation can be used to estimate correlations between domestic and world price movements.
39

BIBLIOGRAPHY
Balassa, B., (1 965). "Tariff protection in industrial countries: an evaluation", Journal of Political Economy, 73.
Bale, M. and E. Lutz (1 981 1, "Price distortions in agriculture and their effects: an international comparison", American Journal of Agricultural Economics, 63 (1 ) (February).
Blandford, D., H. de Gorter and D. Harvey (1989), "Farm income support with minimal trade distortions", Food Policy (August).
Blandford, D. (1 989), "Incorporating agriculture in the GATT framework". Report on Sympo- sium on Bringing Agriculture into the GATT, Annapolis, M.D., US, 19th-20th August 1988, Food Policy (May).
Corden, W.M. (1 957), "The calculation of the cost of protection", Economic Record, 33 (April),
Corden, W.M. (1966), "The structure of a tariff system and the effective protection rate",
Corden, W.M. (1 971 ), The Theory of Protection, Oxford University Press, London. Corden, W.M. (1 974). Trade Policy and Economic Welfare, Oxford University Press, London.
De Gorter, H. and D. McClatchy (1 984), Rates of Distortion as an Alternative to Rates of Protection for Analysing the Trade Effects of Agricultural Support Policies, paper presented to lnternational Agricultural Trade Research Consortium meeting, Wye Woods (August).
Easton, S. and H. Grubel (1983), "The costs and benefits of protection in a growing world", Kyklos, No. 36.
FAO (1 973), Agricultural Protection: Domestic Policy and lnternational Trade (C/73/LIM/9), Rome.
pp. 29-51.
Journal of Political Economy, 74.
FAO (1 975), Agricultural Protection and Stabilisation Policies: a Framework of Measurement in
FAO (1 958), Trends in Agricultural Trade: a Report by a Panel of fxperts (The Habeler Report),
GATT (1 962), Trade in Agricultural Products (Reports of Committee II on Country Consulta-
GATT (1 982). Agriculture in the GATT CGI 8/W/59 (20th January), Geneva. GATT (1 986). Ministerial Declaration on the Uruguay Round, 86-1 572, Geneva. Gray, H. (1 985), Free Trade or Protection?: a Pragmatic Analysis (Macmillan), London. Greenaway, D. (1 983). Trade Policy and the New Protectionism (St. Martins Press), New York. Harvey, D. (1 989), The GATT and Agriculture: the Production Entitlement Guarantee (PEG)
Option, University of Newcastle upon Tyne, United Kingdom, Department of Agricultural Economics and Food Marketing, DP 1/89.
the Context of Agricultural Support (C/75/LIM/2), Rome.
Geneva.
tions), Geneva.
40

Harvey, D. and J. Hall (1 989), "PSEs, producer benefits and transfer efficiency of the CAP and alternatives", University of Newcastle upon Tyne, United Kingdom, Department of Agricul- tural Economics and Food Marketing, DP 3/89 (October)
Haszler, H. and D. Parsons (19871, "The price adjustment gap and world agricultural policy reform", Quarterly Review of the Rural Economy (BAE) (June), Canberra.
Hathaway, D. (1 985). Agriculture and the GATT: Rewriting the Rules. Institute of International Economics, Policy Analyses in International Economics, No. 20, Washington, D.C.
Houck, J. (1 986), Elements of Agricultural Trade Policies (Macmillan), New York. Industries Assistance Commission (1 983). Assistance to Agriculture, Canberra. International Agricultural Trade Research Consortium (1 9881, Bringing Agriculture into the
GATT: Designing Acceptable Agricultural Policies, Summary Report, presented a t the Symposium, Annapolis, Maryland, United States (August).
Josling, T. (1 981 ), lntervention and Regulation in Canadian Agriculture: a Comparison of Costs and Benefits among Sectors, Economic Council of Canada (Technical Report E/ 14) (March), Ottawa.
Kierzkowski, H. (1 987), "Recent advances in international trade theory: a selective survey", Oxford Review of Economic Policy, No. 3, Oxford.
Kirby, M., H. Haszler, D. Parsons and M. Adams (1988). Early Action on Agricultural Trade Reform: Application and Effects, Australian Bureau of Agricultural and Resource Econom- ics, Discussion paper 88.3, Canberra.
Krueger, A.O., M. Schiff and A. Valdes (1 988). "Agricultural incentives in developing countries: measuring the effect of sectoral and economywide policies", The World Bank Economic Review 2, No. 3 (September).
Krugman, P. (ed.) (1 9861, Strategic Trade Policy and the New lnternational Economics (MIT), London.
McCalla, A. and T. Josling (eds.) (1 981). lmperfect Markets in Agricultural Trade, Allanheld, Osman and Co.: Montclair, N.J.
McCalla, A. and T. Josling (1 985). Agricultural Policies and World Markets (Macmillan), New York.
McKenzie, G.W. (1 982), Measuring Economic Welfare: New Methods (Cambridge University Press), Cambridge.
McClatchy, D. (1 987), The Concept of Producer Subsidy Equivalent (PSE): Some Consideration with respect to its lnternational Negotiability, Agriculture Canada, Ottawa (May), (unpublished).
McClatchy, D. (1 989), "An economic overview of the GATT negotiations in agriculture", Market Commentary, Agriculture Canada, Ottawa (September).
MacLaren, D. (1 988), "Trade theory and agricultural trade policy analysis" in Agricultural Trade Policy Analysis (eds. A. Buckwell and A. Burrell), Wye College, Ashford, United Kingdom.
McCrone, G. (1 962). The Economics of Subsidising Agriculture (Allen and Unwin), London. Miller, G. (1 986). The Political Economy of lnternational Agricultural Policy, Department of
Nash, E.G. (1 955). "The competitive position of British agriculture", Journal of Agricultural
OECD (1 982). Council at Ministerial Level, CommuniquB, PRESS/A(82)25 (1 1 th May).
Primary Industry, Canberra.
Economics (June).
OECD (1 987a). National Policies and Agricultural Trade - Country Studies: Australia; Austria; Canada: European Economic Community; Japan; New Zealand; United States.
OECD (1 987b). National Policies and Agricultural Trade (Synthesis Report) (1 987). OECD (1 9 8 7 ~ ) . Council at Ministerial Level, Communiquh, PRESS/A(87)27 (1 3th May). OECD (1 988). National Policies and Agricultural Trade, Country Study: Sweden.
OECD (1 989). National Policies and Agricultural Trade, Country Study: Finland.
Pearson, S. and J. Monke (1 987), The Policy Analysis Matrix: a Manual for Practitioners, Pragma Corporation, Washington, D.C.
Peters, G.H. (1 988), "The interpretation and use of producer subsidy equivalents", Oxford Agrarian Studies, Vol. XVII, Oxford.
Reeves, G. (1 987). "World Agricultural Trade and the New GATT Round", Journal of Agricul- tural Economics (September).
Scandizzo, P. and C. Bruce (1 980), Methodologies for Measuring Agriculture Price Intervention Effects, World Bank Staff Working Paper No. 394, June, Washington, D.C.
Schultz, T. (ed.) (1 978). Distortion of Agricultural Incentives, Indiana University Press, Bloom- ington, United States.
Schwartz, N. and S. Parker (1 988) "Measuring government intervention in agriculture for the GATT negotiations", American Journal of Agricultural Economics, Vol. 70, No. 5 (December).
Steenblik, R. and K. Wigley, "Coal policies and trade barriers", Energy Policy (forthcoming). Strak, J. (1 982) Measurement of Agricultural Protection, Trade Policy Research Centre for
Macmillan, London.
Tangermann, S., T. Josling and S. Pearson (1 987), "Multilateral negotiations on farm support levels", The World Economy (September).
Tangermann, S. and T. Josling (1 988) Measuring Levels of Protection in Agriculture: a Survey of Approaches and Results, paper presented at the XX International Conference of Agricul- tural Economists, Buenos Aires, September (forthcoming).
USDA (1 987), Government Intervention in Agriculture: Measurement, Evaluation and Implica- tions for Trade Negotiations, Foreign Agricultural Economic Report, No. 299, Economic Research Service (April), Washington, D.C.
USDA (1 988). Estimates of Producer and Consumer Subsidy Equivalents: Government Interven- tion in Agriculture 7 982-7 986, Agriculture and Trade Analysis Division, Economic Research Service, ERS Staff Report No. AGES8801 27 (April).
Valdes, A. and J. Zeitz (1980). Agricultural Protection in OECD Countries: its Cost to Less Developed Countries, Research Report 21, International Food Policy Research Institute (December), Washington, D.C.
Verniere, L. (1 989), Protection du secteur agricole et methodologie de /'Equivalent-subvention a la production (ESP), Direction de la Prhvision, France, Document de travail (89-3). Paris.
Warley, T.K. (1988), Agriculture in the GATT: Past and Future, paper presented at the XX International Conference of Agricultural Economists, Buenos Aires (September), (forthcoming).
Webb, A. (1 984), Protection in Agricultural Markets, ERS Staff Report No. AGES850524, US Department of Agriculture, Washington, D.C.
4 2

Zeitz, J. and A. Valdes (1 986), The Costs of Protection to Developing Countries: an Analysis of Selected Agricultural Products, IBRD Staff Working Paper No. 769, World Bank, Washing- ton, D.C.
Zeitz, J. and A. Valdes (1 988). Agriculture in the GATT: an Analysis of Alternative Approaches to Reform, Research Report 70, International Food Policy Research Institute (November), Washington, D.C.
43