Embed Size (px)
Citation preview
CLEAN WELL FIELD REMEDIAL INVESTIGATIONAND FEASIBILITY STUDY
TOWN AND CITY OF OLEAN, NEW YORK
Volume II - Appendices C, D, E, & F
Prepared for:New York StateDepartment of
Environmental Conservation50 Wolf Road, Albany, New York 12233
Henry G. Williams, CommissionerDivision of Solid and Hazardous WasteNorman H. Nosenchuck, P.E., Director
Submitted by:
ENGINEERING-SCIENCEin association withDAMES & MOORE
FEBRUARY 1985 300253

JCLEAN HELL FIELD REMEDIAL
INVESTIGATION/FEASIBILITY STUDYABBREVIATED TABLE OF CONTENTS
VOLUME 1 MAIN REPORT AND APPENDICES A AND B
Executive SummarySection 1.0 introductionSection 2.0 Remedial InvestigationSection 3.0 Feasibility StudySection 4.0 Recommended Remedial AlternativesReferencesAppendix A - Biographical Data on Project Team
PersonnelAppendix B - Glossary
VOLUME 2 APPENDICES C, D, E, AND F
Appendix CAppendix DAppendix EAppendix F
VOLUME 3 APPENDIX G
Field procedurespump Test DataGeotechnical -ResultsBoring, Geophysical Boring andMonitoring Well Logs
Appendix G - Laboratory Analytical Data
VOLUME 4 APPENDICES H, I, AND J
Appendix H - Computer ModellingAppendix I - Geophysical SurveyAppendix J - Infiltration and Inflow Study
300260851J93
APPENDIX C
FIELD PROCEDURES
3002G1

APPENDIX C
FIELD PROCEDURES
FIELD PROCEDURES FOR RESIDENTIAL WELL SAMPLING
Two rounds of residential well sampling were performed during the
periods April 2, 1984 - April 8, 1984 and November 12, 1984 - November
16, 1984, with assistance from the Cattaraugus County Department ofHealth. Sampling locations (homes and businesses) were chosen by theDepartment of Health.
A standardized methodology was employed to collect and analyze
water samples from several private wells. Residential well water sam-ples from the study area were collected for the following purposes:
o To examine the quality of the drinking water of the residencesin the study area.
o To provide information regarding the extent and severity ofgroundwater contamination.
o To evaluate contaminant migration patterns.
Water samples, collected during the first round, were analyzed for the
following parameters:
Trichloroethylene
1,1,1-TrichloroethaneTetrachloroethylene1,2-dichloroethyleneBis(2-ethylhexyl)phthalate
Chloroform
Carbon Tetrachloride
Methylene Chloride 3002G2C-1
851J93
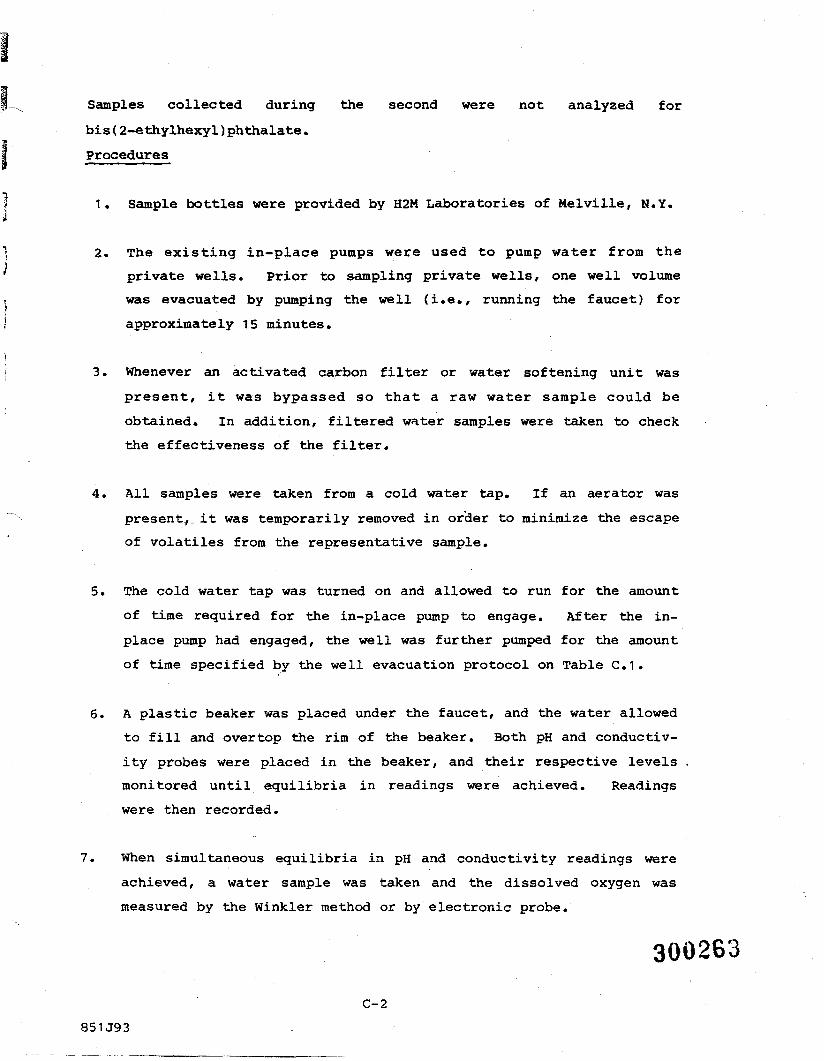
Samples collected during the second were not analyzed for
bis(2-ethylhexyl)phthalate.Procedures
1. Sample bottles were provided by H2M Laboratories of Melville, N.Y.
2. The existing in-place pumps were used to pump water from theprivate wells. Prior to sampling private wells, one well volumewas evacuated by pumping the well (i.e., running the faucet) for
approximately 15 minutes.
3. Whenever an activated carbon filter or water softening unit waspresent, it was bypassed so that a raw water sample could be
obtained. In addition, filtered water samples were taken to checkthe effectiveness of the filter.
4. All samples were taken from a cold water tap. If an aerator was
present, it was temporarily removed in order to minimize the escapeof volatiles from the representative sample.
5. The cold water tap was turned on and allowed to run for the amountof time required for the in-place pump to engage. After the in-
place pump had engaged, the well was further pumped for the amount
of time specified by the well evacuation protocol on Table C.I.
6. A plastic beaker was placed under the faucet, and the water allowedto fill and overtop the rim of the beaker. Both pH and conductiv-
ity probes were placed in the beaker, and their respective levelsmonitored until equilibria in readings were achieved. Readings
were then recorded.
7. When simultaneous equilibria in pH and conductivity readings were
achieved, a water sample was taken and the dissolved oxygen was
measured by the Winkler method or by electronic probe.
300263
C-2851J93

TABLE C.1EVACUATION PROTOCOL FOR PRIVATE WELLS
(One Case Evacuation)
Location
CasingDiameter(in)
Evacuation Time, (min)
Deep WellJet Pump
Shallow WellJet Pump
1/3 hp 1/2 hp 1/3 hp 1/2 hp
Submersible___Pump
1/2 hp
Sereca, Butler &Andrews Streets
4
6
8
4.5
10.2
18
3.5
7.8
13.8
3.5
7.8
13.8
East State Street 4
6
8
1.4
3.2
5.6
1 .3
2.9
5.2
3.5
7.7
14
3.5
7.7
14
1 .3
2.9
5.2
851J93C-3
300264

1v 8. A water sampling apparatus was set up while the dissolved oxygen
_^~" test was being performed. Figure C.1 illustrates the device by5j| which water samples were collected.
1! 9. A stainless steel screw-in adaptor was placed on the tap nozzle if
«***
it was internally threaded. Disposable silicone hose was fitted to
j the adaptor and extended to the sample bottle. The other end of-j
the silicone hose was fitted over the small end of a one-hole"^ neoprene stopper. A teflon tube was pushed up through the stopper
~° hole, extending into the silicone hose. The other end of the-—.. teflon tube was pushed through another neoprene stopper that was__, fitted into the flask mouth and positioned at the bottom of the
flask.
A length of smaller diameter silicone tubing was attached to the
side hose connection spout on the flask. This was the tube used
for filling sample bottles.
The apparatus functioned as follows: the water was run (at a low
pressure) from the tap through the adaptor and tubing into thebottom of the flask. As the water level inside the flask rose,
sediments and particulate matter settled out of suspension onto the
flask bottom.
The side arm hose was clamped shut until water had filled the
entire flask volume and no air was present inside. At this point,the hose was undamped, and the water allowed to pass through. The
purpose of evacuating all of the air from the system was to mini-mize volatilization of chemicals during the sampling.
Similarly, a brass adaptor extension was employed for externally
threaded taps (i.e., outdoor and cellar faucets). The rest of thesampling system remained unchanged.
30026'C-4
851J93

Teflon Tubing
Flask
Sample Bottle
SAMPLING DEVICE FOR PRIVATE (RESIDENTIAL) WELLSNOT TO SCALE 300266
C-5FIGURE C.1
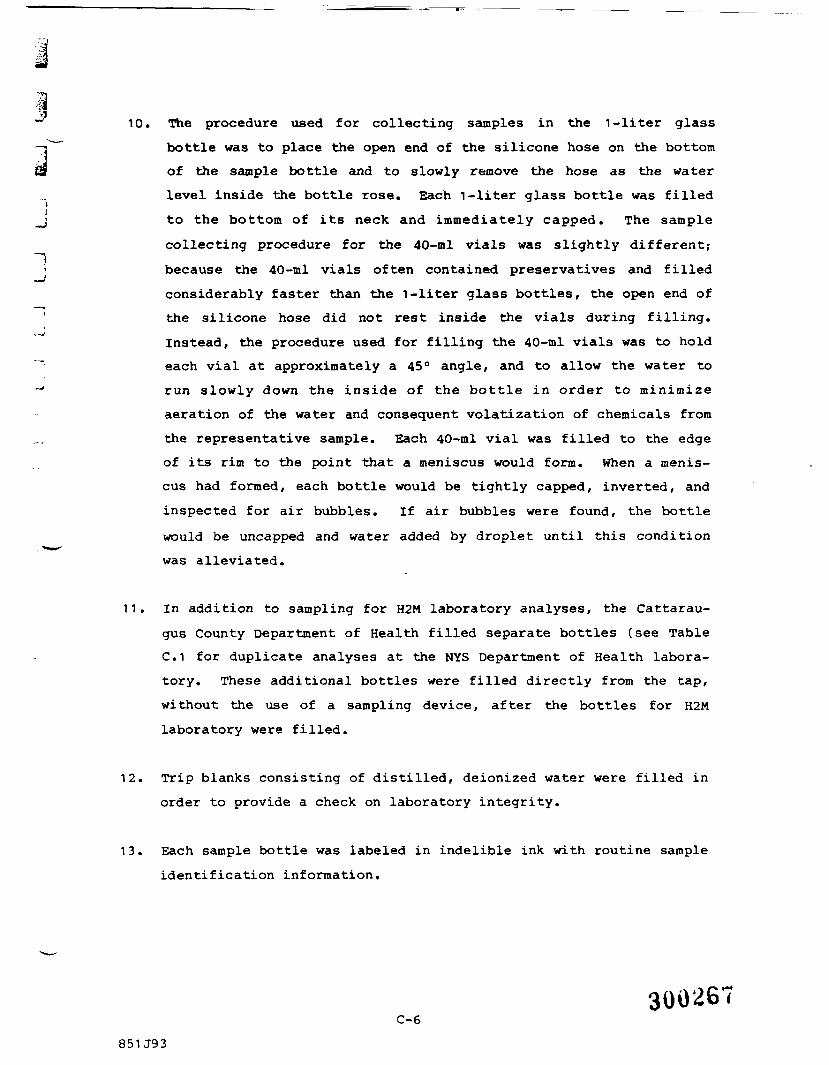
10. The procedure used for collecting samples in the 1-liter glass
3^~~ bottle was to place the open end of the silicone hose on the bottomof the sample bottle and to slowly remove the hose as the waterlevel inside the bottle rose. Each 1-liter glass bottle was filled
_j to the bottom of its neck and immediately capped. The sample
collecting procedure for the 40-ml vials was slightly different;"1
• because the 40-ml vials often contained preservatives and filled—J
considerably faster than the 1-liter glass bottles, the open end of' the silicone hose did not rest inside the vials during filling.
Instead, the procedure used for filling the 40-ml vials was to holdeach vial at approximately a 45° angle, and to allow the water to
-"• run slowly down the inside of the bottle in order to minimizeaeration of the water and consequent volatization of chemicals from
the representative sample. Each 40-ml vial was filled to the edgeof its rim to the point that a meniscus would form. When a menis-cus had formed, each bottle would be tightly capped, inverted, and
inspected for air bubbles. If air bubbles were found, the bottle
would be uncapped and water added by droplet until this condition
was alleviated.
11. In addition to sampling for H2M laboratory analyses, the Cattarau-
gus County Department of Health filled separate bottles (see TableC.1 for duplicate analyses at the NYS Department of Health labora-tory. These additional bottles were filled directly from the tap,
without the use of a sampling device, after the bottles for H2M
laboratory were filled.
12. Trip blanks consisting of distilled, deionized water were filled inorder to provide a check on laboratory integrity.
13. Each sample bottle was labeled in indelible ink with routine sample
identification information.
300267C-6
851J93

14. Bottles were then re-wrapped in original packaging materials(plastic bubble wrap) and placed in shipping coolers. plasticzip-loc bags filled with ice were placed around the bottles for useas a .refrigerant and to provide cushioning protection during trans-portation.
15. Chain of custody documents packaged inside plastic zip-loc bagswere enclosed in each cooler before shipping.
16. All equipment was washed with hexane and methanol and given adistilled water rinse between samples.
DRILLING, WELL INSTALLATION, AND WELL DEVELOPMENT
DrillingAfter a review of CDM borehold data and electromagnetic conductiv-
ity and resistivity surveys done by Technos Inc. (Appendix I) a drilling
program was designed and implemented. Drilling was performed by Buffalo .Drilling Company, Inc., with a 1978 CME-55 drill rig mounted on a 1978Ford F600 series 4x4 truck equipped with a pump water tank and other
miscellaneous equipment. A 6 1/4" I.D. hoHow-stemmed continuous flight
auger was used for all borings except CW10B, CW9A, CW10A, CW13A, CW13B,
CW15A, CW17, CW17A, CW18A which were drilled with a 3 1/2" I.D. hollow-
stemmed continuous flight auger. All augers were steam-cleaned betweenborings to prevent cross-contamination during drilling. On occasion, a
rotary bit and clean water were used to penetrate dense till or largepieces of gravel.
Soil samples were taken by an open-drive split-spoon sampler.
Borings were sampled continuously at 2-foot intervals until the thick
sequence of sand and gravel was penetrated. Thereafter, the samplingmethod was standard sampling at 5-foot intervals. Glass sample jarswere provided by the drilling subcontractor.Well installation
Well installation took place immediately after drilling. For CW13B
a 2" I.D. Schedule-40 PVC pipe with a 2-foot section slotted at the
bottom was used. For all CW and SW wells, except for CW13B, a 10-foot
long 2" Johnson stainless steel wire-wound continuous slot (.020")
c-7 3002G8851J93

screen and 2" I.D. stainless steel riser pipe was used. The pipesections were 10 feet long and flush-jointed; all joints were
additionally secured with teflon tape. All screens and pipe sectionswere cleaned by steaming or washing with hexane, methanol, and distilledwater prior to installation.
Upon completing the screen and riser pipe emplacement, a No. 3
Q-rok sand filter was placed into the annulus to a height of two to fourfeet above the tip of the screened interval. An approximately 2-feet
thick primary bentonite seal was set on top of the sand pack. When
installing the shallow wells, a concrete backfill was poured on top of
the bentonite seal to the ground surface and a 6" O.D. steel protective
casing with a locking cap was installed. After placing the primarybentonite seal in the deep wells, the auger was gradually withdrawn andmiscellaneous backfill material was placed in the hole. Supplementarybentonite seals were emplaced within the column of backfill when it wasnecessary to hydraulically separate geologic units or when the column of
backfill exceeded 40 feet. At the 4-foot depth, concrete was placed on
top of the miscellaneous backfill; or in some cases, a final bentonite
seal; and a 6" O.D. steel protective casing with a locking cap was
installed.
For the bundle piezometers (BP-1 and BP-2), 1/4" I.D. PVC tubes
were placed at approximately 10-foot intervals throughout the entire
soil column under study. Sections of PVC 10-feet long were flush-jointed and the joints were additionally sealed with teflon tape. The
bottom 1-foot of each piezometer was slotted Bentonite seals were placedabove each piezometer tip and sand was backfilled into the borehole
between each bentonite seal. At the 1-foot depth concrete was poured on
top of the sand and a 6" O.D. steel protective casing with a locking cap
was installed.
Relative ground elevation of all wells was surveyed by Manley C.Ackerman Co. These elevations can be found in Table C.2. Table C.3
presents a summary of the drilling and well installation for each
boring. The well schematic for each well can be found in Appendix F.
c-8 300263851J93
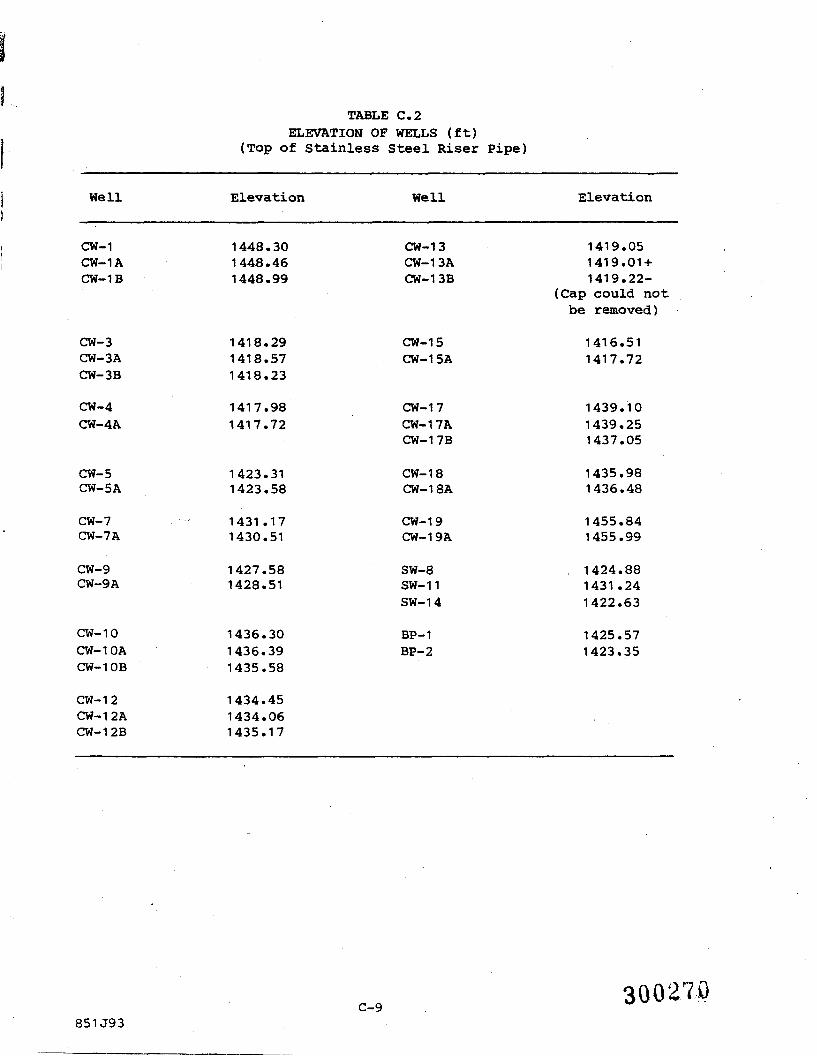
TABLE C.2ELEVATION OF WELLS (ft)
(Top of Stainless Steel Riser Pipe)
Well Elevation Well Elevation
CW-1CW-1ACW-1B
1448.301448.461448.99
CW-1 3CW-13ACW-13B
1419.051419.01+1419.22-
(Cap could notbe removed)
CW-3CW-3ACW-3B
CW-4CW-4A
CW-5CW-5A
CW-7CW-7A
CW-9CW-9A
CW-10CW-10ACW-1 OB
CW-1 2CW-1 2 ACW-12B
1418.291418.571418.23
1417.981417.72
1423.311423.58
1431.171430.51
1427.581428.51
1436.301436.391435.58
1434.451434.061435.17
CW-1 5CW-1 5A
CW-1 7CW-17ACW-17B
CW-1 8CW-18A
CW-1 9CW-19A
SW-8SW-11SW-14
BP-1BP-2
1416.511417.72
1439.101439.251437.05
1435.981436.48
1455.841455.99
1424.881431.241422.63
1425.571423.35
851J93C-9
300273
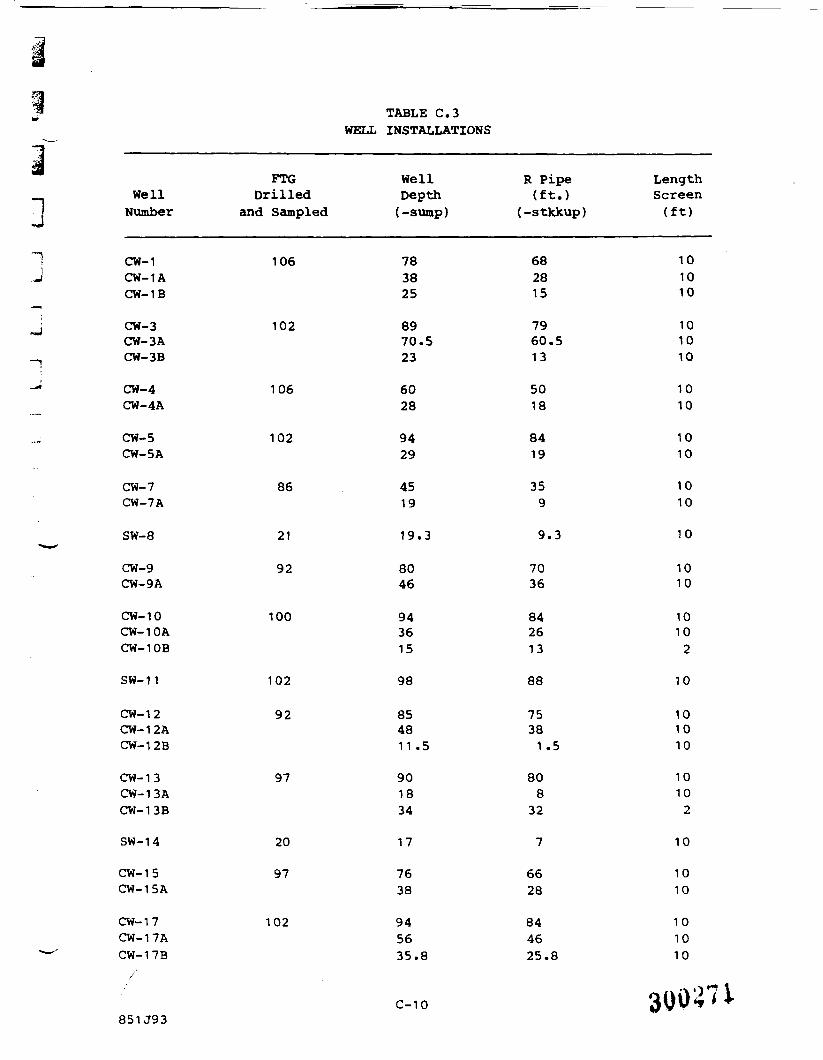
TABLE C.3WELL INSTALLATIONS
3~iJ
.Jn_«•. —
_
"-
WellNumber
CW-1CW-1ACW-1B
CW-3CW-3ACW-3B
CW-4CW-4A
CW-5CW-5A
CW-7CW-7A
SW-8
CW-9CW-9A
CW-10CW-10ACW-1 OB
SW-11
CW-1 2CW-12ACW-12B
CW-1 3CW-13ACW-13B
SW-14
CW-1 5CW-15A
CW-1 7CW-17ACW-17B
FTGDrilled
and Sampled
106
102
106
102
86
21
92
100
102
92
97
20
97
102
WellDepth
(-sump)
783825
8970.523
6028
9429
4519
19.3
8046
943615
98
854811 .5
901834
17
7638
945635.8
R Pipe(f t . )
(-stkkup)
682815
7960.513
5018
8419
359
9.3
7036
842613
88
7538
1.5
808
32
7
6628
844625.8
LengthScreen
( f t )
101010
101010
1010
1010
1010
10
1010
1010
2
10
101010
1010
2
10
1010
101010
C-10851J93
30031 J.
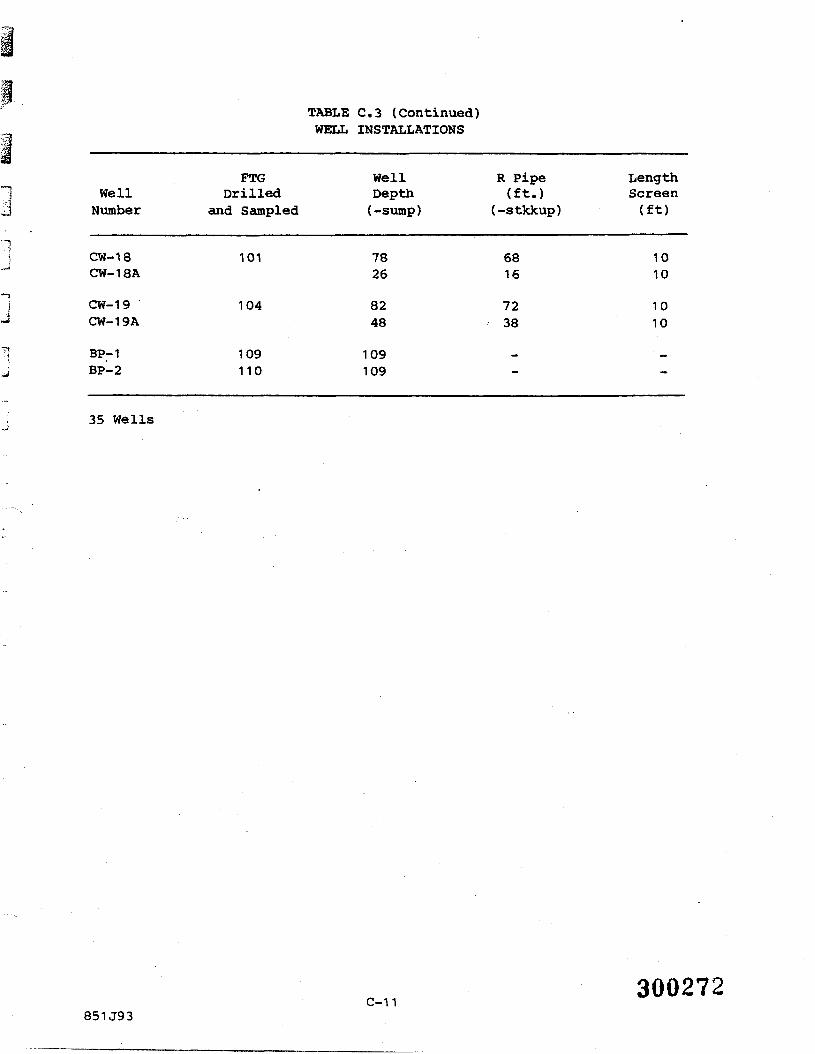
TABLE C.3 (Continued)WELL INSTALLATIONS
WellNumber
CW-18CW-18A
CW-19CW-19A
BP-1BP-2
PTGDrilled
and Sampled
101
104
109110
WellDepth(-sump)
7826
8248
109109
R Pipe(ft.)
(-stkkup)
6816
7238
—
—
LengthScreen(ft)
1010
1010
—
—
35 Wells
300272C-11
851J93
Well Development
The steps followed for well development were as follows:
1. The open end piece of PVC (1") was set to the silt in the well.
Care was taken not to jam it into silt so that it did not become
plugged at the end.
2. The pipe and fitting that goes over well casing was tied down.
3. Compressor hooked up.
4. The well was blown out at 20 minute intervals with a 15 minute rest
in between intervals.
a. This was repeated five times or until discharge was free of
silt (discharge can be cloudy but not dirty as in beginning of
operation).
b. This was repeated at least three times.
5. The open ended blower section was removed and replaced with a 10'section with holes bored throughout. This was used to blow out
into the filter sand (Q rock) through the screen.
a. This was repeated at 10 minute intervals with 10 minute rests
in between.
b. This was repeated at least four times.
6. The open end piece was re-set for 20 minutes at the end.
These procedures depended on the amount of silt in the discharge, the
amount of sand in the discharge, and the amount of water in the well
(quantity of discharge).
300273C-12
851J93

* Mote: Some wells that had little water could have water siphoned or
T pumped into them and then blown out.
_ MONITORING WELL SAMPLING
,J The first round of groundwater sampling was done over a period of 8days (8/21/84; 9/11/84-9/14/84; 9/19/84-9/21/84), and the second round
j of sampling was done in 5 days (11/12/84-11/16/84). The sampling of•••*
monitoring wells consists of three parts: well evacuation, well sam-; pling, and analytical field tests. Each of these procedures is
-J described below.
" Well Evacuation•"" Prior to sampling a monitoring well, the static water level was
recorded and at least two well volumes of water were removed to assure
.„ that the water in the well was truly representative of the groundwater.For shallow wells, or deep wells with a relatively low static water
level, evacuation was accomplished by using a 1075 cc capacity teflon
bailer with a ball check valve at its lower end. An airlift system,
similar in principal to a positive displacement pump, was used to eva-cuate the deeper wells at a rate of approximately 1 gpm. Tables C.4 and
C.5 indicate the methods of evacuation for the individual wells duringboth rounds of sampling.
Sampling Procedure
Following recovery from final evacuation, groundwater samples werecollected according to the procedure summarized on Table C.6. For deep
wells and wells suspected of high contamination, the samples were col-lected using a positive displacement device with a check valve at its
lower end. The advantage of a positive displacement pump is that it
limits degassing and volatilization of contamination when a sample is
removed from a deep well. For shallow wells and wells suspected of the
least contamination, samples were collected using either a stainlesssteel or a teflon bailer with a bail check valve at its lower end.Incorporation of a check valve onto the bailers assures that a sample is
representative of the depth to which the bailer is lowered. Tables C.4
and C.5 list the method of sampling for the individual wells during both
-—- sampling rounds, as well as the tested chemical parameters. All sampleswere removed from a depth just above the well screen to further assure a
300274C-13
851J93

CW-10
CW-10A
TABLE C.4METHODS OF EVACUATION AND SAMPLING
(First Round of Sampling)
Well Depth ofNo. Sample (ft)
CW-1
CW-1A
CW-1B
CW-3
CW-3 A
CW-3B
CW-4
CW-4A
CW-5
CW-5A
CW-7
CW-7A
SW-8
CW-9
CW-9A
80.0
40.0
27.0
91 .0
72.5
25.0
60.0
30.0
96.0
31 .0
47.0
21 .0
21 .3
82.0
14.9
Methodof WellEvacuation
Air lift
Bailer
Bailer
Air lift
Air lift
Bailer
Bailer
' Bailer
Air lift
Bailer
Bailer
Bailer
Bailer
Bai ler
Air lift
Method ofGround Water Sampling
Stainless Bailer
Teflon Bailer
Teflon Bailer
Positive Displacement(Type A)
Positive Displacement(Type A)
Teflon Bailer
Teflon Bailer
Teflon Bailer
Positive Displacement(Type A)
Teflon Bailer
Teflon Bailer
Teflon Bailer
Stainless Bailer
Teflon Bailer
Positive Displacement
ChemicalParametersSampled For
Indicator
Indicator
Indicator
indicator
Indicator, priority
Indicator
Indicator, cis
indicator, cis
Indicator, cis
Indicator
Indicator, listpriority
Indicator, list,cis
Indicator, cis
Indicator, list
Indicator, list,
96.0
38.0
(Type B)
Air lift Positive Displacement(Type A)
Bailer Teflon Bailer
CIS
Indicator, list
Indicator, list,cis
SW-11 100.0 Air lift Positive Displacement(Type A**)
indicator
851J93C-14
300275
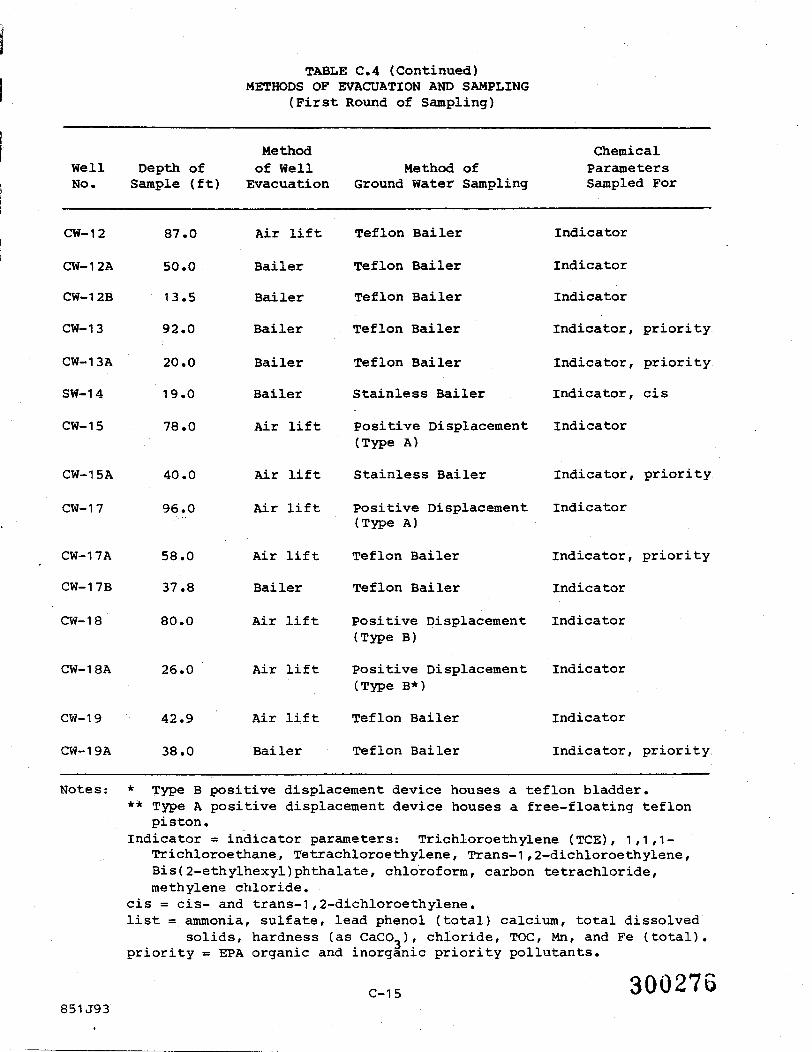
TABLE C.4 (Continued)METHODS OF EVACUATION AND SAMPLING
(First Round of Sampling)
Well Depth ofNo. Sample (ft)
CW-12
CW-12A
CW-1 2B
CW-13
CW-13A
SW-14
CW-1 5
CW-15A
CW-1 7
CW-1 7A
CW-17B
CW-1 8
CW-18A
CW-1 9
CW-1 9 A
87.0
50.0
13.5
92.0
20.0
19.0
78.0
40.0
96.0
58.0
37.8
80.0
26.0
42.9
38.0
Methodof WellEvacuation
Air lift
Bailer
Bailer
Bailer
Bailer
Bailer
Air lift
Air lift
Air lift
Air lift
Bailer
Air lift
Air lift
Air lift
Bailer
Method ofGround Water Sampling
Teflon Bailer
Teflon Bailer
Teflon Bailer
Teflon Bailer
Teflon Bailer
Stainless Bailer
Positive Displacement(Type A)
Stainless Bailer
Positive Displacement(Type A)
Teflon Bailer
Teflon Bailer
Positive Displacement(Type B)
Positive Displacement(Type B*)
Teflon Bailer
Teflon Bailer
ChemicalParametersSampled For
Indicator
Indicator
Indicator
Indicator ,
Indicator ,
indicator ,
Indicator
Indicator ,
Indicator
Indicator ,
Indicator
Indicator
Indicator
Indicator
Indicator,
priority
priority
cis
priority
priority
priority.
Notes: * Type B positive displacement device houses a teflon bladder.** Type A positive displacement device houses a free-floating teflon
piston.Indicator = indicator parameters: Trichloroethylene (TCE), 1,1,1-
Trichloroethane, Tetrachloroethylene, Trans-1,2-dichloroethylene,Bis(2-ethylhexyl)phthalate, chloroform, carbon tetrachloride,methylene chloride.
cis = cis- and trans-1,2-dichloroethylene.list = ammonia, sulfate, lead phenol (total) calcium, total dissolved
solids, hardness (as CaCO,), chloride, TOC, Mn, and Fe (total),priority = EPA organic and inorganic priority pollutants.
C-15 300276851J93

TABLE C.5METHODS OF EVACUATION AND SAMPLING
(Second Round of Sampling)
Depth ofWell Sample Method of Method of Chemical ParametersNo. (ft) Well Evacuation Ground Water Sampling Sampled For
CW-1 80.0 Bailer
CW-1A 40.0 Bailer
CW-1B 27.0 Bailer
CW-3 91.0 Centrifugal Pump
CW-3A 72.5 Centrifugal Pump
CW-3B 25.0 Centrifugal Pump
CW-4 62.0 Centrifugal Pump
CW-4A 30.0 Centrifugal Pump
CW-5 96.0 Centrifugal Pump
CW-5A 31 .0 Centrifugal Pump
CW-7 47.0 Centrifugal Pump
CW-7A 21.0 Centrifugal Pump
SW-8 21.3 Bailer
CW-9 82.0 Centrifugal Pump
CW-9A 48.0 Centrifugal Pump
CW-10 96.0 Centrifugal Pump
CW-10A 38.0 Centrifugal Pump
SW-11 100.0 Centrifugal Pump
Teflon Bailer
Teflon Bailer
Teflon Bailer
Positive Displacement
Positive Displacement
Teflon Bailer
Teflon Bailer
Teflon Bailer
Positive Displacement
Teflon Bailer
Teflon Bailer
Teflon Bailer
Teflon Bailer
Teflon Bailer
Teflon Bailer
Positive Displacement
Teflon Bailer
Indicator
Indicator
Indicator
Indicator
Indicator
indicator
Indicator
Indicator, metals,cyanide, phenol
Indicator
Indicator
indicator
Indicator, metals,cyanide, phenol
Indicator, metals,cyanide, phenol
Indicator, metals,cyanide, phenol
Indicator, metals,cyanide, phenol
Indicator, metals,cyanide, phenol
Indicator, metals,cyanide, phenol
Positive Displacement Indicator
851J93C-16 300377
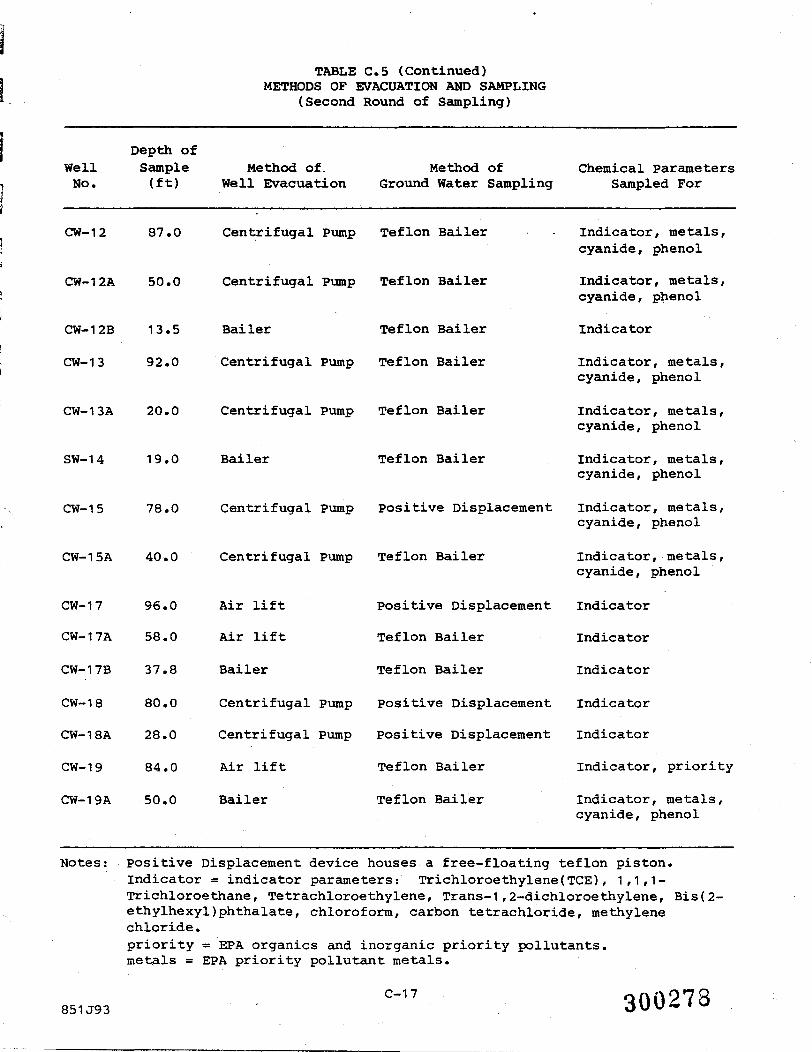
TABLE C.5 (Continued)METHODS OF EVACUATION AND SAMPLING
(Second Round of Sampling)
Depth ofWell SampleNo. (ft)
Method of.Well Evacuation
Method of Chemical parametersGround Water Sampling Sampled For
CW-12
CW-12A
CW-12B
CW-13
CW-13A
SW-14
CW-15
CW-15A
CW-17
CW-17A
CW-17B
CW-1 8
CW-18A
CW-1 9
CW-19A
87.0
50.0
13.5
92.0
20.0
19.0
78.0
40.0
96.0
58.0
37.8
80.0
28.0
84.0
50.0
Centrifugal Pump Teflon Bailer
Centrifugal Pump Teflon Bailer
Bailer Teflon Bailer
Centrifugal Pump Teflon Bailer
Centrifugal Pump Teflon Bailer
Bailer Teflon Bailer
Centrifugal Pump positive Displacement
Centrifugal pump Teflon Bailer
Air lift
Air lift
Bailer
Centrifugal Pump
Centrifugal Pump
Air lift
Bailer
Positive Displacement
Teflon Bailer
Teflon Bailer
Positive Displacement
Positive Displacement
Teflon Bailer
Teflon Bailer
Indicator, metals,cyanide, phenol
Indicator, metals,cyanide, phenol
Indicator
Indicator, metals,cyanide, phenol
Indicator, metals,cyanide, phenol
Indicator, metals,cyanide, phenol
Indicator, metals,cyanide, phenol
Indicator, metals,cyanide, phenol
Indicator
Indicator
Indicator
Indicator
indicator
Indicator, priority
Indicator, metals,cyanide, phenol
Notes:
851J93
positive Displacement device houses a free-floating teflon piston.indicator = indicator parameters: Trichloroethylene(TCE), 1,1,1-Trichloroethane, Tetrachloroethylene, Trans-1,2-dichloroethylene, Bis(2-ethylhexyl)phthalate, chloroform, carbon tetrachloride, methylenechloride.priority = EPA organics and inorganic priority pollutants.metals = EPA priority pollutant metals.
C-17 300273

TABLE C.6SAMPLING PROCEDURE FOR MONITORING WELLS
1. Well and trip blank were opened; initial static water level recordedwith an electric contact probe accurate to the nearest 0.1 ft.
2. Sampling device washed.
o Sampling device was washed with hexane, followed by methanol andfinally distilled water.
o Solvents and distilled water rinse were collected into a largefunnel which emptied into a 5-gallon container.
3. Sampling device lowered into well.
o positive displacement device lowered by the attached teflonairline and water discharge line.
o Bailer was lowered by a nylon cord; a new piece of cord was usedfor each well.
4. Sample taken.
o From positive displacement discharge tube.
- The discharge tube was inserted to the bottom of the samplebottle and withdrawn ahead of the sample so that aeration andturbulence were minimized.
o From bailer.
- Sample was poured slowly from the open end of the bailer andthe sample bottle tilted so that aeration and turbulence wereminimized.
5. Samples were capped, labelled and placed in ice filled coolersprovided by the chemical laboratory.
6. Chain-of-custody forms were completed in duplicate.
o The original copy was put into a zip-lock bag and placed intothe cooler.
o A carbon copy was kept for files at Dames & Moore.
7. Cooler was sealed with strapping tape and D&M labels to assureintegrity and to prevent tampering of samples.
8. Well and trip blank were capped.
9. All equipment was washed.
300279

1
representative groundwater sample. Before and after sampling the sam-pling device was cleaned inside and out with hexane, methanol, and then
rinsed with distilled deionized water.In additon to water samples collected from the monitoring wells,
three types of "blanks" were collected and submitted to the chemicallaboratory for analyses:
a. Trip Blank A - One-only Trip Blank A was prepared ahead of time(in D&M office). It consisted of a sample of distilled, de-
ionized water which was poured into a sample bottle, immediate-
ly capped and labelled. It accompanied the other sample
bottles into the field and to the chemical lab. It was a checkon the chemical laboratory's analysis.
b. Trip Blank B - One-for-each-day Trip Blank B samples were
prepared ahead of time (in D&M office). Each sample consistedof distilled deionized water poured into a sample bottle,
labelled and capped. Each day, a new Trip Blank B sample wasused. For each, the procedure was to open the blank when the
well was uncapped (or faucet turned on), keep Trip Blank Bopened until sampling effort was finished at the well, and cap
Trip Blank B when groundwater sample bottles were capped. Trip
Blank B was a check on the contribution of atmospheric contami-nation to the water samples.
c. Equipment/Wash Blank - Taken between selected wells. • Procedurewas as follows:
Sampling equipment (pump or bailer) washed with solvents,
collecting solvent rinse. Care was taken in the selectionof solvents, so damage to the pump would not occur. Rinsed
with distilled water.
- Sample taken of "clean" distilled deionized water.
Samples refrigerated.
300280851J93

Analytical Field Tests
Prior to filling the sample bottles, two 250-ml beakers of ground-
water were filled. The sample in one beaker was immediately analyzedfor temperature (°C), specific conductance (umhos/cm), and pH. The
sample in the other beaker was analyzed for dissolved oxygen (ppm).Specific conductance, pH, and dissolved oxygen were measured by elec-tronic probe. Temperature was measured by probe and double-checked witha thermometer. All equipment was cleaned and calibrated between eachsample. During the sampling and field testing, sampling records were
filled out. Results of these analytical field tests for both rounds ofsampling are compiled in Appendix G.
AIR QUALITY MONITORING
Air quality monitoring for organic vapors with an HNU photoioni-zation meter was implemented at each well, before, during, and after
sampling. The purpose of air quality monitoring was three-fold: 1) todetermine whether the use of respirators was needed while on-site, 2) to
locate potential "hot-spots" from which vapors may emanate, and 3) to
support or disprove suspicions regarding the locations of the areas of
high contamination. The chart records of the air quality monitoring can
be found in Appendix G.
Although the record shows some levels of air contamination above 5
ppm, none of this contamination is attributed to vapors emanating fromthe monitoring wells. Instead, the detectable readings are attributed
to background levels of gasoline fumes from a generator, and hexane andmethanol fumes from the field washing procedures.
GAMMA AND ELECTRIC LOGGING
The deepest well at each DSM installation was logged using a Mt.
Sopris 1000-C portable logging instrument to record the natural gamma,spontaneous potential (SP), and electrical resistivity of the forma-
tions. All logs were run from the bottom of the hole to the surface.
The instrument depth meter was initialized with the Probe Electrode at
ground surface at each well. Both SP and electrical resistivity werelogged simultaneously on one pass of the logging probe. The logging
probe was cleaned with distilled water between well sites. At most well
C-20
851J93
300281
sites the surface electrode was connected to the protective surface
casing. At a few well sites the surface electrode was pushed into
adjacent soil. Copies of the resulting logs are shown as figures inAppendix F.
The interpretations of these logs are based on relative changes of
all three logs, not necessarily the actual values of displacement. Thelogs were utilized in conjunction with the drilling logs in formulating
a basic understanding of the subsurface strata and in preparing geologi-
cal cross-sections.
SURFACE WATER AND SEDIMENT SAMPLING
Surface water and sediment sampling bottles were provided by H2M
Laboratories of Melville, N.Y. The locations of all sampling sites have
been designated in the Section 2 of the main report. These sitesincluded selected points along the Allegheny River, Haskell Creek, and
the unnamed tributaries to the Allegheny River; the perennial pondbehind Campbell oil Co.; and selected surface depressions and drainage
ditches. At all sampling sites except SS-6 and SED-1 both water and
sediment samples were taken. At SS-6 only a water sample was taken and
at SED-1 only a sediment sample was taken. Table C.7 lists the chemicalparameters sampled at each site. Each sample was initially collected in
a wide mouth glass jar and then the sample was decanted into a samplingjar with the appropriate preservative. The wide-mouth glass jar andthen the sample was decanted into a sampling jar with the appropriate
preservative. The wide-mouth glass jar was washed with hexane followed
by methanol and rinsed with distilled water between each sample. Care
was taken not to overfill the sampling jars, so as to avoid loss of the
sample preservative. Samples were wrapped, packaged on ice and shippedaccording to the same quality assurance procedures as described in the
sections on Residential Well Sampling and Monitoring Well Sampling.
WASTEWATER SAMPLING
Bottles for wastewater samples that were collected from outfalls
were filled directly from the end of the pipe (AVX and Alcas samples).
Bottles for water samples from industrial wells that were collected as
part of the wastewater sampling program were also filled directly.
C-21
851J93
30028!

TABLE C.7SURFACE WATER AND SEDIMENT
CHEMICAL ANALYSIS
SamplingPoint Water (W) Sediment (S)
SS-1 Indicator parameters
SS-2 Indicator parameters
SS-3 Indicator parameters and list
SS-4 Indicator parameters
SS-5 Indicator parameters
SS-6 Indicator parameters
SS-7 Indicator parameters and list
SS-8 Indicator parameters
SS-9 indicator parameters and list
SED-1 (no sample)
Indicator parameters
Indicator parameters and list
Indicator parameters and list
Indicator parameters and list
Indicator parameters
(no sample)
Indicator parameters and listand Barium
Indicator parameters
Indicator parameters
Indicator parameters and list
Indicator parameters are: Trichloroethylene (TCE), 1,1,1-Trichloroethane,Tetrachloroethylene, Trans-1,2-dichloroethylene,Bis(2-ethylhexyl)phthalate, chloroform, carbon tetrachloride, methylenechloride).
For sediment samples, list is: ammonia, sulfate, lead, phenol (total),calcium, hardness (as CaCO_), chloride, TOC, Mn and Fe (total).
For surface water samples, list is: ammonia, sulfate, lead, phenol(total), calcium, TDS, hardness.(as CaCO,), chloride, TOC, Mn and Fe(total).
C-22300283
851J93
Wastewater samples from the McGraw-Edison sewer were collected using a~T~ dip sampler. A dedicated glass bottle was inserted into the sampler form each sample to minimize contamination of samples from remants of water
_- from previous sampling locations.
IN-SITU PERMEABILITY TESTS—\ ~~——' "——•——•—•————————~~—
In order to evaluate the velocity and extent of contamination at——^
the site in Clean, a knowledge of horizontal and vertical spatial varia-tions in the aquifer hydraulic properties must be known. With this goal
"*" in mind, in-situ permeability tests (also referred to a slug or bail~" tests) were conducted at most of the monitoring wells.— Whereas pump tests give an estimate of the average hydraulic prop-
erties for an aquifer between the pumped well and observation wells,_, in-situ permeability tests give an estimate of the hydraulic properties
for a small volume of soil immediately surrounding the well screen ofthe tested well. Most of these tests were performed during the sametime period as the first round of groundwater sampling of the monitorwells. Tests were repeated during the second round of sampling ifadditional information was required. Both falling head and rising head
tests were performed.A solid slug of known volume was lowered into the well, causing the
water level in the well to rise in proportion to the volume of displacedwater. Recovery of the falling water level in the well was then moni-tored over time. After full recovery, the slug was pulled out of thewell, thereby lowering the water level in the well, again by an amountproportional to the volume of displaced water. Recovery of the risingwater level was then monitored over time.
Water level measurements were made either by manually operating anelectric contact probe or with a pressure transducer linked to a micro-processing unit with a printer. All water levels were recorded as dis-tance from the top of the riser pipe and then converted to head differ-ences relative to the initial static water level. Either the rising
head recovery or the falling head recovery data was used to calculatepermeabilities, depending on which .test showed the "smoothest" recovery.
>,_- The following formula was used to calculate horizontal hydraulic conduc-
tivity, K, (permeability).
300284851J93

APPENDIX D
PUMP TEST DATA/DISCUSSION
INTRODUCTION
30028rr
I-*
APPENDIX D
-7 PUMP TEST DATA/DISCUSSIONi
.J INTRODUCTION
. In addition to the permeability testing in monitoring wells in
Olean, spatial variations in transmissivity (T), horizontal hydraulic\ conductivity (K, ), and storativity (S) of the city aquifer have beenJ
calculated using existing data from a pump test done by Camp, Dresser
"~ and McKee (CDM) in 1982. In addition, values of aquifer properties
-"* measured during a more recent pump tests by Lozier/Groundwater
- Associates and Gerahty and Miller at the McGraw Edison Company and AVX
plant, respectively have been used for comparison in this analysis. All
hydraulic information about the city aquifer was used as input and
calibration data in the 3-D numerical simulations of the groundwaterflow system in Olean.
CDM PUMPING TEST
On april 15, 1984 CDM began pumping municipal wells 18M and 37M
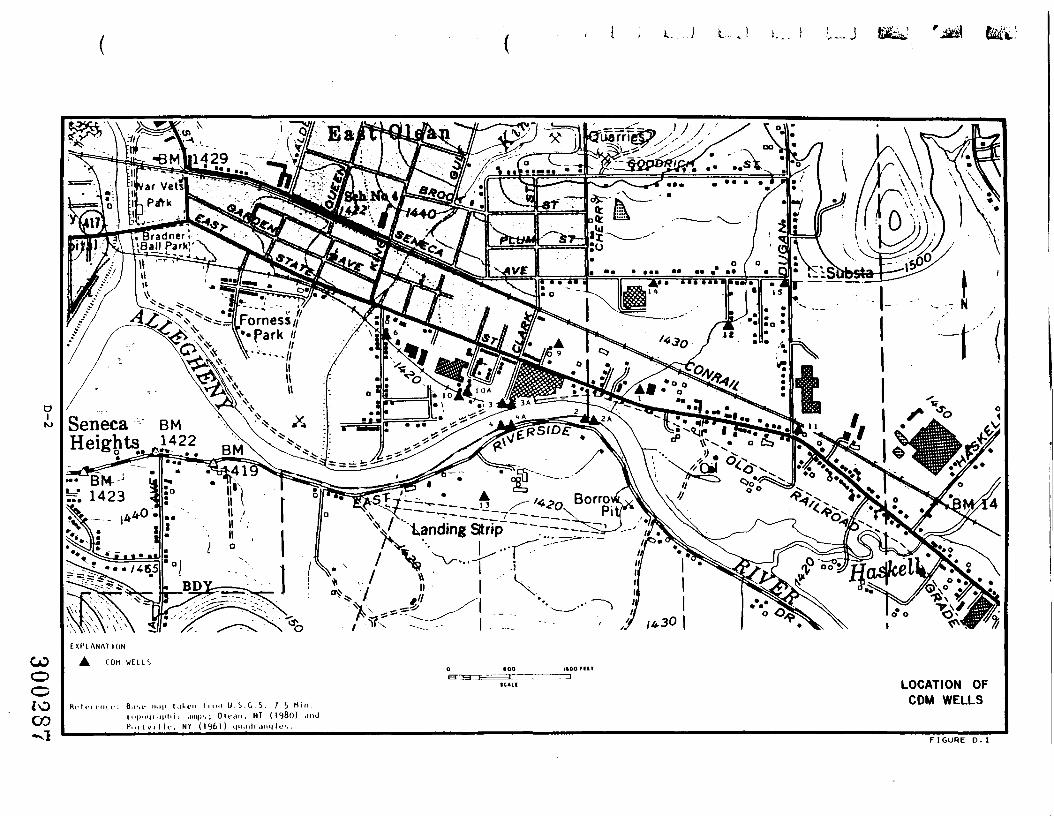
(Figure D.1) simultaneously at estimated mean discharges of 608 gpm and645 gpm respectively. Pumping stopped on May 4, 1982, nineteen days
after start-up. Sufficient drawdown and recovery data were recorded in
CDM observation wells 1, 2, 3, 4, 6, 9, 10, 12, 2A, and 10A (Figure D.1)
for analysis. Data for wells 13, 15, 11, 37M, 38M, and 13M were either
incomplete or unavailable for analysis. Preliminary estimates by CDM of
aquifer characteristics using recovery analyses ranged from 200 to 500-3 -4ft/day for hydraulic conductivity (K) and from 3x10 to 3x10 for
storage coefficient (S) (Table D.1). Unfortunately, neither the
equations used or the recovery graphs were included in the CDM report.
Consequently, DSM felt it necessary to reanalyze the raw data and
recalculate T and S values for the aquifer. Three methods of analysis
were applied: time vs. drawdown, distance vs. drawdown, and
D-1
851J93
300286
U.J
DNJ
COootoCO•vl
EXI ' LANAT ION:
A C O M W E L I Si«oorcET
B.IM- in.i|i l.iki-n I linn U . i . C . S . 7.5 Min.li>|i.ii|i.i|iliii .nn|)s; C lean , NT U980) .indP..i Ivi I U-, NY (1961) i|ii.i>liaiiMli;<..
LOCATION OFCOM WELLS
FIGURE D. 1

TABLE D.1PRELIMINARY ESTIMATES OF AQUIFER CHARACTERISTICS
WellID No.
1
2
3
4
6
9
10
10A
12
Transmissivity (T)ft /day
11 ,000
16,000
13,000
12,000
10,000
14,000
12,000
12,000
28,000
HydraulicConduc ti vi ty ( K )
ft/day
300
700
300
600
200
400
400
400
500
Storativity (S)
4x1 0~4
A
3x1 0
-45x10
-42x10.
4x1 0
-44x10
-41x10
3x1 0~2
.,1x10
(From Camp, Dresser and McKee, 1982).
D-3851J93 300288
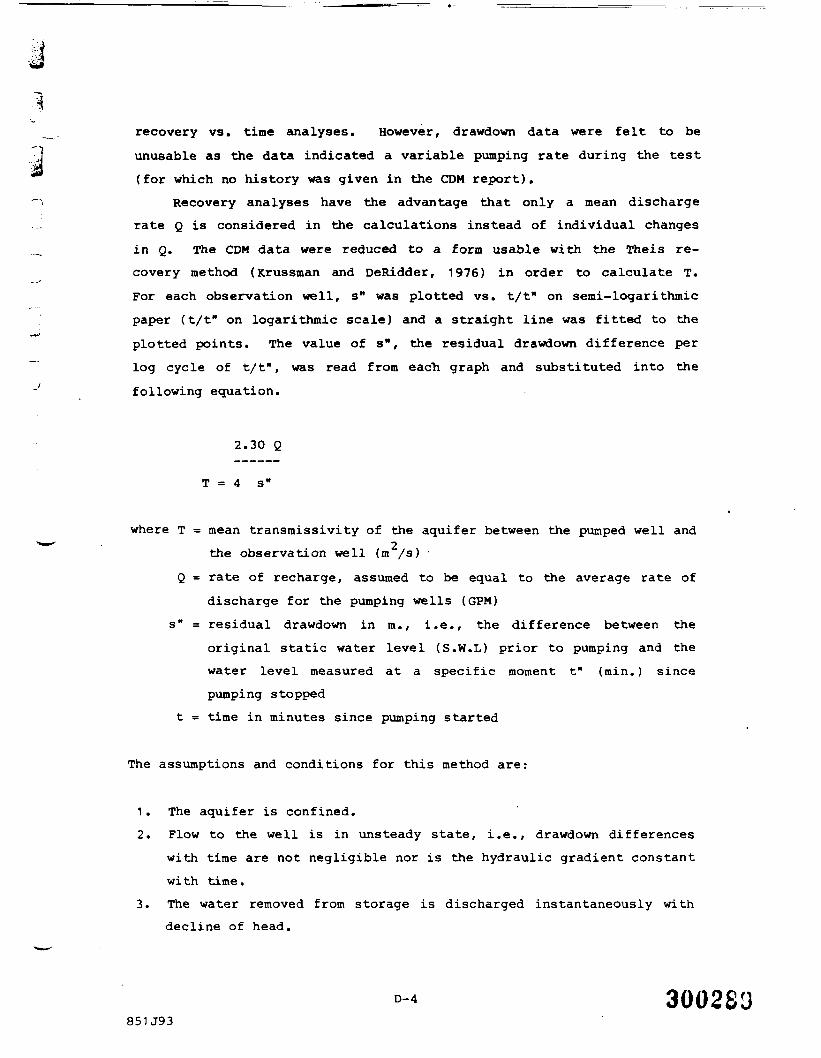
recovery vs. time analyses. However, drawdown data were felt to beunusable as the data indicated a variable pumping rate during the test(for which no history was given in the COM report).
Recovery analyses have the advantage that only a mean discharge
rate Q is considered in the calculations instead of individual changesin Q. The COM data were reduced to a form usable with the Theis re-covery method (Krussman and DeRidder, 1976) in order to calculate T.
For each observation well, s" was plotted vs. t/t" on semi-logarithmic
paper (t/t" on logarithmic scale) and a straight line was fitted to the
plotted points. The value of s", the residual drawdown difference per
log cycle of t/t", was read from each graph and substituted into the
following equation.
2.30 Q
where T = mean transraissivity of the aquifer between the pumped well and
the observation well (m /s) •
Q = rate of recharge, assumed to be equal to the average rate of
discharge for the pumping wells (GPM)
s" = residual drawdown in m., i.e., the difference between the
original static water level (S.H.L) prior to pumping and the
water level measured at a specific moment t" (min.) since
pumping stopped
t = time in minutes since pumping started
The assumptions and conditions for this method are:
1 . The aquifer is confined.
2. Flow to the well is in unsteady state, i.e., drawdown differences
with time are not negligible nor is the hydraulic gradient constant
wi th time.
3. The water removed from storage is discharged instantaneously withdecline of head.
300283851J93
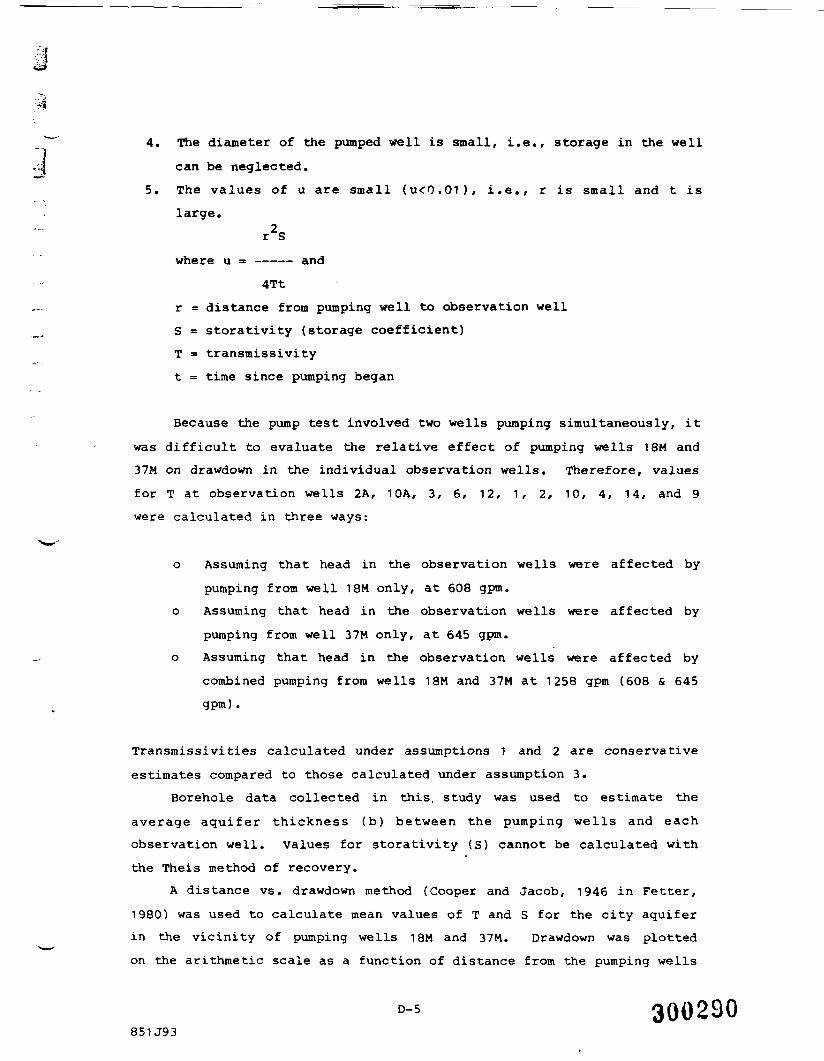
4. The diameter of the pumped well is small, i.e., storage in the well
can be neglected.
5. The values of u are small (u<0,01), i.e., r is small and t is
large.r2S
where u = ——— and
4Tt
r = distance from pumping well to observation well
S = storativity (storage coefficient)T = transmissivity
t = time since pumping began
Because the pump test involved two wells pumping simultaneously, it
was difficult to evaluate the relative effect of pumping wells 18M and
37M on drawdown in the individual observation wells. Therefore, values
for T at observation wells 2A, 10A, 3, 6, 12, 1, 2, 10, 4, 14, and 9
were calculated in three ways:
o Assuming that head in the observation wells were affected by
pumping from well 18M only, at 608 gpm.
o Assuming that head in the observation wells were affected by
pumping from well 37M only, at 645 gpm.
o Assuming that head in the observation wells were affected by
combined pumping from wells 18M and 37M at 1258 gpm (608 & 645
gpm) .
Transmissivities calculated under assumptions 1 and 2 are conservative
estimates compared to those calculated under assumption 3.
Borehole data collected in this, study was used to estimate the
average aquifer thickness (b) between the pumping wells and each
observation well. values for storativity (S) cannot be calculated with
the Theis method of recovery.
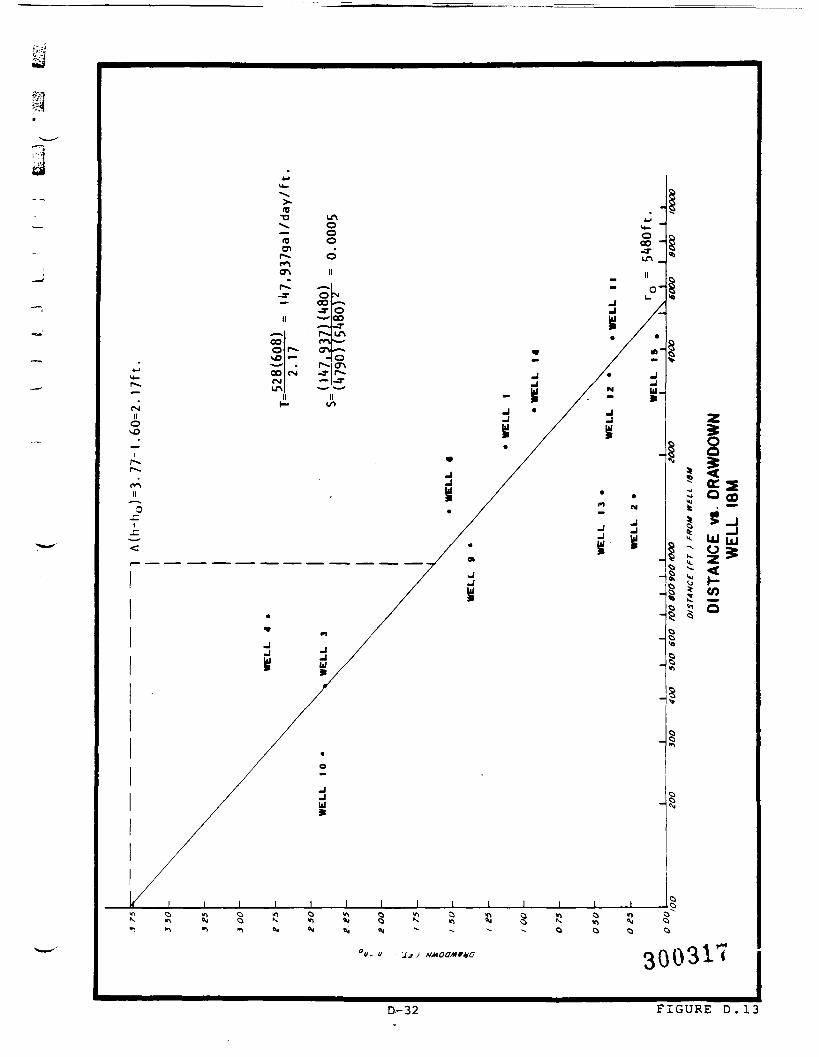
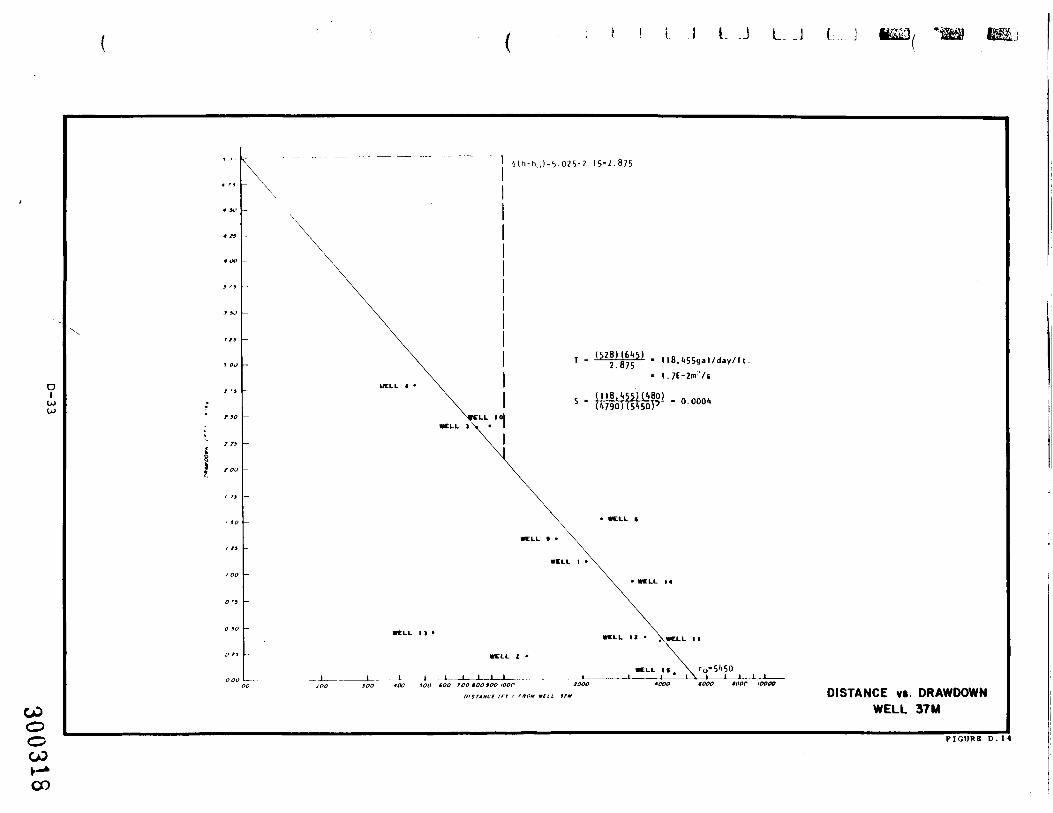
A distance vs. drawdown method (Cooper and Jacob, 1946 in Fetter,
1980) was used to calculate mean values of T and S for the city aquifer
in the vicinity of pumping wells 18M and 37M. Drawdown was plotted
on the arithmetic scale as a function of distance from the pumping wells
D-5
851J93300230

•0-T-x
on%the logarithmic scale. A straight line was drawn to the data pointsand extended until it intercepted the zero-drawdown line. The assump-tions and conditions underlying this method are the same as for theTheis recovery method. A time interval of 8 hours (480 minutes) waschosen, as this allowed time for sufficient drawdown to occur. The
equations used for this method were:528Q Tt
T = ———— and S = ——————(h -h) 4790 r 2o o
where T = transmissivity (gal/day/ft)
Q = constant rate of pumping (gpm)
(h -h) = drawdown per log cycle of distance (ft)
t = time since pumping began
r = the intercept of the straight line with the zero drawdown
axis (ft)
The distance-drawdown data were plotted in three ways: 1) as distance
from well 18M pumping at 608 gpm, 2) as distance from well 37M pumpingat 645 gpm, and 3) as distance from the midpoint between 18M and 37M,
pumping at a combined discharge of 1258 gpm. Wells 2A and 10A were not
used in the distance-drawdown analysis as these two wells were not
screened in the deep city aquifer.
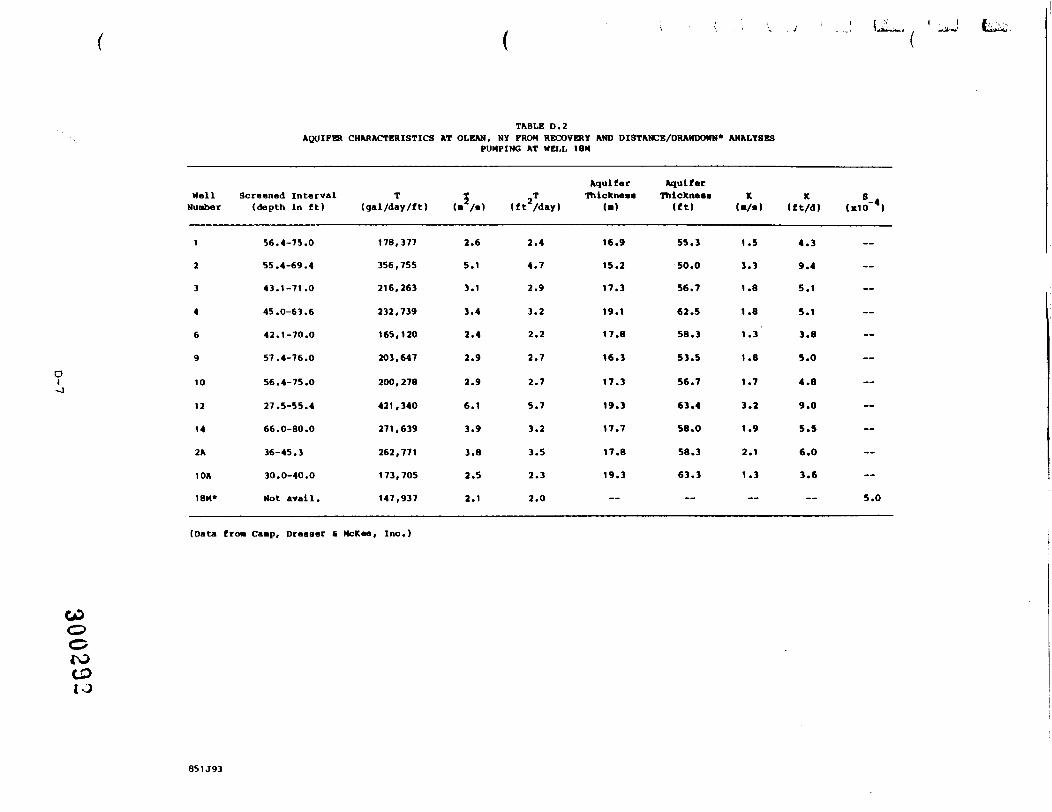
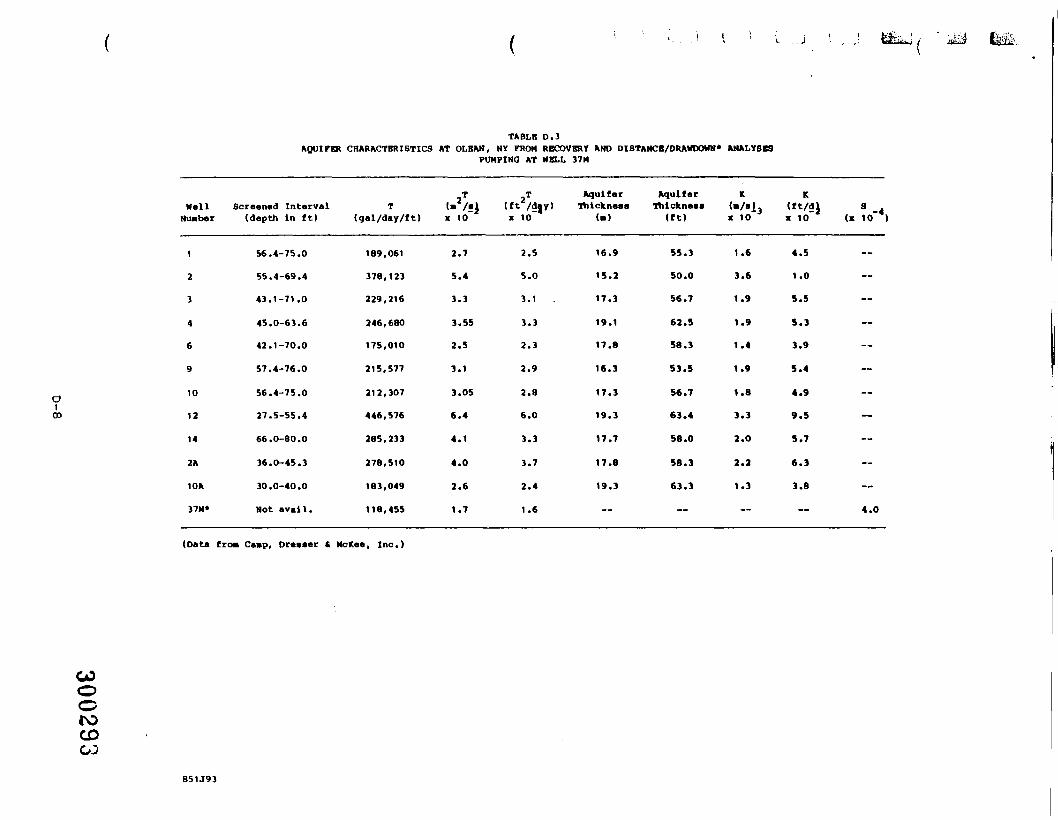
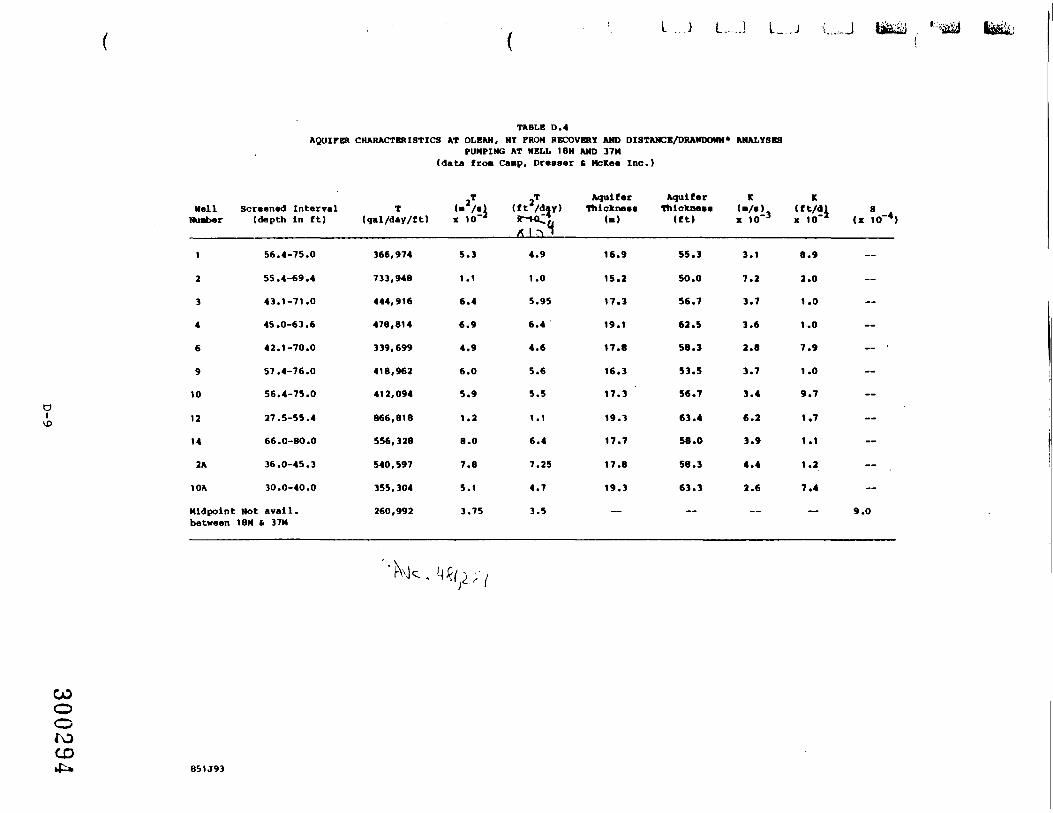
Tables D.2, D.3 and D.4 are a summary of the results. T and K are
expressed in various units for ease of comparison. All of the plotted
curves, and reduced data used in the analysis are given as Figures D.2
through D.15 inclusive. Values for T, K_, and S calculated from the COMpump test data are considered as only approximate estimates in light of
the following limitations of the data base:
1) Drawdown and recovery were not corrected for daily effects of
barometric pressure or for seasonal variations in the water levelof the Alleghany River and the individual wells.
D-6851J93
300291
oo*x>CD10
TABLE D.2AQUIPBR CHARACTERISTICS AT OLEAN, NY FROM RECOVERY AND DISTANCE/DRAWDOWN* ANALYSES
PUMPING AT WELL IBM
WellNumber
1
2
3
4
6
9
01 10
12
14
2ft
10ft
IBM*
Screened Interval(depth in ft)
56.4-75.0
55.4-69.4
43.1-71.0
45.0-63.6
42.1-70.0
57.4-76.0
56.4-75.0
27.5-55.4
66.0-80.0
36-45.3
30.0-40.0
Not avail.
T(gal/day/ft)
178,377
356,755
216,263
232,739
165,120
203,647
200,278
421,340
271,639
262,771
173,705
147,937
I.5.)
2.6
5.1
3.1
3.4
2.4
2.9
2.9
6.1
3.9
3.8
2.5
2.1
(ft2/day)
2.4
4.7
2.9
3.2
2.2
2.7
2.7
5.7
3.2
3.5
2.3
2.0
AquiferThickness
16.9
15.2
17.3
19.1
17.8
16.3
17.3
19.3
17.7
17.8
19.3
--
AquiferThickness
(ft)
55.3
50.0
56.7
62.5
58.3
53.5
56.7
63.4
58.0
58.3
63.3
~
K
1.5
3.3
1.8
1.8
1.3
1.8
1.7
3.2
1.9
2.1
1.3
—
* S-4(ft/d) («10 *)
4.3
9.4
5.1
5.1
3.8
5.0
4.8
9.0
5.5
6.0
3.6
5.0
(Data froa Camp, Dresser t McKee, Inc.)
851J93
I- .. J
oI03
COooroCD03
TABLE D.3AQUIFER CHARACTERISTICS AT OLBAN, NY FROM RECOVERY AND DISTANCE/DRAWDOWN* ANALYSES
PUMPING AT HELL 37H
HellNun bar
1
2
3
4
6
9
10
12
14
2A
10A
37M*
Screened Interval(depth In ft)
56.4-75.0
55.4-69.4
43.1-71.0
45.0-63.6
42.1-70.0
57.4-76.0
56.4-75.0
27.5-55.4
66.0-80.0
36.0-45.3
30.0-40.0
Not avail.
T(qal/day/ft)
189,061
378,123
229,216
246,680
175,010
215,577
212,307
446,576
285,233
278,510
183,049
118,455
T
x 10"
2.7
5.4
3.3
3.55
2.5
3.1
3.05
6.4
4.1
4.0
2.6
1.7
(ft2/day)x 10
2.5
5.0
3.1 .
3.3
2.3
2.9
2.8
6.0
3.3
3.7
2.4
1.6
AquiferThlckneaa
16.9
15.2
17.3
19.1
17.8
16.3
17.3
19.3
17.7
17.8
19.3
—
AquiferThlckneaa
(ft)
55.3
50.0
56.7
62.5
58.3
53.5
56.7
63.4
58.0
58.3
63.3
—
K
x 10~3
1.6
3.6
1.9
1.9
1.4
1.9
1.8
3.3
2.0
2.2
1.3
~
K(ft/dl Sx 10 (x 10 )
4.5
1.0
5.5
5.3
3.9
5.4
4.9
9.5
5.7
6.3
3.8
4.0
(Data from Camp, Dreaaer C McKee, Inc.)
851J93
L...J L_.,J
TABLE D.4AQUIFER CHARACTERISTICS AT OLBMi, NY FROM RECOVERY AND DISTANCE/DRAWDOWN* ANALYSES
PUMPING AT WELL IBM AMD 37M(data froo Camp, Dresser £ McKee Inc.)
WellNunber
1
2
3
4
6
9
10
12
14
2A
10A
Midpointbetween
Screened Interval(depth In ft)
56.4-75.0
55.4-69.4
43.1-71.0
45.0-63.6
42.1-70.0
57.4-76.0
56.4-75.0
27.5-55.4
66.0-80.0
36.0-45.3
30.0-40.0
Mot avail.IBM C 37M
T(gal /day /ft)
366,974
733,948
444,916
478,814
339,699
418,962
412,094
866,818
556,328
540,597
355,304
260,992
2T
x 1 0~
5.3
1.1
6.4
6.9
4.9
6.0
5.9
1.2
8.0
7.8
5.1
3.75
(ft2/day)
4.9
1.0
5.95
6.4
4.6
5.6
5.5
1.1
6.4
7.25
4.7
3.5
AquiferThickness
16.9
15.2
17.3
19.1
17.8
16.3
17.3
19.3
17.7
17.8
19.3
—
AquiferThickness(ft)
55.3
so.o56.7
62.5
58.3
53.5
56.7
63.4
58.0
58.3
63.3
K
x"(o"3
3.1
7.2
3.7
3.6
2.8
3.7
3.4
6.2
3.9
4.4
2.6
—
K(ft/d) 8x 10"* (x 10"*)
8.9
2.0
1.0
1.0
7.9 -- '
1.0
9.7
1.7
1.1
1 .2
7.4
9.0
COooroCD
8SU93
L 1
<T_ __ _ _ _—— — _» AS" =0. 9 F T . = 0 . 2 7 4 M
_L _L _LIO too
t/t"
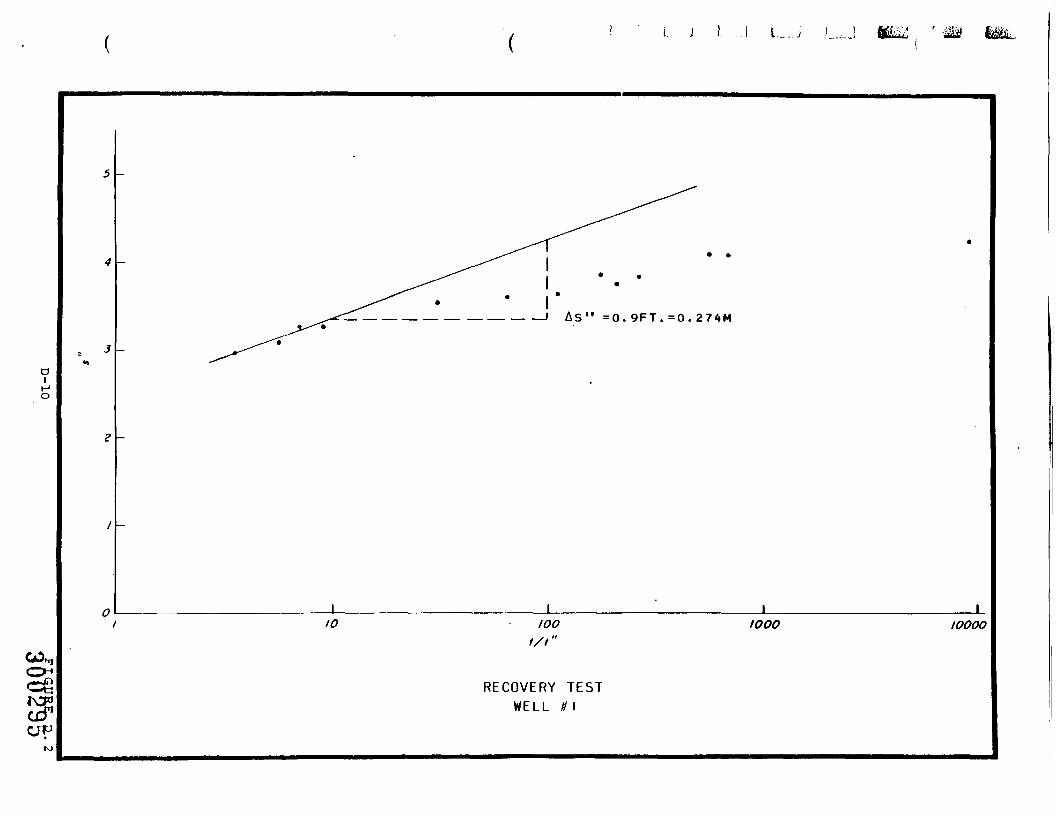
RECOVERY TESTWELL tt\
IOOO IOOOO
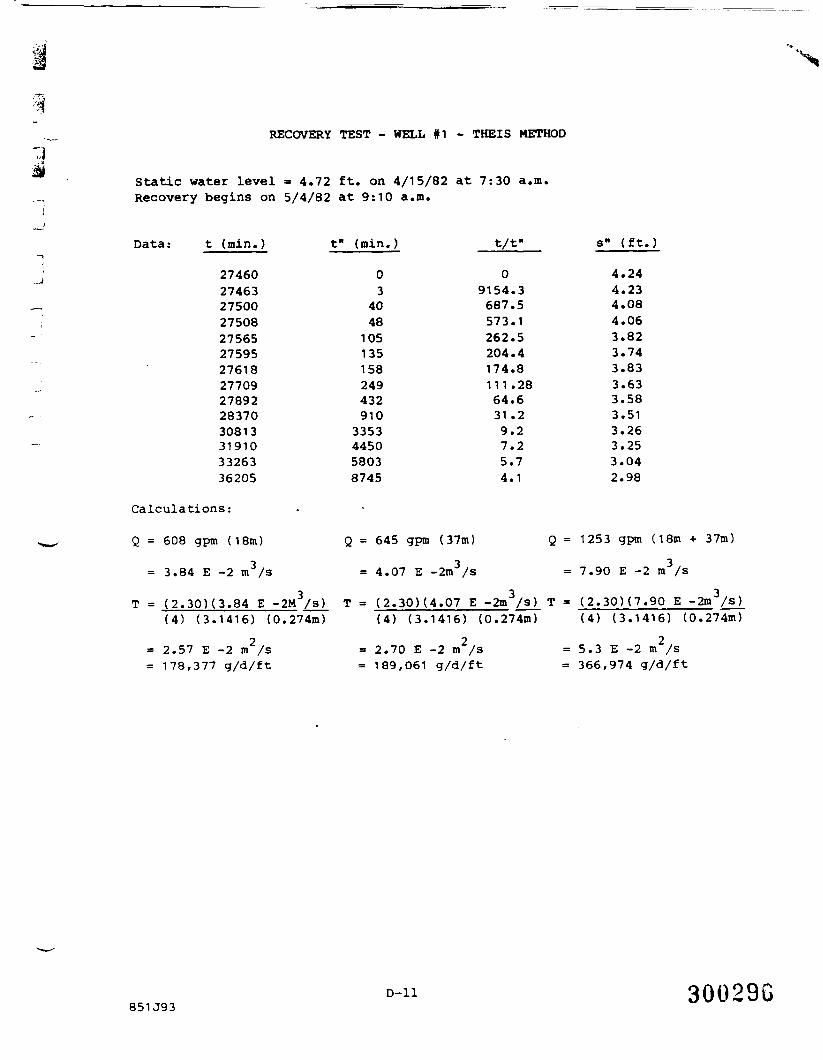
RECOVERY TEST - WELL #1 - THEIS METHOD
Static water level = 4.72 ft. on 4/15/82 at 7:30 a.m.Recovery begins on 5/4/82 at 9:10 a.m.
k
N
Data: t (min.)
2746027463275002750827565275952761827709278922837030813319103326336205
t" (min.)
034048105135158249432910
3353445058038745
t/f
09154.3687.5573.1262.5204.4174.8111 .2864.631 .29.27.25.74.1
4.3.
a" (ft.)
4.244.234.080682
3.743.833.635851262504
2.98
Calculations:
Q = 608 gpm (18m)
= 3.84 E -2 m /s
Q = 645 gpm (37m)
4.07 E -2m /s
Q = 1253 gpm (18m + 37m)
= 7.90 E -2 m3/s
T = (2.30) (3.84 E -2M3/s) T = (2.30H4.07 E -2m3/s) T = (2.30H7.90 E -2m /s)(4) (3.1416) (0.274m) (4) (3.1416) (0.274m)(4) (3.1416) (0.274m)
= 2.57 E -2 m2/s= 178,377 g/d/ft
= 2.70 E -2 m /s= 189,061 g/d/ft
5.3 E -2 m /s366,974 g/d/ft
851J93D-ll 30029G

oIAS" = 0 . 4 S F T . = 1 . 3 7 E - 1 M
_LIO
a?oM
o•
U)
COOOroCD-vl
toot/t"
RECOVERY TESTWELL # 2
IOOOO

RECOVERY TEST - WELL #2 - THEIS METHOD
Static water level = 5.06 ft. on 4/15/82 at 8:02 a.m.Recovery begins on 5/4/82 at 10:20 a.m.
Data: t (min.)
Calculations:
Q = 608 gpm (18m)
= 3.84 E -2 m3/s
t" (min.) t/t" s" (ft.)
27498275102752327548275792769327879283602900529300303873074531849
01225508119538186215071802288932474351
02292.51100.92550.96340.48142.073.232.919.216.2510.529.477.32
2.342.362.352.342.312.232.131.981.861 .831 .831.831.83
Q = 645 gpm (37m)
=4.07 E -2m3/s
Q = 1258 gpm (1 8m + 37m)
= 7.90 E -2 m3/s
T = (2.30H3.84 E -2M3/s) T = (2.30H4.07 E -2m3/s) T = (2.30H7.90 E -2m3/s)(4) (3.1416)) (0.137m) (4) (3.1416) (0.137m) (4) (3.1416) (0.137m)
= 5.13 E -2 m/s= 356,755 g/d/ft
= 5.44 E -2 m/s= 378,123 g/d/ft
= 1.05 E -1 m /s= 733,948 g/d/ft
851J93D-13
300298
> I < II . . .1 i :. . '
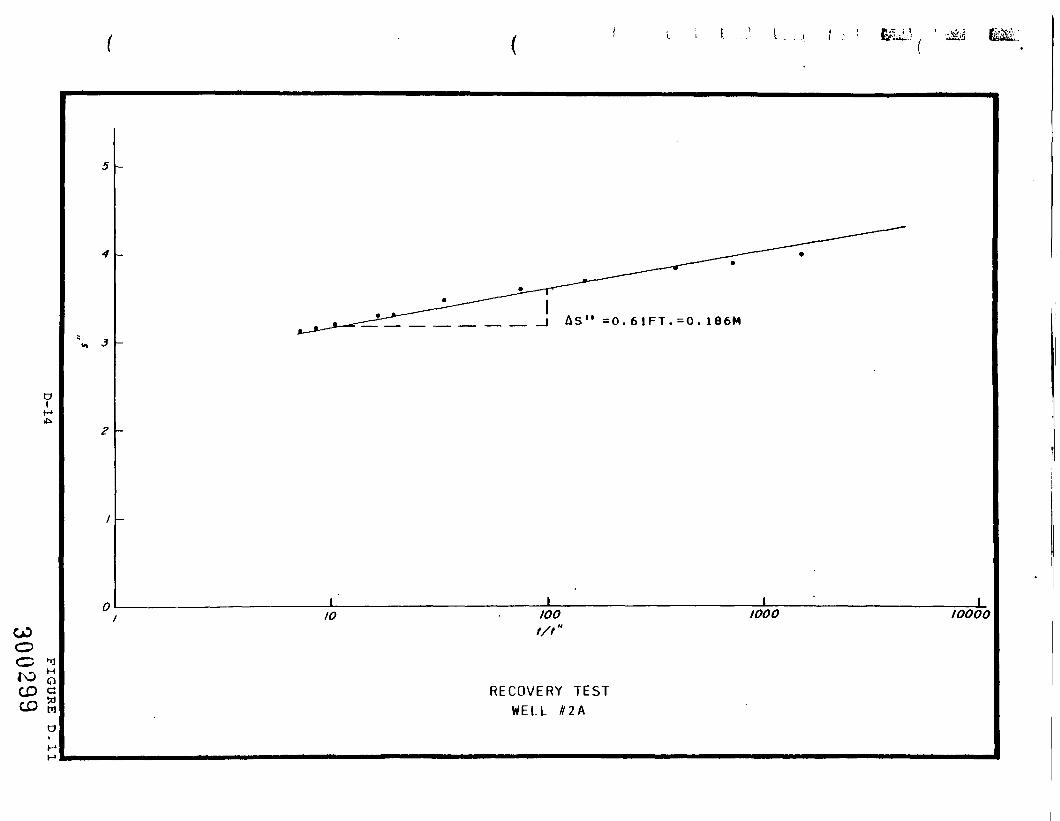
=0. IB6M
_L J.IO IOOt/t"
RECOVERY TESTWELL #2A
1000 IOOOO

RECOVERY TEST - WELL #2A - THEIS METHOD
Static water level = 5.42 ft. on 4/15/8 at 8:07 a.m.Recovery begins on 5/4/82 at 10:33 a.m.
Data: t (min.)
275062752427544275772768927876283562899929294304033118031863
t" (min.)
018387118337085014931788289736744357
t/t"
01529.1724.8388.4151.375.333.419.416.4108
s- (ft.
3.963.963.903.853.733.613.47
7.3
.28
.28
.213.153.13
3.3,3.
Calculations:
Q = 608 gpm (18m)
= 3.84 E -2 m3/s
T = (2.30H3.84 E -2M3/s)(4) (3.1416) (0.186m)
= 3.78 E -2 m2/s= 262,771 g/d/ft
Q = 645 gpm (37m)
= 4.07 E -2m /s
Q = 1253 gpm {18m + 37m)
= (2.30)(4.07 E -2m /s) T(4) (3.1416) (0.186m)
= 4.0 E -2 m2/s= 278,510 g/d/ft
= 7.90 E -2 m /s
(2.30H7.90 E -2m3/s)(4) (3.1416) (0.186m)
7.8 E -2 m /s540,597 g/d/ft
851J93D-15 300300
I J OL.1
DIMCTl
00oO
a»wo*-
^^^_ __ __ __ __ __ J AS" =0. 74FT .=0 .226M
_LIOOO
RECOVERY TESTWELL n
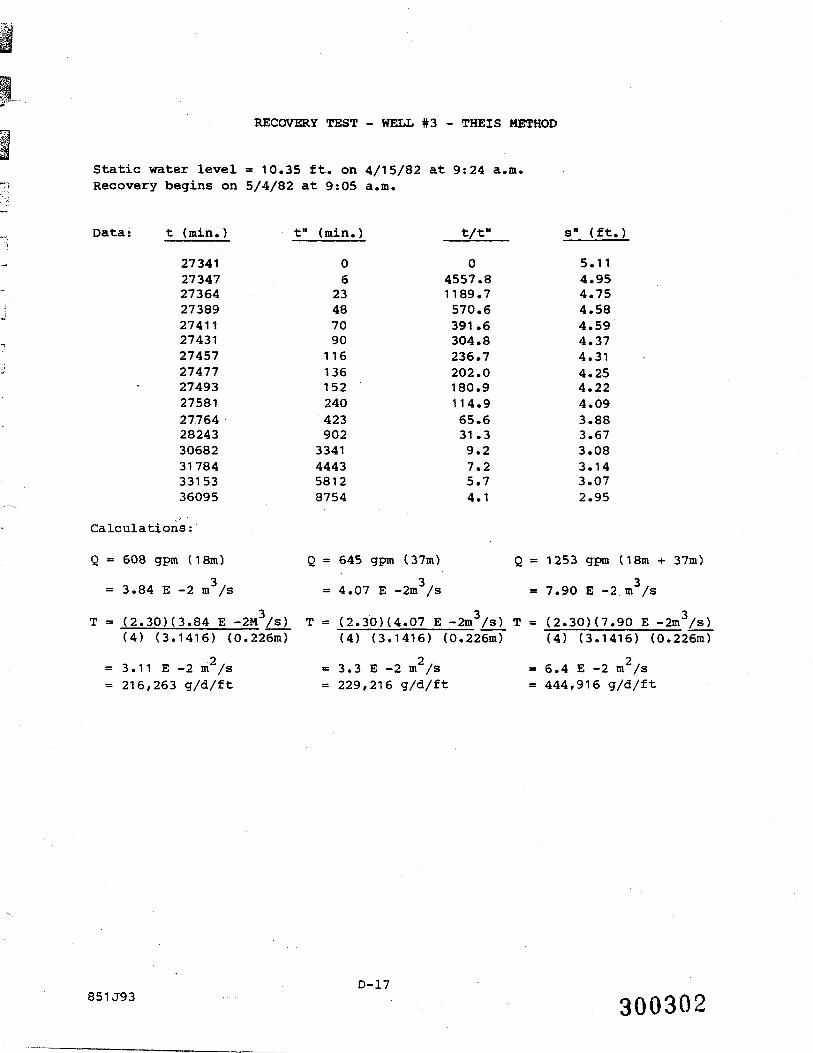
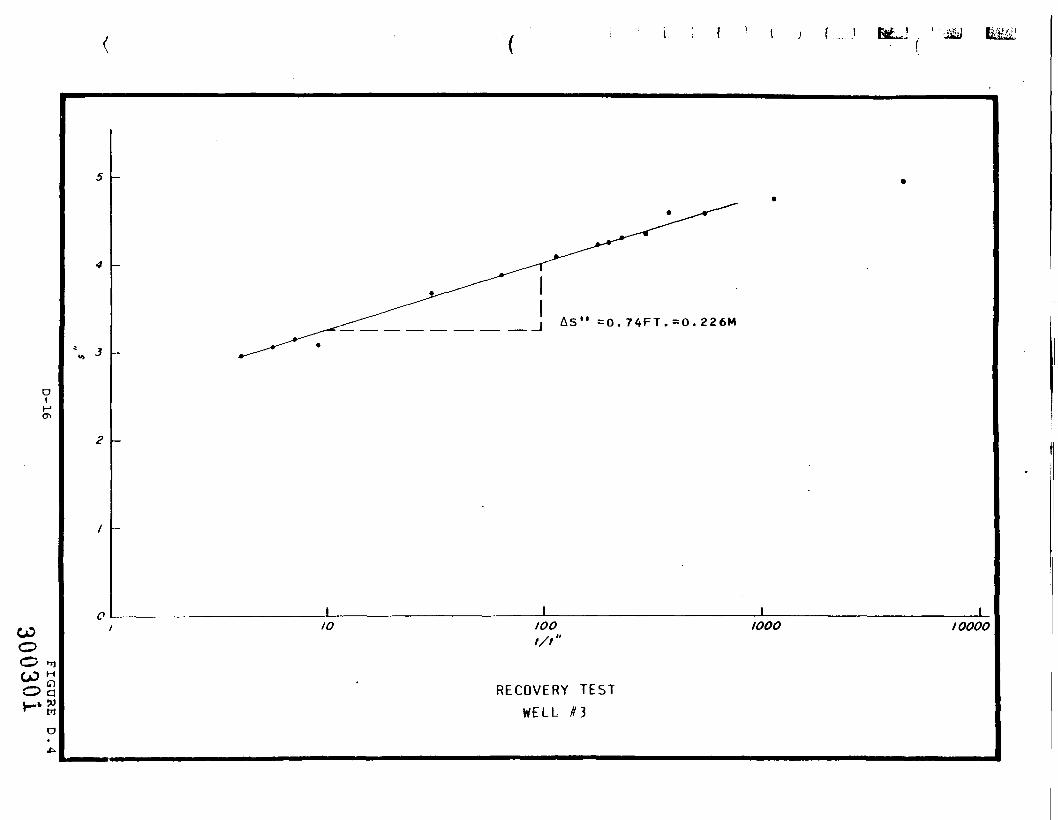
RECOVERY TEST - WELL #3 - THEIS METHOD
Static water level = 10.35 ft. on 4/15/82 at 9:24 a.m.Recovery begins on 5/4/82 at 9:05 a.m.
Data: t (min.) t" (min.) t/t" s" (ft.)
27341273472736427389274112743127457274772749327581277642824330682317843315336095
06
23487090
116136152240423902
3341444358128754
04557.81189.7570.6391.6304.8236.7202.0180.9114.965.631.39.27.25.74.1
5.114.954.754.584.594.374.314.254.224.093.883.673.083.143.072.95
Calculations:
Q = 608 gpm (18m)
= 3.84 E -2 m3/s
T = (2.30H3.84 E -2M3/s)(4) (3.1416) (0.226m)
= 3.11 E -2 m2/s= 216,263 g/d/ft
Q = 645 gpm (37m)
= 4.07 E -2m3/s
Q = 1253 gpm (18m + 37m)
= (2.30)(4.07 E -2m /s) T(4) (3.1416) (0.226m)
= 3.3 E -2 m2/s= 229,216 g/d/ft
7.90 E -2 m /s
(2.30)(7.90 E -2m3/s)(4) (3.1416) (0.226m)
6.4 E -2 m2/s444,916 g/d/ft
D-17851J93 300302

<—.— — — — — __J As" =0. 7FT.=0. 21M
OM00
_L
D
Ln
COOo00oto
IO IOOI/I"
RECOVERY TESTWELL M
IOOOO
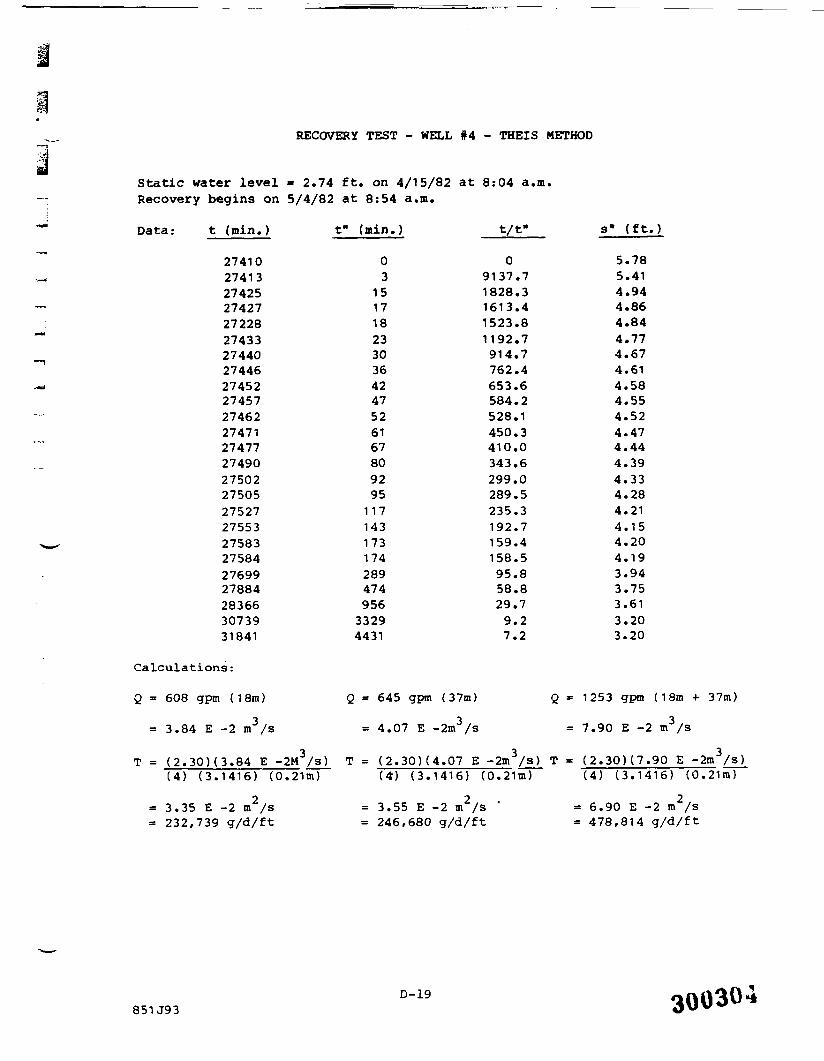
RECOVERY TEST - WELL #4 - THEIS METHOD
Static water level = 2.74 ft. on 4/15/82 at 8:04 a.m.Recovery begins on 5/4/82 at 8:54 a.m.
Data: t (min.) t" (min.)
27410274132742527427272282743327440274462745227457274622747127477274902750227505275272755327583275842769927884283663073931841
03
1517182330364247526167809295
11714317317428947495633294431
t/t s" (ft.)
09137.71828.31613.41523.81192.7914.7762.4653.6584.2528.1450.3410.0343.6299.0289.5235.3192.7159.4158.595.858.829.79.2
5.785.414.944.864.844.774.674.614.584.554.524.474.444.394.334.284.214.154.204.193.943.753.613.20
7.2 3.20
Calculations:
Q = 608 gpm (18m)
= 3.84 E -2 m3/s
Q = 645 gpm (37m)
= 4.07 E -2m3/s
T = (2 .30M3.84 E -2M3/s) T = (2.30) (4.07 E -2m3/s) T(4) (3.1416) (0.21m)
= 3.35 E -2 m2/s= 232,739 g/d/ft
(4) (3.1416) (0.21m)
= 3.55 E -2 m2/s '= 246,680 g/d/ft
= 1253 gpm (18m + 37m)
= 7.90 E -2 m3/s
(2.30X7.90 E -2m3/s)(4) (3.1416) (0 .21m)
6.90 E -2 m /s478,814 g/d/ft
851J93D-19 300304
oINJO
AS" =0.97FT.=0.296M
_L _L
^MOG»M
D
cn
IO IOOO IOOOO
ooCOo01
RECOVERY TESTWELL #6
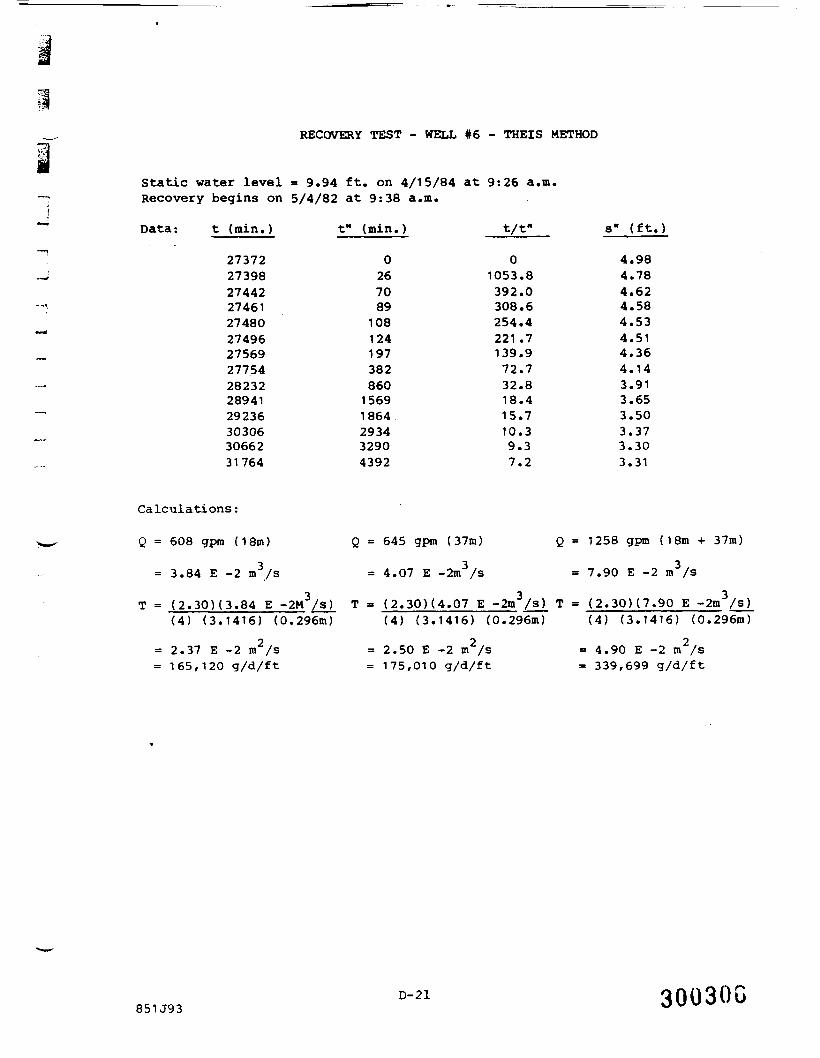
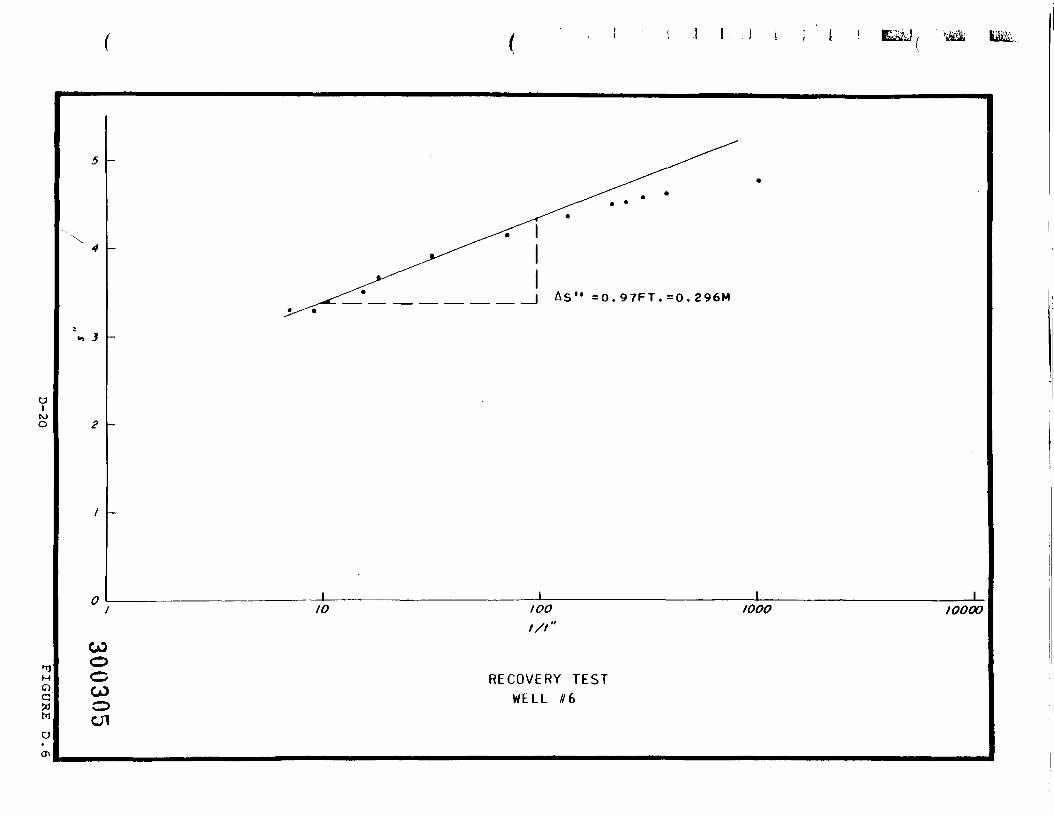
RECOVERY TEST - WELL #6 - THEIS METHOD
Static water level = 9.94 ft. on 4/15/84 at 9:26 a.m.Recovery begins on 5/4/82 at 9:38 a.m.
Data: t (min.) t" (min.) t/f s" (ft.)
2737227398274422746127480274962756927754282322894129236303063066231764
026708910812419738286015691864293432904392
01053.8392.0308.6254.4221.7139.972.732.818.415.710.39.37.2
4.984.784.624.584.534.514.364.143.913.653.503.373.303.31
Calculations:
608 gpm (18m) Q = 645 gpm (37m) 1258 gpm ( 1 8m + 37m)
3.84 E -2 m /s
T = (2.30H3.84 E -2M /s)(4) (3.1416) (0.296m)
4.07 E -2m/s 7.90 E -2 m/s
(2.30H4.07 E -2m3/s) T = (2.3QH7.90 E -2m3/s)(4) (3.1416) (0.296m) (4) (3.1416) (0.296m)
= 2.37 E -2 m/s= 165,120 g/d/ft
= 2.50 E -2 m/s= 175,010 g/d/ft
4.90 E -2 m/s339,699 g/d/ft
D-21851J93
30030G
.; L.I I - -J W
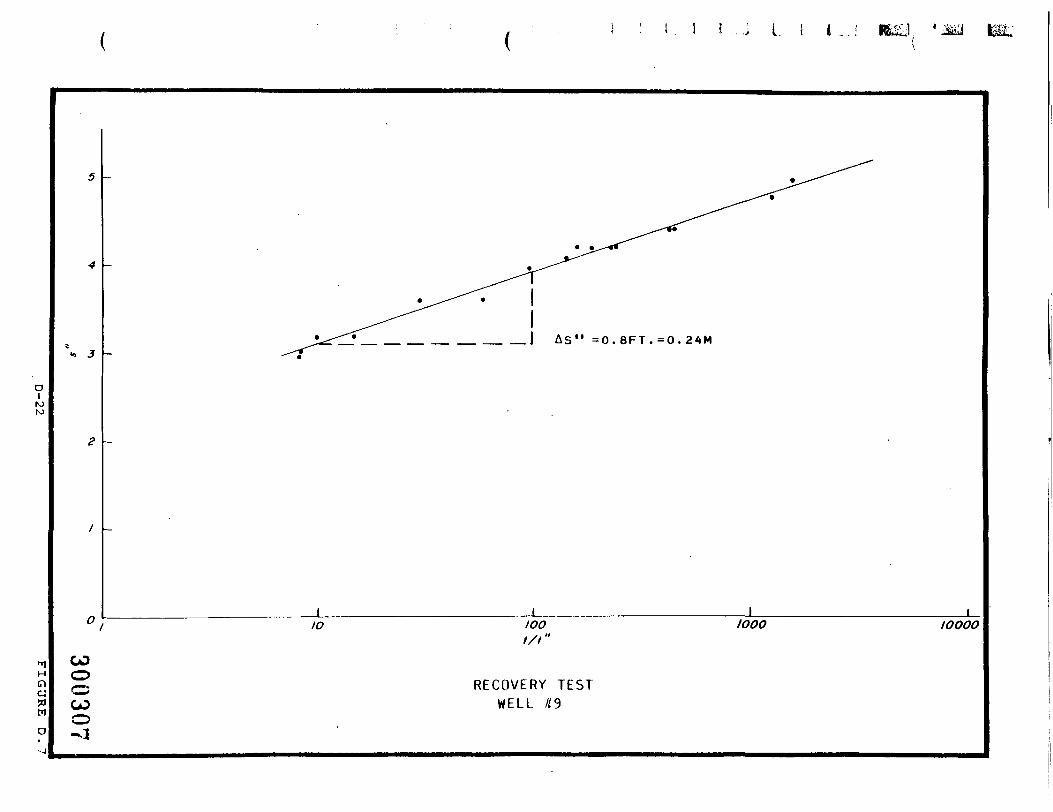
-^f___ __ __ __ __ _1 AS" = 0 . 8 F T . = 0 . 24M
_L
COooCOo
10 100t/t"
RECOVERY TESTWELL / /9
1000 IOOOO

RECOVERY TEST - WELL #9 - THEIS METHOD
Static water level = 24.79 ft on 4/15/82 at 9:50 a.m.Recovery begins on 5/4/82 at 8:43 a.m.
Data: T (min.)
2729327310273142735227355274052741027437274652748527572277552823229236303333096331025
t" (min.)
0172159621121171441721922794629391943304036703732
t/f
01606.51300.7463.6441.2244.7234.3190.5159.7143.298.860,
• 30,15,10.08.48.3
.1
.1
.0
s" (ft.)
5.224.964.784.444.434.2220182009965762
3.21,18,01
2.96
Calculations:
Q = 608 gpm (18m)
= 3.84 E -2 m /s
Q = 645 gpm (37m)
= 4.07 E -2m3/s
Q = 1258 gpm (18m + 37m)
T = (2.30X3.84 E -2M3/s) T = (2.30H4.07 E -2m /s) T(4) (3.1416) (0.24m)
2.93 E -2 m2/s203,647 g/d/ft
(4) (3.1416) (0.24m)
= 3.1 E -2 m2/s= 215,577 g/d/ft
7.90 E -2 m /s
(2 .30)(7 .90 E -2m /s)(4) (3.1416) (0.24m)
6.0 E -2 m /s418,962 g/d/ft
D-23851J93
300308
^J
8
to
(XUJ>ao
1 1 I 1 1
D-24 F I G U R E D . 8
300309
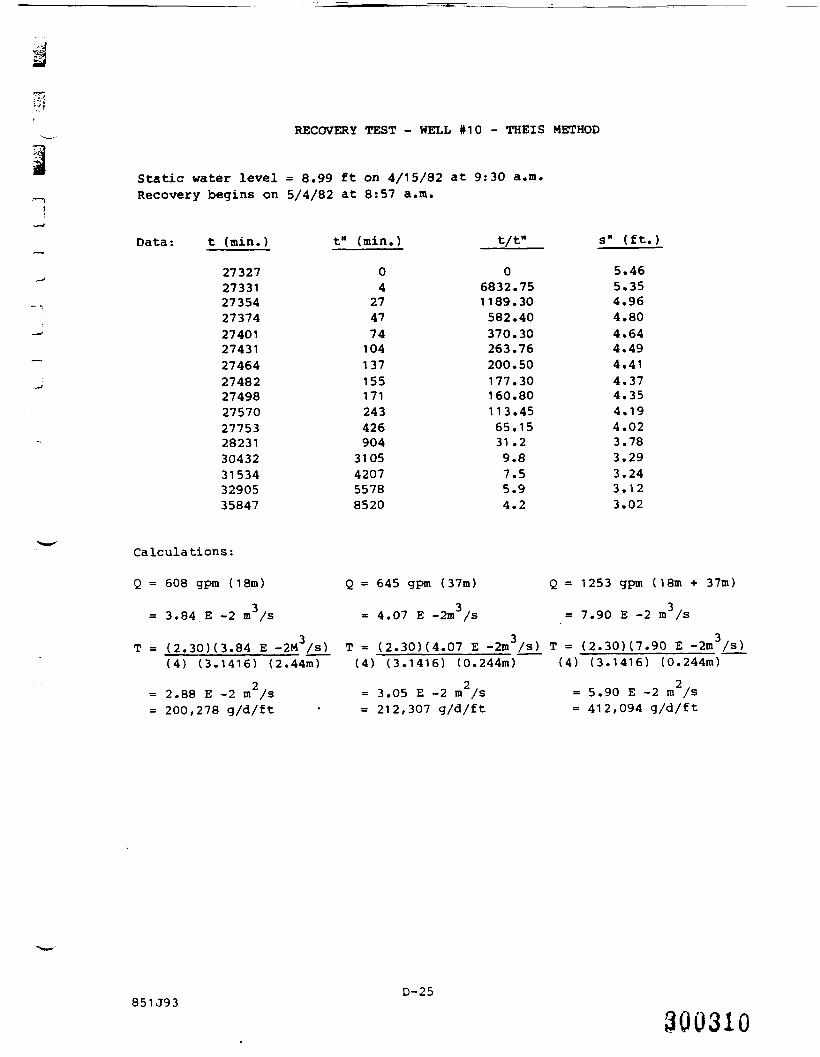
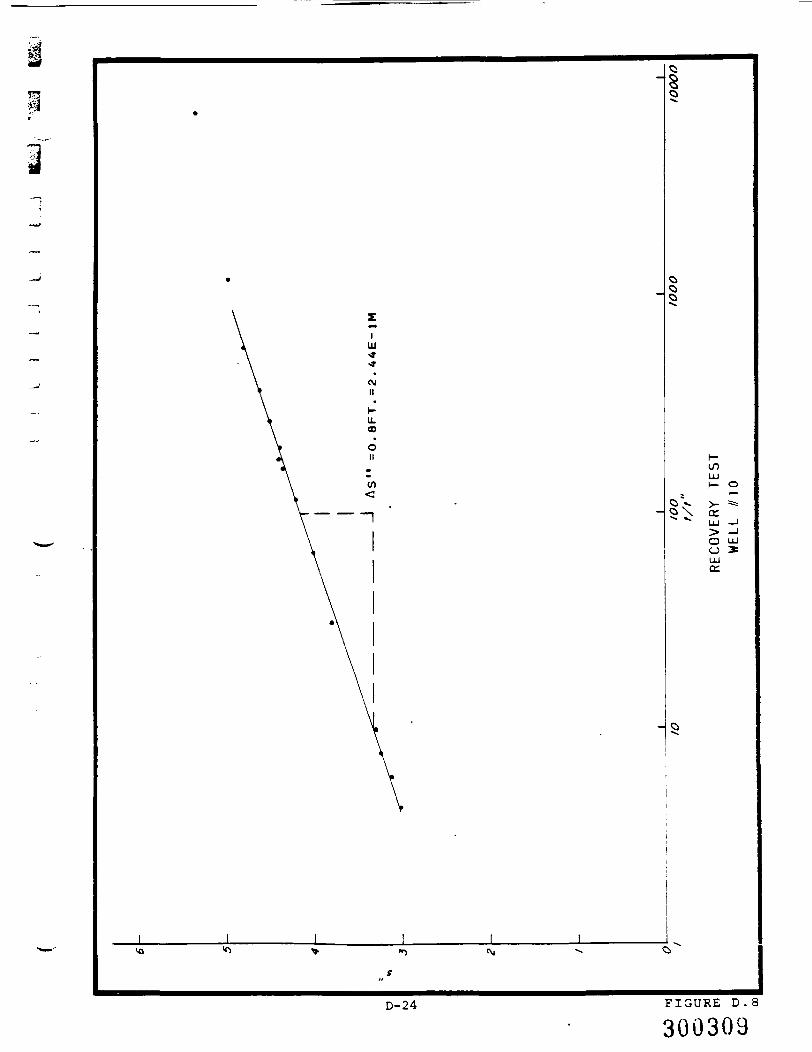
RECOVERY TEST - WELL #10 - THEIS METHOD
Static water level = 8.99 ft on 4/15/82 at 9:30 a.m.Recovery begins on 5/4/82 at 8:57 a.m.
Data: t (min.) t" (min.) t/t- s" (ft.)
27327273312735427374274012743127464274822749827570277532823130432315343290535847
042747741041371551712434269043105420755788520
06832.751189.30582.40370.30263.76200.50177.30160.80113.4565.1531 .29.87.55.94.2
5.465.354.964.804.644.494.414.374.354.194.023.783.293.243.123.02
Calculations:
Q = 608 gpm (18m)
= 3.84 E -2 m3/s
Q = 645 gpm (37m)
= 4.07 E -2m3/s
Q = 1253 gpm (18m + 37m)
= 7.90 E -2 m3/s
T = (2.30H3.84 E -2M3/s) T = (2.30H4.07 E -2m3/3) T = (2.30H7.90 E -2m3/s)(4) (3.1416) (2.44m) (4) (3.1416) (0.244m) (4) (3.1416) (0.244m)
= 2.88 E -2 m /s= 200,278 g/d/ft
3.05 E -2 m /s212,307 g/d/ft
= 5.90 E -2 m /s= 412,094 g/d/ft
851J93D-25
300310
^fff^ ~
<L*__ __ __ __ __ __ J As" =0. 93FT .=0 . 283M
oifo
<•> 3
IOOOOHOG»M
D
ooCO RECOVERY TEST
W E L L # 1 0 A

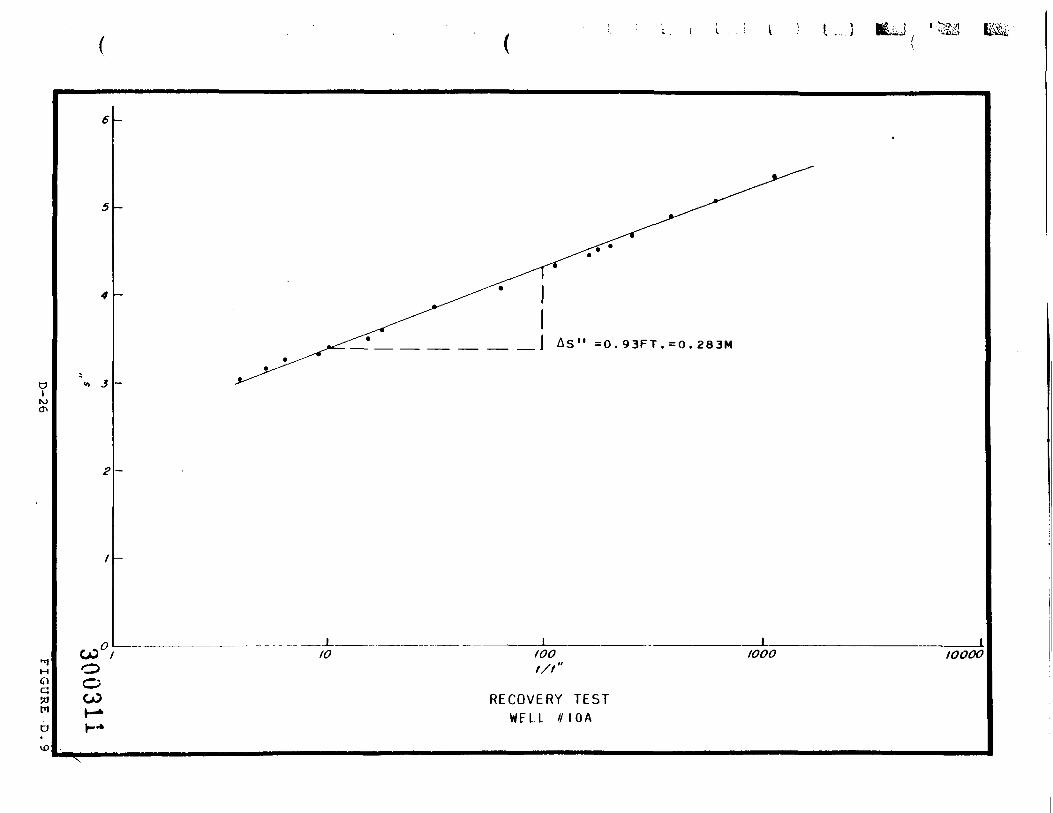
RECOVERY TEST - WELL #10A - THEIS METHOD
Static water level = 9.6 ft. on 4/15/82 at. 9:33 a.m.Recovery begins on 5/4/82 at 8:59 a.m.
Data: t (min.)
273262734927270273962743127460274782749427566277512823028927292243031230669324913386236804
t" (min.)
02344701051341521682404259041601189829863343516565369478
t/t" s" (ft.)
01 1 89 . 1622.0391 .4261.2204.9180.8163.7114.9
65.331 .218.115.410.29.26.35.23.9
5.775.345.104.874.684.564.524.464.324.073.853.623.503.403.313.243.173.03
Calculations:
Q = 608 gpm (18m)
= 3.84 E -2 m3/s
T = (2.30H3.84 E -2M3/s)(4) (3.1416) (0.283m)
= 2.48 E -2 m2/s= 173,705 g/d/ft
Q = 645 gpm (37m) Q
= 4.07 E -2m /S
T = (2.30H4.07 E -2m3/s) T(4) (3.1416) (0.283m)
= 2.6 E -2 m2/s= 183,049 g/d/ft
1258 gpm (18m + 37m)
7.90 E -2 m3/s
(2.30)(7.90 E -2m3/s)(4) (3.1416) (0.283m)
5.1 E -2 m /s355,304 g/d/ft
D-27851J93 300312
L. J t. ) I . }
COooCOV-*CO
^nir__. —— —— —— ——I As" =0. 38FT.=0. 1 16M
_LIOOO IOOOO
t/t"
RECOVERY TESTWELL #12
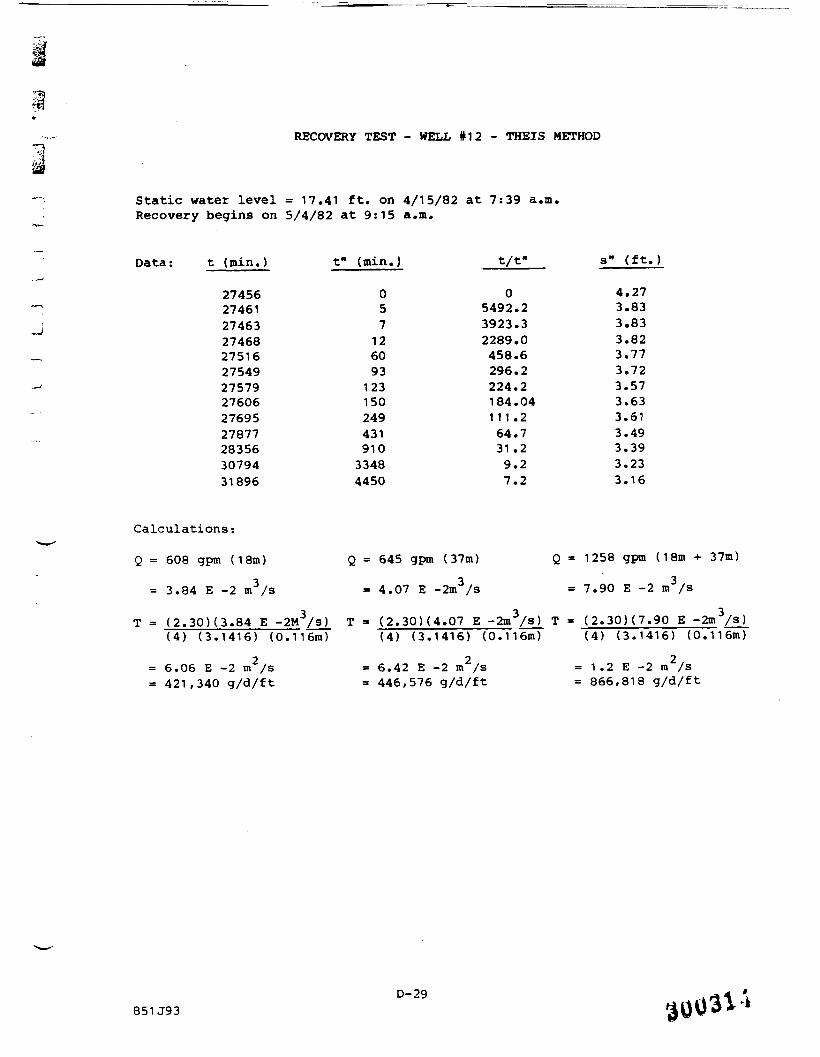
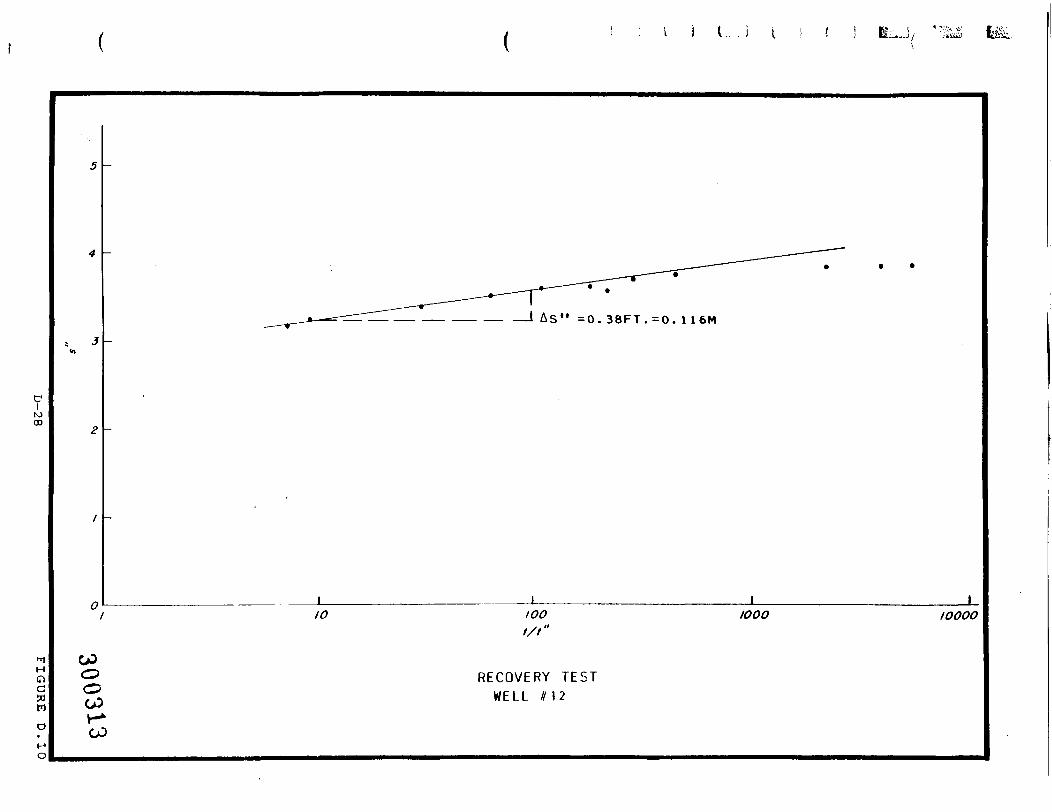
RECOVERY TEST - WELL #12 - THEIS METHOD
Static water level = 17.41 ft. on 4/15/82 at 7:39 a.m.Recovery begins on 5/4/82 at 9:15 a.m.
Data:
~J
t (min.) t" (min.) t/t" s" (ft.)
27456274612746327468275162754927579276062769527877283563079431896
05712609312315024943191033484450
05492.23923.32289.0458.6296.2224.2184.04111 .264.731.29.27.2
4.273.833.833.823.773.723.573.633.613.493.393.233.16
Calculations:
Q = 608 gpm (18m)
= 3.84 E -2 m3/s
Q = 645 gpm (37m)
= 4.07 E -2m3/s
Q = 1258 gpm (18m + 37m)
= 7.90 E -2 m /s
T = (2.30H3.84 E -2M3/s) T = (2.30H4.07 E -2m3/s) T = (2.30)(7.90 E -2m3/s)(4) (3.1416) (0.116m) (4) (3.1416) (0.116m) (4) (3.1416) (0.116m)
= 6.06 E -2 m/s= 421 ,340 g/d/ft
= 6.42 E -2 m/s= 446,576 g/d/ft
= 1.2 E -2 m /s= 866,818 g/d/ft
851J93D-29
I. i I- J L..1 !.-. }
03OOCO
__ __ __ __ __ _I As" =0. 6FT. =0. 18M
_L10 too
t/t"
RECOVERY TESTTHEIS METHOD
W E L L nk
IOOO IOOOO
m
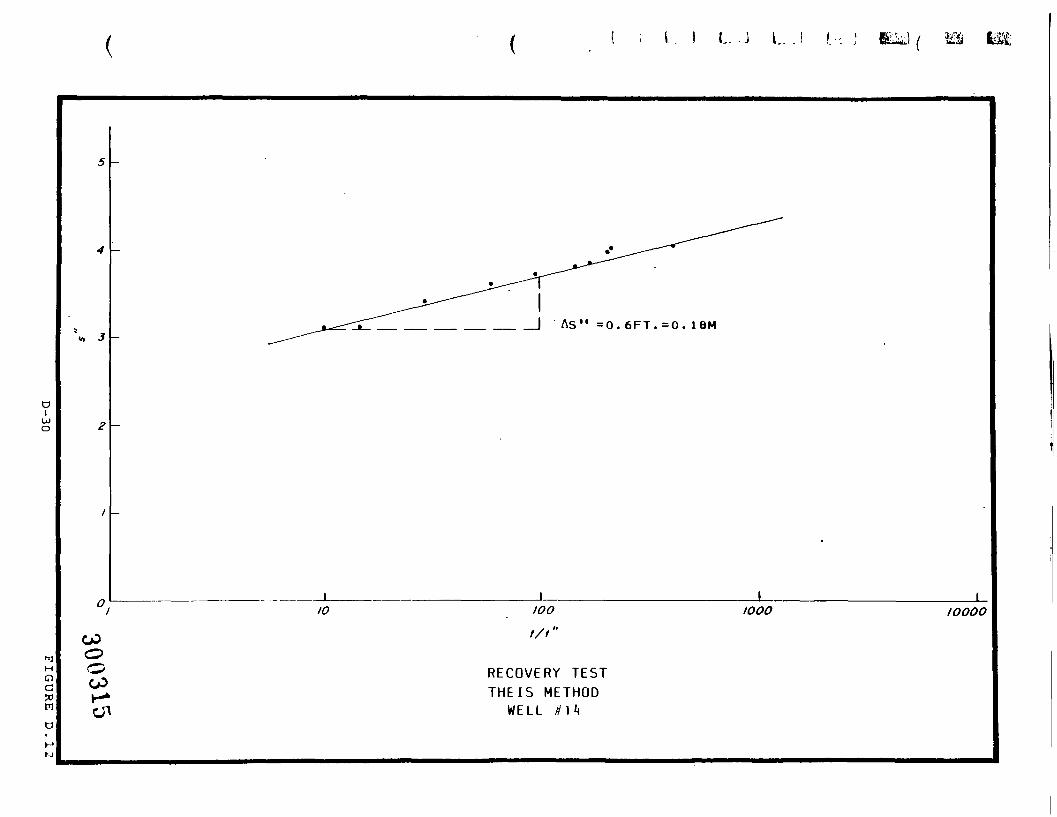
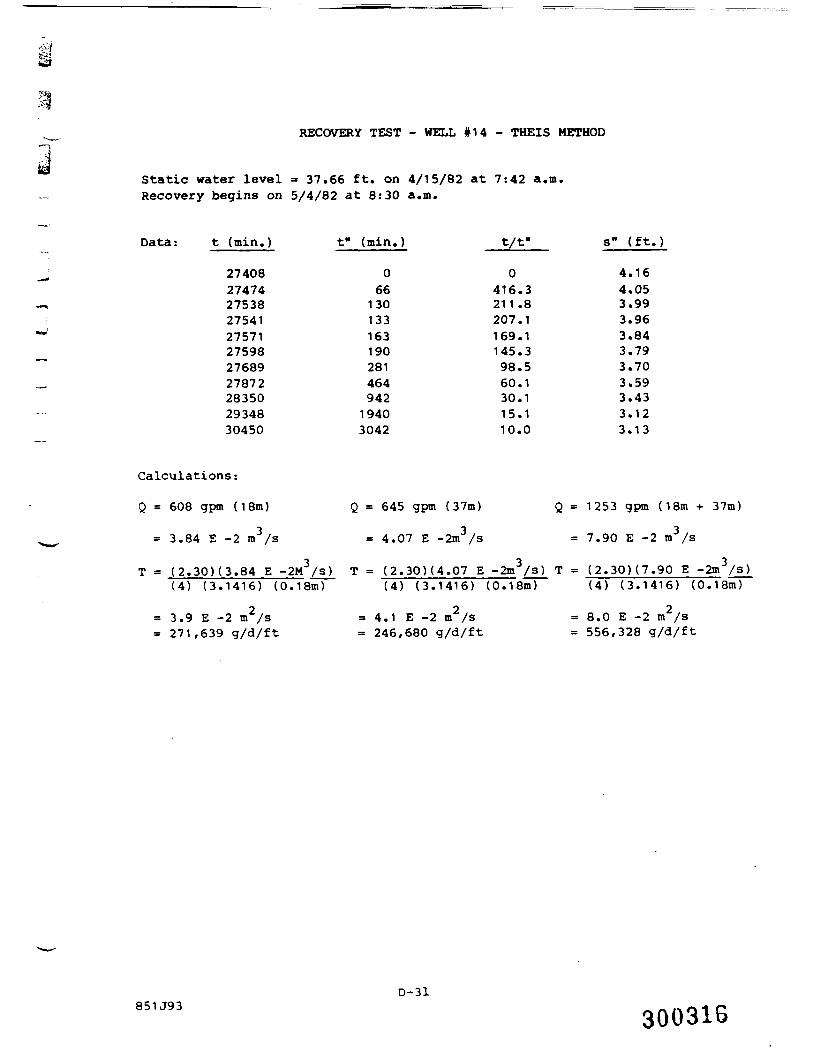
RECOVERY TEST - WELL #14 - THEIS METHOD
Static water level = 37.66 ft. on 4/15/82 at 7:42 a.m.Recovery begins on 5/4/82 at 8:30 a.m.
Data: t (min.)
2740827474275382754127571275982768927872283502934830450
t" (min.)
06613013316319028146494219403042
0416.3211 .8207.1169.1145.398.560.130.115.110.0
s" ( f t . )
4.164.053.993.963.843,793.703.593.433.123.13
Calculations:
Q = 608 gpm (18m)
= 3.84 E -2 m3/s
T = (2.30H3.84 E -2M3/s)(4) (3.1416) (0.18m)
Q = 645 gpm (37m)
= 4.07 E -2m3/s
= 1253 gpm (18m + 37m)
= 7.90 E -2 m3/s
(2.30M4.07 E -2m3/s) T = (2.30H7.90 E -2m3/s)
= 3.9 E -2 m /s= 271,639 g/d/ft
(4) (3.1416) (0.18m)
4.1 E -2 m2/s246,680 g/d/ft
(4) (3.1416) (0.18m)
8.0 E -2 m2/s556,328 g/d/ft
D-31851J93 30031S
30031'
D-32 F I G U R E D . 1 3
I J L.
a ( h - h , , ) - i . 0 2 5 - 2 . 15 = 2 . 8 7 5
T - <»»)^?) . llM55gal/day/,t.
l .7E-2ro ; ' /s
. ( 118. 1.55) Ci BO)5 ' ' 2
tooo loop 10000DISTANCE vs. DRAWDOWN
WELL 37M
F I G U R E D. I 4
OO

J L J I ! ,
« 5.'
* fi
4 00
J ft
J JJ
1 ti
9 JO
ffi
I 5(»
^ f n
. f 00
\ "^
' SO
i ti
ft
O .* '
o fa
o oo
\ " " "" T A(h-h,,)- ! | . 1 )25 -1 .88 *2 . 5*5
-
-
— \\
\\
r \\
T - (^B'|'2?8) - 260,992ga I /day / f t .
- ""ELL 4 \ ' - 3 .75E-2m J / s
' - <260, 992) <<)80) „ „ Q00^
WELL 1 . «LL '« '\
\v
- \\
\ * WILL •
WELL 1 • \.\
\«LL 1
\
. 14
WELL 11. \WELL 11 . X^LL ,,
WELL 1 . \
WELL II \ fo'S^SO.1 .. .. I __ L_..__l J 1 1 1 1 1 1 1 ' l\ 1 1 1 1 1
DISTANCE w. DRAWDOWNWELLS ISM a 37M
FIGURE D . 1 S
CJ3

1
DISTANCE - DRAWDOWN TEST - THEIS METHOD
Well 18M: Q = 608 gpmWell 37M: Q = 645 gpmWells 18M & 37M: Q = 1253 gpm
Pumping begins on 4/15/82 at 7:30 a.m.t = time elapsed since pumping began = 480 min.
Data:
Well No.
6103914121511124
13
Distancefrom 1 8M
(ft)
14002804401120270034004360432021401540700
1560
Distancefrom 37M
(ft)
23608808001600312034804500396020401220460540
Distance frommidpoint of h18M & 37M
(ft)
1880560280
1240284034004360408020001240120
1020
o(ft)
9.948.99
10.2724.7937.6617.4141 .5321 .604.725.062.749.12
h(ft)
*11 .4611 .4112.5826.1638.5817.8141 .5921 .975.84*5.28*5.549.165
h-h(s) (ft)
1 .542.422.411 .370.920.400.060.371 .120.222.800.045
Interpolated between readings surrounding 3:30 p.m.
D-35851J93
3003^°

2) A detailed history of changes in the pumping rate was not avail-
able. Furthermore, some of the assumptions underlying the methodsare not realistically satisfied in all cases. For example, thecity aquifer is not totally confined in some areas under Clean andstorage in the wells may not be insignificant.
PUMP TEST, AT McGRAW EDISON AND AVX
Lozier/Groundwater Associates conducted a very complete and well-
controlled pump test at the McGraw Edison Company plant site in
December, 1983. The test was analyzed according to time vs. drawdown
and recovery vs. time. Their data base contained hydrographs of the
observation wells and daily barometric pressure variations affecting
each well. Their analyses were based on the assumption of a semi-con-
fined aquifer with vertical leakage. Table D.5 is a summary of their
results. Their values for K, in the city aquifer using, a semi-confined
analysis compare well with values for K. calculated from the COM pump
test data using a confined approach.
Gerahty and Miller Inc., in a recent pump test done at the AVX
plant estimated transmissivity of the lower aquifer to be approximately
400,tDOO gpd and storativity to be on the order of 10 . These data are
relatively consistent with the analyses discussed above.
D-36851J93
300321
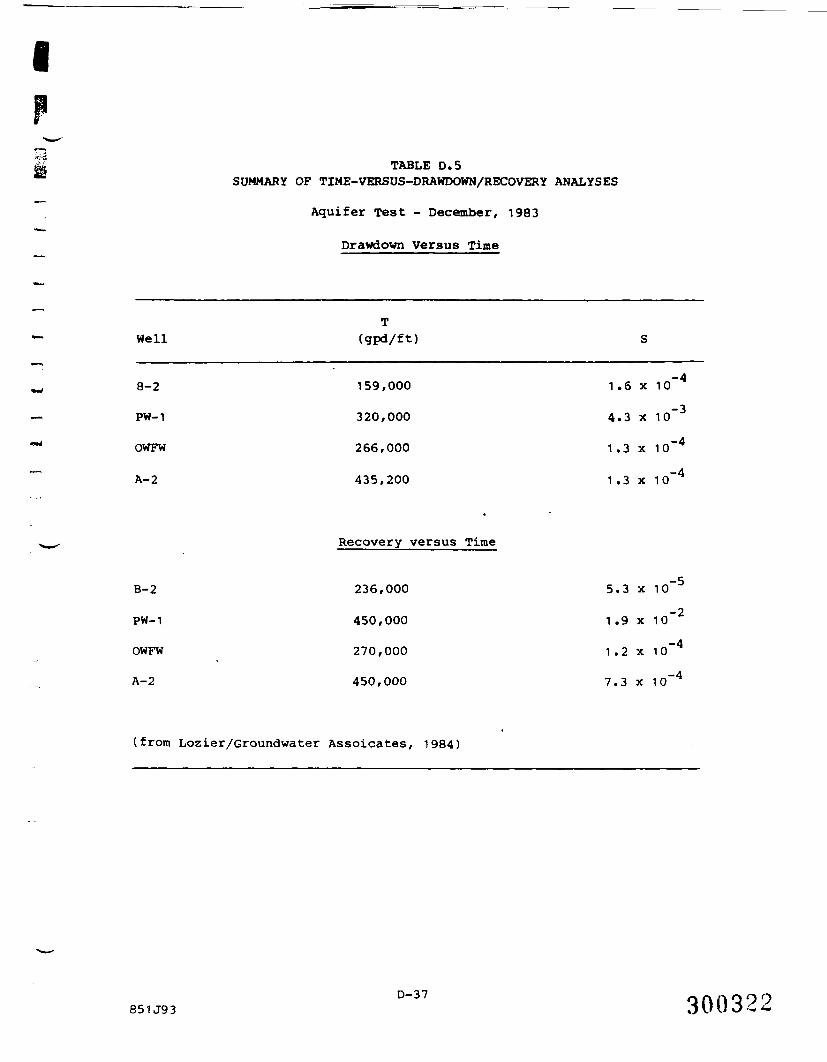
TABLE D.5SUMMARY OF TIME-VERSUS-DRAWDOWN/RECOVERY ANALYSES
Aquifer Test - December, 1983
Drawdown Versus Time
Well
8-2
PW-1
OWFW
A- 2
B-2
PW-1
OWFW
A- 2
(from
T(gpd/ft)
159,000
320,000
266,000
435,200
Recovery versus Time
236,000
450,000
270,000
450,000
Lozier/Groundwater Assoicates, 1984)
S
41 .6 x 10~
4.3 x 10~3
1.3 x 10~4
1 .3 x 10~4
5.3 x 10~5
~1.9 X 10
1.2 x 10~4
7.3 x 10~4
D-37851J93 300322

APPENDIX E
GEOTECHNICAL RESULTS
300323

APPENDIX E
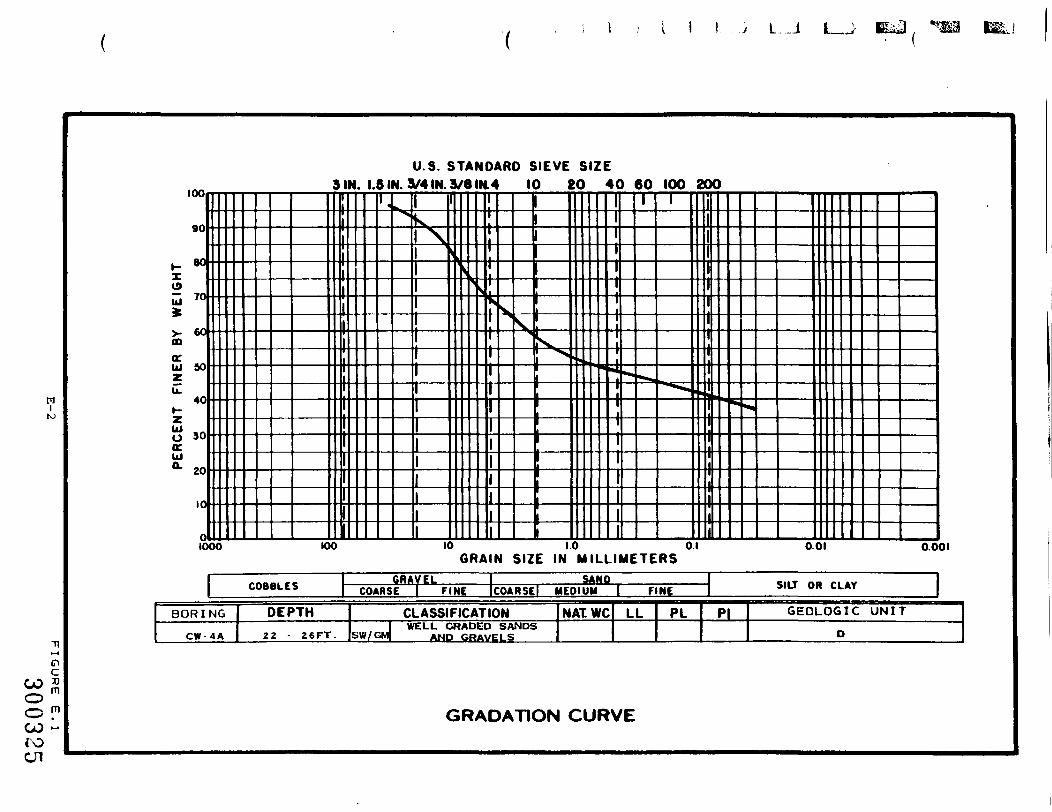
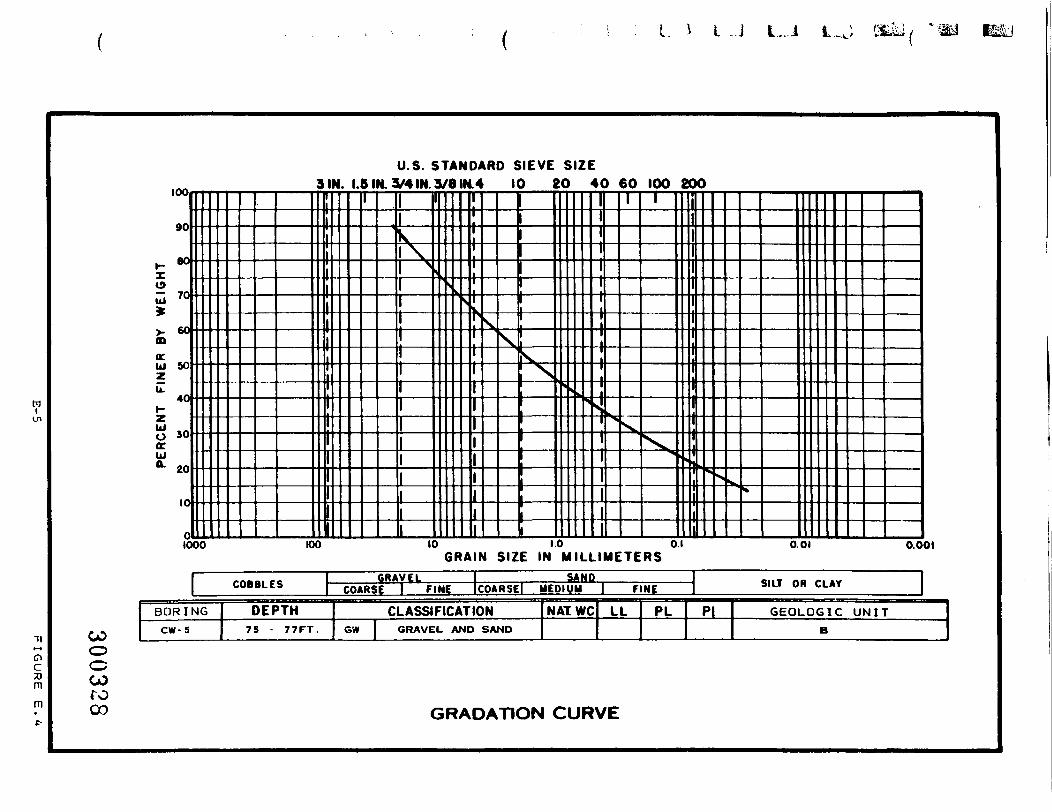
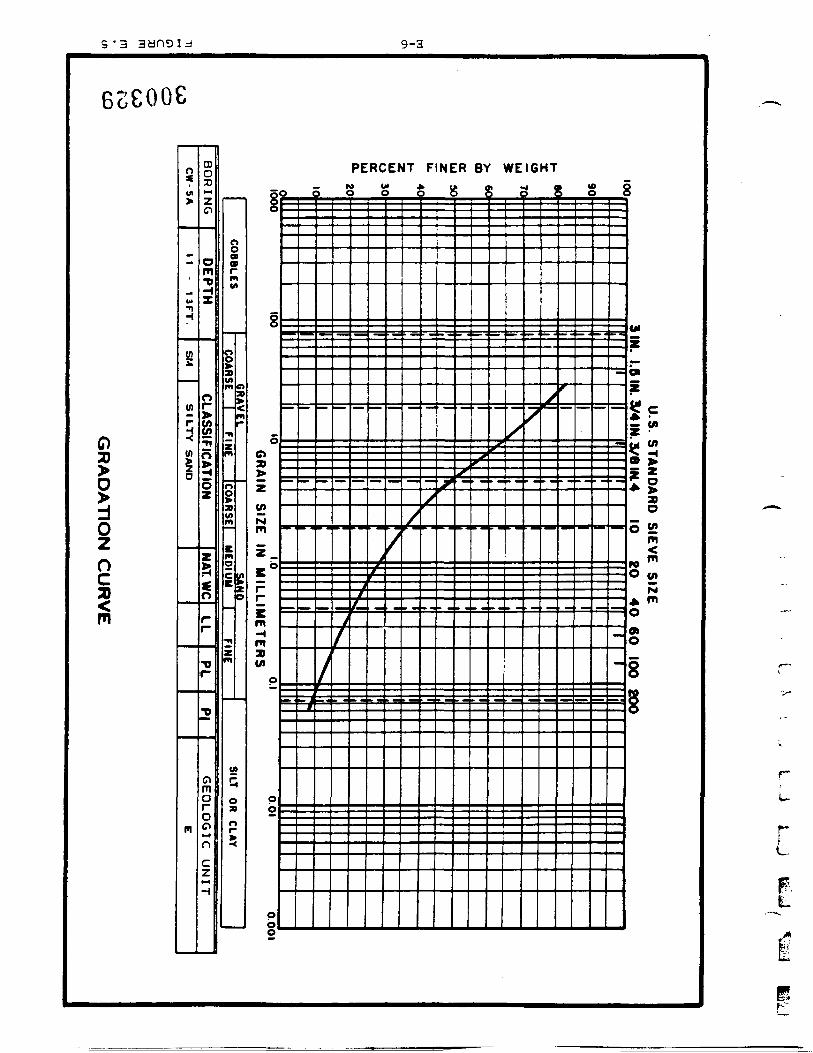
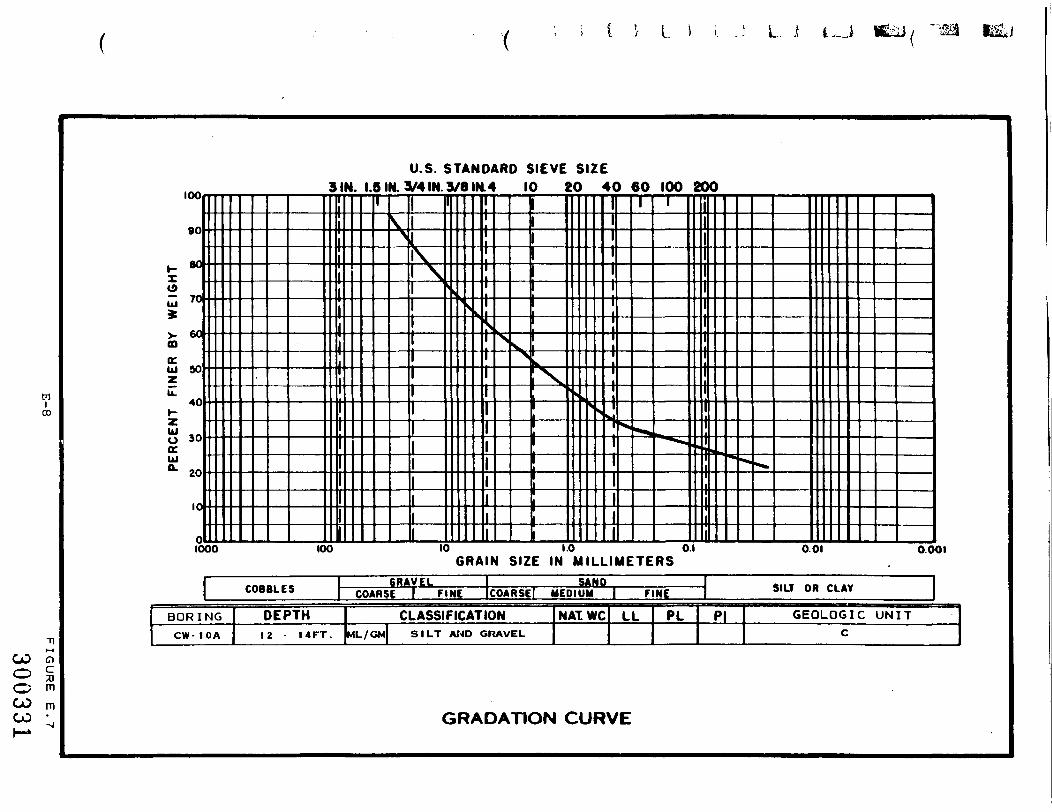
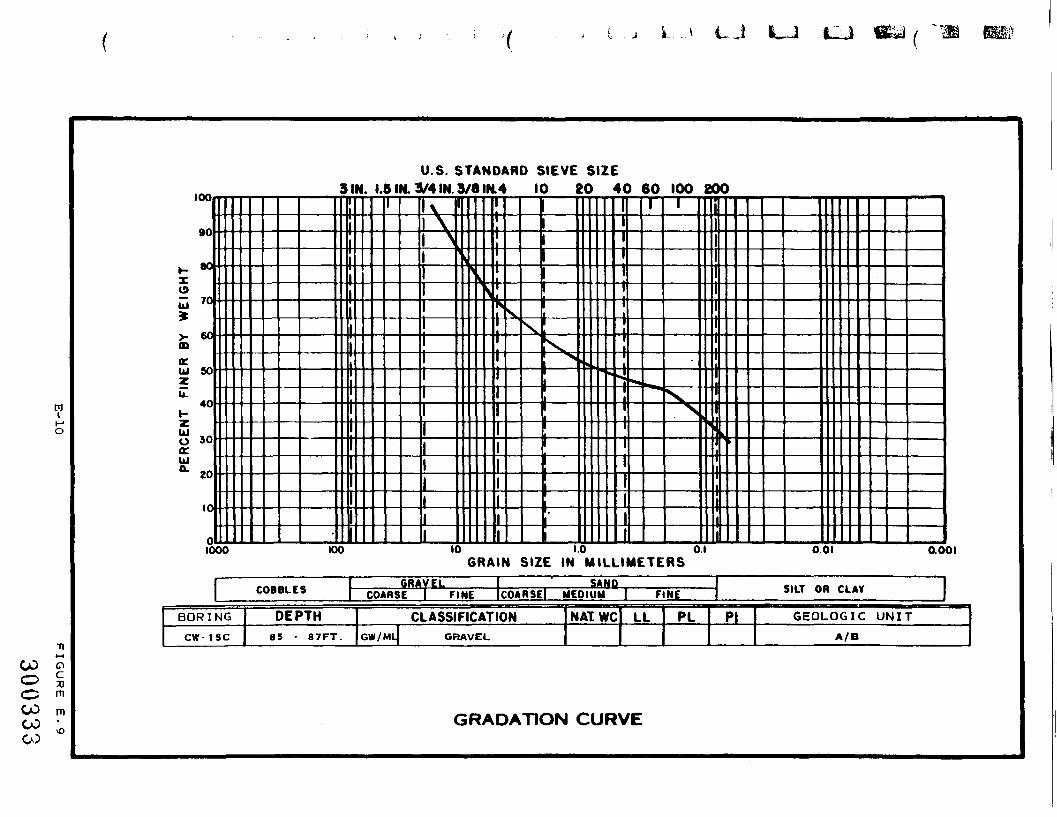
-'i GEOTECHNICAL RESULTSiJ^ Wet sieve grain-size analyses and hydrometer grain-size analyses
were done on selected soil samples in accordance with ASTM D 422-63
entitled, "Standard Method for Particle-Size Analysis of Soils". For
the coarse grained soils, the wet sieve method was employed and for the
~~ fine grained soils, the hydrometer method was used. Soils which were
poorly sorted and contained both coarse and fine particles were tested
using both methods. Grain-size curves are shown in Figures E.1 through
E.12 inclusive. The results of slug testing of wells are presented in
Table E.1
E-1
851J93
300324
L_J
100
1000
U.S. STANDARD SIEVE SIZE3 IN. 1.5 IN. V4 IN. 9/8 IN.4 10 20 40 60 100 ZOO
10 1.0 O.IGRAIN SIZE IN MILLIMETERS
GRADATION CURVE
0.01 0.001
BORI
cw-
NG
4A
COBBLES
DEPTH22 - 26FT.
GRAVELCOARSE 1 FINE
SANDCOARSEl MEDIUM I FINE
CLASSIFICATIONI WELL GRADED SANDS
SW/GM) AND GRAVELS
NAT WC LL PL P|
SILT OR CLAY
GEOLOGIC UNIT
D

100
90
60
70
>-CDOf.tU SOzu.
40
O 30OCUl°" 20
10
01000
U.S. STANDARD SIEVE SIZESIN. 1.5IN. 3/4IN.3/8IN.4 10 20 40 60 100 200
100
X
10 1.0 0.1GRAIN SIZE IN MILLIMETERS
0.01 0.001
COBBLES GRAVELCOARSE 1 FINE
SANDCOARSE! MEDIUM I FINE SILT OR CLAY
BORING
CW-5
DEPTH50 - 52FT.
CLASSIFICATIONGM 1 SILT AND GRAVEL
NAT. WC LL PL PI GEOLOGIC UNIT
c
GRADATION CURVE

L -.) I i_J
U.S. STANDARD SIEVE SIZE10 20
90 -
1- *> ~I(9UJ '°
CD(EUJ 90Zu_
401-Z1115 30QCUJ°- 70
10 •
0 .1000 100
rt - - 1 (1!L_ ..&
1
10
r
^ ,s rh y
¥~\ ——— "-1 ——— '~1 ———Hi ——— '
=b:vEr\• «-i— •-4--H — • •=h1.0
1 k 4
I1
s
1
X
1
"^v^
O.I
11TiiI11
1
j11* u:-i
V «x *x001 O.OOI
GRAIN SIZE IN MILLIMETERS
BORING
C W - D
COBBLES
DEPTH65 - 67FT.
GRAVELCOARSE 1 FINE
SANDCOARSE! MEDIUM I FINE
CLASSIFICATIONGW 1 GRAVE:'. AND SAND
NAT WC LL PL PI
SILT OR CLAY
GEOLOGIC UNIT
B
GRADATION CURVE
t J L...J L
U.S. STANDARD SIEVE SIZE3 IN. 1.5 IN. V4 IN. 3/8 IN. 4 10 20 40 60 100 200
100 • —————————————————————————————————————————————————————————————————————————————————————————
90
X19— 70 -UJ*
ffi
UJ 50ZU.
40
ZUJ0 30OCUJ°- zo
10 •
0
————— ..
. .
. .
1
=
K
\^,
S
s
1
s^
s4
's'
1
S
1
S,
I
X i
|j
iT
1
:|4hi
11
s s, v*
1000 100 10 1.0 O.I 0.01 0.001GRAIN SIZE IN MILLIMETERS
BORINC
<^> c"-5
COBBLES
; DEPTH75 - 77FT.
GRAVELCOARSE FINE
SANDCOARSEl MEDIUM I FINE
CLASSIFICATIONGW GRAVEL AND SAND
NAT WC LL PL
SILT OR CLAY
PI GEOLOGIC UNITB
CD0COfO00 GRADATION CURVE
9-3
CDCDCOroto
GR
AD
ATIO
N C
UR
VE
B
nUl
U>•n
1 S
M
1 S
ILT
Y
SA
ND
n
CDO1—t
Zen
| D
EPTHI
CLASSIFCATIO
N
1or
•v
•o
[ G
EO
LO
GIC
U
NIT
COBBLES
ooam
8
1 COARSE
KmocC
z
I G
RAVELio
o
0
5
o
002)
Z
m
z _a
O.IM
ILL
IME
TE
RS
oo
P
o P
n^4=
PERCENTro w .O O <
f
A
f
j
r"
//
FINER BY WEIGHT
3 o O O ^5
/j>
f*^
r
/
/
/
% i
^
--
zOl
Z ^01 CATA
ND
AR
D
SIE
VE
/8IN.4
10
2
O u>N
Oato
8
L

•L..J
100 •
90 -
H «° 'I<9i 70
X "*Jffi
IEU 50ZU.
40»-ZUJO 30 •oeUi* 20
10 •
0
U.S. STANDARD SIEVE SIZE3 IN. 1.5 IN. V4 IN 3/8 IN. 4 10 20 40 60 100 200
•— • •— ..— ..
ir
f
1!1
i 1 \I \i ^
\ \i S111 —1 — •1 —1 —1 —11111111
1000 100 10
I
S -- !^\
||Hi11PrP
Sj
IVr >r 'rF1EcLB
1.0
11I
s"^s
1
X
1
.
X *
i
iiii
i4•i-4'11
11O.I 0.01 0.001
GRAIN SIZE IN MILLIMETERS
BORING
CW- SA
COBBLES
DEPTH26 - 28FT.
GRAVELCOARSE 1 FINE
SAND 1COARSEl MEDIUM 1 FINE 1
CLASSIFICATION1 GRAVEL AND SAND
GW | Ml XTURE
NAT WC LL PL PI
SILT OR CLAY
GEOLOGIC UNIT
D
GRADATION CURVE
L t-J
100
90
BO
70
OD60
SO
40
O 30ac
10
1000
U.S. STANDARD SIEVE SIZE3 IN. 1.5 IN. V4 IN 3/8 IN. 4 10 20 40 60 100 200
100 10 1.0 O.IGRAIN SIZE IN MILLIMETERS
0.01 0.001
COBBLES GRAVELCOARSE 1 FINE
SANDCOARSE! MEDIUM I FINE SILT OR CLAY
BORING
CW- IDA
DEPTH12 - I4FT.
CLASSIFICATIONML/CMJ SILT AND GRAVEL
NAT WC LL PL PI GEOLOGIC UNITc
GRADATION CURVE

{ } [ \ \. L-,l i-J
COooCOCOfO
U.S. STANDARD SIEVE SIZEBIN. 1.5 IN. V4 IN. 3/8 IN. 4 10 20 40 60 100 200
»u
.-X0u 70 '*
00ac.UJ 90Zu.
401-zUl0 30QCUJ°- 20
10
o .1000 100
1
1
NKN
^
10
S5
1
'V
IHUbip|
v jiSs.C •cL
f
FFIEcEE
1.0
1 • . •4i
|
^
1
S,,,
1
X
01
jl|
1111jJ
11il
J||
S^ s
***- v^^
001
• i •>xj
0.001GRAIN SIZE IN MILLIMETERS
BORING
SW- 14
COBBLES
DEPTH4 - 6FT.
GRAVEL 1 SAND 1COARSE 1 FINE ICOARSEl MEDIUM 1 FINE 1
CLASSIFICATIONSM | SILTY SAND
NAT WC LL PL P|
SILT OR CLAY
GEOLOGIC UNIT
E
GRADATION CURVE
CJ
U.S. STANDARD SIEVE SIZE3 IN. 1.5 IN. V4 IN 3/8 IN. 4 10 20 40 60 100 ZOO
90 •
»- *°X19U 70
*
OD
(CUJ 50Zu.HZUl0 30IKUJ°- 20
10
Q
1000
• •—— ..
100
1
—
| V\
>
|^
10
r
S- 1-^^
.^ ,
1.0
'• J- - -
r
*•
1
•*«
1
x. N,
01
jl||1II111j
'j
' H1
44ii|
001 0.001GRAIN SIZE IN MILLIMETERS
BORING
CW- 1 5C
COBBLES
DEPTH85 - 87FT.
GRAVELCOARSE 1 FINE
SANDCOARSE! MEDIUM 1 FINE
CLASSIFICATIONGW/MLJ GRAVEL
NAT WC LL PL
SILT OR CLAY
PI GEOLOGIC UNITA/B
GRADATION CURVE

i_>
100
90
60
O701
Vm
tu sozu.
40
oa:20
10
01000
U.S. STANDARD SIEVE SIZE3 IN. 1.5 IN. V4 IN. 3/8 IN.4 10 20 40 60 100 200
T
100 10 1.0 O.IGRAIN SIZE IN MILLIMETERS
001 0.001
BORING
CW- 18
COBBLES
DEPTH22 - 24FT.
GRAVELCOARSE 1 FINE
SANDCOARSEl MEDIUM I FINE
CLASSIFICATIONSM 1 SILTY SAND
NAT WC LL PL
SILT OR CLAY
PI GEOLOGIC UNIT
D
GRADATION CURVE

i -3 ganoid
GR
AD
AT
ION
CU
RV
E
?
I 105
- I0
7F
T.
Or
n-<
0(Ar
>
03C
Z
omiz
\ C
LASSIFIC
ATIO
N
1
o
t~r
•or-
•o
| G
EO
LO
GIC
U
NIT
COBBLES [
ftoa(A
X
ICO
AR
SgM
EDIU
M
I
X
GR
AVEL
I0
JO
0TO
nT-
IIOOO
100
10 1.0
01G
RA
IN S
IZE IN
M
ILL
IME
TE
RS
ob
obo
o o
PERCENTH w jo o <
/
//
FINER BY WEIGHT
\ 8 S ^ ?
S^^X
^^^
too
X^
8
-
/
OtzCMz
l«^ z* >aoo <5
w m
o wN
* m0
S8
uIf

COooCOCOCD
U.S. STANDARD SIEVE SIZE3 IN. 1.5 IN. V4 IN. 3/8 IN.4 10
90 •
1- "°I
U 70
*
m(CU 90 •zu.
40»-ZUJ0 30OCUJ°- 20
10
n .
1 ^ 1
*MrMtin— t
r
;:;yv
H
¥f —— "-r "4---uJ_..
H — ••P-f — --1— •rr~ "^t::-rk S^ ^
11
-f ••
1
— .
1
— » ,
1|
1000 IOO 10 1.0 O.I 001 0001GRAIN SIZE IN MILLIMETERS
OUTCROP
COBBLES
DEPTH
GRAVELCOARSE FINE
SANDCOARSE) MEDIUM
CLASSIFICATIONGW 1 GRAVEL AND SAND
NAT
FINE
WC LL PL
SILT OR CLAY
PI GEOLOGIC UNIT
TERMINAL MORAIN
GRADATION CURVE
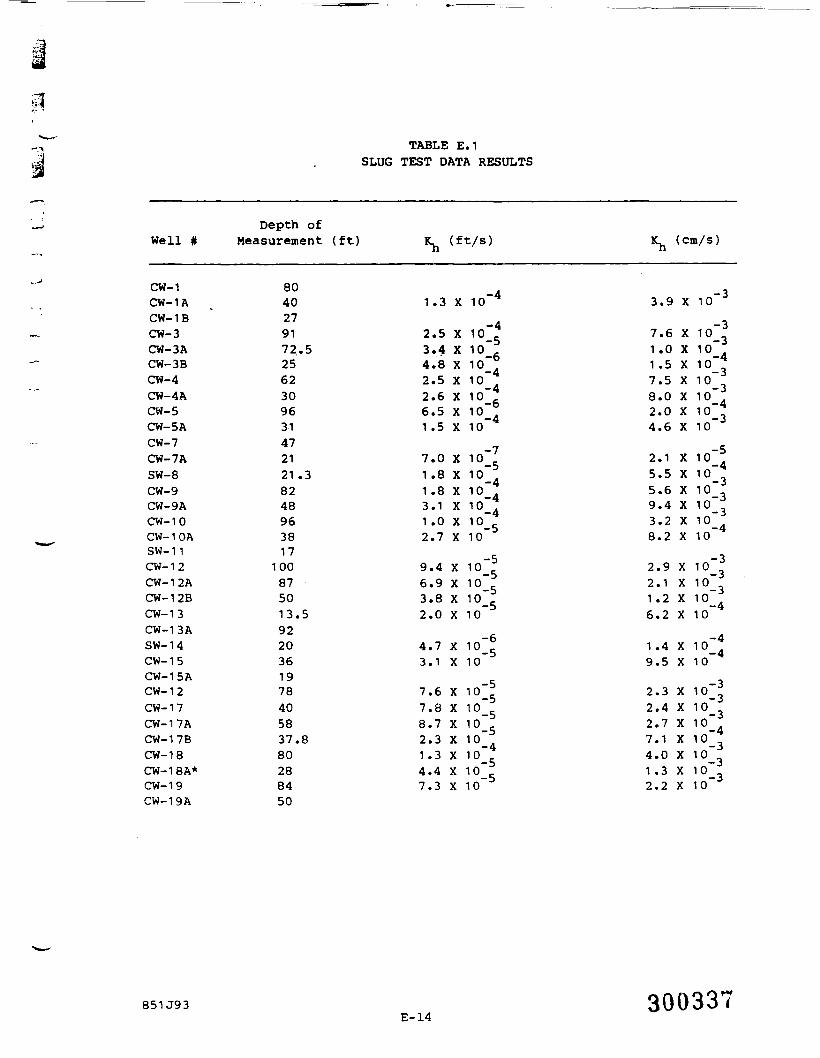
TABLE E.1SLUG TEST DATA RESULTS
Well #
CW-1CW- 1 ACW-1BCW-3CW-3ACW-3BCW-4CW-4ACW-5CW-5 ACW-7CW-7ASW-8CW-9CW-9ACW-10CW-10ASW-11CW-1 2CW- 1 2ACW-12BCW-1 3CW-1 3 ASW-14CW-1 5CW-15ACW-1 2CW-1 7CW- 1 7ACW-17BCW-1 8CW-18A*CW-1 9CW-19A
Depth ofMeasurement (ft)
8040279172.52562309631472121.38248963817
100875013.59220361978405837.880288450
Kjj (ft/s)
1.3 X 10
2.5 X 10 53.4 X 10~6
4.8 X 10~4
2.5 X 10~4
2.6 X 10~6.5 X 10~1 .5 X 10~
7.0 X 10~1.8 X 10~1.8 X 10~.3.1 X 10~4
1 .0 X 10~2.7 X 10~
9.4 X 10~^6.9 X 103.8 X 10~5
2.0 X 10~
4.7 X 10_5
3.1 X 10~
7.6 X 10~|7.8 X 10~8.7 X 10~5
2.3 X 10~1.3 X 10~4.4 X 10~5
7.3 X 10
J^ (cm/s)
3.9 X 10
7.6 X 101.0 X 10~1 .5 X 10~*7.5 X 108.0 X 10"2.0 X 10~*4.6 X 10~
5
2.1 X 10~4
5.5 X 10~,5.6 X 109.4 X 10 ,3.2 X 108.2 X 10~
2.9 X 10~2.1 X 10~1 .2 X 10~6.2 X 10~
1.4 X 10_4
9.5 X 10~
2.3 X 10"^2.4 X 10~2.7 X 10~7.1 X 10"^4.0 X 10~1 .3 X 10~2.2 X 10~
851J93E-14
300337

APPENDIX F
BORING, GEOPHYSICAL BORING AND MONITORING WELL LOGS
300333
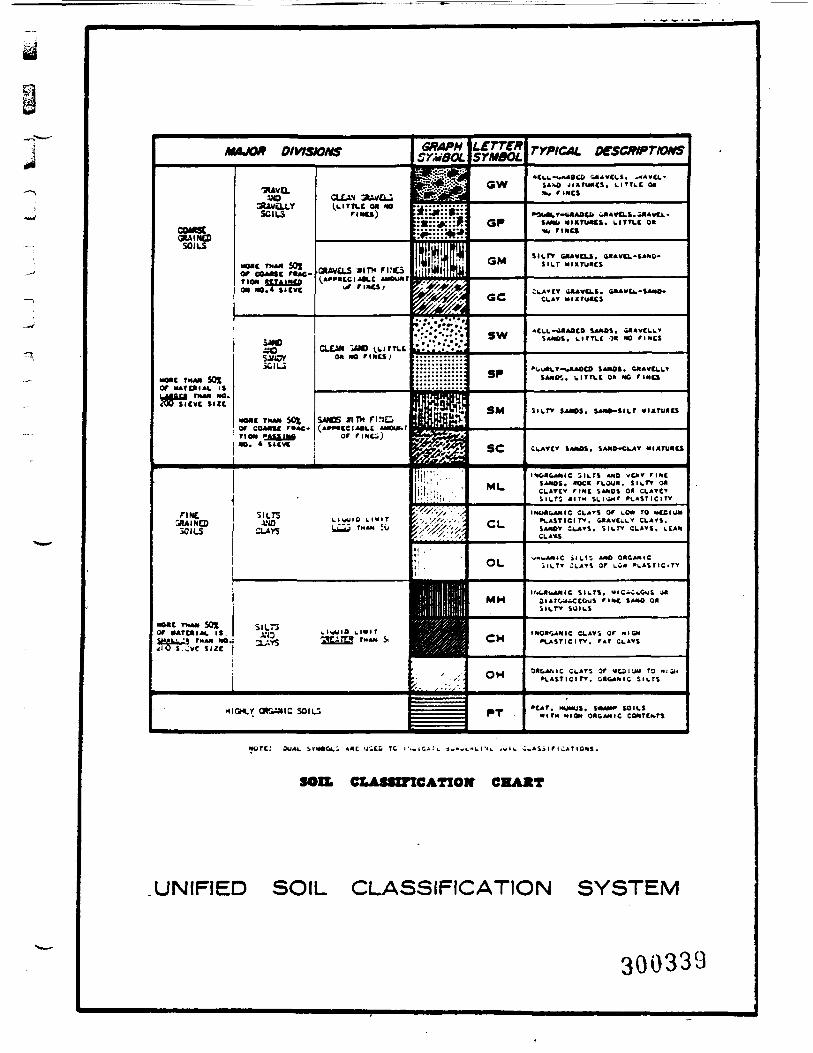
MAM* DIVISiONS
•MC rnM SOSor luroiiAL isiSo sieve size
•FINE
GRAINEDSOILS
no«C THAJ, SOtor nArcftiAL isSHAL!.J« THAN MO.<iO s -v: size
SCIL3
«MC TMAM SOJor eo*Mc rue-riOH KTAintnon «o.« sieve
SJM)
SCIL3
•QIC TWW SOtor COAMC r»AC-rion MM meno. « sieve
SILTS
CLAYS
OtAN 3UV£Li(LirTLe on mo
rmci)
OUVCLS *ITH nresor fixes;
CLEAN "-UO (.LirTLto* MO rmcs;
sues «ITM n:iuor riNCiJ
LI WUI 0 LIVIT^^^ THAN 50
H sa-K.
HlOtr CMUMIC 30IL3
wore: DUAL svitiGL' *ac uica re i*.
GRAPHSYMBOL
'jjj^
^••^••••*3i*«JV****»
:ii::ijc::X•fft::t? 55?
S«IK*••*.*• !*"1V'
:::::::::::::
Rs• • i;':!i , ' ' :
''/''$£'• y/f/
HnMRDflHIin
HIIBiii ^MHKB
^tC-.'i. sw»-i.
LfTTCTSYMBOL
GW
GP
GM
<3C
SW
SP
SM
sc
ML
CL
OL
MH
CH
OH
PT
,L,,;.-,L
TYPICAL DeSCmPTIOMS
SA*O jiariwcs. L i tTLC onM- rmcs
SAW. Hixruaes. uirrCe o*iu rmcs
SILTV QAAVCLS* GMAVCL^SAJVO—SILT miTU*CS
CLAT MiiriMies
SAMOS. LITTLC •>* no rmcs
SAHOC. Lirtxt on no rmcs
SILPT SA«OS. SAno-sitr m»ru«ts
CkAVC^ SAMOS. SAMO«CCAV ItUtruMU
I1OHCAIIIC ilLts AHO vt>" rimeSANOS. «OC« fLOUH. SlLT> 00CLATC-r 'INC SANDS OH CLATCV
INUHWUIIC CL>»S or LO» ro ueciun1.ASTICIT>. &NAVCLLT CkAYS.SAHOT CLAYS. SILfY CLAYS. LCAN
3i»rcj-ccciui 'INC SAMO o*ilLnr SOILS
I*O*'>ANIC CLAYS or max•LASTieirY. TAT CLAYS
»LASTICir>, QURANIC S I L T S
•CAT, WMUS, SWW SOILS
.ASSir i^Ar iONS.
SOIL CLA«nncATioir CHAXT
.UNIFIED SOIL CLASSIFICATION SYSTEM
300333

FIGURE F.2
UNIT E MOSTLY BROWN FINE SAND AND SILTS WITH OCCASIONALLENSES OF GRAVEL OR CLAY: DEPOSITED DURING MODERNTIMES BY RIVER. STREAM AND WIND PROCESSES: ALTHOUGHFINE GRAINED. THESE UNCOSOLIDATED DEPOSITS ARE GENERALLYPERMEABLE.ALSO INCLUDES LOCALIZED BLANKETS OF SAND AND GRAVELCONSTRUCTION FILL OR A MIXTURE OF SOLID WASTES(E.G. CERAMIC TILE. FOUNDRY SAND) AND SAND AND GRAVEL;THESE FILL MATERIALS ARE GENERALLY PERMEABLE EXCEPT WHEREHIGHLY COMPACTED.
UNIT D BROWN TO GRAY-BROWN SAND AND MIXTURES OF SAND AND GRAVELWITH VARYING AMOUNTS OF SILT; MORE RESISTANT GRAVELLITHOLOGIES ARE ROUNDED TO SUBANGULAR IMPLYING THATDEPOSITION WAS PROBABLY FLUVIAL: DISTINGUISHED FROMRECENT ALLUVIUM BY ITS COARSER TEXTURE; GENERALLYPERMEABLE; COMPRISES MOST OF THE UPPER AQUIFER.
UNIT C DENSE. GRAY TO BROWN-GRAY TO BROWN; GENERALLY 50 PERCENTOR MORE SILT BY WEIGHT WITH VARYING AMOUNTS OF FINE TOCOARSE SAND AND FINE TO COARSE GRAVEL; GRAVEL LITHOLOGYIS MOSTLY LOCAL SHALE WHICH IS ANGULAR; DEPOSITION OF THISMATERIAL WAS PROBABLY BY ICE AS LODGEMENT TILL; RELATIVELYIMPERMEABLE: COMPRISES THE UPPER AQUITARO IN THE STUDY AREA.
UNIT B BROWN TO GRAY-BROWN ALTERNATING SEQUENCE OF UNSTRATIFI ED SAND.STRATIFIED SAND AND MIXTURES OF SAND AND GRAVEL; CONTAINS SOME•• EXOTIC" GRAVEL LITHOLOGIES DERIVED FROM A DISTANT SOURCE;GRAVELS ARE ANGULAR, SUBANGULAR AND ROUNDED; THE IRREGULARDISTRIBUTION OF FINES WITHIN THE SAND AND GRAVEL SUGGESTSVARIABILITY IN THE MODE OF DEPOSITI ON. AD GLACIAL OUTWASH.KAMES. OR KAME TERRACES; GENERALLY PERMEABLE. THIS UNITCOMPRISES MOST OF THE LOWER AQUIFER (CITY AQUIFER).
UNIT A RED TO GRAY TO GRAY-BLUE TO GRAY-GREEN LAYERS OF SILT ANDCLAY ASSOCIATED LOCALLY WITH LAYERS OF FINE TO VERY FINEGRAY TO RED SAND; DEPOSITED AS PROGLACIAL LAKE SEDIMENTSPRIOR TO DEPOSITION OF UNIT B; SILT AND CLAY ARE RELATIVELYIMPERMEABLE COMPRISING THE LOWER AQUITARD; SAND LAYERS AREMORE PERMEABLE. COMPRISING PARTS OF THE LOWER AQUIFER.
DESCRIPTION OF MAJOR GEOLOGIC UNITS300340

-1 H- mfm IDPS'— UL| ""i"
BORING: C W - 1
SURFACE ELEVATION c.
COORDINATES
DESCRIPTIVE GEOLOGIC NOTfS
SURFACE CONDITIONS. & A A S S T FICUDTOPSOIL 0 - 0 , 2 S '
ST S I L T . SOME f \r*t SANO
C«AT-BSQ«N DAT C O A A & C TO FINE GR »N3 . re.;c SI
O R A T AND BROUN ONT O « E I A T I k . D *
G R A D I N G TO L I T T L E COARSE TO r I * C S*NQ
3ROMN V E T COARSE T O M E D I U M SANO, T R A C E S l . T
CObB(.£S M l L L I
TO F 1 NE SAND
T H A C E S I L T
GRADES TO COAftSE TO F|N£ C R A v E L , SOME TO L f r r L £ S : L * . L I T T L E TOSOME COARSE TO F I N E SANO
BAQvN hET COARSE TO fIMC SANO
CNAOf* TO SOME CQAftSe TO ^INC CMAV(L
BHOMN MOIST COAflSE TO f 1 NC CAAVCL. LITTLE CQAASC TO 'INC SANO, L I T T L ESILT (TILL)
GOCDOCO
SOU SAMHIMt IhfORMATIOH
PI S1AMOAHO HhtlHAIION T E S T
. • uNOisiuiiBco SAMPLEU DliTUHSEO iAMfU
Q no SAHFLE stcuvi«eo
Kit TO HCIL SCHiMATIC
GftOUl
BENTQHITE SEAL
SANO F I l T t A
• HI SCREEN
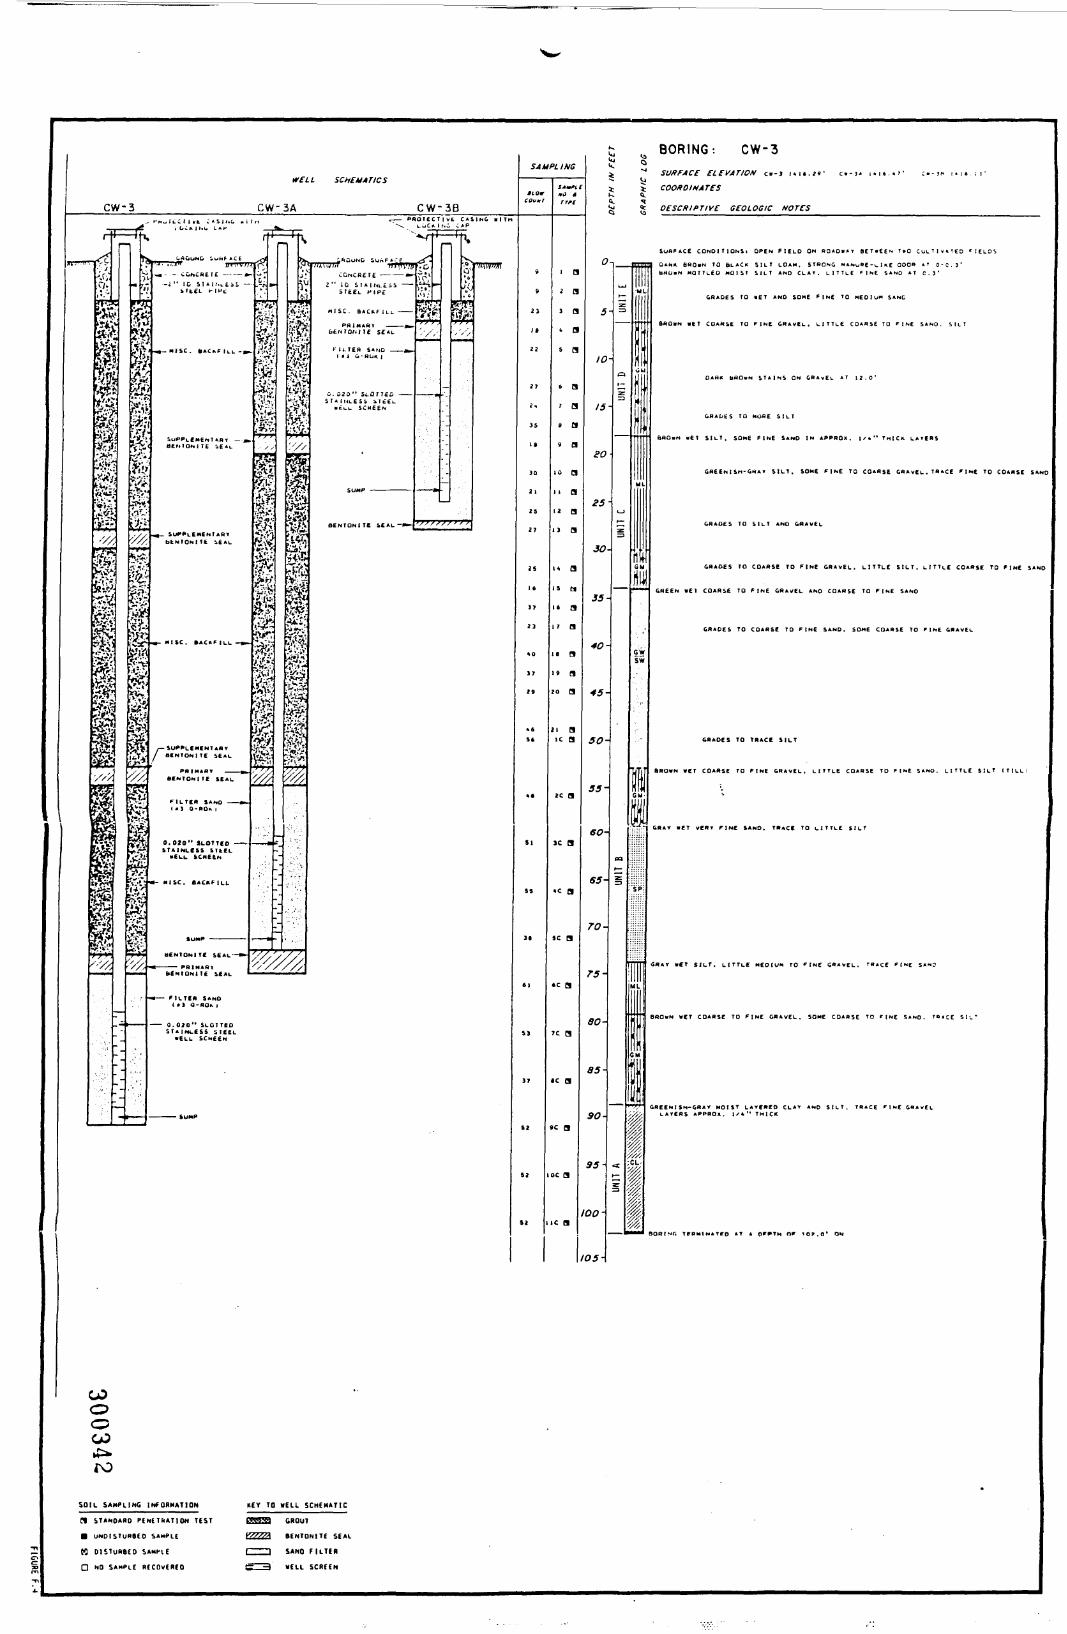
BORING: CW-3
If ELL SCHEMATICS
CW-3 CW-3A CW-3B
rF
•tf/
g
1
1
i- 'r
1
H1Ijji1
•MW
' ,
r>
1£*
1
1
"""I
1
1
1
1
I
1
1
- .<: '
'•*> ..'.'** H I K V J T J
/ BENTONI TE SEAL
BCMTOMl TE SEAL
< • S 0-ROK i
STAINLCSS STtEL
-*- MISC. BACKFILL
UENtONl TE SfiAL— •>•
•^ —— f ILTED SANO( ») Q-HOt, |
—— 0. 010" SLOT TEDSTA 1NLESS S IEEL
•ELL &CNEEN
"f
ft-i ••
^
1
i
ft3$i
^\$\
t
;if'///^
If^
1
I1
'%
^y///,
r - —— P N O T E C T I V t C A & I H G B l T M
, - ( : * - - ^^ "V^^ni*\<jiif " n Mv.'JJKo • \1'WWJI1
2" 10 il»ll.u£ = S —— f^s. — ;'jSTECi. HI PC 'v'j ; 6^
M I S C . B A C K F I L L ——— *$$- &'£
tiEI4TOrillE SEAL '''//' '''''/
1 • i 6-RUK |
• C1.L SCHEEN '
——————— &UMP
COooCO
to
SOIL SAMPLING INFORMATION KEY TO VEIL SCHEMATIC
n STANDARD PENETRATION TEST PPBm GROUT
• UNDISTURBED SAMPLE VsfS/A BENTONITE SEAL
M DISTURBED SANflE 1 ' '| SANO FILTER
O NO SAMPLE RECOVERED g — 1 HELL SCREEN
SAHPLIHG
11 O*HOVHl
9
9
2 3
1 1
22
27
IS
1 •
10
21
23
27
29
1*
17
21
17
29
9t
51
99
11
91
37
92
92
92
«J trrn
i a
2 a
> a
<. as a
6 a
' aa a
9 a
10 a
11 a
12 a
11 a
it a15 U
>t a
17 a
ii a
19 a
20 a
21 aic a
2c a
ic a
•c a
9c a
«c a
c a
c a
c a
c a
c a
«J4J<
%
*K
0
t
10
15
SO
25
30
35
4O
45
SO
55-
6O-
65-
70-
75-
80-
85-
9O-
95-
100-
105-
'
£=1
ra
i —
II<
9
1
I
aa :••
= !ii
iM
csIni
""' SURFACE ELEVATION C.-3 nn.291 c.-3« i « i » . « J ' c . - jc i.n.n'
% COORDINATES
5 DESCRIPTIVE GEOLOGIC NOTES
ML
GRADES TO MOflE S I L T
Ul
-*V
1
L ....... _..,. ..,.„,..,*i
\
I^'
'

WELL SCHEMATICS
CW-4 CW-4A
unrwTRT
r'F
ii '?t>;•;ii^ViVfloi-
$£&is1**'?B$
P:M?
I$HiiftSijaj,
1ifij
'/ /
'
^c!>,J
ll';
S^$15^*
1
|ii*j>>'•&.$£i?p;itif.ft-*W-;^>
1-
tt±y*f v, VF-.VI^*W'w
^^4$X
Vii.ilVV&'Fs
«8$&S?S®il!'ftfi?2S>M&$%$$»3.-*.v.-/»»vsm
LUC.INU CAP LGC«l>g_C_•v.^ r •"
T1H VMM! C.HOUWO S W N F A C E OROuwo SURFACE ffl in <K"
M I S C . BACKFILL — *—
b£»IONlTE SEAL
F I L T E R SAND — -- ——
0.020" SLOTTED ———STAINLESS STEELfctLL SCREEN
•^ —————— M I S C . 8ACKFI1.L
M I S C . BACKFILL ———
^ ————— C A v t O
P«.MA«T dENTQNME SEAL
^ ———— F I L T E R SAND (*) O-NOH t
^ ——— MISC. BACKFILL
^ ——— BENTOHITE SEAL
^ ——— MISC. BACKFILL
«•
X4>!'///•
. ... -
: >
• I*
T ^
>S:(/!•>j*>
§^
'//' Ss //•///////,:0$$$
WK$0 t^^*^¥|MjftS. .^»^V
ffXtWTBTT
1^ :;..:: '' ^ ^ ^ ^ ^ ^ ^ ^ ^ ^ 1
111|Ng
pf
R
1
SAMPLING
»iOfcouir
\ 0
li
11
SJ
14
2«
}^
10
»a
>*
26
32
It
22
SI
12
24
*0
29
J7
1019
«l
It
it
90
St
31S4
ss
1«711
k>
It
21Sft
IJAtA/*
#tf »rrff
IA a
«A a
SA a>A a
JA a
>A a
9A a
IOA C
IIA a
i2A a
HA a
I«A a
ISA a
I4A C
DA a
1 «A C
i9A a
20A a
2iA ai a
2 a
i a« a
> a
» a
7A a78
• a
9A a9a a
o a
i a
2A a2B a /
COOOCO
COSOIL SAMPLING IMfOHMATlON
^ STANDARD PENETRATION TEST
• UNDISTURBED SAMPLE
B D I S T U R B E D SAMPLEQ NO SAMPLE RECOVERED
KEY TO HELL SCHEMATIC
GROUT
6ENTONITE SEAL
SAND r i L T E R
DELL SCREEN
BORING: CW-4SURFACE ELEVATION c.-» i « i s . > j ' C . - « A
% COORDINATES0.
SURFACE CONDITIONS* vEED GROUND COVER
10
IS
25
30
35
40
SO
55-
60-
65-
70-
75-
80-
85 -
90-
95-
00-
IM
1
GRADES TO SOME COARSE TQ F I N E
GRADES TO CHAT I Si»- B«QpN
iRO»N MET SILT, TRACE FINE SAND
lAVISH-RED «ET F I N E SAND. L I T T L E S I L T
(LAYERS I/a" TO I" TnlCK)
ORING TERMINATED AT A DEPTH OF 10*.0' ON

If ELL SCHEMATICS
CVV-5 CW-5A
7*
II&£**
Iit.;!
1
i
i''/,
1
1iI/IP
in-
. ' -
ft
"7-7
'* '('
- &l
1
1
1
§
&*!
>X\
'&(.P
i&wv.\*
^>*
1fi • 'i — -
"////,
IIP
f f i O f E C T I v t C A S I H L ulln * :^ —— PBOieX L O C K I N G CAP _
•• . r
-* —— — C O N C R E T E CONCRETE ———— — — »-
2 " , D 5 ,A, , . .ESS »" 10 •!.,«.«• ———
M I S C . B*C*F|LL —— »-
btr, IGNITE SEAL
F I L T E R SAND —————— »•I • J O-RQK |
SLOT TED S T A I N L E S S
r" b t N f O N I T E StAL -tNIUNIFC SEAL ————
M I S C . BACKFILL —— •^ —— _ M I S C . B A C K F I L L
-. ————— &uPPi-EH£NfAR» B£ TQ jTe
^ ———— - Ml SC . 5ACKF ILL,
•fLL SCREEN
•^ ———— FILTER SANOI«I O-ROKJ
^ —————— 6ENTONIIC SIAU
!i1 IT
L
I
iI1
MMM^ M
irv
JLP.
-
>
it.3
Ci CAC
>
^4
18-y.-
M$$!
'/••///,.ttUVTIt'Jitil• v"'Ay?*i!*'*
X '///•/,
SAMPLING
»iOm
1
72
9 /
«9
1 1 1
• 9
93
S 1
32
2 1
SS
24
32
39
ts
2S
29
32
79
2*
29
4 3
SJ
*5
19
frff
i a2 a
i a* as at a
> a' a9 a
10 C
it a12 a
13 ai» ais ai« a
" aii a19 a10 a
21 a
ic a
jc a
>c a
•c a
sc a
tc a
'c a
•c a
>c a
oc a
ic a
s*K.i
0
5
IO
/f
20-
25 -
30 -
35
40-
45 -
50-
55 -
60-
65-
70-
75-
ao-
85 -
9O-
95-
00-
I(H -
LU .
J
4C4
z *2
1
J
1
1
*
Ml
•iCO . !>
,- o'v5 •)
*'t
*. . -'•<
4',.-^:
v
Si
WT«
=3 ::::
%f
uwninw; ^TT ^Ci^ SURFACE ELEVATION c . -s 1 * 2 0 . »» ' c . - s * . * ? : . * « •
J COORDINATES
Jc DESCRIPTt VE GEOL OGIC NOTES
SURFACE CONDITIONS. MO«EO MAT F I E L D
W
GRADES TO M O I S T
ORGANIC ODOR
M
t
J
W
A
A
j
1
.
GRADES TO C L A Y
1 VV
*
iV
«•
f4•
*1T REOOISn-<RO»N r 1 NE TO MEDIUM SAND. TRACE S I L T
:
• OCCASIONAL BLACK S T A I N
:
*> GREENISH-GRAY MOIST LAYERED C L A Y , S I L T , TRACE^ FINE SAND
- GRADES TO LESS SANO
^
JunC •. 1»»*
COCDoCO
SOU SAMPLING INFORMATION
(1 STANDARD PENETRATION TEST
• UNDISTURBED SAMPLE
t£ DISTURBED SAMPLE
Q NO SAMPLE RECOVERED
«EY TO HELL SCHEMATIC
PBrai GROUI
77777* ICNTONITE SEAL
SANO f I L T E R
•CLL SCREEN
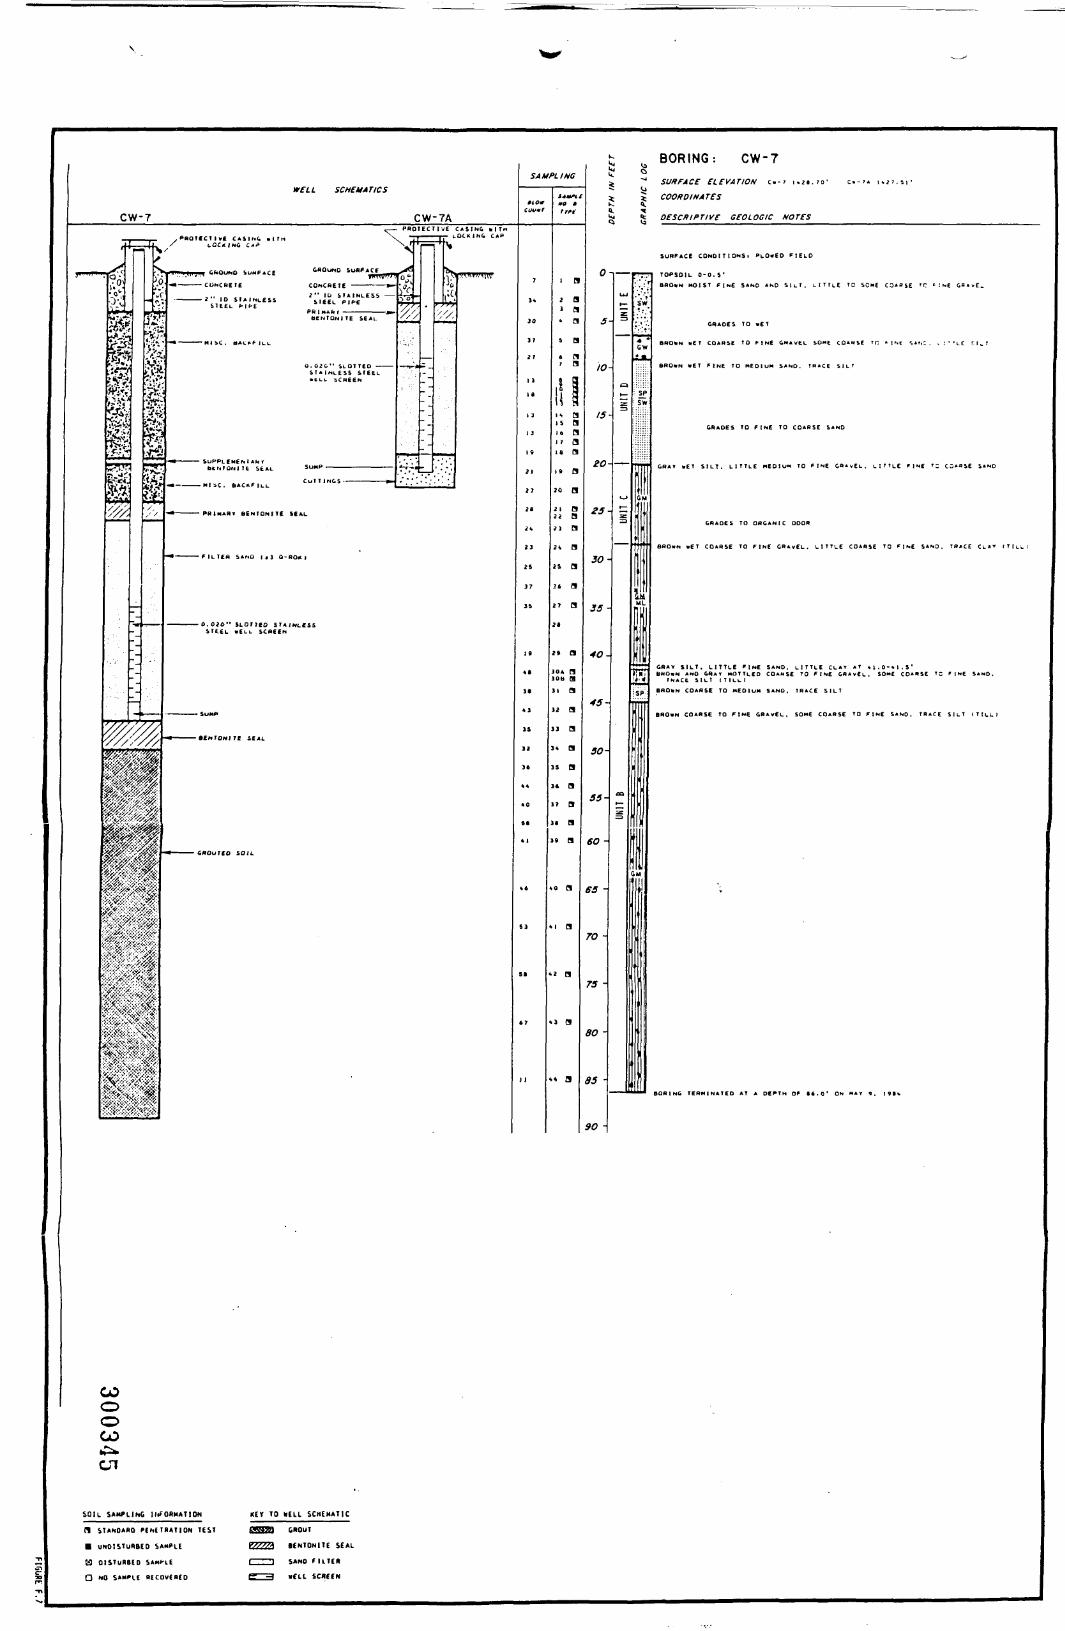
BORING: CW'7
WELL SCHEMATICS
CW-7 CW7A
JE
IWi1
..Y ' -
-_
W'
Iff'A'^\-'/.-'t.
ait
9%HIi!illH?:££•£;
n
T>
v^*'»'
1if1;v
-
- ;
^
M.•-'v%27%;
f*$%%
Hx'i«::*&&•
tVjp'
Ipl
m•ix?:
/ LOCKING CA* \^' * V•^ ^
^^ • ^^^ ** UUMO bUH ACE flTTTV^^ 0 *" T^ ?T^^^T^
SIEEL *\n >I««L (-IPS 'y/, . rwbENfONITE SEAL /// </'
S T A I N L E S S SIEEL -•tLL SCREEN ' _~
•^ ————— BEHTONITE SEAL
-^ ———— GAOUTCO SOIL
SAMPLING
cuvtr
7
34
30
17
27
11
II
1 't
1 3
1 f
21
27
21
21
25
17
35
19
31
41
IS
32
It
44
40
ftt
41
4t
S3
51
67
1 1
HO •rrft
i a2 ai a•• a
5 at ni a
1 M
14 ais ait a17 aia ai> a20 a21 a22 a21 a
24 a
2s a21 a
27 a
2t
2» a
IOA aJOB a11 a
12 a
i a
4 a
9 a)4 a
7 at a
« a
o a
i a
2 a
3 a
» a
*J<t<
t
S0.kl
0
5
10
IS
10
25
30
35
40
45-
50-
55-
60 -
ss -
70 -
75 -
80 -
85 •
90 -
— F
UJ .
^ '
i
*=» ;i
„(
\
:
«
iis
CO
"* SURFACE ELEVATION C - - 7 i » i * . 7 o ' c - - ? * i » i 7 . i i -
> COORDINATESft.
ft: DE SCRIP Tl VE GEOL OGIC NOTES
SURFACE CONDIT IONS. PLOvED FIELD
T7 TOPSOIL 0-0. 5*
'.^ CAAOCS TO ȣT
JL
s5W
: GRADES TO FINE TO COARSE SAND
.1
J)41
' f H A C f e S I L T ( T I L L )
1
J
CO
oCO
SOIL lllfOHMATION
(1 ilAHOASO l>f Hi IBAIION TtST
• UN01STUDBCD SAMPLE
IS OISTURBCO SANfLC
O HO SANH.C RCCOVCDCD
KtT TO >CLL SCHEMATIC
CROU1
ICNIONITE SEAL
SANO t IIIER
vCLL SCREEN
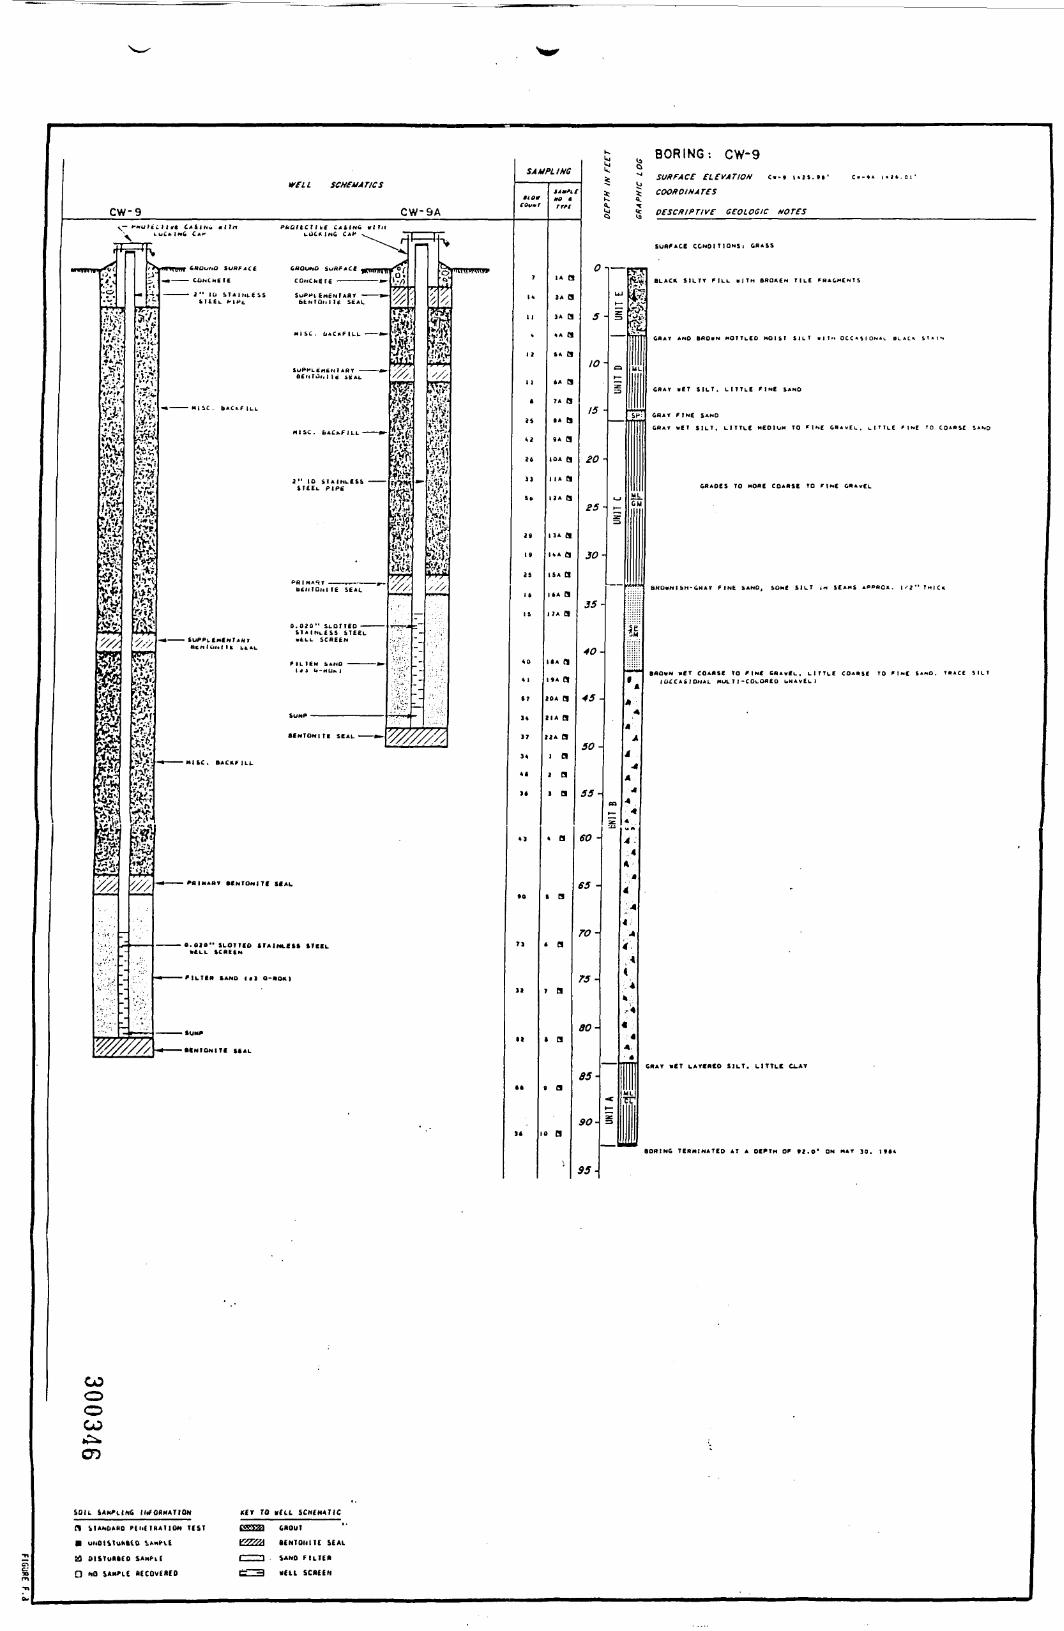
WfiL SCHEMATICS
CW-9 CW-9A
i
•fwt
-O
iy/jV
1•V**'T/WJ
¥§>>;^
»-HUU
77 V
if-M.i.*-
te
11
iiM'f
f*iy/t>
uCklMt CA»- LUCKING CA** ^^^
"•nviH fc»o^*o su«fAce CROUWO SUHPACI ^utinm
*I£tL. f-l^c. btNTOnll ic 5CAL
M I S C . (|AC»F|LL ——— *-
BCriTJf.I It ifcAL
•^ ———— MISC . 6AC*F ILL
2" 10 S1AINLE&& ————ST£Et . PIPt
PR 1 M A R T ————— r, ———————— ,-.
bcliIQi«| IE SEAL
•^ ——— • SUPPLCMCNT AHT «tLL SCREEN
1 * 1 U~HUl> J
BENTONITE SEAL * ———
^v
%
$$
^
w.
V.j-;. \
'/,
•v
Oft
/,^
/x:
Higji
/ :
//
.;;';'
'%//////<
•* —— - »*i ic . SAC HF ILL
SAMPLING
HO*COVMf
7
II
II
1 1
1
is
26
i )
it
1»
19
li
It
1 S
* I
57
It
17
It
1«0 4rrft
IA Q
JA a
IA a• A a
5. a
tA a7A aIA a»A a
IDA a1 1 A aDA a
HA a
ISA a
itA aUA a
ii» aI*A a»OA aMA aIIA ai a> ai a
• O . O J O " SLOTTID *>A!NLe»» »TKL
'ILTIR SAND «•! 0-MOKI
-»UM>
•MNIONITf SfAL
BORING: CW'9SURFACE ELEVATION c.
COORDINATES
SUXFACt C O N D I T I O N S , OB«SS
t) • B
7 B
10 B
10
15
20
25
30
35
40
45
50
55
60 -
65 -
70-
75 -
80-
85-
90-
95-
i
SP:1 CRAY FINC SAND
GRADES TO MOAC COARSE TO F1*C
CM
IOCCAi IOHAL MUL M -CQt-Ofl£O UHAvELl
CRAY «CT LAVCNCO SILT. LITTLE CLAY
BORING T E R M I N A T E D AT A OCPTH Of ffl.O* ON MAY 30.
COCDOCO
CO
SOU iAKfllHC llrf OBMATION
n ilAhOABO PdidHAIIOM tIST
• imOISlukttO iMii-U
a BliTuKiCO S»N(-l(
O NO SA»»LC nccovcftED
Kit TO Kill. SCMiMAIIC
(ROUT
IENTOIII1C SEAL
. SAHO FlLliR
VCll SCStfll

Iff Li SCHEMATICS
CW- IO CW-IOA CW-IOB
»>'.'.W
r
f^
Siimy//.
C5T5
1S?
y.50ipB>*i.a^
•its^iaiife•5W>*•}&VJ$$&'///.1gf-?
i^11///.: -.
^
=1*l
v
>•*S?S£Vif*x>/
1&f$t11»•.Sj
1r»I•^'*F
S3:;*-•A-^'•**i
'//,F&
I-|
1
1j**Hpvyfrjg
• i1 •• •
'//////,^ i
.- LUCAIHO CAH . \ LOCKING CAP
-, • x . Tr i. \ I _ II '^ ^ F m. ^ T± ^** f ^ — T"
*• -sw GBOUNQ SufcPACE
•'•• — " .-'.UIVM' i TnnT 'S0u"0 SI.8FACE .w»|im 'IIUVJM-. —— CONCREIf ———— .- CONCBEIE ——— : —— — _ _
PHIMAHI ———————— •— '. ',—— 1" 10 S T A I N L E S S ——— «• 8SNTONII6 SEAL ',' '/.
SIEEL ^IPE "^SU»PttHtnlAll» — m. *7 ^7BENIOMiri SEAL // ^ f l LTER SAHO ——— fc
-. —— FILL >! rr '" 0-R0'"^ ^r>; >.*/ J" ID STAINLESS — —M-\f( :>j STEEL PIPE*^ ** :
ft if'
^ ^* •f,'*Ijj :/", 0.020" SLOTTED —— ~~l c7^* V' STAINLESS STEELW . ji »ELL SCREEN - '
[j J^ bENIOHITE SEAL -^ '•'///.
-• —— SuPPLEMENIANr tl :-vHEN IGNITE SEAL ^V ^
i> i;'>s ••.•V* r>
tfCNTOMl Tt S«Au ••// '//_
F1L.TCR SANO ———— »- — 'i *\ G-HIJK I
0.020" S L O T T E D —— -*> "S T A I N L E S S &IEEL
-*v
•« ———— MISC. BACKFILL
-4 ———— MISC. BACKFILL
^ ——— FILTIN SAMO ^ »\ O-MOKI
•CLL SCACCN
SAMPLING
tto»COUM
1
2
2
1 1
n
20
23
2'
17
11
12
22
11
21
22
2 1
10
30
21
2122
2S
19
21
IS
• 0
• 0
• •
A]
ss
«0
51
S3
Hur*O Jrrff
IA a
2A a
IA a
• A a
>A a6A a
IA a
BA a
»A aIDA a
HA a
i2A a
ISA aI«A a
ISA a
i6A a
HA a
HA a
19. a
20A a2iA a
22A a
2iA a
2«A a
SA a
i a
i a
i a
» a
a
a
a
a
a
a
COo003.P*-1
SOIL SAMPLING INFORMATION KEY TO KILL SCHEMATIC
(1 STANDARD PENETRATION TEST Q59 SROUT
• UNOISTURIEO SAMPLE YSS/7A 6EHTONITE SEAL
B DISTURBED SAMPLE 1 "*\ SAND FILTER
a NO SAMPLE RECOVERED tj ^ «€LL SCREEN
0
S
10
IS
20
25
30
35
40
45
50 -
55-
60 -
65 -
TO -
75 -
80 '
as •
9O '
95 •
o •
i*
£%%
5
LU
1-;
a1 —
z
00
I
<
Z3
__
^ BORING: CW-IOO^ SURFACE ELEVATION c . - io i«u.«o- c . - i o « io-.!)' : . - ! -3 101. ]«•<j% COORDINATES«.* DESCRIPTIVE GEOLOGIC NOTES
SURFACE CONDITIONS* G»ASS AND ST3NE* F I E L D
Xi£.
:
sw;
I1
ODOR
w
w
#|L1u
t
4
4
4
4
• V
1
1
1
•
1
1
1
k
i1 GRAY HCT LAYERED S I L T . SOMC CLAY

WELL SCHEMATICS
CW-12 CW-I2A CW-I2B
;*
§fy '
t\<fj
!!>I?
H&$imiiKii
• ':
^V
o
np1t
In^
|• i — *—~
///////
CaOUND SlJfcFACE>Tii Y HI f|i',y)i(t
DENTO*«I TE SEAL
SIEEL Pl^-C
-»-«ISC. BACKFILL -•>*.
8EMTONI TC SEAL
-*• M ISC. BACKFILL
•ELL SCREEN
FILTER SANO — —
, SUPPLEMENT ARTS BENT ON 1 T£ SEAL
ttCNTOHlTC SIAL -*-
^^
W,
1M
1
• *
N
imtQf>'izp»ift
1§- .;.';:'- '" '•
W////.
LDCAING CAP ^^ "I 1 '
BENTONI TE SEAL —
STAINLESS SIEEL - :• ELL SCREEN . ,; _- ::;.:
FILTER SANO ——— ». :t « ] 0-RO*. 1 •: ,. - -.
BENTONITE SEAL-* i 1 / / / ///
-*- MISC. «AC«FILL
^-PBIMAfiT BENTOMITE SEAL
— FILTER SAND <«J O-HOKI
— 0.020" SLOTTED STAINLESS STEEL•ELL SCREEN
SAMPLING
tiomcouttt
a
t
4
IG
4
14
1.
44
20
22
30
SI
21
24
29
34
23
71
31
30
2*.
It
42
• «
S2
4S
34
32
30
2«
UnfitMO Jfrft
i a2 a
i a4 as a
6 a' a
• a» a
10 a
u a12 a13 a14 a
is a16 ai' ait a
i» a20 a21 a22 aic a
2c a
>c a
AC a
sc a
»c a
?c a
•c a
>c a
ii.i,
icLC
0
5
10
IS
25 -
30 -
35 -
45 -
SO -
55 -
6O -
65 •
70 -
80-
90 -
95 -
S.
UuI,ttL
S GR
AP
HIC
LO
G
\
BORING: CW'12SURFACE ELEVATION c.- iz 1.31.45 C . - I 2 A i.u.ji c.-ue io?..r
COOra/AMrf.?
DESCRIPTIVE CCOLOeiC NOTES
SURFACE COHOITIONSI CRASS AT EDGE Of TREE LINE
~
oi —
I
CJ
t—z3
CQ
1—
i
tz
fc*
1uorM
J
4
A
A
4*GM
A
t
t
*
t
t
tl
SJ»
sw
••4
4
A
4
4
*•
GW
4
4
A
4
4
«
*
4
a
1!MLCL
GRAY AND BLACK MOIST SILT. ORGANIC-RICH IBuRIED TOPSOIL L A < E » I
GRADES TO TRACE FINE SANO
GRADES TO SOME SILT
BROKN .ET SILT. SOME FINE TO MEDIUM GRAVEL. L I T T L E COARSE TO FINE SANO
ODOR
''
GOOoCO
CO
SOU. SAMPLING INFORMATION
n STANDARD PtNETHATION TEST
• UNOISTUDBCO SAMPLE
K oisTumco SAHPI.EQ NO SAMPI.E RfCdvCACO
KtY TQ Hell SCHEMATIC
CROUT
(ENTONITE SEAL
SANO FILTER
•ELL SCREEN

BORING:
WELL SCHEMATICS
CW-13 CW-I3A CW-I3B
r
*$
'$&?
.** .'*
ii&'ti'
"4:. 1';
^*; j
IrW':
--Xx
iVP**1ii§^*&'i
MMM
^3S
•1"" 'i
••* V*
££•*.' 1*
1i''l:ri<-.
i£1iiingt&
'//
; >•'
LOCKING CAP ^^
GROUND SURFACE
^^MO^^_ TT^^Tltrj*^^
-• ———— CONCRETE ———— •-—— 2" 10 S T A I N L E S S ——
STEEL PIPEPAlMAMT ———————
BENIONlie SEAL
\__ »„„,,,., „,„,,,,,
BENTON1 fk SEAL
0.020" SLOTTED ———
•ELL SCHEEN
FILTER iAND ——— A») • ) 0-HQo. 1
BEMIONIIE SEAL —*-
•—MISC. BACKFILL — »-
BKNTONI IE SEAL
•^ —— MISC. BACKFILL
•4 ——— PR (MART BCNTONITC
•^ ——— PILTCR SANO I«S Q-
• <LL SCRMN
I fc
X '/
]''//'//i>,'- 'v^TPvcS ••""ft tV* i %'
^S*?.««§jVtsa''flii
%•$££
LOCKING CAP ' 1 ~T "
.VMH/J &ROUNO SURFACE
CONCRETE - ———————————
2" ID SCHEDULE *0 ——— » •f -VC PIPE •- -^
oENTONi re SEAL — |r«
"*• M-
'*," \'
1 1
i 1v fi"9 i
VL
bEI4IUNITE SEAL x X
1 • 1 0-ROK 1
( S L O T T E D PvC PIPE)
SEAL
NOKI
NLESS STEEL.
———— SUMP
SAUPLING
now
s
1 1
9
12
1 6
1 4
10
20
41
14
1 9
20
21
44
23
K
4
4
1 J
IO
27
S4
19
49
92
31
44
104
140
mo Arrff
IA a
3A a*A a
SA aAA a;A a
4A a
tA a1 OA C
i IA ai2A aI>A aI»A aISA ai4A a1 7A C
I4A 3
I»A a20A a
2iA a22A G
23A a
24A Q
i a
2 a
> a
4 a
* a
4 a
7 a
• a
» a
o a
COooOJ
CD
SOIL SAMPLING INFORMATION KEY TO VELL SCHEMATIC
u4J*.
t
S
0
5
10
15
zo
25
30-
35-
40-
45 -
50-
55-
60-
65-
70-
75-
80-
85-
90-
95-
00-
:l— J
l_t
1 •
,!
.
.-
*
\
CO '.'"
a- L^ 1
• •*»
— tilM
= 1= 1
_!
~* SURFACE ELEVATION c.-il 1 4 1 4 . 5 5 ' c.-u« I H T . J I ' c.-il* i « i » . 5 j 'ut COORDINATES
g DESCRIPTIVE GEOLOGIC NOTES
)L
7T BROVN MOIST To AEDOISn BRDkN FINE SAND AND SILT
M
4 .
.V L ITTLE S ILT
1 •
*'U
,'t
:
•
f BROHN MET SILT
£' BORING TERMINATED AT A DEPTH OF 9 T . O ' ON JULY 20. 1914
!I STANDARD PENETRATION TEST
• UNDISTURBED SAMPLE
H DISTURBED SAMPLE
D NO SAMPLE RECOVERED
GROUT
BENTONITE SEAL
SAND F I L T E R
HELL SCREEN

w BORING: CW-15
WELL SCHEMATICS
CW-15 CW-I5A
f:.°s
i'*tv£
^T'4'.\i ykf
|v£^
Hi£*<Vi-Tifi
1fe
^E
J•'
~-
I-
^Lj/
"3>
:V *'.'
*J»U*i
'•//;ii?V*^*j
SP
11/
'//////
L O C K I N G CAP LOCKING CAP
r . ., GROUND SURFACE GROUND SURFACE f . ,.
—— — 2" 10 S T A I N L E S S 2" ID STAINLESS —————
SUPPLEMENTARY ————— b£NTONl TE SEAL
-* - Ml SC. b A C A F ILL
MlbC. BACKFILL ———— i^
-« —— SUPPLEMENTARYBeNTQNl IE SEAL
PRIMARY ————————— B£NTON1 TE SEAL
•ELL SCREEN
F I L T E R SAND ————— 1*1 O-ROK)
bENTQNME SEAL SUMp ——————————————————
-^ —— MISC. BACKFILL
;r*k1
i
• *
1
1
!!*'?t'
I•*••
'-
'_-
31
} 'afl
ii1
I
•*-——*»•». MARY flCHOMITE ACAL
•* — FILTER SANO i«j O-ROK i
———— 0.020" SLOTTED STAINLESS STEEL•ELL SCREEN
———— &UMP
•-* —— BENIQNI TE SEAL
*
SAMPLING
tto*
i;
70
«s
67
93
31
59
33
32
21
37
31
30
10
It
10
1221
13
1 1
la
20
22
1 2
1 A
21
51
13
ei
7*
4 7
itttttf»0 trrtf
i a
2 a
i a
* a
5 a
t a
7 a
• a
• a10 aii a12 a13 ai« ais ai> a
n a19 a
20 a21 a
22 a23 a2* a
25 aic a
2c a
BC a
c a
c a
c'a
c a
c a
c a
oca
<<h5
31.«i
0
5
IO
15
2O
25
30
35
40 -,
45 -
50 -
55 -
60 -
65 -
TO -
75 -
BO -
35 •
90 '
95 •
00-
jtfcL4i
" miM
4£ <•it»
4
»
C
^ .!
*
i:
u
H- t
5 fM
«
G00 ?
= J
^H
Ii
a.s rM
It
_U1
J COORDINATES
\ DESCRIPTIVE GEOLOGIC NOTES
TT 6RO»N TOPSOIL AT 0 - 0 . 5 '
U1
| GRADES 10 M O I S T
* GRADES TO >ET
4
M
W1
J
P'
III -•"•"•«- •" ••"• -" "- —)
GRAY SILT ANO CLAYU
L
1
(•/
4
A
j—— —GRAY MET COARSE TO FINE GRAVEL IN . " LAYERBHOMNISn-GRAY MET SILT. TRACE FINE SANO
[j CRAY MET SILT AND FfNC TO COARSE SAND. L ITTLE COARSE TO F | NC GRAVEL
1 •BORING TERMINATED AT A OCPTN OF »?.o* ON JUNE i», !*•*
COooCOeno
SOU. SAMPLING INfORMATlON
PI STANDARD PENETBATION TEST
• uNOiSTuaeEO SAMPLES DISTURBED SAMPLE
O MO SAMPLE RECOVERED
KEY TO HELL SCHEMATIC
GROUT
6CNTONITC SEALSAND FILTERMCLl SCREEN
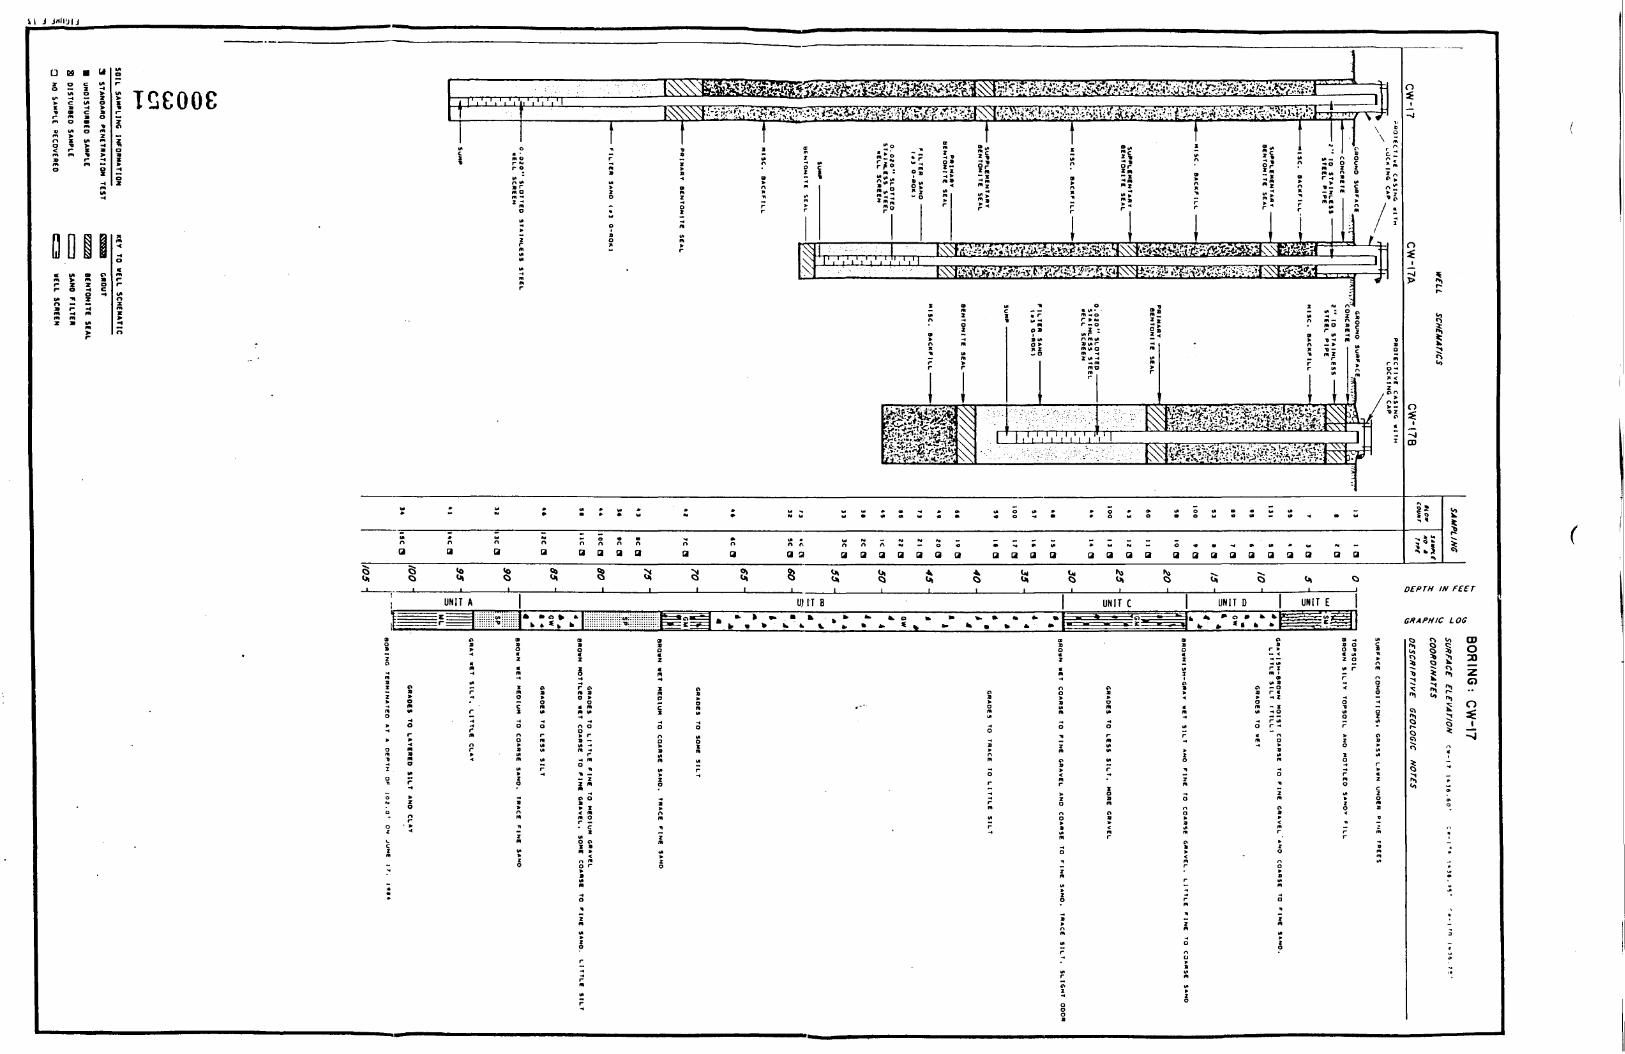
H J jtll'JIJ
G
[ J L I f l« <A «? z 3r ° 3K 2 iS d ^
l \ S^ M]fe J5^ \i f/t''«!J: i/:Ii— T-rr~r~T — i — i— i — TT'T — n —— ' ————————— ^ • r ft n
X) ' "") - '""'0 , I °
1 ?8 S . s|K; ? * ?
S£ 2 Sm •* •*> • _
r • °
^ :: ; T\? 1 i 1.1.1 i ,i !
1%w>.'•^•5
- - 2 : : : s : : : s ; s : :
3&®z®:g^^&&^^ {^^^^r^ —&?^&! ^^
s „ I •„ i «„ 1: i» S ; !% s "% : « ': != r ^ 52 • =!si «i • ^A > j« ? r: sO ^ n « z 0 w z n » _ - .
: s ; .: " s: 5 ?? "? ? :; ? >; ? --i i i j.IS^ -:5 iT^¥4ii t ?.V^^4 \ s^^l J^^ i y^^^V^ if; ^^
i : g .: ?. j i «~.I* X B • f" o _ IA ^r t - 4 ^ M M M * ^ m _
S « o J . m oP > i B r• . ^ • w> • - « a u» t * > ^ - i
f t n i o > r • n - >" X Z 0 * <Q -•* » - O -« unZ- m -* - rr > m r "ir r o r wt
1 J 1 • 1 inni ^ ;:-' \wm^m•5Sife^\N ! T 1 , ' , ' , ' , ' , ' , ' ' ' , ' 1
^ — 1-nY^1
C it
1 *S C
\i-^Z7 ———— fl
LO
CK
ING
C
»
\
GR
OU
ND •••"'••*
WU
17.T
ffi.'V/'M11
su ;.r
PJ_
B - 4 » O > !• O (* » » O » * O( O 1* • * W t»M M « * « o - « « » Q W O • O W « W — W - « •
n " " ° n ° n " n n S r S n n ! 5 - 2 « ; C » » • * * - o * m i f ' < f » ~ *a a B B a a a a a a a a a a a a a a a a a a a a a a a a a a a a a a a a
w
a
oi
ll'fii
SCH
EMATIC
S
17 C
W-I7A
C
W-
-gCD
i** Q* «- s s
•t
SA
MP
LING
IV)Ol
UNIT A UHT UNIT C UNIT D UNIT E» » « . • » . k » k. t.0 K . ,
f c » » W 4 . V » . » » . « v » f c _^0i s
DEPTH IN F£ET
GRAPHIC LOS
o <j <a o>3 § § o3 3 J 5• * • > * " * - »
s «1 -1:
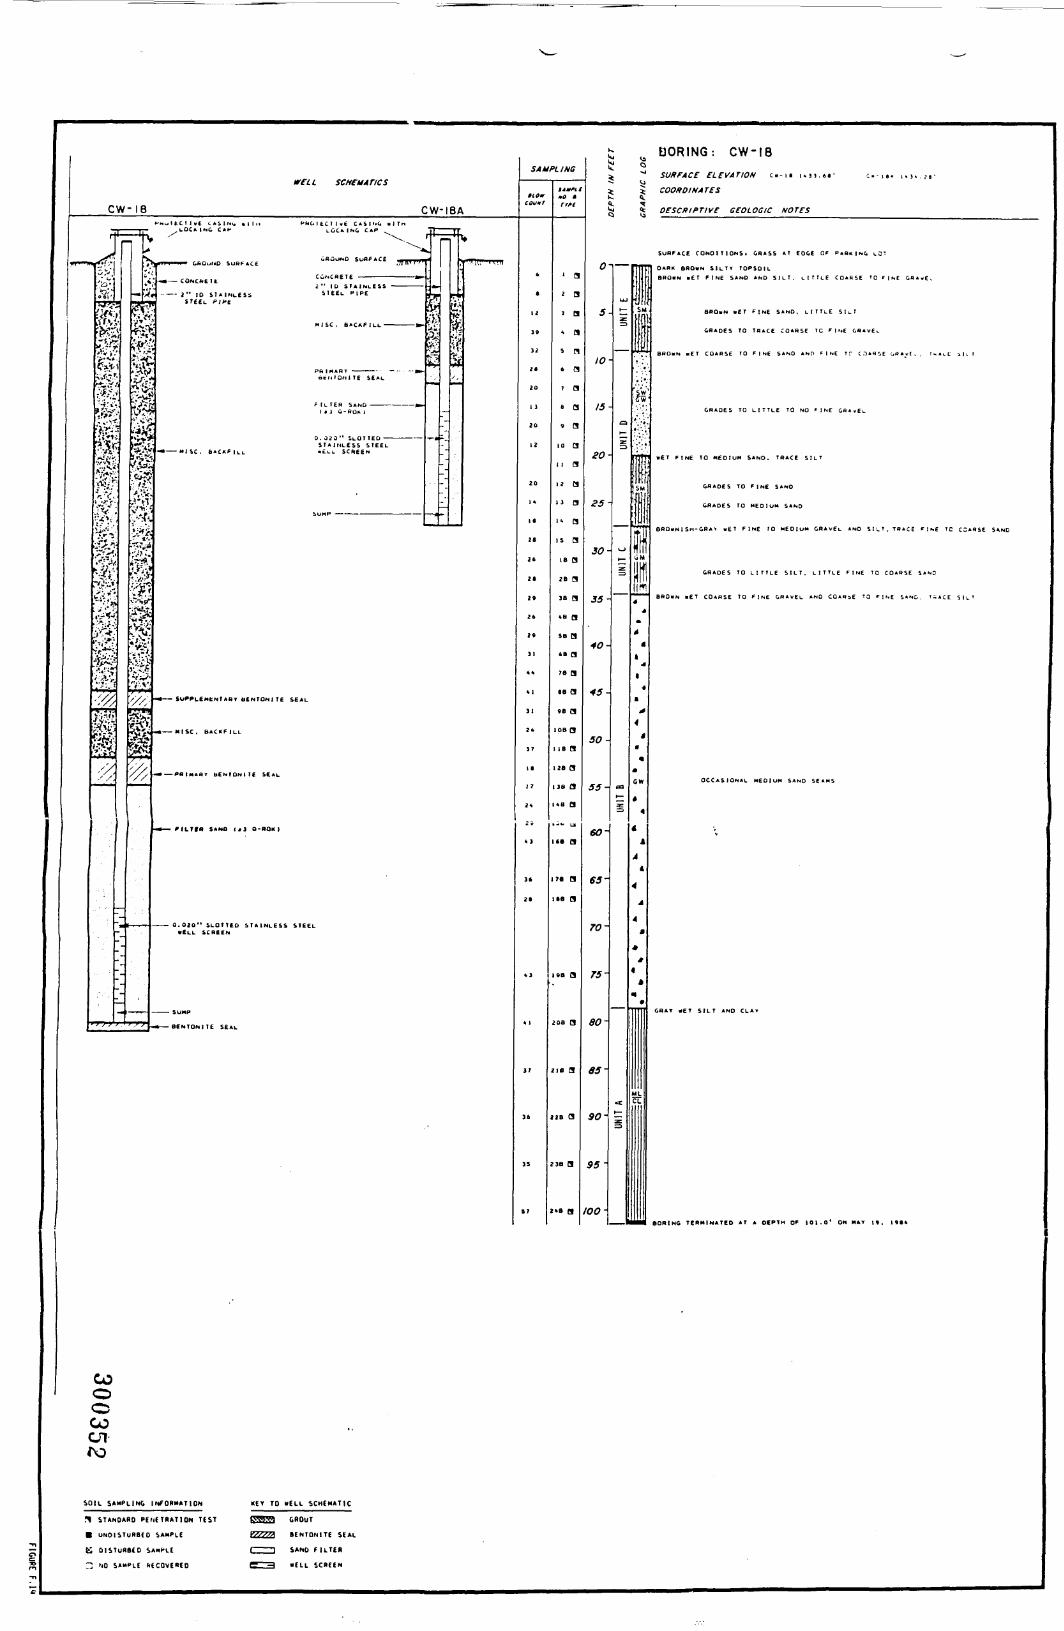
C W - 1 8 CW-IBA
in> '•
r
_^>
1
ft
1§•vV*. •
*r*"73J!
' -;
f S f f
=*\•*.
1|!
'; /ft
§
1"j:.\ .
• ^
^ M u l t C T I v E C A S I ' * ^ •III. P h O l t c l l v E CASINt , M l T n
ufiuUfvO SURFACE wpwv^tvW ^ f w»i««w^w
§? *'if
P A I M A R T —————— - - -- -^
r l L T E R SAND ——————————— i • i Q-aar, t —
S T A I t 4 L £ S S STEEL•* —— M I S C . B A C K F I L L AtLl. SCREEN
-; .
4 —— MISC. BACKFILL
•* —— FILTfR SANO («J O-ROKI
•« —— 8ENTONI1E S£AL
COooCO01
SOIL SAMPLING INFORMATION KEY TO "ELL SCHEMATIC
n STANDARD PENETRATION TEST PWW GROUT• UNDISTURBED SAMPLE IMSS/A BENTONITE SEAL
& DISTURBED SAMPLE 1 '1 SANO FILTER
13 NO SAMPLE RECOVERED g — 1 "ELL SCREEN
SAUPLINS
tie*
6
t
12
39
20
1 3
20
12
20
1 A
28
26
26
29
26
29
31
A A
A ]
31
2 A
37
1 6
17
2A
2w
A 3
36
26
A 3
A 1
17
36
39
97
Itmfi 1MO «rrff
' a
2 a
3 a
A a
5 n6 a
j a
» a9 a
10 a
n a
12 a13 a
!<• a
19 ais a
2B aSB aAB a9s a6B a
78 a68 a
98 a
IOB a
MB a128 a
IB aAB a
i6a a
i7B a
168 a
i9B a
20B B
2ie a
22B a
238 a
>AB a
i1
:t<L
0
5
10
15
20-
25-
30-
35-
40-
45-
50-
55-
60-
65-
70-
75-
85-
90-
95-
too-
u*gkt
C
3
L4J •]
"
'
•i
"l
f
J _ tj
i,4
i<
4
i
t: »
4
4
4
4
M« c
BORING: CW-18Q
U% COORDINATES
<t DESCRIPTIVE GEOLOGIC NOTES
SURFACE CONDIT IONS. G R A S S AT EOOE OF p. a* INC, LOT
B.O...E7 FINE SANO. L I T T L E S , L T
HIIitU1
r
t>
I
<
4
A
t
:
.

fl| p R R
€ i/. B 0« > *»• x= 5 1 g»A -" S "
O* • - * * * w Mi
a a a a a 3 3 3 3
WC
UA
UNIT A 1
5 <S <3
UNIT B UNIT C
<* o T ^IUNIT E
:• .. » « * - * iirl^iiiiiiii;::: tc=j GRAPHIC LOS
RD
IN
BOR
GC
W-19
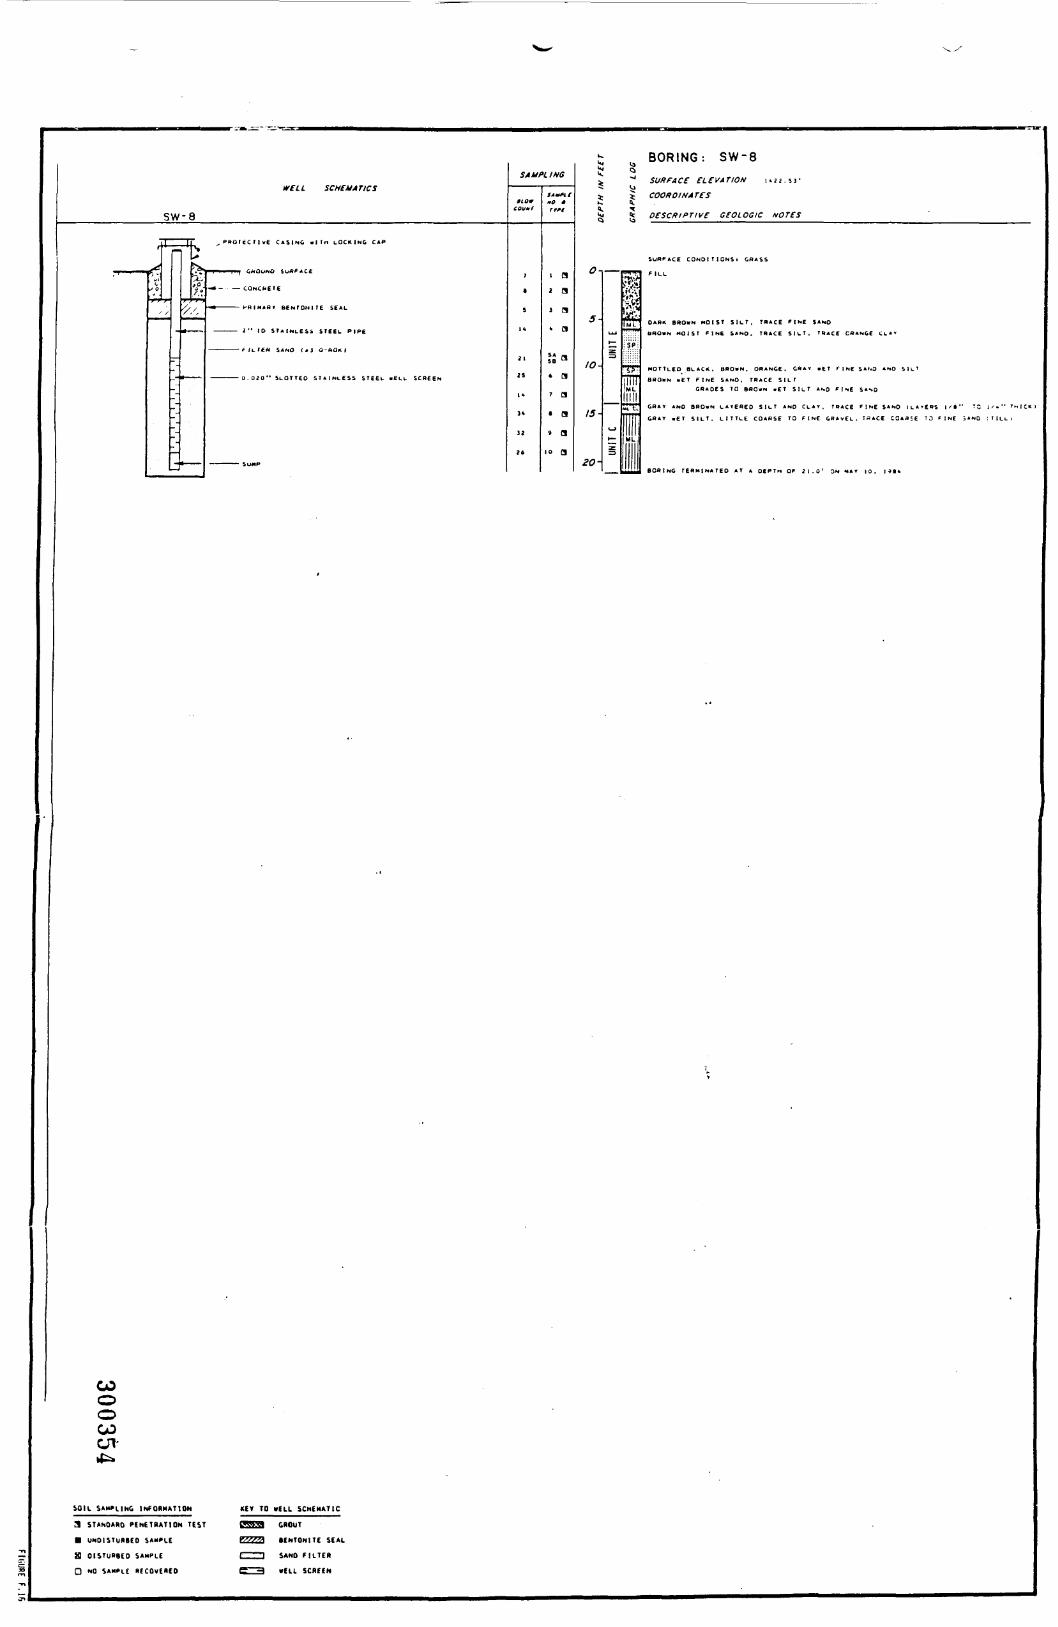
WELL SCHEMATICS
SW-8
r
> 0
c
'
="
-
'_-
3
^
s
1",
*^-«.^
III im OHOuftO SUAF ACE
-* - — CQNCfEIC
SAMPLING
110*COVttt
7
1
1 4
21
26
*0 «
i a2 ai a• a
t a
^ a
• a
» a10 a
\
2£
5-
10-
15-
20-
LLJ
1 —
—
30
1 3
IHM
3
\W
^^
SP
-?rflFML
Illl
iML
MM
SURFACE ELEVATION i * ; i . 5 j *
DESCRIPTIVE GEOLOGIC NOTES
f ILL
COooO3cn-
SOU. S«H>L|NG INfOlltHTlOH
9 ST*NO»BO PtNtTBATION TEST
• UNDISTURBED SA-H.E
S OISTUD8ED SAMPLE
Q NO SAMPLE BECOvEKED
«ET TO KILL SCHEMATIC
GROUT
1EHTOHITC SEALSAND F I L T E R
VEIL SCREEN
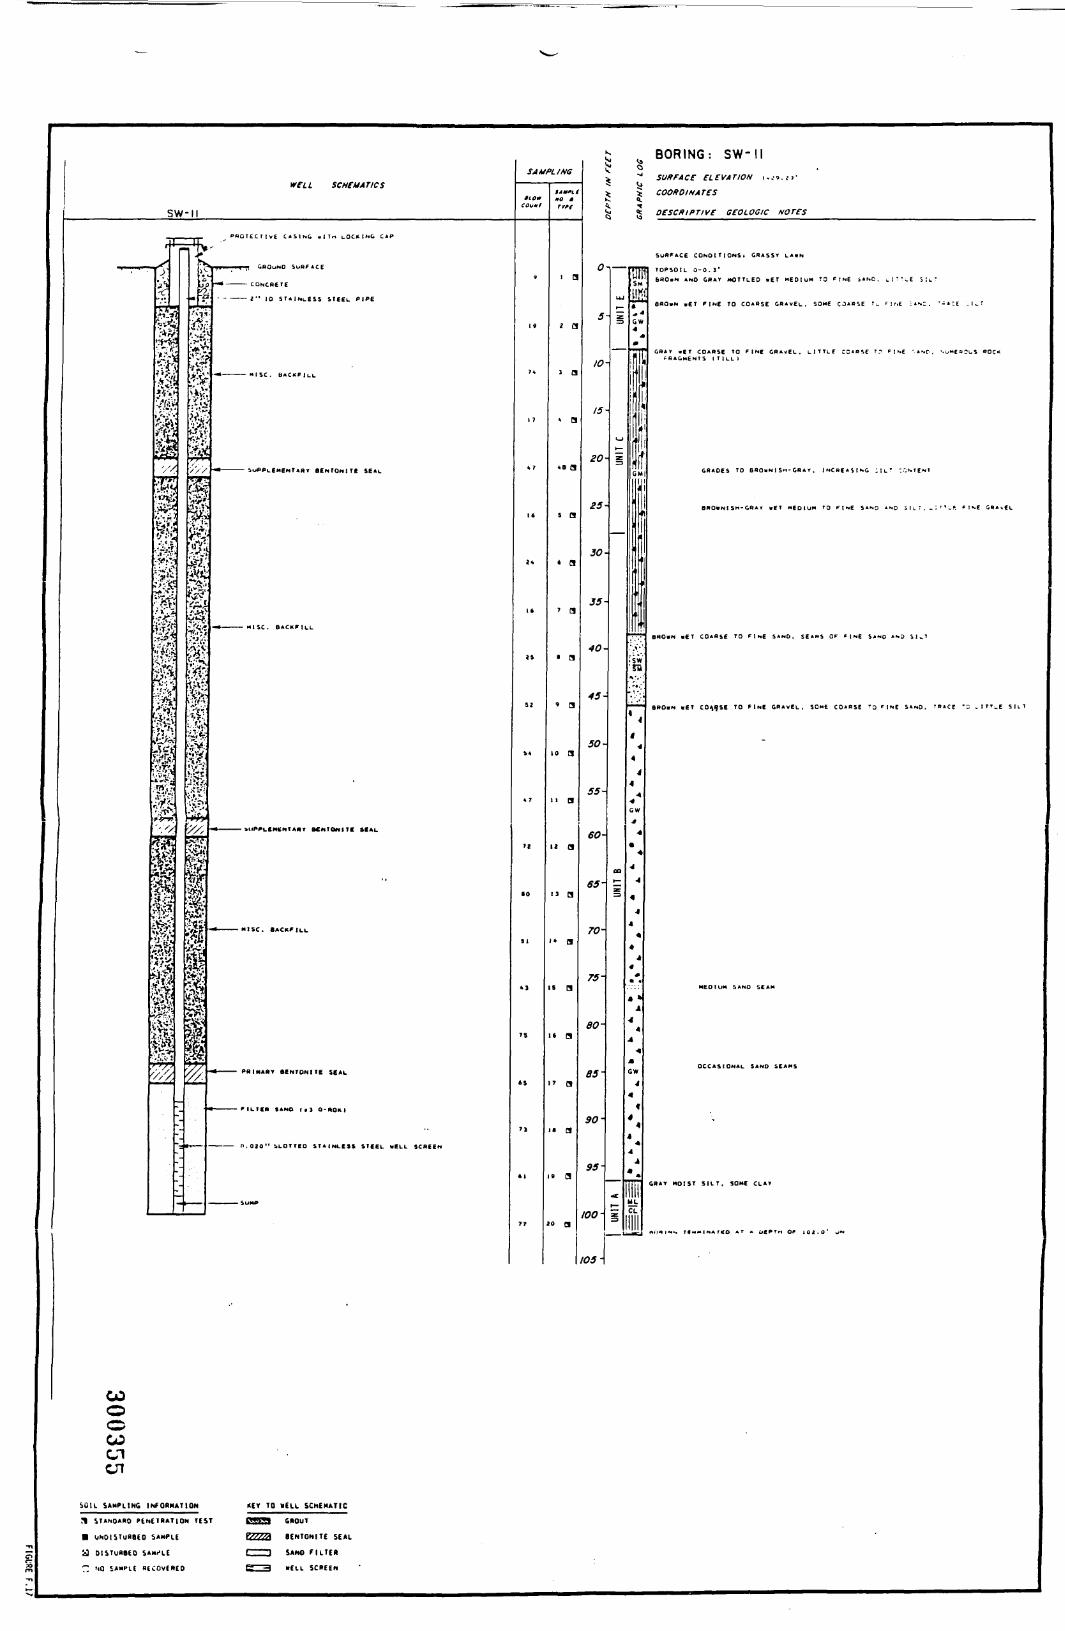
BORING: SW-
WELL SCHEMATICS
sw-n
1 1 M III 1 •
;c
1
|1
vi i
•i**?1a1
HI11
S51iS**1
^A
^^
i-il1
^s>
I
J
vs^1
f.C^
^
;?'Xr
%•'&?
1INT .
.. *-;"
c ji?r*
-5«''f;
!> *-*
•/S/
jWe-
i
11
ill., i 1 ,| CROuno SURFACE
•* ———— CONCRETE
- - ——— I" 10 S T A I N L E S S SIEEL PIPE
• •
^ ———— PRIMARY BENTONITE SEAL
SAHPLIHG
tto*COUMf
\ 9
74
17
A 7
16
i*
It
is
Si
4 7
• 0
SI
TJ
ts
71
T7
«O Jrrn
i a
2 a
i a
» a
AB a
s a
' a
' a
• a
» a
to a
11 a
12 a
13 B
• B
s B
' a
» a
• a
< a
o a
i
:tcLc
0
5
10
15
20
25
30
35
40
45-
50-
55-
60-
65'
70-
75-
80-
85-
90-
95-
100-
105 \
k4k.
t
eLui
— rs
,_ 1
= 04
t
\
I(
'•'.
1
4
4
4
*
4
GV
I
4
71E j
_ —— Lu
O^ SURFACE ELEVATION \,^.it'
* COORDINATES0.
g D ESC ft IPTIVE GEOL OGiC NO TES
T TOPSOlL 0-0. 3*
M
W
»
| F R A G M E N T S 1 T ILL )
4
•
1
1
'•'.
w•Q
4
4
•4
4
4
4
f
4
•4
f
4
4
4
CRAY MOIST S ILT , SOME CLA>
I
COooCOenen
SOIL SAMPLING INFORMATION
H STANDARD PENETRATION TEST
• UNDISTURBED SAMPLE
a DISTuRIED SAMPLET. ><0 SAMPLE RECOVERED
KEY TO DELL SCHEMATIC
GROUT
VSSSM ItNTONITE SEAL
t ' 'I SAND F ILTERHELL SCREEN

BORING: SW-14
UTELL aofottrrcs
SW-14t
I PR^T£-.. r t wt r A«ir.r. . T ic ...n!teirM^ cjiP
i
• •••••i "^
T~
^—
=4
-^_-
~--_
-—
—
V/••••r n*- oACuNt> SURFACE«•• ———— CQh.C»tT£
SAMPLING
cott*r
9
19
b i
1 16
62
3 3
^
25
rrn
i a2 a3 a
• a5 a6 a
' as a
9 a
t 0% -1 SURFACE ELEVATION 1 * 2 0 . 5 3 -
% % COORDINATES
ft. ^^J «e DESCRIPTIVE GEOLOGIC NOTES
0-|
s-
10-
15-
20-
——
UJ
3
a
z
1 |
lift:
mlHESW•••
4
cw
^H
TOPSOIL o-:.!'
6AA3E: TC iR»*. L | T T _ E SUT
ooCOci05
t.I'.j tNFOB«»T]ON
SAND ' ;.1S*

BP-
. ———
WELL SCHEMATICS
\
^
— 'l
1
•t"
' '•'/,
'•'• '/>
•X'
'/-.-//,_
^-"' I t ^ I I / t ; * : 1 '.O «l ln _1 ,H |NU CAP
»
| C.f'OS.L suR fACE
^ - - - ————— C u N C f c E T E
•• — -£i£t. l - . t . ;Tt S E A L
—— ———— -<= IE . - ;MeT£. Iuo£
SAMPLING
tLOWCOuHt
1 1
9
57
2 7
;B
2c
-.6
£6
30
30
^ 7
3<.
3«.
26
3<i
16
<.o
7 |
t S
ss
a i
6 1
103
S2
65
76
7*
6*
59
se
69
55
n57
6O
37
56
4 4
SIMHfHO Mrrrt
i a2 a3 a>. a5 a* a
' a
= a, 3
ic a1 1 a
i - a
i! a
i' a
is a
ic ai? a
i= a
i, a
20 a;i a
i2 3
23 a
2- a25 a26 a30 a31 a27 a32 a" r»)•. a35 a36 a
a ala a
39 a
40 a«i a
«2 ao a
•.« aASA a*se a*«A a•66 a<.? H*•* a«ae a
49 a
jo a
51 a
52 a
COooCO<J1^3
S;u SAKPUI.& INFCBHiTION HE' TO «ELL S C H E M A T I C
Vuk3
3kQUC
o-
5-
10-
15-
20-
25-
30-
35-
4O-
45-
50-
55-
6O-
65-
70-
75-
80-
85-
90-
9S-
100-
105-
110-
ij
.LJ^
————— ^
*—— '?
i 5-;
G
'f*=> ;:^ IT^ a= 'S
frli•J-nh
i{
4
,
•t
4
4
i s
V
«
•cza
= 4
•
4G
4
•
4
«
4
4«
f
•«
•4
i.C
<r
^TSM
IC
J
Dv/n uiv : or i!^ SURFACE ELEVATION i. i j. j '-bJ COORDINATESL.
\ DESCRIPTIVE aCOLOS/C NOTES
£1.wy SANOI *|LL ANO sao.Es ri.e
*"•,-.' 8PO«N «ET PINE SAND AND S IL ' . ^ I T T ^ E 3L * C • --->„-,:.- -*;-,;. -"I..
f"«' C R A l 1 5r-3RO«N «E" COARSE TC * [ ME i S A v E ^ . E J -E . : -- :£ '1 " I '.= i-.,. _ : " " . f : '
M
^
liM.
n™T G«*OES 'C 9»Q»'. »E" C O * K a c "C - IS* r f." i'.." - : -.L " *- !• 1 » - - - L _ .
»• T R A C E S I L T . 30OB
^ U-i*' «t " S ! i _ T . ;;**fc - ; N= ' •„ ; _ * ( • - = j- * . r _
i
"*" 6RU.N «ET C C A 3 5 £ *I C I N E C R A . E ^ . C ^ A P j c • = I ^ . E '-i'... • - * : - : .. •
4
•
*
M
^ .-.SA^E; ir '.u s i ^ r
4
»
p
^
1
4
4
•«
w
4
«
i
1
A
4
4
4
A
LL
M!-Ak
/
I
(.--V: :-T' 1 OAOuT
K-: ;.'-1 S fhTQt , ; ' - S E A L
I : SAND ' KTEfi

WELL SCHEMATICS
BP-2
———— '^--a _.„
•7-*
• - -.AH&
' ' ' -* utNlOni T£ SEAL
——— .,»»«U. ,uu£
-
i
^. * '
X '
SAMPLING
HO*
i 3
1 4
1 2
3d
1 d
4 2
2T
26
3 1
21
36
32
1 S
22
2 1
36
26
26
»2
34
32
46
40
37
5 7
46
72
53
56
79
54
4O
31
4 4
44
36
32
39
37
44
31
4 1
4 1
40
31
36
25
Httft.110 trrff
i a
2 a
3 (1
4 ai a
« a
' a
a a
9 a
10 a
11 a
12 a
13 a
14 a
15 a
16 a
17 a
ii ai»a a
19 a
20 a
21 a
22 a
23 a
24 a
25 a26 a
f ' C»
2« a2> a
10 a
31 a
32 a
3 a4 a
5 3
4 a
7 a6 a
9 a
o a
i a
2 a
3 3
* a5 a
4 a
47 a
4i a
49 a
o a
5%
0
5
10
15
20-
25-
30-
35-
40-
45-
50-
55-
6O-
65-
70-
75-
30-
85-
90-
95-
100-
IO5-
110-
ti3
^
— i
•(
Q
=
^I f
Tt
ra I
II!;
IP
*f^_ r
__ l
"- SURFACE ELEVATION i . ;i . , s •
^ COORDINATESQ.
£ DE SCRIPT! VE GEOL OG/C NOTES
1 TOPSOIL 0 - 0 . 3 '
-j BRDkN AND GRAY MOTTLED. «0 1 C J . Li'E~E: c :~ .€ -,»r.:_ «; ; . - . ' -»..£ '-1 •j f QUNOfir SANC
S
J
k
k
Cf lAOES TO BSC-N
W
SHADES TO Bao.NISH-6».r .IT- T,.CE .:.-
' BROiNi SH-CHAV ,ET co*asE TD FINE GBA*EL *NO s i . . * . ^ : * * . t - : •-= ' . r » - : F :*•«:
i'\
- . ; L IT TL£ SIL i IN L A T E S Sw
L 1 T T ( _ E TO T h * C £ SIL I
M
W
LL
l|
»'
:i: GRADES TO FINE TO MEDIUM SAND
GRADES TO MOSTLY C L A Y . LESS VISIBLE L A - C B S
CfiAY CLAY
i.
|->f RCDDISn-aROHN F|NC TO MEDIUM $ANQ. L ITTLE SIL*
1 BORING TCRNlNATCO AT A DC^Tn OF 110. 0* ON j\jt*€ «I. I'**
COOO03enoo
iN fORHATION «E I1 TO H(tL S C H E M A T I C
^ E N f T f i A T I O N T E S T
8f«Tn»|T£ =E
I———1 i»NO f |LTE»
H--3 «f!.L SC»ti'.
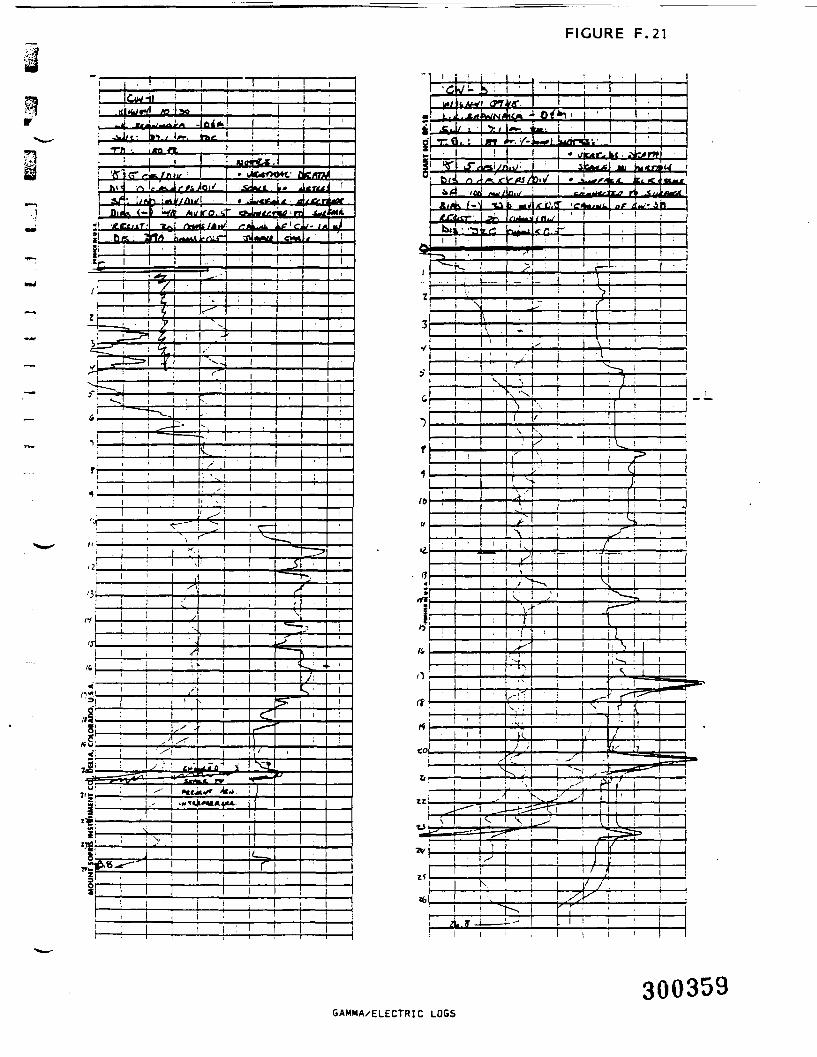
FIGURE F.21
Cw-ll
-3MJ«yl /Q'lso !•.±.,^^,* .1Q fill I | i I
• --l/ f- l»1./ W. »fcg | i
; TT\ •. i^n ft.
'fft(r^<oi.rni3 fr• hli /N L <»<. j /-fe yloi^
QI 7-«! iCCttiT
^
&^* Ijft ^ !•! 'V/il^l • .d>«4IF.A ^ ' myf^n
MinrC^.Idc«x»4f dc<iny
^Ut ,» j,
. st"^.1 ftfM/MMf' /-Hi^ii if
I! be;. 1 IA K«» «.i v^urn ai iMmi I eina43C^-i/j|
V!
i£ : i
' - S '
/ i
r" ; t-t
tt
*•g
<4A.^^/U/ }i
A, , if-^J r£
,h . 1 i -r-| :- ! !
300359GAMMA/ELECTRIC LOGS
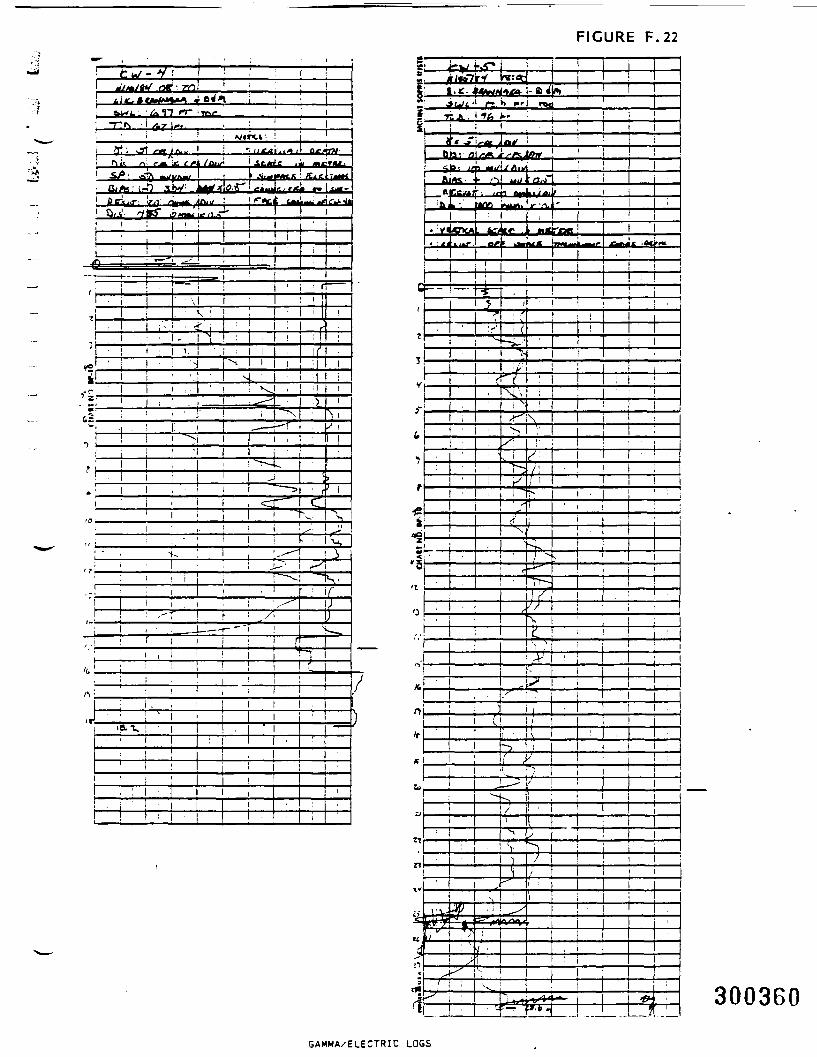
FIGURE F.22
fcu / - V !»'//»/«/
I___,
1 Qi-SJ- ^KS" j»««» !«•>!<*' I_____I !_____I
'=-
I I
K :
±±
I ' I I
I !
I TV. V
I . I -h»-
1
1
g-21" y*
i.*.JLi/f1 n. *> f\ maTtJL. I Ik -t-
i»ZB»S: a ft*, jt ! i !
•' •»>»•. jm mtJMfitJi \kltK. • ^ f^j ^.1 ^ O..J~|
h,.' >« | rmiiif'/^i1 • i
r ugftjll
cp-i~
=u.
-41
-%
;
ft
zl
>f
-*-
t
f>AS. '<Kfnt
!
i r
300360
GAMMA/ELECTRIC LOGS
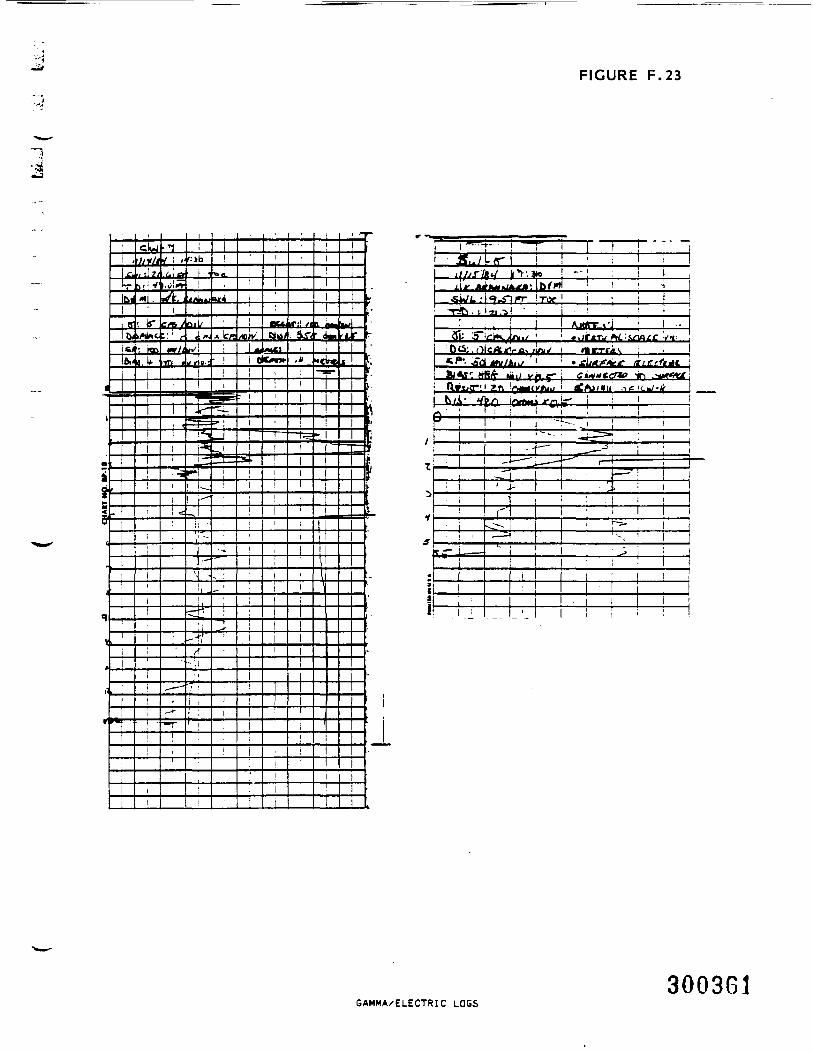
FIGURE F.23
i HS/r »iii;»un i dC i*O/.IT/I s-u
1 I
GAMMA/ELECTRIC LOGS3003B1

•--'4
1
I ui xr/^V i r
Mbfi: o L-/» J g*» /D* [
rtXfi.ilSauted
I. U-rl ..rj !^auM£.
sr
£i_
i i
1
i. i
I i
^
-^ l_L
i i r ZJ.
I ' i
C !
i i i
FIGURE F.24
/t'dtf"!
! \ It. «-r Ft.: i tzw>.
\ ', L ««•fWi*i
S; Aifl<-<-\ *f-p muLraST ---f^iirrf^ " t^F^fi
3003G2GAMMA/ELECTRIC LOGS

I&J tV -.- '::-::i:
—
-
-
...
V
-
V
«ji
7
i
-
-
^i
-
-
._
-
-
-
4'm
\
-
VIII
-
-
I
IVIA 'A •*
y
-
-
.
\
I/
-
/
^
-
--
*£- -
-
/
^
1 f j 7 S ' * ; ; r » ? J ; « . J ; ^ ; c CHAII 110 w> 10 «•
\
:t
-
\-
-
-
-
-
•-
\
^
t
^
r~
~\
V
-
;'-
A'
—
-
v.
—
--
-
-"t
-
\
•x
v
/
r^.
^_
-
,.
T'
--
-
-
^
-
-
V
1v
^
/--
—
^
A
-
-
-
.''
1
-
\
-
-
p.
-
-
.-
-
-
-
-
--
;-
-
-
--
—
-
-.
-
^-
_N_-
-
L
-
-
\
--
f."
yv
-...
r
•-
-
-
T
-,
j
-
•;
-
——
-
-
V
-
-
^
1
;.-
:4
-
-
V
-
.1
-
-
_
-
-
...
-
_.
-
....
I
t
1p
5Ti
I
||f.
1
1
>
i;
f
Tf
S
ir
i -
k
i
?
I
|
* '
SAMM
A/ELECTR
OGS
COoo03cnCO
fc fi
:ic VAVIV 'JjA it ll 1U(;c
KKIWIfJfl CO.. MtM MO* ADO,
0
ihff UI

SL
1:
s't—i-
f^Hftrt T
Attar
1I I
1
31-
>ii-
Srr to_2"HI'
nc«!•
-
-ft:
^-r
3003G4GAMMA/ELECTRIC LOGS
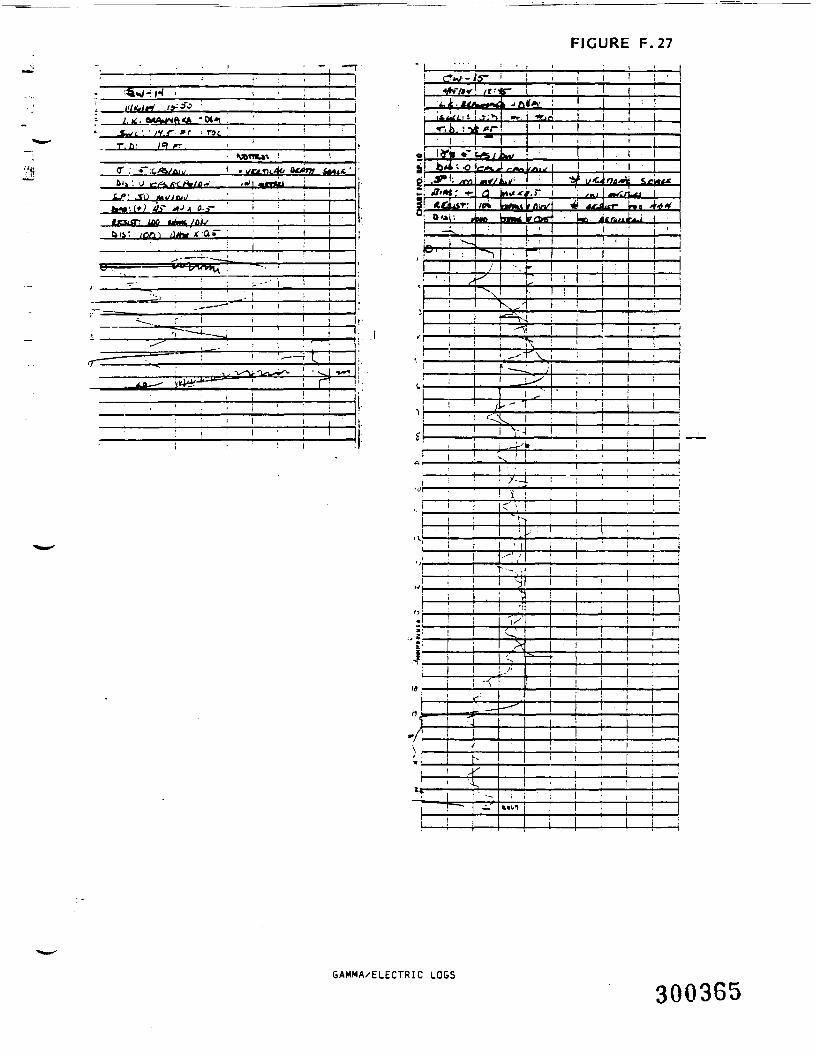
FIGURE F.27
i H
cr :tlj '. ij f
bis' /<y>i <l<^« ^:Q~
i i
\ \
! I
J•A
T^
GAMMA/ELECTRIC LOGS
300365
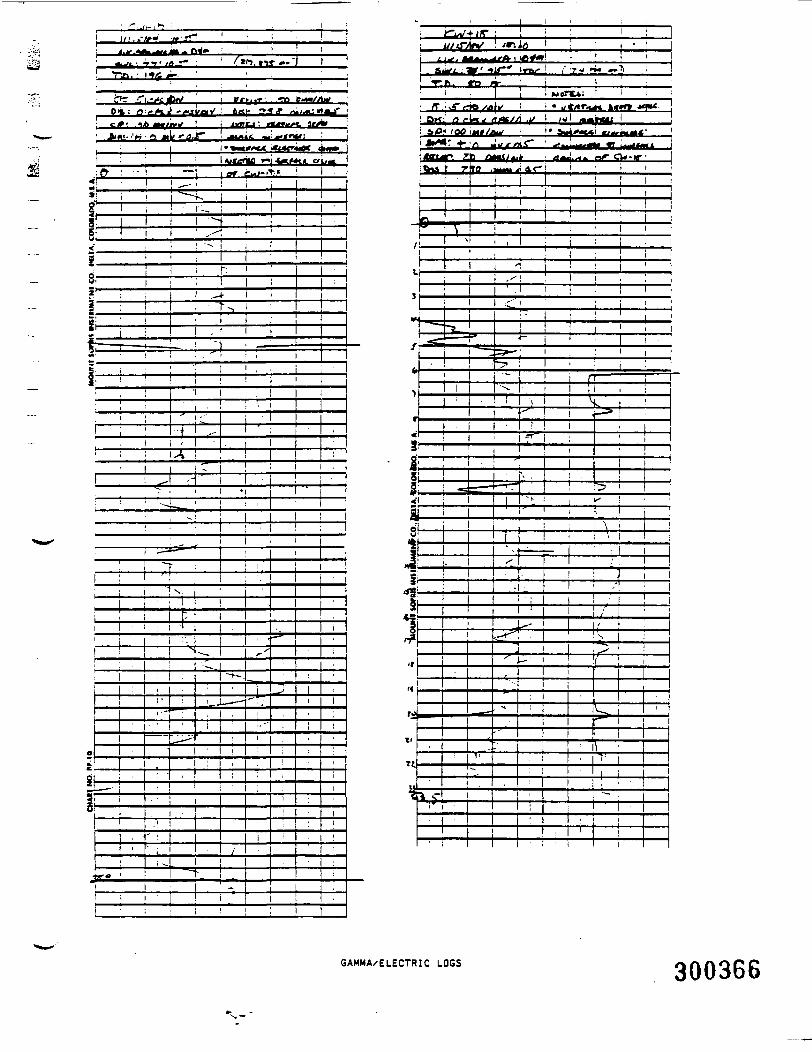
' f*'n. f«->TT
•Ti^j^i A«/0lk: n'.^ftL^ ^<iisl/d*v
cj>* .*>> m*lr** \ •nwr«• ttfftfft- arjbt
«r
5_gr
fi-
fe_ii-ii-
| I
TT
O-
i i . i
r :
•hro I i
i
I ' I
I I I
! I
u/tnn/ \
± wore*-
rU« ^ /roe //I .w >w ,*^W<i
GAMMA/ELECTRIC LOGS 300366
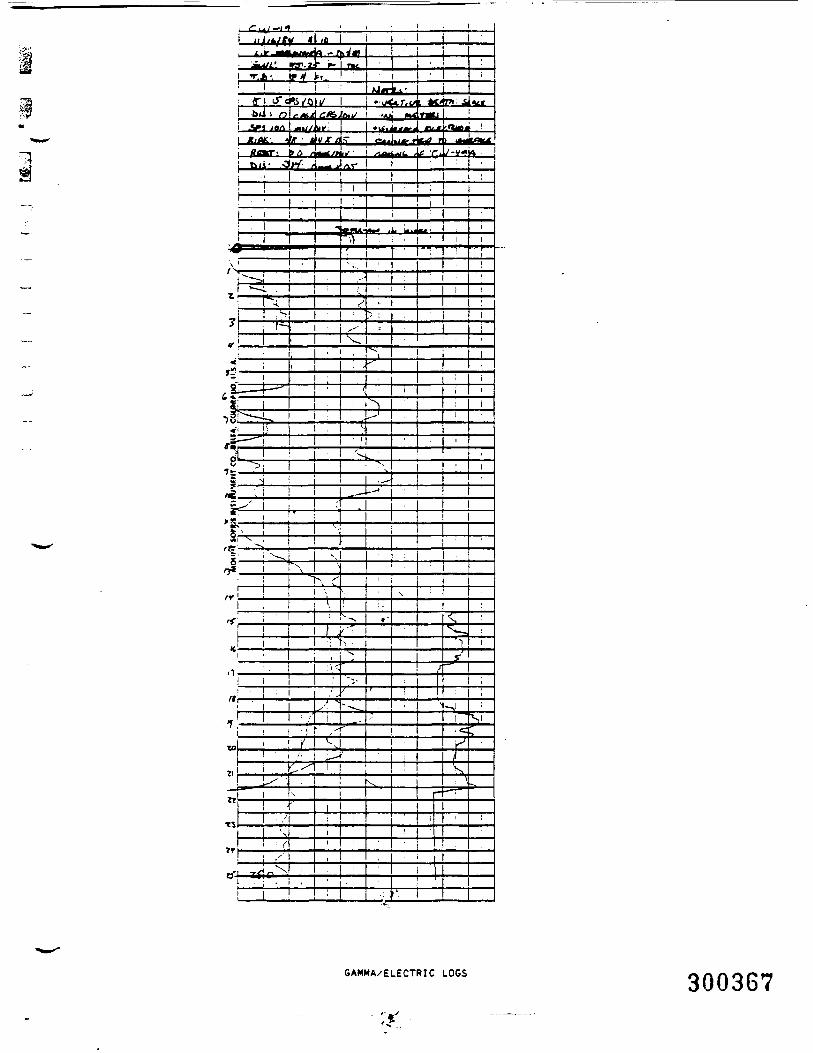
GAMMA/ELECTRIC LOGS 300367