Embed Size (px)
Citation preview
UCRL--53232
DE82 007989
UCRL-53232 Distribution Category UC-11
Health and Environmental Effects Document on Geothermal Energy-
1981
David W. Layton Lynn R. Anspaugh Kerry D. O'Banion
Health and Environmental Risk Analysis Program
roiolaiereri or ~ v f u l n e s 0' dnv information a ~ ~ d r d t ~ ~ ~ r O d u c I . or procers diYlose3 or r?"re!ents that 8.1 uv mu,: 7w m'r#nge yc~vdlely o w e d q h t i Reference herein (0 any roec#f#c corr)-ercldl UrCBUC! "'o€*II > I *,YlCi b" ,rase name, : 'aOeMrk manularturer. or OtherWiS, doel not ~CCLIWCIII COnlt l !d le Or 1 I I C l y 8.1 endorvmenr re iann~oda l i . ln . or favoring by the United SW*er Guueri-eor or d m d % ~ v :%reo' The v # e w and noinianr of duthori e x ~ r ~ s e c herein do not n e c e u m i i ria:e or rellec! !my I' (^e U w e d Starer Gouernwni or m y eency thered
Prepared for: Health and Environmental Risk Analysis Program
Human Health and Assessment Division Office of Health and Environmental Research
Office of Energy Research US. Department of Energy
LAWRENCE LIVERMORE LABORATORY University of California Livermore, California 94550
Available from: National Technical Information Service U.S. Department of Commerce 5285 Port Royal Road 0 Springfield, VA 22161 0 $7.00 per copy (Microfiche$3.50)

DISCLAIMER
This report was prepared as an account of work sponsored by an agency of the United States Government. Neither the United States Government nor any agency Thereof, nor any of their employees, makes any warranty, express or implied, or assumes any legal liability or responsibility for the accuracy, completeness, or usefulness of any information, apparatus, product, or process disclosed, or represents that its use would not infringe privately owned rights. Reference herein to any specific commercial product, process, or service by trade name, trademark, manufacturer, or otherwise does not necessarily constitute or imply its endorsement, recommendation, or favoring by the United States Government or any agency thereof. The views and opinions of authors expressed herein do not necessarily state or reflect those of the United States Government or any agency thereof.

DISCLAIMER Portions of this document may be illegible in electronic image products. Images are produced from the best available original document.
CONTENTS
ExecutiveSummary . . . . . . . . . . . . . . . . . . . . . . . . . . . v Abstract . . . . . . . . . . . . . . . . . . . . . . . . . . . . . . . . 1 Introduction . . . . . . . . . . . . . . . . . . . . . . . . . . . . . . . 2
Methodology . . . . . . . . . . . . . . . . . . . . . . . . . . . . . 4
Geothermal Power Technologies . . . . . . . . . . . . . . . . . . . . 6
Hydrogen Sulfide . . . . . . . . . . . . . . . . . . . . . . . . . . 1 1
Mercury . . . . . . . . . . . . . . . . . . . . . . . . . . . . . 15
Overview of Potential Health and Environmental Effects . . . . . . . . . . 3
The Reference Geothermal Power Industry . . . . . . . . . . . . . . . . . 6
Chemistry of Noncondensing Gases . . . . . . . . . . . . . . . . . . . 11
Benzene . . . . . . . . . . . . . . . . . . . . . . . . . . . . . 13
Radon . . . . . . . . . . . . . . . . . . . . . . . . . . . . . . 17 Human Health Effects . . . . . . . . . . . . . . . . . . . . . . . . . . 20
Public Health . . . . . . . . . . . . . . . . . . . . . . . . . . . . . 20
Risk Assessment Model and Uncertainty Analysis . . . 21 Effec ts of Hydrogen Sulfide . . . . . . . . . . . . . . . . . . . . . 23 Effects of Sulfur Oxides . . . . . . . . . . . . . . . . . . . . . . 25 E f f e c t s o f k n z e n e . . . . . . . . . . . . . . . . . . . . . . . . . 29
E f f e c t s o f Mercury . . . . . . . . . . . . . . . . . . . . . . . . . 32
Effec ts of Radon . . . . . . . . . . . . . . . . . . . . . . . . . . 36
Arsenicalism . . . . . . . . . . . . . . . . . . . . . . . . . . . 38
Occupational Health . . . . . . . . . . . . . . . . . . . . . . . . . . 40 Ecosystem Effects . . . . . . . . . . . . . . . . . . . . . . . . . . . . 43
Emissions of Hydrogen Sulfide and Carbon Dioxide . . . . . . . . . . . . . 44 Accidental Spills . . . . . . . . . . . . . . . . . . . . . . . . . . . 45
Acknowledgments . . . . . . . . . . . . . . . . . . . . . . . . . . . . 50
Conclusions . . . . . . . . . . . . . . . . . . . . . . . . . . . . . . . 48
References . . . . . . . . . . . . . . . . . . . . . . . . . . . . . . 51
i v

EXECUTIVE SUMMARY
The 1981 Health and Environmental Ef fec ts Document (HEED) on geothermal energy focuses on t h e effects of a reference industry t h a t produces 21,000 MWe for 30 y (Le.,
20 x 10'' J o r 20 Quads of electr ical energy). That level of development is equivalent to t h e est imated resource potential of identified, hot-water resources in t h e U.S. Hot-water
resources c a n b e processed by e i ther flashed-steam or binary-fluid geothermal power
plants to produce electricity. In th i s HEED, however, we are primarily concerned with
operation of t h e f lashed-steam facil i t ies because they pose g r e a t e r health and
environmental risks due to atmospheric emissions of noncondensing gases.
The most important noncondensing gases f rom a heal th effects standpoint a r e
hydrogen sulfide and par t iculate su l fa te f rom t h e atmospheric oxidation of hydrogen sulfide, benzene, mercury, and radon. W e assessed t h e public heal th risks of e a c h of
these gases as well as par t iculate su l fa te for a single, reference power plant of 100 M W e' for a scenario of 3,000 MWe of development in California's Imperial Valley; and finally, f o r 21,000 M W of electr ic i ty production over 30 y at 51 different geothermal resource
a r e a s in t h e western U.S. W e also studied t h e health risk of drinking w a t e r contaminated
with arsenic derived f rom geothermal fluids. The occupational heal th risks were est imated for 21,000 MWe of development to conclude t h e analysis of human health
effects. In our ecological analysis, w e examine t h e potential effects of hydrogen sulfide
and carbon dioxide emissions on crops and fores t plants and t h e occurrence of accidental spills of geothermal fluids t h a t would damage soils and vegetation adjacent to power
plants comprising t h e reference industry.
e
PUBLIC HEALTH EFFECTS
W e summarize here t h e analyses performed to de termine t h e heal th effects
associated with exposure to hydrogen sulfide, sulfur oxides, benzene, mercury, and radon in a i r and arsenic in water.
Atmospheric releases of hydrogen sulfide cons t i tu te t h e most significant public
health issue of geothermal energy production. I t is a toxic gas, causing dea th
at concentrat ions above 1000 p a r t s per million by volume (ppmv) and e y e damage at concentrat ions as low as 50 ppmv. However, t h e primary concern is
its annoying odor, which can b e de tec ted by 20% of t h e population at a concentrat ion of just 0.002 ppmv. According to our analysis, at leas t 29 of t h e
51 geothermal resource areas a r e likely to have one or more power plants t h a t e m i t enough hydrogen sulfide to cause odor-related problems.
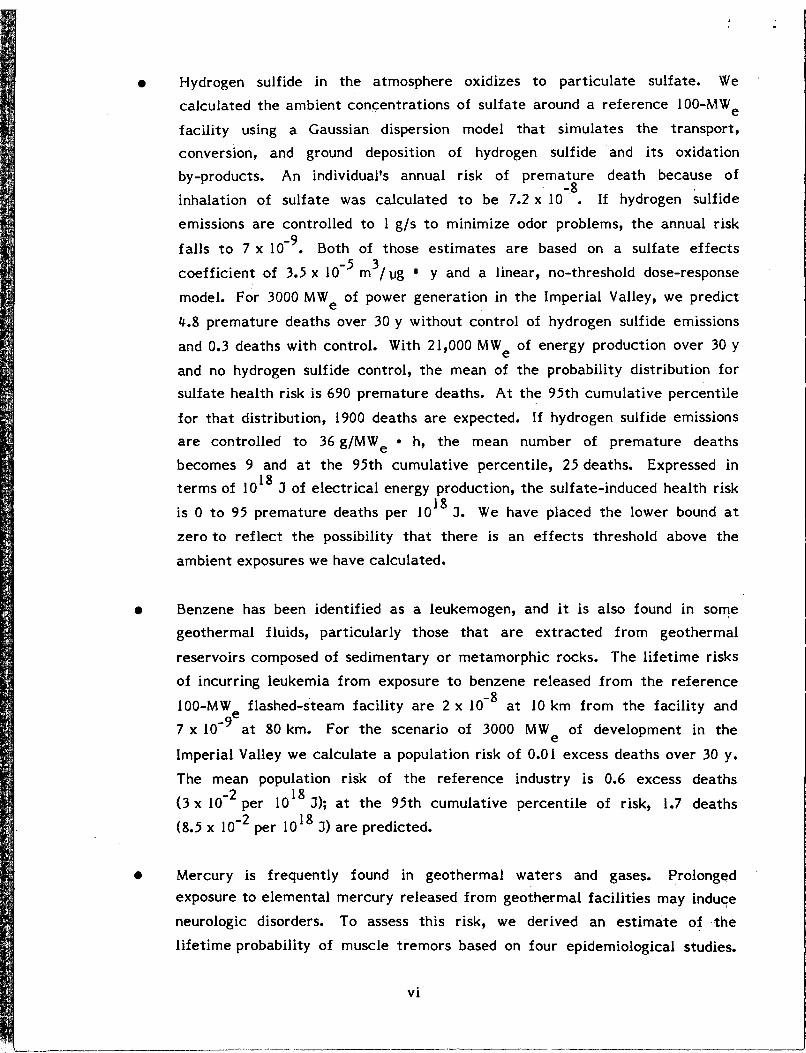
0 Hydrogen sulfide in t h e atmosphere oxidizes to particulate sulfate. W e calculated t h e ambient concentrations of sulfate around a reference I OO-MWe
facil i ty using a Gaussian dispersion model tha t simulates t h e transport , conversion, and ground deposition of hydrogen sulfide and its oxidation by-products. An individual's annual risk of premature death because of inhalation of sulfate was calculated to b e 7.2 x 10 . If hydrogen sulfide
emissions a r e controlled to I g/s to minimize odor problems, t h e annual risk
falls to 7 x IO- . Both of those es t imates a r e based on a sulfate effects
coeff ic ient of 3.5 x 10 m / ug y and a linear, no-threshold dose-response model. For 3000 MWe of power generation in t h e Imperial Valley, w e predict
4.8 premature dea ths over 30 y without control of hydrogen sulfide emissions
and 0.3 dea ths with control. With 21,000 MWe of energy production over 30 y
and no hydrogen sulfide control, t h e mean of t h e probability distribution for sulfate health risk is 690 premature deaths. A t t h e 95th cumulative percent i le
for t h a t distribution, 1900 deaths a r e expected. If hydrogen sulfide emissions a r e controlled to 36 g/MWe h, t h e mean number of premature dea ths
becomes 9 and at t h e 95th cumulative percentile, 25 deaths. Expressed in t e r m s of 10'' J of electr ical energy production, t h e sulfate-induced heal th risk
is 0 to 95 premature deaths per l0"J. W e have placed t h e lower bound a t
z e r o to re f lec t t h e possibility t h a t t h e r e is a n effects threshold above t h e
ambient exposures w e have calculated.
-8
9
-5 3
0 Benzene has been identified as a leukemogen, and it is also found in some geothermal fluids, particularly those t h a t are ext rac ted from geothermal
reservoirs composed of sedimentary o r metamorphic rocks. The l i fe t ime risks
of incurring leukemia from exposure to benzene released from t h e reference
100-MWe flashed-steam facil i ty a r e 2 x at 10 km from t h e facil i ty and 7 x at 80 km. For t h e scenario of 3000 MWe of development in t h e
Imperial Valley w e calculate a population risk of 0.01 excess dea ths over 30 y.
The mean population risk of t h e reference industry is 0.6 excess dea ths
( 3 x per 10l8 J); at t h e 95th cumulative percentile of risk, 1.7 dea ths (8.5 x per 10l8 J) a r e predicted.
0 Mercury is frequently found in geothermal waters and gases. Prolonged exposure to elemental mercury released f rom geothermal facil i t ies may induce
neurologic disorders. To assess this risk, w e derived a n e s t i m a t e of t h e
l i fe t ime probability of muscle t remors based on four epidemiological studies.
vi

The l i fe t ime risk of exhibiting t remors was calculated to b e 1.2 x as a
result of exposure to mercury emi t ted from t h e reference 100-MWe facility.
For 3000 M W e of development in t h e Imperial Valley, we predicted 7.6 cases of mercury-induced tremors. The mean number of cases of t remors for t h e
reference industry was calculated to b e 55 (2.75 per I O J 8 J) and at t h e 95th cumulative percent i le of population risk, 164 cases (8.2 per 10l8 J).
0 Exposure to radon and its short-lived daughters poses a risk of lung cancer. W e
calculated t h e probability of lung cancer f rom 30 y of exposure to 222Rn (in equilibrium with i t s daughters) to b e 8 x m3/pCi, using a basic risk f a c t o r
of 5 x cases of lung cancer per working-level month (WLM). Operation of
t h e re ference 100-MWe geothermal faci l i ty results in risks of lung cancer
ranging from 6.4 x t o 2.4 x IOe8 at distances of 10 and 80 km from t h e
facil i ty, respectively. A population risk of 0.5 cases of c a n c e r was predicted for t h e 3000-MWe scenario in t h e Imperial Valley. The mean population risk of t h e reference 21,000-MW industry was predicted to b e 8.5 cases of lung cancer e (4.2 x IO-' per 10l8 J of electr ic i ty) ; 26 cases (1.3 per I O J 8 J) were predicted at t h e 95th cumulative percentile of population risk.
The ingestion of groundwater or sur face water contaminated with arsenic
derived from geothermal fluids could cause skin cancer. To de termine a n upper
l imit of skin cancer risk, w e assessed t h e potent ia l effects of directly
discharging was te geothermal fluids to surface waters. The case w e chose for analysis is t h e operation of t h e Wairakei geothermal power plant in New Zealand, which discharges al l of its waste geothermal fluids to a local river. The discharges a r e es t imated to produce a 3 9 x / l i t e r increase in t h e arsenic concentrat ion in t h e river, and w e ca lcu la te t h e resulting l i fe t ime risk of
ingesting t h a t contaminated w a t e r to be a surprisingly high 1.6 x That
calculation is based on a l i fe t ime probability of cancer equal to
4 x l i t e r / ug, derived from epidemiological studies of Taiwanese exposed
to elevated levels of arsenic in drinking water f rom wells. The risk e s t i m a t e is
probably incorrect f o r t h e following reasons: arsenic has been shown to b e a n
essential e lement , and therefore t h e linear, no-threshold dose-response model is
inapplicable ; mammals have a detoxification mechanism of methylation ; and arsenic concentrat ions in drinking water of up to lOOpg/liter d o not appear to
result in excessive body burdens.
vii
OCCUPATIONAL HEALTH EFFECTS
The geothermal industry in this country is relatively young and as a consequence,
various kinds of occupational hea l th problems have arisen and then brought under control by improved industrial hygiene practices. The occupational health d a t a t h a t a r e available
r e f l ec t such changing conditions, and so these health statistics cannot b e used t o predict
t h e occupational health e f f e c t s of a full-scale industry. We therefore used r a t e s of
accidental dea ths and occupational diseases f rom similar industries t o e s t ima te occupational risks. According to our calculations, t h e r e would b e 14 accidental dea ths per 10l8 J of electr ic i ty and 340 occurrences of occupational diseases per 10l8 3.
ECOLOGICAL EFFECTS
W e examined t h e potential effects of emissions of hydrogen sulfide and carbon
dioxide on forest plants and crops and concluded t h a t no negative effects on vegetation would occur. In fact, growth enhancement of plants is more likely than stress. W e also
analyzed t h e potential consequences of accidental releases of geothermal fluids on to
vegetation and soils ad jacent to power plants. Our calculations show t h a t less than 5 ha
of land will b e a f f ec t ed by inadvertent releases--assuming t h a t berms and sumps are not used t o contain t h e spilled fluids.
viii
HEALTH AND ENVIRONMENTAL EFFECTS DOCUMENT ON GEOTHERMAL ENERGY--1981
ABSTRACT
W e assess several of t h e important health and environmental risks associated with a re ference geothermal industry t h a t produces 21,000 MWe for 30 y (equivalent to 20 x l o J 8 J). The analyses of health e f f e c t s focus on t h e risks associated with exposure
to hydrogen sulfide, par t iculate sulfate, benzene, mercury, and radon in a i r and arsenic in water. Results indicate t h a t emissions of hydrogen sulfide are likely to cause
odor-related problems in 29 of 51 geothermal resources areas , assuming t h a t no pollution controls are employed. For individuals living within a n 80 km radius of t h e geothermal
resources, chronic exposure to par t iculate su l fa te (an oxidation by-product of hydrogen
sulfide in t h e atmosphere) could result in between 0 to 95 premature dea ths per 10l8 J of electr ic i ty generated. The mean population risk of leukemia from t h e inhalation of
benzene was calculated to b e 3 x lo-* cases per 10l8 J; at t h e 95th cumulative percentile
of risk, 8.5 x lo-* cases per 1Ol8 J were predicted. Exposure to elemental mercury in t h e
atmosphere could produce between 0 and 8.2 cases of t remors per 10l8 J of electricity.
Inhalation of radon and its short-lived daughters poses a mean population risk of 4.2 x 10⁻¹ lung cancers per l o J 8 J and 1.3 cases per 10l8 J at t h e 95th cumulative percent i le of risk. Our analysis of skin cancer risk from t h e ingestion of surface water contaminated
with geothermally derived arsenic suggests t h a t a n existing linear, dose-response model is probably incorrect. I t is inconsistent with data showing t h a t arsenic is an essential e lement and tha t excessive body burdens do n o t appear even when arsenic reaches
100pg/li ter in drinking water. W e based our es t imates of occupational health e f f e c t s on
r a t e s of accidental dea ths and occupational diseases in surrogate industries. According to
our calculations, t h e r e would b e 14 accidental dea ths per 10" J of e lectr ic i ty and 340 cases of occupational diseases per 10l8 J. The analysis of t h e e f f e c t s of noncondensing
gases on vegetation showed t h a t ambient concentrat ions of hydrogen sulfide and carbon dioxide a r e more likely to enhance ra ther than inhibit t h e growth of plants. Finally, w e
studied t h e possible consequences of accidental releases of geothermal fluids and concluded t h a t probably less than 5 h a of land would b e affected by such releases during
t h e production of 20 x 10l8 J of electricity.
1
INTRODUCTION
Geothermal energy is h e a t s tored within t h e earth's crust . This source of energy has
been used to produce electr ic i ty on a commercial basis in t h e U.S. since 1960, and t h e installed electric generating capaci ty is now over 900 MW,. For comparison, t h e energy potential of identified geothermal resources is est imated to b e about 23,000 MW for
30 y, and unidentified resources could b e more than t h r e e t i m e s as great.' As this energy industry expands to higher levels of power production, its cumulative health and
environmental risks could become significant, perhaps unacceptable. Accordingly, a basic purpose of th i s Health and Environmental Ef fec ts Document (HEED) is to quantitatively assess such risks and to de termine whether they a r e manageable. Another important
objective of t h e HEED is to identify a r e a s of research t h a t c a n lead to improved
e s t i m a t e s of heal th and environmental effects.
e
Geothermal resources usually exis t as e i ther convective o r conductive h e a t flow
systems. In both systems most of t h e hea t is stored in t h e rock matrix. H e a t t ransfer within convective systems is primarily through t h e circulation of w a t e r or s t e a m in porous or f rac tured geologic media. The h e a t source for these so-called hydrothermal- convection sys tems is o f t e n a shallow, magmatic intrusion.2 Hydrothermal systems are subcategorized as vapor-dominated (steam) o r hot-water systems. Vapor-dominated
sys tems such as The Geysers in northern California a r e t h e easiest to uti l ize for t h e
production of electr ic i ty as t h e tapped s t e a m c a n b e sen t directly to a low-pressure
turbine. Hot-water sys tems with tempera tures g r e a t e r than 15OoC c a n be used to
genera te e lectr ic i ty with current ly available technology; however, t h e conversion process 3 is more complex because t h e geothermal liquid must be flashed to produce steam.
Lower tempera ture sys tems (190 to 150OC) a r e usable for o ther purposes such as space heating and o ther nonelectr ic o r direct uses.
Two examples of conductive geothermal systems a r e geopressured and hot dry rock
resources. Geopresssured resources exist as deep sedimentary formations containing hot,
saline liquid at pressures considerably higher than normal hydrostatic. The value of these
resources is enhanced by t h e presence of natural gas dissolved in t h e fluids. The
extract ion of geopressured energy is not a demonstrated technology at th i s time. Most of t h e development act ivi t ies associated with this resource have focused on character izat ion
of t h e resource in t h e Gulf Coast region. Hot dry rock resources re fer to low permeability, high-temperature granitic, metamorphic, o r cemented sedimentary formations t h a t are usually in c o n t a c t with a young magmatic intrusion. Heat t ransfer
f rom t h e intrusion is s t r ic t ly by conduction. To exploit hot dry rock resources, f rac tures
2

a r e artificially c rea ted in t h e formation by hydraulic fracturing, and then water is
circulated through t h e f r a c t u r e zone, heated, and returned to t h e surface where t h e h e a t
is ex t rac ted for e lectr ic i ty production or direct uses? This method of resource extract ion is under ac t ive research and development, but it is not considered a near-term technology .
The geothermal resource area with t h e largest amount of electr ical energy
generation in t h e world is located at The Geysers. Here, t h e f i r s t 11-MWe unit began operating in 1960, and today 15 units with a net capaci ty of 908 M W e a r e in operation.
Hot-water resources, in contrast , have been developed much more slowly, and only two IO-MWe power plants a r e now operating in California's Imperial Valley. In t h e long te rm,
however, hot-water resources o f f e r a f a r grea te r potential for power production. The energy potential of identified hot-water resources is est imated to b e t h e equivalent of
21,000 MWe generated for 30 y, compared with t h e less than 2,000 MWe generated for
30 y at The Geysers--the only vapor-dominated resource a r e a in t h e U.S. outside of t h e
National Parks. Here w e address t h e potential effects of developing t h e large energy
potential of t h e hot-water resources.
I
OVERVIEW OF POTENTIAL HEALTH AND ENVIRONMENTAL EFFECTS
There a r e several health and environmental issues connected with t h e extract ion of hot water or s team f rom geothermal reservoirs and t h e subsequent processing to genera te electricity. Based on measurements and experience at existing geothermal facil i t ies and
wells, t h e most serious concerns for both types of resources re la te to emissions of gases t h a t a r e not condensed at operating tempera tures and pressures. The chemical
composition of t h e s e gases varies widely from reservoir to reservoir; however, t h e major
consti tuent is typically carbon dioxide, and significant amounts of methane and hydrogen
sulfide a r e nearly always present along with t r a c e amounts of benzene, radon, and
mercury. Exposure to atmospheric concentrations of hydrogen sulfide, benzene, radon,
and mercury pose potential hazards to public and occupational health. In addition,
exposure to hydrogen sulfide and tox ic chemicals used in hydrogen sulfide aba tement systems has been identified as a n occupational health hazard. Environmentally, noise
emissions have been a problem at The Geysers due to venting of high-pressure s team at 6 wellheads and generating units. Issues more applicable to t h e development of hot-water
resources include t h e disposal of large volumes of spent geothermal liquids, accidental
spills of fluids, land subsidence caused by t h e withdrawal of fluids, and enhanced seismicity f rom fluid injection or reservoir cooling. In addition, phytotoxic effects to
5
3

vegetation in t h e vicinity of power plants c a n b e caused by cooling tower emissions of w a t e r droplets (Le., dr i f t ) containing toxic substances derived f rom s team condensate
used as cooling water. 7
The primary focus of th i s HEED on geothermal energy is on atmospheric emissions of
noncondensing gases because w e believe these gases pose t h e grea tes t hazard to public and occupational health. W e a lso consider ecological effects caused by accidental spills of geothermal fluids and emissions of hydrogen sulfide. In subsequent years o ther HEEDS
will address some of t h e o ther potentially important effects such as subsidence and
cooling tower drift.
METHODOLOGY
The basic methodology w e use to assess t h e risks of geothermal power production is outlined in Fig. I , To begin with, w e def ine t h e basic a t t r ibu tes of t h e reference energy
industry including the level of energy production to be assessed; t h e relevant character is t ics of energy conversion technologies; and importantly, t h e potent ia l releases
of pollutants f rom geothermal facilities. Next, t h e t ransport and fate of t h e pollutants released in to t h e environment are simulated by media-specific (i.e., a i r and water) models. Est imates of t h e environmental concentrat ions of contaminants a r e then used in dose-response models to de termine effects on vegetation, animals, and man. T h e
occupational health e f f e c t s associated with geothermal energy a r e evaluated using
occupational health d a t a along with exposure es t imates and effects models. Finally,
special models or analyt ical techniques a r e used to simulate nonpollutant effects associated with noise emissions, subsidence, and seismicity. Another component of t h e
assessment methodology is t h e quantification of t h e uncertainty o r t h e accuracy of our es t imates of heal th and environmental effects.
4

Occu pa t iona I Occupational
+ Pollutant transport
Worker effects
I
t Man 4 Animals Vegetation,
soil - t / \ t
t 7 t Vegetation Human Animal Non pol I u tan t
effects effects effects effects i - -
I 1 7 Health and environmental effects assessment 1
FIGURE 1. Conceptual diagram of the methodological approach of performing the health
and environmental e f f e c t s assessment of geothermal energy.
5

THE REFERENCE GEOTHERMAL POWER INDUSTRY
Geothermal power production is projected to grow steadily in t h e years ahead. Most of t h e new generating faci l i t ies will rely on t h e proven, vapor-dominated resources of The Geysers, but substantial development is also expected to occur at t h e more prevalent hot-water resource areas. T h e energy potential of t h e discovered hot-water resources is
est imated to be 21,000 MW for 30 y, compared with a n es t imated undiscovered resource e base of over 72,000 MWe f o r 30 y.' W e will consider t h e reference industry--at full
development it will consist of power plants with a n installed capaci ty equivalent to t h e
30-y power potent ia l of t h e discovered resources (Le., 21,000 MW,). There a r e currently
5 I identified resource a r e a s in 1 I western states, with es t imated energy potentials
ranging from 23 to 3400 M W e for 30 y. Over 99% of t h e resources a r e found in t h e eight
states shown in Fig. 2. Emission r a t e s of pollutants f rom t h e power plants t h a t comprise
t h e reference industry will vary according to t h e chemical and physical character is t ics of t h e 51 resource a reas as well as t h e types of power plants installed. The ensuing discussion, therefore , begins with a brief review of t h e geothermal energy technologies
addressed in t h e risk assessment followed by analyses of published d a t a on t h e chemistry of noncondensing gases.
GEOTHERMAL POWER TECHNOLOGIES
T h e t w o basic types of geothermal power cycles t h a t a r e being developed for
commercial applications a r e f lashed-steam and binary-fluid. A simple f lashed-steam
system is depicted in Fig. 3. Geothermal fluid is withdrawn from a well and af te rwards
s t e a m is separated (i.e., flashed) f rom t h e ex t rac ted fluid by pressure reduction. The
residual geothermal liquids a r e disposed of (usually by subsurface injection) while t h e
separated s t e a m is s e n t to a turbine. S team exhausted from t h e turbine is condensed,
creat ing enough w a t e r to m e e t t h e cooling water needs of t h e facility. Noncondensing
gases a r e normally e jec ted from t h e condenser and if necessary piped to a n aba tement
system. A t The Geysers, s t e a m is ext rac ted from a geothermal reservoir by wells and
then sen t directly to a turbine. Thus, power plants at The Geysers a r e essentially t h e s a m e as flashed-steam facilities except f o r equipment needed to separa te s t e a m from
geothermal fluids and t h e e x t r a injection wells required to dispose of t h e was te fluids. The binary-fluid cyc le (Fig. 4) does not use s t e a m to drive a turbine; instead, down-hole
pumps withdraw geothermal fluid from production wells and then t h e pressurized fluids a r e s e n t through a h e a t exchanger t h a t hea ts and vaporizes a secondary working
6
130
120
110
100
90
b 80
70 >: 60
ij 3 50
(v
7
0
Y-
z 40
30
20
10
0
Imperial Valley / ' - resources
Alaska California Hawaii Idaho Nevada New Oregon Utah Mexico
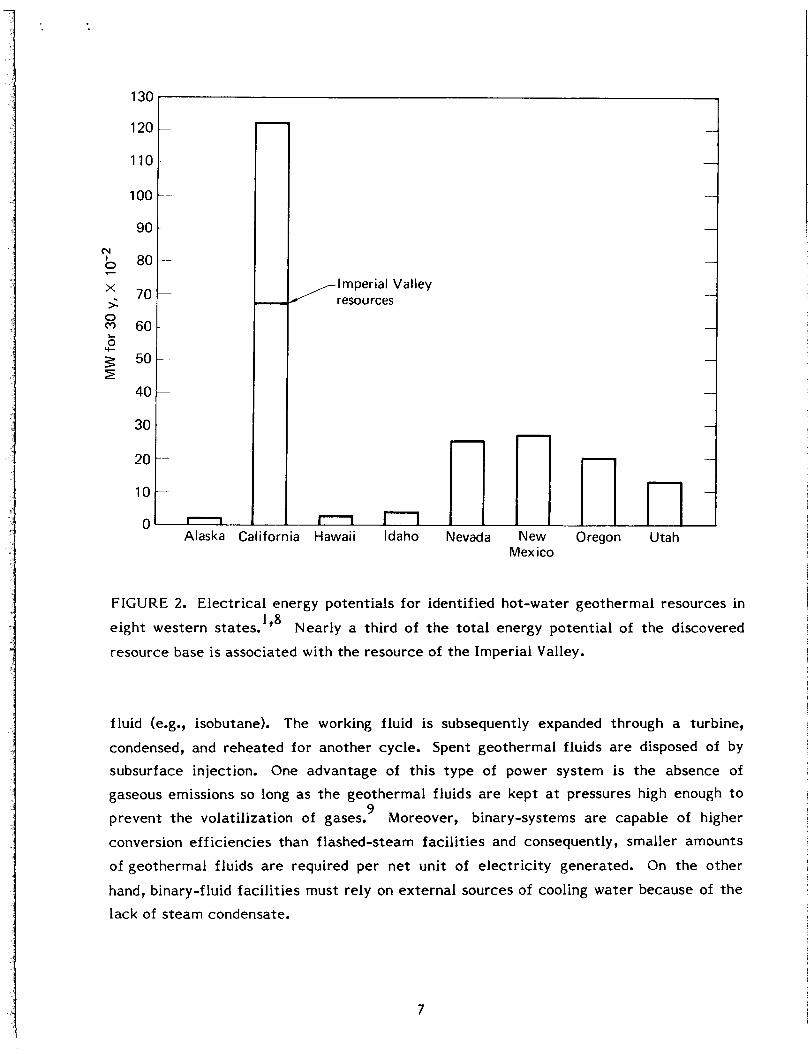
FIGURE 2. Electr ical energy potentials for identified hot-water geothermal resources in
e ight western states. lg8 Nearly a third of t h e to ta l energy potential of t h e discovered
resource base is associated with t h e resource of t h e Imperial Valley.
f h i d (e+, isobutane). The working fluid is subsequently expanded through a turbine, condensed, and reheated f o r another cycle. Spent geothermal fluids a r e disposed of by subsurface injection. One advantage of th i s type of power system is t h e absence of gaseous emissions so long as t h e geothermal fluids a r e kept at pressures high enough to prevent t h e volatilization of gases. Moreover, binary-systems a r e capable of higher conversion efficiencies than f lashed-steam facil i t ies and consequently, smaller amounts
of geothermal fluids a r e required per n e t unit of electr ic i ty generated. On t h e o ther
hand, binary-fluid faci l i t ies must rely on external sources of cooling water because of t h e lack of s team condensate.
9
7

Steam
Spent fluids
Evaporative losses and drift
L
Steam condensate and return flow
water cooling External Secondary tower water supply
working fluid A
FIGURE 3. Single-stage, f lashed-steam geothermal power cycle. Steam separated from
t h e ex t rac ted geothermal fluids drives a turbine-generator to produce electricity.
N oncondensing gases e jected from t h e condenser represent t h e most important pollutant release from this t y p e of conversion technology (adapted from Layton and Morris ). 7
Waste water Cooling water
return flow
FIGURE 4. Binary-fluid power cycle. Geothermal fluids a r e sen t through a heat
exchanger t h a t vaporizes a secondary working fluid, which in turn expands through a turbine-generator to produce electricity. Atmospheric emissions a r e not expected f rom
th is conversion technology so long as t h e ex t rac ted fluids a r e kept at pressures t h a t prevent t h e dissolution of gases (adapted from Layton and Morris 1. 7
8
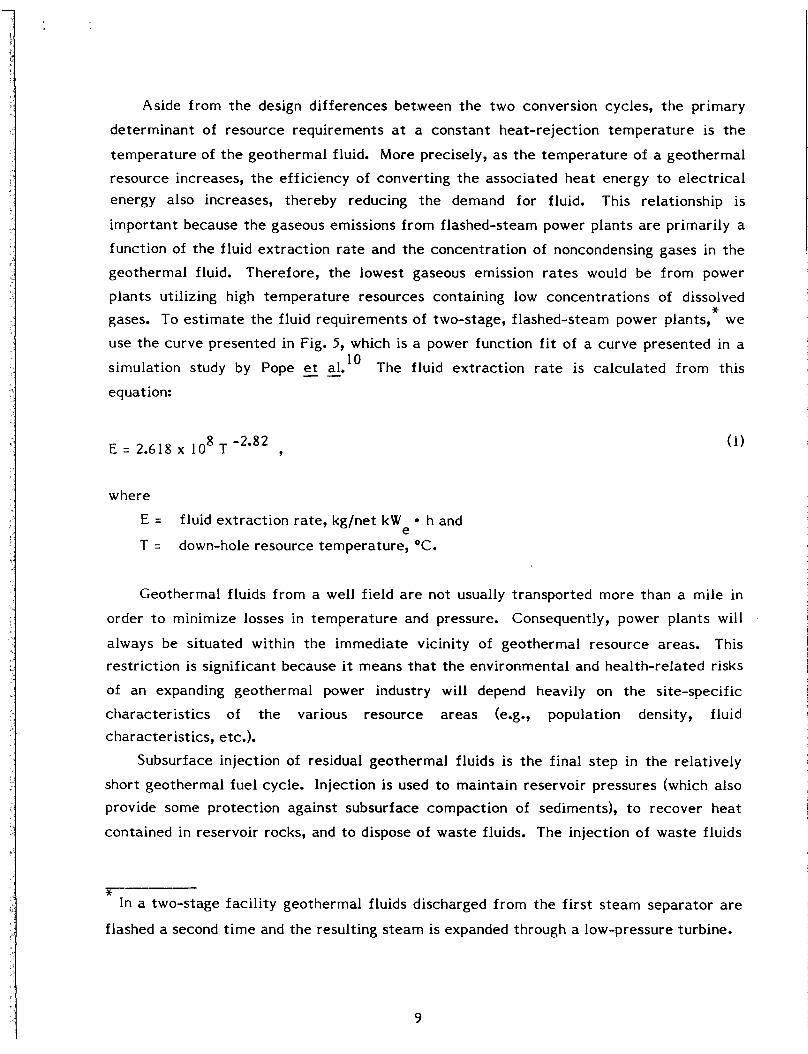
Aside from t h e design differences between t h e two conversion cycles, t h e primary
determinant of resource requirements at a constant heat-rejection tempera ture is t h e
tempera ture of t h e geothermal fluid. More precisely, as t h e tempera ture of a geothermal resource increases, t h e efficiency of converting t h e associated h e a t energy to electr ical energy also increases, thereby reducing t h e demand for fluid. This relationship is
important because t h e gaseous emissions from flashed-steam power plants a r e primarily a function of t h e fluid extract ion r a t e and t h e concentration of noncondensing gases in t h e geothermal fluid. Therefore, t h e lowest gaseous emission r a t e s would b e from power
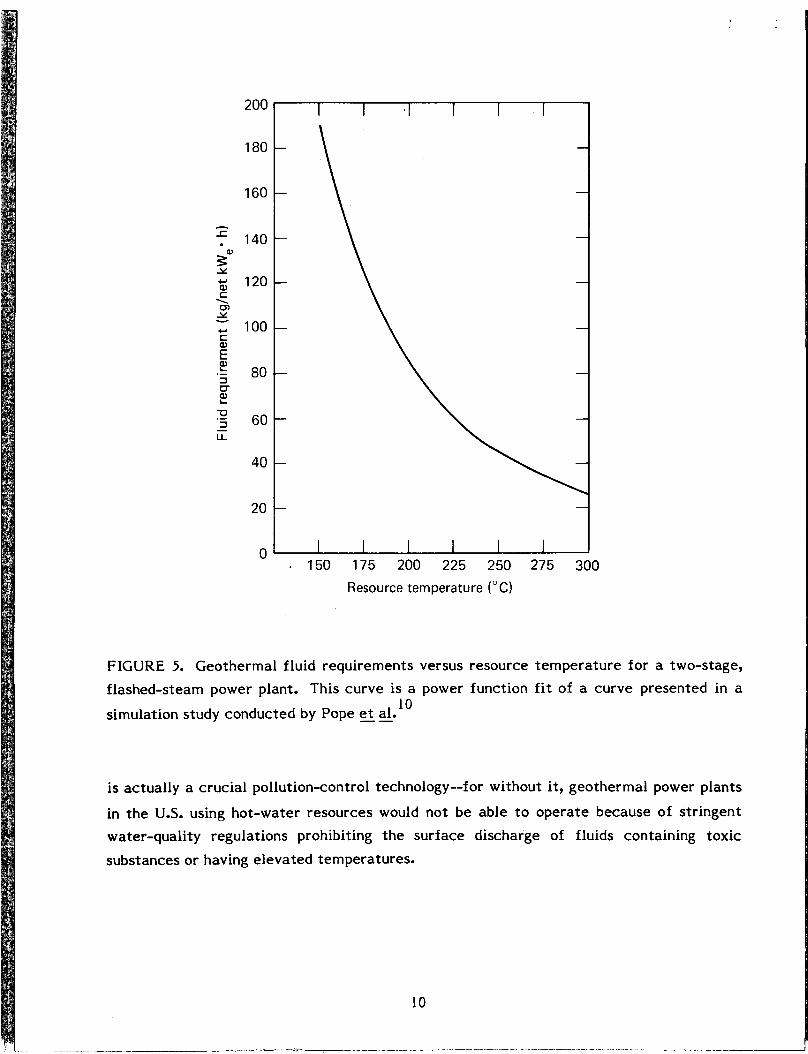
plants utilizing high tempera ture resources containing low concentrat ions of dissolved gases. To e s t i m a t e t h e fluid requirements of two-stage, flashed-steam power plants, w e
use t h e curve presented in Fig. 5, which is a power function f i t of a curve presented in a
simulation study by Pope - - et a1.l' The fluid extract ion r a t e is calculated from this
equation:
*
8 -2.82 E = 2 . 6 1 8 ~ 10 T 9
where
E = fluid extract ion rate , kg/net kW h and
T = e
down-hole resource temperature , "C.
Geothermal fluids f rom a well field a r e not usually transported more than a mile in order to minimize losses in tempera ture and pressure. Consequently, power plants will
always b e s i tuated within t h e immediate vicinity of geothermal resource areas. This restriction is significant because it means t h a t t h e environmental and health-related risks
of a n expanding geothermal power industry will depend heavily on t h e site-specif ic
character is t ics of t h e various resource a r e a s (e+, population density, fluid characterist ics, etc.).
Subsurface injection of residual geothermal fluids is t h e final s t e p in t h e relatively
short geothermal fuel cycle. Injection is used to maintain reservoir pressures (which also provide some protection against subsurface compaction of sediments), to recover hea t
contained in reservoir rocks, and to dispose of was te fluids. The injection of waste fluids
* In a two-stage faci l i ty geothermal fluids discharged f rom t h e first s t e a m separator a r e
flashed a second t i m e and t h e resulting s t e a m is expanded through a low-pressure turbine.
9
200
180
160
- f 140
- 120 Y
a) C \ 0 Y
c 't 100
i! .E 80 3 0- 2
60 - LL
40
20
0
I I * I I I I
. 150 175 200 225 250 275 300
Resource temperature ("C)
FIGURE 5. Geothermal f h i d requirements versus resource tempera ture f o r a two-stage, flashed-steam power plant. This curve is a power function f i t of a curve presented in a
simulation study conducted by Pope et al. 10
is actually a crucial pollution-control technology--for without it, geothermal power plants
in t h e U.S. using hot-water resources would not b e ab le to opera te because of s t r ingent water-quality regulations prohibiting t h e surface discharge of fluids containing toxic
substances o r having elevated temperatures.
10

CHEMISTRY OF NONCONDENSING GASES
Geothermal fluids at depth a r e complex mixtures of dissolved gases and solids. As these fluids a r e withdrawn f rom a reservoir and processed to produce electr ic i ty in f lashed-steam facil i t ies, reductions in tempera ture and pressure cause t h e volatilization and subsequent re lease of various gases t h a t d o not condense at atmospheric
tempera tures and pressures. The major gases in t h e noncondensing g a s phase normally
consist of carbon dioxide ( a t around 90 mole %), methane, hydrogen sulfide, ammonia, nitrogen, and hydrogen. Concentrations of those major gases as well as minor gases like
benzene, mercury, and radon will vary among wells in t h e s a m e geothermal resource a r e a and they will a lso vary in time." In t h e following analyses w e review d a t a on
concentrat ions and emissions of hydrogen sulfide, benzene, mercury, and radon--the most important gases f rom a health effects standpoint.
Hydrogen Sulfide
Hydrogen sulfide is found in nearly all high-temperature geothermal fluids (Le.,
> 150OC). I t is probably formed by one o r more of t h e following mechanisms: reaction of sulfur t h a t is present in reservoir rocks with hot water , magmatic exhalation, or thermal
metamorphism of marine sedimentary rocks. 11'12 Concentrations of th i s g a s sampled from geothermal fluids in t h e U.S. range from 0.18 to 60.7 mg/kg. Table I presents d a t a
on concentrat ions and emission rates of hydrogen sulfide f rom several water-dominated resource areas. Where published values were unavailable, t h e emission r a t e s were
determined by multiplying t h e concentrations of hydrogen sulfide in fluids by t h e fluid extract ion r a t e s calculated from the temperature-dependent function previously
discussed. Table 1 also contains e s t i m a t e s of t h e uncontrolled emission r a t e s of hydrogen sulfide f tom power plants at vapor-dominated resources (Le., The Geysers and Larderello,
Italy). To study t h e uncertainty of t h e measured concentrations and uncontrolled
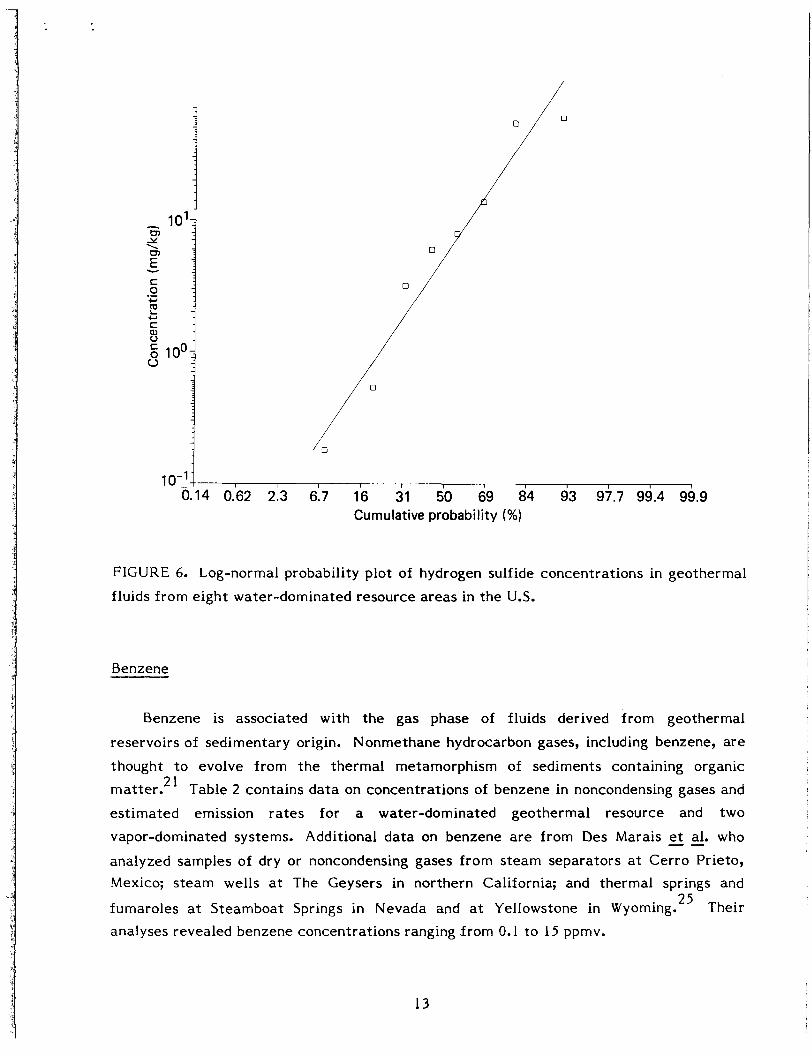
emission rates, we have prepared log-normal probability plots of t h e empirical cumulative
distributions of hydrogen sulfide concentrat ions and emissions (see Figs. 6 and 7). The
geometr ic mean 1-1 of t h e U.S. d a t a on hydrogen sulfide concentrat ions is 5.4 mg/kg with
a geometr ic standard deviation CJ of 7.8. The emission d a t a have a 1-1 of
776 g/MWe h with a 0 of 7.2 (da ta for Matsukawa, Japan were not used).
g
g g
g
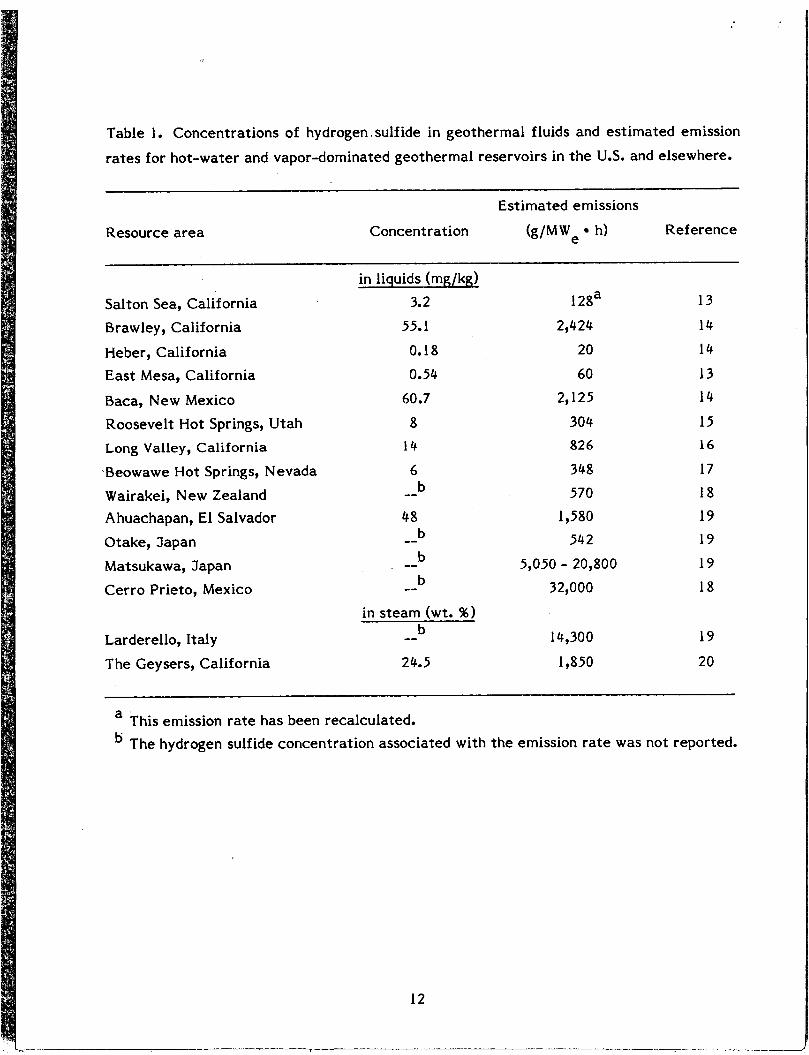
Table 1. Concentrations of hydrogen. sulf ide in geothermal fluids and est imated emission
r a t e s for hot-water and vapor-dominated geothermal reservoirs in t h e U.S. and elsewhere.
Estimated emissions Resource a r e a Concent ration (g/MWe h) Reference
Salton Sea, California Brawley, California
Heber, California Eas t Mesa, California
Baca, New Mexico Roosevelt Hot Springs, Utah Long Valley, California
Beowawe Hot Springs, Nevada Wairakei, New Zealand A huachapan, El Salvador
Otake, Japan
Matsukawa, Japan C e r r o Prieto, Mexico
Larderello, Italy
T h e Geysers, California
in liquids (mg/kg) 3.2 55.1 0.18 0.54 60.7 8 14
6 b --
48 b b b
in s team (wt. %) b
-- -- --
-- 24.5
I 28a 2,424
20 60
2,125 304 826
348 570
1,580 542
5,050 - 20,800 32,000
14,300
1,850
13 14 14 13 14
15 16
17 18 19 19
19 18
19
20
a This emission rate has been recalculated. ’ The hydrogen sulfide concentrat ion associated with t h e emission r a t e was not reported.
12
10-1 1 I 1 I I , 1 I 1 I I I 1
0.14 0.62 2.3 6.7 16 31 50 69 84 93 97.7 99.4 99.9 Cumulative probability (%)
FIGURE 6 . Log-normal probability plot of hydrogen sulfide concentrations in geothermal
fluids f rom eight water-dominated resource a r e a s in t h e U.S.
Benzene
Benzene is associated with t h e gas phase of fluids derived from geothermal
reservoirs of sedimentary origin. Nonmethane hydrocarbon gases, including benzene, a r e
thought to evolve from t h e thermal metamorphism of sediments containing organic matter.21 Table 2 contains d a t a on concentrations of benzene in noncondensing gases and
es t imated emission r a t e s for a water-dominated geothermal resource and two vapor-dominated systems. Additional d a t a on benzene a r e from Des Marais -- et al. who
analyzed samples of dry or noncondensing gases f rom s t e a m separators at Cerro Prieto, Mexico; s team wells at The Geysers in northern California; and thermal springs and
fumaroles at Steamboat Springs in Nevada and at Yellowstone in Wyoming.25 Their analyses revealed benzene concentrations ranging f r o m 0. I to I5 ppmv.
13

h
.c . 3" z
1 04;
v) C 0 .- v) v) .- E w
IC
1 04;
2 x
0
%
I - , , I I s I
2.3 6.7 16 31 50 69 84 93 97.7 99.4 99.9 Cumulative probability (%)
FIGURE 7. Log-normal probability plot of es t imated emissions of hydrogen sulfide from
14 different resource a reas in t h e U.S. and elsewhere in t h e world.
Based on t h e proposed relationship between rock t y p e and occurence of hydrocarbon
gases, w e would expec t gases f rom igneous-related geothermal systems to have much smaller levels of benzene or none at all because such systems a r e depleted in organic
mat ter . D a t a developed by Nehring and Truesdell support this hypothesis. Figure 8 shows chromatograms of gases they collected from igneous and sedimentary-related geothermal resources. As expected, t h e chromatograms of t h e gas samples f rom igneous a r e a s in Kilauea, Hawaii and Steamboat Springs, Nevada (Figs. 8(a) and (b), respectively)
have much lower quant i t ies of organic gases than t h e samples f rom sedimentary and
metamorphic rocks at The Geysers (Fig. 8(c)) and C e r r o Pr ie to (Fig. 8(d)). In other
supporting work, Des Marais et al. found t h a t t h e C content of hydrocarbon gases f rom
t h e C e r r o Prieto geothermal field were qui te comparable to t h e 13C content of coal found
in drill cut t ings f rom wells located in t h a t resource area.25 Furthermore, pyrolysis of t h a t coal in t h e laboratory produced methane t h a t had a 13C content similar to t h a t of t h e methane measured in t h e noncondensing gases f rom t h e geothermal field.
26
1 3
14
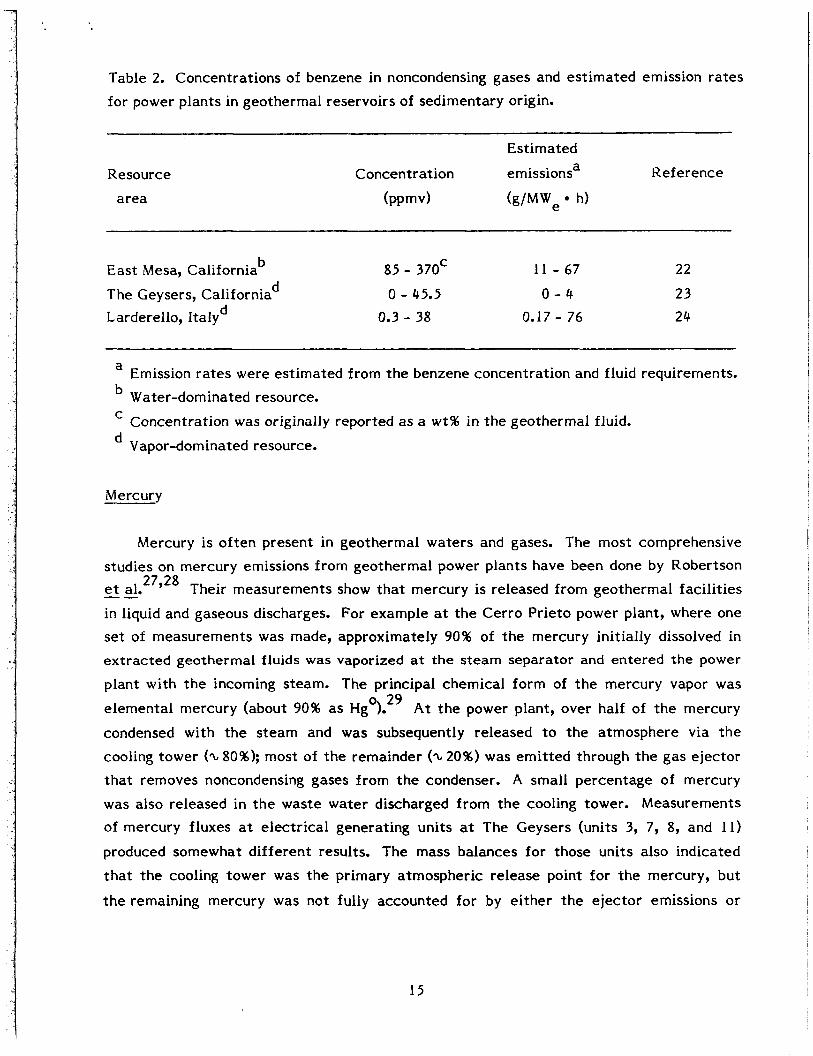
Table 2. Concentrations of benzene in noncondensing gases and est imated emission r a t e s for power plants in geothermal reservoirs of sedimentary origin.
Resource
a r e a
Estimated a Concentration emissions Reference
(ppmv) (g/MWe h)
85 - 370' I 1 - 6 7 22 b Eas t Mesa, California
The Geysers, California Larderello, Italy
0 - 45.5 0 - 4 2 3 0.3 - 38 0.17 - 76 24
d d
a Emission r a t e s were est imated f rom t h e benzene concentration and f h i d requirements. Water-dominated resource.
Concentration was originally reported as a w t % in t h e geothermal fluid.
Vapor-dominated resource.
C
Mercury
Mercury is o f t e n present in geothermal waters and gases. The most comprehensive s tudies on mercury emissions from geothermal power plants have been done by Robertson -- et al. 27928 Their measurements show t h a t mercury is released from geothermal faci l i t ies
in liquid and gaseous discharges. For example at t h e C e r r o Prieto power plant, where o n e set of measurements was made, approximately 90% of t h e mercury initially dissolved in ex t rac ted geothermal fluids was vaporized at t h e s t e a m separator and entered t h e power
plant with t h e incoming steam. The principal chemical form of t h e mercury vapor was
e lementa l mercury (about 90% as Hg0).29 A t t h e power plant, over half of t h e mercury
condensed with t h e s t e a m and was subsequently released to t h e atmosphere via t h e cooling tower (z 80%); most of t h e remainder ('L 20%) was emi t ted through t h e g a s e jector tha t removes noncondensing gases f rom t h e condenser. A small percentage of mercury was also released in t h e was te water discharged f rom t h e cooling tower. Measurements of mercury fluxes at e lec t r ica l generating units at The Geysers (units 3, 7, 8, and 11)
produced somewhat different results. T h e mass balances f o r those units also indicated t h a t t h e cooling tower was t h e primary atmospheric re lease point for t h e mercury, but
t h e remaining mercury was not fully accounted for by e i ther t h e e jec tor emissions o r
15

\
W 0) C m c n m c, W 0,
W C m c, 3 -Q
I C
aJ C W N
W C m J. +
(d) !
5
FIGURE 8. Chromatograms of gas samples f Torn igneous-related geothermal systems
((a) Kilauea, Hawaii and (b) Steamboat Springs, Nevada) and from geothermal reservoirs
composed of sedimentary and metamorphic rocks ((c) The Geysers, California and
(d) Cerro Prieto, Mexico). Adapted from Nehring and Truesdell. 26
16

discharges of was te water f rom t h e cooling tower. However, sludge in t h e basin of t h e cooling tower contained 0.02- to 0.2-wt% mercury,' and Robertson -- et al. believe t h a t
precipitation of mercury within t h e basin is a n important removal mechanism.27 Table 3
contains d a t a on elemental mercury concentrations and est imated emission r a t e s for
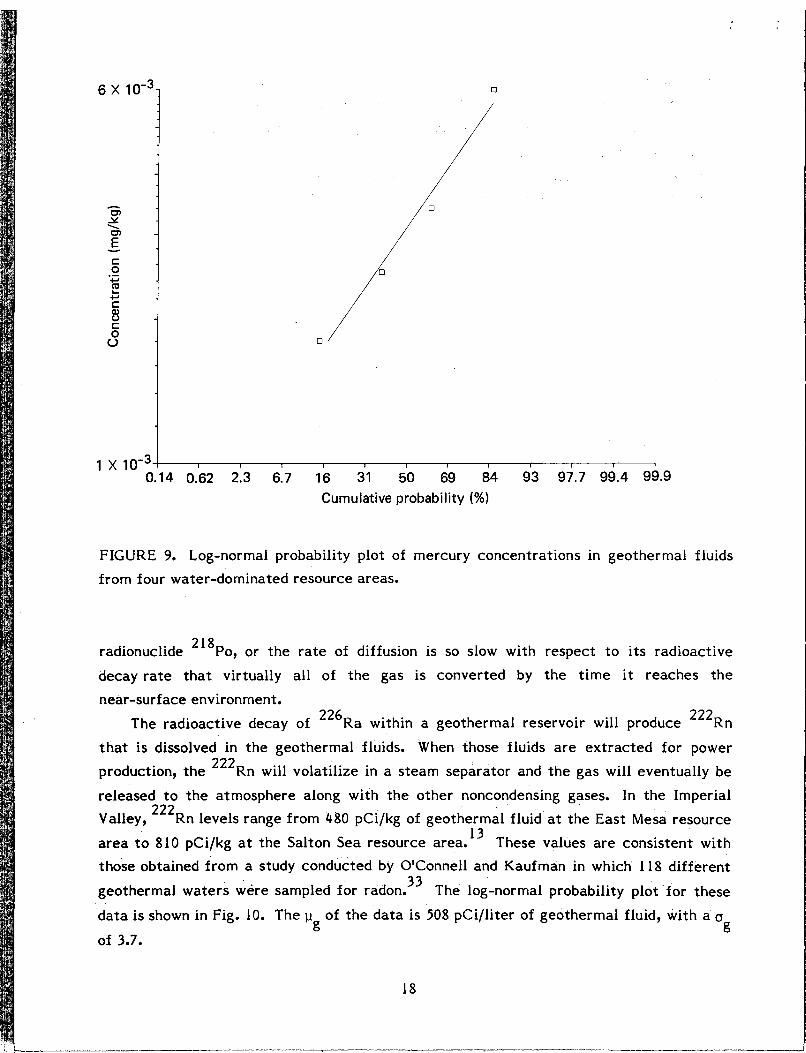
water-dominated systems. A log-normal probability plot of t h e concentrat ion d a t a i s shown in Fig 9. Thew of t h e concentrations is 0.003 mg/kg and t h e u is 1.7. g g
Table 3. Elemental mercury in geothermal fluids and est imated emission r a t e s f rom four
water-dominated resource areas.
Estimated a Concentration emissions Reference
(ppbv) (g/MWe h)
Salton Sea, California East Mesa, California
Puna, Hawaii C e r r o Prieto, Mexico
18
6 3.4 2.5
0.05 13
0.54 13 0. I 17
0.07 28
a Emission r a t e s a r e based on t h e following assumptions: 90% of t h e t o t a l mercury
dissolved in geothermal fluids is released to t h e atmosphere and of t h a t amount, 90% i s e lemental mercury.
Radon
Radon (222Rn), a radioactive gas with a half-life of 3.8 d, is a daughter product of t h e decay chain of naturally occurring 238U. Af te r radon is formed from t h e decay of
226Ra in near-surface soils and rocks, it diffuses to t h e atmosphere at r a t e s t h a t a r e
dependent on 226Ra activity, soil properties, meteorological conditions, and soil
moisture.30 At The Geysers, exhalation r a t e s have been measured t h a t range from
2.6 x Similar r a t e s have been measured elsewhere in
t h e world.32 Radon produced deeper in t h e Earth's c rus t may never reach t h e surface because 222Rn c a n dissolve in groundwater where it decays to its daughter
2 31 to 150 x IOe6 pCi/m s.
17
1 x 10⁻³ 1 I I I I I I I I I I I I
0.14 0.62 2.3 6.7 16 31 50 69 84 93 97.7 99.4 99.9 Cumulative probability (%)
FIGURE 9. Log-normal probability plot of mercury concentrat ions in geothermal fluids f rom four water-dominated resource areas.
radionuclide 218Po, or t h e r a t e of diffusion is so slow with respect to its radioactive
decay r a t e t h a t virtually a l l of t h e gas is converted by t h e t i m e it reaches t h e
near-surface environment.
The radioactive decay of 226Ra within a geothermal reservoir will produce 222Rn
t h a t is dissolved in t h e geothermal fluids. When those fluids a r e ex t rac ted for power production, t h e 222Rn will volatilize in a s team separator and t h e gas will eventually b e
released to t h e atmosphere along with t h e o ther noncondensing gases. In t h e Imperial Valley, 222Rn levels range f rom 480 pCi/kg of geothermal fluid at t h e East Mesa resource
a r e a to 810 pCi/kg at t h e Salton Sea resource area.13 These values a r e consistent with those obtained from a study conducted by O'Connell and Kaufman in which 118 different
geothermal waters were sampled f o r radon.33 The log-normal probability plot for these
d a t a is shown in Fig. 10. The p of t h e d a t a is 508 pCi/l i ter of geothermal fluid, with a (J g g
of 3.7.
18

Cumulative probability (%)
FIGURE 10. Log-normal probability plot of "*Rn concentrat ions in 118 di f fe ren t geothermal waters in t h e western U.S. Data f rom O'Connell and Kaufman. 33
19
HUMAN HEALTH EFFECTS
A mature geothermal power industry will result in heal th risks both to workers in t h e
industry and to t h e general public. The primary source of public health risks is t h e
inhalation of tox ic gases emi t ted by geothermal power plants. A s noted earlier, t h e most important gases in th i s regard a r e hydrogen sulfide, benzene, mercury, and radon.
Hydrogen sulfide emissions c a n cause noxious odors; sulfur oxides f rom t h e atmospheric
oxidation of hydrogen sulfide c a n produce negative health effects including premature
death; benzene is leukemogenic; radon is carcinogenic; and mercury c a n cause neurologic
disorders. A secondary exposure pathway is t h e ingestion of surface waters o r groundwaters contaminated with toxic substances (e+, arsenic) derived from spent
geothermal fluids. Although w e a r e fairly confident t h a t t h e toxic substances l isted
above a r e t h e only significant ones f rom a health effects standpoint, w e cannot rule o u t t h e possibility t h a t s o m e new pollutant will be discovered in t h e process s t r e a m s or t h a t a
recognized pollutant will l a t e r b e shown t o be much more hazardous than previously r e ~ o g n i z e d . 3 ~ An example of th i s is benzene.
Prior to 1978, when Nehring and Truesdell published results of the i r analyses of t h e
organic g a s composition of noncondensing gases f rom geothermal systems,26 benzene was not one of t h e gases t ha t was routinely assessed in environmental analyses of geothermal
projects because t h e r e was no reason to expect its presence. Even now, measurements of
nonmethane hydrocarbon gases a r e not available for most geothermal resources.
Occupational risks associated with geothermal development have historically been
associated with exposure to toxic levels of hydrogen sulfide. Abatement of hydrogen
sulfide t o reduce emissions of t h a t g a s has led to a secondary occupational health
problem: exposure to toxic substances used in t h e aba tement equipment.
PUBLIC HEALTH
Our purpose here is to quantify t h e various public heal th risks for a mature geothermal energy industry with a capaci ty of 21,000 MW,. The assessments of health
risks resulting f rom emissions of noncondensing gases focus on t h e risks of single power plants, a scenario representing geothermal development of 3000 MWe in California's Imperial Valley, and a generic assessment for development a t o ther resource a r e a s using
normalized risk values (e+, risk per pollutant emission rate). The Imperial Valley was chosen f o r t h e detailed analysis because t h e r e is a n abundance of background meteorological d a t a on t h e valley and atmospheric t ransport is not directly a f fec ted by
20
complex terrain. Furthermore, t h e valley has t h e largest concentrat ion of geothermal
resources in t h e U.S. and it is a n a r e a t h a t is likely to have rapid development. Results of t h e assessments on t h e toxic substances a r e expressed in t e r m s of a n individual's risk of
manifesting a particular response (e.g., p remature death, cancer , etc.) as well as population effects (e+, excess deaths). W e also examine t h e risk of incurring skin cancer
f rom t h e ingestion of drinking water contaminated with arsenic originating from
geothermal fluids. For t h a t assessment we perform a worst-case analysis of t h e skin
cancer risk due to drinking water f rom t h e Waikato River in New Zealand, which is
contaminated by d i rec t discharges of geothermal fluids f rom a power plant.
Risk Assessment Model and Uncertainty Analysis
An individual's risk of exhibiting a given heal th effect (e+, death, cancer , etc.) f rom exposure to a n atmospheric pollutant f rom a geothermal power plant is a function of
personal exposure to t h a t pollutant and t h e relationship between exposure and t h e
probability of effect. In our assessments of public heal th risks, w e use a multiplicative model with linear t e r m s t h a t has t h e following mathematical form:
where
R = a n individual's l i fe t ime risk of a n effect resulting from exposure to t h e pollutant, C = concentrat ion of pollutant in geothermal fluid, E = extract ion r a t e of geothermal fluid,
Q P = probability of a n effect due to unit pollutant exposure.
= annual-average ambient concentrat ion of pollutant per unit emission rate , and
Another multiplicative t e r m could be added to t h e model (i.e., x e / x ) t h a t re la tes t h e
predicted outdoor or ambient concentrat ion x with an effective concentrat ion Xe t h a t represents t h e composite indoor and outdoor concentrat ion an individual would b e exposed
to over a year. This t e r m would be especially applicable to a pollutant l ike sulfur dioxide, which is usually higher in outdoor a i r t h a n indoor air. 35936 However, because
t h e r e a r e insufficient d a t a on t h e indoor and outdoor concentrat ions for t h e pollutants w e
consider and on t h e l i fe s tyles of residents in rural areas of t h e western U.S. where most
of t h e geothermal resources a r e located, w e assume by defaul t t h a t y e equals x.
21

An accura te prediction of an individual's risk of a n adverse health effect resulting
from exposure to a pollutant in t h e environment is of ten difficult to obtain because of
uncertainties regarding es t imates of exposure as well as t h e dose-response function for t h e pollutant being assessed. Therefore, it is helpful to quantify t h e uncertainties to gain
a b e t t e r understanding of how they affect t h e prediction of health risk; A simple method of incorporating uncertainty into t h e multiplicative assessment model is to assume t h a t
t h e parameters a r e log-normally distributed and they a r e independent. uncertainties of t h e individual parameters c a n then be propagated to obtain an overall
es t imate of t h e uncertainty for t h e health risk by
3,37,38 The
where for example,
2 Var(1n R) = In u (R) and g
u (R) = geometr ic standard deviation of R. g
The geometr ic standard deviation u for each parameter can b e determined graphically or analytically; however, when sufficient d a t a a r e absent, it must b e determined
j udg men tally.
g
For cases where t h e model parameters a r e not log-normally distributed, different
methods must be employed to analyze uncertainties. One method is to use Monte Carlo
simulation (see, f o r example, Ref. 39). A s described by Schwarz and Hoffman,
The Monte Car lo procedure randomly selects a set of parameter values f rom a prespecified distribution for each input parameter and calculates t h e model output f o r those values. This process is repeated many t i m e s f o r other sets of randomly selected parameter values. The distribution of t h e predictions of al l i terat ions is considered to be a n e s t i m a t e of t h e distribution of t h e model output.40
An alternative approach is to construct f ini te probability distributions (FPDs), which
a r e truncated, discrete forms of continuous probability density functions (PDF& t h a t c a n b e combined numerically on a computer to obtain a n e s t i m a t e of t h e PDF for t h e output
of t h e model. With this method, each PDF is broken down into d iscre te probability intervals t h a t a r e subsequently combined using probabilistic a r i thmet ic to compute a PDF
of t h e model output. The Monte Carlo technique, in contrast , calculates a distribution function of t h e model output t h a t is a function of randomly selected parameter values; In
22
our assessments we employed t h e computer code MACRO1 developed by Edwards t h a t enables a user to propagate FPDs t h a t approximate continuous log-normal, normal,
uniform, log-linear, and triangular PDFs. 41
Effec ts of Hydrogen Sulfide
Atmospheric releases of hydrogen sulfide represent t h e most significant public health
concern of geothermal energy production. Hydrogen sulfide is a toxic gas42; at
concentrat ions above 1000 par t s per million by volume (ppmv) i t c a n cause respiratory
paralysis and above 200 ppmv this gas is sti l l dangerous and should b e recognized as a n imminent t h r e a t to life. Olfactory paralysis takes place at concentrat ions of 150 to
250 ppmv and consequently its charac te r i s t ic odor becomes undetectable at
life-threatening levels.34 The threshold for serious e y e damage is between 50 and
100 ppmv. Absorption of hydrogen sulfide through t h e lung o r t h e gastrointestinal t r a c t produces
toxic effects t h a t a r e believed to b e caused by t h e reversible inhibition of cellular
cytochrome oxidase by t h e undissociated f o r m of hydrogen sulf ide.42 However, hydrogen sulfide is detoxified in humans and animals by oxidation to benign sulfates. For example, guinea pigs c a n detoxify 85% of a single le thal dose of sulfide e a c h hour. This g a s is
considered a noncumulative poison because of t h e detoxification mechanism and because of its reversible inhibition of enzyme systems. There is no evidence t h a t indicates t h a t
hydrogen sulfide in a i r is carcinogenic, mutagenic, o r teratogenic. 43
From a public health perspective, odor annoyance ra ther than t h e a c u t e effects discussed above is t h e primary consequence of hydrogen sulfide emissions. The more
severe effects a r e unlikely because atmospheric dispersion of t h e g a s a f t e r re lease from a
power plant will typically result in nontoxic, ground-level concentrations. Anspaugh and
Hahn have reviewed t h e l i t e ra ture concerning t h e odor detect ion threshold of hydrogen
~ u l f i d e . ~ With one exception, most of t h e studies they examined agreed fairly well and
indicated t h a t t h e median threshold f o r odor perception is about 0.005 ppmv. In addition,
approximately 20% of t h e population c a n smell th i s g a s at a concentration of 0.002 ppmv. There is also some evidence t h a t chronic exposures to low levels of hydrogen sulfide may produce o ther health effects, primarily of a neurasthenic nature. For example, residents downwind of power units s i tuated at T h e Geysers resource a r e a have complained of headaches, nausea, sinus congestion, abrupt awakening, etc., when ambient levels were near 0.1 ppmv.
A primary issue therefore of geothermal energy development is t h e presence of undesirable odors in t h e vicinity of f u t u r e generating facilities. In evaluating t h e
potent ia l for odor annoyance, w e are basically concerned about t h e occurrence of short-
23
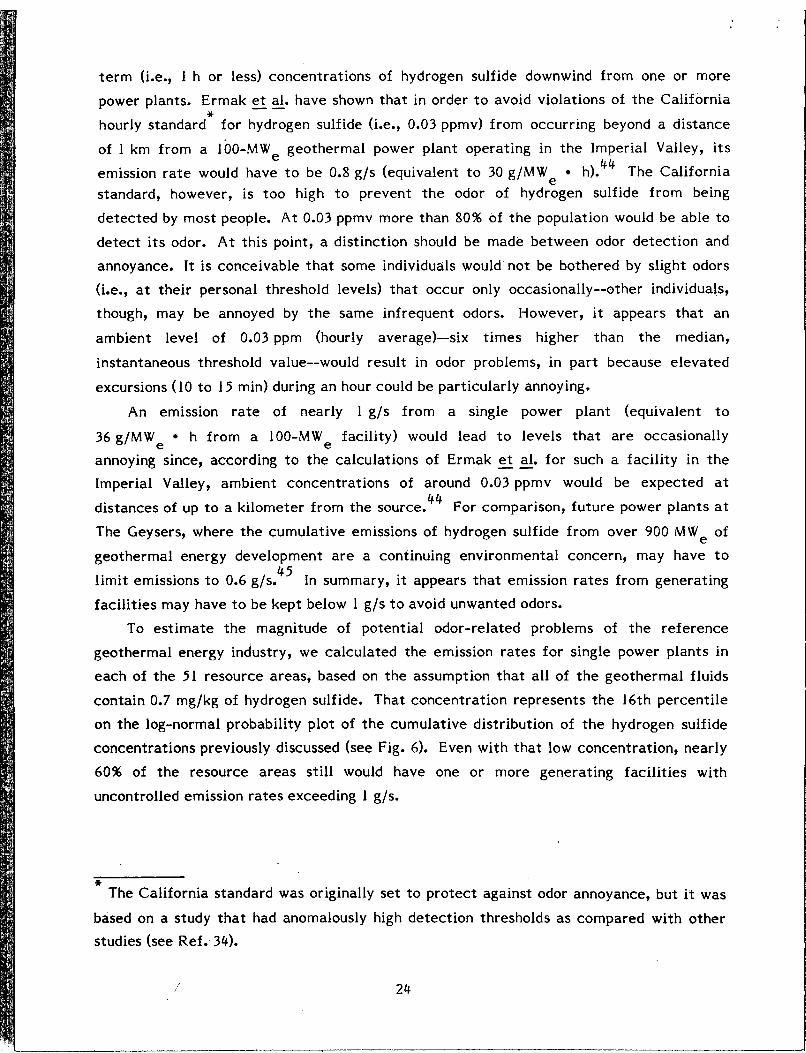
t e r m (i.e., 1 h o r less) concentrations of hydrogen sulfide downwind from one o r more
power plants. Ermak -- et al. have shown t h a t in order t o avoid violations of t h e California
hourly standard for hydrogen sulfide (Le., 0.03 ppmv) from occurring beyond a distance
of 1 km from a 100-MWe geothermal power plant operating in t h e Imperial Valley, its emission r a t e would have to b e 0.8 g/s (equivalent to 30 g/MW h).44 The California standard, however, is too high to prevent t h e odor of hydrogen sulfide from being de tec ted by most people. A t 0.03 ppmv more than 80% of t h e population would b e able to
d e t e c t its odor. A t th i s point, a distinction should b e made between odor detect ion and
annoyance. I t is conceivable t h a t some individuals would not be bothered by slight odors
(i.e., at their personal threshold levels) t h a t occur only occasionally--other individuals, though, may b e annoyed by t h e same infrequent odors. However, it appears t h a t a n
ambient level of 0.03 ppm (hourly average)--six t imes higher than t h e median,
instantaneous threshold value--would result in odor problems, in par t because elevated
excursions (IO to 15 min) during a n hour could b e particularly annoying.
*
e
An emission r a t e of nearly I g /s f rom a single power plant (equivalent to
36 g/MW, h f r o m a 100-MWe facil i ty) would lead to levels t h a t a r e occasionally annoying since, according to t h e calculations of Ermak -- et al. for such a facil i ty in t h e Imperial Valley, ambient concentrations of around 0.03 ppmv would b e expected a t
distances of up to a kilometer f rom t h e source.44 For comparison, fu ture power plants at
The Geysers, where t h e cumulative emissions of hydrogen sulfide from over 900 M W e of
geothermal energy development a r e a continuing environmental concern, may have t o
l imit emissions to 0.6 g/s. In summary, it appears t h a t emission r a t e s f rom generating
faci l i t ies may have to b e kept below I g/s to avoid unwanted odors.
To e s t i m a t e t h e magnitude of potential odor-related problems of t h e reference geothermal energy industry, we calculated t h e emission r a t e s f o r single power plants in
e a c h of t h e 51 resource areas, based on t h e assumption t h a t a l l of t h e geothermal fluids
contain 0.7 mg/kg of hydrogen sulfide. That concentration represents t h e 16th percent i le on t h e log-normal probability plot of t h e cumulative distribution of t h e hydrogen sulfide
concentrations previously discussed (see Fig. 6). Even with t h a t low concentration, nearly 60% of t h e resource areas sti l l would have one o r more generating facilities with
uncontrolled emission r a t e s exceeding I g/s.
45
* The California standard was originally set to protect against odor annoyance, but it was
based on a study t h a t had anomalously high detect ion thresholds as compared with o ther studies (see Ref. 34).
Effec ts of Sulfur Oxides
Hydrogen sulfide released from a geothermal power plant will oxidize in t h e
atmosphere t o sulfur dioxide, which is t h e n oxidized to su l fa te aerosols. The human
health effects of exposure to sulfur oxides have been examined in numerous laboratory and epidemiological studies (see, f o r example, Ref. 46). Studies dealing with t h e acute effects of inhalation of sulfur oxides generally indicate t h a t these effects a r e unlikely at
t h e ambient levels expected to occur as a result of t h e atmospheric oxidation of hydrogen sulfide. Our interest , therefore, is in t h e health response to long-term exposure to low
concentrat ions of sulfur oxides--specifically, a n individual’s risk of premature death. Epidemiological studies such as those carr ied out by Mendelsohn and O r ~ u t t ~ ~ and Lave and S e ~ k i n ~ ~ suggest t h a t t h e inhalation of par t iculate sulfates ra ther than sulfur dioxide
is a primary source of heal th risks associated with long-term, low-level exposure to polluted air. Work done by Amdur showing t h a t sulfate aerosols a r e a respiratory
i r r i tant49 would seem to support the i r findings. On t h e o ther hand, t h e epidemiological
studies a r e unable to de termine whether sulfate, which could actually b e correlated with
some o ther unmeasured, potentially toxic contaminant like respirable particles, is truly t h e cause of t h e health e f f e c t s (i.e., deaths). For this risk analysis, w e follow Wilson
- al. who suggest t h a t sulfate respresents a reasonable surrogate or subst i tute measure of
t h e health hazard of exposure to polluted atmospheres containing sulfur oxides and
par t ic les until fur ther heal th effects research is completed. 50
Health Risks of a Single Facility. More than half of t h e identified resource a r e a s have
energy potentials t h a t a r e below 150 M W e f o r 30 y, and consequently single power plants with generating capaci t ies of 150 M W e or less could conceivably b e used to develop these
resources. Our analysis of t h e heal th risks of sulfate exposure resulting from t h e atmospheric oxidation of hydrogen sulfide e m i t t e d from a single power plant is based on a I 00-M W f lashed-steam facil i ty operating with t h e s e re ference conditions: t h e hydrogen sulfide concentrat ion C in t h e geothermal fluids processed is 5.4 x g/kg and t h e
extract ion r a t e E is 1900 kg/s. The extract ion rate is based on a weighted average value of t h e r a t e s (in kg/MWe s) f o r flashed-steam power plants located in a l l of t h e resource areas. W e employed a Gaussian diffusion model developed by Ermak and
N yholm” to ca lcu la te t h e annual, ground-level concentrat ions of su l fa te (x) around t h e
reference facility.
*
e
* Most geothermal faci l i t ies will probably have generating capaci t ies less than 100 MW,,
but larger faci l i t ies at Wairakei, New Zealand (150 MW,) and C e r r o Prieto, Mexico
(150 MW,) have been constructed. 25
The model c a n s imulate t h e conversion of hydrogen sulfide to sulfur dioxide and then to sulfate as well as t h e deposition of al l t h r e e species onto t h e ground. The model was run with meteorological data (Le., joint probability of wind speed, wind direction, and
atmospheric stabil i ty) measured at a location in t h e cent ra l p a r t of t h e Imperial Valley. A conversion rate of 1.48 x 10⁻⁵/~ was used to represent t h e oxidation of hydrogen sulfide
t o sulfur dioxide52 and a r a t e of 2.78 x 10⁻⁶/s was used to represent t h e oxidation of
sulfur dioxide to ~ u l f a t e . 5 ~ The deposition velocity of hydrogen sulfide was taken to be
2 x m/s a f t e r Judeikis and Wren54; a value of 1 x IO-* m/s was used for sulfur
dioxide55; and finally, t h e deposition r a t e of sulfate aerosols was set equal to
1 x m / ~ . ~ ~ Simulation of t h e atmospheric diffusion, conversion, and deposition out
to a radius of 80 km f rom t h e plant showed a fairly uniform distribution of sulfate,
averaged over 16 wind sectors. The sector-averaged values of x/Q at 10 km increments
ranged from a high of 2.6 x pg s/m3 g at 10 to 20 km f rom t h e source to a low of
I .8 x ug s/m3 g at 80 km. The weighted average value over t h e 80 km radius was 2 x 10-411g* s/m3 g. For our e s t i m a t e of P, t h e probability of premature dea th from
exposure to part iculate sulfate, w e used a value of 3.5 x I O m 5 m3/% y, which is from a review made by Wilson et -- al. of existing epidemiological studies. 50
Some clarifying comments relating to t h e value of P should b e mentioned here.
First , w e have implicitly assumed t h a t at low levels of ambient sulfate, t h e dose-response
function is linear with no threshold of effects . if t h e c u r v e is actually concave at low
doses o r if it has a threshold, th i s assumption will lead t o over-estimates of health risk. I t is interesting to note, however, t h a t t h e epidemiological studies by Mendelsohn and
O r ~ u t t ~ ~ and Lave and Seskin" do support t h e l inearity assumption. Nevertheless,
inadequacies in t h e epidemiological studies (e+, uncontrolled confounding factors such as c i g a r e t t e smoking, inaccura te air-quality measurements, etc.) could conceivably act
toge ther to obscure t h e na ture of t h e relationship between sulfate exposure and
premature death. Indeed, at low concentrat ions sulfate exposure may not cause negative
heal th effects. Table 4 summarizes t h e values of t h e parameters employed in t h e sulfate risk
analysis and t h e corresponding geometr ic standard deviations for a case in which al l of t h e parameters are log-normally distributed. Using these values, we ca lcu la te a median
risk of sulfate-induced dea th R to be 7.2 x 10 /y for persons living within a radius of 80 km from a 100-MWe power plant. The u for R is about 1 I , and thus t h e upper and
g lower l imits to t h e es t imated 68% confidence interval a r e 7.9 x 10e7/y and 6.5 x 10⁻⁹/y. In our previous discussion on t h e possible effects of hydrogen sulfide emissions, we
indicated t h a t emissions f rom geothermal faci l i t ies may have to b e under 1 g/s to avoid
odors near plants. A t t h a t emission rate , t h e median health risk associated with a 100-MWe faci l i ty becomes 7 x 10⁻⁹/y,
-8
26
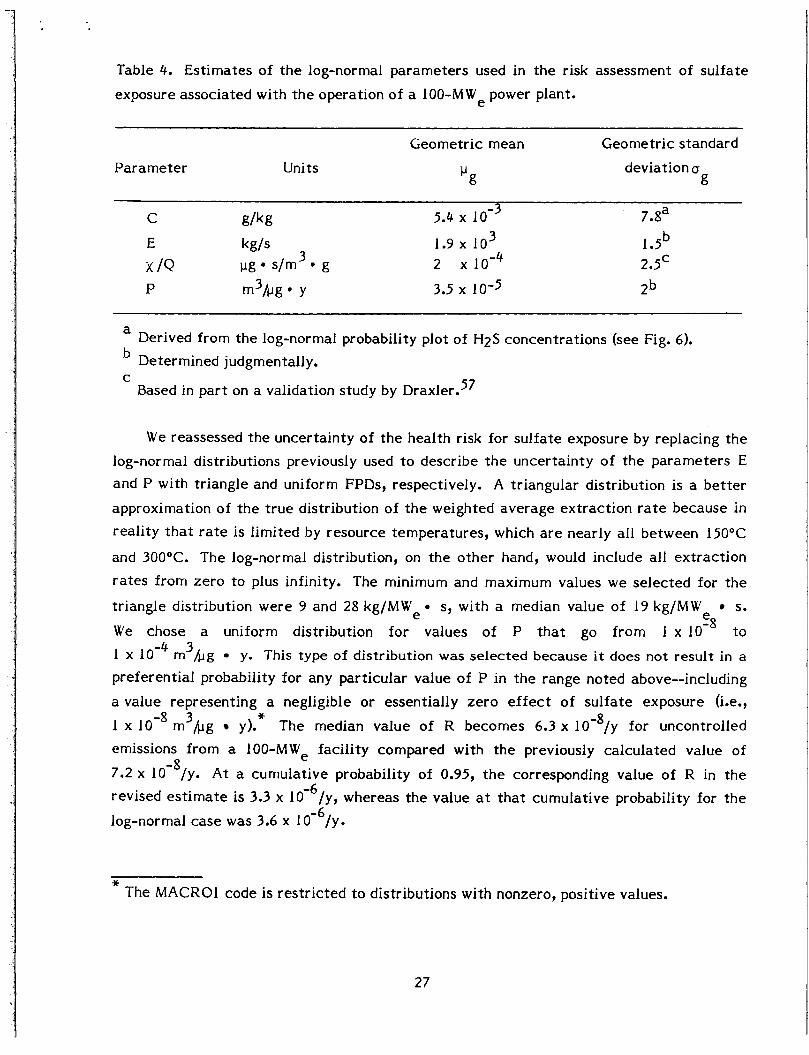
Table 4. Est imates of t h e log-normal parameters used in t h e risk assessment of su l fa te
exposure associated with t h e operation of a 100-MWe power plant.
Geometr ic mean Geometr ic standard deviation a % g
Parameter Units
7.8a b 1.5
2.5'
2b
a Derived from t h e log-normal probability plot of H2S concentrations (see Fig. 6). Determined judgmentally.
Based in p a r t on a validation s tudy by D r a ~ l e r . ~ ' C
W e reassessed t h e uncertainty of t h e health risk for sulfate exposure by replacing t h e
log-normal distributions previously used to describe t h e uncertainty of t h e parameters E and P with tr iangle and uniform FPDs, respectively. A triangular distribution is a b e t t e r
approximation of t h e t r u e distribution of t h e weighted average extract ion rate because in reali ty t h a t r a t e is limited by resource temperatures , which a r e nearly a l l between 150°C
and 300°C. The log-normal distribution, on t h e o ther hand, would include al l extract ion
r a t e s from zero to plus infinity. The minimum and maximum values w e selected for t h e
tr iangle distribution were 9 and 28 kg/MWe s, with a median value of 19 kg/MWe s.
We chose a uniform distribution f o r values of P t h a t go from 1 x to 1 x m 3 4 g y. This type of distribution was selected because it does not result in a preferent ia l probability for any particular value of P in t h e range noted above--including a value representing a negligible or essentially z e r o e f f e c t of su l fa te exposure (Le.,
1 x 10 The median value of R becomes 6.3 x 10⁻⁸/y for uncontrolled
emissions from a 100-MWe faci l i ty compared with t h e previously calculated value of
7.2 x 10⁻⁸/y. At a cumulative probability of 0.95, t h e corresponding value of R in t h e revised e s t i m a t e is 3.3 x 10⁻⁶/y, whereas t h e value a t t h a t cumulative probability for t h e
log-normal case was 3.6 x 10 /y.
-8 3 * m h g y).
-6
* The MACRO1 code is rest r ic ted to distributions with nonzero, positive values.
27
Health Risks of 3000 MW(e) in t h e Imperial Valley. In this analysis w e examine t h e sulfate-related heal th risks of developing 3000 MWe for 30 y at t h e Salton Sea, Brawley, Heber, and East Mesa geothermal resource a r e a s in t h e Imperial Valley. Because t h e
resource a reas are located relatively close to each other , atmospheric emissions from
e a c h resource area will contr ibute to t h e total changes in a i r quali ty across t h e valley. This is t h e only place in t h e U S . where increases in t h e ambient concentrations of
noncondensing gases and t h e associated heal th risks are significantly a f fec ted by t h e operation of power plants in t w o o r more adjacent resource areas. Table 5 contains t h e values w e used for t h e unabated emission r a t e s of hydrogen sulfide from 100-MW power
plants plus t h e assumed generat ing capaci t ies for each resource area. Ground-level
concentrations of su l fa te w e r e simulated using t h e s a m e conversion and deposition rates as in t h e single-source case along with site-specific meteorological d a t a for each resourcearea?' The sit ing pa t te rn of t h e power plants was from a previous study
completed by Ermak. Figure 11 (a) presents t h e regional isopleths of t h e predicted concentrations of sulfate
and t h e associated risks of premature dea th f rom chronic exposure to t h e atmospheric sulfate. Most of t h e risks fall in t h e range of 2 x 10⁻⁶/y to just over 4 x 10⁻⁶/y. If
hydrogen sulfide emissions a r e lowered to 1 g/s to l imit odor annoyances (except at t h e
Heber resource a r e a where power plant emissions a r e a l ready below 1 g/s), t h e risk levels
fa l l to between 1 x 10-77/y and 2 x 10'7/y (see Fig. 1 l(b)). For t h e case of uncontrolled
emissions of hydrogen sulfide, w e calculated a population exposure of 4.6 x 10 pg persons/m for residents of nine municipalities in t h e valley, representing over 80% of t h e valley's population. The population exposure for t h e controlled case was
2.9 x 10 pg persons/m . The associated population risks for those two cases were 0.16 and 0.01 excess dea ths per year, respectively. Over 30 y t h e corresponding number of
dea ths would be 4.8 and 0.3.
e
59
3 3
2 3
Cumulative Health Risks. An FPD for R, t h e number of premature deaths expected for
t h e re ference industry, was calculated by multiplying t h e FPDs of C, x/Q, and P (see Table 4) and a fourth variable equal to t h e sum of t h e product of t h e extraction rates of
geothermal fluids and t h e number of persons at risk (those living within a n 80 k m radius of a resource a r e a ) for each of t h e 51 resource areas. W e assumed t h a t this last variable
10 is normally distributed having a mean of 3.9 x 10 kg persons/s and a s tandard deviation of 9.7 x 10 kg person/s. With 21,000 MWe of energy production and no
control of hydrogen sulfide emissions, t h e mean number of premature dea ths each year is predicted to be 23; at t h e 95th cumulative percentile, t h e r e are 64 premature dea ths per
year. In contrast , t h e mean rate of premature dea ths would b e reduced to about 0.3/y (a t
9
28
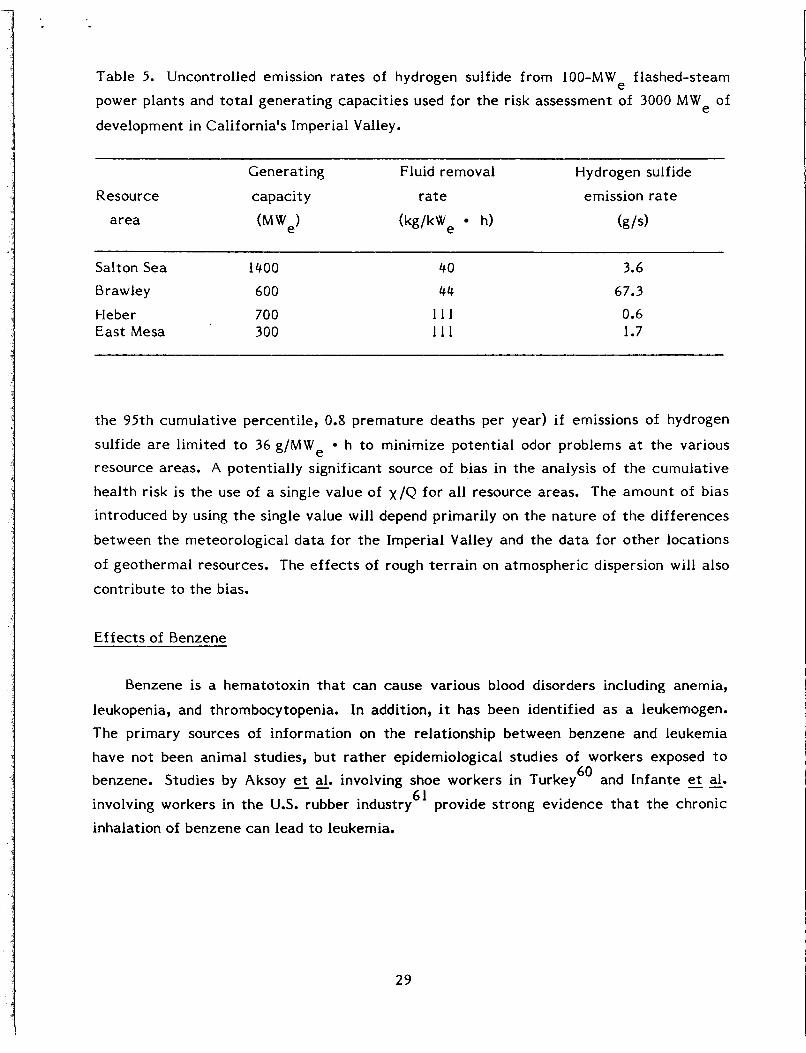
Table 5. Uncontrolled emission r a t e s of hydrogen sulfide from 100-M We f lashed-steam power plants and t o t a l generating capaci t ies used for t h e risk assessment of 3000 M W e of
development in California's Imperial Valley.
Resource
a r e a
Generating Fluid removal Hydrogen sulfide
capaci ty r a t e emission r a t e
(MW,) (kg/kW e h) (g/s)
Salton Sea Brawley
Heber East Mesa
1400 600 700 300
40
44
1 1 1 1 1 1
3.6
67.3 0.6 1.7
t h e 95th cumulative percentile, 0.8 premature dea ths per year) if emissions of hydrogen
sulfide a r e limited to 36 g/MWe h to minimize potential odor problems at t h e various resource areas. A potentially significant source of bias in t h e analysis of t h e cumulative health risk is t h e use of a single value of x /Q f o r a l l resource areas. The amount of bias introduced by using t h e single value will depend primarily on t h e na ture of t h e differences
between t h e meteorological d a t a for t h e Imperial Valley and t h e d a t a for o ther locations
of geothermal resources. The effects of rough te r ra in on atmospheric dispersion will also
contr ibute to t h e bias.
Ef fec ts of Benzene
Benzene is a hematotoxin t h a t c a n cause various blood disorders including anemia,
leukopenia, and thrombocytopenia. In addition, it has been identified as a leukemogen.
The primary sources of information on t h e relationship between benzene and leukemia have not been animal studies, but ra ther epidemiological studies of workers exposed to benzene. Studies by Aksoy -- et al. involving shoe workers in Turkey6' and Infante -- et al.
involving workers in t h e US. rubber industry6' provide strong evidence t h a t t h e chronic inhalation of benzene c a n lead to leukemia.
29
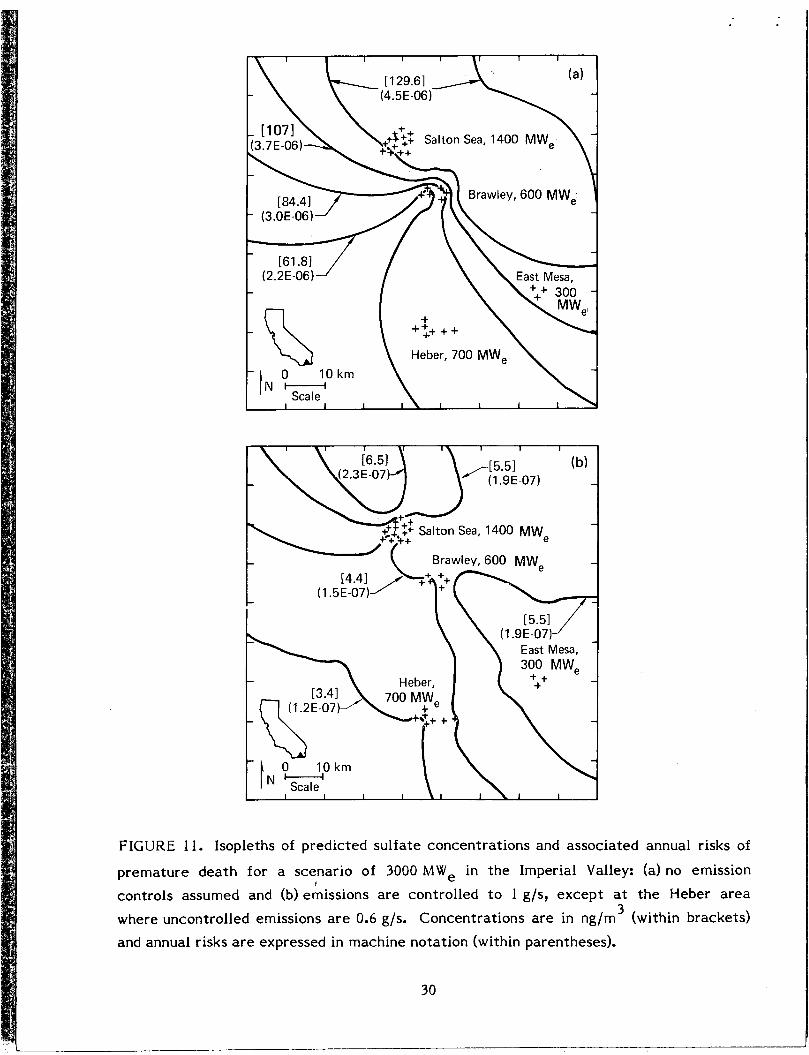
FIGURE 1 . Isopleths of predicted su l fa te concentrations and associated annual risks of
premature d e a t h for a scenario of 3000 MWe in t h e Imperial Valley: (a) no emission controls assumed and (b) emissions a r e controlled to 1 g/s, except at t h e Heber a r e a where uncontrolled emissions a r e 0.6 g/s. Concentrations a r e in ng/m (within brackets) and annual risks a r e expressed in machine notation (within parentheses).
3
30
Health Risks of a Single Facility. Table 6 summarizes t h e parameter values used in t h e
risk assessment of a single 100-MWe facility. The value of C is based on t h e following
assumptions: noncondensing gases f rom wells completed in geothermal reservoirs formed
of sedimentary and/or metamorphic rocks have a p of 10 ppmv, t h e noncondensing gases
a r e composed almost entirely of carbon dioxide, t h e noncondensing gases a r e I % by weight in s team, and 0.2 kg of s team is produced per kilogram of geothermal fluid. The
e s t i m a t e of t h e l i fe t ime probability of leukemia per average l i fe t ime exposure to
atmospheric benzene P is t h e geometr ic mean of es t imates of P derived from t h r e e separa te epidemiological studies. The sector-averaged values of x /Q range from
0.08% s/m g at IO km to 0.003%. s/m g at 80 km (we assume t h a t there is no deposition or conversion of benzene). Those concentrat ions must b e converted to l i fe t ime
equivalent levels by multiplying them by 30/70, t h e rat io of t h e number of years of
geothermal energy production to t h e average l ife expectancy. The corresponding values
of R at dis tances of 10 and 80 km a r e approximately 2 x , respectively.
T h e u f o r t h e predicted risks of leukemia is 11.
g
62
3 3
-9 and 7 x 10
g
Health Risks of 3000 MW(e) in t h e Imperial Valley. The only published d a t a on benzene levels in geothermal fluids f rom t h e Imperial Valley a r e for two wells located at t h e East Mesa resource area. The benzene conten t in t h e noncondensing gases of t h e geothermal fluids t h a t were sampled ranged from 0.015 to 0.065 w t % (85 to 370 ppmv). These values
a r e considerably higher than benzene levels measured elsewhere (see t h e ear l ier discussion on benzene concentrat ions in noncondensing gases) and they should b e
verified. We therefore used t h e value of C shown in Table 6 (Le., 4 x 10 g/kg of geothermal fluid) to represent t h e typical concentration of benzene dissolved in
geothermal fluids at East Mesa as well as t h e o ther resource areas. The emission r a t e s for 100-MW power plants in t h e four resource a r e a s a r e as follows: 0.12 g/s for t h e
Heber and East Mesa areas, 0.05 g/s for Brawley, and 0.04 g/s for Salton Sea (see Table 5
for t h e generating capaci t ies and fluid removal r a t e s used in t h e analysis of t h e
3000-MW scenario). Essentially a l l of t h e l i fe t ime risks of leukemia fel l between 1.6 x IO- (corresponding to a l i fe t ime equivalent concentrat ion of 0.2 &m and 1.6 x 10 ( a t 0.002 pg/m 1. The est imated number of premature dea ths among residents of t h e valley's cities is 0.01 over 30 y.
-5
e
8 3 -8 3
Cumulative Health Risks. To ca lcu la te t h e cumulative health risks of exposure to benzene emi t ted from geothermal facilities at t h e 51 resource areas, w e must make some
simplifying assumptions. First , and foremost, w e assume t h a t t h e p of benzene g
concentrations in geothermal fluids is 0.04 mg/kg with a u of 8, t h a t is, t h e es t imated g
31
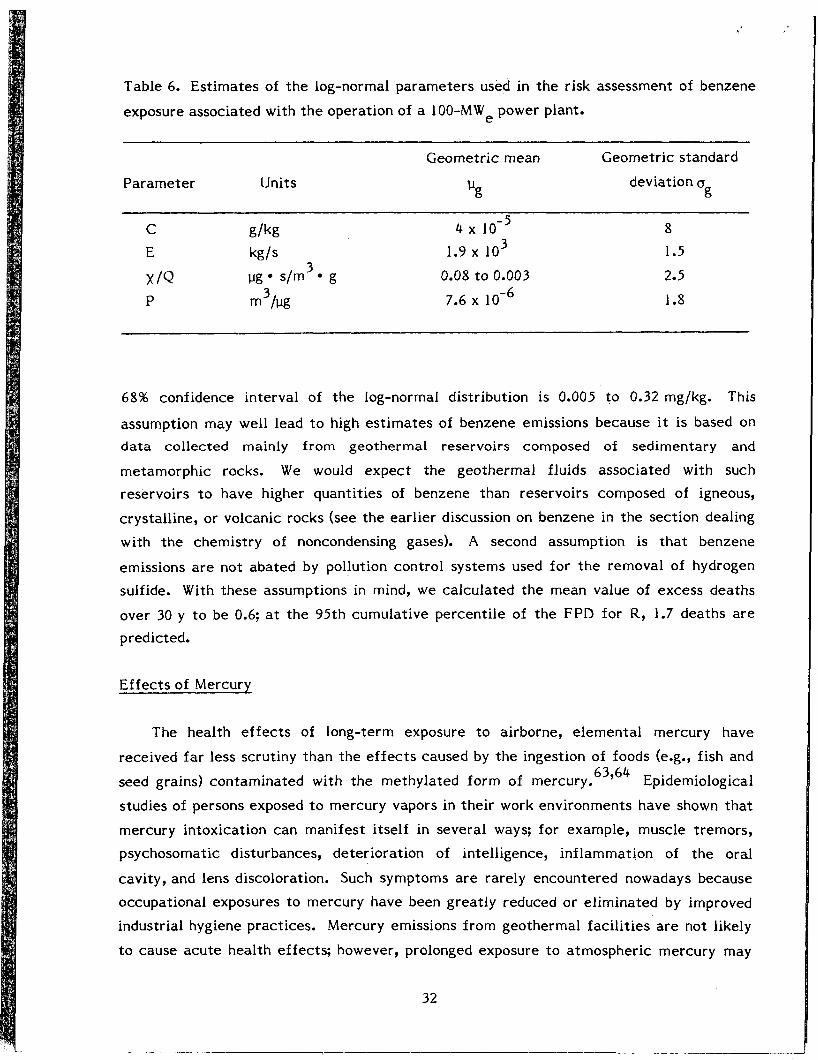
Table 6. Estimates of t h e log-normal parameters used in t h e risk assessment of benzene
exposure associated with t h e operation of a 100-MWe power plant.
Geometr ic mean Geometric standard
deviation 0 ug g
Parameter Units
4 3
C g/kg
x / Q vg s/m g
E kg/s 1.9 x 10 3
P m3/l% 7.6 x
0.08 to 0.003
8 1.5
2.5
1.8
68% confidence interval of t h e log-normal distribution is 0.005 to 0.32 mg/kg. This
assumption may well lead to high es t imates of benzene emissions because it is based on data collected mainly f rom geothermal reservoirs composed of sedimentary and
metamorphic rocks. W e would expec t t h e geothermal fluids associated with such reservoirs to have higher quantit ies of benzene than reservoirs composed of igneous,
crystalline, or volcanic rocks (see t h e ear l ier discussion on benzene in t h e section dealing with t h e chemistry of noncondensing gases). A second assumption is t h a t benzene
emissions a r e not abated by pollution control systems used for t h e removal of hydrogen sulfide. With these assumptions in mind, we calculated t h e mean value of excess dea ths
over 30 y to b e 0.6; at t h e 95th cumulative percent i le of t h e FPD for R, 1.7 deaths a r e predicted.
Ef fec ts of Mercury
The health effects of long-term exposure to airborne, e lemental mercury have
received f a r less scrutiny than t h e effects caused by t h e ingestion of foods (e+, fish and
seed grains) contaminated with t h e methylated form of mercury. 63764 Epidemiological
studies of persons exposed to mercury vapors in their work environments have shown t h a t
mercury intoxication can manifest i tself in several ways; for example, muscle tremors, psychosomatic disturbances, deterioration of intelligence, inflammation of t h e oral
cavity, and lens discoloration. Such symptoms a r e rarely encountered nowadays because occupational exposures to mercury have been great ly reduced or eliminated by improved
industrial hygiene practices. Mercury emissions from geothermal faci l i t ies a r e not likely
to cause a c u t e health effects; however, prolonged exposure to atmospheric mercury may
32
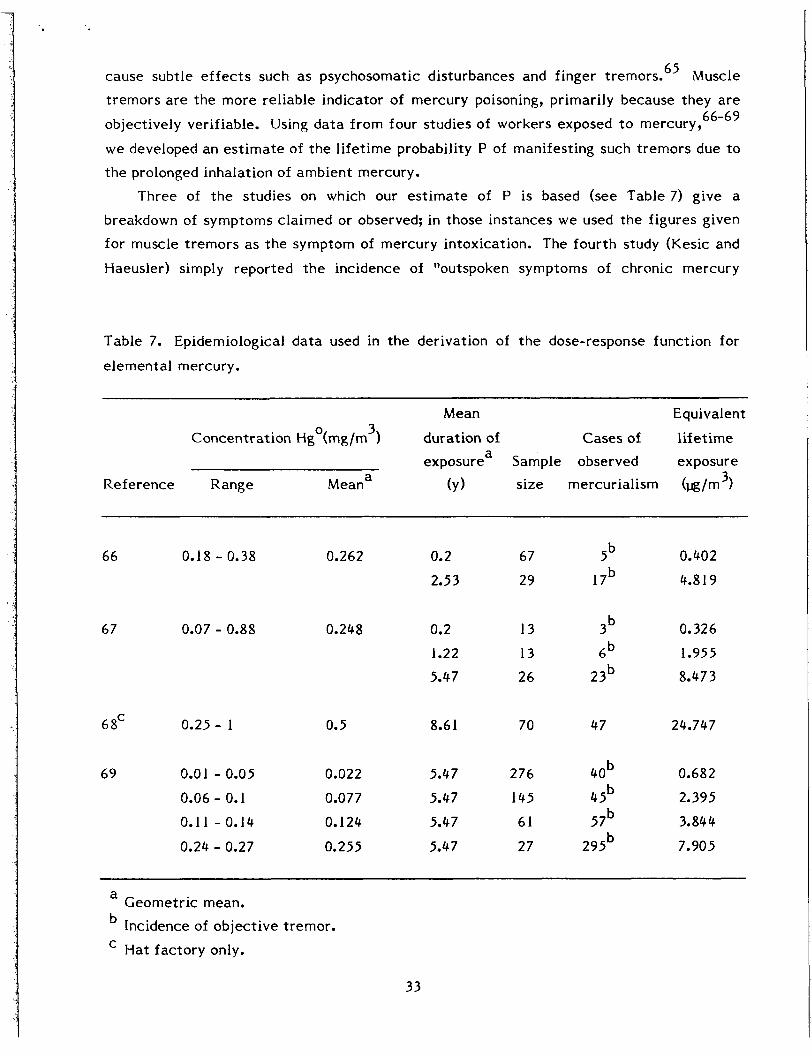
cause subtle effects such as psychosomatic disturbances and finger tremors.65 Muscle
t remors a r e t h e more reliable indicator of mercury poisoning, primarily because they a r e
objectively verifiable. Using d a t a f rom four studies of workers exposed t o mercury,
w e developed an e s t i m a t e of t h e l i fe t ime probability P of manifesting such t remors due to t h e prolonged inhalation of ambient mercury.
66-69
Three of t h e studies on which our e s t i m a t e of P is based (see Table 7) give a
breakdown of symptoms claimed o r observed; in those instances w e used t h e figures given
f o r muscle t remors as t h e symptom of mercury intoxication. The fourth study (Kesic and
Haeusler) simply reported t h e incidence of "outspoken symptoms of chronic mercury
Table 7. Epidemiological d a t a used in t h e derivation of t h e dose-response function for
e lemental mercury.
Mean Equivalent
duration of Cases of l i fe t ime exposure Sample observed exposure
3 Reference Range Meana (Y) s ize mercurialism (pg/m )
3 Concentrat ion Hgo(mg/rn 1 a
66 0.18 - 0.38 0.262 0.2
2.53
67 0.07 - 0.88 0.248 0.2
1.22
5.47
6 8' 0.25 - 1 0.5 8.6 1
69 0.01 - 0.05 0.022 5.47
0.06 - 0.1 0.077 5.47
0.11 - 0.14 0.124 5.47
0.24 - 0.27 0.255 5.47
67 gb
29 1 7b
1 3 g b 13 gb
26 23b
70 47
276 40b
145 45b
61 57b
27 295b
0.402
4.819
0.326
1.955
8.473
24.747
0.682
2.395
3.844
7.905
a Geometr ic mean. Incidence of objective tremor.
Hat fac tory only.
33

poisoning" with no breakdown,68 so w e ut i l ized- t h e single figure reported. W e conservatively assumed t h a t t h e dose-response function f o r mercury is l inear without a n
' effects threshold because mercury has no known metabolic function and no human
threshold has y e t been d e m ~ n s t r a t e d . ~ ' Our e s t i m a t e of P was calculated as t h e geometr ic means of t h e individual P values weighted by t h e sample sizes of t h e four studies. Expressed mathematically,
0.07 m3/w .
where
Pi = ratio of t h e incidence of effects reported in study i to t h e l i fe t ime exposure
Si = ratio of sample size in study i to t h e number of t o t a l samples in all four studies. equivalent for t h e same study and
The above value for P is almost certainly too large. I t would suggest for example 3 t h a t a resident of New York City, where ambient mercury is on t h e order of 0.01 pg/m ,
f a c e s a risk of 7 in 10,000 of developing mercury-induced tremors. One possible source of
error, of course, is t h a t humans may in fact have some dose-response threshold; another source is t h e body's c learance mechanism. In extrapolating public exposure-response
curves f rom d a t a on occupational o r other exposures of l imited duration, one must f i r s t conver t t h e response to lifetime-exposure equivalents. The most conservative way to do th i s (and t h e way used in deriving t h e value of P above) is to assume response is entirely a function of t h e cumulative exposure independent of its t i m e distribution. Thus
1 8 h 240 d o = E . - - . . - . - - € 1 o 24 h 365 d A. 9 ( 5 )
where
= equivalent l i fe t ime concentration of mercury to which a n individual is exposed, €1 E = concentration of mercury in t h e workplace,
T = duration of occupational exposure, and
A. = a g e of exposed worker.
0
0
34
In fact, however, mercury is cleared from t h e body at some r a t e C such t h a t
( I - e-") , Bt - c D - -
where B body burden at t i m e t,
D = dose ra te , and
C = c learance rate .
t
Note t h a t as t increases, Bt approaches D/C; at a sufficiently large t therefore, 6,
reaches a virtual equilibrium. Unfortunately, while t h e clearance r a t e of e lementa l
mercury is known for several organs, it is not known for t h e brain, t h e cr i t ical organ for chronic exposures. The available evidence suggests t h a t i t remains in t h e brain f a r longer
than in o ther organs, with a half t ime possibly as long as several years.71 While it is probable therefore t h a t t h e cumulative-exposure model overest imates t h e risk of inhaled
mercury, we do not know by how much. However, since t h e r a t e of c learance from t h e brain is evidently much slower than t h e whole-body ra te , w e can at leas t e s t i m a t e a lower
bound for risk by set t ing t h e brain c learance r a t e equal to t h e body rate. With a value of 50 d for t h e whole-body halftime,71 t h e value of P is roughly a n order of magnitude lower
than t h e value based on t h e cumulative-dose model.
Health Risks of a Single Facility. The reference 100-MWe power plant relying on
geothermal fluids containing 0.003 mg/kg of elemental mercury will e m i t 4.6 x g/s of mercury to t h e atmosphere (Le., 81% of t h e total mercury originally contained in t h e
fluids). Existing d a t a on t h e atmospheric chemistry of mercury indicate t h a t i t is relatively stable. For example Lindberg, in a study of t h e mercury conten t of t h e plume
from a coal-f ired power plant, found no evidence of vapor-to-particle conversion at
distances up to 22 km from t h e plant. Assuming no deposition o r oxidation of mercury,
t h e weighted average value of x/Q over a n 80 km radius around t h e facil i ty is
8.7 x 10⁻³ug s/m pg ; t h e equivalent l i fe t ime value is 3.7 x 10 g s/m pg. An
individual's l i fe t ime risk R of manifesting muscle t remors resulting from t h e mercury emissions of t h e reference faci l i ty is 1.2 x The ua f o r R is 3.8, and it is based on
72
3 -3 3
6 these values of u u ( x / Q ) = 2.5, a n d a (P) = 2.
for t h e o ther parameters in t h e risk model: u (C) = 1.7, u (E) 1.5, g g g
g g
35
Health risks of 3000 MW(e) in t h e Imperial Valley. To predict increases in ambient concentrations of mercury from 3000 MWe of development in t h e valley, w e used t h e
following mercury emission r a t e s for 100-MW power plants located in these four -3 resource areas: Salton Sea area, 1.6 x 10 g/s; Brawley area, 3 x 10⁻³g/s; Heber area,
-2 7.5 x and East Mesa area, 1.5 x 10 g/s. The predicted concentrations of mercury 3 3 in t h e valley ranged from a high of 96 ng/m to below 0.5 ng/m . The equivalent l i fe t ime
3 concentrat ions corresponding to those predicted levels a r e 41 and 0.2 ng/m , assuming
t h a t energy production las ts 30 y and a n average life expectancy of 70 y. The population risk f o r people living in t h e valley's cities and towns is calculated to be 7.6 cases of
mercury-induced muscle tremors. The population risk we have calculated should b e considered a n upper-bound e s t i m a t e for t w o reasons--first, w e have neglected t h e e f f e c t of mercury clearance from t h e brain, and second, w e have used a linear, no-threshold
dose-response curve.
e
Cumulative Health Risks. For our analysis of t h e cumulative effects of mercury
exposure, we assumed tha t t h e geometr ic mean of t h e geothermal fluids was 0.003 mg/kg of mercury and 81% of t h e mercury contained in t h e fluids processed for energy
production was released to t h e atmosphere. For 21,000 MWe of development, t h e mean
number of cases of mercury-induced t remors is calculated to b e 55, while at t h e 95th
cumulat ive percent i le 164 cases a r e expected.
Ef fec ts of Radon
Considerable a t tent ion has been devoted to deriving risk f a c t o r s for t h e induction of
lung cancer f rom exposure to radon and its short-lived daughters. This is because of t h e
documented excess incidence of lung cancer among miners exposed to high levels of radon
and its daughters underground. Several such studies have been reviewed recent ly in t h e
BEIR-I11 report.73 They conclude t h a t t h e risk es t imates "now range from about 6 to 47
cases per IO PY per WLM." They fur ther conclude, 6
The most likely risk est imates , a t exposure of about I WL and with 6 charac te r i s t ic smoking experience, a r e about 10 cases per 10 PY per WLM
f o r t h e a g e group 35-49, 20 cases per IO6 PY per WLM for t h e a g e group 50-65, and about 50 cases per IO6 PY per WLM f o r those over 65. These values apply to t h e a g e at diagnosis and a r e consistent with available followup data.73
36
In t h e quotes above, PY is t h e person-years at risk and is generally calculated by assuming a la ten t period of 10 y and risk then lasting f o r life.73y74 The unit of exposure
LLL is t h e working level (WL) and is equal to 100 pCi/liter of Rn in equilibrium with its
daughters. The unit of integrated exposure is working level month (WLM), where month is equal to 170 h (of occupational exposure).
These risk es t imates a r e based on a linear dose-effect relationship and have been
crit icized as being at least a n order of magnitude too high. If w e a c c e p t t h e m at face value, assume a log-normal distribution of risks, and assume t h a t 6 and 47 cases per 10 PY per WLM a r e at t h e 5% and 95% probability levels, then p = 20 x 10
Cohen has applied t h e age-specific risk fac tors to t h e U.S. population and has
75
6 -6 and 0 = 2. g g
calculated t h a t 21,765 cases of lung cancer per year a r e predicted based on a calculated
exposure to background levels of radon of 0.22 WLM/year. From this w e c a n der ive a n
age- and sex-averaged absolute risk f a c t o r of 1 x 10 per WLM. Cohen also notes t h a t
compared on a n equivalent basis, t h e UNSCEAR derived value76 is about t h r e e t i m e s 77 -4
lower.
per WLM and fur ther assume t h a t t h e range is f rom 0 to 1 x
74
-3
W e have therefore somewhat arbitrari ly chosen t o use a risk f a c t o r of 5 x 10
per WLM.
W e then proceed with t h e calculation of P as follows :
24 h 365 d M 5 3 170 h 9
liter! . 30 . -. -. m 3 100 pcl d Y
P = 10 l i t e r
(7) P = 8 x d / p C i .
5 Health Risks of a Single Facility. T h e re ference 100-MWe facil i ty e m i t s 9.76 x 10 pCi/s of 222Rn. That emission r a t e results in sector-averaged concentrations of 222Rn ranging
3 3 f rom 0.08 pCi/m at 10 km to 0.003 pCi/m at 80 km. An individual’s risk of lung cancer R from 30 y of exposure to those levels is 6.4 x and 2.4 x for 10 and 80 km respectively, with P equal to 8 x 10 m /pCi (Le., t h e
basic risk factor is I x 10-3/WLM) t h e corresponding values of lung cancer risk at t h e two distances a r e 1.3 x
-6 3 -5 3 m /pCi. For P equal to 1.6 x 10
8 and 4.8 x IO- .
Health Risks of 3000 MW(e) in t h e Imperial Valley. Ambient concentrat ions of 222Rn in
t h e valley were calculated with t h e multiple-source Gaussian dispersion model using t h e
following emission r a t e s for 100-MWe power plants in t h e four geothermal resource
areas: Salton Sea area, 9 x 10 pCi/s; Brawley area, 6 x 10 pCi/s; Heber a rea , 1.6 x 10 pCi/s; and East Mesa 1.5 x 10 pCi/s. The t o t a l population exposure to 222Rn
5 5 6 6
1
among urban residents ~- of t h e valley was calculated to b e 5.7 x IO4 pCi persons/m’. -6 3 With P equal to 8 x 10
exposure.
m /pCi, w e would expect about 0.5 lung cancers f rom 30 y of
37

Cumulative Health Risks. In our analysis of t h e cumulat ive health risks of 222Rn
emissions, w e assumed t h a t a l l geothermal fluids contain 508 pCi/l i ter of 222Rn, t h e geometr ic mean concentrat ion of 1 18 samples of geothermal waters analyzed by O'Connell and K a ~ f m a n . 3 ~ The mean value of t h e FPD for variable R, representing the
cases of lung cancer over 30 y, is 8.5, and at t h e 95th cumulative percentile 26 cases a r e
expected.
Arsenicalism
Although t h e inhalation of toxic gases is t h e primary source of public heal th risks,
t h e chronic ingestion of groundwater or sur face water contaminated with arsenic derived
f rom geothermal fluids could also cause negative heal th effects, including skin cancer.
Normally, residual geothermal fluids will b e injected back in to a geothermal reservoir f o r
disposal, thus isolating t h e spent fluids f rom drinking water supplies. Nevertheless, if a n
injection well is improperly constructed, it is conceivable t h a t injected fluids could
escape to a n aquifer containing potable water. Accidental spills to surface waters a r e a lso possible.
To de termine t h e upper-bound level of individual risk for potent ia l arsenic
contamination, w e chose to assess t h e risks of directly discharging fluids t o surface waters. The case we chose for analysis is t h e operation of t h e Wairakei geothermal
power plant in New Zealand, which is undoubtedly t h e worst example of how drinking water c a n b e contaminated by fluid disposal. Since 1964 t h a t plant has discharged a l l of its was te geothermal fluids in to t h e Waikato River, t h e source of drinking water for a local town. Axtmann calculated a n increase of 39 pg/liter in t h e arsenic concentrat ion of t h e river under average flow conditions because of t h e geothermal discharge^.^^ Under
low flow conditions, t h e incremental concentrat ion could b e as high as 250 &liter. W e have calculated t h e arsenic concentrat ion in t h e spent geothermal fluids f rom Wairakei
and compared it with concentrations of total arsenic f rom other resources in Table 8.
of t h e simple model of t h e US. EPA";
W e e s t i m a t e t h e incremental risk of developing skin cancer through t h e use
where
R' = a n individual's l i fe t ime risk of developing skin cancer f rom drinking water
containing arsenic, C' = concentration of arsenic in drinking water in pg/liter, and P' = l i fe t ime probability of incurring cancer due to drinking water contaminated
with arsenic in liter/%.
38

Table 8. Concentrations of total arsenic in geothermal fluids f rom t e n geothermal
resource areas.
Geothermal resource a r e a
Arsenic concentrat ion
(mg/li ter) Reference
Wairakei, New Zealand
Broadlands, New Zealand Ahuachapan, El Salvador
Hatchobaru, Japan Cerro Prieto, Mexico
Salton Sea, California Brawley, California
Heber, California East Mesa, California
The Geysers, California
2.7
3.3
11.3
3.2 0.5 - 2.2
I 1
2.6
0.1
0.2
< 0.004
78 19
19
19 29
79
79
79
79
80
The value of P' has been derived by t h e US. EPA and is 4 x per pg/liter.81 This
value is based entirely upon epidemiological studies of Taiwanese exposed to high
concentrations of arsenic in drinking water f rom ar tes ian wells. 82983 There is
information t h a t indicates t h a t t r ivalent arsenic was t h e predominant form of arsenic
present in t h e groundwater,81 instead of t h e less toxic pentavalent form t h a t is usually
encountered in natural waters. The Wairakei geothermal fluids could also contain a significant amount of arsenic in t h e t r ivalent state because anaerobic conditions in t h e geothermal reservoir would probably l imit its oxidation to t h e pentavalent form. Data supporting this assumption a r e f rom a study conducted by Crecel ius et al. of arsenic
speciation in t h e geothermal fluid from a well supporting t h e C e r r o Pr ie to power plant in
Mexic0 .2~ They found t h a t t h e arsenic in t h e geothermal fluid prior to atmospheric
exposure was 78% tr ivalent arsenic and 22% pentavalent arsenic. Additional information
t h a t corroborates t h e presence of t r ivalent arsenic in t h e Wairakei geothermal fluids is
from Coulter who reports t h a t t r ivalent arsenic represents as much as 70% of t o t a l
arsenic in sediments in a lake fed by t h e contaminated Waikato River.85 Assuming t h a t t h e speciation of arsenic in t h e Waikato River is similar to t h a t of t h e arsenic in t h e
drinking water consumed by t h e Taiwanese and t h a t t h e r e a r e no significant genet ic o r dietary differences between t h e populations at risk, t h e incremental cancer risk of
84
- -
39

chronic ingestion of geothermal arsenic dissolved in t h e Waikato River would b e about 2 1.6 x 10- . W e e s t i m a t e values of o to b e 2.4 and 2 for C' and P', respectively; and
therefore 3 for R'. g
This calculated risk is surprisingly high, and we suggest t h a t it should be viewed with
caution. As mentioned above, t h e value f o r P' was taken f rom t h e U.S. €PA, and is
based on a linear, no-threshold, dose-response model. This, in fact, is almost cer ta inly not t h e case since arsenic has been shown to b e a n essential element. 86987 And because it
is essential, t h e dose-response relationship exhibits t h e U-shaped curve shown in Fig. 12.
A t low intake levels homeostasis exists, but as arsenic in take decreases t o some as y e t
unspecified level, negat ive effects related to deficiency a r e manifested.88 The l inear threshold or no-threshold model, in contrast , erroneously predicts toxic effects at t h e
intake levels t h a t a r e required for homeostasis. Moreover, at even lower intake levels,
81
t h e linear no-threshold model predicts increasingly smaller probabilities of skin cancer, when in reali ty t h e probabilities of o ther harmful effects a r e increasing.
Other studies indicate t h a t mammals have a detoxification mechanism of methylation'' and t h a t vitamin C c a n counteract t h e toxic effects of arsenic
i n g e ~ t i o n . ~ ' Further , Valentine - - et al. report t h a t "arsenic levels in water at "9 1 concentrat ions of 100pgl l i ter o r less seem not to produce a n undue body burden.
Thus, w e conclude t h a t a threshold probably does exist for t h e production of skin cancer
and 39 &/li ter may b e below t h e threshold level.
OCCUPATIONAL HEALTH
T h e geothermal industry in this country is relatively immature and has developed a significant s t a r t only at The Geysers vapor-dominated resource. Even here, t h e design of
a typical power plant has only begun to stabil ize after going through progressively major
changes to accomplish aba tement of hydrogen sulfide emissions. Because of t h e evolving
na ture of t h e industry, industrial hygiene problems have arisen as a result of initial design
or changes and have then been reduced as problems were recognized and brought under control. A good example of this was a dramat ic rise in occupational health problems
when hydrogen sulfide aba tement was f i r s t t r ied on a large scale with a retrof i t ted system.92 This problem has since been brought under control with additional
occupational hygiene e f f o r t s and newer designs of control technology equipment. As a result of these perturbations and of t h e small size of t h e industry, however, t h e r e a r e no
occupational health s ta t i s t ics t h a t c a n be applied directly to a full-scale industry.
40

C 2 In w
No effect - (homeostasis) _ _
/ I
Nonessent ia I
1 - Mw e m en t s
v) + 0 a,
a, + +
V X 0 c
.-
Increasing intake or dose-
88,89 FIGURE 12. Dose-response curves for essential and nonessential elements.
The geothermal industry must deal with a wide variety of potential occupational hazards. The na ture of these hazards has been described in detai l by Hahn 92993 and also
summarized by Zerwas -- et al. Briefly, t h e industry can b e visualized as going through t h e following stages.
94
1. Exploration of t h e resource.
2. Well drilling and testing. 3. Power plant construction.
4. Power plant operation and maintenance (may include re t rof i t ted control
technology devices). Power plant and field decommissioning. 5.
The s tages of most concern f rom a n occupational health standpoint a r e 2 and 4. T h e
geothermal industry is somewhat unique in t h a t it must deal with very large volumes of fluids t h a t a r e very hot and under pressure, but these fluids a r e externally generated. If something goes wrong, these may b e very difficult to stop. The fluids also contain
contaminants t h a t a r e abrasive and corrosive to t h e system itself and contain dissolved gases t h a t a r e very toxic. If s team supplies must b e vented, very high levels of noise c a n
occur as well. The chemicals used in some hydrogen sulfide aba tement schemes a r e
themselves very toxic. Examples a r e sodium hydroxide and hydrogen peroxide and even
recycled s tee l pickle acid t h a t contains ferrous sulfate, which is useful as a catalyst . 95
In general , t h e grea tes t hazard in t h e geothermal industry has been hydrogen
sulfide. This gas is very toxic and has c rea ted problems particularly during t h e well
41
drilling and power plant operation phases.93 Several individuals have been rendered unconscious. A s a result of these problems, many changes in procedures, designs, and monitoring systems have evolved. In this regard, t h e geothermal industry is not unique. Hydrogen sulfide is a major problem in t h e oil and gas industry, 42943 was a major problem
96 in t h e Swedish shale-oil industry, and is a significant problem even in t h e nuclear industry where it is used to make heavy water. 97
To assess t h e t o t a l risks from t h e operation of 21,000 MWe for 30 y, w e f i r s t
e s t i m a t e t h e required man-years of effor t . According to Zerwas et - &., it t a k e s 50 man-months to drill a geothermal well.94 Based on a resource tempera ture of about
230°C, 40 production wells would be required to supply a 100-MWe plant at one t ime, and
w e e s t i m a t e t h a t another 40 wells would b e required over t h e 30-y plant l i fe as replacements.
From experience at The Geysers, it takes about 1300 man-months to build a
I IO-MWe power plant. Because water-dominated resource plants will b e more complex, w e e s t i m a t e t h a t 2000 man-months would b e required. For decommissioning, w e assume t h a t another 500 man-months would be required, but t h e r e has not been any ac tua l decommissioning experience.
For flashed-steam plants, w e es t imate t h a t one worker is required per M W y e 98 based on d a t a f rom Wairakei and es t imates f rom Baca.
Using t h e above numbers, w e have calculated t h e t o t a l man-years to produce
21,000 M W e f o r 30 y, o r 20 x 10 J of electr ical energy. The results a r e shown in
Table 9. Of t h e total , 85% of t h e predicted manpower is needed f o r t h e operation of t h e
18
power plants. T o predict dea ths f rom occupational accidents, w e have used t h e National Safety Council r a t e s for 1977 as given by Cohen. 99 For construction and
decommissioning, w e used t h e r a t e for construction workers of 60.3 per 10 man-years;
for drilling, we used t h e r a t e f o r mining and quarrying of 65.7 per 10 man-years; and f o r
5
5 r;
operation, w e used t h e r a t e for transportation and public uti l i t ies of 32.7 per 10'
man-years. These results a r e also shown in Table 9.
To ca lcu la te t h e number of occupational diseases, w e have used California statistics
f o r 1974. For construction t h e r a t e is 5.3 per 10 man-years. For drilling, we used 3 t h e r a t e for mineral extract ion of 3.3 per 10 man-years. Because of t h e unique problems
at geothermal power plants, w e have chosen not to use t h e r a t e of 6.2 per IO3 man-years f o r pr ivate utilities, but have used instead t h e r a t e of 10.1 per 10 man-years for
production workers in t h e manufacture of petroleum products. This choice is somewhat arbi t rary but is based on t h e concept t h a t both classes of workers a r e a t similar risk of
exposure to hydrogen sulfide and somewhat similar industrial conditions. These results a r e also shown in Table 9.
100 3
3
42
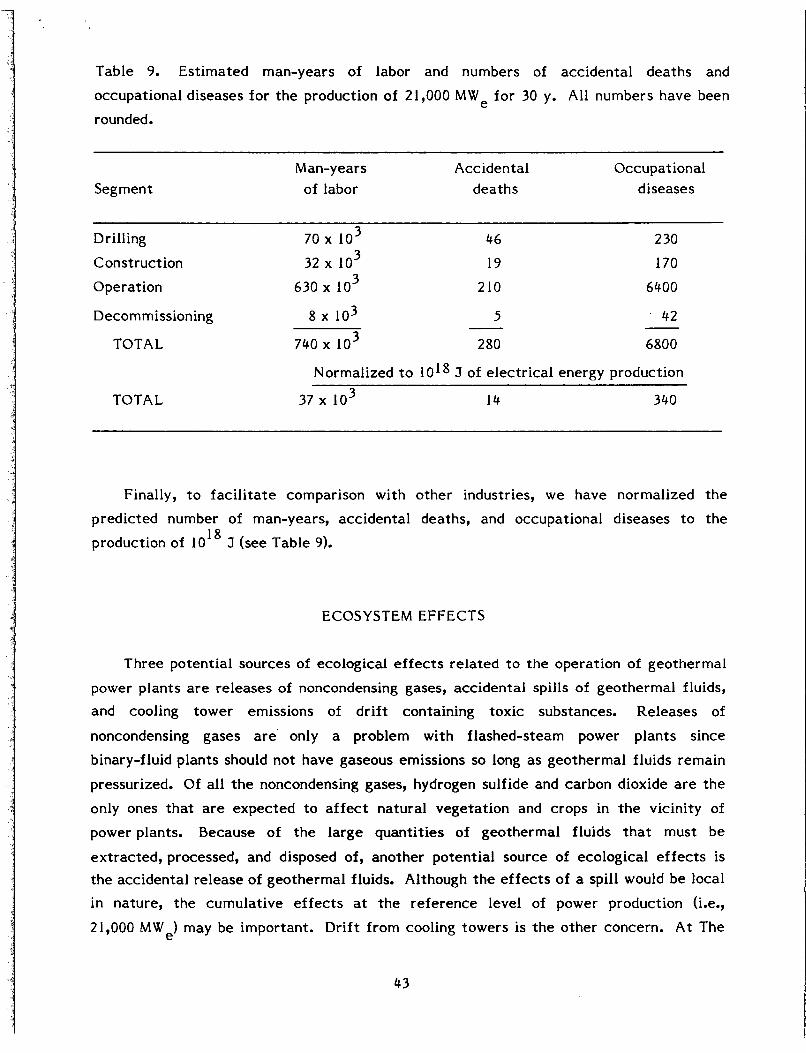
Table 9. Estimated man-years of labor and numbers of accidental dea ths and
occupational diseases f o r t h e production of 21,000 M W e f o r 30 y. All numbers have been
rounded.
Man-y e a r s Accidental Occupational Segment of labor dea ths diseases
Drilling 70 l o 3 46 2 30
Construct ion 32 lo3 19 I70 Operation 630 lo3 210 6400
Decommissioning 8 x I O 3 5 42
TOTAL 740x lo3 280 6800 -
Normalized to 10l8 J of electr ical energy production
TOTAL 37 l o 3 14 340
Finally, to fac i l i t a te comparison with o ther industries, w e have normalized t h e
predicted number of man-years, accidental deaths, and occupational diseases to t h e
production of IOJ8 J (see Table 9).
ECOSYSTEM EFFECTS
Three potential sources of ecological effects related to t h e operation of geothermal
power plants a r e releases of noncondensing gases, accidental spills of geothermal fluids, and cooling tower emissions of dr i f t containing toxic substances. Releases of
noncondensing gases are’ only a problem with flashed-steam power plants since
binary-fluid plants should not have gaseous emissions so long as geothermal fluids remain
pressurized. Of all t h e noncondensing gases, hydrogen sulfide and carbon dioxide a r e t h e
only ones t h a t a r e expected to affect natural vegetation and crops in t h e vicinity of
power plants. Because of t h e la rge quant i t ies of geothermal fluids t h a t must b e
extracted, processed, and disposed of, another potential source of ecological effects is t h e accidental re lease of geothermal fluids. Although t h e e f f e c t s of a spill would be local
in nature, t h e cumulative effects at t h e reference level of power production (Le.,
21,000 MW,) may b e important. Drif t f rom cooling towers is t h e o ther concern. A t The
43
Geysers, boron contained in dr i f t is probably t h e cause of foliar damage to native trees 101 near some of t h e power plants. Boron emissions from cooling towers at geothermal
plants located elsewhere could also produce phytotoxic effects. For example in t h e
Imperial Valley where power plants will b e adjacent to crop lands, boron emissions could
cause crop damage. In th i s section, however, w e will res t r ic t our analyses t o t h e potential effects of noncondensing gases and accidental spills, leaving t h e subject of cooling tower emissions for a detailed analysis in t h e second-year HEED on geothermal energy.
EMISSIONS O F HYDROGEN SULFIDE AND CARBON DIOXIDE
Most of t h e recent work on t h e phytotoxicity of hydrogen sulfide has been conducted
by Thompson and Kats For t h e experiments described in t h e
f i r s t paper they subjected alfalfa, Thompson seedless grapes, le t tuce, sugar beets,
California buckeye, ponderosa pine, and Douglas f i r to continuous fumigations of 30 ppbv (42 pg/m ), 300 ppbv (420 pg/m ), and 3000 ppbv (4200 pg/m ) of hydrogen sulfide. A t the
300-ppbv and 3000-ppbv t rea tments , most of t h e plants exhibited s t ress (i.e., foliar damage o r suppressed yield) when compared with t h e control plants. A t 30 ppbv t h e forest plants did not show any noticeable effects. However, t h e growth of alfalfa, grapes, sugar beets, and l e t t u c e was actually st imulated at t h e lower exposure level. In t h e
second paper they reported t h e results of t reat ing plants with 50-ppmv carbon dioxide and
300-ppbv hydrogen sulfide. Interestingly enough, they found t h a t t h e addition of 50-ppmv
carbon dioxide generally counteracted t h e negative effects of hydrogen sulfide alone at
t h e 300-ppbv exposure level, and in t h e cases of co t ton and alfalfa, t h e t r e a t m e n t s of hydrogen sulfide plus carbon dioxide actually caused more growth in t h e fumigated plants
than in t h e controls.
I02 103 and Thompson -- et al.
3 3 3
Ambient concentrat ions of hydrogen sulfide in t h e vicinity of a reference, 100-MWe flashed-steam geothermal facil i ty processing fluids containing 5.4 mg/kg of hydrogen
sulfide would range from about 2 pg/m at 10 km, assuming no emission controls. If t h e fluids contained t e n t imes as much hydrogen
3 sulfide, t h e concentration range would b e 7 to 19pg/m . So even without aba tement of
hydrogen sulfide, ambient levels a r e not expected to have deleterious effects on plants,
and in fact, t h e l ow concentrat ions may have a minor fertilizing effect.
3 3 a t a dis tance of 5 km to 0.7 pg/m
The potential phytotoxic effects of hydrogen sulfide and carbon dioxide emissions
f r o m 3000 MWe of geothermal development in t h e Imperial Valley have been analyzed by Kercher.lo4 In his study, h e used a computer model to simulate t h e grow,th of sugar
beets, a n important cash-crop in t h e valley, exposed to ambient concentrations of
44
hydrogen sulfide as well as carbon dioxide emi t ted from geothermal facilities. Results of t h a t analysis were then used to assess t h e possible effects on other crops. Without hydrogen sulfide controls and with no emissions of carbon dioxide, t h e model predicts t h a t t h e growth of sugar b e e t s would b e enhanced throughout t h e valley, with bee ts at some
places displaying increases of 10% over t h e control case. Emissions of hydrogen sulfide from al l power plants would have to b e over 100 t / d before t h e growth of sugar bee ts
would b e reduced.lo4 Unabated emissions from a l l power plants making up t h e 3000-MWe scenario, by comparison, a r e 40 t/d. When carbon dioxide emissions were included in t h e
model simulations along with t h e hydrogen sulfide emissions, only increased yields were predicted. The results of t h e sugar bee t simulations were then used to e s t i m a t e t h e
effects on o ther crops by using comparat ive d a t a on t h e sensitivities of sugar bee ts and o ther crops to hydrogen sulfide. In this regard, l e t t u c e and alfalfa a r e 1.6 and 3.4 t i m e s
more susceptible to hydrogen sulfide phytotoxicity, and consequently, emission r a t e s of approximately 70 and 30 t /d f rom al l power plants would result in potential injury.
However, t h e compensating inf h e n c e of carbon dixoide would probably mit igate those
effects.
In conclusion, emissions of both hydrogen sulfide and carbon dioxide from geothermal
facil i t ies in t h e reference industry will not result in negative effects on crops and nat ive
vegetation. Indeed, growth enhancement is more likely than retardation. Even smaller effects (no significant enhancement) will occur if hydrogen sulfide is abated.
ACCIDENTAL SPILLS
Geothermal power plants must rely on large quantit ies of geothermal fluids to
temperature) and 185 m’/MWe h (15OOC resource temperature). A potential danger during t h e extraction, transportation, processing, and disposal of geothermal fluids is t h e
inadvertent re lease of those hot fluids to adjacent lands. Such a spill would damage
vegetation on t h e affected lands and contaminate soils. To assess t h e risks of accidental
releases, w e must determine how much land area would b e covered by fluids a f t e r a spill occurs and w e must also e s t i m a t e t h e probability of events t h a t result in spills.
The sur face a r e a a f f e c t e d by spills per MWe y of energy production is calculated f rom
F - T * S D y A =
45
(9)

where 2 A = a r e a a f fec ted by a spill in m /MWe y,
F = f lowrate of geothermal fluids in m /h, T = duration of spill in h,
D = depth of spill in m, and
S = probability of a release per unit of energy production in fraction/MWe y.
3
The cr i t ica l parameter in th i s analysis is t h e probability of a release per unit of
energy production S . I t is qui te difficult to accurately quantify t h e probability of a spill
event without d a t a on t h e frequency of spills at ac tua l geothermal power plants.
Nevertheless, re lease probabilities c a n be est imated with f ailure-rate d a t a on individual
components (e.g., valves, pumps, piping, etc.) in a power plant. Sung -- et al. have used such d a t a to e s t i m a t e t h e probabilities of t w o types of geothermal fluid releases: ( I ) cri t ical ,
which t h e y def ine as Ira single-point rupture t h a t can b e controlled only by closing t h e
wellhead valves" and (2) major, which they def ine as 'la single-point rupture t h a t is controllable by valves o ther than t h e wellhead valves. '*105 They e s t i m a t e a probability of
3.7 x for a cr i t ica l release during t h e 40-y design life of a 50-MWe flashed-steam
facil i ty, o r 1.85 x 10⁻⁸/MWe y, and 1.8 x for a major re lease (9. x 10-7/MWe y).
T h e reference plant is assumed to have dual pipes carrying fluids f rom a wellfield t o cent ra l s t e a m separators, and hence half of t h e t o t a l flow from a wellfield would b e
released if a cr i t ica l fa i lure occurs. Major releases, though, would be considerably smaller because of t h e availability of more valves to control t h e release.
To analyze t h e amount of land af fec ted by both cr i t ical and major releases, w e used t h e MACRO1 code to combine t h e parameter distributions shown in Table 10. The
maximum value of F in a cr i t ica l re lease is assumed to b e half of t h e flow of a 50-MWe power plant requiring 100 m / M W e * h of geothermal fluids, our maximum e s t i m a t e of
flow for a reference geothermal facility. The minimum flow associated with a cr i t ical re lease was arbitrari ly assumed to b e a t e n t h of t h e maximum flow. The maximum flow
during a major re lease was set equal to t h e minimum discharge during a cr i t ica l release. 4 The median values of A for cr i t ical and major releases were calculated to be 1.6 x IO-
and 8.2 x IOe4 m2/MWe* y. A t t h e reference level of geothermal energy production (i.e.,
3
r
21,000 MWe for 30 y), 6.3 x 10'MWe y of electr ic i ty a r e generated. Thus t h e areas of
land af fec ted f o r t h e reference industry a r e 101 m and 517 m2, for a t o t a l of just over 2 600 m . A t t h e 99th percent i le of t h e cumulative distributions for A, a total of 4 2 5 x 10 m ( 5 ha) would b e affected by both types of spills.
2
46

Table 10. Parameter distributions and values used in t h e analysis of t h e consequences of accidental releases of geothermal fluids.
Distribution values
Parameter Units Distribution Cri t ical release Major re lease
(minimum/maximum)a (minimum/maximum)a
F m3/h Triangle 2 50/2500 25/250
T h Triangle 0. I66/ 1 0.166/1 D m Uniform 0.0 13/0. I52 0.0 I3/0. I52
S fraction/MWe y Log-normal 1.85 x 10⁻⁸/5
a The minimum and maximum values of t h e tr iangle and uniform distributions used to calculate t h e median values.
If w e assume t h a t 12 ha of land a r e required for a typical 100-MWe geothermal power plant, 2.5 x 10 ha of land would b e required for facilities making up t h e reference
industry. So in a comparat ive sense, t h e potential effect of spills on habi ta t s adjacent t o geothermal faci l i t ies is minor compared with t h e disruption of habi ta ts caused by land
requirements of power plants and well f ields (additional site-specific impacts on habi ta ts
will of course b e caused by roads, transmission line corridors, etc.).
3
Accidental releases of fluids c a n b e contained by ear then berms and sumps. In
addition, pressure-activated sensors c a n b e used to d e t e c t inadvertent spills so t h a t
remedial act ion c a n b e taken. Preventive maintenance of equipment will fur ther reduce
t h e likelihood of large spills. To improve t h e probabilistic analysis of spills, t h e value of S needs to b e improved. Sung -- et a d o 5 based the i r es t imates of S on fai lure r a t e d a t a for
equipment in o ther industries and f o r power plant designs t h a t may not prove to b e
representative. Moreover, t h e e s t i m a t e of S does not include human errors, and t h a t
deficiency could significantly change t h e results. Additional d a t a on t h e frequency of spills and causes will have to b e collected as t h e geothermal power industry expands in order to improve our es t imates of t h e spill risk. Also, studies are needed to examine t h e potential f o r blowouts of geothermal wells. Such events could cons t i tu te a more
significant t h r e a t to habitats.
47
CONCLUSIONS
The analyses in this HEED provide some valuable insights in to t h e manageability of heal th and environmental risks of geothermal power production, t h e relat ive importance
of different effects, and t h e need for fu ture research to reduce t h e uncertainties of t h e risk analyses. For most of t h e risks w e studied, w e compared t h e e f f e c t s associated with
both controlled and uncontrolled releases of eff luents to determine t h e changes in heal th risks.
In our analysis of hydrogen sulfide, for example, w e showed t h a t emissions of t h a t gas f rom geothermal facilities would probably have to b e kept below 1 g/s to avoid t h e
occurrence of unwanted odors in t h e vicinity of power plants. We further es t imated t h a t nearly 60% of t h e resource a r e a s would have a t leas t one power plant with emissions
g r e a t e r than 1 g/s, assuming t h a t no controls a r e implemented and t h a t geothermal fluids
contain 0.7 mg/kg of hydrogen sulfide.
The use of hydrogen sulfide aba tement equipment to minimize potential odor
problems has a second-order benefit--the reduction of heal th risks f rom exposure to particulate sulfate, the oxidation by-product of hydrogen sulfide in the atmosphere. The
sulfate-related health risk of 21,000 MWe of energy production was est imated to b e 23 premature dea ths per year without control of emissions, compared with 0.3/y when controls are used to limit emissions of hydrogen sulfide to 36 g / M W to reduce odors.
The chemical t r e a t m e n t of noncondensing gases to remove hydrogen sulfide may also lower emissions of mercury, benzene, and radon. However, t h e degree of control in t h a t
particular si tuation is not known a t this time. Interestingly enough, e f for t s to a b a t e
hydrogen sulfide have led to a secondary health problem, occupational exposure to toxic
substances used in t h e control systems (e+, sodium hydroxide). Thus, t h e management of one health risk c a n actually lead to another unless precautions a r e taken.
e
The public health risks of geothermal development could b e great ly reduced by implementing binary-fluid power plants, which a r e not expected to release noncondensing
gases so long as geothermal fluids a r e pressurized. Again, t h e occupational risks of t h e newer, binary-f h i d technologies could b e g r e a t e r than f lashed-steam systems--this should
b e t h e subject of fu ture research. One drawback of t h e binary-fluid plants is their need for external sources of cooling water. In t h e ar id West, t h e siting of those facil i t ies may
b e a rea l problem and consequently their use may b e severly restricted. The occupational health risks t h a t we have est imated for t h e reference geothermal
industry a r e significantly grea te r than t h e public health risks. W e used occupational d a t a
f rom similar industries t o calculate t h e occupational risks, and unfortunately t h e r e is no
48
way of knowing t h e direction of bias caused by using t h e surrogate d a t a until more d a t a
become available on operating geothermal facilities. Furthermore, until more is known
about t h e sources of occupational illnesses and deaths, i t i s not possible to determine how
ef fec t ive industrial hygiene pract ices will b e in reducing risks.
During our analyses of t h e health and environmental risks of producing geothermal energy, several avenues of fu ture research became apparent t h a t should help t o reduce some uncertainties of risk estimates.
0
0
0
0
In general, more d a t a a r e needed on t h e chemistry of geothermal fluids. A program of sampling and analyses of fluids from more geothermal resources
would b e a cost-effective way of reducing a n important source of uncertainty
in our analyses. This is especially t r u e for benzene, an organic gas t h a t has
only recent ly been discovered in noncondensing gases. Additional d a t a on
hydrogen sulfide and mercury would also b e helpful.
The analyses of t h e health risks of t h e noncondensing gases were based on t h e assumption t h a t t h e predicted outdoor levels of t h e gases were t h e s a m e as t h e
indoor levels. W e know t h a t this is not t r u e f o r all gases, and studies should be
implemented to investigate t h e indoor and outdoor relationships for a l l of t h e noncondensing gases.
A major source of uncertainty involves t h e dose-response relationships of t h e
substances we have assessed. I t is c l e a r t h a t more laboratory and
epidemiological studies are needed to increase our understanding of t h e toxicology of t h e d i f fe ren t gases. Additional information would be particularly helpful on t h e dose-response function f o r su l fa te aerosols. Our analysis of t h e health risk of mercury would b e improved if w e knew more about t h e c learance r a t e of mercury from t h e brain. More research is needed on t h e homeostat ic function of arsenic.
D a t a should be collected on t h e frequency of accidental releases of geothermal
fluids and their potential sources. These d a t a a r e needed to verify t h e risk
es t imates w e have made using failure-rate d a t a of equipment common t o o ther
industries.
49
ACKNOWLEDGMENTS
W e thank N. Nehring and D. Des Marais who supplied us with useful information on t h e occurrence of benzene in geothermal fluids. W e would also like t o acknowledge t h e
help received from Y. Ricker and A. Fountain during t h e final preparation of t h e document.
50

REFERENCES
1. L. J. P. Muffler, Ed., Assessment of Geothermal Resources of t h e United
States--1978, U.S. Geological Survey, Arlington, VA, Circular 790 (1979).
2. L. Rybach, "Geothermal Systems, Conductive Heat Flow, Geothermal Anomalies,"
in Geothermal Systems: Principles and Case Histories, L. Rybach and L.J.P. Muffler, Eds. (John Wiley and Sons, Ltd., New York, 19811, p. 3.
3. D. W. Layton and L. R. Anspaugh, Health Impacts of Geothermal Energy,
International Symposium on Health Impacts of Different Sources of Energy, Nashville, TN, June 22-26, 198 1.
4. G. Heiken, H. Murphy, G. Nunz, R. Pot ter , and C. Grigsby, "Hot Dry Rock
Geothermal Energy," Amer. Sci. -, 69 400 (1981).
5. L. R. Anspaugh and J. L. Hahn, "Human Health Implications of Geothermal Energy," in Health Implications of New Energy Technologies, W.N. Rom and V.E. Archer, Eds. (Ann Arbor Science Publishers, Inc., Ann Arbor, MI, 19801, p. 565.
6. D. L. Ermak and P. L. Phelps, An Environmental Overview of Geothermal Development: The Geysers-Calistoga KGRA, Volume 1. Issues and
Recommendations, Lawrence Livermore Laboratory, Livermore, CA, UCRL-52496,
vol. I (1978).
7. D. W. Layton and W. F. Morris, "Geothermal Power: Accidental Fluid Releases and
Waste Disposal," Chem. Eng. Prog. - 77(4), 62 (1981).
8. D. W. Layton, An Assessment of Geothermal Development in t h e Imperial Valley of
California; Environment, Health, Socioeconomics, and Environmental Control
Technology, Executive Summary, U.S. Department of Energy, Washington, DC, DOE/TIC- 1 1308 ( 1980).
9. J. H. Anderson, "The Vapor-Turbine Cycle for Geothermal Power Generation," in
Geothermal Energy: Resources, Production, Stimulation, P. Kruger and C. Otte, Eds. (Stanford University Press, Stanford, CA, (19731, p. 163.
51
10.
1 1 .
12.
13.
14.
15.
16.
17.
18.
19.
W. . Pope, P. A. Doyle, H. S. Pines, R.' L. Fulton, L. F. Silvester, and
J. M. Angevine, "Conceptual Design Optimization," in Sourcebook on t h e Production of Electricity from Geothermal Energy, J. Kestin, R. DiPippo, H.E. Khalifa, and D.J. Ryley, Eds. (Brown University, Providence, RI, 19801, p. 729.
C. A. Brook, "Variability and Sources of Hydrogen Sulfide and Other Gases in Steam
at The Geysers," in - Research in The Geysers-Clear Lake Geothermal Area, Northern California, R. J. McLaughlin and J. M. Donnelly-Nolon, Eds., U.S.
Geological Survey, Washington DC, Professional Paper I 14 I ( 198 I ), p. 193.
E. F. Wahl, Geothermal Energy Utilization (John Wiley and Sons, New York, 1977).
D. L. Ermak, R. A. Nyholm, and P. H. Gudiksen, Imperial Valley Environmental
Project: Air Quality Assessment, Lawrence Livermore Laboratory, Livermore, CA,
UCRL-52699 (1 979).
F. B. Stephens, J. H. Hill, and P. L. Phelps, Jr., State-of-the-Art Hydrogen Sulfide
Control for Geothermal Energy Systems: 1979, U.S. Department of Energy, Washington, DC, DOE/EV-0068 (1980).
K. L. White, A. C. Hill, and W. 0. Ursenbach, Environmental Overview Report on
Utah Geothermal Resource Areas, University of Utah Research Insti tute, Salt Lake City, UT, UCRL-13955, vols. 1 and 2 (1978).
P. F. Ellis and M. F. Conover, Materials Selection Guidelines for Geothermal Energy Utilization Systems, U.S. Department of Energy, Washington, DC,
DOE/RA/27026-1 (1981).
S . R. Cosner and J. A. Apps, A Compilation of Data on Fluids f rom Geothermal
Resources in t h e United States, Lawrence Berkeley Laboratory, Berkeley, CA,
R. C. Axtmann, "Emission Control of Gas Effluents f rom Geothermal Power Plants,'' Environ. Lett. 8, 135 (1975).
R. DiPippo, Geothermal Energy as a Source of Electricity, U.S. Department of
Energy, Washington, DC, DOE/RA/28320-1 (1980).
52
J
20.
2 1.
22.
23.
24.
25.
26.
27.
2 8.
29.
Pacif ic Gas and Electr ic Co. (PG&E), Notice of Intention, Geysers Unit 17, PG&E, San Francisco, CA (1978).
N. L. Nehring and J. 3. Fausto, "Gases in S team from C e r r o Pr ie to Geothermal
Wells with a Discussion of Steam/Gas Rat io Measurements,It Geotherm. - 8, 253 (1979).
D. W. Layton, D. 3. Powers, P. Leitner, N. B. Crow, P. H. Gudiksen, and Y. E. Ricker, Environmental Summary Document for t h e Republic Geothermal,
Inc., Application for a Geothermal Loan Guaranty Project; 64 M W Well Field and
4 8 MW(Net) Geothermal Power Plant, Lawrence Livermore Laboratory, Livermore,
CA, UCID-18095 (1979).
N. L. Nehring, "Gases from Springs and Wells in The Geysers-Clear Lake Area," in
- Research in The Geysers-Clear Lake Geothermal Area, Northern California, R. J. McLaughlin and J.M. Donnelly-Nolan, Eds., U.S. Geological Survey, Washington, DC, Professional Paper 1141 (1981), p. 205.
A. H. Truesdell and N. L. Nehring, "Gases and Water Isotopes in a Geochemical Section Across t h e Larderello, Italy, Geothermal Field," Pageoph - 117, 276 (1978/79).
D. J. Des Marais, J. H. Donchin, N. L. Nehring, and A. H. Truesdell, "Molecular Carbon Isotopic Evidence for t h e Origin of Geothermal Hydrocarbons," N a t u r e -9 292
826 (1981).
N. L. Nehring and A. H. Truesdell, ItHydrocarbon Gases in Some Volcanic and Geothermal Systems," Geotherm. Resour. Counc. Trans. 2 , 4 8 3 (1978).
D. W. Robertson, E. A. Crecelius, J. S. Fruchter, and J. D. Ludwick, "Mercury
Emissions from Geothermal Power Plants," Science - 196, 1094 (1977).
D. W. Robertson, J. S. Fruchter, J. D. Ludwick, C. L. Wilkerson, E. A. Crecelius,
and J. C. Evans, "Chemical Character izat ion of Gases and Volatile Heavy Metals in Geothermal Effluents," Geotherm. Resour. Counc. Trans. - 2, 579 (1978).
E. A. Crecelius, D. E. Robertson, J. S. Fruchter, and J. D. Ludwick, t tChemical Forms of Mercury and Arsenic Emit ted by a Geothermal Power Plant," in Trace
Substances in Environmental Health--X, D. D. Hemphill, Ed. (University of Missouri, Columbia, MO, 19761, p. 287.
53
30. H. L. Beck, "Gamma Radiation from Radon Daughters in t h e Atmosphere," - J.
Geophys. Res. -9 79 2215 (1974).
31. L. R. Anspaugh, Final Report on t h e Investigation of t h e Impact of t h e Release of 222-Rn, its Daughters, and Precursors at The Geysers Geothermal Field and Surrounding Area, Lawrence Liver more Laboratory, Livermore, CA, Environmental
Sciences Division Report ( 1978).
32. M. H. Wilkening, W. E. Clements, and D. Stanley, "Radon 222 Flux Measurements in Widely Separated Areas," in The Natural Radiation Environment 11, J.A.S. Adams, W.M. Lowder, and T.F. Gesell, Eds. (NTIS, Springfield, VA, CONF-720805-P2,
19721, p. 717.
33. M. F. O'Connell and K. F. Kaufman, Radioactivity Associated with Geothermal
Waters--the Western United States. Basic Data , U.S. Environmental Protect ion
Agency, Off ice of Radiation Programs, Las Vegas, N V, ORP/LV-75-8A (1 976).
34. L. R. Anspaugh and P. Leitner, "Health and Safety Concerns," in An Assessment of
Geothermal Development in t h e imperial Valley of California, Volume 1. Environment, Health, and Socioeconomics, D. W. Layton, Ed., US. Department of Energy, Washington, DC, DOE/EV-0092, vol. 1 (1980).
35. J. D. Spengler, 'Comments," J. Air Pollut. Control Assoc. - 29, 929 (1979).
36. D. J. Moschandreas, J. Zabransky, and D. J. Pelton, Comparison of Indoor and
Outdoor Air Quality, Electr ic Power Research Insti tute, Palo Alto, CA, EPRI
EA-1733 (1981).
37. E. Crouch and R. Wilson, "Regulation of Carcinogens," Risk Anal. - 1, 47 (1981).
38. D. L. Shaeffer and F. 0. Hoffman, "Uncertainties in Radiological Assessments--A
Stat is t ical Analysis of Radioiodine Transport via t h e Pasture-Cow-Milk Pathway,"
Nuclear Tech. I 45 ( I ) , 99 (1979).
39. M. G. Morgan, S. C. Morris, A.K. Meier, and D.L. Shenk, "A Probabilistic
Methodology for Estimating Air Pollution Health Effec ts f rom Coal-Fired Power Plants," Energy Syst. Policy - 2, 287 (1978).
54

40. G. Schwarz and F. 0. Hoffman, "Imprecision of Dose Predictions for Radionuclides
Released to t h e Environment: An Application of a Monte Carlo Simulation Technique," Environ. Intern. - 4, 289 (1980).
41. L. 1. Edwards, MACROI: A Code to Test a Methodology f o r Analyzing Nuclear-Waste Management Systems, Lawrence Livermore Laboratory, Livermore,
CA, UCRL-52736 (1 979).
42. U.S. National Research Council, Hydrogen Sulfide (University Park Press,
Baltimore, MD, 1979).
43. U.S. National Insti tute for Occupational Safety and Health (NIOSH), Cr i te r ia f o r a
Recommended Standard. ..Occupational Exposure to Hydrogen Sulfide, N IOSH, Washington, DC, 77-1 58 ( I 977).
44. D. L. Ermak, R. A. Nyholm, and P. H. Gudiksen, "Potential Air Quality Impacts of
Large-Scale Geothermal Energy Development in t h e Imperial Valley," Atmos. Environ. - 14, 1321 (1980).
45. W. F. Morris and F. 8. Stephens, Strategies for Steam Handling and Hydrogen
Sulfide Abatement at Geothermal Power Plants in The Geysers Area of Northern
California, Lawrence Livermore National Laboratory, Livermore, CA, UCRL-53 I37 (1981).
46. B. G. Ferris, "Health Effec ts of Exposure to Low Levels of Regulated Ai r
Pollutants. A Cri t ical Review," J. Air Pollut. Control Assoc. 2, 482 (1978).
47. R. Mendelsohn and G. Orcutt, "An Empirical Analysis of Air Pollution
Dose-Response Curves," J. Environ. Econ. Manage. - 6, 85 ( 1979).
48. 1. B. Lave and E. P. Seskin, Air Pollution and Public Health (The Johns Hopkins
University Press, Baltimore, MD, 1977).
49. M. 0. Amdur, Toxicological Appraisal of Part iculate Matter, Oxides of Sulfur, and
Sulfuric Acid," 3. Air Pollut. Control Assoc. - 9, 638 (1969).
55
50. R. Wilson, S . D. Colome, J. D. Spengler, and D.. G. Wilson, Health Effec ts of Fossil Fuel Burning. Assessment and Mitigation (Ballinger Publishing Company,
Cambridge, MA, 1980).
51. D. L. Ermak and R. A. Nyholm, Multiple Source Dispersion Model, Lawrence
Livermore Laboratory, Liver more, CA, UCRL-52592 ( 1978).
52. J. L. Sprung, "Tropospheric Oxidation H2S," in Advances in Environmental Science and Technology (John Wiley and Sons, New York, 19771, p. 263.
53. L. Newman, "Atmospheric Oxidation of Sulfur Dioxide," in Atmospheric Sulfur
Deposition. Environmental Impact and Health Effec ts (Ann Arbor Science
Publishers, Inc., Ann Arbor, MI, 1979), p. 131.
54. H. S . Judeikis and A. G. Wren, "Deposition of H2S and Dimethyl Sulfide on Selected
Soil Materials," Atmos. Environ. E, 1221 (1977).
55. J. N. d e Wys, A. C. Hill, and E. Robinson, "Assessment of t h e Fate of Sulfur Dioxide
from a Point Source," Atmos. Environ. 12, 633 (1978).
56. J. A. Garland, "Dry and Wet Removal of Sulfur f rom t h e Atmosphere," Atmos.
Environ. - 12, 349 ( 1978).
57. R. R. Draxler, "An Improved Gaussian Model f o r Long-Term Average Air
Concentration Estimates," Atmos. Environ. - 14, 597 ( 1 980).
58. P. H. Gudiksen, D. L. Ermak, K. C. Lamson, M. C. Axelrod, and R. A. Nyholm, - The Potent ia l Air Quality Impact of Geothermal Power Production in t h e Imperial Valley, Lawrence Livermore Laboratory, Livermore, CA, UCRL-52797 (1 979).
59. D. L. Ermak, Potential Growth of Electr ic Power Production from Imperial Valley Geothermal Resources, Lawrence Liver more Laboratory, Livermore, CA,
UCRL-52252 (1977).
60. M. Aksoy, S . Erdem, and C. Dincol, "Leukemia in Shoe-Workers Exposed Chronically
to Benzene," Blood 44, 837 ( 1974).
56

61.
62.
63.
64.
65.
6 6.
67.
68 .
69.
70.
71.
P. F. Infante, J. K. Wagoner, R. A. Rinsky, and R. F. Young, "Leukaemia in
Benzene Workers," Lance t - 2, 76 (1977).
R. E. Albert, Carcinogen Assessment Croup's Final Repor t on Population Risk to
Ambient Benzene Exposure, U.S. Environmental Protection Agency, Research Triangle Park, NC, EPA-450/5-80-004 (1979).
J. V. Ordonez, J. A. Carillo, M. Miranda, and J. L. Gale, "Estudio Epidemiologico d e
una Enfermedad Considerada como Encefalitis e n l a Region d e 10s Altos d e
Guatemala," Bol. Of. Sanit. Panam. - 60, 18 (1966).
F. Bakir, S. F. Damluji, L. Amin-Zaki, M. Murtadha, A. Khalidi, N. Y. Al-Rawi,
S. Tikriti, H. I. Dhahir, T. W. Clarkson, J. C. Smith, and R. A. Doherty, "Methylmercury Poisoning in Iraq," Science - 181, 230 (1973).
H. B. Gerstner and J. E. Huff, "Clinical Toxicology of Mercury," J. Toxicol.
Environ. Health - 2, 491 (1977).
D. Benning, "Outbreak of Mercury Poisoning in Ohio," Ind. Med. Sur& - 27, 354 (1958).
Y. M. El-Sadik and A-A. El-Dakhakhny, "Effects of Exposure of Workers to Mercury at a Sodium Hydroxide Producing Plant," Am. Ind. Hyg. Assoc. J. - 31, 705 (1970).
B. Kesic and V. Haeusler, "Hematological Investigation of Workers Exposed to Mercury Vapors," Ind. Med. Surg. - 20, 485 ( I95 1).
R. G. Smith, A. J. Vorwald, L. S . Patil, and T. F. Mooney, "Effects of Exposure to
Mercury in t h e Manufacture of Chlorine," Am. Ind. Hyg. Assoc. J. - 31, 687 (1970).
R. C. Harriss and C. Hohenemser, "Mercury--Measuring and Managing t h e Risk,"
Environment - 20(9), 25 ( I 978).
T. Suzuki, "Dose-Ef f ect and Dose-Response Relationships of Mercury and its
Derivatives," in The Biogeochemistry of Mercury in t h e Environment, J.O. N riagu, Ed. (Elsevier-North Holland Biomedical Press, New York, 19791, P 399.
57

72.
73.
74.
7 5.
7 6.
7 7.
7 8.
79.
80.
81.
82.
S . E. Lindberg, "Mercury Partitioning in a Power Plant Plume and its Influence on
Atmospheric Removal Mechanisms," Atmos. Environ. - I 4 227 (1980).
E. P. Radford, Chairman, Commit tee on t h e Biological Effects of Ionizing Radiation, The Effec ts on Populations of Exposure to Low Levels of Ionizing Radiation: 1980 (National Academy Press, Washington, DC, 1980).
B. L. Cohen, "Health Effec ts of Radon from Insulation of Buildings," Health Phys. - 39, 937 (1980).
A. F. Cohen and B. L. Cohen, "Tests of t h e Linearity Assumption in t h e Dose-Effect Relationship f o r Radiation-Induced Cancer," Health Phys. I 38, 53 (1 980).
United Nations Scientific Commit tee on t h e Effec ts of Atomic Radiation, Sources
and Effec ts of Ionizing Radiation (United Nations, New York, 1977).
B. L. Cohen, "Proposals on Use of t h e BEIR-111 Report in Environmental
Assessments," Health Phys. 41, 769 ( I98 1).
R. C. Axtmann, "Environmental Impact of a Geothermal Power Plant," Science -' 187 795 (1975).
K. D. Pimentel, R. R. Ireland, and G. A. Tompkins, "Chemical Fingerprints to Assess
t h e Effec ts of Geothermal Development on Water Quality in Imperial Valley,"
Geotherm. Resour. Counc. Trans. - 2, 527 (1978).
Pacif ic Gas and Electric Co. (PG&E), Application for Certif ication. Geysers Unit
- 16, PG&E, San Francisco, CA (19791, vol. I.
U.S. Environmental Protection Agency (EPA), Ambient Water Quality Cr i te r ia for Arsenic, U.S. EPA, Washington, DC, PB81-I 17327 (1980).
W. P. Tseng, "Effects and Dose-Response Relationships of Skin Cancer and Blackfoot Disease with Arsenic," Environ. Health Perspect. - 19, 109 (1977).
58

83. W. P. Tseng, H. M. Chu, S . W. How, I. M. Fong, C. S . Ling, and S . Yeh, "Prevalence of Skin Cancer in an Endemic Area of Chronic Arsenicism in Taiwan," J. N a t . Cancer Inst. - 40, 453 ( I 968).
84. E. J. Underwood, Trace Elements in Human and Animal Nutri t ion (Academic Press, New York, 1977).
85. G. W. Coulter, "A Preliminary Appreciation of Effec ts on Aquatic Environments of Geothermal Power Development in New Zealand," Geotherm. Resour. Counc. Trans. - 2, 119 (1978).
86. F. J. Nielson, S . H. Givand, and D. R. Myron, "Evidence of a Possible Requirement
for Arsenic by t h e Rat," Fed. Proc. -9 34 923 (1975).
87. M. Anke, M. Grun, and M. Partschefeld, "The Essentiality of Arsenic for Animals,"
in Trace Substances in Environmental Health-X, D. D. Hemphill, Ed. (University of Missouri, Columbia, MO, 19761, p. 403.
88. W. Mertz, "The Essential Trace Elements," Science - 213, 1332 (1981).
89. J. H. Duffus, Environmental Toxicology (John Wiley and Sons, New York, 1980).
90. E. J. Calabrese, Pollutants and High-Risk Groups (John Wiley and Sons, New York, 1978).
91. J. L. Valentine, H. K. Kanz, and C. Spivey, "Arsenic Levels in Human Blood, Urine,
and Hair in Response to Exposure via Drinking Water," Environ. Res. 20, 24 (1979).
92. 3. L. Hahn, "Occupational Hazards Associated with Geothermal Energy," Geotherm.
Resour. Counc. Trans. 1, 283 ( 1979).
93. J. L. Hahn, Evaluation of Occupational Hazards in t h e Geothermal Energy Industry,
California Department of Health Services, Berkeley, CA (in preparation).
94. M. A. Zerwas, C. R. Witwer, R. E. Freeman, A. Salazar, and K. Semrau,
Occupational Health Assessment of t h e Geothermal Hydrothermal Convection Industry, SRI International, Menlo Park, CA ( 1 979).
59
95.
96.
97.
98.
99.
100.
101.
102.
103.
104.
C. G. Schwarzer, "Recycling Hazardous Wastes," Environ. Sci. Technol. ( 1979).
I66
G. Ahlborg, "Hydrogen Sulfide Poisoning in t h e Shale Oil Industry," AMA Arch. Ind.
Hyg. Occup. Med. 3, 247 ( I95 1).
G. A. Poda, "Hydrogen Sulfide Can B e Handled Safely," Arch. Environ. Health -' 12
795 ( 1966).
R. J. Walinchus and M. S. Fox, Geothermal Energy Plant (Hydrothermal Flashed Steam). Environmental Character izat ion Information Report, U.S. Department of
Energy, Washington, D C (in press).
B. L. Cohen, "Perspective on Occupational Mortality Risks," Health Phys. - 40, 703
(1981).
E. Baginsky, Occupational Disease in California 1974, S t a t e of California,
Department of Health, Berkeley, CA ( 1 974).
B. L. Malloch, M. K. Eaton, and N. L. Crane, Assessment of Vegetation Stress and
- Damage Near The Geysers Power Plant Units, Department of Engineering Research, Pacific Gas and Electric Co., San Ramon, CA, 420-79-3 (1979).
C. R. Thompson and G. Kats, "Effects of Continuous H2S Fumigation on Crop and
Forest Plants," Environ. Sci. Technol. l2, 550 (1978).
C. R. Thompson, G. Kats, and R. W. Lennox, "Effects of Fumigating Crops with
Hydrogen Sulfide or Sulfur Dioxide," Calif. Agric. - 33 (31, 9 (1979).
J. R. Kercher, "An Assessment of t h e Impact on Crops of Effluent Gases f rom
Geothermal Energy Development in t h e Imperial Valley, California," J. Environ. Manage. (in press).
60
105. R. Sung, W. Murphy, J. Reitzel , L. Leventhal, W. Goodwin, and L. Friedman,
Surface Containment fo r Geothermal Brines, T R W Inc., Redondo Beach, CA, T-5003 ( 1979).
JAS/adf
61
LLNL*1982/2