Embed Size (px)
Citation preview

1
Anchoring and Adjustment in Software Estimation
Jorge ArandaFebruary, 2005
University of Toronto
OutlineFundamentals, Related Work
Software EstimationJudgmental Biases, Anchoring and Adjustment
Software Estimation ExperimentPlan, ExecutionResultsFollow-up Study
Conclusions
2
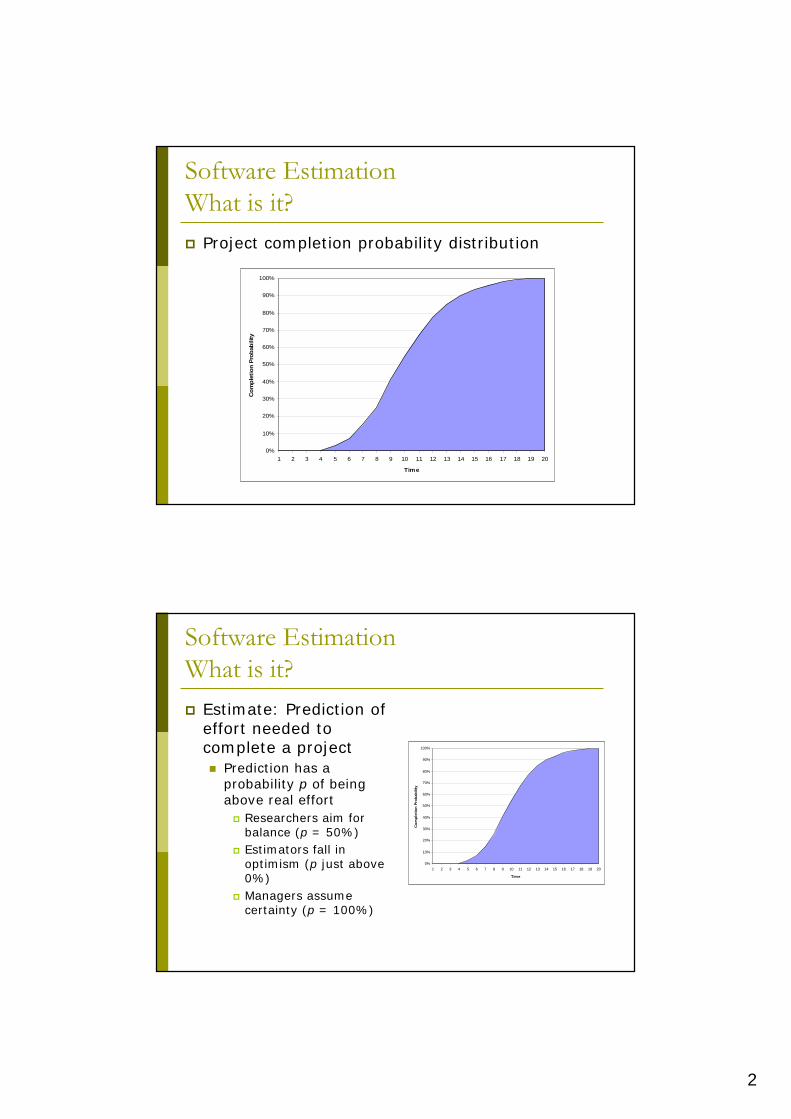
Software EstimationWhat is it?
Project completion probability distribution
0%
10%
20%
30%
40%
50%
60%
70%
80%
90%
100%
1 2 3 4 5 6 7 8 9 10 11 12 13 14 15 16 17 18 19 20
Time
Com
plet
ion
Prob
abili
ty
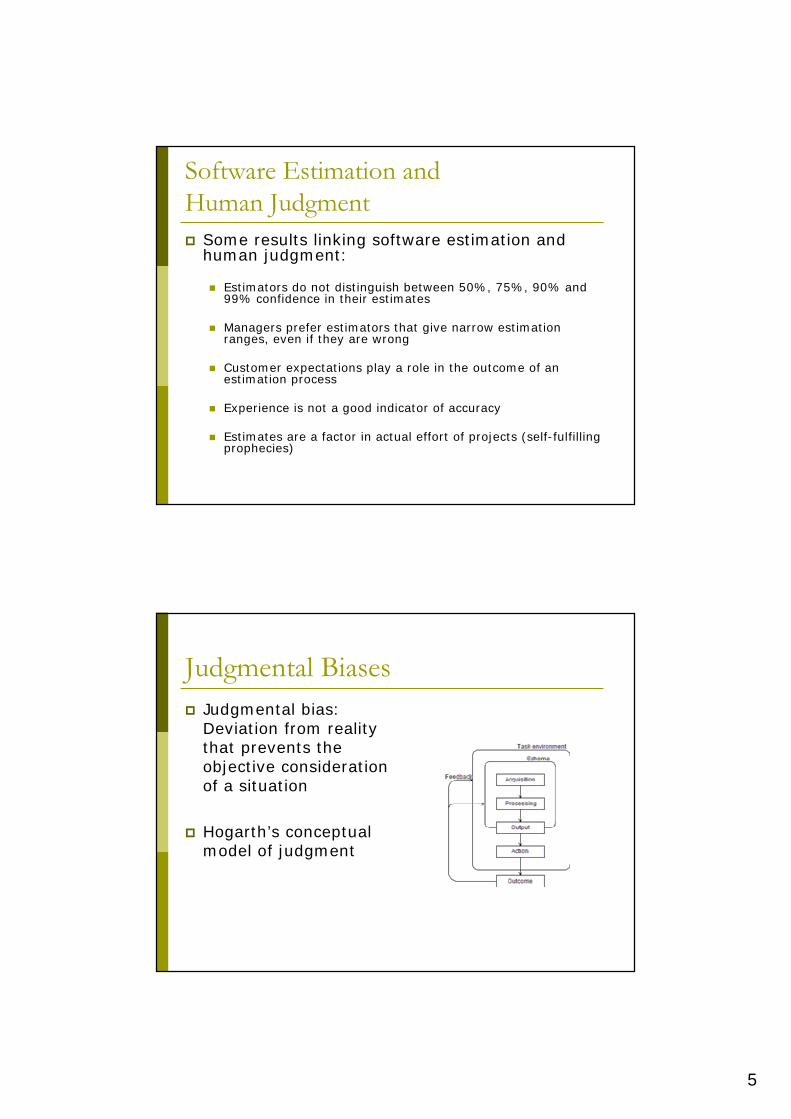
Software EstimationWhat is it?
Estimate: Prediction of effort needed to complete a project
Prediction has a probability p of being above real effort
Researchers aim for balance (p = 50%)Estimators fall in optimism (p just above 0%)Managers assume certainty (p = 100%)
0%
10%
20%
30%
40%
50%
60%
70%
80%
90%
100%
1 2 3 4 5 6 7 8 9 10 11 12 13 14 15 16 17 18 19 20
Time
Com
plet
ion
Prob
abili
ty

3
Software EstimationTechniques
Model-based techniquesCOCOMO, SLIM, ESTIMACS, CheckpointDefault academic idea of what estimation should doAssumption: Software development fits into a general model; model’s equation can be foundCore: Size-effort correlationNote: People are better at estimating effort than size Results: Poor, although calibration is helpful
Learning-oriented techniquesAnalogies, neural networksAssumption: Past performance is good indication of future performanceResults: Good for known territory, bad otherwise
Software EstimationTechniques
Expert-based techniquesIndividual estimation, DelphiAssumption: Humans handle uncertainty better than models/toolsBad reputation in academia
Frequently thought of as mere “guessing”Boehm doesn’t even consider freeform individual expert estimation as an estimation technique
Widespread use in industrySurveys indicate 62%-85% use expert estimation primarily (compare to <10% primary use of models)

4
Software EstimationTechniques
Isn’t all estimation expert-based?Models require human judgment for input
Estimated size of applicationRelevance of situational parameters (team experience, familiarity with problem domain, etc.)
Analogy-based estimation requires picking sources for analogy
Humans are currently better than tools at choosing analogies
Model and analogy-based estimates are normally adjusted if they don’t “feel” right
If human judgment is always required, we should connect to research in psychology
Software EstimationBrown & Siegler: “Psychological research on real-world quantitative expert estimation has not culminated in any theory of estimation, not even in a coherent framework for thinking about the process”.
But there are results from human judgment research we can use
5
Software Estimation andHuman Judgment
Some results linking software estimation and human judgment:
Estimators do not distinguish between 50%, 75%, 90% and 99% confidence in their estimates
Managers prefer estimators that give narrow estimation ranges, even if they are wrong
Customer expectations play a role in the outcome of an estimation process
Experience is not a good indicator of accuracy
Estimates are a factor in actual effort of projects (self-fulfilling prophecies)
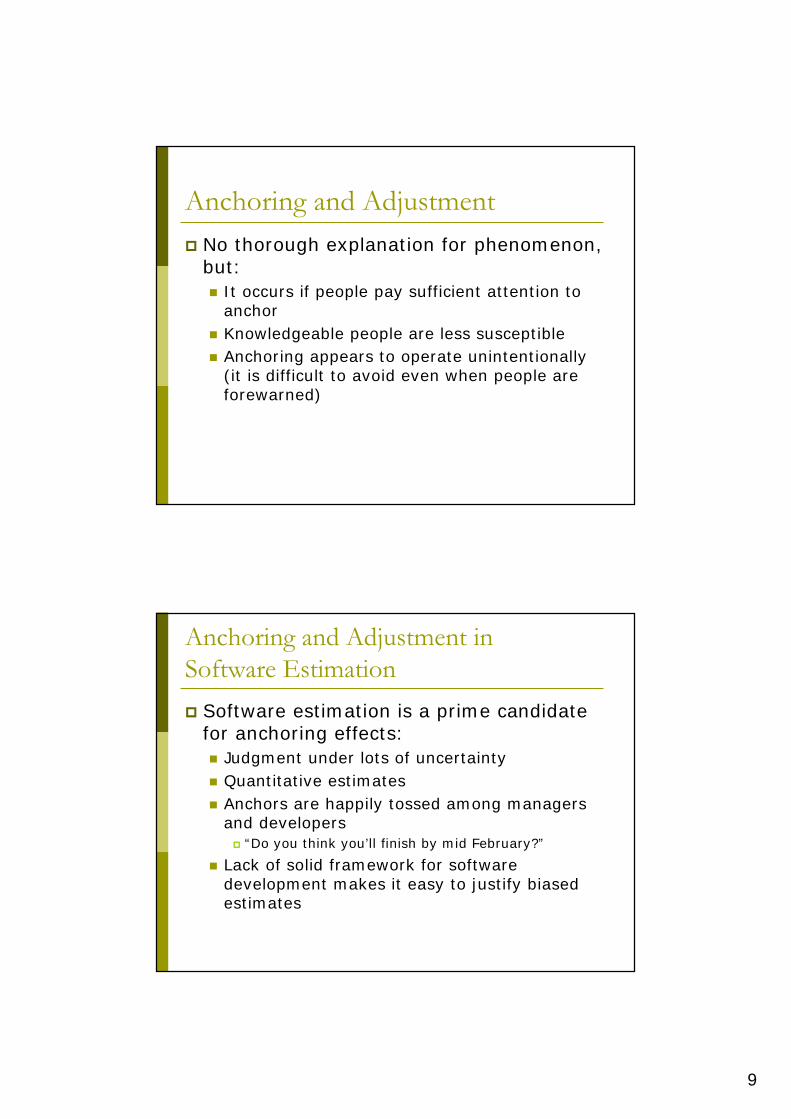
Judgmental BiasesJudgmental bias: Deviation from reality that prevents the objective consideration of a situation
Hogarth’s conceptual model of judgment

6
Judgmental BiasesAcquisition biases
AvailabilityDoes the letter R appear more frequently in the first or in the third position of English words?
Selective perceptionWe perceive information we expected to perceive, and disregard conflicting evidence
Concrete informationDirect advice is given more thought than abstract information
Judgmental BiasesInformation processing biases
InconsistencyDifficulty to apply the same criterion to a repetitive set of cases
RepresentativenessWhen classifying a piece of information, we assign it to the class on which it typically belongs, not in which it statistically belongs
Worthless dataNo specific data at all is better than worthless data

7
Judgmental biasesInformation processing biases (cont.)
Law of small numbersWhich sequence of coin tosses is more likely; six heads in a row or H-T-T-T-H-T?
Regression“Student performance improves after a reprimand, and worsens after a reward”
GroupthinkGroups may take decisions no group member would have taken individually
Anchoring and adjustment(We’ll come back to it in a moment!)
Judgmental BiasesOutput biases
Scale effectsProbabilities are assigned differently when required as percentages than as x:y odds
Illusion of controlPlanning and forecasting induce feelings of control over the uncertain future
Feedback biasesOverconfidence
Practice (and lack of proper feedback) causes an increase in confidence, without an increase in actual performance
Hindsight biasIn retrospect people are rarely surprised of the outcome of a previously uncertain situation

8
Anchoring and AdjustmentTversky & Kahneman’s roulette experiment
Low anchor (10) leads to low estimate (25%)High anchor (65) leads to high estimate (45%)
If judgment is difficult we appear to grasp an anchor (a tentative, even if unlikely, answer) and adjust it up or down according to our intuition
Adjustment is frequently insufficient to compensate anchor
Anchoring and AdjustmentEvidence exists for anchoring and adjustment in wide variety of activities
General knowledge issuesProbability estimatesLegal judgment (ask for large compensations!)Real estate pricing decisionsNegotiation
Anchor does not need to be related to solutionHowever, semantic anchoring effects are more potent than purely numeric anchoring
9
Anchoring and AdjustmentNo thorough explanation for phenomenon, but:
It occurs if people pay sufficient attention to anchorKnowledgeable people are less susceptibleAnchoring appears to operate unintentionally (it is difficult to avoid even when people are forewarned)
Anchoring and Adjustment inSoftware Estimation
Software estimation is a prime candidate for anchoring effects:
Judgment under lots of uncertaintyQuantitative estimatesAnchors are happily tossed among managers and developers
“Do you think you’ll finish by mid February?”
Lack of solid framework for software development makes it easy to justify biased estimates
10
Anchoring and Adjustment inSoftware Estimation
Relevant recent research
Customer expectations may play a role in estimates
Anchoring and adjustment biases assignment of work hours to Work Breakdown Structure analyses
Software Estimation ExperimentResearch Questions
Does the phenomenon of anchoring and adjustment influence software estimation processes?
Is the influence of anchoring and adjustment stronger for estimators that rely solely on expert estimation?
Does the confidence (or lack thereof) estimators have in their answers compensate for possible anchoring and adjustment biases?
Is the anchor effect stronger around anchors that naturally attract estimates due to business cycles –such as “12 months”?

11
Software Estimation ExperimentExperiment Design
Experiment consisted of a software estimation exercise
Problem: Estimate how long will it take to deliver a software application based on:
Initial requirements specificationClient and development team situational informationApproximately 10 pages of material
Participants work on problem individuallyCan take as long as they desireCan use estimation technique(s) of their choice
Required answers:Estimate in monthsJustificationConfidence range (in percentage)
Software Estimation ExperimentExperiment Design
In documentation, future user of system is quoted as saying one of (emphasis added here):
“I’d like to give an estimate for this project myself, but I admit I have no experience estimating. We’ll wait for your calculations for an estimate.”
“I admit I have no experience with software projects, but I guess this will take about 2 months to finish. I may be wrong of course, we’ll wait for your calculations for a better estimate.”
“I admit I have no experience with software projects, but I guess this will take about 12 months to finish. I may be wrong of course, we’ll wait for your calculations for a better estimate.”
I admit I have no experience with software projects, but I guess this will take about 20 months to finish. I may be wrong of course, we’ll wait for your calculations for a better estimate.”
All other data were equal among conditions

12
Software Estimation ExperimentExperiment Design
Note that:Difference among extreme anchors is an order of magnitude
Difference is large, but plausible considering range of estimates at early project stages
Anchor is semantically linked to problem
User does not push his guess as a starting point for negotiation
He labels his own estimate as a guess
Participants read the quote, did not hear it coming from a customer
Less likelihood of attempting to please user (social bias)
Software Estimation ExperimentExecution
29 participants62% graduate students, 38% software professionals62% with previous experience34% with experience in medium to large projects (self-assessed)
Intended even distribution among conditions9 responses for “2 months” condition6 responses for “12 months” condition8 responses for “20 months” condition6 responses for control condition

13
Software Estimation ExperimentGeneral Results
Very wide range of estimatesShortest estimate: 3 monthsLongest estimate: 28 monthsAverage estimate: 12.1 months
Confidence limits increase range to:Minimum: 2 monthsMaximum: 44.8 months
Average +/- confidence percentage: 31%Minimum: 10%Maximum: 100%
Software Estimation ExperimentGeneral Results
Primary estimation techniques used:Expert-based estimation (72%)
WBS analysis: 45%Intractable process: 27%
Model-based estimation (28%)Lines of code: 18%Function points: 10%

14
Software Estimation ExperimentGeneral Results
Software Estimation ExperimentGeneral Results
4.5
16
16.7
“12 months”
5.64.43.7Std. Dev.
1676Median
17.48.36.8Mean
“20 months”Control“2 months”
15
Software Estimation ExperimentGeneral Results
Estimates from the “2 months” condition are significantly different from those in the “20 months” condition (p<0.001)
Estimates from the control condition are significantly different from those in the “20 months” condition (p<0.01)
Estimates from the “2 months” condition were not found to be significantly different from those in the control condition (p>0.1)
Estimates from the “12 months” condition are significantly different from those in the “2 months” condition (p<0.01) and from those in the control condition (p<0.05), but not from those in the “20 months” condition (p>0.1)
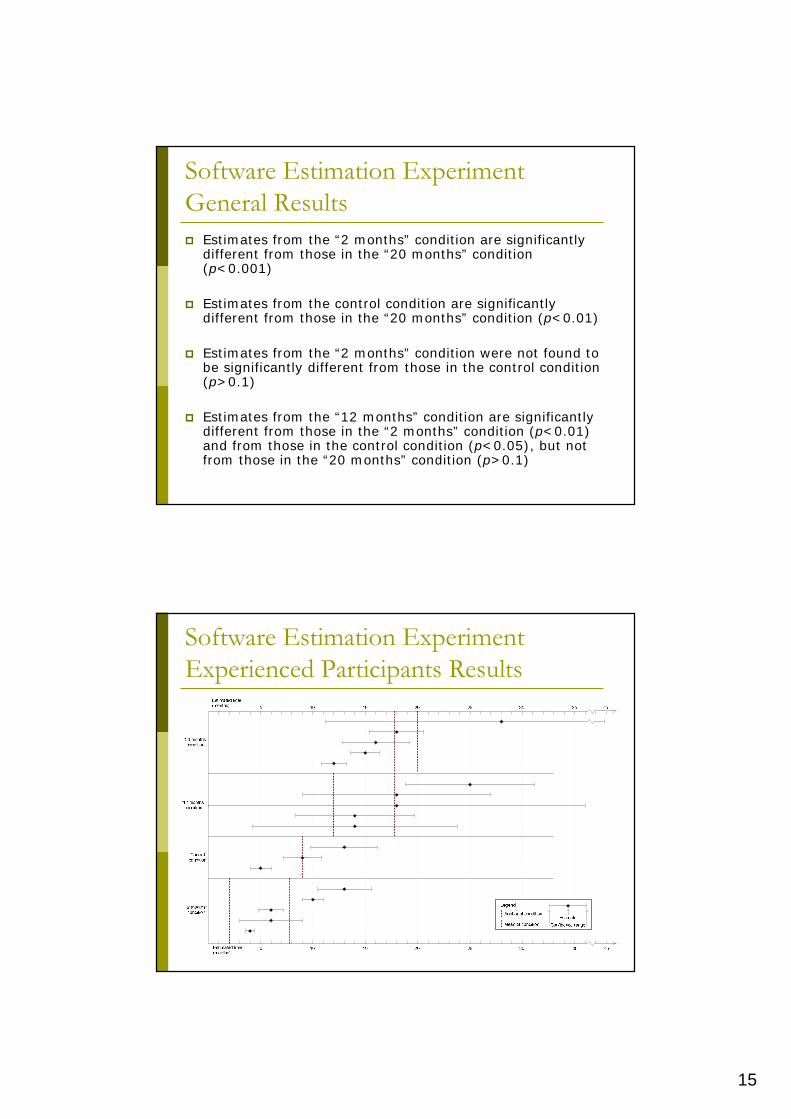
Software Estimation ExperimentExperienced Participants Results

16
Software Estimation ExperimentExperienced Participants Results
4.02
18
17.8
“12 months”
5.53.33.2Std. Dev.
1696Median
17.89.07.8Mean
“20 months”Control“2 months”
Software Estimation ExperimentExperienced Participants Results
Estimates from the “2 months” condition are significantly different from those in the “20 months” condition (p<0.02)
Estimates from the control condition are significantly different from those in the “20 months” condition (p<0.05)
Estimates from the “2 months” condition were not found to be significantly different from those in the control condition (p>0.1)
Estimates from the “12 months” condition are significantly different from those in the “2 months” condition (p<0.01) and in the control condition (p<0.05), but not from those in the “20 months” condition

17
Software Estimation ExperimentExpert-based Techniques Results
“2 months” condition
Control condition
“20 months” condition
Mean of conditionEstimate
Confidence range
Legend
Anchor of condition
Estimated time(months)
Estimated time(months)
“12 months” condition
10 20 305 15 25 4535
10 20 305 15 25 4535
Software Estimation ExperimentExpert-based Techniques Results
4.7
18
17.2
“12 months”
2.03.62.3Std. Dev.
1674Median
15.47.85.1Mean
“20 months”Control“2 months”

18
Software Estimation ExperimentExpert-based Techniques Results
Estimates from the “2 months” condition are significantly different from those in the “20 months” condition (p<0.001)
Estimates from the control condition are significantly different from those in the “20 months” condition (p<0.02)
Estimates from the “2 months” condition were not found to be significantly different from those in the control condition (p>0.1)
Estimates from the “12 months” condition are significantly different from those in the “2 months” condition (p<0.001) and from those in the control condition (p<0.05), but not from those in the “20 months” condition
Software Estimation ExperimentModel-based Techniques Results

19
Software Estimation ExperimentModel-based Techniques Results
n/a
14
14
“12 months”
7.75.50.5Std. Dev.
249.512.5Median
20.79.512.5Mean
“20 months”Control“2 months”
Software Estimation ExperimentModel-based Techniques Results
No comparison between conditions was found to be statistically significant (p>0.05 in all cases)

20
Software Estimation ExperimentGeneral Results -2 – 20 months diff.
“2 months” condition
Control condition
“20 months” condition
Mean of conditionEstimate
Confidence range
Legend
Anchor of condition
10 20 305 15 25 45Estimated time(months)
10 20 305 15 25 45Estimated time(months)
Consider the maximum (pessimistic) values on the “2 months” condition and the minimum (optimistic) values on the “20 months” condition...
Software Estimation ExperimentMaximum-Minimum Results
2.24.44.8Std. Dev.
1377Median
12.88.38.7Mean
“20 months”minimums
Control“2 months”maximums

21
Software Estimation ExperimentMaximum-Minimum Results
Maximum values of estimates from the “2 months” condition are significantly different from minimum values of estimates in the “20 months” condition (p<0.05)
Estimates from the control condition are significantly different from minimum values of estimates in the “20 months” condition (p<0.1)
Maximum estimates from the “2 months” condition were not found to be significantly different from those in the control condition (p>0.1)
Software Estimation ExperimentEstimate Ranges Results Concentrated
“2 months” condition
Mean estimation
Anchor
20%
40%
60%
80%
100%
10 20 305 15 25 45Months
Mean estimation
20%
40%
60%
80%
100%
Control condition
10 20 305 15 25 45Months
Percentage of estimators considering month Mean estimation
Anchor
20%
40%
60%
80%
100%
“20 months” condition
10 20 305 15 25 45Months
Percentage of estimators considering month Mean estimation
Anchor
20%
40%
60%
80%
100%
“12 months” condition
10 20 305 15 25 45Months
The figure to the right shows the percentage of agreement that participants in each condition had with each other.
From bottom-up, the groups are “2 months”, control, “12 months” and “20 months” conditions.
The “12 months” condition had higher ranges than usual, achieving the highest intra-group agreement, with 83%

22
Software Estimation ExperimentEstimate Ranges Results Concentrated
Software Estimation ExperimentEstimate Ranges Results Concentrated
All estimators worked on the same problem
Maximum agreement was 48%Therefore, for any outcome of project, at least 52% of estimates will be wrong

23
ConclusionsAnchoring and adjustment does take place in software estimation processes
Strength of bias too high to be ignoredResults from low anchors are statistically different from high anchorsResults from estimates without anchors are statistically different from high anchors
No statistical difference found between low anchors and control condition
Estimators optimistic/attempting to please by default?Incorrect choice for low anchor?More participants necessary to discover effect?
ConclusionsNo statistical difference found between “12 months” and “20 months” anchors
Both anchors high enough for project?“12 months” group was extracted differently (same company, possibly same business values) than the other three
“12 months” had an average range of error of 53%, against 23-33% on other groups
No effect of “12 months” natural attractor was apparent.

24
ConclusionsAnchoring and adjustment effects unchanged with experienced estimatorsStronger effect for estimators using expert-based techniquesModel-based estimations scarce (28%), bias effect inconclusive
Use of model-based techniques in line with surveys55% of inexperienced estimators chose a model-based technique11% of experienced estimators chose a model-based technique
ConclusionsWhat to do?
Shield estimators from anchorsNot always possible
Give estimates with wide min-max rangesHowever, management will think you are inexperienced
Choose a development lifecycle in which estimates are less relevant and risk is managed
Spiral model better than waterfall