Embed Size (px)
Citation preview

ANCHORAGE ~~su , ~ EST ATE :i~
4
~ ~~ARCH A51 vol. 2 RT no. 1 Spring 1 1979 ~ Copy 2 )
VOLUME II, NO. 1 - SPRING 1979

c z
-) .J
lw 2 )~
GRAPHICS ON PAGES 12, 27, 28, & 43 BY DEGLER'S ART & DESIGN
:( !
(

J3or·
~ANCHORAGE '-· ..... -~.:-..... ::.,_ •. _ •.•.•• :::::::::::...~.---=::::::----......--_,-=::::=;-_
REAL ESTATE RESEARCH REPORT
VOLUME II, NO. 1 - SPRING 1979
U t!.~~~ I~!"'%J'' '"'"' 1 r;,_ l\: ': '. " •' : .· ::, [:· \f( ~~ -~. ~ wr~ ~ ·"""'"' r, "r:- 1 1 r:: r. A ~'(
~...,_-,~~ '',t\ l!,)}:~ .. ' " .. '. . - - - . . - '·-· "~ \.. '\.
NOT TO LEAVE LIBEt\RY
Published Semiannually by the Anchorage Real Estate Research Committee
283 Muldoon Raad Box 209
Anchorage, Alaska 99504
The contributors to this report are solely responsible for statements or interpretations contained herein. We make no warranty, express or implied, and assume no legal liability or responsibility for the accuracy of this data.
No reproductions or quotations of any part of this report permitted without special authorization in writing.

ARERC
INTRODUCTION
Volume 1 of the Anchorage Real Estate Research Report contained a substantial amount of background information on the residential real estate industry in Anchorage. This edition of the Report introduces several new tapies to our publication.
The first-ever index of residential construction costs in Anchorage has been developed by Rob Gamel for the Real Estate Research Committee. This section will be updated every six months so that trends can be identified and analyzed.
Ali of the current surveys of vacancy rates in Anchorage are somewhat deficient. To overcome the shortcomings of the various surveys, the Committee is in the process of developing its own madel to determine vacancy rates and trends in Anchorage. lt is hoped that the results of this survey will be available for pu bi ication in the next edition.
This issue of the Report includes an index of classified advertising of rentai housing for trre past two years. This index was developed by Al Robinson and presents additional information about vacancies in Anchorage. The new graph depicting vacancies reported by the Joint Military Housing Referral Office at Elmendorf Air Force Base was prepared by Rob Gamel.
Other new contributions to this issue include mortgage interest rate trends by Bob Sullivan and utility costs by John Ramzy.
Of course, ali of our regular features have been updated and, in many cases, supplemented. The hard work of ali the committee members has again resulted in a most valuable source of information for the Anchorage real estate community.
Severa! tapies of particular interest will be included in the next edition of the Anchorage Real Estate Research Report. The Planning Department of the Municipality of Anchorage has conducted an exhaustive study of housing stock (by type), by grid square, from 1975 to the present. We look forward to publishing the results of their study. Drs. Husky and Ender have been developing projections of demand for residential housing through 1985, which we hope to include in the next issue.
As you can see, the next Report will contain much timely information and original research. Please mail your subscription renewal early so you are assured of a copy. Volume 1 was completely sold out, and many people were not able to obtain a copy. We appreciate the continued support and interest of our subscribers, who make this Reportpossible.
SUBSCRIPTION APPLICATION
Name ______________________________________________________________________________ _
Address ________________________________________________________________ _
City -----------------------------------State -------------------- Zip ---------------
Regular one-year subscription (including one copy of Spring and Fall issue): $50.00
Mail check to: Anchorage Real Estate Research Committee No. of Subscriptions Requested: ____ _ 283 Muldoon Road, Box 209, Anchorage, AK 99504

-
ARERC
ANCHORAGE REAL ESTA TE RESEARCH COMMITTEE
A nonprofit commuity group organized to develop and distribute factual information on trends in real estate, construction and related activities in the Anchorage area.
CHAIRMAN Robert W. Sullivan
Alaska Mutual Savings Bank
REPORT COORDINATOR John W. Ramzy
Professional Realty, lnc.
EDITOR Angie Dugick
Cook lnlet Region, lnc.
CONSULTANTS
Richard L. Ender, Ph.D. Urban Observatory University of Alaska
Lee Huskey, Ph.D. 1 nstitute of Social and
Econom ic Research
BUSINESS & ECONOMIC CONDITIONS Mary Lou Couch Alaska Pacifie Bank
Robert R. Richards Alaska Pacifie Bank
RESIDENTIAL CONSTRUCTION ACTIVITY
E. Allen Robinson Department of Housing and
Urban Development
CONSTRUCTION COSTS H. Robert Gamel Gamel Homes, 1 ne.
H. Derrell Smith Alaska Statebank
RESIDENTIAL SALES ACTIVITY Bob Baer Totem Realty
VACANCY E. Allen Robinson Department of Housing
and Urban Development
ii
James H. Hubert Federal Home Loan Bank
of Seattle
Robert R. Richards Alaska Pacifie Bank
UNSOLDINVENTORY Abe Love Home Federal Savings & Loan
MORTGAGE LOAN ACTIVITY J im Smith First Federal Savings & Loan Association
MORTGAGE INTEREST RATE TRENDS Robert W. Sullivan Alaska Mutual Savings Bank
UTILITIES John W. Ramzy Professional Realty
EMPLOYMENT TRENDS & COST OF LIVING E. Allen Robinson -Department of Housing
and Urban Development
ORGANIZATION, MARKETING & SALES Carole Bangs Security Title & Trust Company of Alaska

ARERC
H. Derrell Smith Vice President Alaska Statebank 310 Eas.t Northern Lights Blvd. Anchorage, Alaska 99503 279-7637
James L. (J im) Smith Vice President First Federal Savings & Loan Association 813 West Northern Lights Blvd. Anchorage, Alaska 99503 274-6561, ext. 228
iv
Robert W. (Bob) Sullivan Vice President Alaska Mutual Savings Bank P.O. Box 1080 Anchorage, Alaska 99510 274-3561
Barbara Withers Regional Economist-Pianning Department Municipality of Anchorage Pouch 6-650 Anchorage, Alaska 99502 264-4866

l_
ARERC
SUBSCRIBERS TO ANCHORAGE REAL ESTATE RESEARCH REPORT
Alaska Bank of Commerce Alaska Housing Finance Corporation Alaska and the Milepost Alaska Appraisal & Research Corporation Alaska Mutual Savings Bank Alaska Pacifie Bank Alaska Pacifie Ventures Alaska Statebank Alaska Resource Library Alaska Title Guaranty Alaska USA Federal Credit Union Alaska Valuation Service, lnc. Alley-Haeg, 1 ne. The Aleut Corporation Allison & Associates Enterprises Amfac Mortgage Corporation American Realtors Anchor Mortgage Consultants, 1 ne. Anchorage Times Publishing Co., lnc. Appraisal Company of Alaska Arctic First Federal j im A. Arnesen Bank of Montreal Beneficiai Standard Properties, lnc. Besse Engineering, lnc. John R. Boo ney Wayne C. Booth, J r. William P. Bredsen, j r. Burr, Pease & Kurtz, lnc. Business Communications, lnc. Cablecom-General, lnc. Carr-Gottstein Properties, 1 ne. Century 21 - Heritage Homes Coast Mortgage Company Colonial Realty, lnc. Columbia Enterprises Consolidated Services, lnc. Cook lnlet Region, lnc. E. N. Courtney Reginald K. Curtiss Delta Companies State of Alaska
Division of Economie Enterprise Ellison & Ellison Realtors Federal Home Loan Bank of Seattle Federal Home Loan Mortgage Corporation Federal National Mortgage Association First Federal Savings & Loan First Escrow Services of Alaska First National Bank of Anchorage First National Bank of Oregon G & P Services, 1 ne. Gamel Homes, lnc.
v
Avrn S. Gensburg Ward S. Hastings Duane Heyman Hickel lnvestment Company Home Federal Savings & Loan I.M.I. ISER Iowa Appraisal and Research Corporation 1 nvestment Center, 1 ne. The 1 nvestment Corporation Leland P. james Kaiser Cement & Gypsum Corporation Philip Kraus Landmark Realty Lawyers Title lnsurance Agency, lnc. Herbert Lee Lehman Brothers, Kuhn Loeb Marty Loken McDonald's Food Services, lnc. john W. MacCarthy john McMahan Associates, lnc. MGIC Management Consulting Service Management and Planning Services Marston Real Estate Marston - South The Massart Company Massey & Company, lnc. William M. Mehner Merrill Lynch Relocation Management William E. Morrison The Mortgage Corporation Multiple Listing Service, lnc. NANA Construction Co., lnc. NCP Development National Bank of Alaska Nova Real Estate, lnc. Pacifie National Bank of Washington Peoples Bank & Trust Company Pendragon House, lnc. Polar Realty Priee Waterhouse & Co. Professional Realty, lnc. Rainier National Bank Real Estate Appraiser Real Estate Services Corporation Restaurant Corporation of Alaska Seattle First National Bank Security National Bank Security Title & Trust Co. of Alaska Bill Schreck Showcase Realty & 1 nvestments Simpson, Usher & jones, lnc.

ARERC
Harold Smith Spenard Builders Supply Spokane Mortgage Company State of Alaska
Division of Land and Water Stateside Enterprises, lnc. Swain Williams Kenneth F. Swartz Tarn Construction, lnc. Target, 1 ne. Real tors Ticor Mortgage lnsurance Co. Totem Realty, lnc. United Bank Alaska United Lumber Co., lnc. University of Alaska-Library
University of Alaska Center for Cross Cultural Studies
Unwin, Scheben, Korynta and Huette Valley lnvestments Verex Assurance, 1 ne. WGM, lnc. Wakeland, Norene and McDowell, lnc. Washington Mortgage Co., lnc. Wohlforth & Flint Jack White Company Western Enterprises Yorkvest Limited Arthur Young & Co. Yukon Realty, lnc.
This list may not include ali subscribers si nee it is revised on a continuing basis.
vi

ARERC
TABLE OF CONTENTS
1 ntroduction .............. .
Anchorage Real Estate Research Committee
Subscribers to ARERC
Table of Contents ...
Index of Charts and Graphs
Municipality of Anchorage Maps
Anchorq,ge Business and Economie Conditions
Residential Construction ....
Residential Construction Costs
Residential Sales Activity
Rentai Vacancy Trends
Unsold lnventory
Mortgage Loan Activity
Mortgage lnterest Rate Trends
Utilities ...
Employment
Cost of Living .
vii
ii
v
vii
viii
3
8
16
21
31
38
40
42
44
48
50

-
ARERC
INDEX OF CHARTS AND GRAPH~
Location of Municipality of Anchorage
Municipality of Anchorage (Map)
Building Permit Trends ....
1978 Planning Districts (Map)
Multiple Listing Service Districts #5, 10, 15, 20, 25, 30, 35 and 40
Multiple Listing Service Districts# 100 and# 102 ..... .
2
12
14
23
24
Percentage of Ali Sold Residential Properties by Priee Range
Monthly Closed Sales as a Percent of Annual Closed Sales
Vacancy Trends in Residential Housing
. . . . . . . . . . . . . . . . . . . . . . . . 27
Mortgage lnterest Rate Trends
viii
28
33
43

• • r..· ~ ••• : .. : .:.• ~= ~(
.. .. . . .. .. . . . . . . . ..
t:J
D
: .
.·· ...... 1
' . •"' , . . . .. ..
~
~
oO •
;,?.$Jo•G3
PT. BARROW
ALASKA
\ Anchorage ~
,#
FAIRBANKS
•
MUNICIPALITY OF ANCHORAGE
. .. 1 • . . . . . . •' . . . . . . .. ·
. . . . . . . . . . . ... : . ... . . . . . . ': ... . . ·.· .. . ··' , . .. . . :: ..
:' :. •.i 1- =-· .... ••• t-".: .. 1-'e.t.•P.
, ...... ~ . . . .. .
\ : ·:··r ' . .. . ,,.,
Hl KAN
-... ,
)> ;;o m ;;;o (")

ARERC
1"= 10 Miles o Palmer
••; ~~klutno -••••••••••••••••••••1
Anchorage (City)
Metropoliton Areo
(,
(,'(.
(;~ '(.ù
MUNICIPALITY OF ANCHORAGE
2
~'J ~\
~~ ov ~
1 1 1 1 1 1 1 1 1
1 1 -1
1 1 1 1 1 1 1 1 1 1 1 1
! 1
••••••• ..1 1 1 ..

ARERC
BUSINESS AND ECONOMIC CONDITIONS
1
~ 3

ARERC
BUSINESS AND ECONOMIC CONDITIONS
The Anchorage economy as a whole remained stronger than expected in 1978, with employment increasing 2% to 3%. Although other measures of the Anchorage economy indicated an aggregate drop of about 5% in 1978 from the previous year; the level of the Anchorage economy was about 10% above its 1976 mark and more than one-half above levels of pre-pipeline years. lt is expected that 1979 will bring moderate increases in ali sectors of the Anchorage economy as normal growth patterns resume.
Looking to the past, the Anchorage economy ,accelerated rapidly in 1974 and 1975 in anticipation of and during trans-Alaska pipeline construction, followed by a very slow rate of growth at a sustained high level in 1976. ln 1977, however, the growth of the Anchorage economy considerably exceeded most expectations and, therefore, the decline experienced in 1978 was anticipated and should be viewed in its proper perspective.
One of the reasons for the 1978 decline is th at the Anchorage economy has a definite cyclical natur~ whereby highs, lows and plateaus occur in business activity from year to year. These business cycles are present in some form in virtually ali economies. The reasons for the cyclical nature of the Anchorage economy are basically twofold. First of ali, despite the fact that Anchorage has approximately half of the jobs in the state, the entire economy of Alaska is tiny, with the smallest gross state product in the nation. Furthermore, although Anchorage has about one-half of the statewide population, Alaska as a whole is still the smallest of the fifty states. Secondly, Anchorage as a major beneficiary of Alaska's economie growth, will fi nd its future dependent on a series of major, disjointed statewide events, some of which may not even occur and ali of which have timeframes impossible to predict. Examples of such events include construction of a gas pipeline, a petrochemical complex and an oil refinery, additional oil and gas exploration, coal development, hydroelectric projects, Native corporation investments, extension of the Alaska Railroad and the proposed capital move.
Because Anchorage serves as the financial and service center for the rest. of Alaska, it has a slightly different employment mix than the state as a whole. Of ali the jobs in An'chorage, almost one-half is in the distributive industries, more Ahan one-third are in government, and fourteen percent are in the basic industries. Also, Anchorage is headquarters for nearly two-thirds of ali the jobs in Alaska's construction and trade and service industries, and about one-half of ali the Federal government jobs in Alaska. With such a concentration of jobs in these important sectors, it is clear that Anchorage will continue to prosper from Alaskan economie development in general.
REAL ESTA TE TRENDS
ln Anchorage, nonresidential building permit values feil by one-half, returning to near the $70 million level of 1974. This represents a reaction to market conditions following the recent surge of office building construction in the Anchorage area. The Anchorage office space absorption rate feil by about one-quarter in 1978, returning to its 1976 level of about 350,000 square feet. lt is estimated that the value of new commercial construction in the Anchorage area will fall significantly in 1979 from 1978, primarily in response to high inventories. Currently there are over 300,000 square feet of office space available in the Anchorage area, which is about equal to or slightly more than the 1978 absorption rate. Further, there is a possibility that future rents could decline in the office building market which could limit the potential return to investors. This possibility, combined with the high cost of funds, could discourage some new construction.
The Anchorage home-building industry was extremely effective in keeping housing supply in line with demand during 1978. As a result, most real estate market statistics reflect a healthy Anchorage market condition.
Total dwelling units authorized by building permits in 1978 decreased by almost one-third from 1977's record year of 4,877 units. Residential building permit values dropped below their 1977 record to about $150 million, but remained above the values for any other previous year. Signs of strength were reported by the Anchorage Multiple Listing Service where, for the first three-quarters of 1978 the average number of residential sales per week increased and the average number of days required to sell a home decreased. Also, the rate of growth in the average selling priee increased from 1977's rate of growth.
4

~ ....
ARERC
On the other hand, the MLS sales to new listings ratio for the first three-quarters dropped from 58% in 1977 to 50% in 1978, and the rate of growth in sales was only half as fast as the rate of increase in new listings. lnve.ntories also increased substantially in 1978 above previous years.
ln Fesponse to potential oversupply and waning demand, new Anchorage multifamily building permits dropped substantially. The Anchorage apartment vacancy rate rose to record levels in 1978, reflecting some workers leaving Alaska in response to inadequate job opportunities, and sorne movements of households from apartments into first homes. Furthermore, apartment rents have increased less than bui'lding and maintenance costs, which diminishes the economie incentive for multifamily construction.
Conventional mortgage interest rates rose above 10% to new highs in 1978. Nonetheless, consumers were undaunted by the higher rates and responded favorably to the new higher lending limits announced late last year by FNMA and FHLMC. Furthermore, an awareness of the effects of inflation combined with high equity accumulation apparently encouraged many Anchorage residents to continue upgrading. This investment mentality seemed to outweigh consumer sensitivity to rising priees and interest rates.
1 nterest rates for home financing are expected to continue weil above 1 0% in 1979. Whether or not they rise further or fall depends entirely on the anti-inflationary effectiveness of federal fiscal and monetary policies. As of December 1978, there was no sign that inflation was under control. Nevertheless, a slowing U.S. economy accompanied by the expectation of tighter fiscal policies gives cause for hope that interest rates may start to subside in the latter half of 1979. Although interest rates remain high, there should be no shortage of funds.
The foregoing presents an unclear picture for the Anchorage real estate market. The data indicate that so far during the post-pipeline slowdown, housing demand has remained stronger than expected because upgrading demand and the aforementioned investment mentality have offset rising priees and the interest rate effects of a generally lackluster economy. There is a general consensus among those in the real estate industry that these relationships will continue in 1979. A cautious approach on the part of both builders and financial institutions is expected to continue in 1979, with probably little change in Anchorage housing starts from their level in 1978.
CONSTRUCTION TRENDS
The pace of Alaska's construction industry has subsided statewide, and 1979 should bring a lever of activity similar to that experienced in 1978. Large expenditures in the government sector once again will supply a major portion of the activity and may in fact induce a small employment increase.
Anchorage's level of activity in the construction industry, Alaska's largest basic industry, is a function of expansion both elsewhere in the private sector as weil as in government projects. Regardless of the future composition of Alaska's economie growth, the construction industry will benefit to sorne degree. However, the magnitude of growth in Alaska's construction industry will depend on both the rate of increase in government spending and the level of expansion in the private industries. If it is recognized that tighter fiscal postures could be assumed by ali levels of government, thereby suggesting slower increases in government spending, and that rates of growth in private industries are tied directly to government policies, then it is clear that the future of the construction industry in Alaska wm be affected both directly and indirectly by government actions.
TOURISM
Concerning the visitor industry, 1978 turned in an outstanding performance and ali prospects indicate continued growth in the future. Anchorage, the state's largest city, is visited by about three-quarters of ali Alaska travelers. Promotional air fares, increased tour ship traffic and more hotel room availability ali contributed to the 49th state's popularity with visitors.
1978 was the strongest visitor season in Alaska's history. Anchorage counted about 700,000 visitors in 1978, a 1 0% to 15% increase from the previous year. This compares with about 630,000 in 1977 and about 583,000 in 1976. Air travel increased nationwide, and Alaska, where more than 80% of the visitors arrive via commercial airliner, was no exception. Total air passenger traffic at the Anchorage International Airport reached three million for the first time, increasing almost 5% above 1977, despite a strike during the key
5

ARERC
summer season by one major carrier which may have discouraged additional increases. New promotional air fares attracted more travelers to Alaska, partly because the minimum seven-day required stay is less than the average ni ne da ys spent by most Alaska vi si tors.
Anchorage's hotels expanded capacity in 1978. The Hotel Captain Cook added a third tower providing an additional 200 rooms, bringing the downtown Anchorage major hotel room total up to 1 ,500. Furthermor~, Calista Corporation soon will open its new $39-million, 41 0-room hotel to be managed by Sheraton Corporation.
ln the future, if the dollar sustains its decline,abroad and if travel throughout the contine,ntal United States increases in priee, then Alaska as a whole will gain in popularity by comparison, especially in combination with new promotional air fares and tour packaging as weil as the increasing capabilities of Alaska visitor accommodations. However, du ring this year in Anchorage, air travel increases should slow to about 3% in view of the lack of major new economie events which have attracted business travelers in the recent past.
DISTRIBUTIVE INDUSTRIES
The distributive industries also play a major role in the Anchorage economy. Distributive industry employment in Anchorage declined about 1% in 1978, reflecting the general continuing slowdown in the economy. Nonetheless, the large distributive sector accounted for about 48% of ali the jobs in Anchorage. For 1979, the level of activity is expected to increase slightly.
Between November 1977 and November 1978, the Anchorage Consumer Priee 1 nd ex increased 1 0.5%. The outlook for 1979 sees the Anchorage inflation rate dropping from its 1978 rate to about 9%, reflecting anticipated national trends.
Throughout 1978 the cast of funds for both Alaska banks and Alaska borrowers increased substantially. ln january 1978, Alaska banks were paying 7.5% on six-month, large certificates of deposits. ln December 1978, the rate was 10.5%. Loan rates rose also, with the U.S. prime rate increasing from 7.75% at the first of the year to 11.75% at the end of 1978. Nonetheless, total bank loans continued to increase faster than deposits. Likewise, the loan to deposit ratio for ali Alaska banks increased from 59% in 1974 to 75% in 1978 as Alaska financial institutions responded to strong loan demand from Alaska bu si nesses.
Anchorage retail trade remained about even overall in 1978, although rates of growth varied a great deal for individual businesses within the industry. Also, many Anchorage retailers either expanded or relocated in 1978. According to a national survey, per household Anchorage retail sales were al most $19,000 in 1977. For 1979, sorne ri se is expected in Anchorage retail sales as the economy resumes its normal growth trends following the post-pipeline slowdown.
ln the transportation industry, freight handled by the Alaska Railroad was down 4% through October from the same period of the previous year. General cargo, coal and petroleum products handled by the railroad were down. At the Port of Anchorage, although general cargo increased 2% through November of 1978, total tonnage decreased 5%, primarily due to declining petroleum shipments resulting from Tesoro Alaska's Nikiski to Anchorage pipeline. Concerning incoming freight in vans, flats, and containers, 1977 and 1978 were years of virtually no growth at the Port of Anchorage. However, the more than 850,000 tons of in corn ing freight was more th an double ab ove its 1973 lev el.
Total freight handled at the Anchorage 1 nternational Airport dropped 2% from 1977 du ring 1978, returning to a level, nonetheless, weil above any other previous year with the exception of 1977. Also, incoming air freight, a more accurate reflection of the local Anchorage economy, increased 6% from the previous year.
Generally the outlook for Alaska's distributive industries in 1979 will be very similar to the pattern set in 1978. There are no new major economie developments expected to spur large increases in the supportive industries, but there also are not any anticipated negative events to bring about significant declines.
The growth of Anchorage supportive industries depends in the long run upon expansion of the basic sector and government. Therefore, the outlook for Anchorage's distributive industries reflects the future prospects for the basic industries which remain difficult to predict because of the many political uncertainties facing Alaska.
6

ARERC
GOVERNMENT
The other major employer in Anchorage is government. lncluding the uniformed military, about 45% of the jobs in Anchorage are supplied by government. A net increase in total government employment is expected in 1979.
Government spending plays a major role in the Alaska economy, and the high level of public expenditures prevented a severe post-pipeline downturn. The State of Alaska Fiscal Year 1979 budget of $1.5 bill ion is 27% ab ove the year be fore. Although the state budget is expected to continue increasing, it should do so at a decelerating rate given the current political situation.
With the exception of Fairbanks, where the demand for public services has slowed following the heavy impact made initially by trans-Alaska pipeline construction activity, local governments appear to be continuing their expansions. The Municipality of Anchorage has planned $98 million in capital expenditures for 1979, a 48% increase from 1978. However, in the fall of 1978, Anchorage voters approved less than one-third of a $126-million bond package. lt is difficult to tell if the spending contrais represented citizen resistance to increased government expenditures or if the bonding proposais were unacceptable for other reasons. The Anchorage 1979 total budget of $287 mill ion represents a 19% increase from the year before, and the general fund budget of $96 million is 7% above the preceding year.
Late in 1976 Alaska voters mandated that the capital be moved from Juneau to Willow. However, in November of 1978, voters declined to support the general obligation bond issue designed to finance 28% of the capital relocation costs. Furthermore, the voters passed an initiative requiring thatall bondable costs of the relocation be made clear and approved by the voters, with no funds spent on the relocation prior to such voter approval. Since the original legislation required that the move begin by 1980, it is unclear at this time what course of events will take place next.
Clearly, the high level of government expenditures will contribute to the Alaska economy as a whole and Anchorage will be no exception.
ln conclusion, 1979 is expected to be another year of adjustment for the Anchorage economy to post-pipeline levels of activity.
7

8
NOIL3IlHLSN03 'IVILN:IGIS:IH

ARERC
RESIDENTIAL CONSTRUCTION
Despite a flurry of activity in the three months of August through October in both single family and the smaller size multifamily housing structures, units authorized by building permits in the last two months of 1978 d ropped off considerably. The net effect was a total of 1 ,586 authorizations on the second half of the year compared with 1,703 in the first half. The grand total of 3,289 units authorized in 1978 was a decline of nearly a third from 1977's record year of 4,877 units. lt was still weil above the first year of oil pipeline activity, when 2,822 units were authorized in 1974.
Most of the past year's decline was in larger multifamily structures of 5 or more units, falling by 757 units, or 52.9 percent, due to the increasing rentai vacancy rate. The decrease in smaller multifamily housing (2- to 4-family structures) was 29.3 percent; in single family units it was off 23.7 percent; and in mobile homes the new connections were down only 4.7 percent. The year of 1978 was thus one of adjustment to the unusually active building period of 1975-77.
9

ARERC
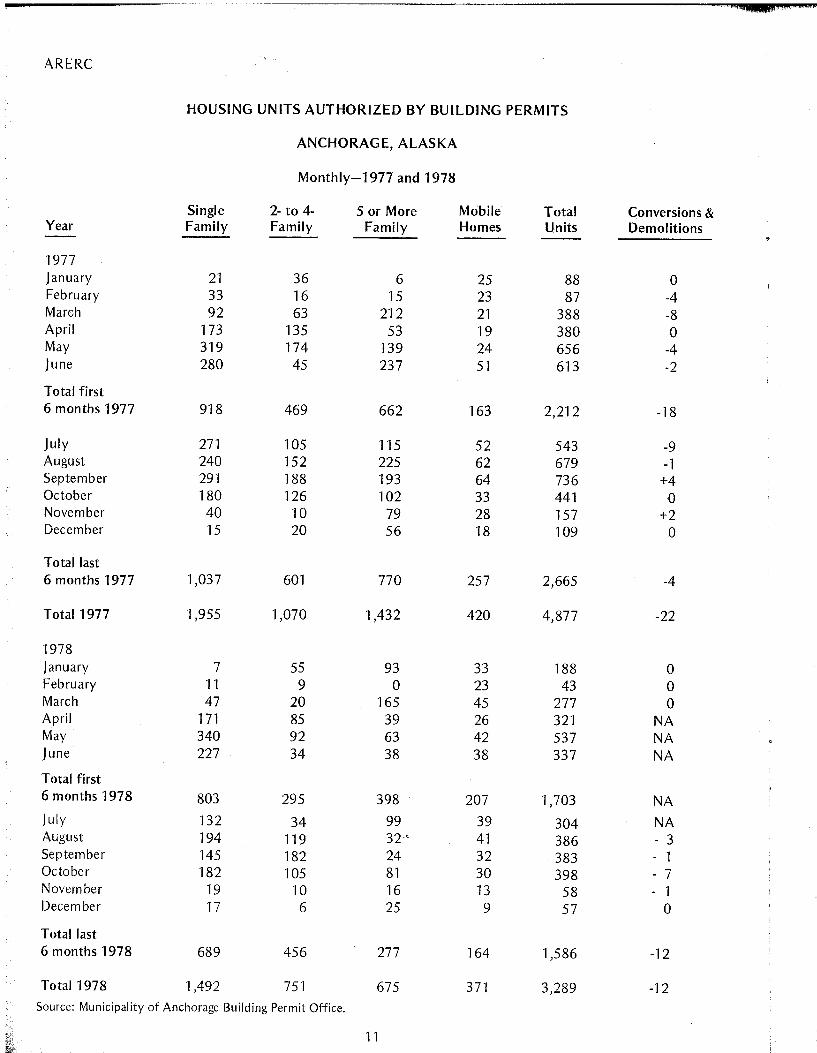
HOUSING UNITS AUTHORIZED BY BUILDING PERMITS
ANCHORAGE, ALASKA
Annually-1970 to 1978
NUMBER OF DWELLING UNITS (NOT PERMITS)
Single 2- to 4- 5 or More Year Family Family Family
1970 1,4003 ~
1,6003
1971 1,385 1,665 1972 1,445 1,506 1973 1,402 684 1974 1,798 1,024 1975 1,827 2,183 1976 1,269 2,216 1977 1,955 1,070 1,432 1978 1,492 751 675
1 Mobile home hook-ups. 2conversions may be plus or mi nus; data for 1970-7 5 are for City only. 3Estimated.
Mobile Total Hones1 Units
NA 3,0003
NA 3,0503
NA 2,951 NA 2,086 NA 2,822 NA 4,010 453 3,938 420 4,877 371 3,289
Conversions & Demolitions2
-59 -39 -63 -54 -41 -12 -46 -22 -12
Source: Municipality of Anchorage Building Permit Office; prior to 1976, City and Borough building departments.
Note: Effective January 1, 1976, ali building permits were issued by the Municipality of Anchorage as a result of the merger of the City of Anchorage and the Greater Anchorage Area Borough on September 15, 1975. Ali land use permits issued for Eagle River, Chugiak, Girdwood, and Portage areas (where building permits are not required) are included in single-family units from J uly 1972 through April 1976; beginning in May 19.76 they are reported by number of units of each type (single family, multifamily, and mobile homes).
10
ARERC
HOUSING UNITS AUTHORIZED BY BUILDING PERMITS
ANCHORAGE, ALASKA
Monthly-1977 and 1978
Single 2- to 4- 5 or More Mobile Total Conversions & Year Family Family Family Homes Units Demolitions
1977 January 21 36 6 25 88 0 February 33 16 15 23 87 -4 March 92 63 212 21 388 -8 April 173 135 53 19 380 0 May 319 174 139 24 656 -4 June 280 45 237 51 613 -2
Total first 6 months 1977 918 469 662 163 2,212 -18
July 271 105 115 52 543 -9 August 240 152 225 62 679 -1 September 291 188 193 64 736 +4 October 180 126 102 33 441 0 November 40 10 79 28 157 +2 December 15 20 56 18 109 0
Totallast 6 months 1977 1,037 601 770 257 2,665 -4
Tota11977 1,955 1,070 1,432 420 4,877 -22
1978 January 7 55 93 33 188 0 February 11 9 0 23 43 0 March 47 20 165 45 277 0 April 171 85 39 26 321 NA May 340 92 63 42 537 NA June 227 34 :58 38 337 NA
Total first 6 months 1978 803 295 398 207 1,703 NA July 132 34 99 39 304 NA August 194 119 32·· 41 386 - 3 September 145 182 24 32 383 - 1 October 182 105 81 30 398 - 7 November 19 10 16 13 58 - 1 December 17 6 25 9 57 0
Totallast 6 months 1978 689 456 277 164 1,586 -12
Total1978 1,492 751 675 371 3,289 -12 Source: Municipality of Anchorage Building Permit Office.
11

ARERC
NO. PERMITS AUTHORIZED
5,000 --
4,000 --
3,000 -
-2,000 -
-1,000 -
-0
TOTAL HOUSING UNITS AUTHORIZED BY BUILDING PERMITS Anchorage, Alaska Area
3,000
Il
1 1970
1970 ·1978
4,010 ,-
3,938 r--ï ~
3,050 2,951
2,822 ~
r---i r--;
2,086 ,..-,
1 1 1 1971 1972 1973 1974 1975 1976
COMPARISON OF BUILDING PERMIT ACTIVITY 1977 and 1978 INCREASE/DECREASE
(+ %) (- %)
4,877 r-----1
1977
Single Family Permits 2 -4 Family Permits
1977 1,955
3,289 r---1
1978
~ 1978Z//lZ/h4;2 7T//~ /ZJ 1977~ 1,070
19787/;~5VA
Multi-Family Permits -
1977 1,432
(- 29.8%)
(-23.7%)
12
(- 29.8%)
Mobile Home Hookups
1977~ 1978~
(-11.7%)

ARERC
TOTAL HOUSING UNITS AUTHORIZED 1
BY BUILDING PERMITS AND PUBLIC CONTRACTS IN SELECTED ALASKAN URBAN AREAS 2
ANNUALLY-1970 TO 1978
Anchor- Fair- Ketch-Year age banks3 juneau ikan Kodiak Sitka Kenai Sol dot na Homer Total
1970 3,000 4 444 157 94 NA 18 17 11 6 3,747 1971 3,0504 348 221 147 23 19 23 4 12 3,847 1972 2,951 439 441 119 93 41 22 16 11 4,133 1973 2,086 446 274 178 31 82 13 11 17 3,138
1974 2,822 594 122 107 43 104 25 37 35 3,889 / 1975 4,010 1,051 154 107 143 64 100 87 13 5,789 1976 3,938 998 281 117 74 136 161 138 60 5,903 1977 4,877 1,561 429 175 239 159 267 177 117 8,001 1978 3,289 806 351 104 203 121 160 69 92 5,195
1978 (by month)
Jan 188 27 8 5 10 6 4 2 251 Feb 43 19 29 13 4 25 0 0 0 133 Mar 277 36 21 14 7 11 1 6 3 376
INTi
Apr 321 138 37 6 11 5 14 5 5 542 May 537 160 56 15 45 4 28 18 29 892 -June 337 129 44 10 7 12 35 10 11 595 July 304 125 31 7 6 10 29 10 5 527
Aug 386 79 25 14 10 12 12 13 11 562 Sept 383 43 35 7 21 6 28 3 7 533 Oct 398 36 19 6 30 24 8 3 13 537 Nov 58 12 24 4 49 1 1 0 150 Dec 57 2 22 3 3 5 0 0 5 97
11ncludes mobile homes, additions, and conversions where reported. 21ncludes city and borough area combined for alllisted areas except Kenai Peninsula Borough. 3Excludes many mobile homes brought into the area, most of them outside the cities of Fairbanks and North Pole. 4Estimated.
NA-Not available.
Source: Builcting permit issuing offices.
13

ARERC
• NORTH
ONE MILE
KINCAID ROAD ~SAND
~ ~ 0 0 a: a:
~ ~ ....
STRAWBERRY ROAD
SAND LAKE
Ç>
"' §
il li i
0 ;:
a: 0 .. a: ~ .. "' ~ '3 "' 0 ~
z
RABBIT CREEK
CHUGIAK
EAGLE RIVER
ELMENDDRF A.F.B . FORT RICHARDSON
.... w w a: .... "' z a: a: ~ ....
~ """TI/ONI = / ·9
~ li'
; ,~ j t(~ ffi .... x .. .,
·~···· ~
/ \ . Î --- ~.~/ '-----~-
·~
\ ·~
.. v
----./~ -~-~~·~ § )~
',\
cl ~ ·········· \ ."--; HILLSlDË '< .
~ ABBOTT
~. /Î
~~ O'MALLEY ROAD ~
r//
1 HUFFMAN ROAD
~ ~"-.._
/ . ....---(
,4 • \ DEARMOUN ROAD ;t...-;As8ÎT c "---._ '\
1978 ANCHORAGE PLANNING DISTRICTS ~-~·~~
( ""'- ~ . ./'.----- ~-)~ GIFÙ>WOOD/ALYESKA ---~
/
14
1

ARERC ARE1
J ULY 1, 1978 SUBCOMMUNITY HOUSING UNITS FROM BUILDING PERMITS
Single Multi- Mobile Family Duplex Family Home Other
Government Hill 147 146 1,078 1,371 North Mountain View 740 168 1,214 222 2,344 Fairview/Downtown 1 '735 481 3,738 142 286 6,382 South Mountain View 1,863 500 1,531 1 '134 100 5,128 lnlet View/Turnagain 1,368 259 432 54 16 2,129 Spenard 3,356 867 5,288 1,476 140 11 '127 Lake Otis 2,609 382 1,258 10 245 4,504 North Muldoon 2,087 460 1 '113 1,422 5,082 South Muldoon 2,539 352 696 586 4,173 Abbott Loop 1,445 126 702 541 2,814 Sand Lake 3,547 526 1,705 134 5,912 Campbeii/Kiatt 1,297 124 215 873 2,509 O'Malley /Hillside 3,635 67 90 2 3,794 Oceanview 910 45 65 15 1,035
Total 27,278 4,503 19,125 6,611 787 58,304
Source: Municipality of Anchorage.
15

9L
SLSO:l NOIL:lflliLSNO:l 'IVILN3GIS3ll
ARERC
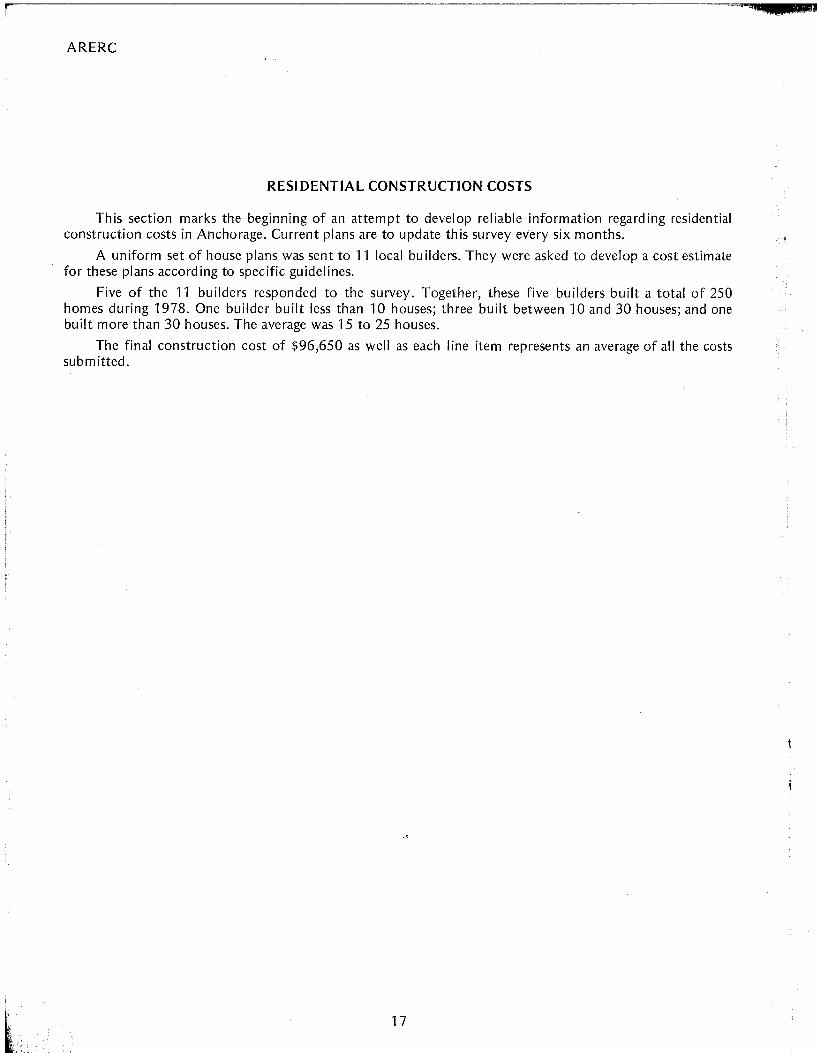
RESIDENTIAL CONSTRUCTION COSTS
This section marks the beginning of an attempt to develop reliable information regarding residential construction costs in Anchorage. Current plans are to update this survey every six months.
A uniform set of house plans was sent to 11 local builders. They were asked to develop a cast estimate for these plans according to specifie guidel ines.
Five of the 11 builders responded to the survey. Together, these five builders built a total of 250 homes du ring 1978. One builder built less than 10 houses; three built between 10 and 30 houses; and one built more than 30 houses. The average was 15 to 25 houses.
The final construction cast of $96,650 as weil as each line item represents an average of ali the costs submitted.
17

ARERC
INSTRUCTIONS TO BUILDERS
GUIDELINES FOR CO~TING OUT ARERC PLANS
1. The purpose of this survey is to determine as accurately as possible the average component costs of building a rather typical "Aiaskan box"; i.e., a garage under split entry with an unfinished downstairs.
2. We have included a material takeoff from Spenard Builders Supply which includes trusses, windows and doors to aid you in this pricing area.
3. The plans reproduced are a few years old, so we ask that you priee them out according to current building requirements, such as smoke detectors, etc.
4. A special note: please use current priees as of January 1, 1979. For the purposes of this survey, assume that no extra costs would be incurred for winter construction. Therefore, in figuring flat work for example, do not add in heat charges for winter construction.
5. We have tried to make notations on the plans listing the most common construction methods utilized today, such as asphalt versus concrete driveways, 5/8" vs. W' subfloor, T-11 siding and a few others. Because most builders still use 2x4 wall construction rather than 2x6, we retained the 2x4 design.
20

ARERC
RESIDENTIAL SALES ACTIVITY
21

ARERC
RESIDENTIAL SALES ACTIVITY
Statistics summarizing Anchorage area residential sales for each calendar year have been completed and are presented in the attached tables. Figures include the Mat-Su Borough, as many residents of that Borough commute to Anchorage and are a part of that market. ln addition, because of the statistical information available, a very minimum number of non-Anchorage, Mat-Su sales are included, but these have little or no bearing on the total picture.
The figures regarding residential sales have been obtained from Multiple Listing Service, lnc. Presently, 184 real estate agencies and over 1,500 agents in the Anchorage area report sales to the MLS. lt is estimated that over 90 percent of the total residential sales in Anchorage are reported to MLS, and are thus included in the statistics presented here.
The latest available data from MLS have been used. Revisions of data occur in each edition of the MLS due to the fact that some sales do not close and this information needs to be incorporated into the data. These revisions are most prevalent in data published during the most recent six months, and do not significantly affect older data.
22

ARERC
• NORTH
ONE MILE
.t"-... INTERNATIONAL AIRPOR
-15- West Tudor - Dimond u-r
RASPBERRY ROAD
KINCAID ROAD SAND ;Y.ÏcË)
0 STRAWBERRY ROAD
~~~ ~ a:
~ ~ 0 _,
-20- Dimond South
5- DOWNTOWN 10- SPENARD 15 -WEST TUDOR - DIMOND 20- DIMOND SOUTH 25- ABBOTT ROAD- RABBIT CREEK 30- EAST TUDOR - ABBOTT ROAD 35- EAST DEBARR- TUDOR
KLATTROAD
0
~ a:
40- MOUNT AIN VIEW- MERRILL FIELD
ELMENDORF A.F.B.
r· ....,_'./
-40- Mountain View - Merrill Field
~
... w w a: t; z 0: a: ::J ...
z / East Debarr
CRE~ ' /~ . '-.._ _/'./ i\__ ---- \
\, V\ \_
/ \ 0
~ '\ R
Tudor
-30- East Tudor - Abbott Rd .
~ /0 -25- Abbott Road - Rabbit Creek
O'MALLEY ROAD
/
r/ 1
. ./- - HUFFMAN ROAD
{<01'0
CREEK ___r-. ____..... . .....__ -~
~-/'-·~--- ....______---- ..___ / /
MULTIPLE LISTING SERVICE DISTRICTS
23

ARERC
~·
1
102 MAT-SU
BOROUGH
100 EAGLE RIVER
MULTIPLE LISTING SERVICE DISTRICTS
24

ARERC
12/31/1978 12/31/1977 12/31/1976 12/31/1975
SUMMARY STATISTICS-ANCHORAGE MULTIPLE LISTING SERVICE
ANNUAL SALES STATISTICS*
Average Market Average Listing Priee
Average Sales Priee Time Sold (Days)
$80,719 73,428 66,665 59,722
$79,869 72,577 65,609 58,965
53 55 60 50
*Statistics computed as of December 31 each year.
Average Selling Priee
No. of Sales
Total Volume Residential Closed
$
TOTAL RESIDENTIAL SALES STATISTICS (January 1 through December 31)
1978 1977 1976
79,869 $ 72,577 $ 65,609
2,864 2,579 1,895
$228,746,832 $187,176,172 $124,330,744
Average Listing Priee
Houses Not Sold
$86,660 76,683 73,278 67,264
1975
$ 58,965
1,606
$94,699,226
FINANCING METHOD BY PERCENT OF TOTAL RESIDENTIAL MARKET
State and FHA Federal VA Conventional Assumption M iscellaneous
1978 3.60% 24.09% 51.60% 10.71% 10.00% 1977 1.52% 26.79% 52.34% 8.41% 10.94% 1976 2.26% 27.46% 48.60% 12.70% 8.98% 1975 4.08% 26.58% 42.02% 13.13% 14.19%
WEEKL Y SALES VOLUME
J an.-Dec. 1978 jan.-Dec. 1977 jan.-Dec. 1976 Jan.-Dec. 1975
Average Sales Per Week 55 50 36 31
Total Residential Listings 1,441 994 677 457
Weeks of Listings of lnventory 26.2 19.9 18.9 14.7
RESIDENTIAL SALES STATISTICS
1978 1977 1976 1975
Average Sales Priee $81,875 $73,815 $66,812 $59,516
% lncrease Over Previous Year 10.9% 10.5% 12.26% N/A
*These figures include Anchorage, Eagle River, and Chugiak sales statistics only.
25

ARERC
RESIDENTIAL SALES BY NUMBER OF BEDROOMS 1978, 1977 AND 1976
-1978- -1977- -1976-2 Bedrooms
Units-(AII off Market) 1,074 855 803 Units-(Not Sold) 523 337 382 Average List Priee $ 66,916 $ 59,937 $ 61,834 Units-(AII Sold) 551 ... 518 421 Dollar Value $ 35,715,902 $ 30,956,729 $ 23,444,785 Average List Priee $ 65,664 $ 60,402 $ 56,408 Average Sale Priee $ 64,820 $ 59,762 $ 55,688 Average Sale Time (Days) 57.14 61.31 71.1
-1978- -1977- -1976-3 Bedrooms
Units-(AII off Market) 2,743 2,103 1,647 Units-(Not Sold) 1,274 828 772 Average List Priee $ 85,655 $ 74,225 $ 71 '163 Units-(AII Sold) 1,469 1,275 875 Dollar Value $115,988,622 $ 90,643,063 $ 55,781,708 Average IJ.5t Priee $ 79,701 $ 71,749 $ 64,670 Average Sale Priee $ 78,957 $ 71,092 $ 63,750 Average Sale Time (Days) 52.99 56.88 58.9
-1978- -1977- -1976-4 Bedrooms
Units-(AII off Market) 1,386 1,071 933 Units-(Not Sold) 650 386 418 Average List Priee $ 100,192 $ 90,786 $ 82,892 Units-(AII Sold) 736 685 515 Dollar Value $ 66,963,708 $ 56,767,069 $ 38,220,501 Average List Priee $ 91,917 $ 84,008 $ 75,665 Average Sale Priee $ 90,983 $ 82,871 $ 74,214 Average Sale Time (Days) 50.30 47.58 55.4
-1978- -1977- -1976-Over 4 Bedrooms
Units-(AII off Market) 253 206 186 Units-(Not Sold) 145 105 102 Average List Priee $ 106,048 $ 97,967 $ 92,744
~ Units-(AII Sold) 108 101 84 Dollar Value $ 1 0,078,600 $ 8,809,311 $ 6,883,750
•,>
Average List Priee $ 95,044 $ 89,674 $ 83,671 Average Sale Priee $ 93,320 $ 87,220 $ 81,949 Average Sale Time (Days) 55.10 54.83 53.40
Source: Anchorage Multiple Listing Service.
26

ARERC
l-~~--~
PERCENT AGE OF ALL SOLO RESIDENTIAL PROPERTIES BY PRICE RANGE 1978
E·9.3%
D-22.2%
c. 31.4%
A· UN DER $54,~99 8 · $55,000 TO $69,999 C · $70,000 TO $84,999 D · $85,000 TO $99,999 E · $100,000 TO $124,999 F · $125,000 AND OVER
27
8·23.6%

IV 00
11.00
10.00
9.00
8.00
• • • • 7.00
. . /
1/ t/
6.00
5.00
4.00
"'
MONTHLY CLOSED SALE AS A PERCENT OF ANNUAL CLOSED SALES COMPARISONS 1976_1977 __ 1978 ••
• • 1 ' •
,
IX \ .. ·· • • 1
/ •• ----.!--_ • 1
•• f">( • • ~,~ ' •• • 1 ' • • • ' . ' • ,. 1 •• ' ,. 1 . . . . .
1-- ... , v "'
. .
.1/ ~,o." 1 • • '\ ...... ,.. . . . ... ......... r-------- •' • . • • •
1 •
1 •
~{ 1 \ 1 '1
----- ~- -- ----
• . •
• ~ . ' . ' . ',·
't ~ ., . ', . '
': ' ' ~·· . ' ' ' ~',, ' ~
• • •
.... \ • . • • . • • • • • • .
---3.00 JAN FEB MAR APR MAY JUN JUL AUG SEP OCT NOV DEC
)> ;;c 1"1'1 ;;tl (')

ARERC
PROFILE OF RESIDENTIAL SALES ACTIVITY ANNUAL STATISTICS-1975, 1976, 1977, 1978
Anchorage Multiple Listing Service*
J anuary 1 to December 31, 1978 J anuary 1 to December 30, 1977 Average
Percent of Average Listing
Average Average Listing Sale Time- Priee-
Unit %Total Dollar %Sales Listing Selling Priee Houses Sold Houses Not
District Sales Market Volume Activity Priee Priee Received Median Sale (Da ys) Sold
En tire District 2,864 100.00 228,746,832 52.49 80,719 79,869 98.94 78,750 53.2 86,660
5 34 1.18 2,625,500 69.38 75,602 77,220 102.13 69,500 38.8 84,566
10 179 6.25 14,822,950 55.59 83,928 82,809 98.66 76,500 42.7 89,877
15 435 15.18 34,432,915 60.08 79,712 79,156 99.30 78,450 51.9 84,707
20 364 12.70 31,618,763 51.19 87,509 86,864 99.26 84,600 63.8 96,266
25 278 9.70 27,147,910 49.46 98,739 97,654 98.90 95,000 60.3 111,679
30 118 4.12 9,388,662 56.19 80,228 79,564 99.17 81,000 51.1 81,234
35 713 24.89 56,434,371 66.26 79,960 79,150 98.98 80,500 44.8 89,541
40 146 5.09 10,136,492 59.10 70,427 69,428 98.58 67,750 41.2 79,486
100 256 8.93 19,963,075 47.76 78,947 77,980 98.77 79,625 59.6 84,749
102 253 8.83 16,596,694 38.33 67,027 65,599 97.86 65,000 60.5 74,840
J anuary 1 to December 30, 1977
En tire District 2,583 100.00 187,456,322 61.41 73,421 72,573 98.84 71,000 55.2 76,580
5 25 .96 1,808,000 64.10 74,806 72,320 96.67 65,500 78.4 69,385
10 194 7.51 13,837,825 67.59 72,320 71,328 98.62 67,500 58.5 79,519
15 394 15.25 27,829,838 69.00 71,230 70,634 99.16 68,500 52.8 76,803
20 352 13.62 27,348,920 57.32 78,679 77,695 98.74 76,000 69.0 82,950
25 282 10.91 23,993,568 63.51 86,149 85,083 98.76 82,664 56.7 95,371
30 127 4.91 9,092,250 53.13 72,248 71,592 99.09 73,900 48.7 71,402
35 725 28.06 53,473,781 75.52 74,474 73,756 99.03 73,500 44.8 79,560
40 133 5.14 7,959,200 65.19 60,898 59,843 98.26 58,000 47.3 64,487
100 161 6.23 11,253,500 54.57 70,681 69,897 98.89 70,500 60.0 76,481
102 119 4.60 7,140,650 36.50 60,614 60,005 98.99 56,950 66.0 65,271
January 1 to December 31, 1976
En tire District 1,895 100.00 124,330,744 53.09 66,665 65,609 98.41 66,000 60.5 73,278
5 27 1.42 1,672,900 35.52 63,212 61,959 98.01 60,000 67.8 80,797
10 165 8.70 10,785,563 65.47 66,582 65,367 98.17 63,000 94.8 72,739
15 334 17.62 22,104,362 57.68 66,533 66,180 99.46 65,500 65.8 71,482
20 223 11.76 16,461,500 43.38 74,997 73,818 98.42 73,500 70.6 78,845
25 166 8.75 13,213,476 46.89 81,303 79,599 97.90 76,950 65.2 89,792
30 111 5.85 7,398,335 53.62 67,794 ·'-66,651 98.31 67,500 61.0 67,476
35 529 27.91 34,126,830 61.65 65,568 64,511 98.38 62,500 44.7 72,151
40 92 4.85 5,030,522 55.08 55,695 54,679 98.17 55,000 51.9 58,989
100 122 6.43 7,396,850 51.47 61,872 60,629 97.99 64,000 46.2 69,633
102 54 2.84 2,783,045 37.76 51,993 51,537 99.12 48,750 68.6 72,251
*See footnote on following page.
29

&
' 1
A
ARERC
january 1 to December 31, 1975*
Entire District 1 ,606. 100.00 94,699,226 56.70 59,722 58,965 98.73 58,000 50.3 67,264 5 19 1.18 1,074,100 44.18 58,447 56,531 96.72 51,500 58.4 71,485 10 149 9.27 8,658,750 57.75 59,232 58,112 98.10 58,000 41.4 65,563 15 271 16.87 16,016,292 57.05 59,714 59,100 98.97 58,000 49.9 63,752 20 173 10.77 11 '124,855 49.28 64,393 64,305 99.86 65,200 55.7 72,663 25 174 10.83 11,867,063 52.25 69,289 68,201 98.43 67,750 63.7 84,540 30 70 4.35 4,167,925 60.86 59~912 59,541 99.38 61,500 40.2 66,352 35 465 28.95 27,427,718 69.50 59,827 58,984 98.58 57,000 42.9 70,607 40 121 7.53 6,263,700 51.05 52,342 51,766 98.89 50,000 59.8 58,570 100 108 6.72 5,648,923 56.84. 53,015 52,304 98.65 53,250 52.6 59,062 102 24 1.49 1,087,300 35.82 46,679 45,304 97.05 45,000 75.0 55,625
*Multiple Listing districts 101 and 103 through 106 are in other areas of the State, and thus were excluded from these statistics. Also, because of the higher number of non-MLS brokers in the excluded districts, the reported data in those districts are not considered to be representative of actual sales activity. Since these small districts were not included, columns such as"% of the Total Market" total slightly less than 100% and "Unit Sales" do not add.
The districts referred to above are depicted on pages 23 and 24.
30

ARERC
RENTAL VACANCY TRENDS
31

î" 1
ARERC
RENTALVACANCYTRENDS
Vacancies in the Anchorage area's rentai housing have continued to increase since m id-1978. This trend is evident from two measures. The former weekly and recently semi-monthly counts of apartment vacancies taken by phone by the Joint Military Referral Office at Elmendorf Air Force Base show an overall increase in vacancies from nearly 14 percent at the end of June to al most 22 percent at the end of December 1978. This sample of low, median, and high rent apartments has been broadened from 3,222 to 4,001 units currently. As indicated in the following table, the lower rent apartments have been about one-fourth empty in the last two months of 1978. Sizeable vacancy increases were also recorded in December in both the medium and higher rent groups of apartments.
The same upward trend has been noted in a count of classified ads in the Sunday edition of the Anchorage Times. Ali family type units, both homes and apartments (furnished and unfurnished} have been counted as number of ad listings only, not the number that may be vacant. This rough measure, however, exhibits broad trends. Compared to a total listing cou nt of around 700 in late June 1978, this figure grew to over 800 in nearly ali the Sundays of November and December. By January 7, 1979, the total exceeded 900 for the first time. These ad counts over the past few years have typically shown some decline in the summer months when more construction activity usually occurs.
The Anchorage Real Estate Research Committee is currently developing its own methodology for determining vacancy rates. We hope to include this information in the next volume of the Report.
32

ARERC
1
1
V AC ANCY TRENDS IN RE~ This chart indicates the trend of rentai housing vacancies as reported by the Joint Military Housing Referral Office at Elmendorf Air Force Base. The weekly reports have been averaged on a monthly basis. From October 1974 to the end of 1977, these vacancy rates were reported in two rentai categories; the lower rent apartments below $300 per month, and the medium and high rent apartments combined at rents of $300 or more. Beginning in January 1978, these last two categories were separately reported so that the low, medium and high rent apartments are in distinct rentai groups. There is some overlapping, however, of rent ranges between unit sizes. The three rentai categories as of January 1978 are as follows:
Low Medium High
0-&1-BR
$150-$299 $300-$375 $376 & Over
2-BR
$200-$300 $301-$400 $401 & Over
3-BR
$225-$350 $351-$465 $466 & Over
Source: Joint Military Housing Referral Office, Elmendorf Air Force Base
Low Medium to High Medium High
4-BR
$300-$390 $391-$500 $501 & Over
" 1 \
r
1
1 \ 1 \ 1
1 \ 1
1
1
r
1
1 1
1
A 1 V
/ --,.,...., -
/ -...,.-" /""- _,
1 ------"
/ ' 1 / ' / "-- - "'"\ 1 ' .) ' _. ,__...--
------L-~~~--~--~--r-~---.==~--~~r=~~-r--~=-~~~~---r--,---r-~~~---r--,--r--1-
O::T AOV JJli:: .JAN !PB !1tf~ !14Y ZN .70L Al6 5éP (1J (Vol
7S 75 7.5" '7.5 76 76 76 7b 7(o 76 76 76 70 70 76
33

~ RESIDENTIAL HOUSING
1 1
.,.
.. 1
1 1
!""
-
r--, /'\ 1 " / \ 1 '-/
\ 1 \ 1
1 \_-/
...... J - ....._ 1
.... " 1 \ 1 \ 1 \ 1 \ 1 1 1 \__..}
1 1 1
1
1
1 1
/
r
/~ . \ /. \
:\ 1 ' 1 • 1 •
r·-\ fi. J
/ .. •' \ 1 •. 1 . 1 \ ' ' ,
' .. i \ :\ 1 . 1 \.· ;/ \, i : •/ v \f 1
1 1 1 \ /~\ 1 v \ 1
\ 1 \ r----J
\ 1 \ 1
..;
, ..
;> dr )ov ZfC Jw tEB ~~AR k ,~y Jo# JUL JJ26 .:JP d71Jav z>k ~N lb JAR k- kr .bN dvL Aas stP h kûv tEe ~ 76 70 76 '11 77 7'7 1'7 77 77 77 77 '7'7 77 77 77 78 79 78 78 78 ?8 78 78 '78 78 76 78
34

r-~-·~M··-----
ARERC 1 1978 ANCHORAGE CIVILIAN RENT AL HOUSING VACANCY RATES
1978 Low Medium High Average
Jan. 6 3.5 13.1 12.6 8.3% 13 4.1 13.6 17.4 9.5% 20 13.4 13.0 17.2 13.9% 27 14.3 13.7 16.1 14.4%
Feb. 3 14.5 14.5 17.2 15.0% 10 16.3 14.5 16.6 15.7% 17 16.4 13.4 17.4 15.5% 24 16.2 11.0 14.1 14.1%
Mar. 3 16.2 11.5 15.7 14.5% 10 14.9 10.5 16.8 13.7% 17 14.7 8.7 21.9 13.9% 24 14.7 9.9 18.1 13.7% 31 14.2 11.5 15.2 13.4%
Apr. 7 17.1 15.9 7.8 15.1% 14 15.7 14.2 9.2 14.1% 21 15.8 9.5 12.5 13.1% 28 13.4 9.5 14.5 13.3%
May 5 14.1 11.7 15.2 13.5% 12 14.9 10.4 16.1 13.5% 19 14.7 10.1 19.9 14.0% 26 14.2 11.2 21.0 14.3%
June 2 13.9 9.6 18.1 13.2% 16 15.0 8.8 18.3 13.4% 30 15.0 10.0 17.7 13.8%
July 28 11.8 7.5 17.5 11.1
Aug. 11 12.9 9.7 19.7 12.9
Sept. 1 22.7 9.1 11.1 15.7 15 18.1 9.5 15.9 14.4
Oct. 7 17.5 10.2 15.9 14.5 14 22.3 9.8 16.2 16.4 20 21.9 9.0 15.2 15.5 27 22.3 10.1 13.8 15.8
Nov. 4 25.4 8.8 13.4 16.5 17 25.4 9.3 13.3 16.7
Dec. 15 24.9 14.9 17.3 19.4 29 26.8 16.1 22.2 21.8
Annual Average- 1978 16.4 11.2 16.0 14.4
1 Rent ranges by unit size (number of bedrooms) are as follows:
0- & 1-BR 2-BR 3-BR 4-BR
Low $150-$299 $200-$300 $225-$350 $300-$390
Medium $300-$375 $301-$400 $351-$465 $391-$500
High $376 & Over $401 & Over $466 & Over $501 & Over
Source: joint Military Housing Referral Office, Elmendorf Air Force Base.
35

ARERC
CLASSIFIED AD LISTINGS FOR RENT IN ANCHORAGE TIMES
SELECTED DATES, 1977-1978
Monthly Average Mobile
Homes Efficiencies Apts. Furn. Apts. Unfurn. Total Total Homes
May 29, 1977 42 13 162 ,. 161 378 378 7
june5, 1977 49 9 165 200 423 391 10 june 12, 1977 53 6 163 154 376 14 june 19, 1977 48 6 157 192 403 12 june 26, 1977 65 12 134 154 365 11
july 17,1977 45 10 153 162 370 364 6 j uly 24, 1977 32 12 140 145 329 6 july31,1977 55 8 161 171 395 14
August 7, 1977 41 11 162 167 381 379 15 August 14, 1977 53 11 145 159 360 13 August 21, 1977 51 16 136 165 368 9 August 28, 1977 54 13 166 173 406 20
September 4, 1977 42 12 182 149 385 380 11 September 11, 1977 49 9 181 167 406 11 September 18, 1977 50 15 167 157 389 14 September 25, 1977 46 7 143 146 342 21
October 2, 1977 54 15 203 180 452 469 18 October 9, 1977 69 11 195 180 455 28 October 16, 1977 77 13 174 189 453 15 October 23, 1977 81 14 186 202 483 16 October 30, 1977 65 17 179 243 504 14
November 6, 1977 62 15 196 228 501 530 15 November 13, 1977 65 25 184 246 520 17 November 20, 1977 70 20 184 269 543 14 November 27, 1977 71 22 212 253 558 20
December 4, 1977 77 25 231 304 637 567 34 December 11, 1977 69 34 221 282 606 26 December 18, 1977 73 25 210 244 552 23 December 25, 1977 66 16 184 208 474 12
j anuary 1, 1978 66 19 206 258 549 615 19 ,. J anuary 8, 1978 63 23 222 310 618 23 J anuary 15, 1978 61 22 226 324 633 22 January22, 1978 53 23 236 306 618 25 j anuary 29, 1978 65 25 253 318 661 23
February 5, 1978 71 24 262 314 671 620 17 February 12, 1978 69 25 215 292 601 22 February 19, 1978 83 21 201 283 588 12
Mareil 5, 1978 74 34 236 291 635 584 16 March 12, 1978 64 26 239 284 613 11 March 26, 1978 57· 22 186 240 505 12
36 "-"'TI!ilfft ~""hiNm· Ph

ARERC
CLASSIFIED AD LISTINGS FOR RENT IN ANCHORAGE TIMES
SELECTED DATES, 1977-1978 (conti nued) Monthly
Average Mobile
Homes Efficiencies Apts. Furn. Apts. Unfurn. Total Total Homes
April 2, 1978 56 21 225 272 574 543 13
April 9, 1978 67 19 211 285 582 17
April 16, 1978 64 14 207 211 496 28
April 23, 1978 64 7 217 263 451 18
April 30, 1978 70 19 249 277 615 23
May 7, 1978 69 14 271 280 634 604 18
May 14, 1978 57 15 273 297 642 17
May 21, 1978 35 13 235 264 547 26
May 28, 1978 64 18 239 273 594 22
june 4, 1978 81 16 281 291 669 630 24
june11,1978 62 15 270 288 635 16
june 18,1978 72 8 263 265 608 25
June 25, 1978 74 11 250 276 611 16
july2, 1978 82 16 258 272 628 680 21
july9, 1978 95 17 297 284 693 21
july16, 1978 86 19 289 303 697 19
j uly 23, 1978 90 11 275 324 700 19
j uly 30, 1978 97 13 258 316 684 16
August 6, 1978 86 15 308 318 727 711 22
August 13, 1978 69 13 293 298 673 27
August 20, 1978 101 10 268 305 684 17
August 27, 1978 116 16 308 320 760 15
September 3, 1978 89 23 272 335 719 710 20
September 10,1978 95 21 292 320 728 16
September 17, 1978 76 14 255 318 663 19
September 24, 1978 89 17 273 354 733 23
October 1, 1978 101 27 276 318 722 739 30
October 8, 1978 107 25 276 304 712 27
October 15, 1978 89 21 273 307 690 25
October 22, 1978 113 17 297 320 747 37
October 29, 1978 105 21 330 370 826 50
November 5, 1978 106 28 323 345 802 802 39
November 12, 1978 104 20 307 333 764 36
November 19, 1978 138 27 326 322 813 33
November 26, 1978 154 26 305 346 831 34
December 3, 1978 136 26 338 362 862 808 28
December 10, 1978 142 23 320·- 368 853 29
December 17, 1978 132 21 318 366 837 28
December 24, 1978 102 12 279 278 671 29
December 31, 1978 120 28 333 338 819 25
37

8f
..
XHOLN3ANIG'IOSN11
::nt3~V

ARERC
UNSOLDINVENTORY
ANCHORAGE TOTAL CONSTRUCTION ACTIVITY AS OF DECEMBER 31, 1978
Single-Family Construction (1-4 units), excluding condominiums
Number: 996 Percent Sold: 56% Percent U nsold:
Condominiums
Number: 612 Percent Sold: 35% Percent Unsold:
Multi-Family (over 4-plex)
Number: 29 projects 377 units
44%
65%
This sample was kept on a simple basis in arder to facilitate ease of data acquisition and to insure maximum response from those institutions which participate in construction lending. Virtually alllending institutions with offices in Anchorage responded to the questionnaire.
Questionnaires were sent to ali banks, savings and loans, mutual savings banks, credit unions and mortgage companies in Anchorage. Twenty institutions, representing ali major lenders, responded to the survey. Although it is very difficult to quantify, it is estimated that this sample represents over 90% of construction activity in Anchorage during 1978.
If there is a problem in the sample, it lies in the area of multi-family units. Since it may not be uncommon for out-of-state institutions to finance construction of some of Anchorage's larger projects and since those institutions are unknown at this time, their totals are not included in these figures.
Because this report is not preceded by others with similar sampling techniques, it is difficult to draw sweeping conclusions. However, at !east one thing appears evident, single-family houses are still built in larger quantities than condominiums, and these houses seem to have better market acceptance as evidenced by the significantly greater proportion of houses sold as a percentage of total constructed when compared to condominiums.
39

ov
XLIAIL:JV NVO~ 3DVDLHOW

ARERC
MORTGAGE LOAN DELINQUENCIES
Number of Days Delinquent
Loans1 30 60 90 Total
6/30/76 10,923 1.97% .45% .28% 2.70% 12/31/76 11 ,551 2.17% .44% .47% 3.08% 6/30/77 12,094 1.95% .39% .43% 2.77% 12/31/77 13,232 2.10% .46% .42% 2.98% 6/30/78 14,530 2.37% .41% .38% 3.15% 12/31/78 16,446 2.32% .44% .46% 3.22%
Total No. Number of Days Delinquent of Loans
Outstanding 30 60 90 Total
6/30/76 FHLMC 3,541 54 8 1 63 FNMA 4,640 116 25 12 153 AHFC2 . 2,742 __iL _16 _ _1_8 79
10,923 215 49 31 295
12/31/76 FHLMC 3,564 75 10 3 88 FNMA 4,782 126 29 12 167 AHFC2 3,205 _2Q_ _12_ ___12_ ...lQL
11 '551 251 51 54 356
·,: 6/30/77 FHLMC 3,564 67 7 4 78 !
FNMA 4,640 116 25 12 153 AHFC 2 3,890 53 15 36 104
12,094 236 47 52 335
12/31/77 FHLMC 3,467 86 8 5 99 FNMA 4,842 138 29 11 178 AHFC 2 4,923 ___ii_ _li_ -22._ 117
13,232 278 61 55 394
6/30/78 FHLMC 3,654 71 16 10 97 FNMA 5,220 184 24 10 218 AHFC2 5,656 89 19 35 143
14,530 344 59 55 458
12/31/78 FHLMC 3,742 87 15 12 114 FNMA 6,088 217 29 18 264 AHFC 2 6,616 _lL ___2_L 46 152 --
16,446 382 72 76 530
1 The nu mber of loans outstanding is the total number of loans owned by FHLMC, FNMA, and AHFC in Alaska. Approximately 80% of these loans are on owner-occupied single-family residences in the Anchorage area. These loans represent approximately 90% of ali conventional residentialloans in Anchorage.
2AHFC bases its delinquency statistics on seller/servicer reports which have monthly eut-off dates ranging from the 13th-20th of a mon th. Consequently AH FC reports its mortgage loan delinquencies on a 50-80-110 day basis.
41

ARERC
..
MORTGAGE INTEREST RATE TRENDS
""
42

ARERC
INTEREST RATE
11.00%
10.75%
10.50%
10.25%
10.00%
9.75%
9.50%
9.25%
9.00%
8.75%
8.50%
8.25%
8.00%
7.75%
7.50%
7.25%
7.00%
8.795
~ 8.750
~ t:::: ~ t:::;
~ t= ~ t::::
@] ~ t:::: ~ .--
~ == c::: .--
~ == t::::: ~ .--
~ ~ t:::=: =
~ t= c::: ~
CONVENTIONAL MORTGAGE LOAN INTEREST RATES Anchorage, Alaska
Period -12/31n6 thru 12/31/78
10.125
~ 9.971
~ ~ ~
9.435
~ 9~3
~ ~ ~6 ~ 9.008 ~ ~
~ ~ ~ ~ ~ ~ ~ 8.500 :>
~ ~ ~ ~ f= ~ ~ ~ ~ ,__
~ ~ ~ ~ -1
~ ;::::=
~ ~ ""=
~ ~ ~ ~ f= ~ 7.750 r-: f=
~ F= ~ ~ t::::
F== ~ ~ t:::: ~ .500 '--
~ ~ ~ = ~
t= ~ ~ ;;:::::: t== ~ ~ '-- = x
~ ~ ~ ~ ~ ~ ~ ~ ~ ~ ~ f=
r-- ~ ~ :::::: ~ ~ f= ~ 12/31/76 6/30/77 -·· 12/31/77 6/30/78
Lege nd
~~-FNMA AHFC FHLMC
43
1~r ~ 10.797
~ ~ ~ ~ ~ ~ ~ ~ ~ ~ 8.750
~ ~ ~ ~ 1:::
~ ~ ~ ~
~ ~ ~ r--
~ ~ x;
~ r--
~ ~ ~ ~
~ ~ ~ r--
~ ~ ~ ~ r--12/31/78
Sub Notes: FHLMC rate includes 0.375% service fee
~
~ ~
~
~ ~
Yield shown is average yield

tt
S3I~I'II~fl
::::n13~v

ARERC
UTILITIES
Residents of Anchorage receive utility services from various providers, depending upon the service area in which they live:
Providers of utilities are:
Electricity Chugach Electric Association Municipality of Anchorage
Natural Gas Alaska Gas & Service
Water Central Alaska Utilities Municipality of Anchorage
Sewer Municipality of Anchorage
Refuse Anchorage Refuse Municipality of Anchorage
45

8t
LN3WXO'ldW3
::n.r:n1v

"" -< --,- o-_ ·~ ""-'"'-"' '"• _,-
441\j Sb :•11
ARERC
EMPLOYMENT TRENDS
ALASKA STATE AND ANCHORAGE
Annually, 1970-1977; Monthly, 1977-1978
Civilian Nonagricu ltural Nonagricultural Labor Force Wage & Salary An nuai Wage & Salary by Place of Employment by U nem ployment Employment by An nuai Residence Place of Work 1 Rate Place of Work3 Unemployment
Year Anchorage Anchorage Anchorage2 Alaska Total Rate Alaska
1970 49,024 42,000 6.7% 93,100 7.1% 1971 53,902 45,450 8.2 98,300 8.2 1972 57,535 48,250 8.9 104,200 8.3 1973 60,630 50,750 9.7 110,000 8.5 1974 58,661 58,700 6.8 128,200 7.0 1975 68,481 69,650 5.5 161,300 6.9 1976 73,436 73,100 6.8 171,700 6.7
1977 84,513 77,850 6.5 164,100 6.6 J anuary 72,150 7.2 152,100 8.1 February 72,700 8.3 154,800 8.8 March 73,700 7.7 158,500 7.3 April 75,450 7.3 163,600 6.4 May 78,150 7.0 168,300 7.3 June 80,500 6.0 172,400 6.2
J uly 79,900 5.6 171,800 5.2 August 81,600 5.2 172,600 5.4 September 82,900 5.2 171,900 5.3 October 80,750 5.9 166,000 5.7 November 78,900 6.5 160,100 6.4 December 77,600 6.7 156,900 6.9
1978 76,950 8.3 164,000 11.1 J anuary 74,100 8.4 151,600 12.0 February 74,450 8.1 153,000 11.8 March 74,900 9.5 155,700 12.8 April 75,850 9.1 159,400 12.1 May 77,950 9.0 165,300 12.1 June 79,500 8.6 171,600 11.4
July 77,650 7.9 176,000 10.0 August 78,350 7.5 179,300 9.5 September 80,800 7.5 173,300 9.4 October 78,750 7.4 166,000 10.2 November 76,100 7.9 160,500 11.1 December 75,200 8.3 156,600 11.4
1 Rounded to nearest 50. 2Based on Civilian Labor Force by Place of Residence. 3 Rounded to nearest 100.
Source: Research and Analysis Section, Employment Security Division, Alaska Department of Labor.
49

QÇ
~NIAI~ ~0 LSO:l
::nt::HIV

ARERC
ANCHORAGE CONSUMER PRICE INDEX
The second half of 1978 showed continually higher increases in the Anchorage Consumer Priee Index at annual rates exceeding the U.S. City average. ln November 1978, the Anchorage CPI increased to 194.7, up 10.5 percent from a year earlier. This is the first double digit increase since the pipeline boom period. The U.S. City average CPI in November 1978 was 202.0, which represents an annual rate of increase of 9.0
percent. These figures are index numbers with 1967 as a base of 100.
51

ARERC
CONSUMER PRICE INDEX 1
Annual Rate of Change Anchorage, Alaska ·and U. S. City Average
1974 to December 1978 (Anchorage, October 1967 = 100; U. S., 1967 = 100)
CPI Annual Rate of Change Anchorage U. S. Anchorage u. s. --
1974- Jan 125.6 139.7 7.9 7.4 Apr 129.9 143.9 8.8 10.1 J uly 134.2 148.0 11.5 11 .5 Oct 140.2 153.0 13.3 12.0
1975- Jan 142.9 156.1 13.8 11.7 Apr 150.0 158.6 15.5 10.2 July 153.8 162.3 14.6 9.7 Oct 157.4 164.6 12.3 7.6
1976- Jan 158.8 166.7 11.1 6.8 Apr 161.7 168.2 7.8 6.1 July 164.9 171.1 7.2 5.4 Oct 167.6 173.3 6.5 5.3
1977- Jan 169.4 175.3 6.7 5.2 Apr 172.6 179.6 6.7 6.8 J uly 177.4 182.6 7.6 6.7 Oct 177.3 184.5 5.8 6.5
1978- Jan 179.2 186.9 5.8 6.6 Apr 183.6 191.3 6.4 6.5 Mar 180.7 189.8 N.A. N.A. May 184.2 193.3 4.6 7.0 July 188.5 196.7 6.3 7.7 Sept. 193.2 199.3 9.8 8.3 Nov. 194.7 202.0 10.5 9.0
N.A.- Not applicable
1 Unrevised index for urban wage earners and clerical workers through April 1978; revised index for ali urban consumers beginning March 1978.
Source: Bureau of Labor Statistics, U. S. Department of Labor.
52

ALASKA HD
:1~4 tiORAGE A51 vol. 3 r ESTATE Fall
! ~!~~ 2 ARCH REPORT
-
,. ·.
,c
VOLUME rn- FALL 1979
,r-.._
1 J'
.....

7301
3 Fdc//
\AN CH_Q~R_A_GE ~--" """""'~'""'"""''""''"'"""~"'~·-·~~·--·-·-"-·--
REAL ESTATE RESEARCH REPORT
VOLUME ill - F ALL 1979
Published semiannually by the Anchorage Real Estate Research Committee
cjo Security Title 711 "H" Street
Anchorage, Alaska 99501
The contributors to this report are solely responsible for statements or interpretations contained herein. We make no warranty, express or implied, and assume no legal liability or responsibility for the accu racy of this da ta.
No reproductions or quotations of any part of this report permitted without special authorization in
writing.

'
ARERC
INTRODUCTION
The Anchorage Real Estate Research Report is fast becoming an "institution" in the real estate community. We thank our readers for their support and encouragement.
This volume of the Report contains information current through June 30, 1979. As always, the regular features have been updated and severa! new and enlightening research studies have been included. We are continuing our custom of not repeating duplicate data from volume to volume. Y ou will find prior years' data in Volumes 1 and Il. ··
Volume Ill includes two special studies that the Committee is particularly proud to be able to publish. This edition includes the first portion of a study conducted by Barbara Withers and Sandy Barto of the Municipality of Anchorage Planning Department. This is an analysis of ali of the housing stock in Anchorage and Eagle River/Chugiak. lt is an up-to-the-minute count of ali dwelling units, categorized by type and location, which has been verified through field checking. Subsequent issues of the Report will include further information on Anchorage housing stock and trends. Drs. Richard Ender and Lee Huskey have provided projections of housing demand in the Anchorage area for the next six years.
Dr. Ender has also contributed an analysisofthe real purchasing power of the Anchorage consumer, which is most revealing.
For the first time ever, the Committee is publishing its own vacancy survey in addition to the information provided by the Elmendorf Housing Referral Office and the classified ad listings in the newspaper. lt is gratifying to note that these statistics and other sources support each other.
This edition again reflects the hard work and dedication of ali the Committee members. Without them, there would not be a Report.
Plans are already under way for a most exciting and informative Volume IV. We hope that you will take this opportunity to subscribe to the Report if you have not already done so.
SUBSCRIPTION APPLICATION
Name
Address ---------------------------------------------------------------------
City State ---------- ZIP ____ _
Regular one-year subscription (includes one copy of Spring and Fall issue, 1979): $50.00 _______ __
lndividual copies: {$25.00 per copy)
Vol. 1
\) oùi ';,0~
Vol. Il
Please indicate the volume and number of copies.
Mail check to: Anchorage Real Estate Research Report cfa Security Title & Trust Co. of Alaska 711 H Street Anchorage, Alaska 99501 Attn: Carole Bangs
Vol. Ill Vol. IV
----

ARERC
ANCHORAGE REAL ESTATE RESEARCH COMMITTEE
A nonprofit community group organized to develop and distribute factual information on trends in real estate, construction and related activities in the Anchorage area.
CHAIRMAN Robert W. Sullivan
Alaska Mutual Savings Bank
REPORT COORDINATOR John W. Ramzy
Professional Realty, lnc.
EDITOR Angie Dugick
Cook lnlet Region, lnc.
CONSUlTANTS
Richard L. Ender, Ph.D. Urban Observatory University of Alaska
Lee Huskey, Ph.D. lnstitute of Social and
Econom ic Research
BUSINESS & ECONOMIC CONDITIONS (Gu est Contributor) Lee Huskey, Ph.D. lnstitute of Social and Economie Research
ANCHORAGE INCOME ANAL YSIS Richard L. Ender, Ph.D. Urban Observatory University of Alaska
RESIDENTIAL CONSTRUCTION ACTIVITY E. Allen Robinson Department of Housing and
Urban Development
ANCHORAGE HOUSING STOCK Sandy Barto Municipality of Anchorage Planning Department
Barbara Withers Municipality of Anchorage Planning Department
MORTGAGE LOAN ACTIVITY Jim Smith First Federal Savings & Loan Association
ii
James H. Hubert Federal Home Loan Bank
of Seattle
Robert R. Richards Alaska Pacifie Bank
PROJECTIONS OF HOUSING DEMAND Richard L. Ender, Ph.D. Urban Observatory University of Alaska
Lee Huskey, Ph.D. lnstitute of Social and Economie Research
CONSTRUCTION COSTS H. Robert Gamel Gamel Homes, lnc.
H. Derrell Smith Alaska Statebank
RESIDENTIAL SALES ACTIVITY Bob Baer Totem Realty
VACANCY Judy Ponsford
E. Allen Robinson Department of Housing
and Urban Development
Terry Tyson Foster Appraisal Services

j'!
ARERC
CON DO CONVERSIONS John W. Ramzy Professional Real ty, 1 ne.
UNSOLDINVENTORY Abe Love Home Federal Savings & Loan
MORTGAGE INTEREST RATE TRENDS Robert W. Sullivan Alaska Mutual Savings Bank
iii
UTILITIES Jerry Ali ison Allison & Associates
EMPLOYMENT TRENDS & COST OF LIVING E. Allen Robinson Department of Housing
and Urban Development
ORGANIZATION, MARKETING & SALES Carole Bangs Security Title & Trust Company of Alaska

ARERC
ANCHORAGE REAL ESTATE RESEARCH COMMITTEE MEMBERS
Jerry Allison Allison & Associates P.O. Box 1466 Eagle River, Alaska
Bob Baer President-General Manager Totem Realty 724 East 15th Ave. Anchorage, Alaska 99501 272-0571
Carole Bangs Assistant Vice President Security Title & Trust Company of Alaska 711 H Street Anchorage, Alaska 99501 276-0909
Sandy Barto Demographer-Pianning Department Municipality of Anchorage Pouch 6-650 Anchorage, Alaska 99502 264-4254
Angela E. (Angie) Dugick Special Projects Coordinator Cook lnlet Region, lnc. Drawer 4-N Anchorage, Alaska 99509 274-8638
Richard L. (Rick) Ender, Ph.D. Director Urban Observatory University of Alaska 3221 Providence Drive Anchorage, Alaska 99504 263-1760
H. Robert (Rob) Gamel Vice-President-General Manager Gamel Homes, lnc. 750 East Fireweed Lane Anchorage, Alaska 99503 274-3679
James H. (Jim) Hubert Vice-President-Econom ist Federal Home Loan Bank of Seattle 600 Stewart Street Seattle, Washington 98101 (206) 624-3980
iv
Lee Huskey, Ph.D. Assistant Professor of Economies lnstitute of Social & Economie Research 707 A Street, Suite 206 Anchorage, Alaska 99501 278-4621
Abe Love Vice President Home Federal Savings & Loan Pouch 7008 Anchorage, Alaska 99501 272-1451
Judy Ponsford 3340 Checkmate Drive Anchorage, Alaska 99504 333-6606
John W. Ramzy Professional Realty, lnc. 507 West Northern Lights Blvd. Anchorage, Alaska 99503 279-8551
Robert R. (Bob) Richards Executive Vice President Alaska Pacifie Bank P.O. Box 420 Anchorage, Alaska 99510 276-3110
E. Allen (Al) Robinson Area Economist Department of Housing & Urban
Development-Anchorage Area Office 334 West 5th Ave. Anchorage, Alaska 99501 271-4183
H. Derrell Smith Vice President Alaska Statebank 310 East Northern Lights Blvd. Anchorage, Alaska 99503 279-7637
james L. (Jim) Smith Vice President First Federal Savings & Loan Association 813 West Northern Lights Blvd. Anchorage, Alaska 99503 274-6561, ext. 228

ARERC
Robert W. (Bob) Sullivan Vice President Alaska Mutual Savings Bank P.O. Box 1120 Anchorage, Alaska 99510 274-3561
Terry Tyson Real Estate Appraiser F oster Appraisal Services 118 East 1 nternational Airport Road Anchorage, Alaska 99502 276-5659
v
Barbara Withers Regional Economist-Pianning Department
· Municipality of Anchorage Pouch 6-650 Anchorage, Alaska 99502 264-4866

ARERC
SUBSCRIBERS TO ANCHORAGE REAL ESTATE RESEARCH REPORT
Alaska Bank of Commerce Alaska Brick Alaska Housing Finance Corporation Alaska & The Milepost Alaska Appraisal & Research Corporation Alaska Mortgage lnsurance Alaska Mutual Savings Bank Alaska Pacifie Bank Alaska Pacifie Construction Co. Alaska Pacifie Ventures Alaska Statebank Alaska Resource-Library Alaska Title Guaranty Alaska USA Federal Credit Union Alaska Valuation Service, lnc. Alaskan Real Estate Alley-Haeg, 1 ne. The Aleut Corporation Allison & Associates Enterprises Amfac Mortgage Corporation American Realtors Anchor Mortgage Consultants, lnc. Anchorage Board of Realtors Anchorage Times Publishing Co., lnc. Apartment Company Appleby Construction Co., Ltd. Appraisal Company of Alaska Arctic First Federal Area, lnc. Realtors J im A. Arnesen Bank of Montreal Baugh Construction & Engineering Co. Beneficiai Standard Properties, 1 ne. Besse Engineering, lnc. John R. Booney Wayne C. Booth, J r. Carl G. Boraiko, CCIM William P. Bredsen, Jr. Bowden Company Realtors Burr, Pease & Kurtz, lnc. Business Communications, lnc. CEDC Cablecom-General, lnc. Cablevision of Alaska, lnc. Carr-Gottstein Properties, 1 ne. J. B. Gottstein Co., 1 ne. Century 21-Heritage Homes Coalition for Econom ic Justice Coast Mortgage Co. Colonial Realty, lnc. Columbia Enterprises Consolidated Services, lnc. Continental Land lnvestments
vi
Cook lnlet Region, lnc. Al Courtney E. N. Courtney Reginald K. Curtiss Tom Degler Delta Companies Devaii/Wardwell Real Estate Dimond Center State of Alaska
Division of Economie Enterprise Dynamic Realty Eklutna, lnc. Eljim Realty Limited Ellison & Ellison Realtors Erickson & Hinchey Executive 1 ne., Real tors Federal Home Loan Bank of Seattle Federal Home Loan Mortgage Corporation Federal National Mortgage Association First Federal Savings & Loan First Escrow Services of Alaska First National Bank of Anchorage First National Bank of Oregon G & P Services, 1 ne. Gamel Homes Avrn S. Gensburg Hanson Realty-Century 21 Ward S. Hastings Joseph R. Henri Duane Heyman Hickel lnvestment Company Hollywood Apt. Co. Home Federal Savings & Loan Huffman Hills Development Co. I.M.I. 15ER Iowa Appraisal & Research Corporation lnvestment Center, lnc. The lnvestment Corporation Leland P. James Kaiser Cement & Gypsum Corporation Key Real Estate Co. Kelly-Gay 1 nvestments Chuck Kim Philip Kraus Landmark Realty John Lapagua Co. Lawyers Title 1 nsurance Age ney, 1 ne. Herbert Lee Lehman Brothers, Kuhn Loeb Marty Laken Z. J. Loussac Library Carl E. Luchsinger

ARERC
John W. MacCarthy David McCabe McDonalds Food Services, lnc. John McMahan Associates, lnc. Mat-Su Borough MGIC Management Consulting Service Management & Planning Services Marston Real Estate Marston Real Estate-South The Massart Company Massey & Company, lnc. William M. Mehner Merrill Lynch Relocation Management Modern Construction, lnc. William E. Morrison The Mortgage Corporation Mueller Enterprises Multiple Listing Service, lnc. NANA Construction Co., lnc. NCP Development National Bank of Alaska Noey & Associates, Ltd. Nova Real Esta te, 1 ne. PMI Mortgage lnsurance Co. Pacifie National Bank of Washington Benny W. Patterson Peoples Bank & Trust Co. Pendragon House, lnc. Polar Realty Priee Waterhouse & Co. Professional Realty, lnc. Rainier National Bank Real Estate Corner Real Estate Services Corporation Restaurant Corporation of Alaska Herbert Ross Royal Alaska Sales Seattle First National Bank Security National Bank
Security Title & Trust Co. of Alaska Security Pacifie Mortgage Bill Schreck Showcase Realty & lnvestments Simpson, Usher & Jones, lnc. Harold Smith Spenard Builders Supply Spokane Mortgage Co. State of Alaska
Division of Land & Water Stateside Enterprises, 1 ne. Swain-Williams Kenneth Swartz Tam Construction, lnc. Target lnc., Realtors Ticor Mortgage lnsurance Co. Totem Realty, lnc. Terry L. Tyson United Bank Alaska United Lumber Co., lnc. University of Alaska-Library University of Alaska
Center for Cross Cultural Studies Unwin, Scheben, Korynta & Huette Valley lnvestments Verex Assurance, lnc. WGM, lnc. Wakeland, Norene & McDowell, lnc. Washington Mortgage Co., lnc. Ed Wesley Western Washington University Wohlforth & Flint Jack White Co. Western Enterprises Wometco-Lathrop Co. Wood & Rhoads James M. Yarmon Yellow Electric Yorkvest Limited Arthur Young & Co. Yukon Realty, lnc.
This list may not include ali subscribers since it is revised on a continuing basis.
vii
-----------------------------------------

ARERC
TABLE OF CONTENTS & EXECUTIVE SUMMARY
Introduction ..... .
Anchorage Real Estate Research Committee ii
Subscribers to ARERC vi
Table of Contents . viii
1 nd ex of Ch arts and Graphs ix
Municipality of Anchorage Maps
Anchorage Business and Economie Conditions 4 The Anchorage economy dec/ined s!ightly in the first six months of 1979, with potential for renewed growth in ear!y 7980's.
Anchorage 1 ncome Analysis . . . . . . . . . . . . . . . . . . . . . . . . . . . . . . . . . . . 8 Anchorage consumers have /ost much of their relative advantage in purchasing power since the pipeline boom. ·
Residential Construction . . . . . . . . . . . . . . . . . . . . . . . . . . . . . . . . . . . . . . . . . 10 Residential building permits dec/ined sharply in Anchorage, as weil as statewide.
Anchorage Housing Stock . . . . . . . . . . . . . . . . . . . . . . . . . . . . . . . . . . . . . . . . 16 Brand-new study on housing stock in Anchorage and Eagle River/Chugiak indicates a total of 60,987 dwelling units.
Projections of Housing Demand . . . . . . . . . . . . . . . . . . . . . . . . . . . . . . . . . . . . . 24 Projections of Anchorage housing demand indicate moderate growth in the 7980's.
Residential Construction Costs . . . . . . . . . . . . . . . . . . . . . . . . . . . . . . ....... 28 Residentia/ construction costs have increased less thon 1% in the post six months.
Residential Sales Activity . . . . . . . . . . . . . . . . . . . . . . . . . . . . . . . . ...... 32 The number of residential home sales in the first six months of 19 79 far exceeded the same period during the pipeline boom years of 7975, 1976 and 1977, and was approximately 93% of the 7978 sales figure.
Vacancy ................................................. 42 Data from various sources indicate Anchorage apartment vacancy rate is at record-high leve/s.
Condo Conversions . . . . . . . . . . . . . . . . . . . . . . . . . . . . . . . . . . . . . . . . . . . 50 Condominiums converted from apartment buildings have had /ess thon overwhelming response from prospective purchasers. To date, approximately 570 converted condominiums have been added to the existing unso/d condominium inven._tory.
Unsold lnventory ............................................ 54 Although the number of units in production has decreased, sales seem to have held steady.
Mortgage Loan Acitivity . . . . . . . . . . . . . . . . . . . . . . . . . . . . . . . . . . . . . . . . . 56 The number of /oans outstanding continues to grow at a healthy rate, wh ile the percentage delinquent is the /owest since june of 7976.
viii

ARERC
Mortgage 1 nterest Rates . . . . . . . . . . . . . . . . . . . . . . . . . . . . . . . . . . . . . . . . . 60 Conventiona! mortgage interest rates reach a/1-time highs above 7 7%.
Utilities . ....... 62 The growth rate in residentia/ telephone main stations has decreased to a/most zero.
Employment . . . . . . . . . . . . . . . . . . . . . . . . . . . . . . . . . . . . . . . . . . ..... 66 Nonagricu!tura/ wage and sa!ary emp!oyment appears to have bottomed out in February and some seasonal increases are evident. '
Cost of Living . . . . . . . . . . . . . . . . . . . . . . . . . . . . . . . . . . . . . . . . . . . . . . 68 Although dropping s!ightly in May, Anchorage 's CP/ continues to report double-digit year-to-year increases.
INDEX OF CHARTS AND GRAPHS
Location of Municipality of Anchorage
Municipality of Anchorage (Map)
Building Permit Trends
1979 Anchorage Housing Stock
1978 Eagle River/Chugiak Housing Stock
Housing Supply and Demand, 1968-1979
Multiple Listing Service Districts #5, 10, 15, 20, 25, 30,35 and 40
Multiple Listing Service Districts # 100 and # 102 ..... .
Percentage of Ali Sold Residential Properties by Priee Range
Vacancy Trends in Residential Housing
Anchorage Vacancy Rate Survey
Mortgage 1 nterest Rate Trends .
ix
2
14
18
19
27
36
37
41
45
49
. ....... 61
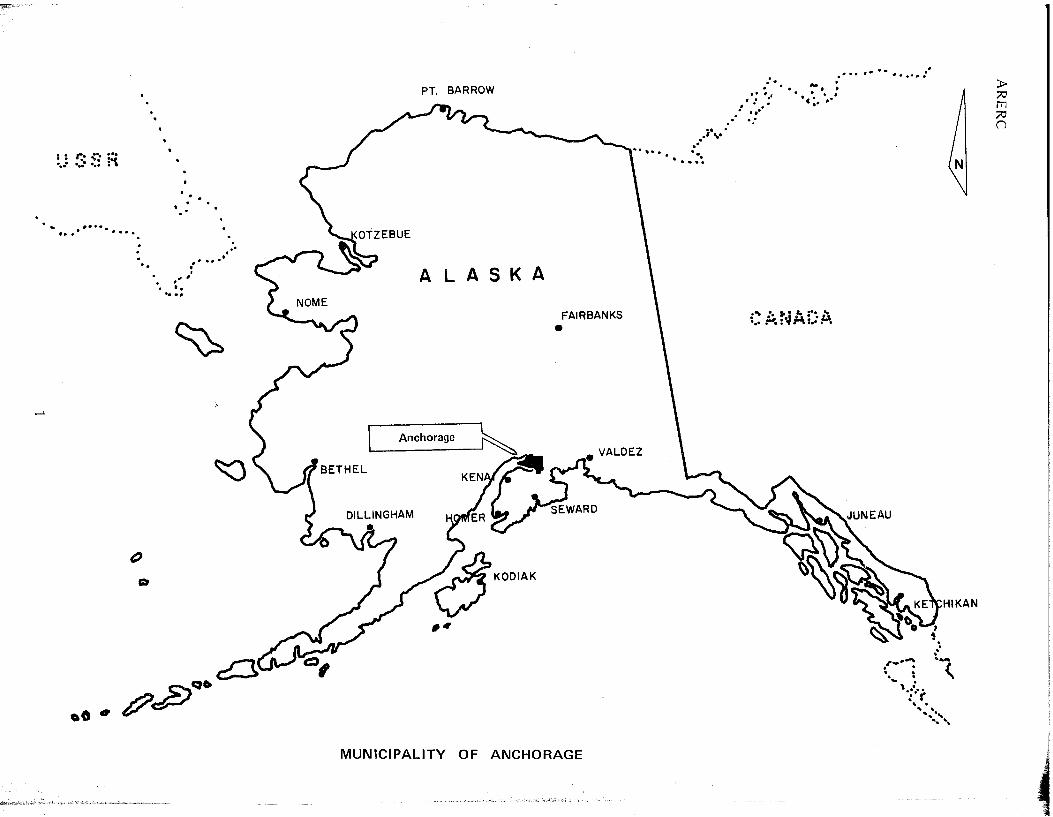
: • t":.• •••••• ... : .. :· ~= :·<
.... .. . . . .....
oO •
. . . ..
" 0
.·· • # •••• . . -~ , . . ... : .
~
~
PT. BARROW
ALASKA
1 Anchorage ~
DILLINGHAM
# ..
FAIRBANKS
•
MUNICIPALITY OF ANCHORAGE
.. . .·' "' .. . ·. .....
.. . . . . . . . . •'
..... ·- ~ .. • •• •• #: . . . . . . . . . .. · • c ;. • ....
·:
i: :i:r.r~A;::P.
,.# .... . . ·... t
\ : ·:··r ' . .. . .. ,.,
Hl KAN
... ',
)> ;;u m ;;u n

ARERC
t"= 10 Miles o Palmer
•• i ---··················1
ttJjj ~ Ill' Ft. Richardson -1 mendorf A F 8
Anchorage (City}
Metropoliton Areo
(j
(;"(.
6~ '(.0
MUNICIPALITY OF ANCHORAGE
2
~-<.. o-0 ~
~s t;\
1 1 1 1 1 1 1 1 1 1 1 1 1 1 -1
1 1 1 1 1 1 1 1 1 1 1 1
1 1 1 1 ••••••••• 1
1 .. Portage 1
1 1 ° !.•••••••.! Whittier

ARERC
3

SNOILIGNO:l :liWON033 GNV SS3NISilH
::nt3~V

ARERC
ANCHORAGE BUSINESS AND ECONOMIC CONDITIONS
The rapid growth experienced by the Anchorage economy between 1970 and 1977 will not be experienced in 1979. The Anchorage economy grew rapidly between 1970 and 1977; employment increased by 85 percent. The economie activity associated with state government expenditures, the development of Prudhoe Bay and the construction of the trans-Alaska pipeline was responsible for this growth.
This growth trend was reversed in 1978 when employment feil by 1.2 percert. If the trend established in the first part of 1979 continues, Anchorage will experience a slight decline in total employment again in 1979. Nonagricultural wage and salary employment feil during the first part of 1979; average employment for the first six months of 1979 was lower by 1 ,800.
Three industries accounted for the majority of this decline: construction, trade and services. The most rapidly growing industry was government; bath state and federal government grew during this period. Although it is impossible to project this reduced employment for the entire year, one cannat assume that over the year, the economy will grow much larger than it was in 1978.
Employment growth is only one indicator of the economy's health. Two other indicators, unemployment and the Consumer Priee Index, provide a slightly more positive picture. According to the State Labor Department, bath the unemployment rate and the total number of unemployed have fallen in the past year. The unemployment rate feil from 9.1 to 8.0 between April 1978 and April 1979. At the same time, total unemployment feil by 840 to about 6,400. This may indicate that some discouraged workers are leaving the Anchorage region. The Anchorage Consumer Priee Index increased by 10.5 percent for the year ending May 1979. While this in itself is not good news, the rate of increase was less than for the U.S. as a whole, where consumer priees increased at a rate of 10.8 percent. This may indicate a return to the pre-pipeline trend wh en Anchorage priees increased less rapidly th an U .S. priees, thereby reducing the Anchorage cast-ofliving differentiai.
To understand the recent pattern of growth in Anchorage and to forecast its future growth, we need to u nderstand th ree characteristics of the Anchorage economy.
1. Construction is important to the Anchorage economy. Construction employment accounts for over 20 percent of the employment in those industries which are traditionally considered to provide the major impetus for growth (manufacturing, mining, construction, government). For the most part, construction employment occurs because of increased government expenditures, growth or the expectation of future growth which adds to the existing stock.
2. Economie activity in other regions of the state affects Anchorage because of its role as the financial, administrative and distribution center for most of the state. Construction or mining activity in other regions of the state leads to growth in the Anchorage economy.
3. Government employment is bath important to the economy and relatively stable. State and federal government employment accounted for 18 percent of total employment in 1978.
The recent pattern of employment growth can be explained in terms of these characteristics. The end of pipeline construction in 1977 lead to a reduction in statewide employment; statewide nonagricultural wage and salary employment feil from 173,499 in 1976 to 166,006 in 1977. During this period, employment in Anchorage increased. Major construction projects like the Sheraton Hotel and Federal Building were responsible for maintaining growth in Anchorage. Expansion of residential and commercial space also played a role in this continued growth. The completion of these major projects and the realization that commercial and residential space were overexpanded reduced the construction activity this year, leading to a decline in construction employment. The reduction in local construction permitted the full effects of the reduced state activity to be felt on the Anchorage support sector. The growth of state and federal government reduced the negative impact of these other factors.
The pattern of growth and contraction in bath the construction and support sectors can also be explained as an adjustment to à much larger economy. Growth during the pipeline period left an economy which was approximately 25,000 employees larger than prior to pipeline construction. This larger economy requires adjustments in bath the type and size of businesses. The recent pattern can be seen as an adjustment to this new equilibrium. This pattern of adjustment cannat be expected to be smooth, but necessitates a pattern of expansion and contraction.
5

ARERC
The Alaska Department of Commerce and Economie Development has projected statewide employment growth at a rate of approximately 4 percent between 1980 and 1984. This statewide growth should be reflected as growth in Anchorage. Anchorage should, 1n the near future, begin to feel the effects of major construction and mining projects in the state. The largest of these projects is the ALCAN gas tine, which looks more promising since President Carter's recent energy speech. Recent estimates are that construction could begin as early as 1982. Two petrochemical projects are also scheduled to begin in the early 1980's: Pacifie LNG and Alpetco. Expansion of the Prudhoe Bay field is beginning this year. An OCS lease sale in the Beaufort Sea is scheduled for the end of 1979, and three sales in the Gulf of Alaska and Lower Cook lnlet are scheduled through 1981. This state activity will affect Anchorage growth through its support, service and transportation sectors. These projects may ··àffect construction prior to the ir actual start dates if anticipatory expansion of commercial and residential space takes place. The stability of government employment will be important, providing a secure base for expansion. Government may also be a source of expansion depending on the effect on state government expenditures of the additional unanticipated oil revenues which resulted from recent OPEC oil priee hikes.
6

ARERC
7

8
~SX~VNV3WO~NI3DVHOH~NV

ARERC
ANCHORAGE INCOME ANAL YSIS
ln analyzing income patterns in Anchorage, two factors must be taken intoaccount. Thefirstisthe effect of the Consumer Priee Index (CPI). With both indices beginning at an October 1967 base of 100, the United States average rose more rapidly in the early 1970's than the Anchorage average. This began narrowing the gap between the two as growth in Anchorage continued, transportation systems improved and market efficiencies increased. Beginning in 1974, however, priees began rising faster in Anchorage with the advent of the pipeline and extra demand-pull. This trend slowed and reversed in 1976 until the present, with the U.S. and Anchorage averages coming closer together. ln 1978, the Anchorage average an nuai CPI stood at 186.3, with the U.S. CPI at 194.2. By May 1979, the Anchorage CPI was 203.5 and the U.S. CPI was 214.1. lt should be noted that the CPI index was redefined and thus altered during the first quarter of 1978.
When comparing Anchorage per capita income, which rose 172 percent in eight years, to the CPI which gained only 59 percent, the improvement in relative income can be seen. The U.S. gains were only 125 percent in income and a 55-percent increase in the CPI. The CPI can be related to actual income to produce real income in 1969 base dollars. The difference between the two is shown in Table A and reflects the income gains du ring the pipeline years and the subsequent narrowing of the difference.
A second factor affecting Anchorage income patterns is the cost-of-living differentiai between the United States and Anchorage. lt cannot be said that Anchorage and the U.S. both oegan 1967 with the same purchasing power. Anchorage's cost of living has been consistently higher. One indicator of this is the cost estima te for urban fam il y budgets. 1 n 1978, this difference varied from 40.1 percent for higher budget families to 64.8 percent for lower budget. The cost-of-living differentiai has altered sightly over time as the CPI differentiai changed. lt has, however, stayed within 2 percent of the 1978 data.
Using the intermediate budget difference of 41.4 percent as the income level affecting most Anchorage households, an approximate purchasing power difference can be calculated. Table A takes both the CPI and cost-of-living differences into consideration to show relative per capita purchasing power between the United States urban average and Anchorage.
ln the early 1970's, Anchorage incomes were not performing as weil as the country as a whole and had purchasing power below the national average. The pipeline boom coupied rising incomes and a fairly stable cost-of-living differentiai to produce a significant improvement in Anchorage income relative to the U.S. urban average. These gains began to erode in the post-pipeline period.
With the economie downturn affecting Anchorage in late 1977 and 1978, it is projected that Anchorage's gains have practically disappeared relative to the national average, with only a $76 relative purchasing power advantage in 1978 per capita income.
TABLE A PER CAPITA INCOME AND REL-\.TIVE PURCHASING POWER*
Anchorage Anchorage Anchorage u.s. u.s. per capita annual avg. real per capita per capita annual avg.
Year in corne 1 CPI2 in corne incarne 1 CPI2
1969 $ 4,196 109.6 $3,828 $3,119 116.3 1972 5,632 115.9 4,859 4,493 125.3 1973 6,050 120.8 5,008 4,9§0 133.1 1974 7,383 133.9 5,514 5,428 147.7 1975 10,006 152.3 6,570 5,861 161.2 1976 10,466 164.1 6,378 6,397 170.5 1977 11,430 174.2 6,561 7,026 180.5 1978 See last paragraph of text.
1 Regional Economies Information System, Bureau of Economie Analysis. 2The Alaska Economy, 1978.
*These figures do not incorporate the effects of graduated persona! income taxes.
9
u.s. Index of real per capita real incarne
incarne difference
$2,682 142.7 3,586 135.5 3,742 133.8 3,675 150.0 3,636 180.7 3,752 170.0 3,893 168.5
Anchorage relative
purchasing power
- $ 36 - $ 212 - $ 283 +$ 318 +$1,429 +$1,073 +$1 ,056

Ol
NOII:lilHLSNO:l 'IVIIN3GIS3H

ARERC
RESIDENTIAL CONSTRUCTION
As usual, the spring months of March, April and May showed an upswing in residential construction in the Anchorage area, but the volume was weil below the same period in 1978 and continued the downward trend from the peak year of 1977 wh en the ail pipeline was being completed. The mon th of June 1979 had fewer housing units authorized than May, and July is expected to be lower than June. For the first six months of 1979, a total of 965 units was authorized compared to 1, 703 in the first half of 1978, a decrease of 738 units, or 43 percent.
Single family authorizations account for the largest percentage decline in the first half of 1979 compared to 1978. A total of 371 -:Was_ authorized this year, dawn nearly 54 percent from 803 in the first half of 1978. Mobile home connections are off about 49 percent in 1979, from 207 last year to 105. Small multifamily-type structures (2 to 4 units) are dawn about 46 percent from 295. to 160 units. Although the Anchorage area continues to have a high apartment rentai vacancy rate, there were 327 units authorized in larger apartments (5 units or more), dawn only 18 percent from the 398 in the first half of 1978.
11

ARERC
HOUSING UNITS AUTHORIZED BY BUILDING PERMITS
ANCHORAGE, ALASKA
Annually-1970 through June 1979
NU M BER 0 F D W EL L 1 N G ,UN 1 T S ( N 0 T PERM 1 T S)
Single 2- to 4- 5 or More Mobile Total Conversions & Year Family_ Family Family Homes1 Units De mol itions2
1970 1,4003 1,6003 NA 3,0003 -59 1971 1,385 1,665 NA 3,0503 -39 1972 1,445 1,506 NA 2,951 -63 1973 1,402 684 NA 2,086 -54 1974 1,798 1,024 NA 2,822 -41 1975 1,827 2,183 NA 4,010 -12 1976 1,269 2,216 453 3,938 -46 1977 1,955 1,070 1,432 420 4,877 -22 1978 1,492 751 675 371 3,289 -12 1979 371 160 327 105 965 +2 (thru June)
1 Net additions to mobile home inventory (new or used). 2conversions may be plus or minus; if plus, these are included in total units beginning in 1979. Data for 1970-75 are for City only.
3Estimated.
NA-Not available.
Source: Municipality of Anchorage Building Permit Office; prior to 1976, City and Borough building departments.
Note: Effective J anuary 1, 1976, ali building permits were issued by the Municipality of Anchorage as a re suit of the mer ger of the City of Anchorage and the Greater Anchorage Area Borough on September 15, 1975. Ali land use permits issued for Eagle River, Chugiak, Girdwood, and Portage areas (where building permits are not-required) are included in single-family units from July 1972 through April 1976; beginning in May 1976 they are reported by number of units of each type (single family, multifamily, and mobile homes).
......:__
12

ARERC
HOUSING UNITS AUTHORIZED BY BUILDING PERMITS
ANCHORAGE, ALASKA
Monthly-1978 and 1979*
Single 2- to 4- 5 or More Mobile Total Conversions & Year Family Family Family Homes Units Demolitions
1978 January 7 55 93 33 188 0 February 11 9 0 23 43 0 March 47 20 165 45 277 0 April 171 85 39 26 321 NA May 340 92 63 42 537 NA June 227 34 38 38 337 NA
Total first 6 months 1978 803 295 398 207 1,703 NA
july 132 34 99 39 304 NA August 194 119 32 41 386 - 3 September 145 182 24 32 383 - 1 October 182 105 81 30 398 - 7 November 19 10 16 13 58 - 1 December 17 6 25 9 57 0
Totallast 6 months 1978 689 456 ?.77 164 1,586 -12
Total1978 1,492 751 675 371 3,289 -12
1979 January 7 3 41 25 77 + 1 February 10 0 0 4 14 0 March 31 8 132 10 181 0 April 60 31 27 29 148 -t 1 May 134 48 100 21 303 0 june. 129 70 27 16 242 0
Total first 6 months 1979 371 160 327 105 965 + 2
*Monthly data for 1977 can be found in Vol. 1 and Vol. Il, No. 1.
Source: Municipauty of Anchorage Building Permit Office.
13

ARERC
TOTAL HOUSING UNITSAUTHORIZED BY BUILDING PERMITS Anchorage, Alaska Area
NO. PERMITS AUTHORIZEO
5,000
4,000
3,000
2,000
1,000
0
3,000
1970
Single Family Permits
1978~
1979~ (-54%)
Multi·Family Permits
1978~ 1979~
(-18%)
1970 ·1978
4,877
··-
4,010 3,938
3,050 2,951
2,822
2,086
1971 1972 1973 1974 1975 1976 1977
COMPARISON OF BUILDING PERMIT ACTIVITY First 6 months of 1978 and 1979
INCREASE/OECREASE (+ %) (- %)
14
2 · 4 Family Permits
1978EJ
1979~ (-46%)
Mobile Home Hookups
1978Fl
1979~ (- 49%)
3,289
1978

ARERC
TOTAL HOUSING UNITS AUTHORIZED1
BY BUILDING PERMITS AND PUBLIC CONTRACTS IN SELECTED ALASKAN URBAN AREAS2
ANNUALL Y -1970 through June 30, 1979
Anchor- Fair- Ketchi-Year age banks3 juneau kan Kodiak Palmer Kenai Soldotna Homer Total -· 1970 3,0004 444 157 94 NA 19 17 11 6 3,747 1971 3,0504 348 221 147 23 15 23 4 12 3,847 1972 2,951 439 441 119 93 9 22 16 11 4,133 1973 2,086 446 274 178 31 2 13 11 17 3,138 1974 2,822 5i94 122 107 43 7 25 37 35 3,889
1975 4,010 1,051 154 107 143 8 100 87 13 5,789 1976 3,938 998 281 117 74 72 161 138 60 5,903 1977 4,877 1,561 429 175 239 75 267 177 117 8,001 1978 3,289 806 351 104 203 125 160 69 92 5,195 1979 (first 6 months) 965 342 189 48 24 18 20 9 54 1,669
1978 (first 6 months} january 188 27 8 5 10 6 4 2 251 February 43 19 29 13 4 25 0 0 0 133 Mar ch 277 36 21 14 7 11 1 6 3 376 April 321 138 37 6 11 5 14 5 5 542 May 537 160 56 15 45 4 28 18 29 892 June 337 129 44 10 7 12 35 10 11 595
Total first 6 months 1,703 509 195 63 84 78 82 40 50 2,789
1979 (first 6 months) January 77 23 3 11 6 0 0 0 4 124 February 14 10 7 3 3 0 0 0 13 50 Mar ch 181 28 11 6 1 0 1 0 12 240 April 148 100 88 8 2 3 2 2 4 357 May 303 119 45 11 7 4 8 5 5 507 June 242 62 35 9 5 11 9 2 16 391
Total first 6 months 965 342 189 48 24 18 20 9 54 1,669
11ncludes mobile homes, additions, and conversions where reported. 21ncludes city and borough area combihed for Anchorage, Fairbanks, Ketchikan and Kodiak. 3Excludes many mobile homes brought into the area, most of them outside the cities of Fairbanks and North Pole. 4Estimated.
NA-Not available.
Source: Building permit issuing offices.
15

9l
)I:)QlS DNISflOH 3DV"HOH:lNV

ARERC
ANCHORAGE HOUSING STOCK
This section provides information about the housing stock in Anchorage. Housing stock estimates are important information for a wide range of users, from real estate investors to demographers. ln the past, annual estimates of housing stock in Anchorage were strictly based upon the addition of residential building permit data to a 1975 housing data base. This approach hasan over-bias which results from the inclusion of dwelling units which do not reach completion.
The Municipality of Anchorage Planning Department recently conducted a complete field survey of the Anchorage bowl to determine the current housing stock. Data were collected by structure type by parce! of land. These data have been summarized by geographie area on a 1 00-scale grid system and represent the housing stock as of June 30, 1979. Subsequent issues of this Report will provide additional housing stock information by grid, including growth rates, historical data series, density patterns, and changes in mix of structure-type.
Housing stock data are also summarized on a 1 00-scale grid system for the Eagle River/Chugiak area. This information reflects housing stock as of September 1978. 1979 Eagle River/Chugiak data will be available in the next issue.
ln ali cases, ali numbers represent actual dwelling units, not structures. For example, a count showing 8 duplexes represents 4 buildings, each having 2 dwelling units.
17

ARERC
1979 HOUSING STOCK
Al~CHORAGE AREA 100 SCALE GRID SYSTEM
)
1 >/Y'. 1.
j • NORTH
'137 1138 1133
733 ~397 2 i 429 721 ~ ~
~ z :_ ~ ..134T
ONE MILE 514 843 1 607 3 i8 99 745 ~. EBAAR A NUE -~ ,~-- ' 1441
~-~-,., ...... 73 491 700 ~850 2 w440 526 754 ~170 ·6iEi-ÈPr-- ~ ~ 2:
C19 k"' cc ~ §;1541
378 250 _,_ 405 m564 69 338 ~ 335
"'
.r:.~~:;:E ~ 1522
6 9 531 56o "mt 149 144 1722
2021 1 2022 1 2023 1 2024 1 qjf'i? 1 20261~27 113 370 112
w ,_ ; --- ,- }; ~ • 1741
433 222 349· TUDOR a82 318 m 3~68 360
1841
1941
203lv2038 1 2039 1 2040 1 2041 8 IRASPBET'i"A6Ao
2121 1 ,~.,J"Mi 148 't~ ls51&1Rw.a.L_j~17_l~ fJ()4_Lkj26~~ 48 1 94~ ·•' •' •• c' 2141 • _2_
~~ \~-~ /'" ~ 1 . ~ ~ "' 2221 a: a: 0 0 2241
1 ~ 1 32 4 ':! 77é. 134':! 523, 274 100 153 134 91 :r 54w 69 173" - ...... __ ,.......____ ;:; .... ::; ~· r /i}o 5 il
'~~~ z J!":L ; ~'0" ' ~ ..__ ;< ~ i> 2341
~t '-&--. ::1 4'9' ~125"' 548 23 3 o-~ r6o9 34 ü • 111 97 60 117•; TT ROAD ---........... """" ~""':~ - i \
~ , 2424 CAMP8~ L C.~~KE ,· ( Ir/ • r:2 - __ 2441
1 19t 29:tl - ~n- :::Z23 g297 1 2 7 3l3 2 4- 50 101 51/ 44 59 37
1'"5 ( -_ ~ _ .. ·-.. 2541 "- ""' W 100t AVt.NUE > ~ !Il --,
,. 299 1 12 J 7 D'MA LEY R Ao62 64 129 î04 2t 29
'·· " • Q ( d j 2626 "( - ~ '\ 2641
64 <ll8r o49 1 67 43 60 85 61 :48 40 55 30 ',~ Q u > -
~~S 4')' 21~ 17~'- • 8S -4~- 3, .ts~o oJOO ~ 24 20~ 39 2ll
'- - 5 --- ~-\ -•. ' -- :3 EXAMPLE: GR/02529 ,_... -~...,__....., 28
ja""' --- Y ::! 2841
ru_,_, -~he 14 281 ' 1 100 40 1'J7 71 29 55 74~ 55 36
"""''~ -· ~ ' \ -~ '-- ~~ "'"'~ 2m - 2941 250 24 1~7 c4Q .02 26 4'Ax J9 9
3~2 -~ 89 67 69 38 22 J9 3041
TOTAL : 57,463 -~~RABBITI~ 1 1 1 3
7-~n~6-Ï 2
2 '-9 35 15 1 15
SOURCE: HORAGE
~~~~:~~LI~;p~:T~~~T 1
9
1 ~: 1 10 1 : Il: 1 ~6
1 11
2 1 1
~ 2 1 1
RESEARCH SECTION
1 1 1 7/11/79
18
5
_j_
..11_

ARERC
1978 HOUSING STOCK 1657
~ v,659 z ~ 1660 1661 1663
TOTAL= 3,524 ..r
~ ~" 1s( fc MIRROR
~~~/ 5 3 Jfi 1563 • .. _q})') ci' ---- ~50~ ~ K"' /
f.~\f. 1 'ti~ 22 11 4y 70 4 1463
~ ONE MILE rf ""'s 1353 ~4 wf ·~ _\ ~ / ~ ~ 'L ~~ ~3~ 50 70 5 1363
8/79 "' ' )
125t!
!?"" :~ '\ 1 IEk Î~ : [A/Œ
1251 '--zgw AW:J'(_pR 17 18 1 1263 /~ ~
v~_ v 1
~\~ 1150 v /Y; ~~/ 2/ 38 8 ·-i 1163 "-..--../
~>{sJ r ~L ~ '\
1050
~ 24 '16 1063
ORT / Rtr. lt>n<n.
:""""'""
IL:PSALA ~v Il~/' ~Le ~ \ LAKE 950 9'/ ~~ l~ 963
"' ~ \. . ··········.
1 1/ 7 ~tt ........_
850 1 ~2 r-) 863
.N/
750 1 v 53 K 611 5 763
(~ 7 EAGLERIVER v\ l w 650 lOOSCALE 663 ~~ 7
/
550 ( 1/t!t [#LAK
1 1 GRIDSYSTEM
563
450 ~ v,4 16 • 463
~~~·; r f 15 ' ~ -EXAMPLE: GRID NW 455 363
250 ~ ~ 65 ( ~~ro ~ i\27 .... ~L! tAD~y 263 ·~ CREEK
.0
~., ORONAOO f'D~ v; Î' .,40
15~ MUNTE R 181 17 3 1 163 lERY.} R.D
' /.' z
r- -' ~
\~ 2Vr fh~ _.r
0 1::': "' -o a:
50 è g267 :n 145 90 ~69 6 15 63 ~ ,, ~ 1~ >J "' NORTHWEST GRIDS '" .• !'._ EAGLE RIVER ROAD ~THWEST GRIDS
50 ( ") 1 2 42 5 26 5 63
~
1501
'-·...J l'"'"'\' ~ ./R~ j-39 10 5 163 '- (E
GLE
1'-------..r v·\'-_....- ., , ......, '\..1 \, 1.
~5~ 250 251 252 253 1~ 235 256 257 258 260 2~1 )~ 253 11
10 69
19

ARERC
1979 HOUSING STOCK BY TYPE
Single Multi- Mobile Single Multi- Mobile GR ID Family Dupîex family Home GR ID Family Duplex family Home
1130 42 32 - - 1537 74 40 287 4 1131 85 102 32 1538 295 140 34 95 1132 19 8 1,002 1539 69 1133 - - 40 - ·.- 1540 222 44 72 1135 224 72 661 27 1541 25 - 310 1136 498 130 672 55 1625 32 - 16 1140 - - - 80 1626 143 8 160 1229 25 10 46 - 1627 279 82 654 52 1230 18 8 118 - 1628 250 62 340 73 1231 63 14 205 - 1629 174 48 220 135 1232 3 - 11 - 1630 64 20 629 74 1233 8 2 226 1 1632 165 6 160 1234 1 - - 1633 347 50 1236 317 54 80 186 1634 6 1237 225 132 365 11 1636 9 1238 4 - - 393 1637 345 40 133 13 1239 146 8 57 1638 245 4 128 183 1240 131 52 225 21 1639 66 66 46 1241 185 154 360 22 1640 137 8 4 1328 79 32 31 1641 136 8 1329 215 110 612 1726 18 58 22 1330 191 70 234 10 1727 315 78 326 77 1331 191 28 720 13 1728 242 64 265 19 1332 222 84 685 22 1729 280 100 434 239 1335 74 440 1730 32 21 222 1336 129 102 470 142 1732 113 34 105 1337 1 - 1733 270 134 18 11 1338 138 62 230 177 1734 55 12 105 50 1339 219 76 72 31 1735 58 54 237 1340 93 2 - 4 1737 266 156 380 1341 167 78 115 385 1738 97 16 136 69 1427 13 - - 1739 227 - 141 1428 96 44 3 1740 266 1429 225 150 57 - 1741 296 64 1430 149 180 155 1827 164 18 78 183 1431 70 22 469 10 1828 145 32 39 1432 261 56 541 40 1829 346 12 53 1433 39 34 - 1830 11 10 117 1434 455 32 4 - 1831 49 56 120 2 1435 498 196 6 - 1832 101 6 107 2 1436 65 2 420 363 1833 280 14 77 1437 2 - - 1834 82 22 178 53 1438 440 - 1835 15 4 82 5 1439 381 60 85 - 1928 1 1440 252 4 63 435 1929 123 32 65 2 1441 170 - - 1930 34 6 4 1 1525 79 - - 1931 33 8 82 1 1526 305 78 - - 1932 5 - 20 1527 342 16 27 1933 165 10 136 4 1528 180 - - 47 1934 2 - - 314 1529 175 56 1,001 31 2025 31 4 45 3 1530 105 84 401 34 2026 235 50 81 4 1531 118 30 272 29 2027 97 2 5 8 1532 261 2 56 - 2031 77 66 137 2 1533 303 75 - 2032 22 2 5 7 1534 250 - - - 2033 10 4 - 19
20

ARERC
Single Multi- Mobile Single Multi- Mobile GR ID Family Duplex family Home GR ID Family Duplex family Home
2034 58 1 2435 3 1 2035 33 6 60 2436 43 7 2042 8 2437 98 3 2043 5 2438 51 2122 2 2439 43 2123 17 2 2440 59 2124 42 5 2441 37 2125 332 8 2525 2 2126 243 54 276 5 2526 277 22 2127 181 2 10 2528 1 2129 347 24 44 2 2531 10 2 2130 34 16 46 2 2532 1 2131 82 50 71 1 2533 7 2132 14 2 4 2536 49 4 9 2133 129 4 52 82 2537 59 5 2134 39 4 5 2538 128 1 2135 28 2 12 52 2539 104 2142 2 2540 27 2143 1 2541 29 2222 6 26 2626 64 2223 3 1 2630 83 15 2224 73 4 2631 13 2 8 6 2225 112 2 20 2632 28 10 17 6 2226 347 24 140 12 2633 57 4 6 2227 208 52 12 2 2634 25 2 16 2228 84 16 2635 38 8 4 10 2229 76 34 42 1 2636 81 4 2230 78 42 14 2637 56 2 3 2231 36 8 46 1 2638 44 4 2232 14 4 30 45 2639 40 2233 34 8 12 2640 53 2 2234 48 4 3 14 2641 30 2235 146 8 19 2727 1 2322 29 2 2728 15 2323 7 1 2729 < 41 2 2324 31 4 12 2 2730 153 22 8 29 2325 31 38 56 2731 100 20 32 22 2326 123 28 396 2732 4 2 2327 200 18 15 2733 74 6 5 2328 87 15 2734 25 2 21 2329 85 4 520 2735 46 3 2330 18 4 12 2736 151 2331 4 4 3 2737 100 2332 11 8 7 2738 24 2333 78 6 11 76 2739 20 2334 75 4 18 2740 39 2335 56 2 2 2741 12 2336 117 2829 5 2423 1 .2830 14 2424 123 68 2831 281 2425 220 76 2832 215 20 26 70 2426 120 2 54 2833 96 3 1 2427 157 26 36 4 2834 25 2 13 2428 119 2 176 2835 137 2429 1 2836 71 2430 1 1 2837 28 2431 6 1 2838 55 2432 29 304 2839 74 2434 2 2840 54
21

ARERC
Single Multi- Mobile Single Mufti- Mobile GR ID Family Duplex family Home GR ID Family Duplex family Home
2841 33 2 1 3235 9 2843 18 - - 3237 2 2931 22 - - - 3238 32 - - 3 2932 226 4 19 1 3239 1 2933 236 4 4 3240 14 - - 1 2934 170 - - 7 3241 11 - 4 2935 38 2 - 3242 1 2936 52 - - - 3336 7 2 2937 23 - 3 3337 16 - 9 2938 47 2 - - 3339 4 2939 31 - - 8 3340 1 1 - - 2 2940 48 - - 11 3341 14 - - 2 3032 3 - - 3342 1 3033 60 - - 3437 13 3034 74 2 - 13 3438 10 3035 63 - 4 3439 2 3036 60 - 9 3440 2 3037 32 - 6 3441 3 3038 21 - 1 3442 1 3039 28 - - 1 3536 2 3133 1 - 6 3538 9 3134 43 2 - 1 3539 2 3135 73 - - 4 3638 2 3136 50 - - - 3639 1 3137 25 - - 6 3640 1 3138 10 - - 3738 1 3139 26 - - - 3740 1 3141 3142 2 - - 1 TOTAL 26,300 4,868 19,335 6,960
TOTAL 1979 HOUSING STOCK-57,463
22

ARERC
~ ~
1. 1 '' ~ .• ~
23

ONVW30 DNISilOH ~0 SNOil:)3fO"Hd

ARERC
PROJECTIONS OF HOUSING DEMAND FROM 1980-85
An accurate projection of housing demand involves a complex set of assumptions and a well-defined data base. The first step is the development of a population projection. Table 1 displays a projection to 1985 based on ISE R's regional MAP model which assumes growth due to general economie development and the construction of the natural gas pipeline beginning in 1981. To produce a population estimate which will predict civilian housing demand, on-base military and institutional populations must be subtracted out.
TABLE 1: POPULATION PROJECTION: 1979-19851
Estimated Civilian Population Population
1979 196,500 175,812 1980 195,911 175,748 1981 200,809 181 '1 09 1982 211,853 192,153 1983 222,022 202,272 1984 223,576 203,826 1985 224,694 204,894
One factor affecting housing demand is the length of residence. Because the projection period includes a major statewide construction project, the length of residence of the average person is shortened temporarily as new workers and families move into Anchorage. Newer residents have a greater demand for rentai miltifamily units compared to more long-term residents.
1 n addition to length of residence, other interrelated factors influence demand. Household size is expected to continue to decline throughout the projection period, as it has during the past decade. This has had two effects:. increasing overall housing demand by spreading fewer people among more units, and altering housing demand away from the standard single -family home. This changing demand base for housing types combines with declining household size and changing proportion of length of residence to produce a demand projection.
Using the approach described above, Table 2 projects housing demand to 1985. lncluded in this projection is a built-in vacancy rate ranging from two percent for single family to four percent for multifamily.
lt should be noted that the housing type is differentiated from ownership status; that is, a single-family residence can be a rentai, and multifamily units include condos, PUD's and other types of owner-occupied units. The projection makes an assumption that the proportion of owner-occupied multifamily units will increase during the study period, as more condominiums and townhouse units enter the market. This is one factor, along with cost and others, which slows the growth of the single-family market.
The projection can be compared to the present 1979 housing stock to estimate the construction demand during the six-year period. Note that the present high vacancy rate produces an actual 1979 stock which is higher than the demand for both 1980 and 1981. Wh ile demand in multifamily units is expected to grow 23.7 percent from 1980 to 1985, the present surplus produces only 1, 786 new units needed to meet the demand. Single-family demand is expected to grow a slower 15.4 percent, but the lower vacancy in 1979 improves the new construction demand. Mobile homes are expected to show the smallest growth (14.8) while duplexes increase by 25.2 percent.
25

ARERC
TABLE 2: HOUSING STOCK DEMAND: 1979-19852
Single Multi- Mobile Family Duplex family Home Total
1979 (Actual) 29,414 4,954 19,695 7,341 61,404 1980 29,664 4,313 17,361 7,259 58,597 1981 30,571 4,510 18,188 7,473 60,742 1982 32,280 .. 4,902 19,768 7,917 64,867 1983 34,051 5,222 21,066 8,344 68,683 1984 34,300 5,330 21,335 8,397 69,362 1985 34,239 5,402 21,481 8,336 69,458
1980-85 Change in Demand: Units 4,575 1,089 4,120 1,077 10,681
1980-85 Change in Demand: % 15.4% 25.2% 23.7% 14.8% 18.5%
New Unit Demand 1980-85 4,825 448 1,786 995 8,054
Average Annual New Unit Demand 804 75 298 166 1,343
The conclusion is that demand is slowly changing in favor of the multifamily and duplex units, but the present surplus will continue to depress the number of new· units required to meet the needs of the community. Single-family-unit demand is stronger now because of a smaller surplus, but this strength slows to equilibrium very shortly after the gas pipeline construction peaks.
One noteworthy aside is the changing mix of owner-rental duplex/multifamily units. As more condominium and townhouse units come on the market, the character of this style of housing changes, and the proportion of rentai stock relative to the total stock may actually decrease.
1 Population as of J uly 1.
21ncludes estimates for Eagle River/Chugiak and Turnagain Arm.
26

ARERC
65
60
55
Cl) 50 !::: z ::l {!j z ëi5 ::l 45 0 I LL 0 a: w ~ 40 ::l z
35
30
HOUSING SUPPLY AND DEMAND ·ANCHORAGE AREA 1968·1979
25 ~--~--~-r----~----r----,-----r----~----~---,r---~----~ 1968 1969 1970 1971 1972 1973 1974 1975 1976 1977 1978 1979
HOUSING SUPPLY AND DEMAND
The accompanying chart describes the historical relationship between housing supply and demand in Anchorage. After a fairly even market in the tate 196Q's and early 1970's, a surplus of housing occurred due to the delay of the onset of pipeline construction. This oversupply turned very rapidly into a serious shortage of housing between 1975 and 1977. Market response to this situation produced a very large number of new units which eventually created a substantial surplus by 1978-79.
The technique for this analysis was designed by the U.S. Department of Housing and Urban Development for assessing urban housing markets.
27

SLS03 NOIL3illiLSN03 'IVILN3GIS3ll

ARERC
RESIDENTIAL CONSTRUCTION COSTS
A different distribution method was used to gather construction cost data for this edition in the hope of improving the response rate.
lndividual banks and financial institutions were asked to send the house plans and questionnaires to their builders. Plans were sent to 21 builders, with seven providing responses.
Because of the banks' involvement, the builders responded anonymously. Th us, it was not possible to determine if any of the builders were the same as the respondents to the first survey. We are also unable to provide any information on builders' size or volume of construction.
Because the respondents to this survey differed, and due to indiviçlual pricing techniques and construction methods, it was not possible to compare each and every cost item as in the prior survey. lndividual cast items differed significantly in random patterns. However, the average total costs appear to be representative of the market.
ln general, the survey results indicated that material costs, such as lumber, increased an average of 4% during the past six months. However, labor-related cost items decreased substantially during the same period, resulting in a very slight overall increase (.9%} in the total cost of a single-family residence.
29

ARERC
HOU SE PLANS BI D UPON
~ ~
-. ~,
•... ''11'1
' ' til "["t'''ff" ' .: nr~i'r "'11'' l '~nrrr . .. ' ''""'' ,. .. ' ' 1 : 1 ! 1 '
1
1
r· : · , : ' · 1 • •
i1
i : 1 l:::1 · · il . l' . u~ l'
' llilllllllll Willl llil ul . ~~ ', . . ·. Il r---- -~ -- ___ ;= Il ttt li Il Il lill --t.J. ~-::::::::
Dining
UPPER LEVEL
GARAGE
.LOWER LEVEL
,---,~~DQ L=-=--=-'' ~~
30
Unfin. Bedroom
Unfin. Bedroom

ARERC
1.
Il.
Ill.
CONSTRUCTION COSTS OF A TYPICAL SINGLE-FAMIL Y DWELLING
LOT COST1
COST OF STRUCTU RE2
FINANCING AND SALES COSTS3
AVERAGETOTALCOST
$30,500
48,990
18,110
$97,600
1 Builders instructed to base cost estimate on an R-1 lot within the Municipality of Anchorage complete with ali utilities
including water, sewer, electric, gas, paving, curbs and gutters.
2The cost figures presented are for a typical split-entry house with the following characteristics: 1,144 square feet finished upstairs, which includes 2 bedrooms, 1 Y2 baths, kitchen, dining room and living room with fi replace; 568 square feet
unfinished downstairs, plus a 440-square-foot 2-car garage. (See plans on p. 30.)
3sales commissions, closing costs, interest on construction loan and loan fee, job supervision and direct job overhead. lncludes general and administrative expenses such as insurance, office expense and taxes. ln addition, includes builder's
profit.
31

XIIAII3V S:I'IVS 'IVIIN3GIS:Ill
:nr:n1v

ARERC
RESI DENTIAL SALES ACTIVITY
Statistics summarizing Anchorage area residential sales from J anuary 1 through June 30 of the past four years are presented in the attached tables. These figures include sales in the Matanuska-Susitna Borough, since about 21% of the Mat-Su labor force commutes to Anchorage to work, and is therefore a substantial part of the Anchorage residential market. ln addition, because of the statistical information available, a very minimum number of non-Anchorage, Mat-Su sales are included, but these have very little bearing on the total picture.
These statistics have been obtained from the Multiple Listing Service, lnc. (hereinafter referred to as MLS). Presently, about 184 real estate agencies and over 1500 real estate agents in the Anchorage area report sales to M LS. lt is estimated that over 90% of the total residential sales in Anchorage are reported to MLS, and that these statistics reflect Anchorage residential sales activity quite accurately.
The la test available data from M LS have been used. Revisions of data occur in each edition of the MLS due to the fact that some sales do not close and this information needs to be incorporated into the data. These revisions are most prevalent in data published during the most recent six months, and do not significantly affect older data.
L·- 33

ARERC
SUMMARY STATISTICS-ANCHORAGE MULTIPLE LISTING SERVICE
FINANCING METHOD BY PERCENT OF TOTAL RESIDENTIAL MARKET
State and FHA Federal VA Conventional Assumption Miseellaneous
1979 {thru 6/30) 3.47% 25.72% 40.88% 15.01% 14.92% 1978 {thru 6/30) 3.43% 22.59% 55.14% 9.16% 9.68% 1977 {thru 6/30) 1.02% 23.15% 54.65% 8.74% 2.09% 1976 {thru 6/30) 2.26% 27.59% 48.60% 12.66% 8.89%
~ SEMIANNUAL SALES STATISTICS
Average Mkt. Average Listing Average Listing Average Selling Time Sold Priee-Houses
Priee Priee (Days) (Not Sold)
1979 (thru 6/30) $85,580 $84,345 65 $92,711 1978 (thru 6/30) $77,828 $77,232 49 $83,534 1977 {thru 6/30) $70,398 $69,564 54 $73,314 1976 {thru 6/30) $65,661 $64,918 57 $73,721
SEMIANNUAL STATISTICS
Jan-June Jan-June Jan-June Jan-June 1979 1978 1977 1976
·.:)· Average. SeiJing Priee $ 84,345 $ 77,232 $ 59,564 $ 64,918
Number of Sales 1,399 1,505 1,241 954
.. Total Volume-Residential Closed $117,999,058 $116,234,286 $ 86,330,032 $ 61,931,901
WEEKL Y SALES VOLUME
June1979 June 1978 june 1977 june1976
Average Sales per Week 54 59 48 37
,\ Total Residential Listings (as of 6/30) 2,093 1,610 984 999 No. of Weeks of lnventory (based upon average sales) 38.8 25.6 20.5 27.0
34 -
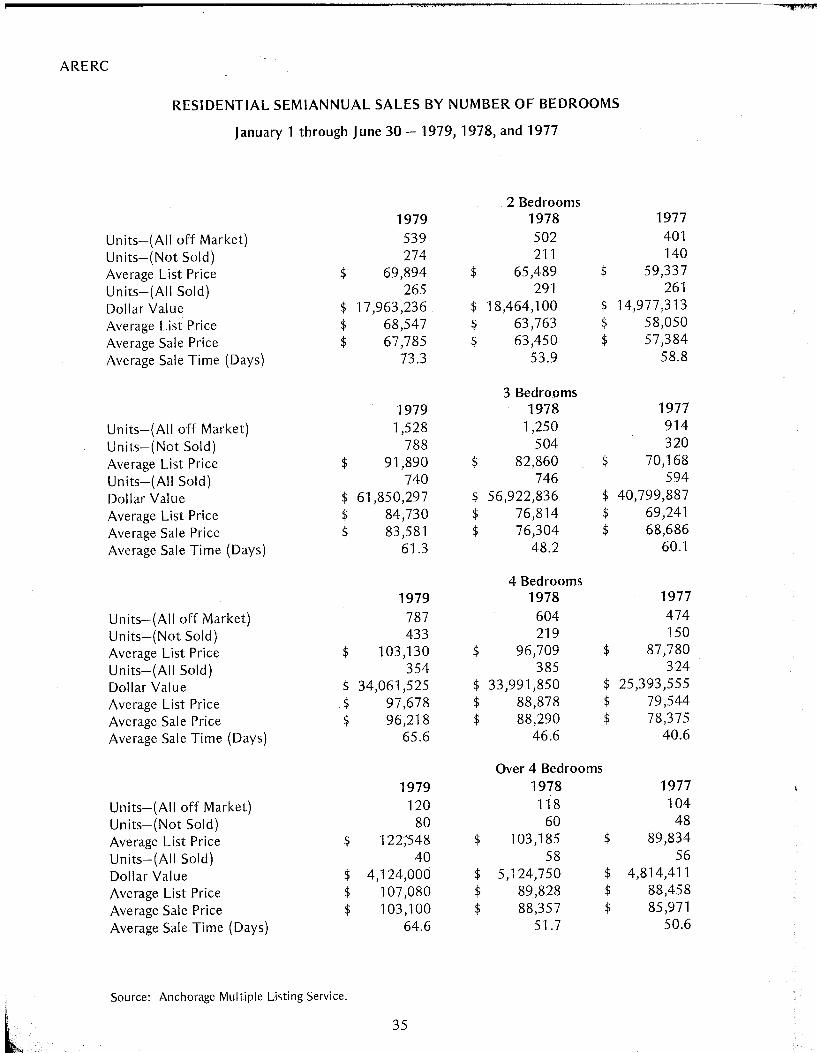
ARERC
RESIDENTIAL SEMIANNUAL SALES BY NUMBER OF BEDROOMS
J anuary 1 through June 30 - 1979, 1978, and 1977
2 Bedrooms 1979 1978 1977
Units-(All off Market) 539 502 401
Units-(Not Sold) 274 211 140
Average List Priee $ 69,894 $ 65,489 $ 59,337
Units-(All Sold) 265 291 261
Dollar Value $ 17,963,236 $ 18,464,100 $ 14,977,313
Average List Priee $ 68,547 $ 63,763 $ 58,050
Average Sale Priee $ 67,785 $ 63,450 $ 57,384
Average Sale Time (Days) 73.3 53.9 58.8
3 Bedrooms 1979 1978 1977
Units-(All off Market) 1,528 1,250 914
Units-(Not Sold) 788 504 320
Average List Priee $ 91,890 $ 82,860 $ 70,168
Units-(All Sold) 740 746 594
Dollar Value $ 61,850,297 $ 56,922,836 $ 40,799,887
Average List Priee $ 84,730 $ 76,814 $ 69,241
Average Sale Priee $ 83,581 $ 76,304 $ 68,686
Average Sale Time (Days) 61.3 48.2 60.1
4 Bedrooms 1979 1978 1977
Units-(AII off Market) 787 604 474
Units-(Not Sold) 433 219 150
Average List Priee $ 103,130 $ 96,709 $ 87,780
Units-(AII Sold) 354 385 324
Dollar Value $ 34,061,525 $ 33,991,850 $ 25,393,555
Average List Priee $ 97,678 $ 88,878 $ 79,544
Average Sale Priee $ 96,218 $ 88,290 $ 78,375
Average Sale Time (Days) 65.6 46.6 40.6
Over 4 Bedrooms 1979 1978 1977
Units-(AII off Market) 120 118 104
Units-(Not Sold) 80 60 48
Average List Priee $ 122,'548 $ 103,185 $ 89,834
Units-(AII Sold) 40 58 56
Dollar Value $ 4,124,000 $ 5,124,750 $ 4,814,411
Average List Priee $ 107,080 $ 89,828 $ 88,458
Average Sale Priee $ 103,100 $ 88,357 $ 85,971
Average Sale Time (Days) 64.6 51.7 50.6
Source: Anchorage Multiple Listing Service.
35
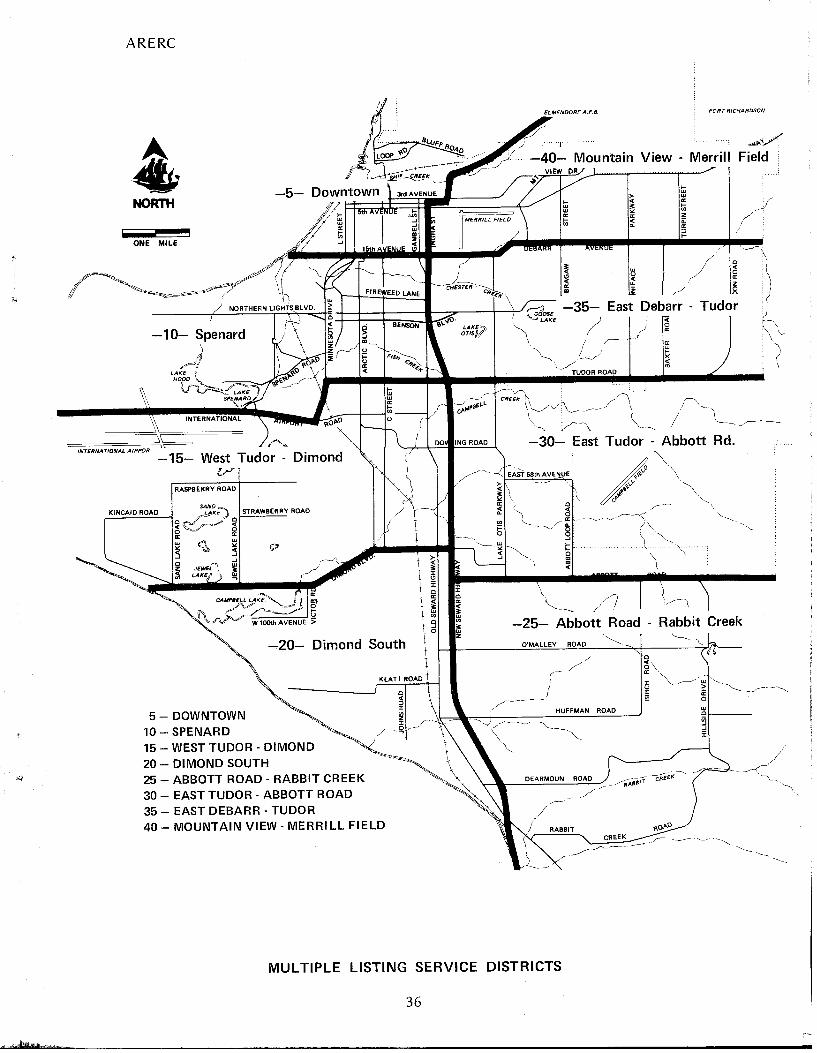
"'
~\
ARERC
ELMENDORF A.F.B.
r ~0 View - Merrill Field • NORTH
-5- Downtown l "'" AvoNu• , / (
/1''~"1'"' ,11 ' ' ~ ~ a:
tu w a: t; z ii: a:
y /'
ONE MILE r~
=====______:,=='·~ / ~ INTERNATIONAL AIRPOR
-15- West Tudor - Dimond u-r
RASPBERRY ROAO
KINCAID ROAD SAND
Ç 1 STRAWBERRY ROAD 0 0
" ~ li! a:
~ ~1 0 -'
-20- Dimond South
5- DOWNTOWN 10- SPENARD 15- WEST TUDOR- DIMOND 20- DIMOND SOUTH 25- ABBOTT ROAD- RABBIT CREEK 30- EAST TUDOR - ABBOTT ROAD 35- EAST DEBARR- TUDOR
KLATIROAD
~ "' z ::t
/->l
40- MOUNT AIN VIEW- MERRILL FIELD
i "' Ï 0 a:
~ "' g 0
Ï 0 a:
" [li "' 1~
~ ~
~ ~
a: "'
1 ) 1 (!?osE -35-1/
East Debarr ."\ LAKE /)
·~ 1 .r-1.__-/L/
TUDOR ROAD
; ~ a:
a: w ... x ;a
/ \ 0 '\ " : 0 :
~ : i $; ; (
Tudor ~·'-
(
CRE~ /\ ~ ~;-~ ~--- / L~~ -30- East Tudor - Abbott Rd.
_------...__--....._r·~~ )~
.... \
"\ ~
-'-.
\
//) -25- Abbott Raad Rabbit Creek
O'MALLEY ROAD
/
1/
1 / --~ HUFFMAN ROAD
DEARMOUN ROAD / . ....-AsOÎT
/
/ .~ ~
"\
--------- ---....
MULTIPLE LISTING SERVICE DISTRICTS
36

ARERC
Li
J .
. --------- - ----- ---
102 MAT-SU
BOROUGH
100 EAGLE RIVER
MULTIPLE LISTING SERVICE DISTRICTS
37

ARERC
PROFILE OF RESIDENTIAL SALES ACTIVITY ANNUAL STATISTICS-1976, 1977,1978
Anchorage Multiple Listing Service*
J anuary 1 to December 31, 1978 Average
Percent of Average Listing Average Average Listing Sale Ti me- Priee-
Unit %Total Dollar %Sales Listing Selling Priee Houses Sold Houses Not District Sales Market Volume Activity Priee Priee Received Median Sale (Da ys) Sold -- ----- -- --,.
En tire District 2,864 100.00 228,746,832 52.49 80,719 79,869 98.94 78,750 53.2 86,660 5 34 1.18 2,625,500 69.38 75,602 77,220 102.13 69,500 38.8 84,566 10 179 6.25 14,822,950 55.59 83,928 82,809 98.66 76,500 42.7 89,877 15 435 15.18 34,432,915 60.08 79,712 79,156 99.30 78,450 51.9 84,707 20 364 12.70 31,618,763 51.19 87,509 86,864 99.26 84,600 63.8 96,266 25 278 9.70 27,147,910 49.46 98,739 91,654 98.90 95,000 60.3 111,679 30 118 4.12 9,388,662 56.19 80,228 79,564 99.17 81,000 51.1 81,234 35 713 24.89 56,434,371 66.26 79,960 79,150 98.98 80,500 44.8 89,541 40 146 5.09 10,136,492 59.10 70,427 69,428 98.58 67,750 41.2 79,486 100 256 8.93 19,963,075 47.76 78,947 77,980 98.77 79,625 59.6 84,749 102 253 8.83 16,596,694 38.33 67,027 65,599 97.86 65,000 60.5 74,840
january 1 to December 31, 1977
En tire District 2,583 100.00 187,456,322 61.41 73,421 72,573 98.84 71,000 55.2 76,580 5 25 .96 1,808,000 64.10 74,806 72,320 96.67 65,500 78.4 69,385 10 194 7.51 13,837,825 67.59 72,320 71,328 98.62 67,500 58.5 79,519 15 394 15.25 27,829,83~ 69.00 71,230 70,634 99.16 68,500 52.8 76,803 20 352 13.62 27,348,920 57.32 78,679 77,695 98.74 76,000 69.0 82,950 25 282 10.91 23,993,568 63.51 86,149 85,083 98.76 82,664 56.7 95,371 30 127 4.91 9,092,250 53.13 72,248 71,592 99.09 73,900 48.7 7.1,402 35 725 28.06 53,473,781 75.52 74,474 73,756 99.03 73,500 44.8 79,560 40 133 5.14 7,959,200 65.19 60,898 59,843 98.26 58,000 47.3 64,487 100 161 6.23 11,253,500 54.57 70,681 69,897 98.89 70,500 60.0 76,481 102 119 4.60 7,140,650 36.50 60,614 60,005 98.99 56,950 66.0 65,271
J anuary 1 to December 31, 197 6
En tire District 1,895 100.00 124,330,7 44 53.09 66,665 65,609 98.41 66,000 60.5 73,278 5 27 1.42 1,672,900 35.52 63,212 61,959 98.01 60,000 67.8 80,797 10 165 8.70 10,785,563 65.47 66,582 65,367 98.17 63,000 94.8 72,739
"" 15 334 17.62 22,104,362 57.68 66,533 66,180 99.46 65,500 65.8 71,482 20 223 11.76 16,461,500 43.38 74,997 73,818 98.42 73,500 70.6 78,845 25 166 8.75 13,213,476 46.89 81,303 79,599 97.90 76,950 65.2 89,792 30 111 5.85 7,398,335 53.62 67,794 66,651 98.31 67,500 61.0 67,476 35 529 27.91 34,126,830 61.65 65,568 64,511 98.38 62,500 44.7 72,151 40 92 4.85 5,030,522 55.08 55,695 54,679 98.17 55,000 51.9 58,989 100 122 6.43 7,396,850 51.47 61,872 60,629 97.99 64,000 46.2 69,633 102 54 2.84 2,783,045 37.76 51,993 51,537 99.12 48,750 68.6 72,251
*See footnote on following page.
38

ARERC
PROFILE OF RESIDENTIAL SALES ACTIVITY SEMIANNUAL STATISTICS-1976, 1977, 1978, 1979
Anchorage Multiple Listing Service*
J anuary 1 to June 30, 1979
Average Percent of Average Listing
Average Average Listing Sale Time- Priee-Unit %Total Dollar %Sales Listing Selling Priee Median Hou ses Sold Houses
District Sales Market Volume Activity Priee Priee Received Sale (Days) Not Sold
En tire District 1399 100.00 117,999,058 47.04 85,580 84,345 98.55 81,950 64.8 92,711
5 10 .71 878,400 43.47 88,840 87,840 98.87 85,000 41.8 71,376 10 80 5.71 6,726,900 51.94 85,875 84,086 97.91 78,750 49.7 88,854 15 204 14.58 16,166,900 55.13 80,045 79,249 99.00 79,700 82.8 87,667 20 148 10.57 14,369,850 41.11 98,351 97,093 98.72 90,250 76.7 105,824 25 146 10.43 15,416,050 43.58 107,835 105,589 97.91 105,000 68.4 116,349 30 62 4.43 5,066,800 51.66 82,700 81,722 98.81 83,500 59.3 88,014 35 378 27.01 31,457,383 59.90 84,532 83,220 98.44 81,000 53.4 96,237 40 82 5.86 5,989,267 50.30 73,732 73,039 99.06 73,950 68.7 79,327
100 134 9.57 11,329,425 45.89 85,383 84,547 99.02 83,750 56.7 95,097 102 107 7.64 7,493,483 31.01 71,300 70,032 98.22 67,950 77.6 77,821
J anuary 1 to June 30, 1978
En tire District 1505 100.00 116,234,286 60.90 77,828 77,232 99.23 76,500 48.9 83,534
5 19 1.26 1,448,000 79.16 72,000 76,210 105.84 69,500 37.7 77,200 10 93 6.17 7,027,900 61.58 76,016 75,568 99.41 75,000 40.4 87,817 15 241 16.01 18,719,600 69.65 78,193 77,674 99.33 76,000 42.5 82,107 20 214 14.21 17,603,025 58.63 82,604 82,257 99.57 82,500 57.4 87,919 25 147 9.76 14,031,500 59.03 96,658 95,452 98.75 91,500 56.6 109,917 30 57 3.78 4,382,406 67.05 77,314 76,884 99.44 76,500 53.5 74,082 35 363 24.11 27,640,336 75.78 76,778 76,144 99.17 77,000 41.1. 86,634 40 80 5.31 5,345,200 76.19 67,981 66,815 98.28 64,250 35.3 77,213
100 131 8.70 9,931,950 52.40 76,817 75,816 98.69 78,500 58.5 83,601 102 121 8.03 7,655,969 44.81 63,709 63,272 99.31 65,000 59.3 74,562
*Multiple Listing districts 101 and 103 through 106 are in other areas of the State, and th us were excluded from these statistics. Also, because of the higher number of non-MLS brokers in the excluded districts, the reported data in those districts are not considered to be representative of actual sales activity. Since these small districts were not included, columns such as"% of the Total Market" total slightly less than 100% and "Unit Sales" do not add.
The districts referred to above are depicted on pages 36 and 37.
39

i'
"
ARERC
PROFILE OF RESIDENTIAL SALES ACTIVITY SEMIANNUAL STATISTICS-1976, 1977, 1978, 1979
Anchorage Multiple Listing Service*
january 1 to June 30, 1977
Average Percent of Average Listing
Average Average Listing Sale Time- Priee-Unit %Total Dollar %Sales Listing Sel ling Priee Houses Sold Houses Not
District Sales Market Volume Activity Priee Priee Received Median Sale (Days) Sold
En tire District 1241 100.00 86,330,032 65.21 70,398 69,564 98.81 68,500 54.3 73,314
5 13 1.04 707,000 72.22 55,403 54,384 98.16 52,000 83.5 72,150 10 95 7.65 6,428,450 69.65 69,023 67,667 98.03 63,500 57.1 77,039 15 203 16.35 13,756,637 70.00 68,387 67,766 99.09 66,500 55.2 72,547 20 150 12.08 11,378,625 56.81 77,104 75,857 98.38 74,250 77.7 79,482 25 129 10.39 10,413,004 65.48 81,993 80,720 98.44 79,500 55.4 90,515 30 61 4.91 4,196,300 57.00 69,693 68,791 98.70 70,000 37.5 72,216 35 355 28.60 24,822,616 78.53 70,483 69,922 99.20 69,500 42.4 71,210 40 71 5.72 4,240,000 68.93 60,628 59,718 98.49 56,500 48.2 60,885
100 82 6.60 5,604,350 60.29 68,600 68,345 99.62 68,500 55.5 69,088 102 44 3.54 2,745,650 38.93 62,897 62,401 99.21 58,450 67.4 63,406
january 1 to june 30, 1976
Entire District 954 100.00 61,931,901 61.19 65,661 64,918 98.86 64,900 57.4 73,721
5 17 1.78 1,015,800 35.41 61,102 59,752 97.79 58,500 42.4 78,866 10 85 8.90 5,404,000 70.83 64,367 63,576 98.77 62,250 80.7 69,494 15 164 17.19 10,997,219 64.82 66,708 67,056 100.52 66,000 73.4 71,870 20 110 11.53 7,971,400 45.45 73,241 72,467 98.94 72,950 67.4 78,694 25 78 8.17 6,139,666 53.79 80,563 78,713 97.70 75,250 65.7 96,758 30 56 5.87 3, 712,785 69.13 67,431 66,299 98.32 66,500 68.3 71,638 35 269 28.19 17,210,001 72.70 64,755 63,977 98.79 62,500 36.1 71,177 40 52 5.45 2,898,250 72.22 56,436 55,735 98.75 55,500 54.8 54,795
100 58 6.07 3,528,400 61.70 62,342 60,834 97.58 62,500 46.3 71,785 102 30 3.14 1,547,545 52.63 51,591 51,584 99.98 46,500 57.7 69,925
*Multiple Listing districts 101 and 103 through 106 are in other areas of the State, and th us were excluded from these statistics. A Iso, because of the higher number of non-M LS brokers in the excluded districts, the reported data in tho se districts are not considered to be representative of actual sales activity. Since these small districts were not included, columns such as"% of the Total Market" total slightly less than 100% and "Unit Sales" do not add.
The districts referred to ab ove are depicted on pages 36 and 37.
40

ARERC
PERCENT AGE OF ALL SOLO RESIDENTIAL PROPERTIES BY PRICE RANGE
January 1, 1979 ·June 30, 1979
A. 5.9%
F. 5.9%
E.14.0%
B. 20.1%
D. 22.9%
A· UN DER $54,999 B · $55,000 TO $69,999 C · $70,000 TO $84,999 0 · $85,000 TO $99,999 E · $100,000 TO $124,999 F · $125,000 AND OVER
41
c. 31.2%

SGN3liL X:JNV:JVA ~VLN3ll
:::r~I3~V

ARERC
RENTALVACANCYTRENDS
Rentai housing vacancies in the Anchorage area in the first half of 1979 have continued at about the same high level reached at the end of 1978. Monthly surveys taken by the Joint Military Housing Referral Office at Elmendorf Air Force Base now cover approximately 3,700 units in structures containing 10 to 400 units. (This survey has decreased from a weekly to a monthly basis during the past year.) The accompanying table (p. 44) shows that the lower rent apartments are nearly one-third vacant, while the medium and higher rent units are around one-seventh vacant. The overall vacancy rate in this sample is a little over 20 percent, with little variation over the first six months of 1979.
A similar high level of rentai vacancies is evident in the count of classified ads in the Sunday edition of the Anchorage Times. Ali family-type units, both homes and apartments {furnished and unfurnished) have been counted as the number of listings only, not the number that may be vacant. Beginning in january 1979, total listing exceeded 900 for the first time. They had been as low as 839 during the first four months of 1979, but on four Sundays they exceeded 1,000 by the end of june.
The information depicted on the map on page 49 is derived from the Anchorage Real Estate Research Committee's own vacancy survey. Data were compiled over a six-month period, from january 1 through june 30, 1979. Approximately 3,000 randomly selected units were sampled on a monthly basis. Only units currently on the market for rent were included in the Report. Condominium conversions were not considered.
Adequate data for the Sand Lake and Hillside areas were not available for this edition, but hopefully will be included in the next issue.
The following vacancy rates were indicated by this survey: low rent-16.7%; medium rent-15.3%; high rent-17.1 %; overall-16.4%.
43

ARERC
ANCHORAGE CIVILIAN RENT AL HOUSING VACANCY RATES 1
1978 and 1979
Low Medium High Average
1978 January 6 3.5 13.1 12.6 8.3
13 4.1 13.6 17.4 9.5 20 13.4 13.0 17.2 13.9 27 14.3 13.7 16.1 14.4
February 3 14.5 14:·5 17.2 15.0 10 16.3 14.5 16.6 15.7 17 16.4 13.4 17.4 15.5 24 16.2 11.0 14.1 14.1
Mar ch 3 16.2 11.5 15.7 14.5 10 14.9 10.5 16.8 13.7 17 14.7 8.7 21.9 13.9 24 14.7 9.9 18.1 13.7 31 14.2 11.5 15.2 13.4
April 7 17.1 15.9 7.8 15.1 14 15.7 14.2 9.2 14.1 21 15.8 9.5 12.5 13.1 28 13.4 9.5 14.5 13.3
May 5 14.1 11.7 15.2 13.5 12 14.9 10.4 16.1 13.5 19 14.7 10.1 19.9 14.0 26 14.2 11.2 21.0 14.3
June 2 13.9 9.6 18.1 13.2 16 15.0 8.8 18.3 13.4 30 15.0 10.0 17.7 13.8
Semiannual Average-1978 14.1 11.7 16.1 13.6
July 28 11.8 7.5 17.5 11.1 August 11 12.9 9.7 19.7 12.9
September 1 22.7 9.1 11.1 15.7 15 18.1 9.5 15.9 14.4
October 7 17.5 10.2 15.9 14.5 14 22.3 9.8 16.2 16.4 20 21.9 9.0 15.2 15.5 27 22.3 10.1 13.8 15.8
November 4 25.4 8.8 13.4 16.5 17 25.4 9.3 13.3 16.7
December 15 24.9 14.9 17.3 19.4 29 26.8 16.1 22.2 21.8
Annual Average-1978 16.4 11.2 16.0 14.4
1979 January 19 31.5 15.2 17.6 22.4 February 9 31.1 15.6 17.3 22.3 Mar ch 2 31.2 15.3 14.8 21.8 Mar ch 30 30.9 15.0 17.9 22.3 April 30 30.6 15.8 19.3 22.8 May 25 28.8 15.4 14.8 20.5 June 29 35.0 14.1 13.9 23.2
Semiannual Average-1979 31.3 15.2 16.5 22.2 1 Rent ranges by unit size (number of bedrooms) are as follows:
0- & 1-BR 2-BR 3-BR 4-BR
Low $150-$299 $200-$300 $225-$350 $300-390 Medium $300-$375 $301-$400 $351-$465 $391-$500 High $376 & Over $401 & Over $466 & Over $501 & Over
Source: Joint Military Housing Referral Office, Elmendorf Air Force Base.
44

L OQ' 7+
..-
VACANCY TRENDS INI This chart indicates the trend of rentai housing vacancies as reported by the Joint Military Housing Referral Office at Elmendorf Air Force Base. The weekly reports have been averaged on a monthly basis. From October 1974 to the end of 1977, these vacancy rates were reported in two rentai categories; the lower rent apartments below $300 per month, and the medium and high rent apartments combined at rents of $300 or more. Beginning in January 1978, these last two categories were separately reported so that the law, medium and high rent apartments are in distinct rentai groups. There is sorne overlapping, however, of rent ranges between unit sizes. The three rentai categories as of January 1978 are as follows:
0-&1-BR 2-BR 3-BR 4-BR
Low $150-$299 $200-$300 $225-$350 $300-$390
Medium High
Low Medium to High Medium High
$300-$375 $376 & Over
$301-$400 $351-$465 $391-$500 $401 & Over $466 & Over $501 & Over
Source: Joint Military Housing Referral Office, Elmendorf Air Force Base.
,.,.r-- -....... /
--/
/ ___ ....1
45
/\ 1 / \ 1
1 \ 1 1 \ 1
A f \1
// ', 1
/ '---""' 1 ' _..J ''-----
1 1
1 1
I 1
1
r--" \ /
v

l RESIDENTIAL HOUSING
/\
' 1 \ ';' ~ ' 1
"\ 1
\ 1
\..-1 \ 1 \ 1 \ 1
1 1 \_ _ _J
/'
1 1
1 /
1
1 1
1
/
~
·" ./\ r-·.\ 1 \ 1 \ /\ / ' 1 , ' . ', ~~ \ ----·. ' ' ' -.. / \ 1 : 1 1 '
32
31
30 tf1
2.8
2-7
zr;
25
21--
23
2.2
zr ;?.0
/9
!8
17
16 ',\ ;\ \ ·\ 1: _.......--. ,..... \ ' 1 ' 1 ', ' / './ / 'h \: ·v· \/' (/ \.\ rts
1
' ' ' .
\ /~\ 1
,/
v \ 1 \ 1 1 \ r---\ 1 -1
46
\ 1 .j
lê.
10

ARERC
CLASSIFIED AD LISTING FOR RENT IN ANCHORAGE SUNDAY TIMES SELECTED DATES, 1978 and 1979
Monthly Average Mobile
Homes Efficiencies Apts. Furn. Apts. Unfurn. Total Total Homes
J anuary 1, 1978 66 19 206 258 549 615 19
J anuary 8, 1978 63 23 222 310 618 23
J anuary 15, 1978 61 22 226 324 633 22
January22, 1978 53 23 236 306 618 25
January 29,1978 65 25 253 318 661 23
February 5, 1978 71 24 262 314 671 620 17
February 12, 1978 69 25 215 292 601 22
February 19, 1978 83 21 201 283 588 12
March 5, 1978 74 34 236 291 635 584 16
March 12, 1978 64 26 239 284 613 11
March 26, 1978 57 22 186 240 505 12
April 2, 1978 56 21 225 272 574 543 13
April 9, 1978 67 19 211 285 582 17
April 16; 1978 64 14 207 211 496 28
April 23, 1978 64 7 217 263 451 18
April 30, 1978 70 19 249 277 615 23
May 7, 1978 69 14 271 280 634 604 18
May 14,1978 57 15 273 297 642 17
May 21, 1978 35 13 235 264 547 26
May 28, 1978 64 18 239 273 594 22
June4, 1978 81 16 281 291 669 630 24
June 11, 1978 62 15 270 288 635 16
june 18, 1978 72 8 263 265 608 25
June 25, 1978 74 11 250 276 611 16
july2, 1978 82 16 258 272 628 680 21
July9, 1978 95 17 297 284 693 21
July 16, 1978 86 19 289 303 697 19
J uly 23, 1978 90 11 275 324 700 19
J uly 30, 1978 97 13 258 316 684 16
August 6, 1978 86 15 308 318 727 711 22
August 13, 1978 69 13 293 298 673 27
August 20, 1978 101 10 268 305 684 17
August 27, 1978 116 16 308 320 760 15
September 3, 1978 89 23 272 335 719 710 20
Septem ber 1 0, 197 8 95 21 292 320 728 16
September 17, 1978 76 14 255 318 663 19
September 24, 1978 89 17 273·- 354 733 23
October 1, 1978 101 27 276 318 722 739 30
October 8, 1978 107 25 276 304 712 27
October 15, 1978 89 21 273 307 690 25
October 22, 1978 113 17 297 320 747 37
October 29, 1978 105 21 330 370 826 50
November 5, 1978 106 28 323 345 802 802 39
November 12, 1978 104 20 307 333 764 36
November 19, 1978 138 27 326 322 813 33
~ November 26, 1978 154 26 305 346 831 34
47

ARERC
CLASSIFIED AD LISTING FOR RENT IN ANCHORAGE SUNDAY TIMES SELECTED DATES, 1978 and 1979
(continued)
Monthly Average Mobile
Homes Efficiencies Apts. Furn. Apts. Unfurn. Total Total Homes
December 3, 1978 136 26 338,. 362 862 808 28 December 10, 1978 142 23 320 368 853 29 December 17, 1978 132 21 318 366 837 28 December 24, 1978 102 12 279 278 671 29 December 31, 1978 120 28 333 338 819 25
January 7, 1979 134 27 385 407 953 932 30 J anuary 14, 1979 147 23 332 406 908 32 January 21, 1979 137 27 319 414 897 25 january 28, 1979 152 24 366 429 971 26
February 4, 1979 98 22 409 437 966 919 31 February 11, 1979 134 21 375 391 921 41 February 18, 1979 127 17 324 393 861 38 February 25, 1979 146 9 363 411 929 31
March 4, 1979 132 15 358 407 912 887 27 March 11, 1979 128 24 347 396 895 19 March 18, 1979 107 21 335 439 902 21 March 25, 1979 88 18 329 404 839 30
April1, 1979 117 24 380 406 927 908 29 April 8, 1979 120 21 362 362 865 23 April15, 1979 106 22 341 370 839 18 April 22, 1979 122 27 375 380 904 17 April 29, 1979 137 21 396 451 1,005 27
May 6, 1979 135 24 397 448 1,004 966 28 May 13, 1979 135 20 380 419 954 18 May 20, 1979 143 18 399 414 974 22 May 27, 1979 135 21 359 418 933 34
June 3, 1979 129 25 416 422 992 986 34 June -fo,! 1979 140 23 402 453 1,018 30 June 17,1979 121 22 355 435 933 34 June24, 1979 143 21 366 473 1,003 30
48

ARERC
• NORTH
ONE MILE
KINCAIO ROAO
KEY
l):t§UI*fif$ Primary work areas
~ Secondary work areas
ANCHORAGE VACANCY RATE SURVEY
June 30, 1979
r/ !
/ - - HUFFMAN ROAO
FORT RICHARDSON
/
The individual vacancy rates indicated are for actual rentai units clustered in the general area. These individual rates are
reflected in the overall rate of 16.4%.
49

SNOIS"H3ANO:> OONO:>

ARERC
ANCHORAGE CONDOMINIUM/APARTMENT CONVERSIONS
Property owners have sought various solutions to declining rentai occupancy rates recently, with several owners attempting to sell their units as condominiums. To date, no project has been successfully sold out. The majority of attempted conversions has sold less than 35%. The sales reported here represent market response, and the reader should note that purchase agreements between building owner and prospective condominium owner may be predicated upon project financing, buyer qualifications and sources of financing.
51

"
ARERC
District1 --
5 10 10 10 10 20 35 35 40 40
Total
5 10
Total
35 40
Total
ANCHORAGE CONDOMINIUM/APARTMENT CONVERSIONS
No. Units No. Sales2 % Sold
84 18 21.4% 146 25 N/A
18 6 33.3% 3 1 33.3% 4 2 -.- 50.0%
16 N/A N/A 168 60 35.7%
24 N/A N/A 89 30 33.7% 18 N/A N/A
570
SCHEDULED FOR CONVERSION
210 N/A N/A 60 N/A N/A
270
ATTEMPTED CONVERSIONS-RECONVERTED TO RENTALS
50 36
86
N/A N/A
N/A N/A
1 See Multiple Listing Service Districts Map on page 36.
2Sales based on accepted purchase agreement. Sorne closings pending approval of lender financing.
N/A =Not Available
52
Priee Range
$28,950-37,250 N/A $55,000-60,000 N/A $35,000-50,000 $52,000-54,000 $34,950-51,000 $61,500-64,000 $44,500-50,000 $54,000
N/A N/A
$36,700-61,500 $28,500-53,000

ARERC
53

ts
XHO~N:IANIG'IOSNil

'
ARERC
ANCHORAGE SINGLE-FAMIL Y CONSTRUCTION ACTIVITY AS OF JUNE 30, 1979
Single-Family Construction (1-4 units), excluding condominiums
Number: 812 Percent Sold: 54%
Condominiums
Number: 545 Percent Sold: 39%
Percent Unsold:
Percent Unsold:
46%
61%
Since December 1978, the number of units under construction financed by local financial institutions has dropped significantly (approximately 16%). The drop in the number of units in production reflects an almost 50% decrease in building permits issued in the Municipality of Anchorage this year.
lnterestingly enough, sales seem to have held up, as indicated by the reduced number of units in production, and the sold/unsold percentages remaining essentially the same as in December 1978.
Most construction lenders seem to feel that the total inventory of newly constructed homes and condominiums will continue to drop throughout the 1979 construction season. This drop in construction activity seems to be directly related to the flattened local economy, and, among condominiums, to a significant increase in apartment to condominium conversions.
L __ 55
A!

9S
X~IAI~:>V NVO'I 3DVD~liOW

ARERC
MORTGAGE LOAN DELINQUENCIES
Total No. Number of Days Delinquent of Loans Outstanding 30 60 90 Total
6/30/76 FH.LMC 3,541 54 8 1 63 FNMA 4,640 116 25 12 153 AHFC 1 12.742 ~ 16 _1_8 79
10,923 215 49 31 295
12/31/76 FHLMC 3,564 75 10 3 88 FNMA 4,782 126 29 12 167 AHFC 1 3,205 ~ _12_ __12... _lQl_
11 ,551 251 51 54 356
6/30/77 FHLMC 3,564 67 7 4 78 FNMA 4,640 116 25 12 153 AHFC 1 3!890 53 15 36 104
12,094 236 47 52 335
12/31/77 FHLMC 3,467 86 8 5 99 FNMA 4,842 138 29 11 178 AHFC1 4.923 _ii_ 24 39 _ill_
13,232 278 61 55 394
6/30/78 FHLMC 3,654 71 16 10 97 FNMA 5,22D 184 24 10 218
AHFC2 5,656 89 19 35 143 14,530 344 59 55 458
12/31/78 FHLMC 3,742 87 15 12 114 FNMA 6,088 217 29 18 264 AHFC1 6,616 ~ 28 46 152
16,446 382 72 76 530
6/30/79 FHLMC 3,918 88 8 12 108 FNMA 6,404 177 26 28 231 AHFC1 7,592 72 23 58 153
17,914 337 57 98 492
1 AHFC bases its delinquency statistics on seller/servicer reports which have monthly eut-off dates ranging from the 13th-20th of a mon th, Consequent! y AHFC reports its mortgage loan delinquencies on a 50-80-110 day basis,
L 57
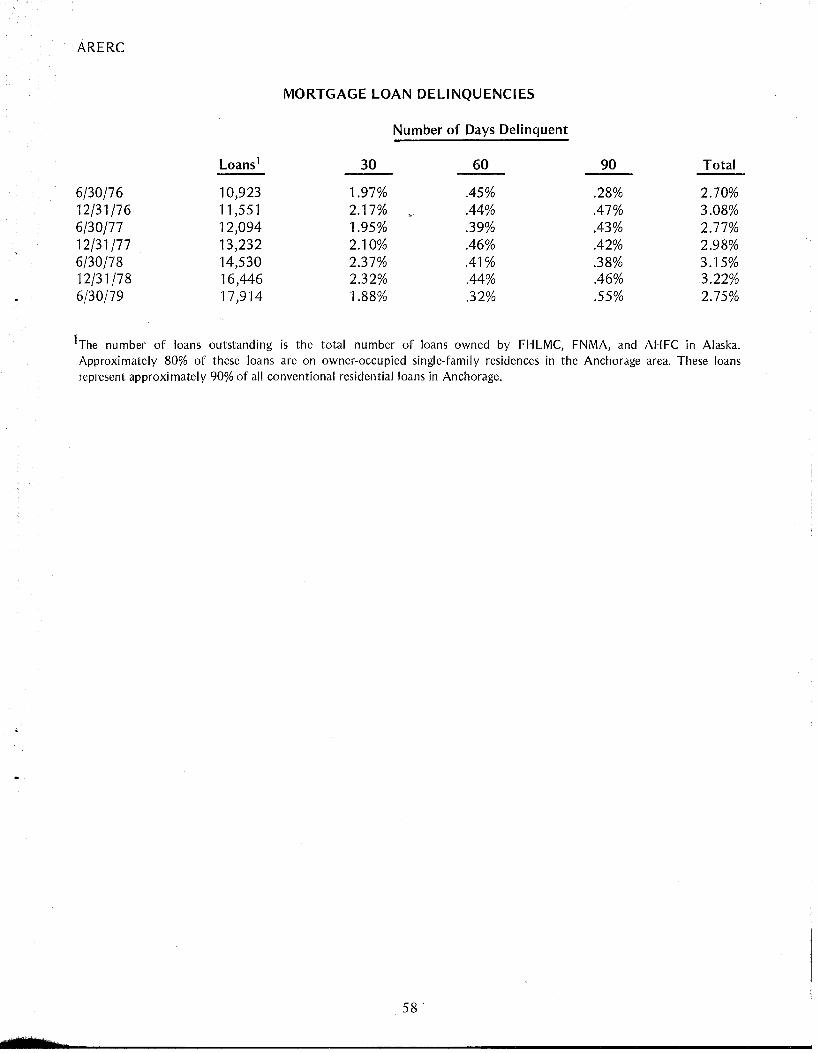
ARERC
MORTGAGE LOAN DELINQUENCIES
Number of Days Delinquent
Loans1 30 60 90 Total
6/30/76 10,923 1.97% .45% .28% 2.70% 12/31/76 11,551 2.17% •,- .44% .47% 3.08% 6/30/77 12,094 1.95% .39% .43% 2.77% 12/31/77 13,232 2.10% .46% .42% 2.98% 6/30/78 14,530 2.37% .41% .38% 3.15% 12/31/78 16,446 2.32% .44% .46% 3.22% 6/30/79 17,914 1.88% .32% .55% 2.75%
1The number of loans outstanding is the total number of loans owned by FHLMC, FNMA, and AHFC in Alaska. Approximately 80% of these loans are on owner-occupied single-family residences in the Anchorage area. These loans re present approxi mately 90% of ali conventional residential loans in Anchorage.
58
ARERC
59

..
<;-
ARERC
MORTGAGE INTEREST RATE TRENDS
60
1 i
i

ARERC
INTER EST RATE
11.00%
10.75%
10.50%
10.25%
10.00%
9.75%
9.50%
9.25%
9.00%
8.75%
8.50%
8.25%
8.00%
7.75%
7.50%
7.25%
7.00%
L
6/30/77
CONVENTIONAL MORTGAGE LOAN INTEREST RATES Anchorage, Alaska
Period · 6/30/77 thru 6/30/79
12/31/77 6/30/78 12/31/78
Lege nd
1 FNMA AHFC FHLMC
61
11.595
6/30/79
Sub Notes: FHLMC rate includes 0.375% service fee
Yield shown is average yield
'W

(;9
SillLI'IILil
:::nn~v
ARERC
RESIDENCE MAIN STATIONS
The data presented for telephone main stations of the Anchorage Telephone Utility cover the "bowl" area of the Municipality. Areas which are within the Municipality, but which are excluded from the data are:
the Girdwood area the Eagle River/Chugiak/Peters Creek area Fort Richardson Elmendorf Air Force Base
The growth rate in residential main stations has decreased to approximately zero, and may actually be on the verge of a moderate downturn.
The utility defines a Main Station as essentially one line or one telephone number. lt may have one or more extension instruments in addition to the primary one.
~ ~~--
63
•

ARERC
RESIDENCE MAIN STATIONS ANCHORAGE BOWL
QUARTERLY, 1970-1979
Year Quarter Residence Year Quarter Residence --1970 First 24,838 1975 First 39,269
Second 25,296 Second 40,285 Third 25,862 ,- Third 40,590 Fourth 26,847 Fourth 41,833
Annual Average 25,711 Annual Average 40,494
1971 first 28,221 1976 First 43,129 Second 28,548 Second 43,442 Third 29,092 Third 45,026 Fourth 30,641 Fourth 46,153
Annual Average 29,126 Annual Average 44,438
1972 First 31,331 1977 First 47,136 Second 32,098 Second 48,074 Third 32,048 Third N.A. Fourth 32,187 Fourth N.A.
Annual Average 31,916 An nuai Average N.A.
1973 First 32,795 1978 First N.A. Second 33,295 Second 48,875 Third 33,502 Third 49,329 Fourth 34,419 Fourth 49,873
Annual Average 33,503 Annual Average N.A.
1974 First 35,237 1979 First 50,416 Second 35,840 Second 50,369 Third 36,419 Third Fourth 38,144 Fourth
Annual Average 36,410 Annual Average
Source: Anchorage Telephone Utility.
64
~~r'P'S 'hw

ARERC
Mon th
January February March April May June
%change first 6 months
July August September October November December
%change last 6 months
Annual Average% Change
RESIDENCE MAIN STATIONS ANCHORAGE BOWL
MONTHLY, 1978 and 1979
1978 Residential Stations
N/A 48,233 48,493 48,854 48,780 48,993
1.6%
48,812 49,096 50,078 49,684 49,945 49,989
2.4%
3.6%
65
1979 Residential Stations
50,329 50,445 50,475 50,567 50,380 50,161
-.3%
'Z iiiMM

iii .11F1
99
~N3WX.O'IdW3

ARERC Al
EMPLOYMENT TRENDS ALASKA STATE AND ANCHORAGE
Annually, 1970-1978; Monthly, 1978-1979
Nonagricultural Nonagricultural Wage & Sai ar y An nuai Wage & Salary Employment by Unemployment Employment by An nuai Place of Work 1 Rate Place of Work3 Unemployment
Year Anchorage Anchorage2 Alaska Total Rate Alaska
1970 42,000 6.7% 93,100 7.1% 1971 45,450 8.2 98,300 8.2 1972 48,250 8.9 104,200 8.3 1973 50,750 9.7 110,000 8.5
1974 58,700 6.8 128,200 7.9 1975 69,650 5.5 161,300 6.9 1976 73,750 6.8 171,700 8.3 1977 77,850 6.5 164,100 9.2
1978 76,950 8.3 164,000 11.1 January 74,100 8.4 151,600 12.0 February 74,450 8.1 153,000 11.8 March 74,900 9.5 155,700 12.8 April 75,850 9.1 159,400 12.1 May 77,950 9.0 165,300 12.1 June 79,500 8.6 171,600 11.4
july 77,650 7.9 176,000 10.0 August 78,350 7.5 179,300 9.5 September 80,800 7.5 173,300 9.4 October 78,700 7.4 16!),000 10.2 November 76,100 7.9 160,500 11.1 December 75,250 8.3 156,600 11.4
1979 january 73,050 8.7 153,100 11.7 February 72,300 8.8 152,700 12.0 March 72,750 8.2 155,150 11.1 April 73,800 7.8 157,800 10.0 May 76,000 7.1 164,200 8.9 juneP 78,100 7.2 168,200 8.6
1 Rounded to nearest 50. 2Based on Civilian Labor Force by Place of Residence. 3 Rounded to nearest 1 00.
P-Preliminary
Source: Research and Analysis Section, Employment Security Division, Alaska Department of Labor.
67

89
9NIAI'I ~0 LSO:l
J~3~V .
%L F>JSEJ'
~U;JUJt\(
JE ri

ARERC
ANCHORAGE CONSUMER PRICE INDEX
During the first half of 1979, the Anchorage Consumer Priee Index (CPI) continued its double digit rate of annual increases evident since November 1978. From 194.7 in that month, the Anchorage CPI rose fairly steadily to 203.5 by May 1979. The year-to-year increases amounted to 10.5 percent in J anuary, 11.2 in March, and 10.5 in May.
Although the U.S. City average CPI index is stiJl a little higher than Anchorage's, the annual rate of increase has been Jess, ex ce pt for the la test reported month of May 1979, wh en the U .S. index rose 10.8 percent over May 1978.
These figures are index numbers with 1967 as a base of 100.
69

"
ARERC
CONSUMER PRICE INDEX 1
Annual Rate of Change Anchorage, Alaska and U. S. City Average
1974 to May 1979 (Anchorage, October 1967 = 100; U. S., 1967 = 100)
CPI Annual Rate of Change Anchorage u. s. Anchorage u. s. - --
1974- Jan 125.6 139.7 7.9 7.4 Apr 129.9 143.9 8.8 10.1 July 134.2 148.0 11.5 11.5 Oct 140.2 153.0 13.3 12.0
1975- jan 142.9 156.1 13.8 11.7 Apr 150.0 158.6 15.5 10.2 july 153.8 162.3 14.6 9.7 Oct 157.4 164.6 12.3 7.6
1976- Jan 158.8 166.7 11.1 Éi.8 Apr 161.7 168.2 7.8 6.1 july 164.9 171.1 7.2 5.4 Oct 167.6 173.3 6.5 5.3
1977- Jan 169.4 175.3 6.7 5.2 Apr 172.6 179.6 6.7 6.8 july 177.4 182.6 7.6 6.7 Oct 177.3 184.5 5.8 6.5
1978- jan 179.2 186.9 5.8 6.6 8f2r 183.6 191.3 6.4 6.5 Mar 180.7 189.8 N.A. N.A. May 184.2 193.3 4.6 7.0 july 188.5 196.7 6.3 7.7 Sept. 193.2 199.3 9.8 8.3 Nov. 194.7 202.0 10.5 9.0
1979- jan 198.1 204.7 10.5 9.3 Mar 201.0 209.1 11.2 10.2 May 203.5 214.1 10.5 10.8
N.A. - Not applicable
1 Unrevised index for urban wage earners and clerical workers through April 1978; revised index for ali urban consumers beginning March 1978.
Source: Bureau of Labor Statistics, U. S. Department of Labor.
70

S3.10N-

NOTES
L_ --

NOTES
L_ --