Embed Size (px)
Citation preview

9
ANATOLIY A. PLATONOV, ŁUKASZ M. MAŁKIEWICZ
Warsaw University of TechnologyInstitute of Electronic Systems
Poland, e-mail: [email protected], [email protected]
PARTICULARITIES OF THE CYCLIC A/D CONVERTERS ENOB DEFINITION AND MEASUREMENT1,2
The paper is devoted to the methods of accurate assessment and analysis of the expected and actual effective number of bits (ENOB) of cyclic analog-to-digital converters. The equivalence of defi nition of ENOB in the IEEE Standard 1241-2000 and proposed in earlier author’s works analytical defi nition formulated on the basis of distributions of the input signal and conversion errors. Indirect and direct methods of ENOB measurement are considered. The presented results can be used for a development of accurate methods of performance analysis and testing of the cyclic and other ADCs.
Keywords – analog-digital conversion, cyclic, intelligent ADC, ENOB, converter’s performance
1. INTRODUCTION
High requirements to the speed and accuracy of conversion under general tendency to diminish the sizes, cost and power consumption of analog-to-digital converters (ADC) converters are best satisfi ed in the cyclic converters (CADC). The main factor complicating the development of theoretical support of the design of both ADC and CADC is multiple non-linearity of the ADC’s transition function conditioned by the fi nite input range of the converters, non-linear mapping of the continuous set of analogue input signals into the discrete set of output codes, and by non-uniform setting of quantization thresholds. These non-linearities create signifi cant diffi culties in formulation of adequate characteristics of the conversion quality [1-4] and, as a consequence, in the development of mathematically grounded methods of their measurement. A not less important and unsolved task is an optimization of the architecture and parameters of CADC enabling full utilization of the resources of their analogue and digital components improving the converter’s performance. These circumstances complicate the design
1 The work is supported by Grant 3 T11 059 29 of the Polish Ministry of Science and Information Society Technologies.
2 The work was presented at IEEE Instrumentation and Measurement Technology Conference (IMTC 2006) [5]
METROLOGY AND MEASUREMENT SYSTEMSVOL. XV, NUMBER 1 (2008)
10
of the converters and worsen their actual characteristics in comparison with those potentially achievable.
Nowadays, most commonly used measures of ADC performance are the effective number of bits (ENOB) and an equivalent measure – effective resolution (EFR) [1, 3–5], signal-to-noise and distortion ratio (SINAD), total harmonic distortion (THD), differential (DNL) and integral (INL) nonlinearities, and some others [1, 2]. Except of ENOB, all the listed measures of conversion quality are determined for pure sine-wave testing signals with specifi ed amplitude and frequency. However, non-linearity of the ADC violates the principle of superposition; that makes the results of sine-wave tests approximate and sensitive to the changes of the form and parameters of the sinusoid. This decreases the reliability of the test results and radically increases the requirements to the form and parameters of the harmonic testing signals. Another disadvantage of sine-wave tests is non-uniformly weighed numerical assessment of quantization thresholds (“code transition levels” [1]) setting errors. The latter effect is caused by the slow changes of the signal near its extremes, specifi c for the harmonic signals, and fast changes near the zero values. As the result, the accuracy of quantization threshold measurements decreases in the central and increases in the upper and bottom regions of the ADC input range. At last, the sine wave cannot be considered as a typical signal at the ADC input. For these reasons, the search for more accurate characteristics of conversion quality, independent of the testing signals, as well as for accurate and methods of their measurement, convenient for applications, remains an unsolved issue in ADC design [2, 3].
Recently, researches in this direction are focused on measurements of the fl ash ADC performance. Other classes of converters, such as the cyclic ADC (sub-ranging, successive approximation, Σ∆, redundant sign digit, others) and pipe-line (cascade) ADC, are measured as "black boxes" and analysed using the methods and measures of quality used in the fl ash ADCs analysis and testing. However, investigations [5–10] and other show that these methods and measures cannot be directly applied to the analysis of cyclic ADC (CADC) and pipe-line ADC (PADC) and should be corrected. The necessity of corrections follows from the established fast normalization of quantization errors for the greater number of cycles or cascades of conversion [6, 7]. This violates the commonly used assumption, valid for high-quality fl ash ADC, that the conversion errors are distributed uniformly inside of each quantization interval. As the result, all the characteristics of CADC and PADC using this assumption also become inadequate.
An additional diffi culty following from the “black-box” approach to CADC and PADC analysis is the impossibility to determine the dependence of the conversion quality on the architecture, parameters and non-idealities of the analogue part, internal noise and distortions. For the same reason, defi nition of integral and differential non-linearities of CADC and PADC loses its sense. Also, a “black-box” approach does not permit to investigate the processes inside the converters, including the changes of accuracy and reliability of codes formed in sequential cycles or stages of conversion.
The paper generalizes the results of work [5] devoted to development of accurate formal methods of ADC performance analysis, optimization and testing. The investigation is performed for the case of the cyclic ADC. Special attention is paid to necessary correction of known
ANATOLIY A. PLATONOV, ŁUKASZ M. MAŁKIEWICZ

11
defi nition of ENOB and to the principles of ENOB measurement. There are considered indirect and direct methods of ENOB measurement initially studied in [6, 7]. Analysis of the direct method shows its advantage over conventional indirect methods of ENOB assessment [3, 4] due to exclusion of intermediate operation – estimation of the root mean square (rms) error of conversion. Direct measurement of ENOB permits also to apply optimal estimation theory and compute its estimates using extended optimal adaptive algorithms [11, 12]. Although the analysis is carried out for cyclic ADC, the presented analytical tools and qualitative results of investigation can be applied to the analysis and design of other classes of CADC, PADC and, in part, of the fl ash ADC.
2. MATHEMATICAL TOOLS FOR ANALYSIS OF CYCLIC CONVERTERS
The approach and mathematical tools presented in [6-10] can be applied to the analysis of both conventional and intelligent cyclic ADC (IC ADC). The term “intelligent CADC” refl ects their particularity of functioning: both forming of the output codes and adaptation of the analogue part are performed on the basis of permanently corrected model of the input excitation and predictions of its evolution [13]. To explain the principles of intelligent conversion and the sources of its advantages over known methods of cyclic conversion, below we compare the architectures of IC ADC and CADC (see Figs. 1, 2), methods of forming the input signal codes and mathematical models of both classes of the converters. As a specimen of CADC, the known sub-ranging converter ADI-1678 [13] is considered. The architecture and functioning of IC ADC are considered on the level of generalization adopted in [6-10].
Fig. 1. General structure of CADC.
Comparison of the converters shows that their analogue parts have identical architecture and differ only in the gains of amplifi ers (A). Digital parts of the converters differ both in construction and method of fi nal codes forming.
Particularities of the cyclic a/d converters enob defi nition and measurement

12
Fig. 2. General structure of intelligent CADC.
2.1. Main mathematical models
To enable a formal description of the conversion process, mathematical models of the input signals, analogue and digital parts of the converters should be given. We assume that the input signals Vt = V(t) are zero mean Gaussian random processes with the power not greater than the given value 2
0 and spectral power density equal to zero outside the frequency
band [-F, F]. The sample-and-hold block (S&H in Figs. 1, 2) holds the value of the sample V(m) = V(m/2F), m = 1, 2, …, M, at the fi rst input of subtracting block Σ during the interval
1/ 2T F= . Each sample V(m) = V(m/2F) of the input signal is converted in the same way, in n = F0/2F cycles, independently of the results of conversion of the previous sample (F0 is the pass-band of the analogue part of the converter). This permits to reduce the analysis of CADC work to consideration of the conversion of a single sample V(m) = V which, in turn, permits to reduce the model of the input signal to the form of a sequence of adjacent rectangular pulses with normally distributed amplitudes, suffi cient for initial research.
In each cycle, the intermediate code ˆkV of the sample V is formed using previous code
and digital “observation” – code formed by the NADC – bit coarse pre-converter ADCIn at the output of the analogue part (NADC = 1 ÷ 6bits, depending on the type of CADC). This process can be described by the recursive equation common for all CADC:
(1)
which can be treated as a mathematical (input-output) model of the processes in the digital part of the CADC. Values of the gains kL in (1) depend on the type of CADC. Mathematical model of the analogue part describing transformation of the input sample V into observations can be introduced in the form of a piece-wise linear static transition function [6-12] applicable for the analysis of each CADC:
ANATOLIY A. PLATONOV, ŁUKASZ M. MAŁKIEWICZ
ky1
ˆkV
1
ˆ ˆk k k kV V L y ; ( = 1,...,k n ),
ky

13
(2)
where are the residual signals formed by the subtracting block Σ and routed to the input of amplifi er A. Value represents here the analogue equivalent of one-step prediction of the sample value: formed by the digital part of CADC in the previous cycle. Noise is the sum of the noise of the feedback chain, S&H block, subtractor Σ and possible external noise. In the present work, noise is considered as zero-mean white Gaussian noise with the variance . Parameter D determines the boundaries [-D, D] of the full scale range (FSR) of pre-converter ADCIn. Noise is the quantization noise at the ADCIn output describing the distortions caused by the step-wise form of the transition function. According to the commonly used approach, this noise is assumed to be uniformly distributed inside of the quantization interval [−∆ADC/2; ∆ADC/2] = ), and its variance is determined by formula:
. . (3)
2.2. Constraints on the parameters of conventional CADCs
Fig. 3. Codes forming in conventional CADC [14].
Depending on the type of CADC, digital gains Lk in (1) and analog gains kC in (2) may have fi xed or subsequently switched values connected by the reversed dependence: .In conventional CADCs, decimal values of the gains Lk are determined by parameters of the shifting elements in the digital part. In each cycle, before being added to the previous code ,
Particularities of the cyclic a/d converters enob defi nition and measurement
ke = 1
ˆk kV V v
1
ˆkV
1
1 1 1( )
k
k ,k kˆ ˆV E V | y V
kv
kv2
0
k
1 1[ / 2 , / 2 ]ADC ADCN N- D D
2=
ADC
2
12=
D2
32
2NADC
1
k kC L
1
ˆkV
14
observations should be shifted up by positions (see Eq. (1) and Fig. 3). Values mk represent here the number of least signifi cant bits (LSB) reserved for the correction of possible errors in the intermediate codes usually realized as overlapping of mk bits of codes and [14]. For this reason, in conventional CADC, the decimal form of the gains
kL and analogue gains
kC always has the form of integer powers of two:
. (4) Initial values
1C and
1L are determined by the ratio of FSR of pre-converter
InADC to
FSR of CADC, and also must be equal to the integer powers of two. Final resolution of CADC after n cycles is equal to .
2.3. Principles of intelligent A/D conversion
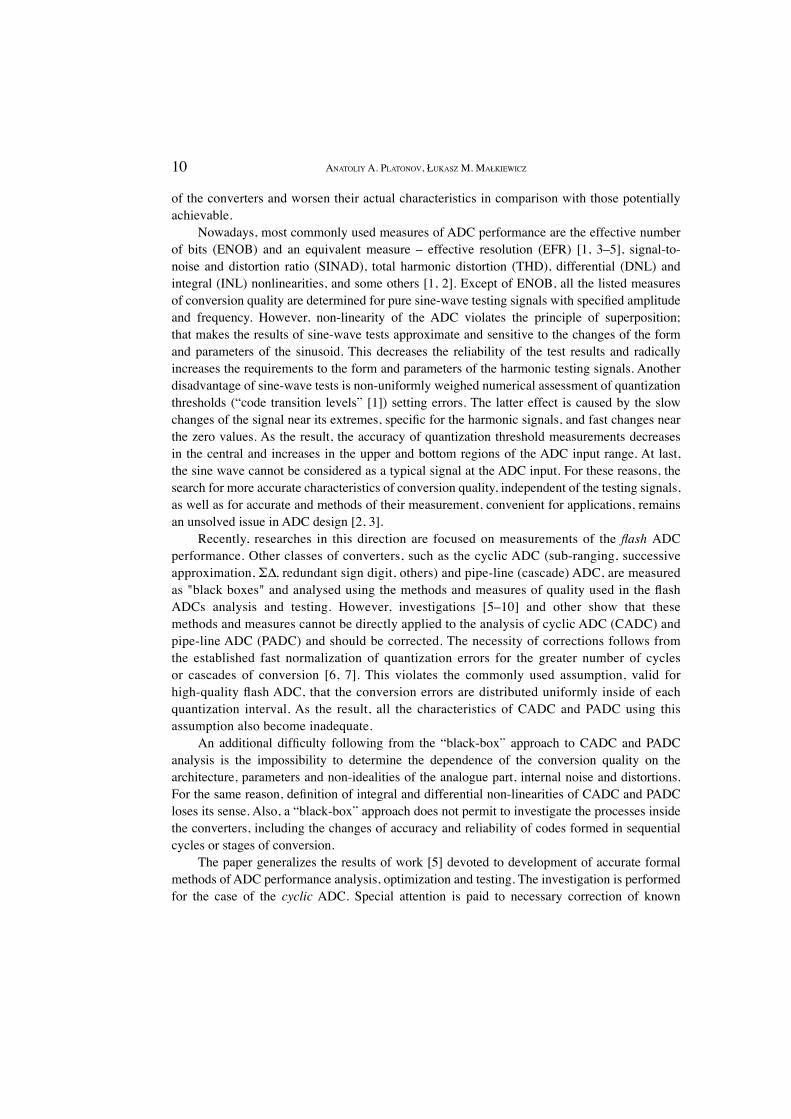
Intelligent and conventional CADC have identical analogue parts and differ in the principle of code forming and in realization of the digital part (see Figs 1, 2). Unlike CADC, in IC ADC each intermediate code ˆ
kV , (k = 1, …, n) is actually computed, according to the same recursion (1) in the form of
compN -bit binary word, (Ncomp = 16, 24 or 32 bits depending on required fi nal resolution of IC ADC). The digital multiplier M placed at the input of digital part of IC ADC computes, in each cycle, the Ncomp -bit binary product of Ncomp -bit gain
kL and NADC -bit observation . The computed code is added in the adder (Ad) to the estimate computed in the previous cycle. New Ncomp -bit estimate is routed from the adder to one-cycle storing unit z-1 and to the input of feedback D/A converter DACIn. The analog equivalent ˆkV of this estimate is routed to the second input of the subtracting block and a new cycle of
conversion begins.This process is illustrated in Fig. 4 where changes of “true” non-erroneous bits (denoted by
zeros) in the codes ˆkV , k = 1, 2, … are presented.
Fig. 4. Codes forming in intelligent CADC.
ANATOLIY A. PLATONOV, ŁUKASZ M. MAŁKIEWICZ
1
ˆkV
ky1
1( )
k
k i ADC iN N m
1
ˆkV k kL y
1
1 ( ) 1
12
ki ADC iN m
k kC C L
1( )
n
fin i ADC iN N m
k kL y
ky k kL y1
ˆkV
1
ˆ ˆk k k kV V L y
15
Transition to the long-word arithmetics in IC ADC removes constraint (4) on the values of gains , k kL C and permits to set the analogue gains
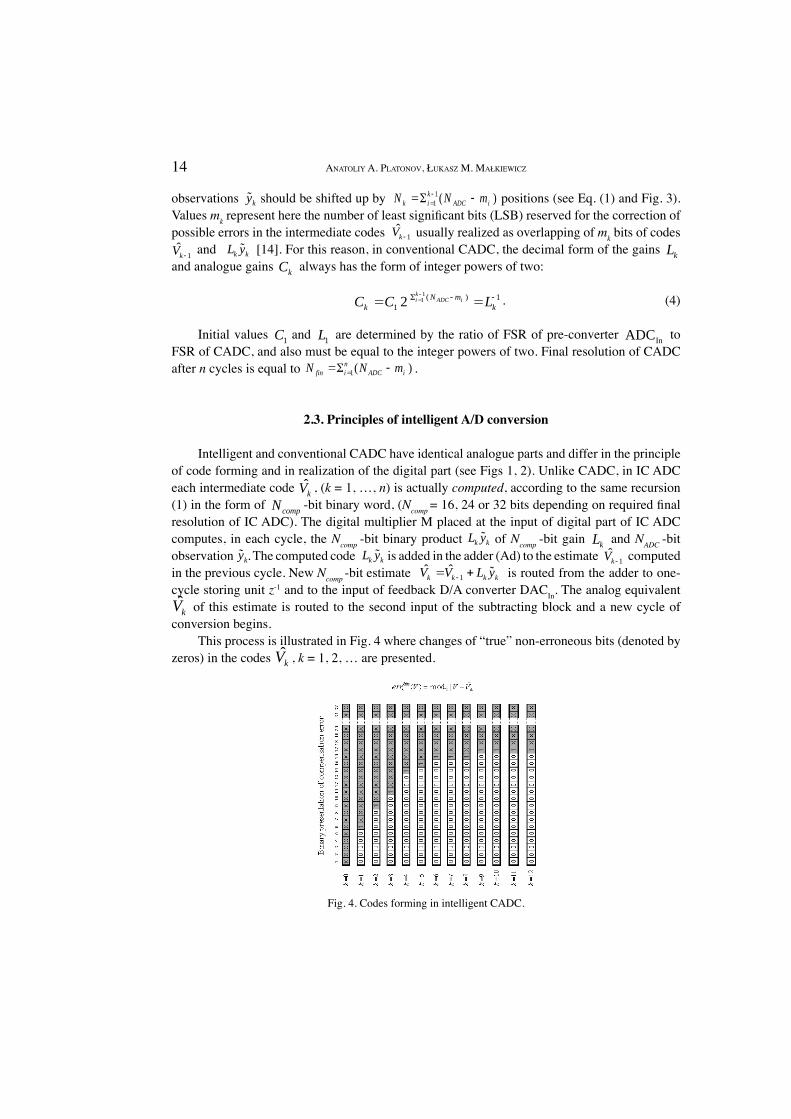
kC to the values somewhat greater than in conventional CADC. This increases the signal-to-noise ratio (SNR) at the output of pre-converter ADCIn and improves the quality of estimates. However, gains Ck can be increased only till a defi nite value, above which the probability of CADC overloading exceeds the given permissible value μ. Optimal values Ck and Lk which minimize MSE of conversion under given μ are determined, for each cycle, by the following formulas [6-10, 12] (values Lk are presented in decimal form):
(5)
and
(6)
where:
(7)
is the maximal value of SNR at the ADCIn output. Value is the power of the useful component of the signal ; and is the power of quantization noise of pre-converter
InADC . The saturation factor α in (5) – (7) is connected with the permissible
probability of overloading μ by the relationship:
(8)
where: Φ(α) – is the Gaussian error function. Probability μ determines the probability γ = 1 - (1-μ)n ≈ nμ of appearance of distorted codes at the IC ADC output, which coincides with the word error rate (WER) introduced in IEEE Standard 1241-2000 ([1], p. 4.13) as an independent characteristic of the conversion performance. Initial values for recursions (1), (6) are determined by the mean value
0
ˆ 0V = and permissible power of the input signal, respectively.
One should notice that gains (5) are strictly optimal only if distributions of random values and noise in models (1), (2) are Gaussian [11, 12]. The step-wise form of the ADCIn transition function makes distribution of quantization noise non-Gaussian. For this reason, values (5) are only close to the optimal ones (sub-optimal) and can be corrected in the way improving the fi nal resolution of IC ADC [8-10].
Particularities of the cyclic a/d converters enob defi nition and measurement
2ˆ[( ) ]k kP E V V
2
1
, k
k
DC
P
1
1
1k
k k
k
PL C
P
12
1
12 2 21
k kk k
k
C PP P
C=
2 2
2 -1
12
1
(1 ) 1 k
k
QQ P
P,
22 2
2
2
( ) signalac k kk
noise
WC E e DQ SNR
W
2 2 2( ) ( / )signal k kW C E e D
kynoiseW
( )
2
0
1exp
22
xdx =
1
2
μ,
k
2

16
3. DISCRETE SCALE OF CODES AND ENOB
In works [6, 7] it was established that independently of the form and distribution of the input signal, distribution of fi nal code errors in IC ADC quickly normalizes. In Figure 5, changes of histograms of conversion errors in sequential cycles are shown. Plots in Figs. 5a, b are obtained in simulation experiments as the result of conversion of M = 10 000 samples of a sinusoidal input signal, plots in Fig. 5c correspond to a random, uniformly distributed input signal. The results show that beginning with the “threshold” number of cycles n*, all histograms take the Gaussian form.
a) b) c)
Fig. 5. Evolutions of histograms of conversion errors versus number of cycles under different classes of the input signals: a) FSR/2 sine wave; b) (FSR-LSB)/2 sine wave; c) random uniformly distributed signal.
The threshold number of cycles corresponds to the instant of time when rms of conversion errors
(rms noise in terms of [1]) reaches the value σv of rms of the analogue noise at
the amplifi er (A) input: . One can show that the threshold value n* determines the optimal number of conversion cycles and can be assessed according to the formula [6-10, 12]:
. (9)
The distribution of conversion errors for k ≥ n* takes the form:
. (10)
Using (10), one can easily show that values of the signal V , which produce the code word ˆkV , lie in the interval with a probability not smaller than
1 - μ.
ANATOLIY A. PLATONOV, ŁUKASZ M. MAŁKIEWICZ
k kP
k kP
1 2
2
1
ˆ[ ]ˆ( | ) ( | ) (2 ) exp
2
k kk k
k
V Vp V y p V V P
P
17
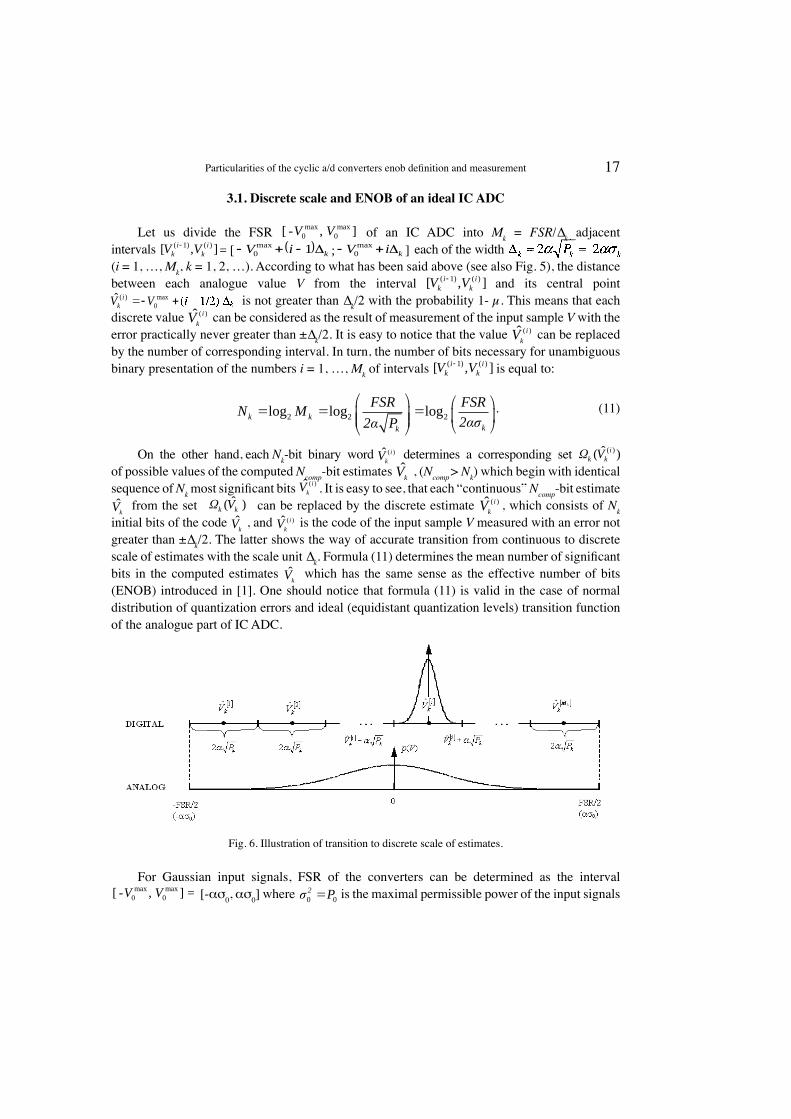
3.1. Discrete scale and ENOB of an ideal IC ADC
Let us divide the FSR max max
0 0[ - , ]V V of an IC ADC into Mk = FSR/∆k adjacent
intervals each of the width (i = 1, …, Mk, k = 1, 2, …). According to what has been said above (see also Fig. 5), the distance between each analogue value V from the interval and its central point is not greater than ∆k/2 with the probability 1- μ. This means that each discrete value ( )ˆ i
kV can be considered as the result of measurement of the input sample V with the
error practically never greater than ±∆k/2. It is easy to notice that the value ( )ˆ i
kV can be replaced
by the number of corresponding interval. In turn, the number of bits necessary for unambiguous binary presentation of the numbers i = 1, …, Mk of intervals is equal to:
. (11)
On the other hand, each Nk-bit binary word ( )ˆ i
kV determines a corresponding set
of possible values of the computed Ncomp-bit estimates ˆk
V , (Ncomp > Nk) which begin with identical sequence of Nk most signifi cant bits ( )ˆ i
kV . It is easy to see, that each “continuous” Ncomp-bit estimate
ˆk
V from the set can be replaced by the discrete estimate ( )ˆ i
kV , which consists of Nk
initial bits of the code ˆk
V , and ( )ˆ i
kV is the code of the input sample V measured with an error not
greater than ±∆k/2. The latter shows the way of accurate transition from continuous to discrete scale of estimates with the scale unit ∆k. Formula (11) determines the mean number of signifi cant bits in the computed estimates ˆ
kV which has the same sense as the effective number of bits
(ENOB) introduced in [1]. One should notice that formula (11) is valid in the case of normal distribution of quantization errors and ideal (equidistant quantization levels) transition function of the analogue part of IC ADC.
Fig. 6. Illustration of transition to discrete scale of estimates.
For Gaussian input signals, FSR of the converters can be determined as the interval max max
0 0[ - , ] =V V [-ασ0, ασ0] where is the maximal permissible power of the input signals
Particularities of the cyclic a/d converters enob defi nition and measurement
( 1) ( )[ , ]
i i
k kV V = [ kiV 1max
0 ; kiV max
0 ]
( 1) ( )[ , ]
i i
k kV V( ) max
0
ˆ i
kV V
( 1) ( )[ , ]
i i
k kV V
2 2 2log log logk k
kk
FSR FSRN M
22 P
( )ˆ( )i
k kV
ˆ( )k kV
0 0
2 P
18
(choice α = 3 refers to "three sigma" FSR. Nowadays, values α = 4 and 5 are usually taken. For the threshold mode of conversion (conversion of each sample is fi nished after a threshold number of cycles n = n* and
), taking into account FSR = 2ασ0, formula (11) for
ENOB of an ideal IC ADC can be rewritten in the form:
. (12)
Left terms of this formula are accurate for n ≥ n* cycles of conversion. For n < n*, this term can be used for approximate evaluation of ENOB of an ideal IC ADC [5-10].
It is necessary to remember that formula (11) is valid only if overloading of the converter is excluded with a probability not less than 1- μ. For conventional, non-optimal CADC this probability, as well as the word error rate (WER), is not a characteristic of special importance and, apart from the case high-precision converters, can be omitted. However, in each sub-optimal ADC where close to full utilization of resources of the analogue and digital elements is achieved, ENOB and WER are mutually connected and WER becomes a not less important characteristic of conversion quality. In practical applications, WER can be replaced by the equivalent characteristic – bit error rate (BER) widely used in digital communications [15].
3.2. Relation between standard and introduced ENOB defi nitions
The defi nition of ENOB given in IEEE Standard 1241-2000 ([1], p. 4.5.2) for fl ash ADC has the form
, (13)
where N is the ENOB (resolution) of the ideal ADC, rms noise = is measured for actual converters with non-ideal transition function using formula ([1], Sect. 4.5.1.1):
(14)
and σ = ∆2/12 is the ideal rms quantization error computed according to formula (3) where D and NADC should be replaced by the values FSR/2 and N, respectively. If DNL, INL, offsets, gain setting errors and other non-idealities of the analogue part are negligibly small, rms noise , and formula (13) becomes an identity E = N. Contrary to [1], where the value N is assumed to be given, for IC ADC this value is assessed according to (11).
Comparison of formulas (11) – (13) shows that defi nition of ENOB of IC ADC introduced in Sect. A generalizes the defi nition of the ideal ENOB N given in [1]. Assuming that rms noise of actual IC ADC is measured in the same way as rms noise of the fl ash ADC, that is according to (13), one may rewrite (11) in the equivalent form:
ANATOLIY A. PLATONOV, ŁUKASZ M. MAŁKIEWICZ
n nP
*
2
* 0 0 0
2 2 2
1log log log
2n
nn
N NPP
2 2
ˆlog = log
12
FSRENOB N
rms noise
ˆ
ˆ 2 / 12NFSR

19
. (15)
Values
, (16)
in this formula represent the ENOB of actual IC ADC in full concordance with the defi nition given in [1] (see Eq. (13)). The single but principal difference concerns the defi nition of ENOB Nk of an ideal IC ADC where should be replaced by the assessment , due to fast normalization of quantisation errors. Additional researches show that a similar correction is to be introduced also in defi nitions of ENOB of other classes of CADC and pipe-line ADC, which is to be measured according to (16), not (13).
In practice, the width of an ideal quantization interval can be assessed using simulations and measurement of the width of histograms of output quantization noise. For the greater numbers of cycles and Gaussian quantisation errors, ∆k can be assessed using (14) and formula Δk = 2ασk. To assess the fi nal ENOB of ideal IC ADC at the threshold point n = n*, it is enough to assess Δn using histograms of the noise νk (or signal ek) at the input of amplifi er (A).
It is worth noting that in the threshold mode (n = n*) of conversion, substitution of (12) into (9) and application of (7) and formula n* = F0/2F (see Sect. 2.1.) permit to obtain the relationship:
. (17)
Formula (17) is the analog of Shannon’s formula [15] for channel capacity and determines the maximal information fl ow R through the converter, achievable under probability of appearance of rough errors (IC ADC overloading) not greater than a given small μ [9, 10, 12].
4. DIRECT MEASUREMENT OF ENOB
Computing the estimates ˆkV in the form of long binary words permits to directly measure
the number of signifi cant bits (denoted further as kNOB , k = 1, …, n) that is the number of
“true” bits before the fi rst erroneous bit (FEB) in the code ˆkV . It is easy to see that NOBk is equal
to the number of zeros: (0)( )kn V before the fi rst unity (FEB) in the binary presentation of the
conversion error . To determine this number, it is suffi cient to register the number of position (1)
( )kn V where the fi rst unity in the binary word bit
kerr appears (in Fig. 4, FEB is denoted by unity). Values measured in this way depend on the current values of the input signal, therefore correct analysis of the conversion quality requires the application of statistical tools and assessment of distribution of NOBk or FEB values. The
Particularities of the cyclic a/d converters enob defi nition and measurement
0
2 2 2
ˆ ˆˆlog log log
ˆ
k kk k
k k k
N N
0
2 2 2
ˆˆ log log log
ˆ ˆ
kk k
k k k
FSRN N
2
k= k 12 k=2 Pk
k=2 Pk
2
ˆmod | |bit
k kerr V V
(0) (1)( ) ( ) ( ) 1k k kNOB V n V n V

20
latter can be done using modelling technique [16] and histograms of NOBk [5-7], which can be obtained in simulation experiments.
a) b) c)
Fig. 7. Evolution of histograms of FEB positions (distinguished by white color) versus number of cycles: a) top-view; b) top view from the level of 50 hits; c) all the nonzero hits. White continuous line corresponds to ENOB
measured indirectly.
A typical plot of changes of the histogram of FEB appearance in different positions of the output codes ˆ
kV depending on the number of cycles is presented in Fig. 7a. The brighter white color refers here to the higher frequencies of FEB appearance. In Figure 7b, the top-view of this histogram a from the level of 50 counts is shown, and in Fig. 7c all the non-zero FEB – counts in corresponding positions are shown. The plots permit to see a large amount of rarely appearing FEBs (Fig. 7c), and all FEBs that ever appeared in experiment (M = 10 000 samples). Continuous white lines in Fig. 7 a-c show the changes of ENOB computed using the basic defi nition (16) where rms noise was computed, for each k = 1, …, 50, according to formula (14).
Analysis of histograms shows that the distribution of FEB has a sharp low boundary (see Figs 7c-d), which can be used as an assessment of the actual values of ENOB in sequential cycles of conversion. Preliminary investigations show that conventional indirect method of ENOB (16) measurement using rms (14) determines the low boundary of estimates of ENOB obtained in direct measurements. We must say that values of ENOB measured directly do not depend on any assumptions about dependencies of ENOB on ideal and real rms noise, as it is in indirect measurements, and give an objective information about the real resolution of the converters. The complex form of FEB (NOBk) histograms shows the necessity of their careful statistical analysis and elaboration of measures and methods of IC ADC performance analysis and measurement most adequate and convenient for applications. This concerns also other classes of ADCs – it was established [6, 7] that FEB-histograms of each ADC have a complex asymmetric form, and heuristic defi nitions of ADC resolution and different methods of their measurement lead to different results.
5. CONCLUSIONS
The results of work show that most convenient for application and adequate characteristic of conversion quality is the effective number of bits (ENOB). It is shown that a perspective
ANATOLIY A. PLATONOV, ŁUKASZ M. MAŁKIEWICZ
ˆk
21
way of improvement of the effi ciency of cyclic ADC is the transition from low-bit logic to long binary word arithmetic in the code forming algorithm. This removes the limitations existing in conventional CADC and enables their optimization including the application of optimal data-processing algorithms and transition to a discrete scale of estimates [5-10, 12].
The transition considered in Sect. 3 from continuous to discrete scale of estimates (codes) permits to introduce, in a natural way, an analytical Eq. (12) for the ENOB, which can be directly connected with parameters of analogue elements and the code forming algorithm, parameters setting errors, non-linearities, statistic characteristics of the input signals and noise [5-10, 12]. There is shown the conceptual equivalence of the basic defi nition of ENOB so determined and given in [1]. However, for cyclic ADC this measure should be corrected, taking into account fast normalization of the conversion errors for the greater number of cycles (see formulas (12), (14), (16)).
The direct method of ENOB measurement discussed in Sect. 4, based on FEB-histograms permits not only to unify and make the assessments of CADC resolution more adequate and accurate, but also to elaborate more adequate and convenient testing methods for other classes of ADC. The complex structure of FEB-histograms shows the necessity to solve this task using advanced tools of statistical analysis and estimation theory.
REFERENCES
1. IEEE Standard 1241-2000 for Terminology and Test Methods for Analog-to-Digital Converters, IEEE Inc, Jan. 2001.
2. Serra A. C.: “New trends in analog to digital converters technique”, Proc. of 4th Int. Conf. on Advanced A/D and D/A Conversion Techniques and Their Applications & 7th European Workshop on ADC Modelling and Testing (ADDA&EWADC 2002), Prague, Czech Republic, June 2002, pp. 7–11.
3. Blair J., Linnenbrink T.: “Corrected RMS error and effective number of bits for sinewave ADC tests”, Proc. of 4th Int. Conf. ADDA&EWAD’ 2002, Prague, June 2002, pp. 263–267.
4. Hejn K., Pacut A.: “Effective resolution of analog to digital converters”, IEEE Instrum. and Measurement Magazine, vol. 6, no. 3, 2003, pp.48–55.
5. Platonov A. A., Małkiewicz Ł.: “Particularities of the Cyclic A/D Converters ENOB Defi nition and Measurement”, Proc. of 2006 IEEE Instrumentation and Measurement Technology Conference (IMTC 2006), Sorrento, Italy, April 2006 (CD-ROM).
6. Platonov A. A., Małkiewicz Ł.: “Analytical and empirical ENOB in evaluation and analysis of cyclic A/D converters performance”, Proc. of 5th Int. Conf. on Advanced A/D and D/A Conversion Techniques and Their Applications (ADDA’ 2005), Limerick, Ireland, June 2005, pp. 325–330.
7. Platonov A. A., Małkiewicz Ł.: “Direct and indirect methods of ENOB evaluation and analysis”, Proc. of 14th Int. Symposium on Measurements for Research and Industry Applications and 10th Workshop on ADC Modelling and Testing, Gdynia – Jurata, Poland, Sept. 2005, pp. 595–600.
8. Platonov A. A., Małkiewicz Ł.: “Analytic design of cyclic low energy ADC with sub-optimal estimates calculation”, IMEKO XVII World Congress, Dubrovnik, Croatia, June 2003, pp. 141–146.
9. Platonov A. A., Małkiewicz Ł., Jędrzejewski K.: “Adaptive CADC optimisation, modelling and testing”, Proc. of 13 Int. Symp. IMEKO on Measurements for Researches and Industry Applications and 9th Workshop on ADC Modelling and Testing, vol. 2, Athens, Greece, 29 Sept. – 1 Oct. 2004, pp. 817–821.
10. Platonov A. A., Jędrzejewski K., Małkiewicz Ł., Jasnos J.: “Principles of optimisation, modelling and testing of intelligent cyclic A/D converters”, Measurement, vol. 39, no. 3, 2006, pp. 213–231.
11. Platonov A. A.: Analytical methods of analog-digital adaptive estimation systems design, Publ. House of Warsaw University of Technology, series “Electronics”, v. 154, Warsaw, 2006 (in Polish).
Particularities of the cyclic a/d converters enob defi nition and measurement

22
12. Platonov A. A.: “Optimal identifi cation of regression-type processes under adaptively controlled observations”, IEEE Trans. on Signal Proc., vol. 42, no. 9, Sept. 1994, pp. 2280–2291.
13. Platonov A. A.: „Intelligent ADC. Principles of functioning, optimisation and analysis”, Metrology MS, vol. 13, no. 4, 2006, pp. 335–355.
14. Goodenough F.: “Next-generation 12-, 14-bit IC ADCs sample signals”, Electronic Design, vol. 37, no. 4, Penton Publishing, Cleveland, OH, US, 1989, pp. 121–123.
15. Haykin S.: Communication Systems, New York: J. Wiley & Sons, 2001. 16. Arpaia P., Daponte P., Rapuano S.: “A state of the art on ADC modeling”, Proc. of 4th Int. Conf. ADDA&EWAD’
2002, Prague, Czech Republic, June 2002, pp. 151–155.
ANATOLIY A. PLATONOV, ŁUKASZ M. MAŁKIEWICZ