Embed Size (px)
Citation preview

ANALYZING TERRASAR-X AND COSMO-SKYMED HIGH-RESOLUTION SAR DATA
OF URBAN AREAS
Mingsheng Liao*, Timo Balz, Lu Zhang, Yuanyuan Pei, Houjun Jiang
State Key Laboratory of Information Engineering in Surveying, Mapping and Remote Sensing,
Wuhan University, 129 Luoyu Road, Wuhan, China
KEY WORDS: SAR, high-resolution, urban area, InSAR, Persistent Scatterer Interferometry
ABSTRACT:
The new high-resolution synthetic aperture radar (SAR) satellite systems offer new possibilities for urban remote sensing. COSMO-
SkyMed and TerraSAR-X operate in X-band and both can deliver data with a spatial resolution of up to one meter. High-resolution
SAR data is particularly useful for post-disaster damage assessment and monitoring, because SAR systems operate (almost) weather
independent. Interferometric SAR (InSAR) can be used to generate precise 3D models of urban areas, and using Persistent Scatterer
Interferometry (PS-InSAR) urban subsidence can be measured precisely.
* Corresponding author.
1. INTRODUCTION
Comparable to the tremendous improvements in the remote
sensing sciences caused by the successful launch of IKONOS in
1999, the radar remote sensing sciences will benefit from the
new commercial high-resolution spaceborne synthetic aperture
radar (SAR) satellite systems. COSMO-SkyMed (De Luca et al.
2007), Radarsat-2 (Thompson et al. 2008), and TerraSAR-X
(Eineder et al. 2005) provide spaceborne SAR data in spatial
resolutions not available before. With resolutions of up to one
meter, the data can be used for urban remote sensing.
SAR has several disadvantages in urban areas, which are related
to the wavelength and oblique viewing geometry of SAR sys-
tems. In section 2, we describe the problems of SAR remote
sensing in urban areas.
But, SAR also has some unique advantages. One advantage is
the ability to acquire data under almost all weather conditions,
at day and night. SAR systems are active systems, i.e. they
transmit and receive their own energy. Therefore, they are in-
dependent of the sun. The transmitted microwaves can penetrate
clouds; hence, SAR systems can acquire data even during bad
weather conditions. Extreme weather conditions, like for exam-
ple very heavy rainfall, can influence and even hinder the data
acquisition though. This happens rather seldom though.
This unique advantage of SAR systems is extremely important
in time-critical applications. After the Wenchuan Earthquake
(Parsons et al. 2008) on May 12, 2008, heavy rainfall hindered
the use of optical remote sensing systems in the affected area.
SAR was for some regions the only available spaceborne data
source in the days following the earthquake. SAR is widely
used for post-seismic damage assessment (Shinozuka et al.
2000; Yonezawa and Takeuchi 2001; Matsuoka and Yamazaki
2005; Stramondo et al. 2006; Gamba et al. 2007; Chini et al.
2008). Typically pre-disaster data is compared with post-
disaster data, but this was not possible after the Wenchuan
Earthquake, because almost no pre-disaster high-resolution
SAR data was available. Nevertheless, TerraSAR-X and
COSMO-SkyMed delivered important data for the disaster
management (Balz et al. 2008). High-resolution SAR was, for
example, widely used to monitor (Shao et al. 2008) the so-
called quake lakes (Stone 2008). High-resolution SAR can also
be used for damage assessment in urban areas (Balz and Liao
2009), which will be demonstrated in section 3.
The weather independence is not the only advantage of SAR
systems. SAR systems can precisely measure distances. Using
two receiving antennas and a technique called interferometric
SAR (InSAR) digital elevation models (DEM) can be generated.
Instead of using two antennas at the same time, which is called
single-pass InSAR, the same sensor can acquire data twice at
different times, which is called multi-pass InSAR. This tech-
nique is used by today’s satellites. In this way, they are able to
acquire precise height models, which will be shown in section 4.
Using interferometric SAR data acquired over a long time, per-
sistent scatterers (PS) can be determinated and observed. This
allows for even more precise measurements of height differ-
ences. This technique is called Persistent Scatterer Interferome-
try (PS-InSAR) (Ferretti et al. 2000, 2001) and can be used for
subsidence measurement (Hilley et al. 2004). Typically, this
requires a huge amount of data. Using small stack PS-InSAR,
subsidence can be measured with less data. This is described in
section 5. Finally, conclusions will be drawn.
2. HIGH-RESOLUTION SAR DATA OF URBAN AREAS
SAR systems acquire images from an oblique viewing geometry.
The geometry differs in azimuth direction, which is the heading
direction of the sensor platform, and range direction, which is
the direction of the radar signal and is normally perpendicular
to azimuth.
In azimuth, the geometry depends on the Doppler Effect. For
non-moving objects, a SAR system can reach very high resolu-
tions in azimuth. In range direction the position of an object is
determined by the runtime of the signal, which directly corre-
lates to the length of the signal path. This leads to several typi-
cal SAR effects, which only occur in range direction.
The first effect, the so-called layover, is visible in Figure 1.
Figure 1 shows the Mingsheng Bank building in Wuhan, China.
The building is 331.3 m height and is the tallest building in
Wuhan. It was the 18th tallest building in the world when it was
finished in 2007. The image was acquired as part of the Wuhan
University TerraSAR-X test site, a joint project between the
Wuhan University, Beijing Spot Image and Infoterra, to pro-
mote the use of high-resolution SAR images.
The image in Figure 1 was taken from an ascending orbit and
was illuminated from the left side. The building can clearly be
recognized. Strong reflections occur on the edge of the building
and at the rooftop. The corner-reflection at the foot point is
clearly identifiable. The top of the building can be seen far on
the left side of Figure 1, whereas the bottom is in the center of
Figure 1. This is the so-called layover. Because the top of the
building is closer to the sensor and because the position of an
object in range depends on signal’s time of flight, the building’s
roof is mapped closer to the sensor than the bottom.
roof
corner-reflection
Figure 1. TerraSAR-X spotlight image from October 31,
2008, acquired in VV polarization from an ascending orbit.
Another effect caused by the oblique viewing geometry is the
radar shadow. The dark area in the center of the image is no
shadow though, it is a small lake. Calm water acts like a mirror
in X-band SAR images, therefore the energy transmitted by the
SAR sensor is forward scattered by the lake and is not backscat-
tered to the sensor; hence, lakes appear dark in SAR images.
Figure 2 shows the same area as Figure 1, but the image was
acquired from a descending orbit. The image is therefore illumi-
nated from the right side.
The double-bounce at the descending image (Figure 2) is very
strong and the side-lobes of this extreme reflection can be seen
throughout the whole scene. Double-bouncing occurs when mi-
crowaves are forward scattered by a smooth surface, for exam-
ple a lake, hit another surface, for example a building, and are
scattered back to the sensor.
The radar cross section (RCS) for the double bounce scattering
from a building can be approximated using the physical optics
approximation (Dong et al. 1997):
2 2 2 2 8 01 22
0
16 sin( sin sin )sin cos
sin sindb p p i
k LR R A
k L
where 1pR and
2pR are the Fresnel Reflection Coefficient of
the wall and the ground respectively. i is the incidence angle,
0k is the wave number, L is the length of the flat rectangular
plate (see Dong et al. 1997), A is the area of the wall, and is
the aspect angle. The aspect angle is the orientation of the
building relating to the looking direction of the sensor with
0o if the wall is perpendicular to the looking direction.
roofcorner-reflection
Figure 2. TerraSAR-X spotlight image from October 18,
2008, acquired in VV polarization from a descending orbit.
The extreme double-bounce reflection of the Mingsheng Bank
building is therefore related to the extreme height of the
building, because db shows a quadratic dependence with the
wall area, and due to the very small aspect angle . Addition-
ally, the small lake in front of the building strongly reflects the
incoming energy from the radar with a high Fresnel Reflection
Coefficient, amplifying the extreme backscattering. Due to the
lake in near-range, even triple-bounce reflections can be ob-
served. Triple-bouncing is not very common in SAR images of
urban areas. But, triple-bouncing frequently occurs at bridges
over water (Lee et al. 2006).
3. HIGH-RESOLUTION SAR FOR POST-DISASTER
DAMAGE ASSESSMENT IN URBAN AREAS
The new high-resolution SAR satellite systems have been used
for damage assessment and post-disaster risk monitoring after
the Wenchuan Earthquake from May 12, 2008. High-resolution
SAR is a reliable data source, because of its all-weather imaging
capabilities. In disaster management, this is a crucial point. But,
SAR data is difficult to interpret. Because of the oblique
viewing geometry of SAR, ambiguities and occlusions hinder
the SAR image interpretation, especially in urban and moun-
tainous areas.
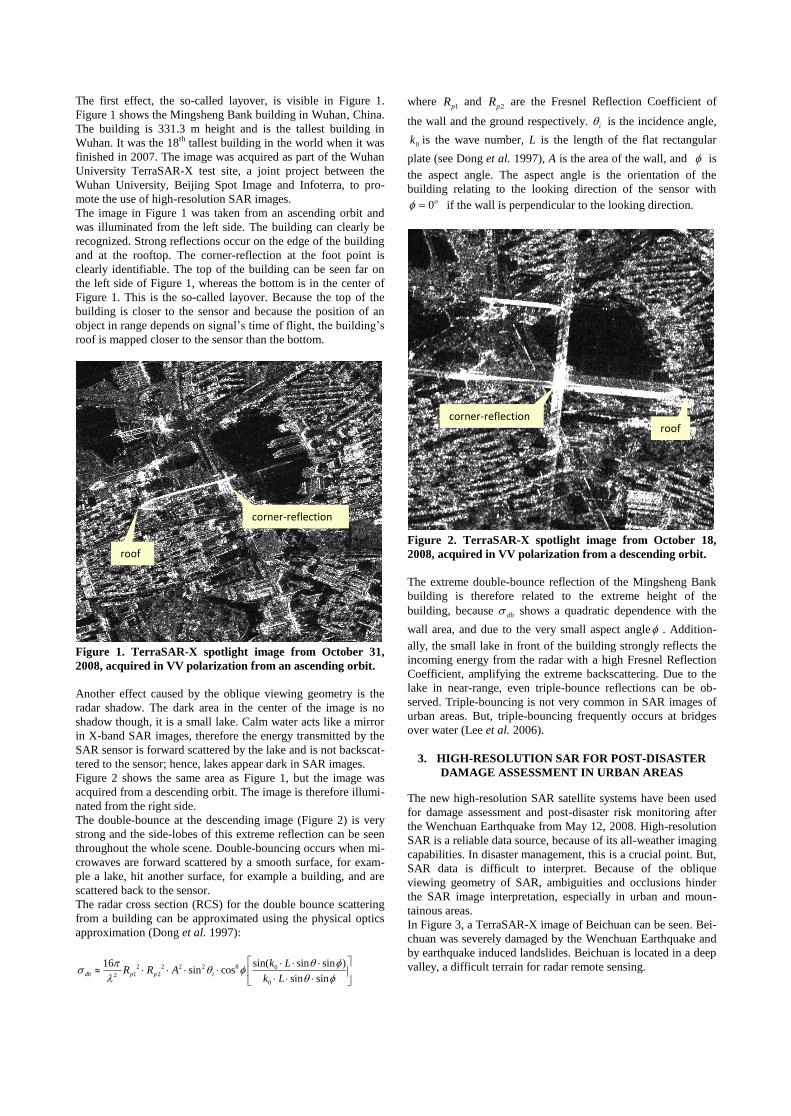
In Figure 3, a TerraSAR-X image of Beichuan can be seen. Bei-
chuan was severely damaged by the Wenchuan Earthquake and
by earthquake induced landslides. Beichuan is located in a deep
valley, a difficult terrain for radar remote sensing.

The SAR image shown in Figure 3 was taken from a descending
orbit; hence, the sensor was looking from the right side. The
landslides on the western sides of the mountains, like for exam-
ple the so-called New-Middle-School Landslide, can be identi-
fied in this SAR image.
New-MiddleSchool Landslide
Figure 3. TerraSAR-X stripmap image of Beichuan acquired
from a descending orbit on May 15, 2008.
But, due to fore-shortening and layover, the landslides on the
eastern sides cannot be identified. For this purpose, a second
SAR image, taken from an ascending orbit, is needed. Figure 4
shows a TerraSAR-X image of Beichuan acquired from an
ascending orbit, two days after the image shown in Figure 3 was
taken. In Figure 4, the landslides on the western sides are not
identifiable.
WangjiayanLandslide
Figure 4. TerraSAR-X stripmap image of Beichuan acquired
from an ascending orbit on May 17, 2008.
Ascending-descending image pairs are therefore recommended
for SAR image interpretation in urban and mountainous areas.
But using ascending-descending image pairs reduces the tem-
poral resolution. To improve the temporal resolution, different
sensor systems should be used together. Useful combinations do
not only include ascending-descending image pairs, but also
combinations of imaging modes with different resolutions. The
COSMO-SkyMed image from Beichuan shown in Figure 5 was
acquired in spotlight mode. The image has a spatial resolution
of one meter. The stripmap images shown in Figure 3 and
Figure 4 have a spatial resolution of three meters.
collapsed bridge
damaged bridge
Figure 5. COSMO-SkyMed spotlight image acquired from
an ascending orbit on May 14, 2008.
Figure 5 shows two bridges in Beichuan, which are marked with
an ellipse in Figure 3 and Figure 4. The status of the bridges
cannot be determined in the stripmap images, but the spatial
resolution of the spotlight image is high enough to identify the
damages. The western bridge collapsed, whereas the eastern
bridge is only damaged, which can be seen in the shadow casted
by the bridge.
In Figure 6, three SAR images of Dujiangyan city can be seen.
Dujiangyan is located near the Zipingpu dam (Kerr and Stone
2009). Figure 6(a) shows a COSMO-SkyMed image acquired
from a descending orbit on May 13, 2008, one day after the
quake. It was the first high-resolution SAR image from the area.
The high and chaotic reflections of the buildings near the street
are indicators for possible building damages (Balz and Liao
2009). The COSMO-SkyMed image has strong sidelobes all
over the image, disturbing the interpretations.
Figure 6(b) shows a Terra-SAR-X spotlight image taken on
May 15, 2008, from a descending orbit. The spatial resolution is
higher and the image has much less sidelobes. The buildings
near the street also have strong and chaotic backscatter. In
Figure 6(c), a TerraSAR-X stripmap image acquired on May 22,
2008, from an ascending orbit can be seen. No strong
reflections are visible and the buildings near the street seem
undamaged on the first glance. But, although the shadow is
almost linear, the layover seems chaotic, which is also
indicating severe building damage.
The TerraSAR-X images seem clearer and they suffer less from
sidelobes in the Dujiangyan scenes. But, as can be seen in
Figure 6, the differences are rather small. Differences caused by
different looking angles, image modes, and orbits are more
significant.

COSMO-SkyMed
damaged?
(a)
TerraSAR-X
damaged?
(b)
TerraSAR-X
chaotic layover
(c)
Figure 6. Descending COSMO-SkyMed image (a), de-
scending TerraSAR-X image (b), and ascending TerraSAR-
X image (c) of Dujiangyan city.
4. TERRASAR-X INSAR DATA OF SHANGHAI
To evaluate the interferometric performance of TerraSAR-X, we
use a pair of TerraSAR-X SLC data over Shanghai. Shanghai is,
with over 20 million inhabitants, the largest city in China in
terms of population. The city is located at the Yangtze River
Delta. The city area is rather flat. Shanghai is bisected by the
Huangpu River.
Since the 1990s, the economical reforms lead to a remarkable
development of the city, making it one of the world’s financial
centers and the world’s biggest cargo port.
The two TerraSAR-X images were acquired in stripmap mode
from descending orbits on April 21 and August 20, 2008. They
cover the urban and most suburban areas of Shanghai. Figure
7(a) shows the TerraSAR-X test scene.
-π π
(a) (b)
Figure 7. TerraSAR-X InSAR results over Shanghai. Ampli-
tude image (a); Interferometric phase (b).
The urban area and dock area show as bright features, due to
high backscattering, while water bodies (sea and river), as well
as, for example, the runways on the airport show dark tones, as
a result of very low backscattering. The suburban areas appear
in medium gray levels. Figure 8 shows the interferometric phase
over the Pudong area in Shanghai. Figure 9 shows the cohe-
rence in the same area. The high-rise buildings forming the Pu-
dong skyline can be identified clearly in the interferometric
phase image.
The perpendicular baseline is about 61.4 m, which is moderate
for X-band SAR systems. Therefore, good coherence, as high as
0.8, can be maintained in most urban areas, even with a long
temporal baseline of 121 days. Meanwhile, coherence is nearly
lost in most suburban or rural areas, which is likely due to sur-
face changes between the two acquisitions in spring and sum-
mer respectively.
Figure 8. Interferometric phases over the Pudong area in
Shanghai.
Although from a single interferometric experiment we cannot
derive any information of surface deformations, it does reveal
that TerraSAR-X data is suitable for SAR interferometric stu-
dies over urban areas, even with a long temporal baseline. Fur-
thermore, it is expected that PS-InSAR with time series of Ter-
raSAR-X data can be successfully applied to subsidence mon-
itoring in urban areas such as Shanghai.

Figure 9. Coherence image of the Pudong area in Shanghai.
5. SMALL STACK PS-INSAR OVER SHANGHAI
Since the 1920s, Shanghai is suffering from subsidence. This
has gotten worse with the increasing urban development since
the 1990s
Differential interferometry (D-InSAR) has been widely applied
for large-area subsidence monitoring. However, this technique
is difficult to employ for long-term monitoring, due to temporal
decorrelation, atmospheric effects, and other limitations. In or-
der to overcome the major problems of D-InSAR, the Persistent
Scatterer Interferometry (PS-InSAR) has been developed. Using
PS-InSAR, the subsidence can be precisely measured.
Figure 10. Subsidence measured over Shanghai using PS-
InSAR.
For the Shanghai study area, eight ENVISAT ASAR IMS
images (Track 497, Frame 621), acquired from October 2007 to
October 2008, are combined to generate the differential inter-
ferograms. The perpendicular baselines range from -325 m to
254 m. The maximum difference in the Doppler Centroid fre-
quency is about 7.2 Hz. The processed area is approximately
5000 km2. The SRTM C-Band DEM is used for the topographic
phase removal. 16 differential interferograms were generated. In
total 821,477 PS points are extracted from the short-time
InSAR stack (Lu et al. 2008). Using the spatio-temporal un-
wrapping method, we can obtain the annual average subsidence
rate. We found the subsidence rate to be in the range of -25 to
10 mm/year. Figure 10 shows the subsidence map obtained by
short-term stack PS-InSAR. It shows a good consistency with
the reference subsidence map derived from leveling measure-
ments in that the main subsidence areas coincide well with each
other.
We plan to test small stack PS-InSAR using high-resolution
SAR over Shanghai, soon. The necessary data is acquired at the
moment. High-resolution PS-InSAR is a promising technique.
Adam et al. (2008) show that while using PS-InSAR with high-
resolution SAR images, many persistent scatterers can be found
in one building. By grouping neighbored persistent scatterers,
combined movement estimation can be set up and specific dis-
placement models for the group movement can be employed
(Gernhardt and Hinz 2008).
6. CONCLUSIONS
Spaceborne high-resolution SAR images are a new, reliable,
and weather independent data source. With spatial resolutions
up to one meter, remote sensing applications in urban areas are
possible. SAR image interpretation is rather difficult though.
Because of the oblique viewing geometry, occlusions and ambi-
guities frequently occur in SAR images. SAR images of urban
areas are especially difficult to interpret. Layover and shadows
of high-rise buildings disturb the image. The artificial structures
forward scatter a great amount of the energy transmitted by the
SAR system. Double- and multi-bounces frequently occur in
SAR images of urban areas, further disturbing the interpretation.
SAR images are important data sources for time-critical opera-
tions in need of weather independent surveillance. Disaster
management benefits strongly from high-resolution SAR. For
example, after the Wenchuan Earthquake, SAR was widely used
for post-disaster surveillance.
For time-critical missions, the temporal resolution of a system is
crucial. The modern high-resolution SAR satellites have a high
revisiting frequency. The repeat-orbit period of TerraSAR-X is
only 11 days, compared with 35 days for ERS or Envisat ASAR
and 24 days for Radarsat-1. COSMO-SkyMed’s four satellite
constellation has an even higher repetition rate. The combined
use of various data sources can further increase the temporal
resolution. Using data from different sensors is always difficult,
even if the sensors operate with almost similar characteristics.
For manual interpretation, COSMO-SkyMed and TerraSAR-X
data can be combined. A combined use of the data for auto-
mated procedures is more difficult, but seems possible for the
real parts of the SAR images.
Another important feature of SAR systems is their precise
measurement of distances, which can be used for the creation of
DEMs using InSAR. High-resolution InSAR allows the creation
of precise height models of urban areas. Using high-resolution
persistent scatter interferometry differences in the subsidence of
single buildings can be identified.
We are just about to discover the whole range of new possibili-
ties and applications provided by the new high-resolution SAR
systems. There are new applications for the weather indepen-
dent high-precision measurements of high-resolution SAR sys-
tems and it is time to discover them.
ACKNOWLEDGMENT
The authors would like to thank the Infoterra GmbH, Beijing
Spot Image, and Beijing Earth Observation Inc. This work was
supported by the National Key Basic Research and Develop-
ment Program of China (Contract No. 2007CB714405), Na-
tional 863 Program of China (Contract No. 2007AA12Z180),
and China Postdoctoral Science Foundation (20080440952).

REFERENCES
Adam, N., Eineder, M., Yague-Martinez, N. and Bamler, R.,
2008. High-resolution interferometric stacking with TerraSAR-
X. In: Proc. International Geoscience and Remote Sensing
Symposium (IGARSS 2008), Boston, USA.
Balz, T., Scheuchl, B. and Li, D.R., 2009. Sichuan Earthquake
(1): suitability of satellite images in rapid response. GIM Inter-
national, 22 (10), pp. 13-15.
Balz, T. and Liao, M.S., 2009. Building damage detection using
post-seismic high-resolution SAR satellite data. International
Journal of Remote Sensing, in press.
Chini, M., Bignami, C., Stramondo, S. and Pierdicca, N., 2008,
Uplift and subsidence due to the 26 December 2004 Indonesian
earthquake detected by SAR data. International Journal of
Remote Sensing, 29, pp. 3891-3910.
De Luca, G.F., Marano, G., Piemontese, M., Versini, B.,
Caltagirone, F., Casonato, G., Coletta, A. and De Carlo, M.,
2007. Interoperability, expandability and multi mission-sensor
COSMO-SkyMed capabilities. In: Proc. International Geo-
science and Remote Sensing Symposium (IGARSS 2007), Barce-
lona, Spain.
Dong, Y., Forster, B. and Ticehurst, C., 1997. Radar backscatter
analysis for urban environments. International Journal of
Remote Sensing, 18, pp. 1351-1364.
Eineder, M., Breit, H., Fritz, T., Schuettler, B. and Roth, A.,
2005. TerraSAR-X SAR products and processing algorithms. In:
Proc. International Geoscience and Remote Sensing Sympo-
sium (IGARSS 2005), Seoul, Korea.
Ferretti, A., Prati, C. and Rocca, F., 2000. Nonlinear subsidence
rate estimation using permanent scatterers in differential SAR
interferometry. IEEE Transactions on Geoscience and Remote
Sensing, 38, pp. 2202-2212.
Ferretti, A., Prati, C. and Rocca, F., 2001. Permanent scatterers
in SAR interferometry. IEEE Transactions on Geoscience and
Remote Sensing, 39, pp. 8-20.
Gamba, P., Dell’Acqua, F. and Trianni, G., 2007, Rapid damage
detection in the Bam area using multitemporal SAR and
exploiting ancillary Data. IEEE Transactions on Geoscience
and Remote Sensing, 45, pp. 1582-1589.
Gernhardt, S. and Hinz, S., 2008, Advanced displacement es-
timation for PSI using high resolution SAR Data. In: Proc. In-
ternational Geoscience and Remote Sensing Symposium
(IGARSS 2008), Boston, USA.
Hilley, G.E., Buergmann, R., Ferretti, A., Novali, F. and Rocca,
F., 2004. Dynamics of slow-moving landslides from permanent
scatterer analysis. Science, 304, pp. 1952-1955.
Kerr, R.A. and Stone, R., 2009, A human trigger for the Great
Quake of Sichuan? Science, 323, p. 322.
Lee, J.S., Ainsworth, T.L., Krogagor, E. and Boerner, W.-M.,
2006. Polarimetric analysis of radar signature of a man-made
structure. In: Proc. International Geoscience and Remote Sens-
ing Symposium (IGARSS 2006), Denver, Colorado.
Lu, L.J., Liao, M.S., Wang, C.C., Tian, X., Li, D.R., Fang, Z.,
Wang, H.M., Yang, L.J., Fang, Z.L., 2008, A new method of
identification of stable pointwise target in small SAR dataset. In:
Proc. 2008 Dragon Symposium, ESA SP-655, Beijing, China.
Matsuoka, M. and Yamazaki, F., 2005, Building damage
mapping of the 2003 Bam, Iran, Earthquake using Envi-
sat/ASAR intensity imagery. Earthquake Spectra, 21, pp. S285-
S294.
Parsons, T., Ji, C. and Kirby, E., 2008. Stress changes from the
2008 Wenchuan Earthquake and increased hazard in the Si-
chuan basin. Nature, 454, pp. 509-510.
Shao, Y., Gong, H.Z., Wang, S.A., Zhang, F.L. and Tian, W.,
2008. Mulit-source SAR remote sensing data for rapid response
to Wenchuan Earthquake damage assessment [in Chinese].
Journal of Remote Sensing, 12, pp. 865-870.
Shinozuka, M., Ghanem, R., Houshmand, B. and Mansouri, B.,
2000, Damage detection in urban areas by SAR imagery.
Journal of Engineering Mechanics, 126, pp. 779-777.
Stone, R., 2008, Landslides, flooding pose threats as experts
survey quake’s impact. Science, 320, pp. 996-997.
Stramondo, S., Bignami, C., Chini, N., Pierdicca, N. and
Tertulliani, A., 2006, Satellite radar and optical remote sensing
for earthquake damage detection: results from different case
studies. International Journal of Remote Sensing, 27, pp. 4433-
4447.
Thompson, A.A., Luscombe, A., James, K., and Fox, P., 2008,
RADARSAT-2 mission status: capabilities demonstrated and
image quality achieved. In: Proc. 7th European Conference on
SAR (EUSAR 2008), Friedrichshafen, Germany.
Yonezawa, H.A. and Takeuchi, S., 2001, Decorrelation of SAR
data by urban damage caused by the 1995 Hoyogoken-Nanbu
earthquake. International Journal of Remote Sensing, 22, pp.
1585-1600.