Embed Size (px)
Citation preview
#mstrworld
#mstrworld
Analyzing Multiple Data Sources with Multisource Data
Federation and In-Memory Data Blending
Presented by: Trishla Maru

#mstrworld 2
Agenda
• Overview
• MultiSource Data Federation
• Use Cases
• Design Considerations
• Data Blending
• What is Data Blending
• When to use Data Blending?
• Benefits of Data Blending
• Demo
• MultiSource Option Vs. Data Blending
• Performance Gain with New Dashboarding Engine
• Q&A
#mstrworld
MicroStrategy Analyzes Data from Corporate System of Record
and Personal Data Files
Modeled Data
• Modeled Data is performed through
MicroStrategy Architect
• Designer architects global model which
abstracts physical structure of data
(tables and columns, aggregates etc.)
Self Service Data
• This self-service data is achieved via the
“Import Data” feature
• User adds the data, and during the
import process, supplies basic mapping
of Attributes, Metric
1 2
MicroStrategy Intelligence Server
Local Data Dept. DB
Corporate
Data Sources
Architect Web Client
Global Model Self Service Data
XML\Web Services
1 2
Hadoop
#mstrworld
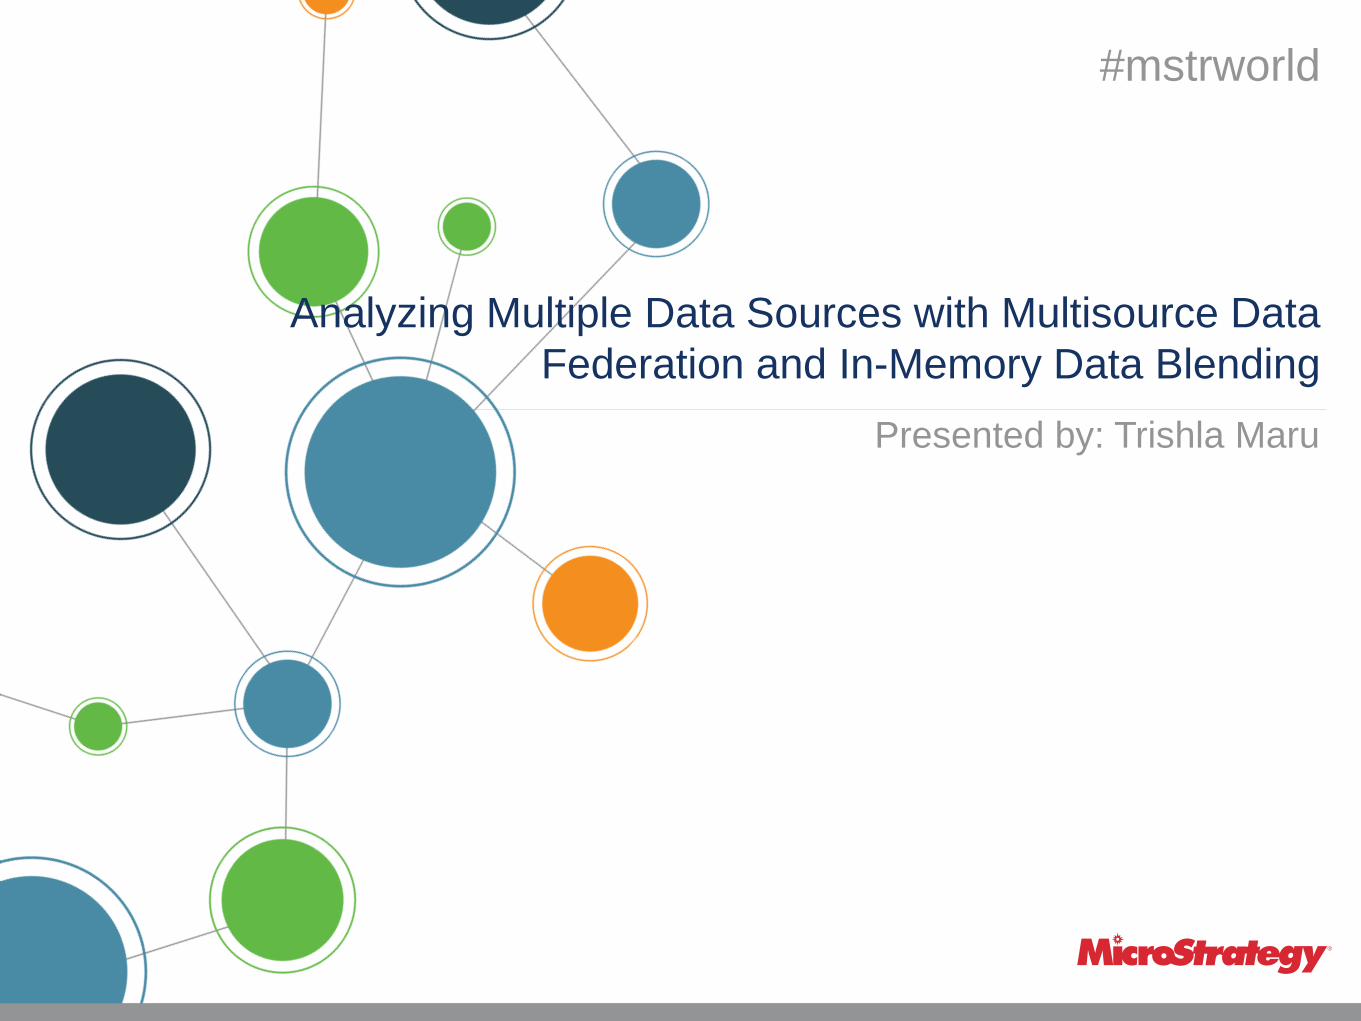
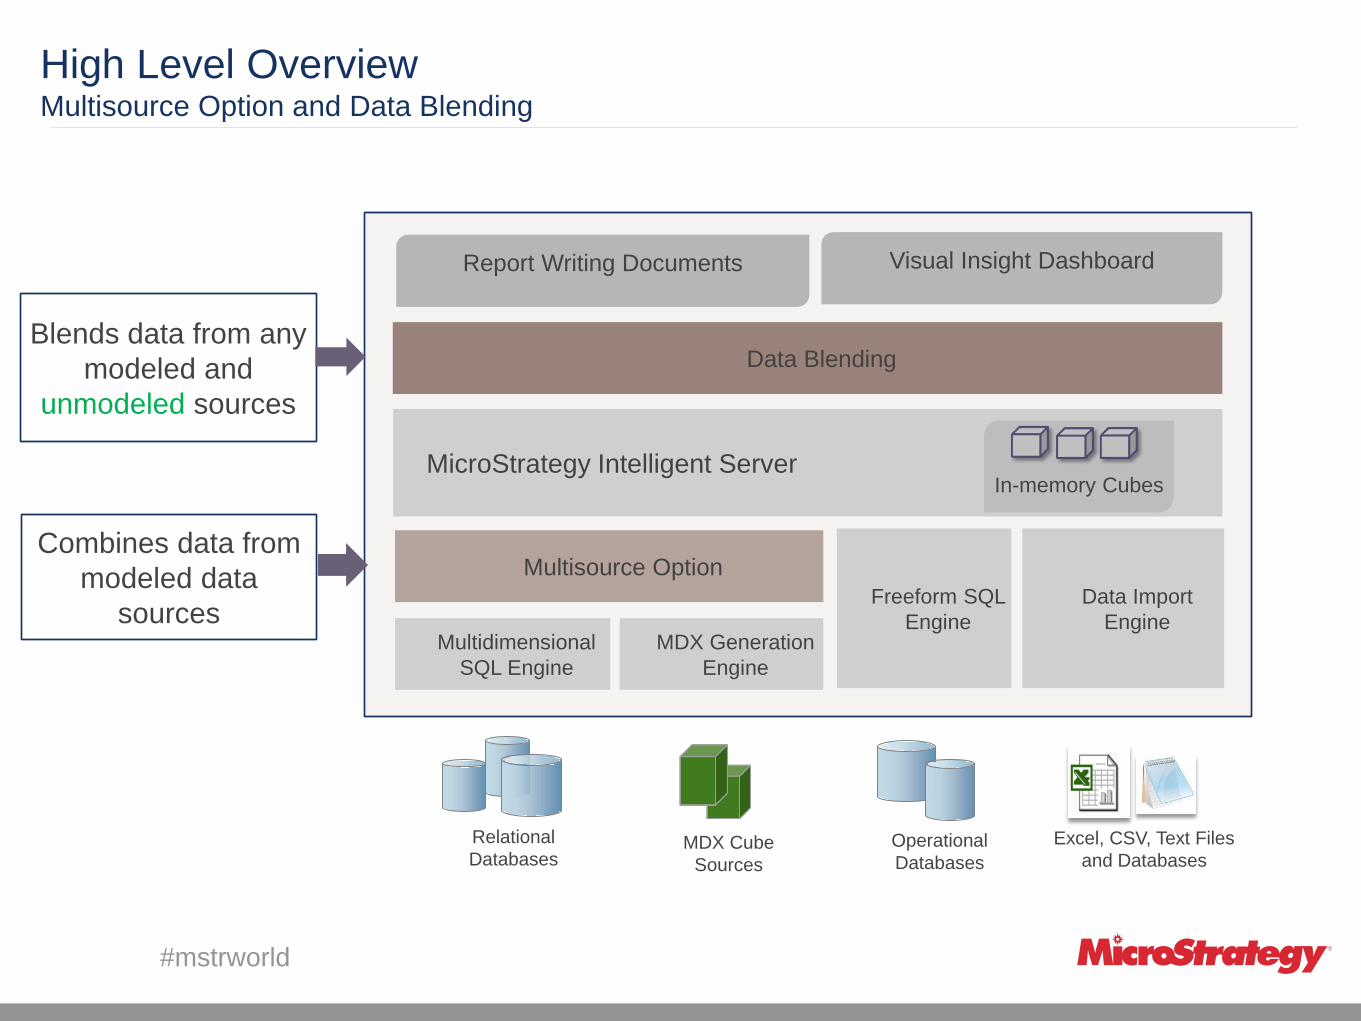
High Level Overview Multisource Option and Data Blending
Multidimensional
SQL Engine
MDX Generation
Engine
Freeform SQL
Engine
Multisource Option
MicroStrategy Intelligent Server
Report Writing Documents
Data Blending
Data Import
Engine
Visual Insight Dashboard
Relational
Databases MDX Cube
Sources
Operational
Databases
Excel, CSV, Text Files
and Databases
In
In-memory Cubes
Combines data from
modeled data
sources
Blends data from any
modeled and
unmodeled sources

#mstrworld 5
Agenda
• Overview
• MultiSource Data Federation
• Use Cases
• Design Considerations
• Data Blending
• What is Data Blending
• When to use Data Blending?
• Benefits of Data Blending
• Demo
• MultiSource Option Vs. Data Blending
• Performance Gain with New Dashboarding Engine
• Q&A
#mstrworld
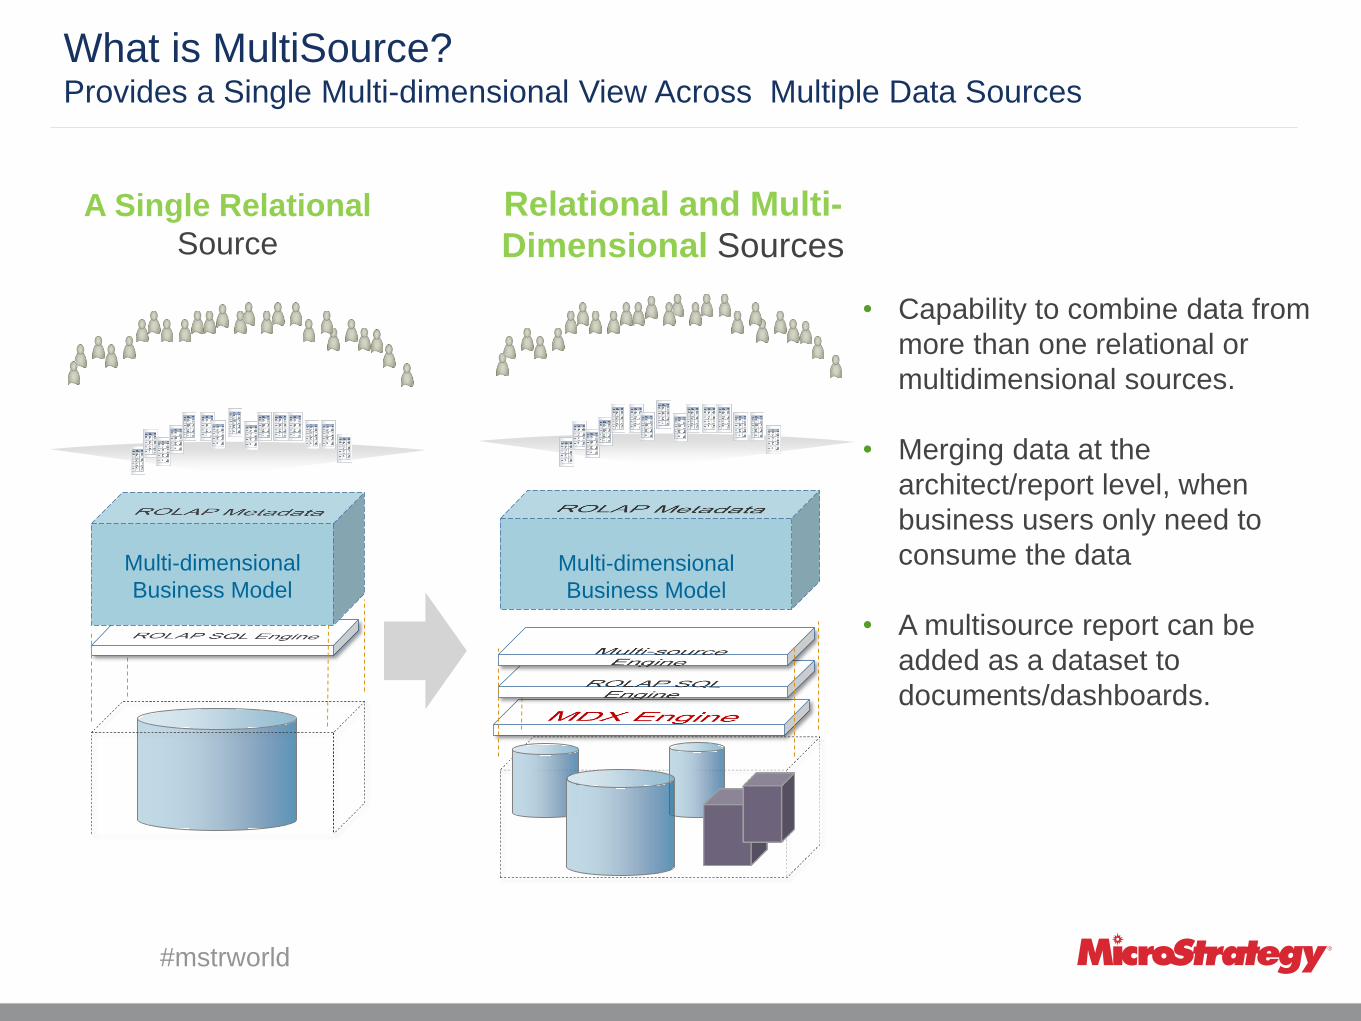
What is MultiSource? Provides a Single Multi-dimensional View Across Multiple Data Sources
Multi-dimensional
Business Model
Relational and Multi-
Dimensional Sources
A Single Relational
Source
Multi-dimensional
Business Model
• Capability to combine data from
more than one relational or
multidimensional sources.
• Merging data at the
architect/report level, when
business users only need to
consume the data
• A multisource report can be
added as a dataset to
documents/dashboards.
#mstrworld
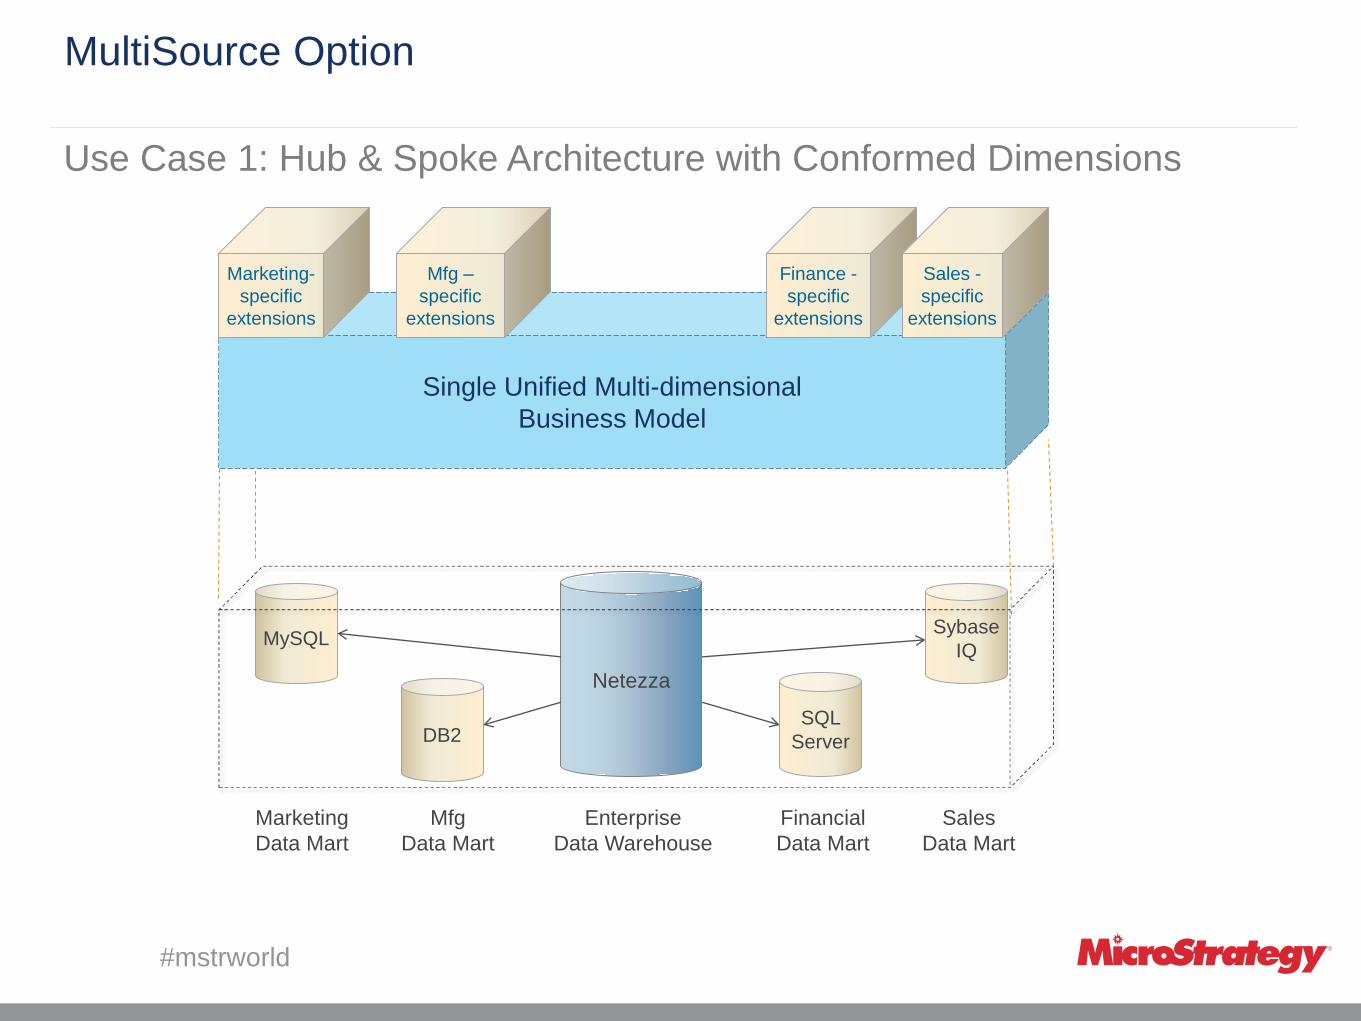
MultiSource Option
Use Case 1: Hub & Spoke Architecture with Conformed Dimensions
Netezza
SQL
Server
Sybase
IQ MySQL
DB2
Financial
Data Mart
Sales
Data Mart
Mfg
Data Mart
Marketing
Data Mart
Single Unified Multi-dimensional
Business Model
Marketing-
specific
extensions
Mfg –
specific
extensions
Finance -
specific
extensions
Sales -
specific
extensions
Enterprise
Data Warehouse

#mstrworld
MultiSource Option
Use Case 2: Balance Workload Across Databases
RDBMS1
RDBMS2
Result
Multisource ROLAP
High-level
Query Detail
Query
Fast Database for
Aggregates
Scalable Database
for Details
Result
Multi-dimensional
Business Model
MicroStrategy Analytics Platform

#mstrworld
MultiSource Option Use Case 3: Gradual Evolution from Islands of BI to Enterprise BI
Stage 2
Merging Islands of BI Using MicroStrategy Multisource
Finance
Dept HR
Dept
Sales
Dept
Enterprise
DW
Stage 3
Consolidating Data Re-pointing Metadata to the
EDW
Finance
Dept HR
Dept
Sales
Dept
Enterprise
DW
Finance
Dept HR
Dept
Sales
Dept
Enterprise
DW
Stage 1
Disparate Islands of BI All Running on MicroStrategy
BI
#mstrworld 10
Agenda
• Overview
• MultiSource Data Federation
• Use Cases
• Design Considerations
• Data Blending
• What is Data Blending
• When to use Data Blending?
• Benefits of Data Blending
• Demo
• MultiSource Option Vs. Data Blending
• Performance Gain with New Dashboarding Engine
• Q&A

#mstrworld
MultiSource Option is Designed for High Performance
1. Push Down ROLAP Joining Minimizing Data Movement
Multi-pass
SQL
RDMBS1
Table
“A”
Table
“B”
Partial
Result (Temporarily stored in
Intelligence Server memory)
Result
RDBMS2
Push-down
Join Table
“C” Insert Partial
Result into Temp
Table
Multi-dimensional
Business Model
Multiple Relational and Multi-Dimensional Sources
#mstrworld
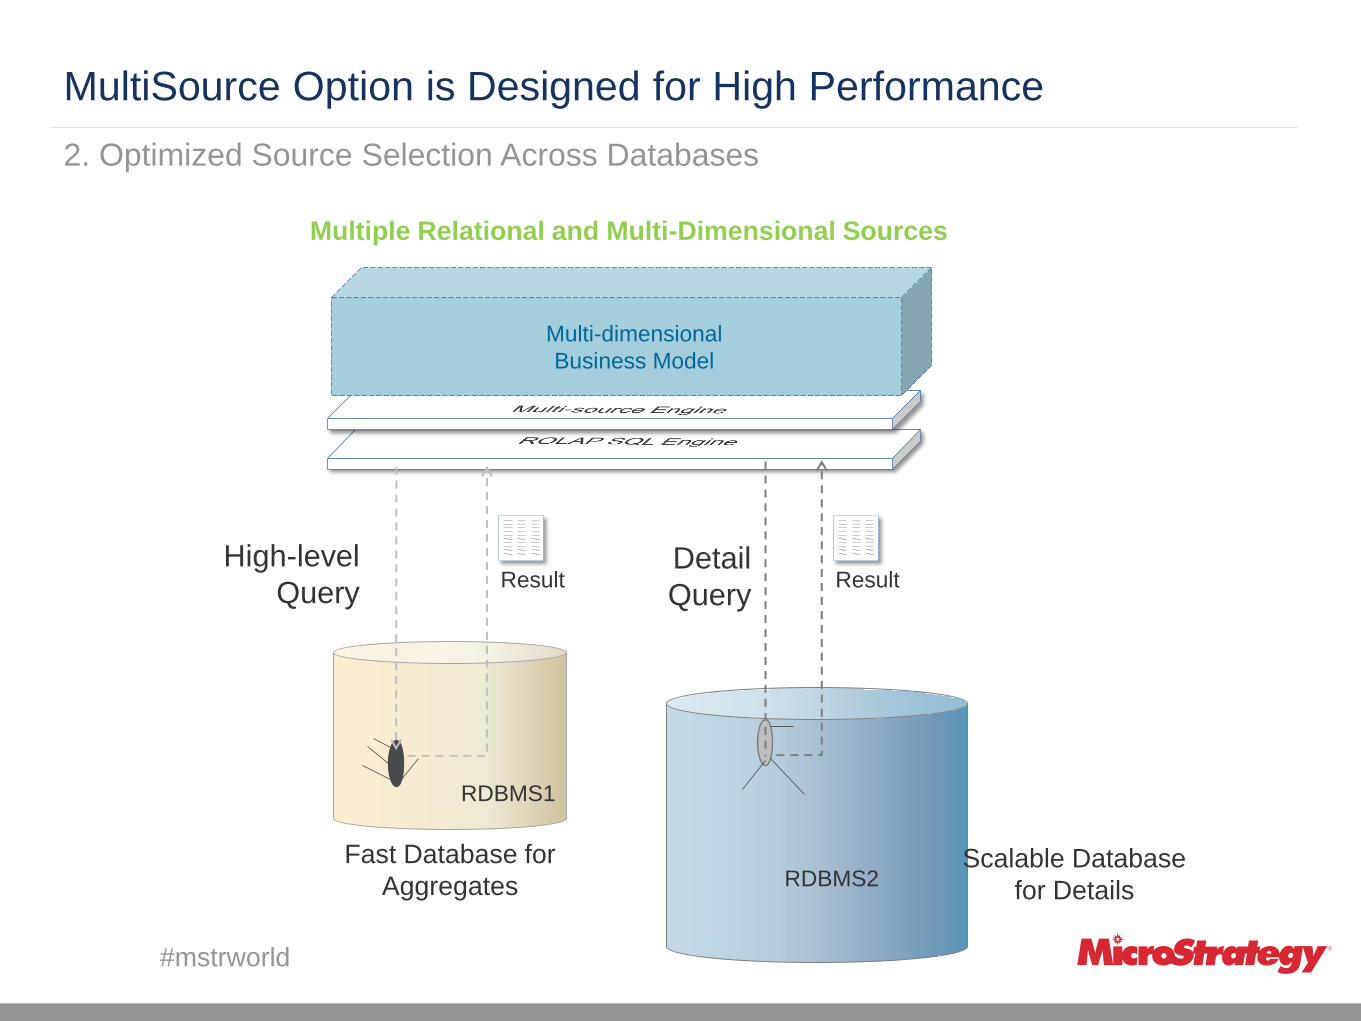
2. Optimized Source Selection Across Databases
RDBMS1
RDBMS2
Result High-level
Query Detail
Query
Fast Database for
Aggregates Scalable Database
for Details
Result
Multi-dimensional
Business Model
Multiple Relational and Multi-Dimensional Sources
MultiSource Option is Designed for High Performance
#mstrworld
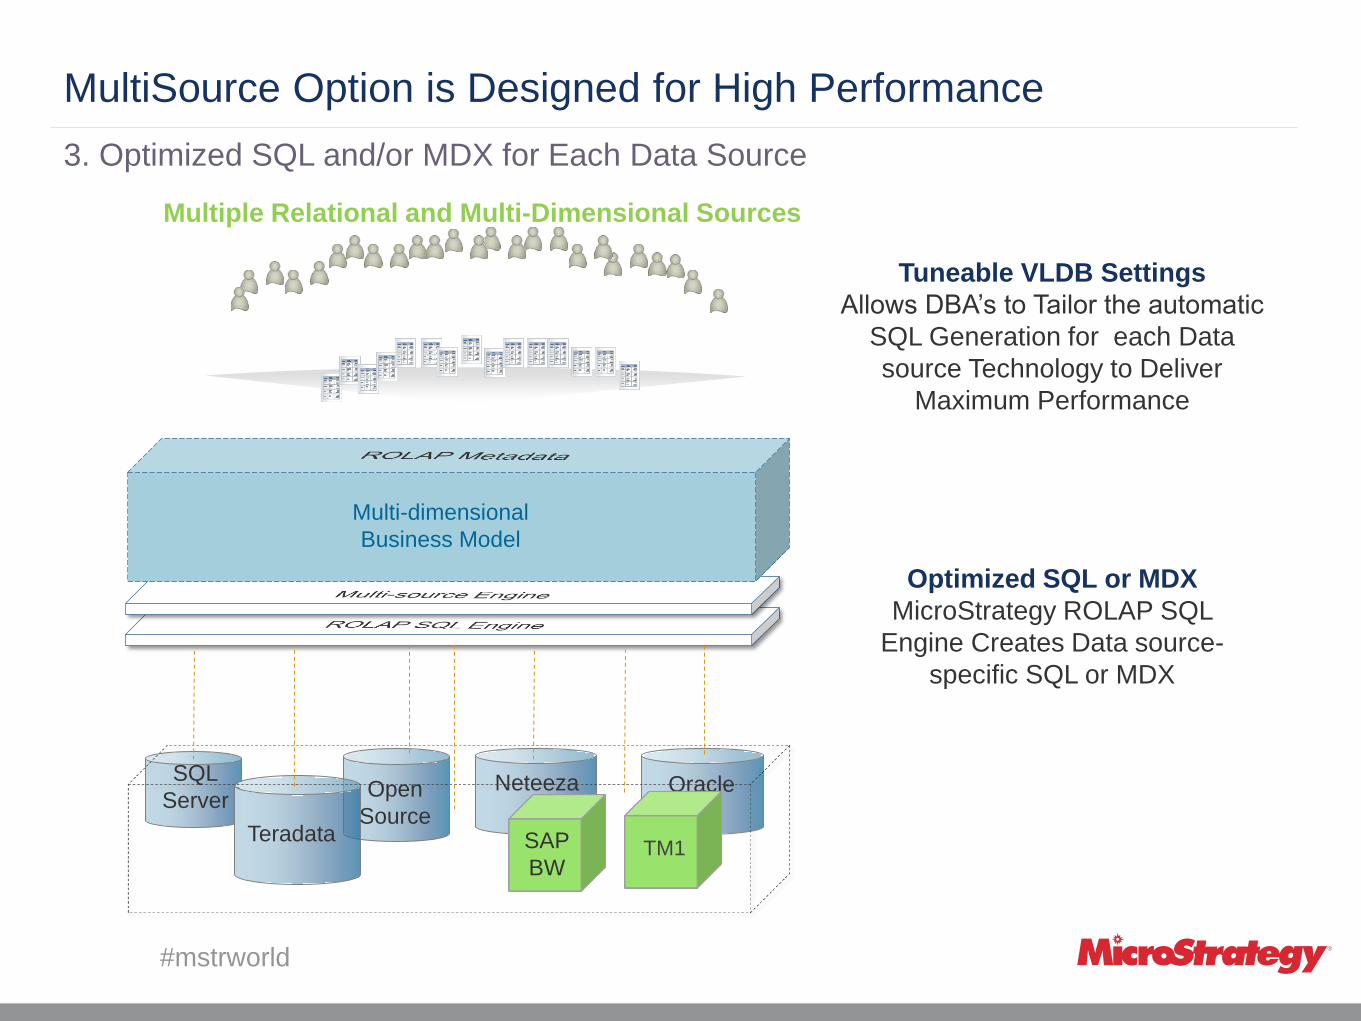
MultiSource Option is Designed for High Performance 3. Optimized SQL and/or MDX for Each Data Source
Optimized SQL or MDX
MicroStrategy ROLAP SQL
Engine Creates Data source-
specific SQL or MDX
Tuneable VLDB Settings
Allows DBA’s to Tailor the automatic
SQL Generation for each Data
source Technology to Deliver
Maximum Performance
Multi-dimensional
Business Model
SQL
Server
Teradata
Oracle Neteeza Open
Source
TM1 SAP
BW
TM1
Multiple Relational and Multi-Dimensional Sources
#mstrworld 14
Agenda
• Overview
• MultiSource Data Federation
• Use Cases
• Design Considerations
• Data Blending
• What is Data Blending
• When to use Data Blending?
• Benefits of Data Blending
• Demo
• MultiSource Option Vs. Data Blending
• Performance Gain with New Dashboarding Engine
• Q&A
#mstrworld
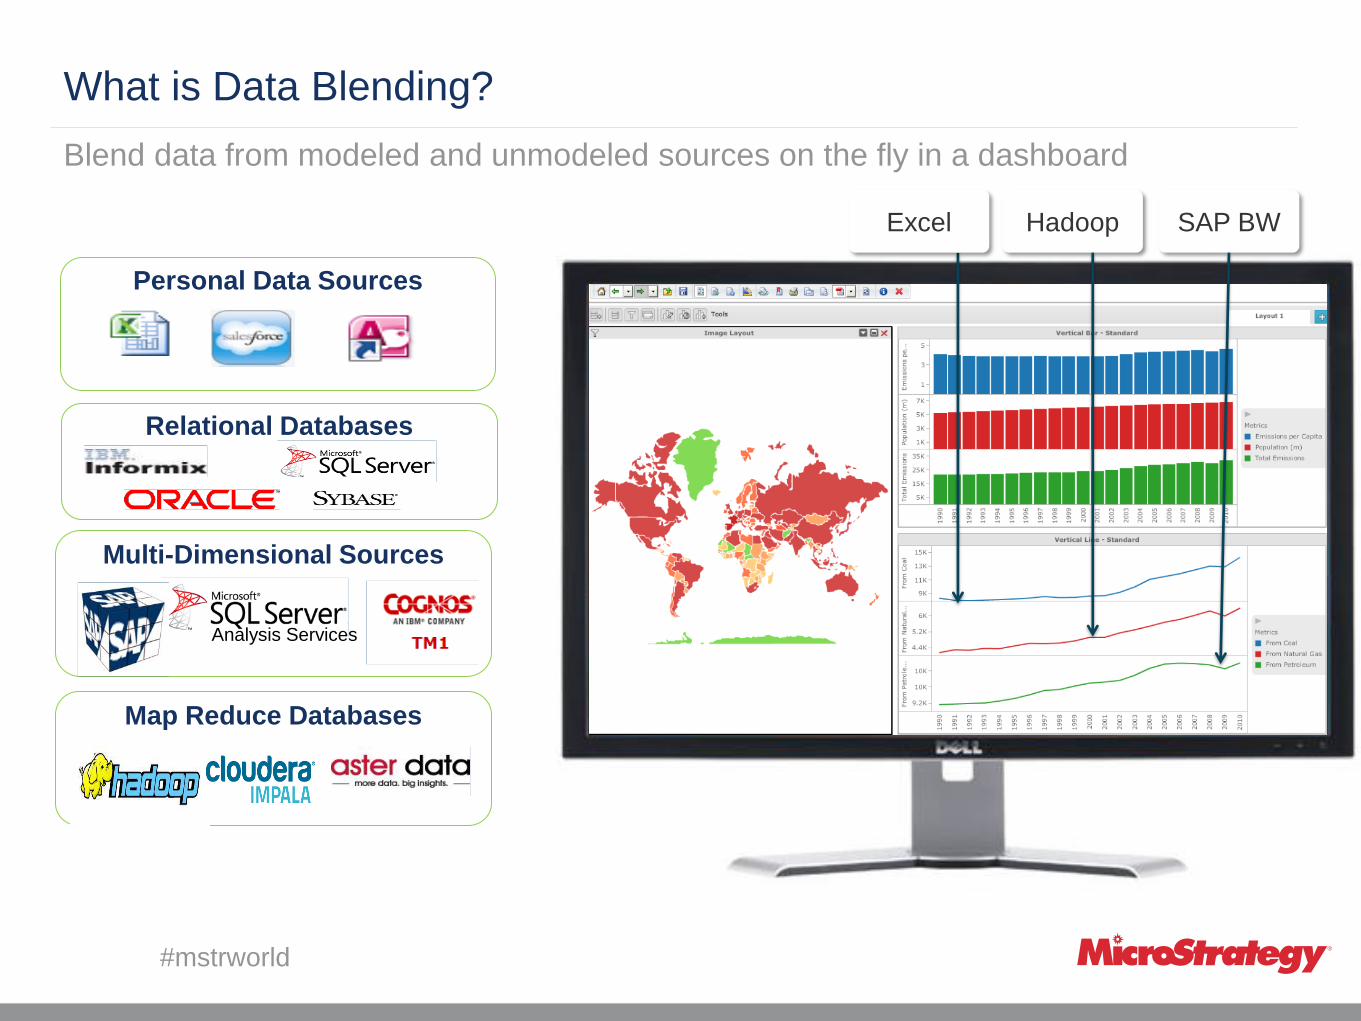
What is Data Blending?
Blend data from modeled and unmodeled sources on the fly in a dashboard
Personal Data Sources
Relational Databases
Multi-Dimensional Sources
Analysis Services
Hadoop SAP BW
Map Reduce Databases
Excel
#mstrworld
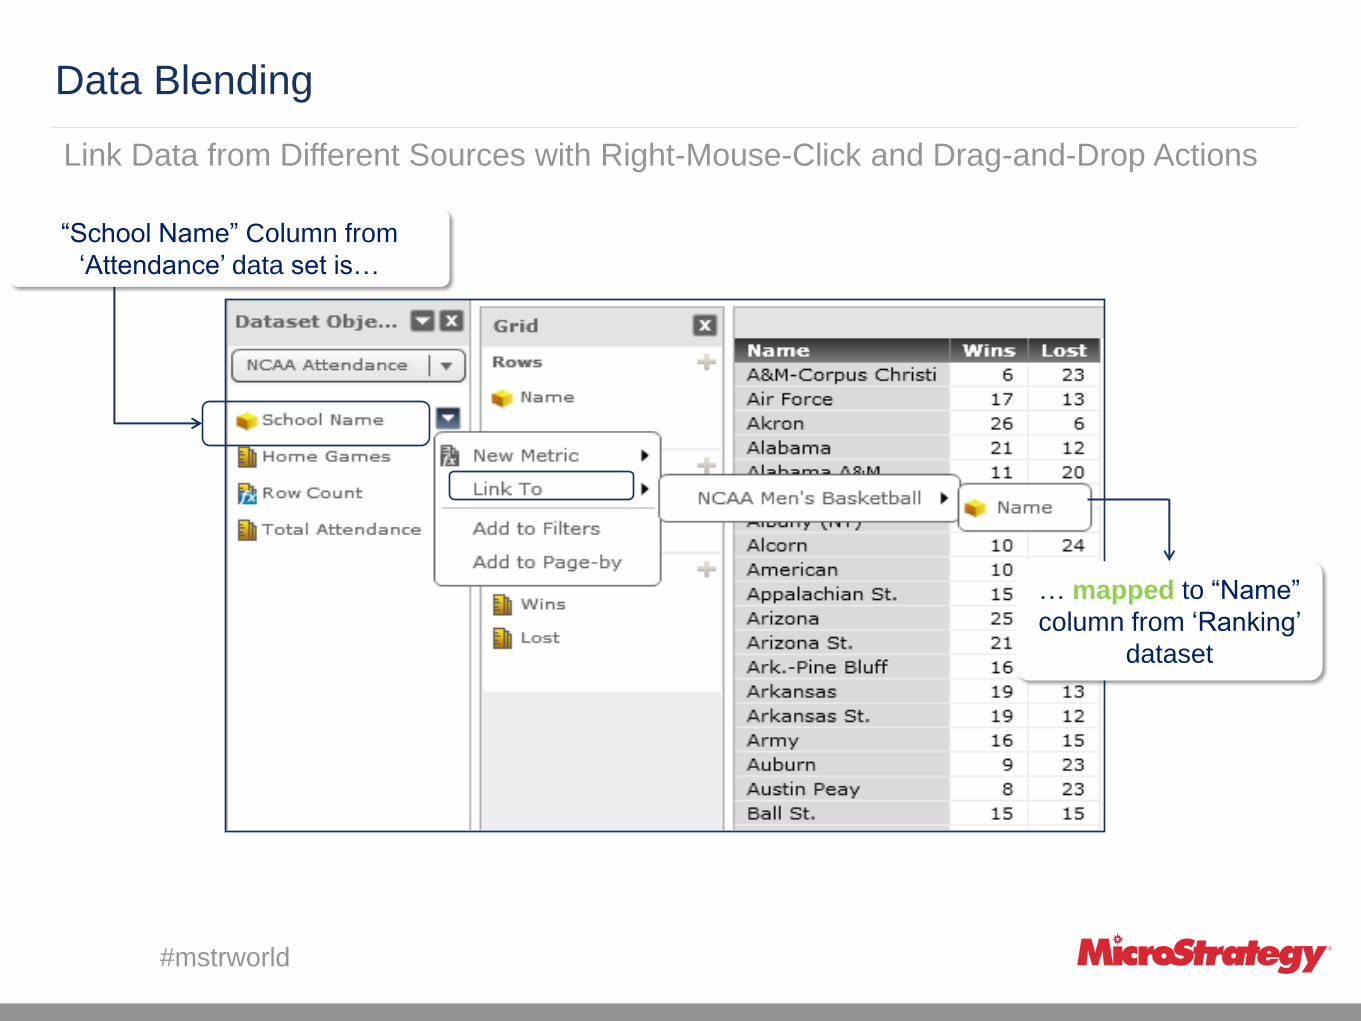
Data Blending Link Data from Different Sources with Right-Mouse-Click and Drag-and-Drop Actions
“School Name” Column from
‘Attendance’ data set is…
… mapped to “Name”
column from ‘Ranking’
dataset
#mstrworld
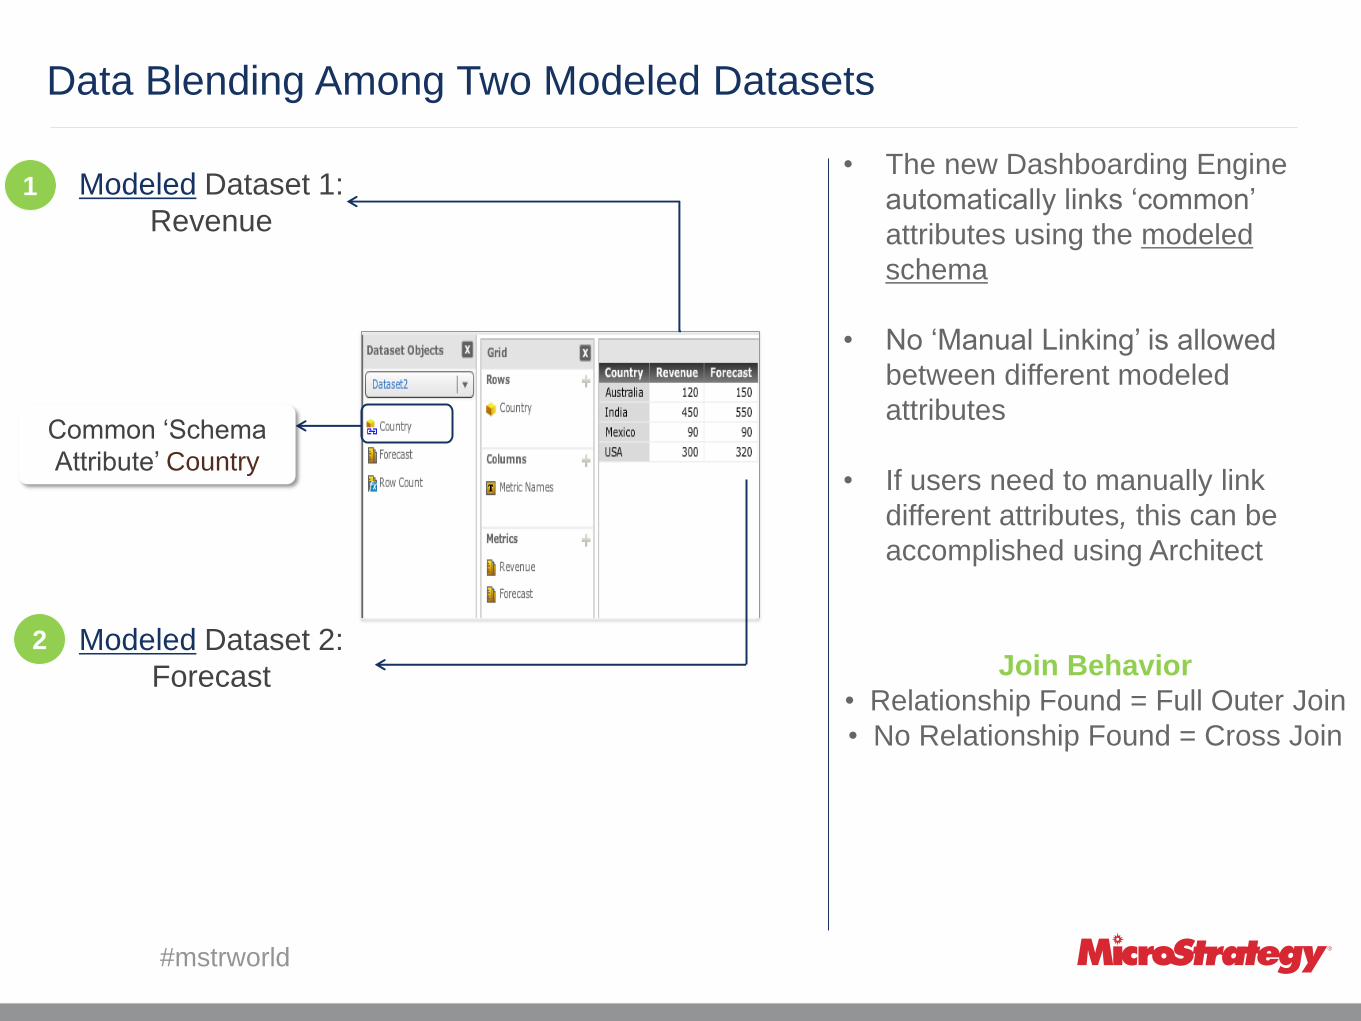
Data Blending Among Two Modeled Datasets
1 1
2 2
Modeled Dataset 1:
Revenue
Modeled Dataset 2:
Forecast
Common ‘Schema
Attribute’ Country
• The new Dashboarding Engine
automatically links ‘common’
attributes using the modeled
schema
• No ‘Manual Linking’ is allowed
between different modeled
attributes
• If users need to manually link
different attributes, this can be
accomplished using Architect
Join Behavior
• Relationship Found = Full Outer Join
• No Relationship Found = Cross Join

#mstrworld
Data Blending Among Modeled and Unmodeled Data
More Than One Dataset
in one VI Analysis
Auto-Linking
• RWD Engine tries to identify a
link between columns using
‘Header Name’ and ‘Data Type’
• Users have the flexibility to
Unlink the auto-link
OR
Data Blended from
Two Datasets
Join Behavior • Relationship Found = Full Outer Join
• No Relationship Found = Cross Join
Manual-Linking
• Users can manually link
imported/unmodeled attributes
to other imported/modeled
attributes
1
2
3

#mstrworld
When to use Data Blending? On the fly Blend data in a Dashboard or Document
Blend data from any number of sources with simple drag and drop actions!
Add any number of datasets to
your analysis!

#mstrworld
When to use Data Blending? Blend Modeled data with Unmodeled data in a Single Visualization
Instantly merge data from modeled and unmodeled data sources.
Blend and analyze without any IT dependency
Performance Score comes
from an Excel file
EDW City Data comes
from EDW
#mstrworld
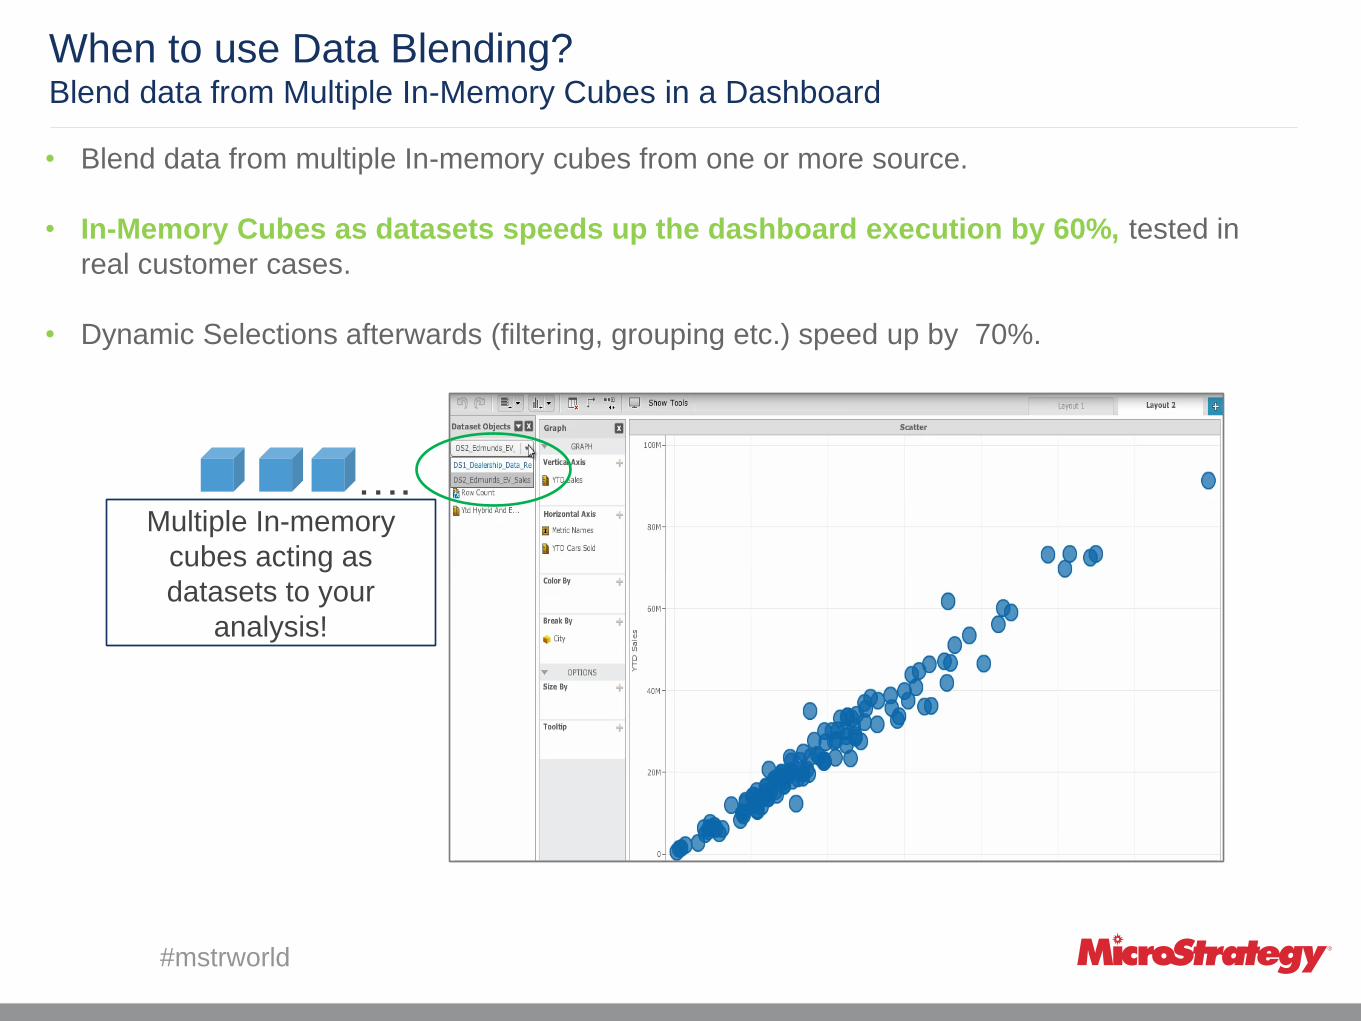
When to use Data Blending? Blend data from Multiple In-Memory Cubes in a Dashboard
• Blend data from multiple In-memory cubes from one or more source.
• In-Memory Cubes as datasets speeds up the dashboard execution by 60%, tested in
real customer cases.
• Dynamic Selections afterwards (filtering, grouping etc.) speed up by 70%.
…. Multiple In-memory
cubes acting as
datasets to your
analysis!
#mstrworld
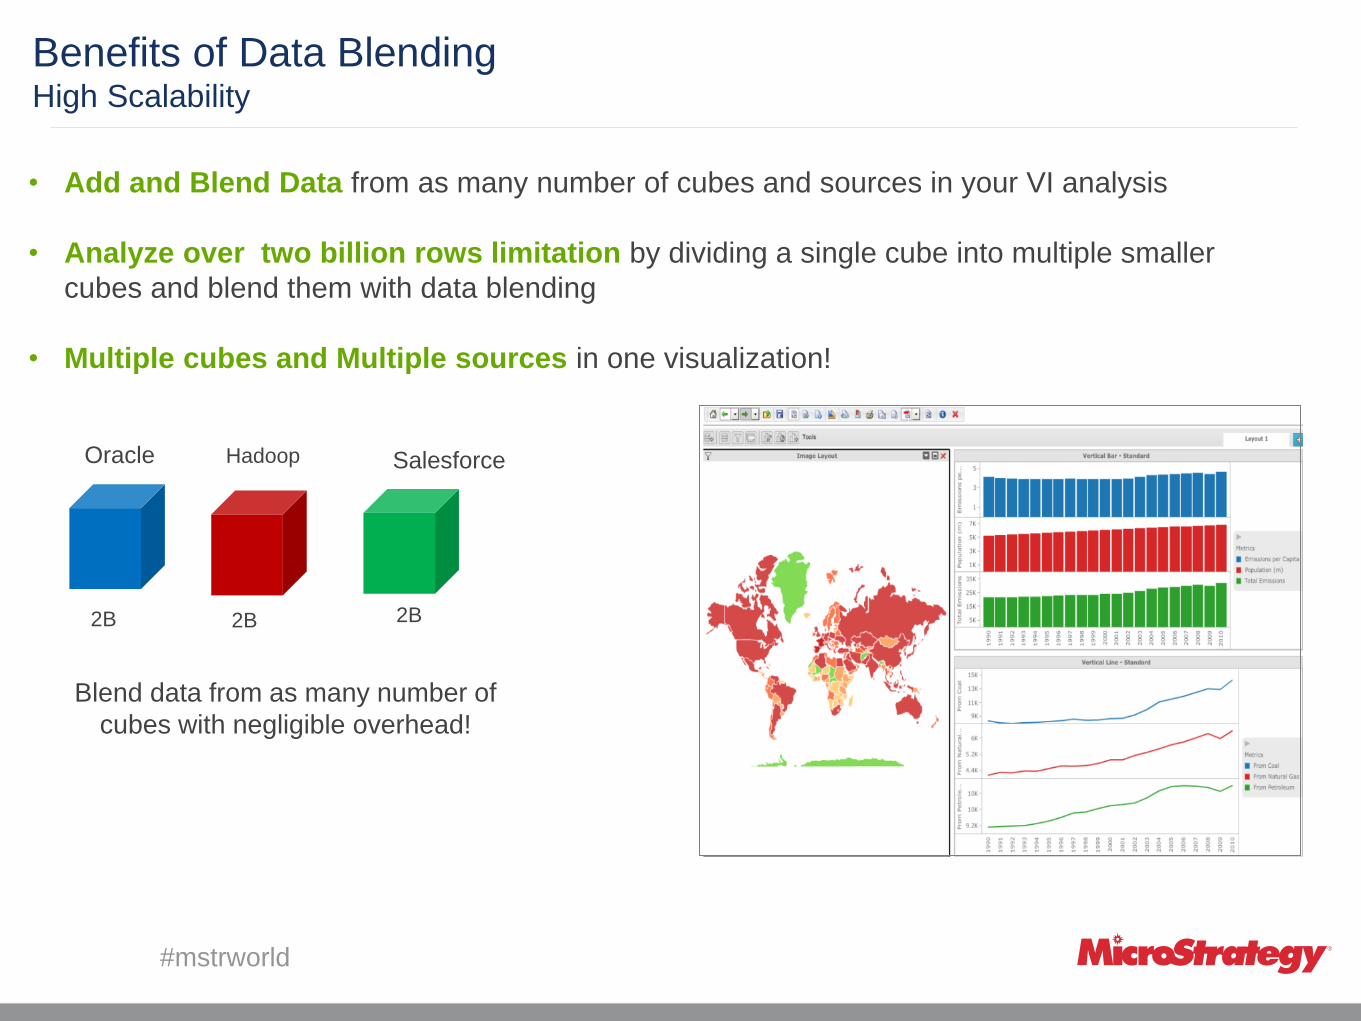
Benefits of Data Blending High Scalability
• Add and Blend Data from as many number of cubes and sources in your VI analysis
• Analyze over two billion rows limitation by dividing a single cube into multiple smaller
cubes and blend them with data blending
• Multiple cubes and Multiple sources in one visualization!
Blend data from as many number of
cubes with negligible overhead!
2B 2B 2B
Oracle Hadoop Salesforce

#mstrworld
Benefits of Data Blending Faster Cube Load and Refresh
MicroStrategy 9.3.1
One big cube feeding the
dashboard
In- Memory
Cube
Auto Refresh one
big cube
MicroStrategy Analytics Platform
Multiple cubes feeding the
dashboard
Faster Auto Refresh
than for one big cube
• Quicker load and refresh of the data with multiple Intelligent cubes.
• Improve the dashboard execution times by 60%
#mstrworld 24
Agenda
• Overview
• MultiSource Data Federation
• Use Cases
• Design Considerations
• Data Blending
• What is Data Blending
• When to use Data Blending?
• Benefits of Data Blending
• Demo
• MultiSource Option Vs. Data Blending
• Performance Gain with New Dashboarding Engine
• Q&A
#mstrworld
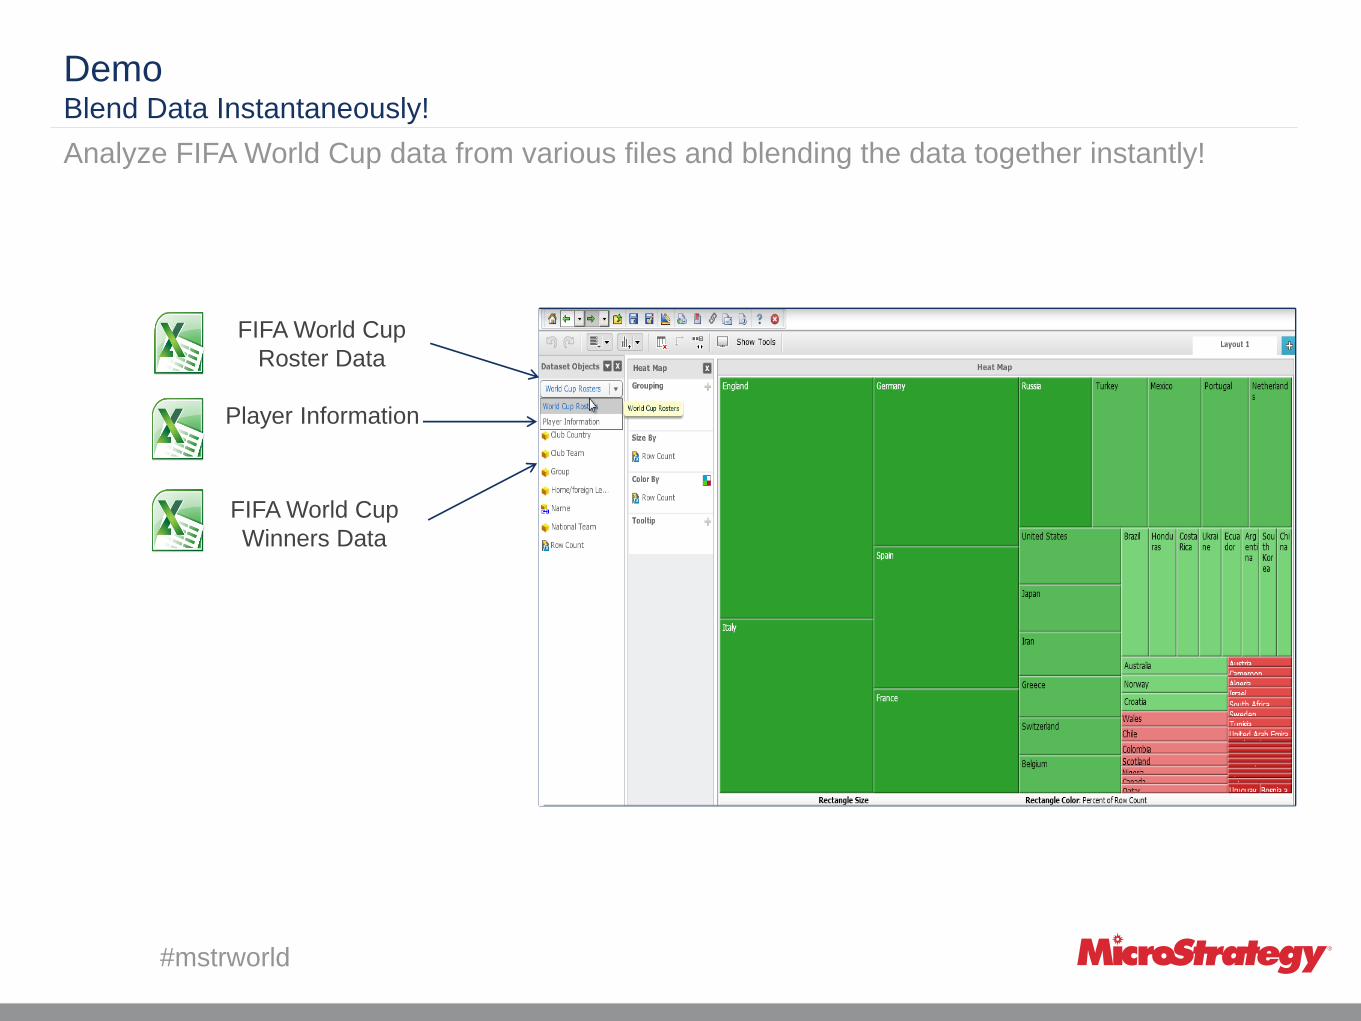
Demo Blend Data Instantaneously!
Analyze FIFA World Cup data from various files and blending the data together instantly!
FIFA World Cup
Roster Data
Player Information
FIFA World Cup
Winners Data
#mstrworld 26
Agenda
• Overview
• MultiSource Data Federation
• Use Cases
• Design Considerations
• Data Blending
• What is Data Blending
• When to use Data Blending?
• Benefits of Data Blending
• Demo
• MultiSource Option Vs. Data Blending
• Performance Gain with New Dashboarding Engine
• Q&A

#mstrworld
Multisource Option Vs. Data Blending
Multisource Option Data Blending
Modeled approach to join data On the fly blending data
Join data from various modeled
sources at the schema/report
level
Join data from various modeled
and unmodeled sources at the
dashboard/document level
Join is pushed to the underlying
database
Join occurs in MicroStrategy’s
Intelligent Server
Developed for Architects Developed for Business Users
Allows the user to have more
than one modeled schemas in a
single project
Removes the limitation of one
cube per VI analysis
#mstrworld 28
Agenda
• Overview
• MultiSource Data Federation
• Use Cases
• Design Considerations
• Data Blending
• What is Data Blending
• When to use Data Blending?
• Benefits of Data Blending
• Demo
• MultiSource Option Vs. Data Blending
• Performance Gain with New Dashboarding Engine
• Q&A
#mstrworld
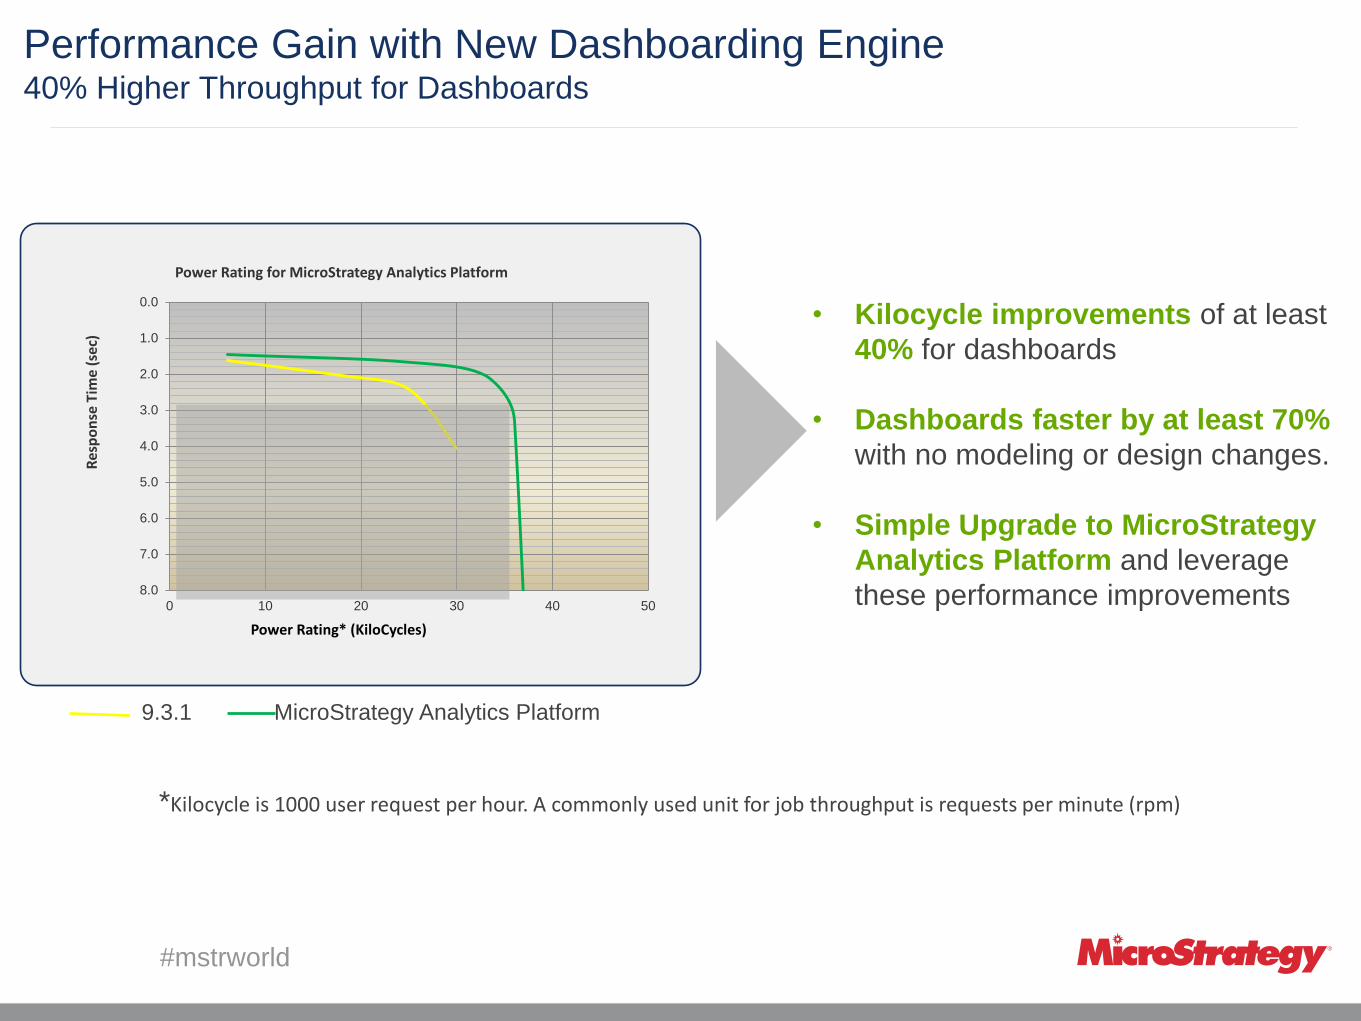
Performance Gain with New Dashboarding Engine 40% Higher Throughput for Dashboards
• Kilocycle improvements of at least
40% for dashboards
• Dashboards faster by at least 70%
with no modeling or design changes.
• Simple Upgrade to MicroStrategy
Analytics Platform and leverage
these performance improvements
0.0
1.0
2.0
3.0
4.0
5.0
6.0
7.0
8.0
0 10 20 30 40 50
Res
po
nse
Tim
e (s
ec)
Power Rating* (KiloCycles)
Power Rating for MicroStrategy Analytics Platform
9.3.1 MicroStrategy Analytics Platform
*Kilocycle is 1000 user request per hour. A commonly used unit for job throughput is requests per minute (rpm)
#mstrworld
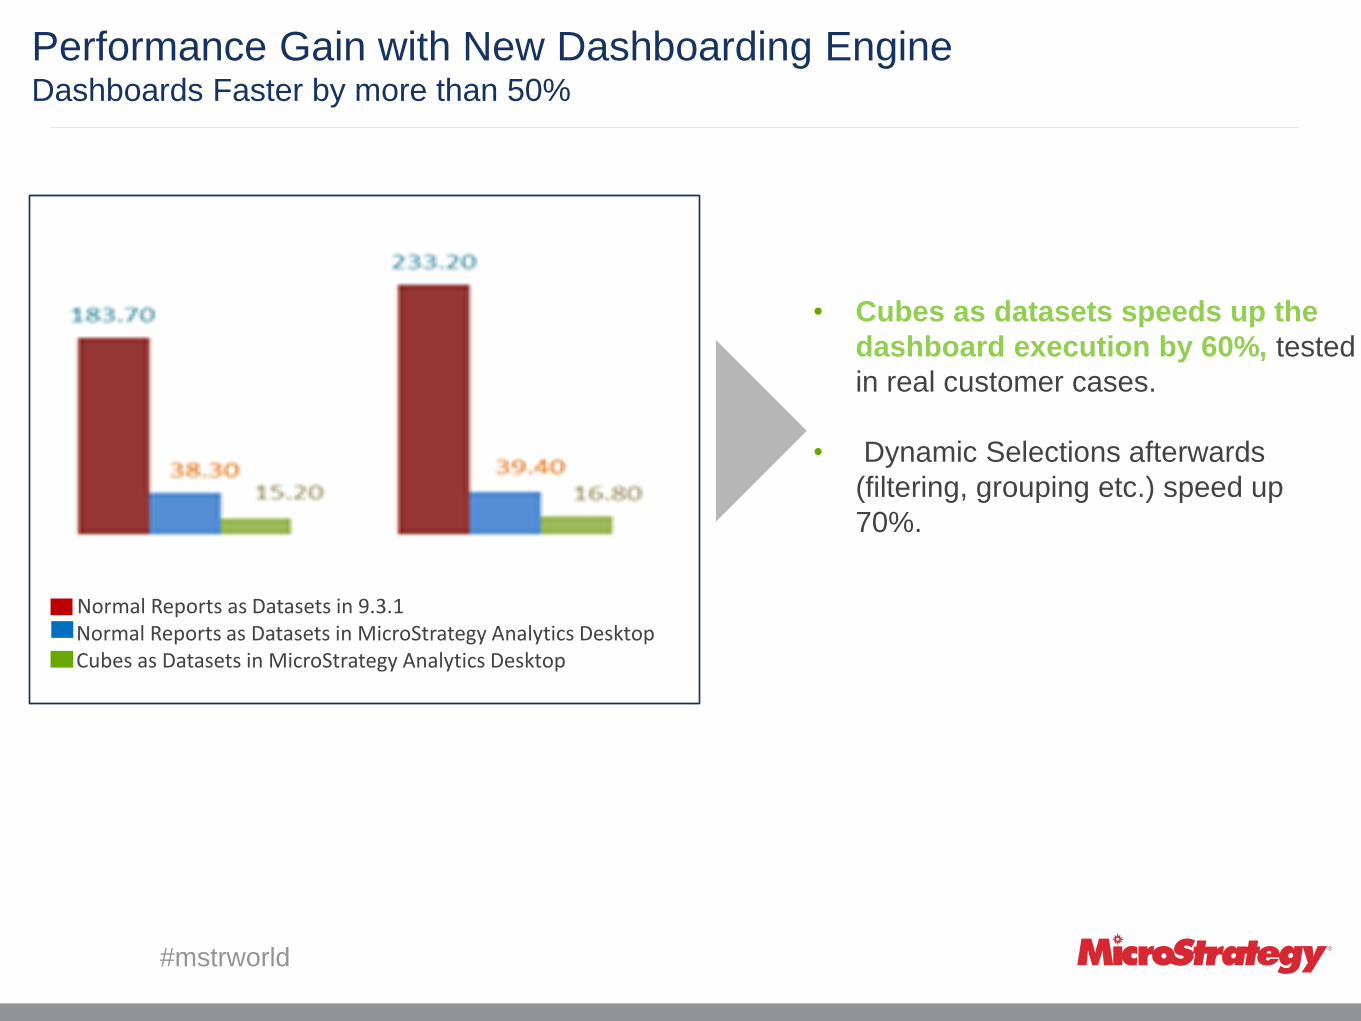
Performance Gain with New Dashboarding Engine Dashboards Faster by more than 50%
Normal Reports as Datasets in 9.3.1 Normal Reports as Datasets in MicroStrategy Analytics Desktop Cubes as Datasets in MicroStrategy Analytics Desktop
• Cubes as datasets speeds up the
dashboard execution by 60%, tested
in real customer cases.
• Dynamic Selections afterwards
(filtering, grouping etc.) speed up
70%.
#mstrworld
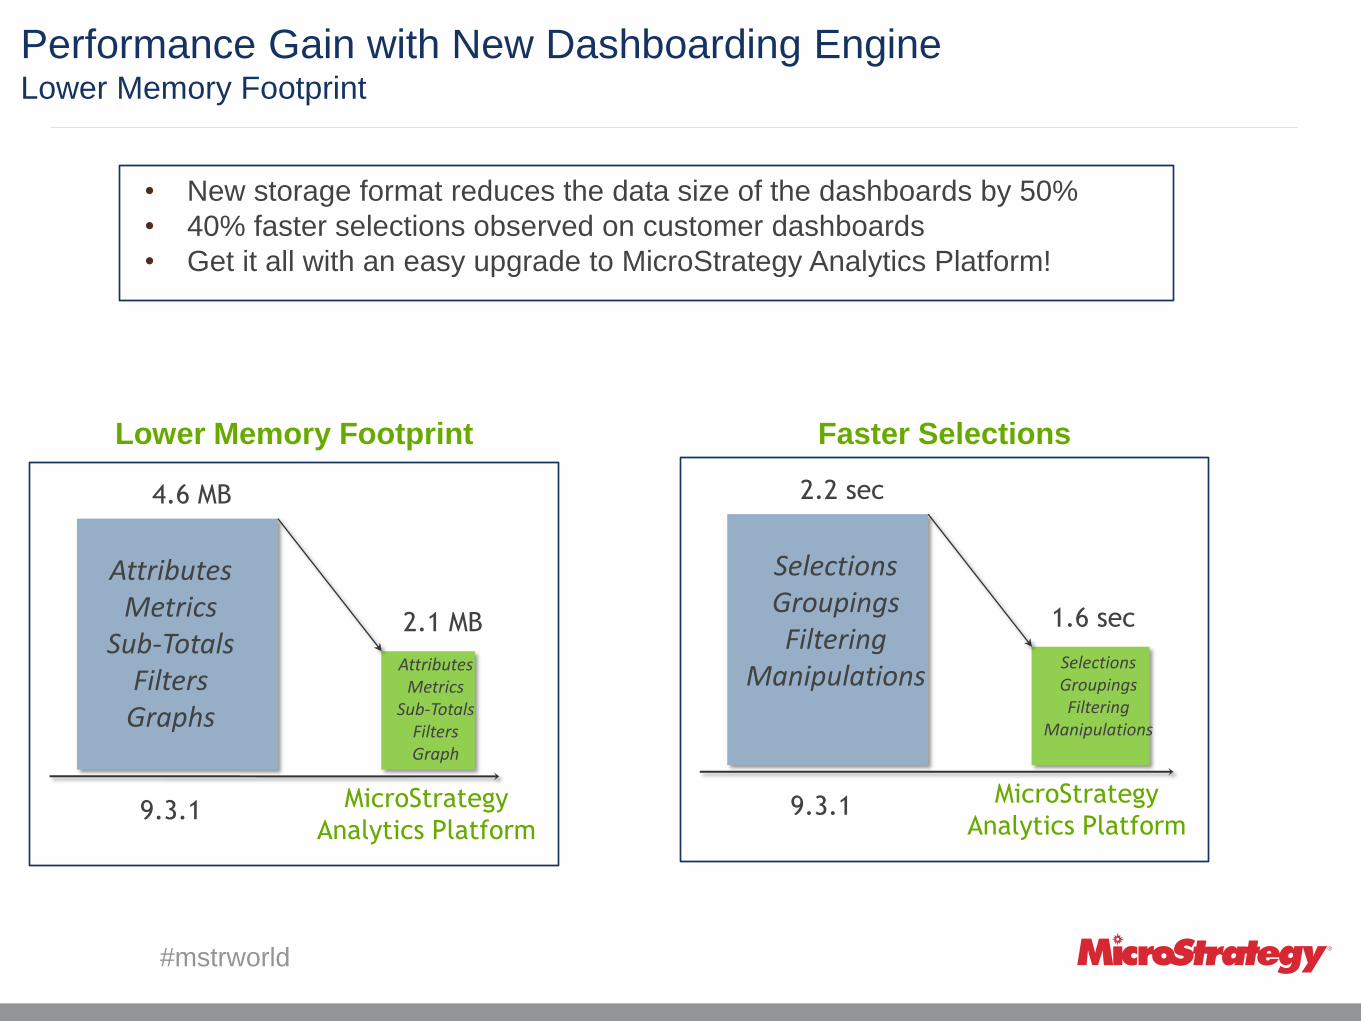
Lower Memory Footprint
Performance Gain with New Dashboarding Engine Lower Memory Footprint
9.3.1 MicroStrategy
Analytics Platform
4.6 MB
2.1 MB
Attributes Metrics
Sub-Totals Filters
Graphs
Attributes Metrics
Sub-Totals Filters Graph
Faster Selections
9.3.1 MicroStrategy
Analytics Platform
2.2 sec
1.6 sec
Selections Groupings Filtering
Manipulations Selections Groupings Filtering
Manipulations
• New storage format reduces the data size of the dashboards by 50%
• 40% faster selections observed on customer dashboards
• Get it all with an easy upgrade to MicroStrategy Analytics Platform!
#mstrworld 32
Agenda
• Overview
• MultiSource Data Federation
• Use Cases
• Design Considerations
• Data Blending
• What is Data Blending
• When to use Data Blending?
• Benefits of Data Blending
• Demo
• MultiSource Option Vs. Data Blending
• Performance Gain with New Dashboarding Engine
• Q&A
#mstrworld
Q&A
Questions?