Embed Size (px)
Citation preview

PROSIDING ISBN : 978‐979‐16353‐3‐2
Seminar Nasional Matematika dan Pendidikan Matematika Jurusan Pendidikan Matematika FMIPA UNY, 5 Desember 2009 1021
T‐7
ANALYZING CORONAL MASS EJECTION OF JULY 10, 2005 AND ITS EFFECT ON THE EARTH’S MAGNETOSPHERE
Bachtiar Anwar Division of Applied Geomagnetism and Space Electromagnetism
National Institute of Aeronautics and Space (LAPAN) Jl. DR. Djundjunan 133, Bandung 40173
E‐mail: [email protected]
Abstract
A large coronal mass ejection (CME) was occurred on July 10, 2005 08:54 UT at the South‐West solar limb. This was a partial type of CME as the ejected coronal plasma covered partially around the occulting disk of coronagraph. The Large Angle and Spectrometric Coronagraph (LASCO) aboard Solar and Heliospheric Observatory (SOHO) data were used in detecting CME. The data taken by the Extreme‐ultraviolet Imaging Telescope (EIT) as well as Michelson Doppler Imager (MDI) that observes the active regions in white‐light wavelength and maps the magnetic field of the photosphere are used to identify the source region of CME. The projected speed of CME perpendicular the Sun‐Earth line is determined to estimate the arrival time at the Earth’s orbit. The speed and location of the source region of CME are used to study the effect of CME to the Earth’s magnetosphere (geo‐effectiveness). It is concluded that the CME’s effect to the Earth’s space environment was relatively small (Dst index greater than –100 nT) due to the source region was located close to the West solar limb. This work supports the efforts in establishing space weather service at LAPAN.
Keywords: coronal mass ejection, geo‐effectiveness, space environment, space weather.
1. Introduction
The Sun is very dynamics in nature when it is seen in X‐ray or extreme
ultraviolet (EUV) [4]. There is a rapid change in minutes in active regions but there is
also a gradual change of solar corona globally more than one solar rotation (27.3 days)
as seen in EUV or X ray synoptic maps [2]. The intensity change of transient event such
a flare can be even as fast as in seconds order due to a sudden liberation of magnetic
energy of an active region into radiation in electromagnetic waves. Some large flares of
PROSIDING ISBN : 978‐979‐16353‐3‐2
Seminar Nasional Matematika dan Pendidikan Matematika Jurusan Pendidikan Matematika FMIPA UNY, 5 Desember 2009 1022
M or X class are accompanied with a huge coronal mass ejection (CME) that may
caused severely disturbance at the interplanetary space and the Earth’s space
environment as well [1, 5, 6, 7, 10]. In this case, the active region that releases a flare
with coronal mass ejection (CME) is the source region of CME.
A CME may be initiated by a dark filament at the solar disk or prominence
eruption at the solar limb. Instability in one or both of the foot points of filament may
init eruption of the filament, trigger further instability in the corona above the filament
and therefore cause ejection of solar coronal plasma. The dark filament or prominence
eruption plays an important role in triggering the coronal mass ejection in middle or
high latitude of the Sun. A dark filament may form at or close to or far from the active
regions. During a minimum phase of solar cycle in which the appearance of active
regions is very rare, dark filament or prominence eruption mostly controls the
occurrence of CME.
Other possible the source region of CME is a helmet streamer [12, 13]. This is a
coronal structure which looks like a helmet or dome with a tail structure at the top.
This structure may form over a large active region or outside the active region. The
helmet streamer that formed above an active region is the potential source region of a
powerful CME such as ‘halo’ type when it is directed to the Earth. Location of active
region that produced a CME at solar disk can be used to forecast whether a CME has a
strong impact to the Earth’s space environment or not [8, 11, 14].
Identifying the source region of a CME is very crucial as it will provide more
precise in forecasting the arrival of CME related disturbance at the Earth orbit. This is
part of space early warning system to be developed at LAPAN [3, 9,13]. Based on a
statistical study, a CME may reach the Earth as early as one day or longer up to 6 days.
It depends upon the position of the source region of CME in solar disk, its initial speed,
as well as mechanisms of acceleration or deceleration during its propagation in the
interplanetary space [7]. This work deals with analyzing a large CME at the South‐West
solar limb that occurred on July 10, 2005. The effects of this CME on the Earth’s space
environment will also be studied.

PROSIDING ISBN : 978‐979‐16353‐3‐2
Seminar Nasional Matematika dan Pendidikan Matematika Jurusan Pendidikan Matematika FMIPA UNY, 5 Desember 2009 1023
Section 2 provides observational data taken from the SOHO spacecraft, while
the methods in analyzing the data are given in section 3. Data processing and analysis
are provided in section 4, while the results and discussions are presented in section 5.
Finally, conclusion of the work is given in section 6.
2. Observations
SOHO spacecraft observes the Sun at multi‐wavelengths based on optical
imaging taken by the Large Angle and Spectrometric Coronagraph Experiment (LASCO)
and Michelson Doppler Imager (MDI), as well as extreme ultraviolet (EUV) taken by the
Extreme ultraviolet Imaging Telescope (EIT). LASCO is used to take images of outer
solar corona up to 30 solar radii. MDI observes the features at photosphere such as
active region (sunspot group) to follow its morphological evolution as well as mapping
the magnetic pattern of the Sun. The occurrence of CME is sensed by LASCO
instrument while EIT images are used to study the evolution of coronal structure which
can be used to find the source region of CME. EIT is able to detect a sudden increase in
intensity that may correspond to the occurrence of flare or coronal wave of CME.

PROSIDING ISBN : 978‐979‐16353‐3‐2
Seminar Nasional Matematika dan Pendidikan Matematika Jurusan Pendidikan Matematika FMIPA UNY, 5 Desember 2009 1024
Figure 1. A coronal mass ejection was observed by SOHO/LASCO‐C2 (left) and LASCO‐
C3 (right) at the South‐West solar limb on July 10, 2005. The angular span of
CME plasma is shown by lines in LASCO‐C3 image.
Figure 2. Soft X ray flux of GOES satellite showing a solar activity in July 9 – 11, 2005. A
possible sudden increase of X‐ray flux that may correspond to CME event is
shown by an arrow.
PROSIDING ISBN : 978‐979‐16353‐3‐2
Seminar Nasional Matematika dan Pendidikan Matematika Jurusan Pendidikan Matematika FMIPA UNY, 5 Desember 2009 1025
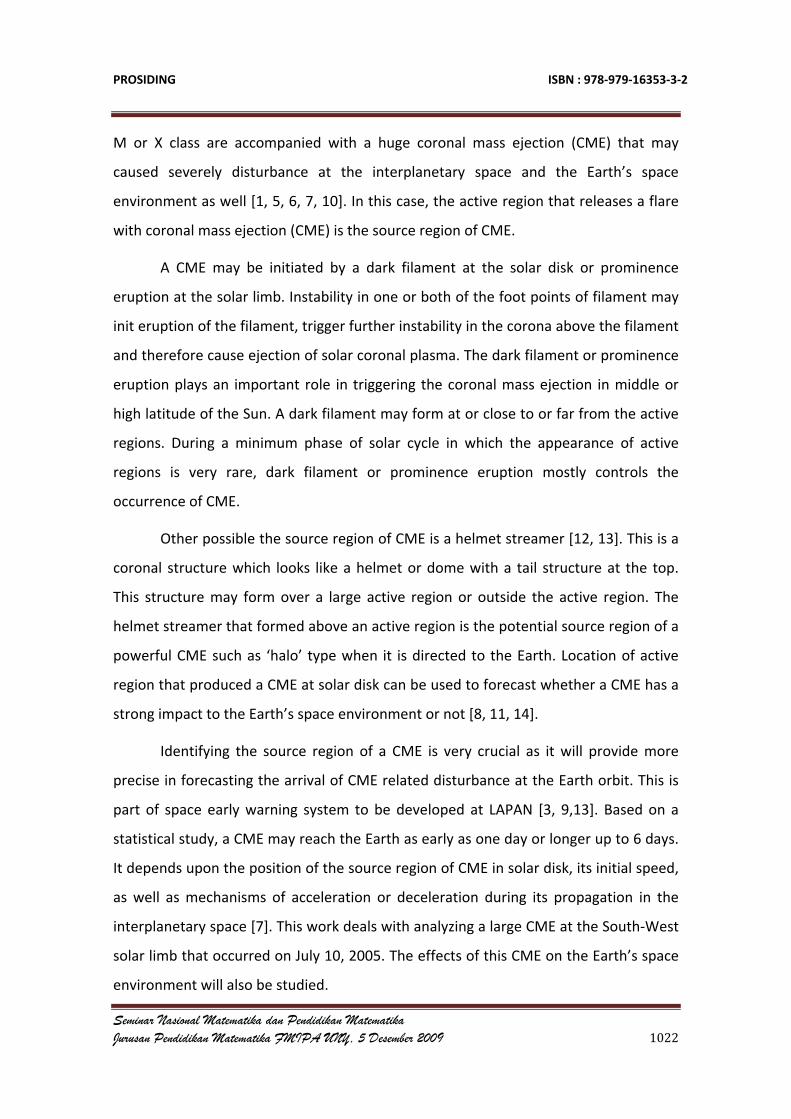
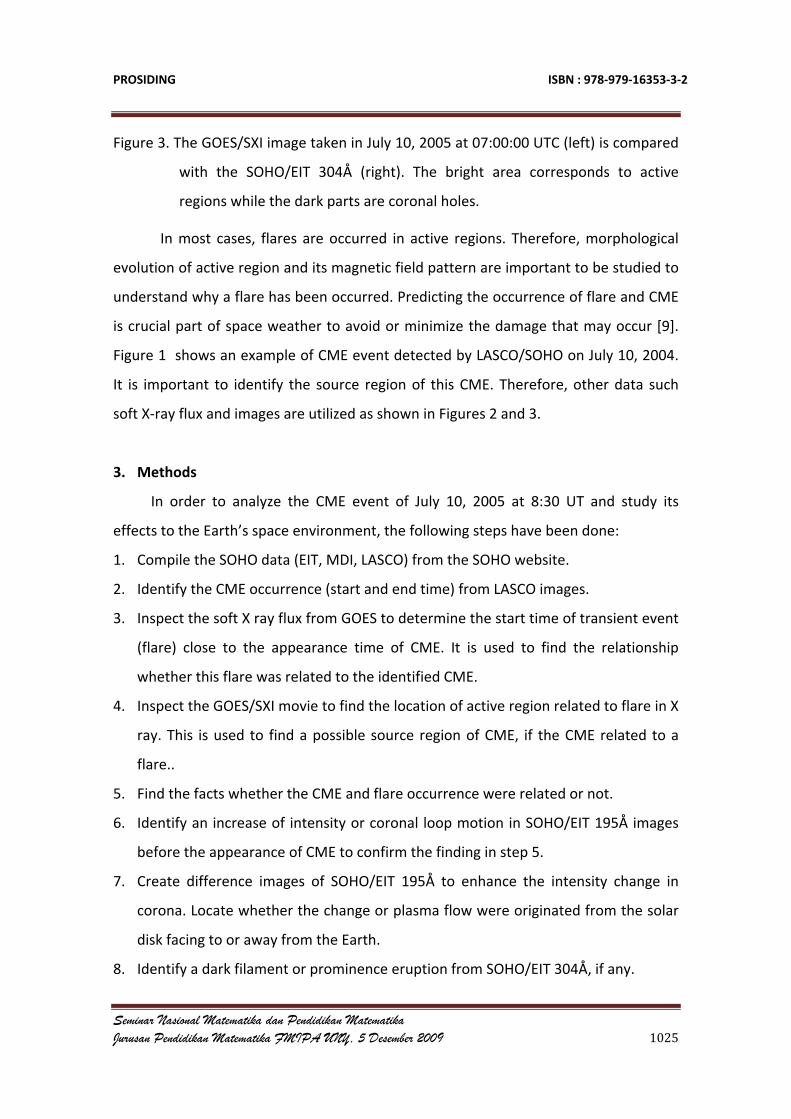
Figure 3. The GOES/SXI image taken in July 10, 2005 at 07:00:00 UTC (left) is compared
with the SOHO/EIT 304Å (right). The bright area corresponds to active
regions while the dark parts are coronal holes.
In most cases, flares are occurred in active regions. Therefore, morphological
evolution of active region and its magnetic field pattern are important to be studied to
understand why a flare has been occurred. Predicting the occurrence of flare and CME
is crucial part of space weather to avoid or minimize the damage that may occur [9].
Figure 1 shows an example of CME event detected by LASCO/SOHO on July 10, 2004.
It is important to identify the source region of this CME. Therefore, other data such
soft X‐ray flux and images are utilized as shown in Figures 2 and 3.
3. Methods
In order to analyze the CME event of July 10, 2005 at 8:30 UT and study its
effects to the Earth’s space environment, the following steps have been done:
1. Compile the SOHO data (EIT, MDI, LASCO) from the SOHO website.
2. Identify the CME occurrence (start and end time) from LASCO images.
3. Inspect the soft X ray flux from GOES to determine the start time of transient event
(flare) close to the appearance time of CME. It is used to find the relationship
whether this flare was related to the identified CME.
4. Inspect the GOES/SXI movie to find the location of active region related to flare in X
ray. This is used to find a possible source region of CME, if the CME related to a
flare..
5. Find the facts whether the CME and flare occurrence were related or not.
6. Identify an increase of intensity or coronal loop motion in SOHO/EIT 195Å images
before the appearance of CME to confirm the finding in step 5.
7. Create difference images of SOHO/EIT 195Å to enhance the intensity change in
corona. Locate whether the change or plasma flow were originated from the solar
disk facing to or away from the Earth.
8. Identify a dark filament or prominence eruption from SOHO/EIT 304Å, if any.

PROSIDING ISBN : 978‐979‐16353‐3‐2
Seminar Nasional Matematika dan Pendidikan Matematika Jurusan Pendidikan Matematika FMIPA UNY, 5 Desember 2009 1026
9. Determine the source region of CME using SOHO/EIT and SOHO/MDI [1].
10. Do measurement of the sky‐projected speed of CME [4, 5].
11. Determine the arrival time of CME at the Earth’s orbit.
12. Confirm the arrival time of CME at the Earth using Dst (Disturbance storm time)
index.
Construction of a movie from sequence of images taken by SOHO’s instrument
involves an alignment of the center position of the Sun at each image to avoid motion
in the movie caused by a jitter motion of the spacecraft. Suppose that the center of
solar disk of the first image is (Xo,Yo), the center position of the subsequence solar
images are represented as (X1,Y1), (X2,Y2), …, (Xn,Yn), where n is the number of
subsequence images. To align the images to the first one, the subsequence images
should be shifted to amount of ΔXi and ΔYi, as follows:
ΔXi = Xi – Xo
ΔYi = Yi – Yo where i=1, n. (1)
Note that the shift of image involves operation of all pixels. In this work, the size of
image is 512 x 512 pixels.
To enhance a weak flow in coronal images (EIT or LASCO), a difference
technique was utilized. A difference image was simply constructed from two images
taken in a close in time (less than 2 hours), where the second image was subtracted
from the first one.
4. Data processing and analysis
In order to find the source region of CME, the SOHO/EIT195Å and GOES/SXI are
utilized. The flow of coronal plasma seen in sequence images of EIT195Å may very
weak and therefore is difficult to be detected visually. In order to enhance this weak
flow, a technique namely “running difference” is used. In this method, the two
sequence images taken at relatively close in time are subtracted. An example of the
difference image taken by SOHO/EIT 195Å in July 10, 2005 at 08:48 UT is given in

PROSIDING ISBN : 978‐979‐16353‐3‐2
Seminar Nasional Matematika dan Pendidikan Matematika Jurusan Pendidikan Matematika FMIPA UNY, 5 Desember 2009 1027
Figure 4 (bottom‐left), along with the corresponding LASCO‐C2 difference image at
08:54 UT (bottom‐right). These two images fit each other in time sequence as the EIT
195Å represents lower part of corona while LASCO‐C2 image observes outer part of
corona. Their positions at the occulting disk of coronagraph (South‐West) also fit as
well. By measuring the width of CME in angle the center position can be estimated.
Careful inspection on two images reveals that the plasma flow did not obscure the
solar limb. This means that the flow was originated from a region behind the solar
limb. This active region was observed at the solar limb in July 8, 2005 as shown in
Figure 4 (top).
Figure 4. SOHO/EIT 195Å and GOES/SXT showing an active region at the South‐West
limb on July 8, 2005. The region released a CME on July 10, 2005. The
difference of EIT 195Å images that shows an enhance a weak plasma flow at
the South‐West limb close to solar surface (bottom‐left) and the difference
image of LASCO‐C2 that shows an ejection plasma at a large distance.

PROSIDING ISBN : 978‐979‐16353‐3‐2
Seminar Nasional Matematika dan Pendidikan Matematika Jurusan Pendidikan Matematika FMIPA UNY, 5 Desember 2009 1028
Low latitude CME is mostly related to active regions. Therefore, we need to seek
the active region that released the CME of July 10, 2005. Figure 4 (upper) shows
SOHO/EIT 195Å image taken on July 8, 2005 at 08:00 UT (left) and GOES/SXI at 01:00
UTC (right). The position of active region that may release a CME two days later (July
10) is indicated by a box located at the South‐West solar limb. This position is fit well
with the position of the center of CME shown in Figure 4 (bottom‐right). From these
facts, it is concluded that the source region of CME on July 10, 2005 was an active
region. Probably, a flare was occurred accompanied with CME.
Figure 5. Measurement of the height of the CME loop top (+ sign) relative to the center
of the Sun (the center of coordinate) based on LASCO‐C3 difference images.
The occulting disk is disappeared in the difference image.
5. Results and discussions
In this section, we provide the results of analyzing the CME events on July 10,
2005, as well as discussions. Identification of the source region of CME is crucial part in
analyzing the effects of CME on the Earth’s magnetosphere. A CME is ejection of
magnetized plasma solar corona in nature and it will turn into an interplanetary
coronal mass ejection (ICME) during its propagation in the interplanetary space. The
CME trajectory in general follows the solar magnetic field lines in the interplanetary
space which has a spiral‐like pattern. The speed of CME may as low as 10 km/s up to

PROSIDING ISBN : 978‐979‐16353‐3‐2
Seminar Nasional Matematika dan Pendidikan Matematika Jurusan Pendidikan Matematika FMIPA UNY, 5 Desember 2009 1029
2400 km/s for a super‐fast CME. In order to study the effects of CME on
magnetosphere, determination of CME speed is required. This can be performed by
measurements of the CME loop tops in the difference image of LASCO‐C2 sequentially
as shown in Figure 6. The results of the measurements of the loop top are given in
Figure 6: (a,b) positions of the loop top in X and Y axis (a,b); the height of the loop top
relative to the center of the Sun (c); and the final projected speed in the sky plane (d).
The initial speed when the CME appeared at the LASCO‐C3 was 500 km/s. There was
an acceleration of the CME plasma at the first one hour to 700 km/s and then
decreased gradually during the next 2.5 hours to about 400 km/s. Other acceleration
was occurred about two hours later to reach a top speed of about 900 km/s. The CME
plasma was decreased again to about 700 km/s. This is the final speed as the CME loop
top was dimmed before reached the outer boundary of the field of view of LASCO‐C3
coronagraph.
Figure 6. Determination of CME speed projected to the sky plane based on the
measurements of the loop top positions. The final speed is accounted to
about 700 km/s.

PROSIDING ISBN : 978‐979‐16353‐3‐2
Seminar Nasional Matematika dan Pendidikan Matematika Jurusan Pendidikan Matematika FMIPA UNY, 5 Desember 2009 1030
Figure 7. The Dst index showed a decrement after the observed CME on July 10, 2005
at about 08:30 UT. Though, the peak was greater than ‐100 nT indicating
that the CME’s effect on the Earth’s magnetosphere was minor.
In order to estimate the arrival time of CME at the Earth’s orbit, the average
distance of Sun‐Earth of 150 millions km is assumed. Furthermore, there was no
acceleration and deceleration during its propagation in the interplanetary space, the
arrival time of CME at the Earth’s orbit is about 2.5 days since it launched from the
Sun. The actual CME speed toward the Earth may smaller than 700 km/s and therefore
the traveling time of CME may be longer (about 3 days). Based on the global index of
magnetic field (Disturbance storm time/Dst) compiled by World Data Center for
Geomagnetism, Kyoto University, the decrease in Dst index was occurred in July 13 as
show by arrow in Figure 7.
6. Conclusion
We have described the methods and analysis of the CME event that occurred on
July 10, 2005 at about 8:48 UT. The source region of CME was located at the unseen
hemisphere or behind the South‐West solar limb. The CME was related to an active
region, a possibly a flare, although it can not be detected directly by X‐ray flux of GOES.
The effect of this CME was minor as shown by Dst index ( greater than ‐100 nT).
Therefore, it is concluded that the CMEs located at West solar limb cause a minor
geomagnetic storm. This conclusion can be applied to a space weather service at

PROSIDING ISBN : 978‐979‐16353‐3‐2
Seminar Nasional Matematika dan Pendidikan Matematika Jurusan Pendidikan Matematika FMIPA UNY, 5 Desember 2009 1031
LAPAN, meaning that if there is a CME at the West limb in the future, a space alert will
not be necessary issued to public.
Acknowledgements
Author thanks to the team of SOHO and GOES spacecrafts. SOHO is an
international project between ESA and NASA. GOES is operated by NOAA for space
weather program.
References
1. Anwar, B. Identifying the Source Disturbance of Geomagnetic Storm, Digital Information & System Conference (DISC), Maranatha Christian University, October 3, 2009, Bandung, 2009h.
2. Anwar, B. Construction of EUV Synoptic Maps of Solar Corona, Digital Information & System Conference (DISC), Maranatha Christian University, October 3, 2009, Bandung, 2009g.
3. Anwar, B. Monitoring High‐Speed Particle Stream from Equatorial Coronal Hole, Post‐Graduate National Seminar, Surabaya Institute of Technology, August 12, 2009, Surabaya, 2009f.
4. Anwar, B. Noise Removal of LASCO Images Using Median Filter, National Seminar in Mathematics, Faculty of Mathematics and Natural Sciences, Surabaya State University, August 8, 2009, Surabaya, 2009e.
5. Anwar, B. Determination of Final Speed of Coronal Mass Ejection, Proc. National Seminar in Mathematics, Faculty of Mathematics and Natural Sciences, Surabaya State University (UNESA), June 20, 2009, Surabaya, 2009d.
6. Anwar, B. Identifying the Source Region of Coronal Mass Ejection, Proc. National Seminar in Mathematics and Natural Sciences, Faculty of Mathematics and Natural Sciences, Satyawacana Christian University (UKSW), June 13, 2009, Salatiga, 2009c.
7. Anwar, B. Automatic Detection of Coronal Mass Ejection, Proc. National Seminar in Mathematics and Natural Sciences, Faculty of Mathematics and Natural Sciences, May 16, 2009, Yogyakarta State University, Yogyakarta, 2009b.
8. Anwar, B. Monitoring the Sun for Space Weather, Proc. National Seminar in Education Mathematics (LSM XVII), April 4, 2009, Faculty of Mathematics and Natural Sciences, Yogyakarta State University, 2009a.
9. Anwar, B. Development of Database System for Space Early Warning, Proc. National Seminar in Science and Technology II, 17‐18 November 2008, Lampung University, p.18.
PROSIDING ISBN : 978‐979‐16353‐3‐2
Seminar Nasional Matematika dan Pendidikan Matematika Jurusan Pendidikan Matematika FMIPA UNY, 5 Desember 2009 1032
10. Bothmer, V. and Daglis, I.A. Space Weather, Physics and Effects, Springer‐Praxis Publishing, 2007.
11. Lanzerotti, L.J. Space Weather Effects on Technologies, in “Space Weather”, Song, P., Singer, H.J. and Siscoe, G.L. (Eds), Geophysical monograph, 125, 2001, p.11.
12. Setiahadi, B. Problems of Equilibria and Instabilities on Solar Coronal Magnetic Fields and Its Evolution Towards Energetic Energy Liberation: Effect to Interplanetary Space, Prosiding Seminar Nasional Matematika, FMIPA UNDIP, 2005, E1., p.1.
13. Setiahadi, B., Sakurai, T., Miyazaki, H., and Hiei, E. Research on Magnetohydrodynamic Transport Phenomena in Solar‐Terrestrial Space at LAPAN Watukosek 2006, Prosiding Seminar Antariksa Nasional III, 2006, p. 17.
14. Singer, H.J., Heckman, G.R. and Hirman, J.W. Space Weather Forecasting: A Grand Challenge in “Space Weather”, Song, P., Singer, H.J. and Siscoe, G.L. (Eds), Geophysical monograph, 125, 2001, p.11.