Embed Size (px)
Citation preview

Analytics: Server Architect (Siebel 7.7)
Activity Guide
June 2005Part # 10PO2-ASAX-07710
D44608GC10
Edition 1.0
D44919
®

Copyright © 2005, 2006, Oracle. All rights reserved.
Disclaimer
This document contains proprietary information and is protected by copyright and other intellectual property laws. You may copy and print this document solely for your own use in an Oracle training course. The document may not be modified or altered in any way. Except where your use constitutes "fair use" under copyright law, you may not use, share, download, upload, copy, print, display, perform, reproduce, publish, license, post, transmit, or distribute this document in whole or in part without the express authorization of Oracle.
The information contained in this document is subject to change without notice. If you find any problems in the document, please report them in writing to: Oracle University, 500 Oracle Parkway, Redwood Shores, California 94065 USA. This document is not warranted to be error-free.
Restricted Rights Notice
If this documentation is delivered to the United States Government or anyone using the documentation on behalf of the United States Government, the following notice is applicable:
U.S. GOVERNMENT RIGHTSThe U.S. Government’s rights to use, modify, reproduce, release, perform, display, or disclose these training materials are restricted by the terms of the applicable Oracle license agreement and/or the applicable U.S. Government contract.
Trademark Notice
Oracle, JD Edwards, PeopleSoft, and Siebel are registered trademarks of Oracle Corporation and/or its affiliates. Other names may be trademarks of their respective owners.

Analytics: Server Architect (Siebel 7.7)
i
Table of Contents
Lab 1-1: ABC Background ..................................................................................1 Lab 1-2: Gather Information to Start Building an Initial Business Model .............7 Lab 1-3: Verifying and Testing a Data Source ..................................................10 Lab 1-4: Importing a Data Source .....................................................................14 Lab 1-5: Defining Keys and Joins .....................................................................21 Lab 2-1: Defining the Repository Logical Structure...........................................27 Lab 2-2: Building Simple Fact Measures ..........................................................33 Lab 3-1: Customizing the Presentation Catalog................................................39 Lab 4-1: Testing the Repository ........................................................................45 Lab 4-2: (Optional Lab) Checking Consistency.................................................55 Lab 5-1: Importing Additional Product Tables ...................................................61 Lab 5-2: Creating Multiple Sources for a Logical Table Source (Manual) .........64 Lab 5-3: Creating Multiple Sources for a Logical Table Source (Automated) ...66 Lab 5-4: Specifying the Most Economical Source.............................................71 Lab 6-1: Creating Calculation Measures Using Logical Columns .....................77 Lab 6-2: Creating Calculation Measures Using Physical Columns ...................81 Lab 6-3: Creating Calculation Measures Using the Calculation Wizard ............85 Lab 7-1: Creating Dimensional Hierarchies ......................................................93 Lab 7-2: Creating Level-Based Measures.......................................................102 Lab 7-3: Defining Share and Rank Measures .................................................108 Lab 8-1: Using Aggregate Tables ...................................................................113 Lab 9-1: Modeling a Value-Based Partition.....................................................127 Lab 10-1: Using Dynamic Repository Variable .................................................139 Lab 11-1: Creating Comparison Measures .......................................................147

Analytics: Server Architect (Siebel 7.7)
ii
Lab 11-2: Testing the Comparison Measures and Calculations........................152 Lab 12-1: Modeling the Physical Layer for the Slowly Changing Dimension ....157 Lab 12-2: Modeling the Logical Layer for the Slowly Changing Dimension ......164 Lab 12-3: Modeling the Presentation Layer for the Slowly Changing
Dimension.........................................................................................167 Lab 13-1: Modeling a Dimension Extension Table............................................171 Lab 13-2: Modeling a Fact Extension Table......................................................177 Lab 14-1: Creating Users and Groups ..............................................................185 Lab 14-2: Assigning Permissions to Users .......................................................190 Lab 14-3: Authenticating Using an External Database......................................195 Lab 14-4: Setting Query Limits and Timing Restrictions ...................................202 Lab 15-1: Inspecting Cache Files......................................................................207 Lab 15-2: Modifying Cache Parameters............................................................212

Module 1: Building the Physical Layer of a Repository
Analytics: Server Architect (Siebel 7.7) 1
Lab 1-1 ABC Background
Goals Read the ABC document to become familiar with the business scenario for the fictitious company used throughout the course.
Time 10 – 15 minutes
Instructions: Read the following ABC document:

Module 1: Building the Physical Layer of a Repository
2 Analytics: Server Architect (Siebel 7.7)
ABC Business Scenario ABC sells food and non-food items to restaurant chain customers throughout the United States. ABC is looking for a way to enable its current employees (especially experienced sales staff and operations managers) to ask their most pertinent business questions themselves. ABC believes that up-to-date sales performance monitoring, especially if it can be made exception-driven, will enable the company to better focus its management and customer service efforts. ABC also has the vision of making this data directly available to customers so they can better analyze their purchase history and compare it to what is being purchased nationally. ABC’s management feels that this added value will set them apart from their competitors and result in additional sales.
You are a consultant, hired by ABC to implement its business analysis. From your initial interviews with managers, you obtain the following information about ABC:
• Managers want use their own information to answer about the sales history of their products, the buying history of their customers, the order fulfillment performance of their operations group, and the selling performance of the sales force.
• The company has little experience in data analysis and they do not expect to hire any data analysts in the future. They want to be able to ask the relevant questions themselves without being required to learn more about computers.
• The database has about 350,000 invoice-level records (the “grain” of the database). To make this kind of information widely available within the enterprise, it must have a structure consistent with the way employees think about the business.
From further interviews and examination of existing sample reports presenting invoice-based data, you determine the following:
• ABC employees think about their business in terms of sales, products and product hierarchies, time periods, and customer-sales force relationships.
• There are five levels of products. From the bottom (most detailed) level to the top, they are: o Specific Product o Generic Product o Sub-Type o Type o Total
• Many existing reports contain data presented at these levels. An example would be: (Product) Type = Cheese, (Product) Sub-Type = American Cheese, and Product = American Cheese Slices.

Module 1: Building the Physical Layer of a Repository
Analytics: Server Architect (Siebel 7.7) 3
• There are five levels in the customer-sales organization. These levels mirror organizational management responsibilities. From the bottom, they are:
o Customer o Sales Representative o District o Region o Total
• The time reporting periods are: o Day o Month o Year o Total time
In addition to these hierarchies, ABC would like to group customers using geographical attributes like Zip Code, City, and State. Likewise, they would like to analyze products by characteristics such as Diet Type and Suppliers.
The commonly reported measures are dollar sales, units ordered, units shipped, and net weight shipped. Another important measure for order fulfillment is “cuts,” the difference between the units ordered and units shipped (units ordered – units shipped). Operations management tracks this since cuts equals lost sales, and operations management is responsible for minimizing cuts.
ABC would like to look at all these measures at all levels of the hierarchy; by the important product and customer attributes, by the various time periods; and compare these with previous years.
Source Data From interviewing the data administrators and examining documents they provide, you learn that the source data resides in the invoice system on a Microsoft SQL server. The data is at the invoice level.
In addition to the invoice information, there are various tables that provide information on customers, the product lines, the time periods, and the relationship between customers and the company’s sales organization.
It appears as though relevant data comes from the following tables, which exist in the invoice schema:
The following are examples of data in some of the tables. D1_products

Module 1: Building the Physical Layer of a Repository
4 Analytics: Server Architect (Siebel 7.7)
D1_product_type

Module 1: Building the Physical Layer of a Repository
Analytics: Server Architect (Siebel 7.7) 5
D1_product_subtype
D1_customer2

Module 1: Building the Physical Layer of a Repository
6 Analytics: Server Architect (Siebel 7.7)
D1_Orders2

Module 1: Building the Physical Layer of a Repository
Analytics: Server Architect (Siebel 7.7) 7
Lab 1-2 Gather Information to Start Building an Initial Business Model
Goals To gather business data to design the business model.
Scenario You are the server architect, and you need to build the business model. Following the recommended implementation methodology, gather information necessary to accomplish the tasks in the Define and Discover stages to develop the initial business model design.
Outcome Some modeled data requirements.
Time 10 – 15 minutes
Instructions:
Use the information in the ABC document to help you determine the following information, which you will need to implement the business model.
1. What measures (facts) does ABC wish to report on?
2. What hierarchies can you identify?
3. Against which attributes (dimensions) does ABC want to analyze their facts?
4. By which additional attributes does ABC want to analyze products?

Module 1: Building the Physical Layer of a Repository
8 Analytics: Server Architect (Siebel 7.7)
5. By which geographical attributes does ABC want to analyze data?
6. Complete the following diagram with your identified facts and dimensions:
(Facts)
(Dimension)
(Dimension) (Dimension)

Module 1: Building the Physical Layer of a Repository
Analytics: Server Architect (Siebel 7.7) 9
Solutions 1-2 Gather Information to Start Building an Initial Business Model
Answers
1. What measures (facts) does ABC wish to report on? Dollar sales, Units Ordered, Units Shipped, Net Weight Shipped, Cuts
2. What hierarchies can you identify? Product, Time (Period), Customer/Sales Rep
3. Against which attributes (dimensions) does ABC want to analyze their facts? Product, Time (Period), Customer
4. By which additional attributes does ABC want to analyze products? Supplier, Diet Type
5. By which geographical attributes does ABC want to analyze data? Zip Code, City, State
6. Complete the following diagram with your identified facts and dimensions:
Sales
Time Period
Customer Product
Module 1: Building the Physical Layer of a Repository
10 Analytics: Server Architect (Siebel 7.7)
Lab 1-3 Verifying and Testing a Data Source
Goals To verify connectivity to an Open Database Connectivity (ODBC) Data Source and test it using the Analytics Client.
Scenario ABC has just finished designing the business model, and the team has identified that the physical data to support the business model resides in a Microsoft SQL Server supplier2 database. You will first verify the connection to the supplier2 database using the ODBC Data Sources Administrator in order to import the schemas into the repository, and then test the connectivity using the Analytics ODBC Client.
Outcome Verified ABC ODBC data source connectivity.
Time 5 – 10 minutes
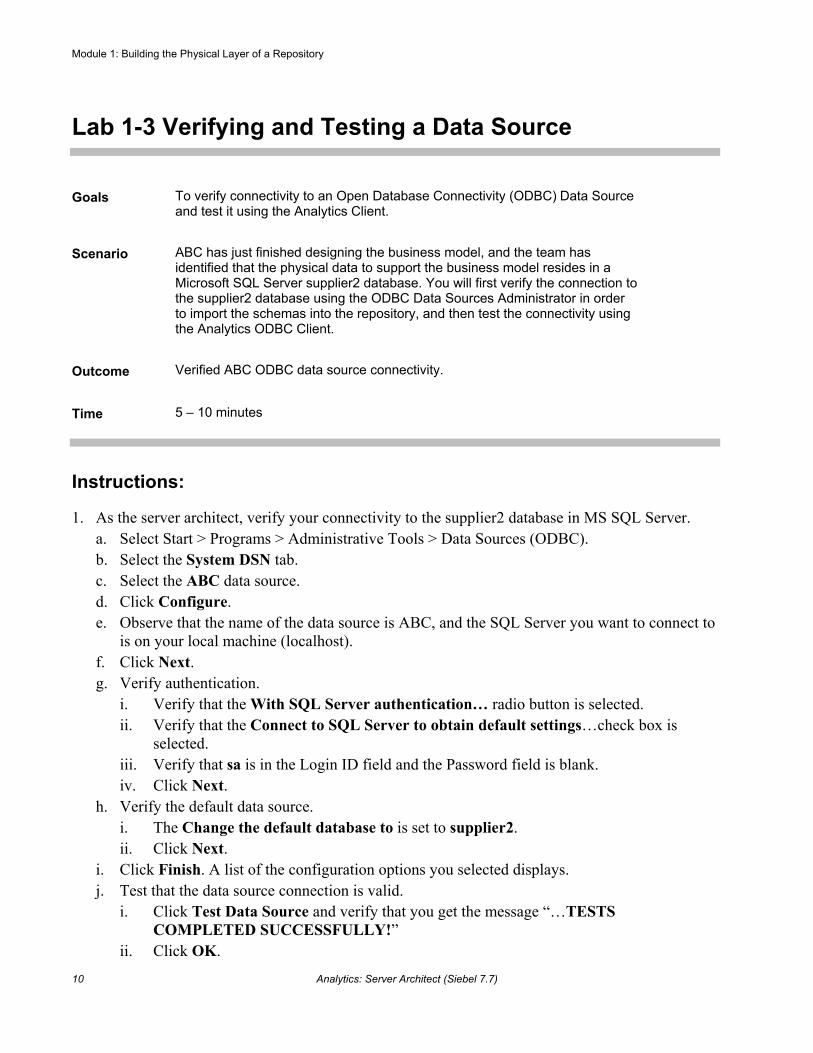
Instructions:
1. As the server architect, verify your connectivity to the supplier2 database in MS SQL Server. a. Select Start > Programs > Administrative Tools > Data Sources (ODBC). b. Select the System DSN tab. c. Select the ABC data source. d. Click Configure. e. Observe that the name of the data source is ABC, and the SQL Server you want to connect to
is on your local machine (localhost). f. Click Next. g. Verify authentication.
i. Verify that the With SQL Server authentication… radio button is selected. ii. Verify that the Connect to SQL Server to obtain default settings…check box is
selected. iii. Verify that sa is in the Login ID field and the Password field is blank. iv. Click Next.
h. Verify the default data source. i. The Change the default database to is set to supplier2. ii. Click Next.
i. Click Finish. A list of the configuration options you selected displays. j. Test that the data source connection is valid.
i. Click Test Data Source and verify that you get the message “…TESTS COMPLETED SUCCESSFULLY!”
ii. Click OK.

Module 1: Building the Physical Layer of a Repository
Analytics: Server Architect (Siebel 7.7) 11
iii. Click OK again. iv. Click OK to close the ODBC Data Source Administrator.
2. Test the connection to the ABC ODBC data source using the Siebel Analytics ODBC Client tool. Note: Siebel Analytics ODBC Client Tool is an administrator tool that provides an environment for testing connectivity to physical data sources. However, this can be accomplished using any ODBC-compliant tool.
a. Select Start > Programs > Siebel Analytics > Siebel Analytics ODBC Client. b. Select File > Open Database. c. In the DSN field, use the drop-down list to select ABC. d. In the UID (user ID) field, type sa (no password).
e. Click OK.
3. Now that you have connected successfully to the ABC data source, view the schema for supplier2. a. Select Utility > View Schema. b. In the Database Tables field, select the D1_Calendar2 table. What happens?
c. In the Columns in the Current Table field, scroll down to select the Month_in_Year column. What happens?
d. Review the attributes of the Month_in_Year column. i. What is the column Type?
ii. Is this a required column?

Module 1: Building the Physical Layer of a Repository
12 Analytics: Server Architect (Siebel 7.7)
e. Close the Database Schema window.
4. Use the schema information just gathered to issue a query directly to the supplier2 database. a. Select Utility > Enter SQL Query. b. Create a query to request the number of distinct months in a year. In the SQL Statement
Editor, type the SQL statement SELECT distinct month_in_year FROM d1_calendar2.
c. Click Execute. Check your results:
Note: Executing the SQL and generating the results above proves that you have connected to the supplier2 database schema successfully through your ABC ODBC data source.
5. Select File > Exit to exit the Siebel Analytics ODBC Client.

Module 1: Building the Physical Layer of a Repository
Analytics: Server Architect (Siebel 7.7) 13
Solutions 1-3 Verifying and Testing a Data Source
Answers
3.b. In the Database Tables field, select the D1_Calendar2 table. What happens? The columns in this table display in the Columns in the Current Table field.
3.c. In the Columns in the Current Table field, scroll down to select the Month_in_Year column. What happens? The attributes of this column display in the attributes of the Current field.
3.d.i. What is the column Type? A small integer, or SMALLINT
3.d.ii. Is this a required column? No

Module 1: Building the Physical Layer of a Repository
14 Analytics: Server Architect (Siebel 7.7)
Lab 1-4 Importing a Data Source
Goals To create a new repository and import the table schemas from an external data source.
Scenario You verified the connection to ABC’s supplier2 database by testing your connectivity using the Analytics ODBC Client. Now, you are ready to create a new repository and import the supplier2 schema into the Physical layer of the repository using the Administration Tool.
Outcome New ABC.rpd file containing D1_Calendar2, D1_customer2, D1_Orders2, and D1_products tables in the Physical layer.
Time 10 – 15 minutes
Instructions:
Before you import the table schema into the Physical layer of the repository, examine the tables and keys defined in the supplier2 MS SQL database, using MS SQL Server Administration utilities.
1. Select Start > Programs > Microsoft SQL Server > Enterprise Manager.
2. Examine the supplier2 database table object. a. Expand Microsoft SQL Servers. b. Expand SQL Server Group. c. Expand (local) (Windows NT). d. Expand Databases.

Module 1: Building the Physical Layer of a Repository
Analytics: Server Architect (Siebel 7.7) 15
e. Expand supplier2.
3. Examine the properties of the D1_Calendar2 table in the supplier2 database. a. Click the Tables icon. b. In the right pane, double-click the D1_Calendar2 table. The Table Properties dialog box
appears:

Module 1: Building the Physical Layer of a Repository
16 Analytics: Server Architect (Siebel 7.7)
c. What column is the primary key constraint defined on?
d. How many rows are in this table?
e. Scroll down and examine the table columns. f. Click Cancel to close the Table Properties window.
4. Examine the properties of D1_customer2 table in the supplier2 database. a. In the right pane, double-click the D1_customer2 table. The Table Properties dialog box
appears:
b. Is there a primary key constraint defined on this table?
c. How many rows are in this table?
d. Scroll down and examine the table columns. e. Click Cancel to close the Table Properties window.

Module 1: Building the Physical Layer of a Repository
Analytics: Server Architect (Siebel 7.7) 17
5. Repeat this process for the following tables, answering the questions below for each table you examine: Table Name
D1_Orders2
D1_products a. Is there a primary key constraint defined on D1_Orders2?
b. Is there a primary key constraint defined on D1_products?
c. Click Cancel to close the Table Properties window. d. Select Console > Exit to close Enterprise Manager.
6. Create a new repository file for ABC. a. Select Start > Programs > Siebel Analytics > Siebel Analytics Administration. b. Select File > New. c. To name the repository, enter ABC in the File name field and click Save.
7. Import ABC’s table schemas from the supplier2 database. a. Select File > Import > from Database. b. Scroll down to select ABC:
c. In the User Name field, verify that sa is the value and leave the Password field blank. d. Click OK. The Import dialog box opens. e. Expand the supplier2 folder. f. Expand the dbo folder.

Module 1: Building the Physical Layer of a Repository
18 Analytics: Server Architect (Siebel 7.7)
g. Select the following tables to import the table schemas into the Physical layer to build ABC’s initial business model: Note: Click the first table (to deselect any parent objects), and then use CTRL + click to select the remaining tables. Physical Table Name
D1_Calendar2
D1_customer2
D1_Orders2
D1_products Note: At import, you can specify the type of metadata to import. The default is to import tables, primary keys, and foreign keys. Only import objects needed for query generation.
h. Verify that the check boxes for Tables, Keys, and Foreign Keys are selected. i. Verify that ABC, supplier2, and dbo objects are not selected, before you click the Import
button. j. Click Import. The metadata is imported into the Physical layer of the Administration Tool
and the data source appears in the Physical layer. k. When the import is completed, click Close. l. To display the tables, expand the ABC data source, expand the supplier2 catalog icon, and
expand the dbo schema icon. m. Verify that four tables imported successfully in the dbo folder.
8. Verify the connection pool for ABC’s data source. a. Double-click the Connection Pool object. b. Modify the connection pool using the following values:
Name SUPPLIER CP Data source name ABC User name sa Password
c. Click OK. d. Click OK to confirm the blank password. e. Why would you create more than one Connection Pool for a single data source?
9. Perform a visual check to verify that the only key imported automatically into the schema was defined on the D1_Calendar2 table. Expand the folder for each table in the schema looking for the icon next to the columns; this icon indicates that this column is a key column. a. Click + (plus) to expand D1_Calendar2 table. b. Observe the YYYYMMDD column.

Module 1: Building the Physical Layer of a Repository
Analytics: Server Architect (Siebel 7.7) 19
c. Collapse D1_Calendar2. d. Expand the D1_customer2 table. e. Was a key automatically imported for D1_customer2?
f. Collapse D1_customer2. g. Expand the D1_Orders2 table. h. Was a key automatically imported for D1_Orders2?
i. Collapse D1_Orders2. j. Expand the D1_products table. k. Was a key automatically imported for D1_products?
l. Collapse D1_products.
10. Save the repository. a. Select File > Save. b. Click No to check Global Consistency.
Note: Check Global Consistency checks for errors in the entire repository. Some of the more common checks are done in the Business Model and Mapping and Presentation layers. Since these layers are not defined yet, bypass this check until the other layers in the repository are built.
11. Remain logged in to the Siebel Analytics Administration Tool for the next lab.

Module 1: Building the Physical Layer of a Repository
20 Analytics: Server Architect (Siebel 7.7)
Solutions 1-4 Importing a Data Source
Answers
3.c. What column is the primary key constraint defined on? YYYYMDD
3.d. How many rows are in this table? 474
4.b. Is there a primary key constraint defined on this table? No
4.c. How many rows are in this table? 136
5.a. Is there a primary key constraint defined on D1_Orders2? No
5.b. Is there a primary key constraint defined on D1_products? No
8.e. Why would you create more than one Connection Pool for a single data source? To give certain users more immediate access to data over other users
9.e. Was a key automatically imported for D1_customer2? No
9.h. Was a key automatically imported for D1_Orders2? No
9.k. Was a key automatically imported for D1_products? No

Module 1: Building the Physical Layer of a Repository
Analytics: Server Architect (Siebel 7.7) 21
Lab 1-5 Defining Keys and Joins
Goals To manually define the primary keys, foreign keys, and joins in the Physical layer using the Siebel Analytics Administration Tool.
Scenario You have just created a new repository and imported the initial supplier2 table schemas into the Physical layer of the repository. Now, you need to define the primary keys, foreign keys, and joins in the Physical layer manually, because the only key automatically defined was the primary key on D1_Calendar2 table. You will define the keys and join conditions in the other tables used for the business model manually, using the Physical Diagram feature of the Administration Tool.
Outcome Keys and joins defined on the physical tables.
Time 15 – 20 minutes
Instructions:
You should still be logged in to the Siebel Analytics Administration Tool.
1. Before you begin defining the keys and joins manually, examine the key defined on D1_Calendar2. Double-click the D1_Calendar2 table. a. Select the Keys tab. b. Double-click PK_D1_Calendar2 key. The Physical Key dialog box opens. c. What is the physical key column for this table?
d. How was the key defined automatically for this table?
e. Click Cancel. f. Select the Foreign Keys tab. g. Is there a physical foreign key column for this table?
h. Click Cancel.

Module 1: Building the Physical Layer of a Repository
22 Analytics: Server Architect (Siebel 7.7)
Note: In the next steps, you will define keys and joins using two techniques. The first technique allows you to create primary keys on tables using the Physical Table properties dialog box. The second technique allows you to create both joins and foreign keys on the table using the Physical Diagram view.
2. In the following steps, you will use the first technique—using the Physical Tables properties—to configure the primary key on the D1_Orders2 table. The primary key for D1_Orders2 is made up of multiple columns, called a compound key (ProdKey, PeriodKey, and CustKey) used to uniquely identify a row in a table. a. In the Physical layer, double-click the D1_Orders2 table. b. Select the Keys tab. c. Click New. The Physical Key dialog box opens. d. Select the check boxes for the following columns:
Column Name
ProdKey
PeriodKey
CustKey
e. Click OK to close the Physical Key dialog box. Note: Even though you have selected three columns, only one will appear in this dialog box.
f. Click OK to close the Physical Table window.
3. Verify that the three columns (CustKey, PeriodKey, and ProdKey) display the Primary Key icon in the Physical layer.
Note: You may have noticed that the Primary Key icons appear only in the Physical layer. They did not appear in the Physical table dialog box in a prior step.
a. Collapse the D1_Orders2 table.
4. Using the second technique in the following steps, you will define joins and foreign keys using the Physical Diagram view. a. Right-click the ABC data source and select Physical Diagram > [any option] to open the
Physical Diagram view. b. Drag the table objects so they are all visible. c. The first join you will create will define the relationship between D1_Calendar2 and
D1_Orders2. The join you create will represent the following relationship between these tables: D1_Calendar2 has a one-to-many relationship with D1_Orders2.

Module 1: Building the Physical Layer of a Repository
Analytics: Server Architect (Siebel 7.7) 23
i. Click the New Foreign Key button on the toolbar.
ii. Click the D1_Calendar2 table, and then click the D1_Orders2 table.
Note: It matters which table you click first. The join is creating a one-to-many (1:N) relationship that joins the primary key column in the first table to a column that is a foreign key in the second table.
iii. Select the columns that join the tables. Select the D1_Calendar2.YYYYMMDD column, and then select the D1_Orders2.PeriodKey. Verify that the Expression edit box (bottom) contains the following expression:
iv. Click OK. v. Observe the 1:N relationship between D1_Calendar2 and D1_Orders2 represented in
the Physical Diagram view:
6. Repeat the process you just completed and create joins and foreign keys for the other tables. Note: As you create the joins, a message will appear, asking you to create a column as a ‘key column’ on the first table, which is necessary to create the relationship to the foreign key column in the second table. When you see this message, click Yes.
a. Create the joins based on the expressions listed below. The join is creating a one-to-many
(1:N) relationship that joins the key column in the first table to a column that is a foreign key in the second table.
Note: Verify that each Expression edit box contains the following expression:
D1_customer2.NewKey = D1_Orders2.CustKey
D1_products.ProductKey = D1_Orders2.ProdKey

Module 1: Building the Physical Layer of a Repository
24 Analytics: Server Architect (Siebel 7.7)
b. Observe the Physical Diagram:
c. Close the Physical Diagram window.
7. Observe some additional options for viewing the physical table diagram. Right-click D1_Calendar2 table and select Physical Diagram > Object(s) and Direct Joins.
a. Observe the Physical Diagram:
b. Close the Physical Diagram window. c. Repeat this process for D1_Orders2 table, by selecting Physical Diagram > Object(s) and
Direct Joins for D1_Orders2 table. Why are ALL of the tables visible in the diagram with D1_Orders2?
d. Close the Physical Diagram window.
8. Select File > Exit to exit the Siebel Analytics Administration Tool. 9. Click Yes to save changes.

Module 1: Building the Physical Layer of a Repository
Analytics: Server Architect (Siebel 7.7) 25
Solutions 1-5 Defining Keys and Joins
Answers
1.c. What is the physical key column for this table? YYYYMMDD
1.d. How was the key automatically defined for this table? The key was defined in the source database (supplier2) as a primary-key constraint, created automatically during the import schema process. Note: The metadata-type Tables, Keys, and Foreign Keys were enabled during the import process.
1.g. Is there a physical foreign key column for this table? No
7.c. Why are ALL of the tables visible in the diagram with D1_Orders2? All of the tables have a one-to-many relationship with D1_Orders2.

Module 1: Building the Physical Layer of a Repository
26 Analytics: Server Architect (Siebel 7.7)

Module 2: Building the Business Model Layer of a Repository
Analytics: Server Architect (Siebel 7.7) 27
Lab 2-1 Defining the Repository Logical Structure
Goals To create the logical structure of the repository.
Scenario ABC is now ready to build the initial business model to analyze the Supplier Sales information. You are ready to define the logical business model of the repository. This specifies the mapping between the Business Model and Mapping layer and the Physical layer.
Outcome In the Business Model and Mapping layer, the SupplierSales business model with Periods, Customers, Products, and SalesFacts logical tables.
Time 15 – 20 minutes
Instructions:
The subject area that the team has defined is based on Sales, Products, Customers, and Period data. These data elements will be used to model the initial application.
The physical model you are working with now looks like this:
1. Using the Siebel Analytics Administration Tool, you will define the repository logical structure for ABC’s business model. a. Select Start > Programs > Siebel Analytics > Siebel Analytics Administration. b. Select File > Open > Offline. c. Double-click ABC.rpd to open the repository file. d. Enter the following parameters:
User Administrator Password <blank>

Module 2: Building the Business Model Layer of a Repository
28 Analytics: Server Architect (Siebel 7.7)
e. Click OK. 2. ABC’s initial model will be built to support the Supplier Sales initial business model.
Use your understanding of ABC’s business requirements to identify the physical tables that will be used to support the business model (refer to the prior methodology lab if necessary): Customer, rep, district, and region data maps to source table. Main product information data maps to source table. Invoice sales data maps to source table. Month codes and names data maps to source table.
3. Create a business model folder in the Business Model and Mapping layer that contains the logical-to-physical table mappings for ABC’s Supplier Sales business model. a. Right-click the white space of the Business Model and Mapping layer and select New
Business Model. b. In the Name field, type SupplierSales. c. Click OK. The new Business Model and Mapping folder appears in the Business Model and
Mapping layer:
Note: The red symbol on the business model folder indicates it is not enabled for querying. You will update this indicator once the Presentation layer is defined.
4. Create ABC’s business model using the four tables you identified in the prior step to support the Supplier’s Sales business model. a. Expand the ABC data source, expand the supplier2 catalog icon, and expand the dbo
schema icon. b. Use CTRL+click to select the tables D1_Calendar2, D1_customer2, D1_Orders2, and
D1_products. c. Drag the selected tables onto the SupplierSales folder.
Note: When tables with keys and joins are defined in the Physical layer and dragged onto the business model folder at the same time, the keys and joins will automatically be created in the Business Model and Mapping layer. If tables are added to a business model later, the keys and joins must be created manually. Note: The table icon for D1_Orders2 is yellow, which means it is a logical fact table. The color changes when logical joins to the fact are created.
5. Rename the tables in the Business Model and Mapping layer to make them more meaningful. a. Double-click the D1_Calendar2 table. The Logical Table dialog box opens. b. Verify that the General tab is selected. c. In the Name field, type Periods. d. Click OK.

Module 2: Building the Business Model Layer of a Repository
Analytics: Server Architect (Siebel 7.7) 29
e. Repeat the process and rename the following tables: Table Rename to:
D1_customer2 Customers
D1_products Products
D1_Orders2 SalesFacts
6. Delete columns that are not needed for analysis. a. Expand the SalesFacts table and then click on the first column below. Then use
CTRL+click to select the remaining columns to be deleted. Columns
InvNbr
DWACostExtnd
RepCostExtnd
CMDolrs i. Verify that the SalesFacts table is not selected, before you press the DELETE key. ii. Press the DELETE key. iii. Click Yes to delete the objects.

Module 2: Building the Business Model Layer of a Repository
30 Analytics: Server Architect (Siebel 7.7)
b. Expand the Periods table and then click on the first column below. Then use CTRL+click to select the remaining columns to be deleted. Columns
True_Julian_Day_NM
Day_in_Month
Day_Name
Day_in_Year
Day_Since_Jan_11990
Week_Num_in_Year
WeekSince_Jan11990
Chinese_Year through DAGO (including DAGO)
i. Verify that the Periods table is not selected, before you press the DELETE key. ii. Press the DELETE key. iii. Click Yes to delete the objects.
c. Expand the Products table and select the PGCode column. i. Verify that the Products table is not selected, before you press the DELETE key. ii. Press the DELETE key. iii. Click Yes to delete the object.
d. Expand the Customers table and use CTRL+click to select the RepNo and Factor columns. i. Verify that the Customers table is not selected, before you press the DELETE key. ii. Press the DELETE key. iii. Click Yes to delete the objects.
7. Rename logical columns for better understanding by end users. a. Double-click the logical column YYYYMMDD, in the Periods table. The Logical Column
dialog box opens.
b. Verify that the General tab is selected. c. In the Name field, type Day. d. Click OK.
8. Rename the following logical columns, repeating the process in the previous step: Periods Table Rename to:
Full_Gregorian_Dte Date
Month_in_Year Month in Year
SalesFacts Table Rename to:

Module 2: Building the Business Model Layer of a Repository
Analytics: Server Architect (Siebel 7.7) 31
ActlExtnd Dollars
UnitShpd Units Shipped
UnitOrdd Units Ordered
NetWghtShpd Net Weight Shipped
Customers Table Rename to:
NewKey Customer Key
Name Customer
SalesRep Sales Rep
Products Table Rename to:
GenericDescription Generic
SpecificDescriptin Specific
Package_weight Package Weight
9. Select File > Save to save the repository.
10. Click No to check Global Consistency.
11. Remain logged in to the Siebel Analytics Administration Tool for the next lab.

Module 2: Building the Business Model Layer of a Repository
32 Analytics: Server Architect (Siebel 7.7)
Solutions 2-1 Defining the Repository Logical Structure
Answers
2. Customer, rep, district, and region data maps to D1_customer2 source table. Main product information data maps to D1_products source table. Invoice sales data maps to D1_Orders2 source table. Month codes and names data maps to D1_Calendar2 source table.

Module 2: Building the Business Model Layer of a Repository
Analytics: Server Architect (Siebel 7.7) 33
Lab 2-2 Building Simple Fact Measures
Goals To examine the logical-to-physical table mappings and create simple fact measures.
Scenario The Supplier Sales subject area is now defined in the Business Model and Mapping layer. You will review the logical-to-physical table mappings to better understand the relationships that exist between the fact and dimensional tables of a dimensional model in order to build simple fact measurements. You want to verify the keys and join conditions in the business model and examine the logical table sources that provide the mapping to the data source in the Physical layer. You will also create business measures by defining aggregation rules on logical columns.
Outcome Modified SalesFacts logical table.
Time 15 – 20 minutes
Instructions:
You should still be logged in to the Siebel Analytics Administration Tool.
1. Review the dimensional model for ABC’s Supplier Sales business model by opening the Business Model Diagram. Right-click the SupplierSales subject area and select Business Model Diagram >Whole Diagram. Rearrange the table objects to look similar to this:
Note: The dimensional model for the Supplier Sales business model is an example of a star schema, a single fact table that has foreign key relationships with several dimension tables.

Module 2: Building the Business Model Layer of a Repository
34 Analytics: Server Architect (Siebel 7.7)
a. Based on the definition of a star schema in the Business Model Diagram above, identify the fact table, dimensional tables, and cardinality between tables for the SupplierSales business model. i. Which logical table is the fact table?
ii. Which logical tables are the dimension tables?
iii. What is the cardinality between Products and SalesFacts?
iv. What is the cardinality between Customers and SalesFacts?
v. What is the cardinality between Periods and SalesFacts?
b. Double-click the connector between the tables Products and SalesFacts. Observe the information in the Logical Foreign Key dialog box. i. Which columns are linked?
ii. Click Cancel. c. Double-click the connector between the tables Customers and SalesFacts. Observe the
information in the Logical Foreign Key dialog box. i. Which columns are linked?
ii. Click Cancel. d. Double-click the connector between the logical tables Periods and SalesFacts. Observe the
information in the Logical Foreign Key dialog box. i. Which columns are linked?
Note: Notice that the logical column named Day has been renamed from YYYYMMDD.
ii. Click Cancel. e. Close the SupplierSales Logical Table Diagram window.
2. Examine the logical table sources.

Module 2: Building the Business Model Layer of a Repository
Analytics: Server Architect (Siebel 7.7) 35
Note: Each logical table has a Sources folder that contains one or more logical table sources. The logical table sources provide the mapping to columns in the Physical layer.
a. Expand the Sources folder of the SalesFacts logical table. What is the name of the logical
table source for the SalesFacts table?
b. Double-click the SalesFacts logical table source, D1_Orders2. The Logical Table Source dialog box opens. Select the Column Mapping tab.
c. Scroll to the right to see the Physical Table column and adjust the column widths to make all three columns visible:
i. The Dollars logical column is mapped to what physical column?
ii. The Dollars logical column is mapped to what physical table?
d. Click Cancel to close the dialog box.
3. You will create ABC’s simple fact measurements by defining default aggregation rules on logical columns defined in the SalesFacts table. Note: Measures are often data that is additive, such as total dollars or total quantities. The SalesFacts logical table serves as the measures in our business model, and some of its logical columns will be aggregated by summing. a. Double-click the Dollars logical column. The Logical Column dialog box opens. Select the
Aggregation tab. b. In the default aggregation rule field, select the drop-down arrow to display the choices.

Module 2: Building the Business Model Layer of a Repository
36 Analytics: Server Architect (Siebel 7.7)
i. What aggregation rules are available?
c. ABC wants to analyze the total dollars as a business measurement. Specify the default aggregation rule for Dollars to Sum. i. In the default aggregation rule field, use the drop-down menu to select Sum. ii. Click OK.
4. Specify the default aggregation rule on the remaining logical columns in SalesFacts. a. Select Units Shipped, then use CTRL+click to select Units Ordered and Net Weight
Shipped. b. Right-click and select Set Aggregation. c. Select Sum as the default aggregation rule.
d. Click OK.
Note: This is another way of setting aggregation on logical columns. e. What happens to the logical column icons after you change the default aggregation rule to
Sum?

Module 2: Building the Business Model Layer of a Repository
Analytics: Server Architect (Siebel 7.7) 37
5. Select File > Exit to exit the Siebel Analytics Administration Tool.
6. Click Yes to save the changes to ABC.rpd.

Module 2: Building the Business Model Layer of a Repository
38 Analytics: Server Architect (Siebel 7.7)
Solutions 2-2 Building Simple Fact Measures
Answers
1.a.i. Which logical table is the fact table? SalesFacts
1.a.ii. Which logical tables are the dimension tables? Customers, Periods, and Products
1.a.iii. What is the cardinality between Products and SalesFacts? One-to-many
1.a.iv. What is the cardinality between Customers and SalesFacts? One-to-many
1.a.v. What is the cardinality between Periods and SalesFacts? One-to-many
1.b.i. What columns are linked? ProductKey and ProdKey
1.c.i. What columns are linked? CustomerKey and CustKey
1.d.i. What columns are linked? Day and PeriodKey
2.a. Expand the Sources folder of the SalesFacts logical table. What is the name of the logical table source for the SalesFacts table? D1_Orders2
2.c.i. The Dollars logical column is mapped to what physical column? ActExtnd
2.c.ii. The Dollars logical column is mapped to what physical table? D1_Orders2
3.b.i. What aggregation rules are available? None, Sum, Avg, Count, Count Distinct, Max, Min, First, Last, and Median, and two standard deviation measures: StdDev, and StdDevPop.
4.e. What happens to the logical column icons after you change the aggregation rule to Sum? It changes to a summation symbol.

Module 3: Building the Presentation Layer of a Repository
Analytics: Server Architect (Siebel 7.7) 39
Lab 3-1 Customizing the Presentation Catalog
Goals To customize the presentation catalog and create a personalized view of the sales data for district managers.
Scenario ABC has completed the initial build of the Supplier Sales logical subject area that will allow end users to query on several business measures. You will customize the presentation catalog for users by reordering columns, renaming columns, and deleting columns that are not needed, and then configure another presentation catalog for ABC’s district managers.
Outcome In the Presentation layer, SupplierSales and SupplierSalesDM catalogs.
Time 10 – 15 minutes
Instructions:
1. Using the Siebel Analytics Administration Tool, you will define the presentation layer for ABC’s business model. a. Select Start > Programs > Siebel Analytics > Siebel Analytics Administration. b. Select File > Open > Offline. c. Double-click ABC.rpd to open the repository file. d. Enter the following parameters:
User Administrator Password <blank>
e. Click OK.
2. Create a new presentation catalog in the Presentation layer. a. Verify that the Presentation layer is visible. If it is not visible, select View > Presentation. b. Drag the SupplierSales business model folder into the Presentation layer. A presentation
catalog folder appears with the name SupplierSales. Note: All objects within a presentation catalog must derive from a single business model.
3. Reorder the columns in the SupplierSales presentation catalog.
Module 3: Building the Presentation Layer of a Repository
40 Analytics: Server Architect (Siebel 7.7)
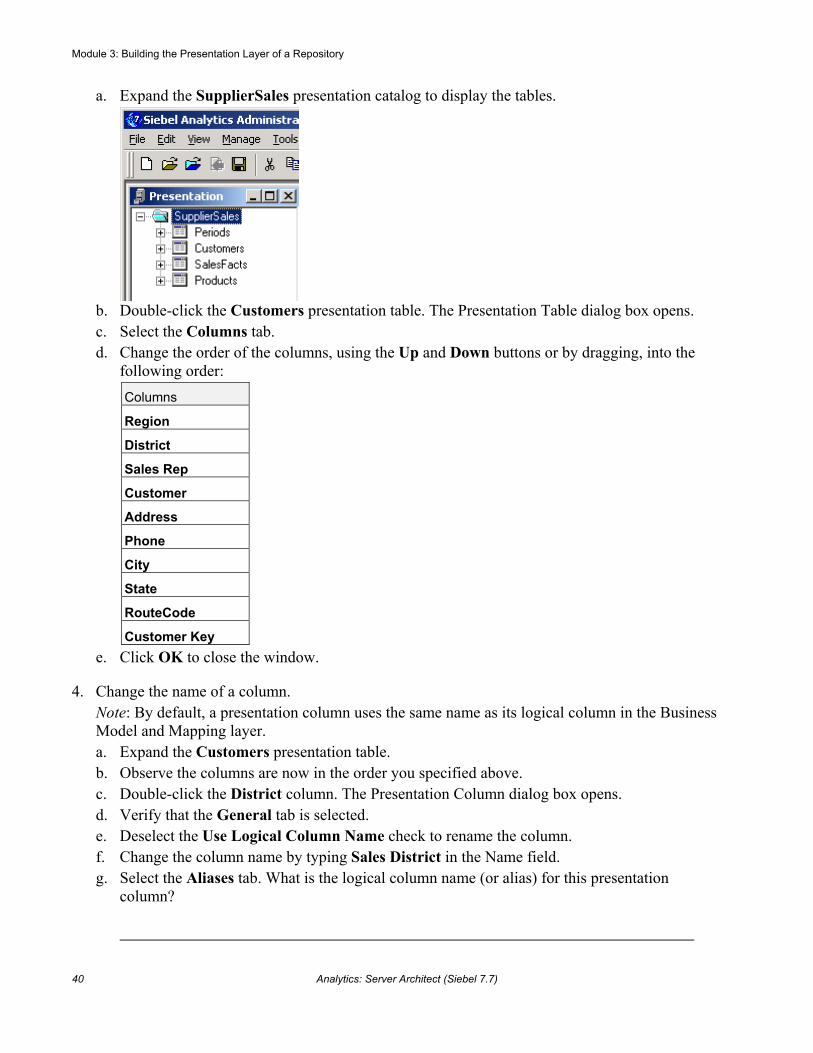
a. Expand the SupplierSales presentation catalog to display the tables.
b. Double-click the Customers presentation table. The Presentation Table dialog box opens. c. Select the Columns tab. d. Change the order of the columns, using the Up and Down buttons or by dragging, into the
following order: Columns
Region
District
Sales Rep
Customer
Address
Phone
City
State
RouteCode
Customer Key e. Click OK to close the window.
4. Change the name of a column. Note: By default, a presentation column uses the same name as its logical column in the Business Model and Mapping layer. a. Expand the Customers presentation table. b. Observe the columns are now in the order you specified above. c. Double-click the District column. The Presentation Column dialog box opens. d. Verify that the General tab is selected. e. Deselect the Use Logical Column Name check to rename the column. f. Change the column name by typing Sales District in the Name field. g. Select the Aliases tab. What is the logical column name (or alias) for this presentation
column?

Module 3: Building the Presentation Layer of a Repository
Analytics: Server Architect (Siebel 7.7) 41
h. Click OK to close the window.
5. To make the content more understandable to users, simplify it by deleting unnecessary columns. a. In the Customers table, select the Customer Key column and press the DELETE key. b. Click Yes to delete the object. The Customer Key column is deleted from the Customers
table. c. Delete the following columns in the Presentation layer:
Products Table
ProductKey
SalesFacts Table
ProdKey
PeriodKey
CustKey d. Why should you delete key columns from the presentation tables?
e. What would be a reason not to delete key columns from the presentation tables?
f. Collapse the SupplierSales catalog folder.
6. Create a new presentation catalog in the Presentation layer based on the SupplierSales catalog folder for ABC’s District Managers (DM). District Managers will analyze information required to manage their sales district, such as sales dollars and sales reps; they will not analyze any information related to ABC’s products. a. Copy an existing presentation catalog.
i. Select the SupplierSales catalog folder. ii. Select Edit > Duplicate. A presentation catalog folder appears with the name
SupplierSales#1. Note: All objects within the SupplierSales catalog folder are also in the SupplierSales#1 catalog folder.
b. Rename the SupplierSales#1 catalog folder to SupplierSalesDM. i. Double-click SupplierSales#1. ii. Verify that the General tab is selected. iii. Change the catalog folder name by typing SupplierSalesDM in the Name field. iv. Click OK.
7. The District Managers will not analyze the SupplierSales product information in their view of the data.

Module 3: Building the Presentation Layer of a Repository
42 Analytics: Server Architect (Siebel 7.7)
a. Expand the SupplierSalesDM presentation catalog. b. Which presentation table in the SupplierSalesDM catalog folder stores Supplier Sales
product data?
c. Select the Products presentation table and press the DELETE key. d. Click Yes to delete objects. The Products table is deleted from the SupplierSalesDM
catalog.
8. Save the changes to ABC.rpd.
9. Leave the Siebel Analytics Administration Tool open for the next lab.

Module 3: Building the Presentation Layer of a Repository
Analytics: Server Architect (Siebel 7.7) 43
Solutions 3-1 Customizing the Presentation Catalog
Answers
4.g. Select the Aliases tab. What is the logical column name (or alias) for this presentation column? District
5.d. Why should you delete key columns from the presentation tables? Key columns in each presentation table are typically not useful and can be deleted. It is good data warehousing practice not to expose table keys to users.
5.e. What would be a reason not to delete key columns from the presentation tables? If other ODBC client tools require the key information
7.b. Which presentation table in the SupplierSalesDM catalog folder stores Supplier Sales product data? Products

Module 3: Building the Presentation Layer of a Repository
44 Analytics: Server Architect (Siebel 7.7)

Module 4: Testing and Validating a Repository
Analytics: Server Architect (Siebel 7.7) 45
Lab 4-1 Testing the Repository
Goals To test the new presentation catalog, generate some queries using the Analytics ODBC Client and Siebel Answers, and examine the query log file.
Scenario ABC has finished building the initial business model and needs to test the repository, before publishing it to end users. You will check the repository for errors using the check consistency option, and then test it using the Analytics ODBC Client tool and Siebel Answers to compare query results, and examine the query log file to verify the SQL statements.
Outcome Verified repository file
Time 25 – 35 minutes
Instructions:
1. Using the Siebel Analytics Administration Tool, you will run a consistency check looking for errors in the repository. a. Select Start > Programs > Siebel Analytics > Siebel Analytics Administration. b. Select File > Open > Offline. c. Double-click ABC.rpd to open the repository file. d. Enter the following parameters:
User Administrator Password <blank>
e. Click OK.
2. Perform a consistency test to check the Business Model and Mapping layer for inconsistencies, such as logical tables that do not have logical sources configured, or business models that do not have Presentation catalogs defined. a. In the Business Model and Mapping layer, right-click the SupplierSales subject area and
select Check Consistency. A prompt appears, verifying that the business model is consistent, and asking if it should be made available for queries.

Module 4: Testing and Validating a Repository
46 Analytics: Server Architect (Siebel 7.7)
b. Click Yes. Another prompt appears.
c. Click OK. The business model folder changes from unavailable for querying to available
for querying . Notice that the red circle disappears from the business model folder once the business model is available for queries.
3. Enable query logging for the Administrator user by setting the Query Logging Level to see the SQL generated and the various data sources, tables, and columns that are accessed during testing. a. Select Manage > Security. b. In the left pane, select Users. The Administrator user appears in the right pane. c. In the right pane, double-click Administrator. The User dialog box opens. d. Verify that the User tab is selected. e. In the Logging level field, set the value to 2. f. Click OK. g. Close the Security Manager window.
Note: More Security-related topics will be addressed later in the course.
4. Select File > Exit to exit the Siebel Analytics Administration Tool. a. Click Yes to save changes to ABC.rpd.
5. Update the Repository section in the analytics initialization file, NQSConfig.INI. Note: An entry in the Repository section of the initialization file instructs the Siebel Analytics Server to load a specific repository into memory upon startup. If it detects a syntax error while loading the repository, it logs the error to the server log file (NQServer.log). a. Double-click C:\SiebelAnalytics\Config\NQSConfig.INI. b. Locate the REPOSITORY section and modify as follows:
c. Save the changes and close the file. d. Close the Windows Explorer.
6. Restart the Siebel Analytics Server service to read in the new ABC repository, and verify that the Siebel Analytics Web service is started. a. Select Start > Programs > Administrative Tools > Services. b. If the Siebel Analytics Server service is already started, right-click Siebel Analytics Server
and select Restart. If Siebel Analytics Server is not started, right-click and select Start. c. If Siebel Analytics Web service is already started, right-click Siebel Analytics Web and
select Restart. If Siebel Analytics Web is not started, right-click and select Start.

Module 4: Testing and Validating a Repository
Analytics: Server Architect (Siebel 7.7) 47
d. Verify that the Siebel Analytics Server and Siebel Analytics Web services are started by selecting Action > Refresh until the Status column displays the value Started.
e. Close Services.
7. Examine the NQServer.log file to verify that startup is successful. a. Double-click C:\SiebelAnalytics\Log\NQServer.log. b. Scroll down to the bottom of the file and locate the message “Loading repository
C:\SiebelAnalytics\Repository\ABC.rpd”: i. Verify that the Subject Area that was loaded, and note the “Siebel Analytics Server
started” message.
Note: The log file can contain messages indicating why the server startup failed. For example, if there were a syntax error in the NQSConfig.INI file, the NQServer.log file would contain messages about the syntax error. After examining the log messages, correct the problem and start the server again.
c. Close the NQServer.log file. d. Close the Windows Explorer.
8. Use the Analytics ODBC Client to verify the schema. a. Select Start > Programs > Siebel Analytics > Siebel Analytics ODBC Client. b. Select File > Open Database. c. In the DSN field, use the drop-down menu to select Analytics Web.
Note: The Analytics Web DSN is an ODBC data source created to connect to Siebel Analytics Server.
d. Type Administrator in the UID field and leave the Password field blank.

Module 4: Testing and Validating a Repository
48 Analytics: Server Architect (Siebel 7.7)
e. Click OK.
9. Test and verify the SupplierSales business model using the Analytics ODBC Client tool. Select Utility > View Schema. a. List the business model tables.
b. Select the SalesFacts table. List the columns in this table.
c. Close the Database Schema dialog box.
10. Test the Supplier Sales business model by executing queries to verify the results. a. Select Utility > Enter SQL Query.
Note: The queries you issue in this lab are not case-sensitive. The query syntax begins with the word SELECT, followed by a list of columns (logical columns defined in the Presentation or Business Model and Mapping layer), then followed by a FROM clause. The FROM clause is followed by table names, or just the catalog folder name. The results appear in a table with columns matching the list of columns following the SELECT statement.
b. Execute a query for a list of regions by typing select region from suppliersales. Verify that three rows were returned:

Module 4: Testing and Validating a Repository
Analytics: Server Architect (Siebel 7.7) 49
c. Execute a query for a list of districts and total dollars (sorted in ascending order) in the East region for 1999 by typing select district, dollars from suppliersales where region=’East’ and year=1999 order by dollars asc. Examine the results returned:
d. Observe the rows of information returned coming from the presentation tables in the
SupplierSales catalog (Customers and SalesFacts). Which Sales District has the highest revenue (dollars)? Note: You will execute this query again in a later step using Siebel Answers to compare results.
11. Select File > Exit to close the Siebel Analytics ODBC Client tool.
12. Verify that the PopChart service is started. This is the engine that renders results in chart and graph views in Siebel Answers and Intelligence Dashboards. a. Select Start > Programs > Administrative Tools > Services. b. In the Services window, scroll to locate the PopChart 5.1 service. c. Double-click the PopChart 5.1 service. d. Verify that Startup type is set to Automatic. If not, change it. e. Verify that Service status is set to Started. If not, start the service. f. Click OK. g. In the Services window, verify that the PopChart 5.1 service is started and Startup type is set
to Automatic. h. Minimize the Services window.
13. Start Siebel Answers. a. Select Start > Programs > Siebel Analytics > Siebel Analytics Web. b. Enter the following parameters:
User Administrator Password <blank>
c. Click Log In. d. Click the Answers link.

Module 4: Testing and Validating a Repository
50 Analytics: Server Architect (Siebel 7.7)
14. Execute queries to test the SupplierSales subject area. Create a request showing the dollars for each sales rep in the MidAtlantic district in the year 1999. a. Select the SupplierSales subject area. b. Expand the Customers table and click the Sales Rep and Sales District columns. c. Expand the SalesFacts table and click the Dollars column.
i. On the Dollars column, click the Order by icon once to select Order Ascending icon.
d. Expand the Periods table and click the Year column. e. Create filters on the Year and Sales District columns.
i. In the Year column, click the Add Filter icon. In the Value field, enter 1999 and click OK.
ii. In the Sales District column, click the Add Filter icon. In the Value field, enter MidAtlantic and click OK.
f. Verify the filters:
g. Remove columns that do not need to be displayed in the request results.
i. In the Year column, click the Remove Column icon. ii. In the Sales District column, click the Remove Column icon.
h. Click the Results tab to view the results. Which Sales Rep produced the highest revenue (dollars)?
15. Create a request showing the dollars for each sales district in the East region for the year 1999.
a. Click the Create a new request icon and select the SupplierSales subject area. b. Select Customers > Sales District to add the column as criteria. c. Select Customers > Region to add the column as criteria. d. Select SalesFacts > Dollars to add the column as criteria.
i. On the Dollars column, click the Order by icon once, to select Order Ascending icon.
e. Click Periods.Year to add the column as criteria. f. Create the filters.
i. In the Year column, click the Add filter icon. In the Value field, enter 1999 and click OK.
ii. In the Region column, click the Add filter icon. In the Value field, enter East and click OK.
g. Verify the filters:

Module 4: Testing and Validating a Repository
Analytics: Server Architect (Siebel 7.7) 51
h. Delete the Year and Region columns from the request results by clicking the Remove Column icon in each column.
i. Click the Results tab to view the results. Which Sales District has the highest revenue (dollars)?
j. Compare these results with the results generated for the East region using the Siebel Analytics ODBC Client in the prior step.
16. Select File > Close to exit Siebel Answers.
17. Examine the Analytics query log file. a. Double-click C:\SiebelAnalytics\Log\NQQuery.log. Scroll down to the bottom of the file to
locate the last query you executed. (See the following illustration.)
b. Locate the “SQL Request” section.
i. Which presentation table is Sales District information coming from?
ii. Which presentation table is Dollars information coming from?
iii. The FROM clause identifies which catalog name?
c. Locate the “General Query Info” section, just below the SQL Request section. i. Which repository (logical name) was accessed for this query?

Module 4: Testing and Validating a Repository
52 Analytics: Server Architect (Siebel 7.7)
ii. Which Subject Area was accessed for this query?
iii. Which presentation catalog was accessed for this query?
d. Locate the “Sending query to database named ABC” section, just below the General Query Info section. i. Which physical tables are accessed for this query?
ii. Did this query complete successfully?
iii. How many rows were retrieved from the database?
e. Close the NQQuery.log file. f. Close the Windows Explorer.

Module 4: Testing and Validating a Repository
Analytics: Server Architect (Siebel 7.7) 53
Solutions 4-1 Testing the Repository
Answers
9.a. List the business model tables. Periods, Customers, Products, SalesFacts
9.b. Select the SalesFacts table. List the columns in this table. Dollars, Units Shipped, Units Ordered, Net Weight Shipped
10.d. Which Sales District has the highest revenue (dollars)? Yankee
14. Execute queries to test the SupplierSales subject area. Create a request showing the dollars for each sales rep in the MidAtlantic district in the year 1999.
14.h. Which Sales Rep produced the highest revenue (dollars)? Paula Madison
15. Create a request showing the dollars for each sales district in the East region for the year 1999.

Module 4: Testing and Validating a Repository
54 Analytics: Server Architect (Siebel 7.7)
15.i. Which Sales District has the highest revenue (dollars)? Yankee
17.b.i. Which presentation table is Sales District information coming from? Customers
17.b.ii. Which presentation table is Dollars information coming from? SalesFacts
17.b.iii. The FROM clause identifies which catalog name? SupplierSales
17.c.i. Which repository (logical name) was accessed for this query? Star
17.c.ii. Which Subject Area was accessed for this query? SupplierSales
17.c.iii. Which presentation catalog was accessed for this query? SupplierSales
17.d.i. Which physical tables are accessed for this query? D1_customer2, D1_Calendar2, and D1_Orders2
17.d.ii. Did this query complete successfully? Yes
17.d.iii. How many rows were retrieved from the database? 4

Module 4: Testing and Validating a Repository
Analytics: Server Architect (Siebel 7.7) 55
Lab 4-2 (Optional Lab) Checking Consistency
Goals To understand the requirements for a consistent business model.
Scenario ABC has successfully tested the presentation catalog and made it available for querying by end users. In this lab, you will modify your business model to generate an inconsistent business model, to further understand the requirements of creating a consistent business model.
Outcome Inconsistent ABCLab4.rpd
Time 15 minutes
Instructions:
1. Before modifying the Analytics repository, stop the Siebel Analytics Server service. a. Select Start > Programs > Administrative Tools > Services. b. Right-click Siebel Analytics Server and select Stop. c. Verify that the Siebel Analytics Server stopped by checking that the Status column displays
no value. d. Minimize the Services window.
2. Make a copy of ABC.rpd file. a. Navigate to C:\SiebelAnalytics\Repository. b. Right-click ABC.rpd and select Copy. c. Right-click anywhere in the right pane and select Paste. d. Rename the copied file ABC_LAB4.rpd. e. Close Windows Explorer.
3. Use the Siebel Analytics Administration Tool to check consistency on ABC’s business model. a. Select Start > Programs > Siebel Analytics > Siebel Analytics Administration. b. Select File > Open > Offline. c. Double-click ABC_LAB4.rpd to open the repository file. d. Enter the following parameters:
User Administrator Password <blank>
e. Click OK. f. In the Siebel Analytics Administration Tool title bar, verify that you have opened
ABC_LAB4.rpd.

Module 4: Testing and Validating a Repository
56 Analytics: Server Architect (Siebel 7.7)
4. Examine the business model based on the requirements for defining a consistent business model. a. Check the business model for logical join conditions.
i. In the Business Model and Mapping layer, right-click SupplierSales and select Business Model Diagram > Whole Diagram. The logical table business model diagram appears.
ii. Observe the join connections between SalesFacts (fact table) and the dimensional tables. Note: Other check consistency requirements are finding logical columns that are not mapped to physical sources, and determining if physical tables referenced in a business model are not joined to tables referenced in the business model. Checking consistency does not guarantee that the business model is constructed correctly, but it does check for some of the more common errors in the business model.
5. Modify the business model to generate an inconsistent business model. Create a condition in the business model where an undefined join condition exists. a. Select the join connection between the Periods and SalesFacts logical tables. b. Right-click and select Delete. c. Click Yes to delete objects. The join relationship between Periods and SalesFacts is deleted. d. Close the Logical Table Diagram window.
6. From the Business Model and Mapping layer, perform a consistency check. a. In the Business Model and Mapping layer, right-click SupplierSales and select Check
Consistency. A prompt appears, verifying that the business model is not consistent, and asking if it should be marked as unavailable for queries.
b. Click Yes. Review the business model compile messages:
Module 4: Testing and Validating a Repository
Analytics: Server Architect (Siebel 7.7) 57
c. Click OK. The business model folder changes from available for querying to unavailable for querying . Notice the red circle appears on the business model folder, once the business model is unavailable for queries.
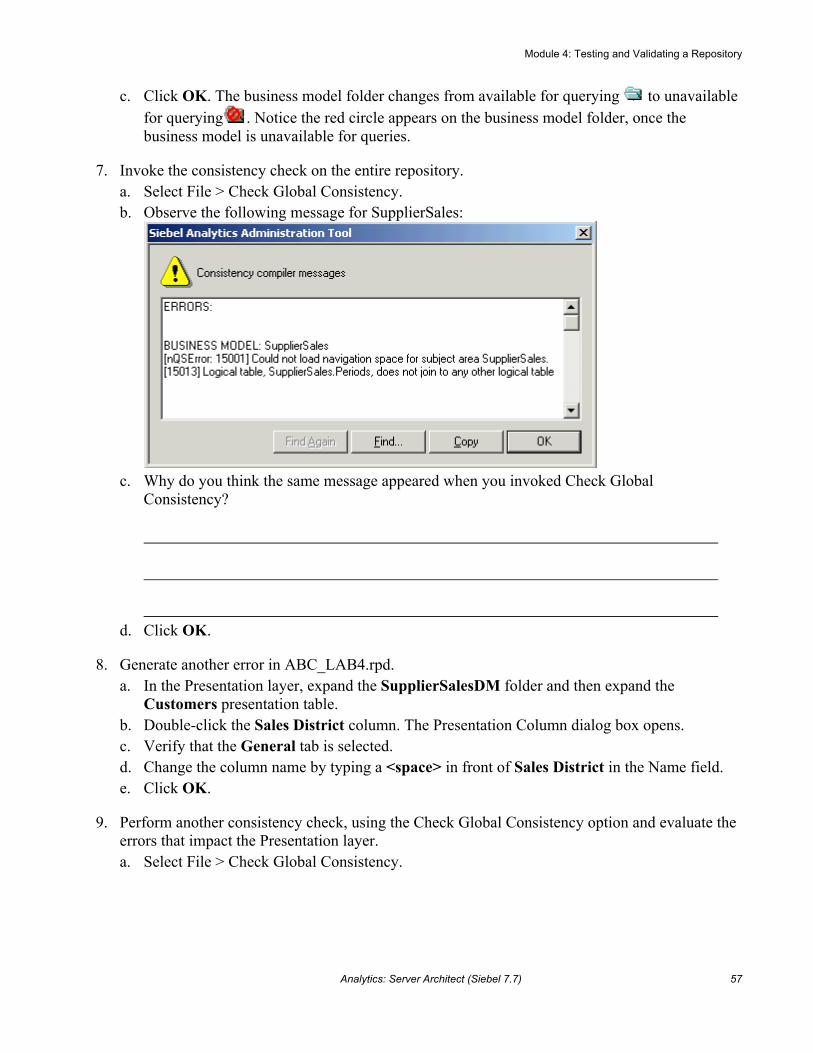
7. Invoke the consistency check on the entire repository. a. Select File > Check Global Consistency. b. Observe the following message for SupplierSales:
c. Why do you think the same message appeared when you invoked Check Global
Consistency?
d. Click OK.
8. Generate another error in ABC_LAB4.rpd. a. In the Presentation layer, expand the SupplierSalesDM folder and then expand the
Customers presentation table. b. Double-click the Sales District column. The Presentation Column dialog box opens. c. Verify that the General tab is selected. d. Change the column name by typing a <space> in front of Sales District in the Name field. e. Click OK.
9. Perform another consistency check, using the Check Global Consistency option and evaluate the errors that impact the Presentation layer. a. Select File > Check Global Consistency.

Module 4: Testing and Validating a Repository
58 Analytics: Server Architect (Siebel 7.7)
b. Scroll down toward the bottom of the message window and observe the following message for the SupplierSalesDM catalog folder:
c. Click OK.
10. Perform the consistency check from the Business Model and Mapping layer. a. In the Business Model and Mapping layer, right-click SupplierSales and select Check
Consistency. b. Observe the business model compile message:
c. Why don’t you see the error message relating to SupplierSalesDM having leading or trailing
spaces in it?
d. Click OK.

Module 4: Testing and Validating a Repository
Analytics: Server Architect (Siebel 7.7) 59
11. Select File > Exit to exit Siebel Analytics Administration Tool and DO NOT save the changes to ABC_LAB4.rpd.
Module 4: Testing and Validating a Repository
60 Analytics: Server Architect (Siebel 7.7)
Solutions 4-2 Checking Consistency
Answers
7.c. Why do you think the same message appeared when you invoked Check Global Consistency? The Check Global Consistency looks for compilation errors on the entire repository, whereas the check consistency from the Business Model and Mapping layer checks for errors in a particular subject area that you have selected. In this example, the error pertains to the same subject area in the Presentation and Business Model and Mapping layers.
10.c. Why don’t you see the error message relating to SupplierSalesDM having leading or trailing spaces in it? The check consistency from the Business Model and Mapping layer checks for errors associated with the subject area that you have selected, such as finding logical columns that are not mapped to physical sources, checking for undefined logical join conditions, and determining if physical tables referenced in a business model are not joined to tables referenced in the business model.

Module 5: Adding Multiple Sources to a Dimension
Analytics: Server Architect (Siebel 7.7) 61
Lab 5-1 Importing Additional Product Tables
Goals To import normalized tables that contain additional product information into the Physical layer of the repository.
Scenario There are product tables that store detail information about ABC’s products. You want to add these tables to the Product dimension in the Business Model and Mapping layer. You will import these tables into the repository and create keys and foreign key joins for the tables.
Outcome In the Physical layer, d1_pricelist, D1_prod_diet_types, D1_product_subtype, D1_product_type, and d1_suppliers tables and associated keys and joins.
Time 5 – 10 minutes
Instructions
1. Verify that the Siebel Analytics Server is stopped. a. Select Start > Programs > Administrative Tools > Services. b. Locate Siebel Analytics Server and verify that the status field has no value. c. Minimize Services.
2. Start the Siebel Analytics Administration Tool and open the ABC.rpd repository offline. a. Select Start > Programs > Siebel Analytics > Siebel Analytics Administration. b. Select File > Open > Offline. c. Double-click ABC.rpd. d. Verify that User is Administrator and Password field is blank. e. Click OK.
3. Import the product tables that store product code, pricing, and supplier (vendor) information. a. Select File > Import > from Database. b. Verify that the connection type is ODBC 3.5. c. Scroll down and select the ABC data source. d. In the User Name field, verify that sa is the value and leave the Password field blank. e. Click OK. f. Expand the supplier2 folder. g. Expand the dbo folder. h. Select the following tables (use CTRL+click) to import:
Table Name
d1_pricelist

Module 5: Adding Multiple Sources to a Dimension
62 Analytics: Server Architect (Siebel 7.7)
D1_prod_diet_types
D1_product_subtype
D1_product_type
d1_suppliers i. Verify that the Tables, Keys, and Foreign Keys check boxes are selected. j. Click Import. k. Click Close.
4. Define joins and foreign keys using the Physical Diagram view. Note: The tables you imported provide more detail information about ABC’s products, such as product type (example: Cheese or Beef), subtype (example: American cheese or Beef patties), and diet codes (example: Diet or Regular). These tables represent a one-to-many relationship to the D1_products table. a. In the Physical layer, right-click the ABC database and select Physical Diagram > Object(s)
and All Joins to open the Physical Diagram view. b. Drag the new table objects so they are all visible. c. Use the New Foreign Key button on the Tool bar to create the following relationships:
Note: Reply Yes to the message asking if you want to create a matching table key.
Dimension key Foreign key
D1_product_subtype.SubtypeCode D1_products.SubtypeCode
D1_prod_diet_types.DietCode D1_products.DietCode
d1_suppliers.SupplierCode D1_products.SupplierCode
d1_pricelist.ProductKey D1_products.ProductKey
D1_product_type.TypeCode D1_product_subtype.TypeCode

Module 5: Adding Multiple Sources to a Dimension
Analytics: Server Architect (Siebel 7.7) 63
d. Check your results:
e. Close the Physical Diagram.

Module 5: Adding Multiple Sources to a Dimension
64 Analytics: Server Architect (Siebel 7.7)
Lab 5-2 Creating Multiple Sources for a Logical Table Source (Manual)
Goals To add the information from the price list table to the Product dimension.
Scenario You have imported the product tables that store detail information about ABC’s products into the Physical layer of the repository and configured keys and foreign key joins for the tables. Thus far, the Product dimension in the Business Model and Mapping layer includes only information from the root product table: D1_products. You are ready to add the information from the price list table to the Product dimension, and while doing that, simplify the data structure (in effect, creating a denormalized logical table).
Outcome In the Business Model and Mapping layer, the d1_pricelist physical table is added to the existing logical table source for the Product dimension. In the Business Model and Mapping layer, the Price logical column is added to the Product dimension and mapped to the appropriate physical table.
Time 5 minutes
Instructions:
1. Add the information from the price list table to the existing logical table source for the Product dimension. Note: There are two methods to model multiple sources for an existing logical table source. In this lab you will use the Properties window of an existing logical table source, which is a manual process and requires several steps. In a subsequent lab, you will use a more automated process. a. In the Business Model and Mapping layer, expand the Sources folder of the Products table
and double-click the D1_products logical table source to view the properties. b. Click the General tab and click Add. c. In the Browse window, select the d1_pricelist table and click the Select button. d. Click OK.
2. Now that the physical table that stores the pricing information has been added to the Product logical table source, create a new logical column and map it to the appropriate physical table. a. In the Business Model and Mapping layer, right-click the Products table and select New
Object > Logical Column. b. Enter Price in the Name field and click OK. c. Open the Properties window of the D1_products logical table source. d. Click the Column Mapping tab. e. Select the Show unmapped columns check box.
Module 5: Adding Multiple Sources to a Dimension
Analytics: Server Architect (Siebel 7.7) 65
f. In the Logical Column section, click the Price ellipsis (…) button to open the Expression Builder.
g. In the lower-left pane of the Expression Builder, click the Physical Tables folder. h. In the center pane, click d1_pricelist. i. In the right pane, click Price. j. Select Insert and examine the expression. k. Click OK to close the Expression Builder. l. Verify that Show Mapped Columns is selected, and that d1_pricelist appears in the
Physical Table column. m. Click OK.

Module 5: Adding Multiple Sources to a Dimension
66 Analytics: Server Architect (Siebel 7.7)
Lab 5-3 Creating Multiple Sources for a Logical Table Source (Automated)
Goals To add the information from the additional product tables to the Product dimension.
Scenario So far, you have added the information from the price list table to the Product dimension. You are ready to add information from the other product tables to the Product dimension using an alternative method. You will create multiple sources for the Product logical table source that simultaneously adds the columns to the Product dimension.
Outcome In the Business Model and Mapping layer, the D1_prod_diet_types, D1_product_subtype D1_product_type, and d1_suppliers physical tables are added to the existing logical table source for the Products logical table. In the Business Model and Mapping layer, the Diet_type, ItemSubtype, ItemType, and ItemSupplier logical columns are added to the Products logical table and mapped to the appropriate physical tables.
Time 5 – 10 minutes
Instructions:
1. Add additional information to the Product dimension and simultaneously add a new source to the existing D1_products logical table source. a. In the Physical layer, expand the D1_prod_diet_types table and locate the Diet_type
column. b. In the Physical layer, drag the Diet_type column onto the D1_products logical table source
in the Products dimension in the Business Model and Mapping layer. c. Verify your results.
i. Was the Diet_type column added to the Product dimension?
ii. View the properties of the D1_products logical table source. iii. Click the Column Mapping tab. Is the Diet_type column mapped to the
D1_prod_diet_types physical table?
iv. Click Cancel.

Module 5: Adding Multiple Sources to a Dimension
Analytics: Server Architect (Siebel 7.7) 67
2. Repeat the above steps to add the following product information to the Products dimension, simultaneously adding new sources to the existing D1_products logical table source: Physical Table Physical Column
D1_product_subtype ItemSubtype
D1_product_type ItemType
d1_suppliers ItemSupplier a. Verify your results.
i. Open the D1_products logical source Properties window and click the Column Mapping tab to verify your results.
ii. What new table sources were added to the D1_products logical table source? It may be necessary to scroll to the right.
b. Click OK.
3. Rename the new logical columns in the Product dimension so they are meaningful to users. a. In the Business Model and Mapping layer, double-click the Diet_type logical column to
open the Properties window. b. To rename the column, enter Diet Type in the name field. c. Click OK. d. Rename the other new columns to the following:
From… To…
ItemSubtype Subtype
ItemType Type
ItemSupplier Supplier
4. Add the new product information to the SupplierSales presentation catalog. a. Drag the five new columns onto the Products table in the SupplierSales presentation catalog
and reorder the columns as follows: Column Name
Price
Type
Subtype
Diet Type
Supplier
5. Select File > Check Global Consistency to validate your work.
6. Select File > Save to save your work.

Module 5: Adding Multiple Sources to a Dimension
68 Analytics: Server Architect (Siebel 7.7)
7. Select File > Exit to close the Administration Tool.
8. Restart the Siebel Analytics Server and Siebel Analytics Web services. a. Select Start > Programs > Administrative Tools > Services. b. Restart the Siebel Analytics Server and Siebel Analytics Web services. c. Minimize the Services window.
9. Start Siebel Answers. a. Select Start > Programs > Siebel Analytics > Siebel Analytics Web. b. Enter the following parameters:
User Administrator Password <blank>
c. Click Log In. d. Click the Answers link.
10. Create a request. a. Select the SupplierSales subject area. b. Create the following request:
c. Click the Results tab to view the results.
11. Examine the query log to determine which table or tables have been accessed for this simple query. a. Double-click C:\SiebelAnalytics\Log\NQQuery.log. b. Scroll down and verify that three tables: D1_products, D1_product_subtype, and D1_product
type, have all been accessed, despite the fact that the D1_product_type table alone contains all the data requested.
c. Select File > Exit to close the query log. Note: In the next lab, you will specify a more economical way for the Analytics Server to access this data.
12. Select File > Close to close Siebel Answers.

Module 5: Adding Multiple Sources to a Dimension
Analytics: Server Architect (Siebel 7.7) 69
Solutions 5-3 Creating Multiple Sources for a Logical Table Source (Automated)
Answers
1.c.i. Was the Diet_type column added to the Product dimension? Yes
1.c.iii. Click the Column Mapping tab. Is the Diet_type column mapped to the D1_prod_diet_types physical table? Yes
2.a.ii. What new table sources were added to the D1_products logical table source? D1_prod_diet_types, D1_product_subtype, D1_product_type, and d1_suppliers
10.c. Click the Results tab to view the results.
11.b. Scroll down and verify that three tables: D1_products, D1_product_subtype, and D1_product type, have all been accessed, despite the fact that the D1_product_type table

Module 5: Adding Multiple Sources to a Dimension
70 Analytics: Server Architect (Siebel 7.7)
alone contains all the data requested.

Module 5: Adding Multiple Sources to a Dimension
Analytics: Server Architect (Siebel 7.7) 71
Lab 5-4 Specifying the Most Economical Source
Goals Add a second logical table source to the Product dimension.
Scenario In examining the physical sources and the Products dimension table, you discover that the columns, TypeCode and Type, are mapped to different physical tables, while the information for both is stored in a common physical table. In order to model the most economical method for the Siebel Analytics Server to find information for these two columns, you decide to add a second logical table source to the Product dimension so that the Siebel Analytics Server queries only one table for the TypeCode and Type information.
Outcome In the Business Model and Mapping layer, Type is added as second logical table source for the Products logical table.
Time 5 minutes
Instructions:
1. Open the Siebel Analytics repository file. a. Shut down the Siebel Analytics Server service. b. Double-click C:\SiebelAnalytics\Repository\abc.rpd. c. Log in as Administrator with no password.
2. Examine the existing column mappings for the two columns, Type and TypeCode, to determine the economical method for the Siebel Analytics Server to find information. a. In the Business Model and Mapping layer, expand the Sources folder of the Products table
and double-click D1_products. b. Click the Column Mapping tab. c. To what physical table and physical column is TypeCode mapped?
d. To what physical table and physical column is Type mapped?
e. Click Cancel to close the Properties window.
3. Determine which physical table stores information for both TypeCode and Type. a. In the Physical layer, expand the D1_product_type physical table. b. Verify that this table stores the information for TypeCode and ItemType.

Module 5: Adding Multiple Sources to a Dimension
72 Analytics: Server Architect (Siebel 7.7)
4. Model a new mapping for the TypeCode logical column by creating a second logical table source for the Products dimension. a. In the Business Model and Mapping layer, right-click the Sources folder for the Products
table and select New Logical Table Source. b. Verify that the General tab is selected. c. In the Name field, enter Type to name the new logical table source. d. Click Add. e. In the Browse dialog window, select the D1_product_type physical table and click Select. f. Click OK. g. Verify that the TypeCode column now maps to D1_product_type.
i. Double-click the Type logical table source you just configured to view the properties. ii. Click the Column Mapping tab. iii. Verify that TypeCode is mapped to the D1_product_type physical table.
Note: The TypeCode logical column was mapped automatically because the logical and physical names are identical. If they were not, you would need to select the physical table manually to map the column.
h. Map the Type column to the D1_product_type physical table. i. For the Type logical column, click the Expression field and select
“ABC”.”supplier2”.”dbo”.”D1_product_type”.”ItemType” from the drop-down list. ii. Click OK.
i. Verify the mappings. i. Double-click the Type logical table source. ii. Click the Column Mapping tab. iii. Deselect the Show unmapped columns check box. iv. Verify that TypeCode and Type are mapped to the d1_product_type physical table.
j. Leave the Properties window of the Type logical table source open for the next step.
5. There are now two logical table sources for the Products dimension and the TypeCode logical column maps to both. You need to let the Siebel Analytics Server know which source to use by specifying content for TypeCode and Type. a. Click the Content tab on the Type logical table source (the properties should be open from
the previous step). b. Click in the Table column, and select Products from the menu. c. Click in the Column column, and select TypeCode from the menu. d. In the next blank row, click in the Table column, and select Products from the menu. e. Click in the Column column, and select Type from the menu.

Module 5: Adding Multiple Sources to a Dimension
Analytics: Server Architect (Siebel 7.7) 73
f. Check your results:
g. Click OK.
6. Select File > Check Global Consistency to validate your work.
7. Select File > Save to save your work.
8. Select File > Exit to close the Administration Tool.
9. Return to Services to start services. a. Start the Siebel Analytics Server. b. Stop and start the Siebel Analytics Web service. c. Close Services.
10. Start Siebel Answers. a. Select Start > Programs > Siebel Analytics > Siebel Analytics Web. b. Enter the following parameters:
User Administrator Password <blank>
c. Click Log In. d. Click the Answers link.
11. Create a request. a. Select the SupplierSales subject area. b. Create the following request:
c. Click the Results tab to view the results.
12. Examine the query log to determine which table is accessed. a. Double-click C:\SiebelAnalytics\Log\NQQuery.log. b. Scroll down and verify that now only the d1_product_type table is accessed in this query.

Module 5: Adding Multiple Sources to a Dimension
74 Analytics: Server Architect (Siebel 7.7)
c. Select File > Exit to close the query log.
13. Return to Siebel Answers and select File > Close to close the application.

Module 5: Adding Multiple Sources to a Dimension
Analytics: Server Architect (Siebel 7.7) 75
Solutions 5-4 Specifying the Most Economical Source
Answers
2.c. To what physical table and physical column is TypeCode mapped? TypeCode is mapped to the D1_products physical table and to the TypeCode physical column.
2.d. To what physical table and physical column is Type mapped? Type is mapped to the D1_product_type physical table and to the ItemType physical column.

Module 5: Adding Multiple Sources to a Dimension
76 Analytics: Server Architect (Siebel 7.7)

Module 6: Adding Calculations to a Fact
Analytics: Server Architect (Siebel 7.7) 77
Lab 6-1 Creating Calculation Measures Using Logical Columns
Goals To derive a new calculation based on existing business measures.
Scenario You want users to be able to track the difference between the units ordered and units shipped by selecting a single fact column called Cuts. This important business measure can potentially help track lost revenue. You will configure a formula for Cuts using existing logical columns as objects in the formula. You are using existing logical columns because the physical data column names may change. The Expression Builder utility will help you configure the formula.
Outcome In the Business Model and Mapping layer, Cuts is added to the SalesFacts logical table. In the Presentation layer, Cuts is added to the SalesFacts presentation table.
Time 10 – 15 minutes
Instructions:
1. Stop the Siebel Analytics Server service. a. Select Start > Programs > Administrative Tools > Services. b. Right-click Siebel Analytics Server and select Stop. c. Leave Services open.
2. Start the Siebel Analytics Administration Tool and open the ABC repository offline. a. Select Start > Programs > Siebel Analytics > Siebel Analytics Administration. b. Select File > Open > Offline. c. Double-click ABC.rpd to open it. d. Verify that the login parameters are the following:
User ID Administrator Password <blank>
e. Click OK.
3. Define a new logical measure called Cuts (the difference between what was ordered and what was shipped) in the SalesFacts logical table that uses existing logical columns as its source. a. In the Business Model and Mapping layer, right-click the SalesFacts logical table and select
New Object > Logical Column. b. Verify that the General tab is selected. c. Enter Cuts in the Name field to name the column.

Module 6: Adding Calculations to a Fact
78 Analytics: Server Architect (Siebel 7.7)
d. Select the Use existing logical columns as the source check box. e. To open the Expression Builder, click the Ellipsis button (to the right of the text edit
box). f. In the left pane of the Expression Builder, select the Logical Tables folder. g. In the middle pane, select the SalesFacts logical column. h. In the right pane, select the Units Ordered logical column. i. Click Insert. j. Click the - minus sign on the toolbar. k. In the right pane, select the Units Shipped logical column. l. Click Insert. Check your results:
m. Click OK to close the Expression Builder. n. Examine the data type of the new Cuts column.
i. Select the Data Type tab. Note that the formula is expressed in terms of the physical column data types even though the formula is based on logical columns.
ii. What is the Data Type of the Cuts column?
o. Click OK.
4. Add the new Cuts column to the SupplierSales presentation catalog. a. In the Presentation layer, verify that the SupplierSales presentation catalog is expanded. b. Select Cuts from the SalesFacts logical table and drag it onto the SalesFacts presentation
table.
5. Select File > Check Global Consistency to validate your work.
6. Select File > Save to save your work.
7. Select File > Exit to close the Administration Tool.
8. Start the Siebel Analytics Server service and restart the Siebel Analytics Web service.
9. Start Siebel Answers. a. Select Start > Programs > Siebel Analytics > Siebel Analytics Web. b. Enter the following parameters:
User Administrator Password <blank>
c. Click Log In. d. Click the Answers link.
10. Click the SupplierSales subject area.

Module 6: Adding Calculations to a Fact
Analytics: Server Architect (Siebel 7.7) 79
11. Create the following request:
a. Click the Results tab to view the results.
i. Verify that the Cuts calculation is accurate for the Frozen food type by manually subtracting Units Shipped from Units Ordered.
ii. Is the value in the Cuts column for the Frozen food type accurate? iii. Verify that the Cuts calculation is accurate for the Lamb food type by manually
subtracting Units Shipped from Units Ordered. iv. Is the value in the Cuts column for the Lamb food type accurate?
12. Leave Siebel Answers open.
13. Examine the query log to see what query was sent to the database. a. Double-click C:\SiebelAnalytics\Log\NQQuery.log. b. Note that cuts is a column listed in the query and the two columns summed in the list of
columns appear as sum(T56.UnitShpd) and sum(T56.UnitOrdd). Also note that there is a subquery.
c. Select File > Exit to close the query log.
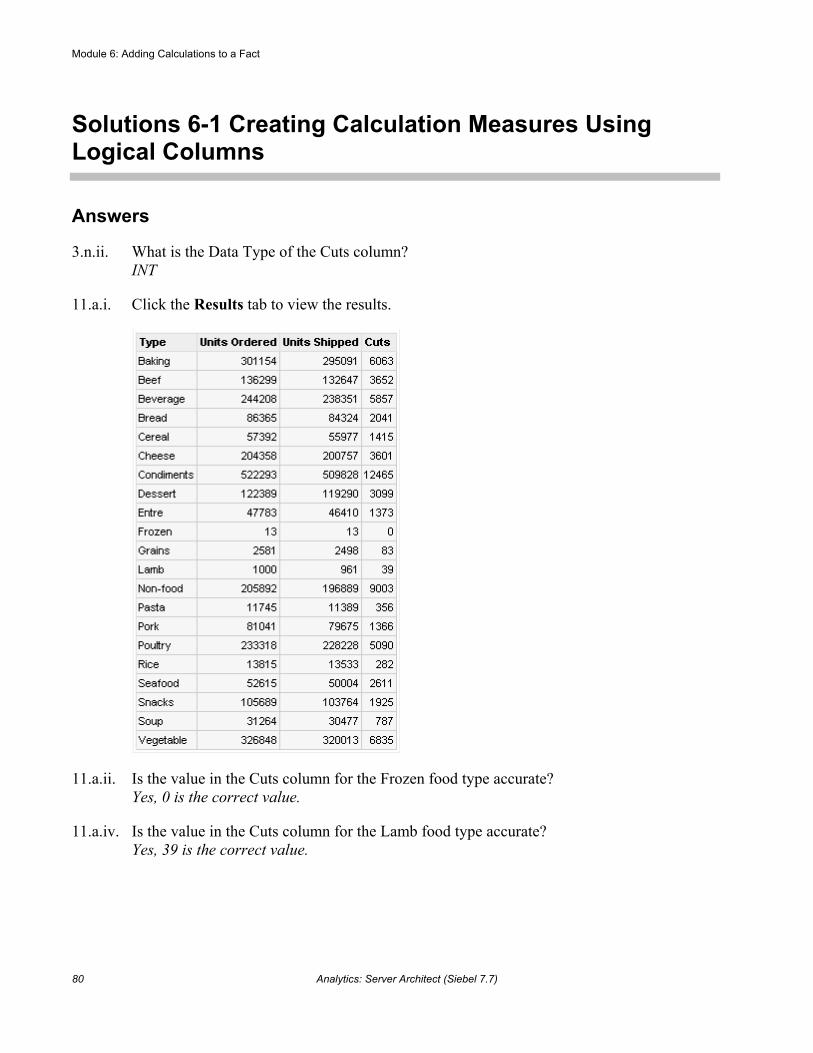
Module 6: Adding Calculations to a Fact
80 Analytics: Server Architect (Siebel 7.7)
Solutions 6-1 Creating Calculation Measures Using Logical Columns
Answers
3.n.ii. What is the Data Type of the Cuts column? INT
11.a.i. Click the Results tab to view the results.
11.a.ii. Is the value in the Cuts column for the Frozen food type accurate? Yes, 0 is the correct value.
11.a.iv. Is the value in the Cuts column for the Lamb food type accurate? Yes, 39 is the correct value.

Module 6: Adding Calculations to a Fact
Analytics: Server Architect (Siebel 7.7) 81
Lab 6-2 Creating Calculation Measures Using Physical Columns
Goals To modify a repository in Online mode and create a calculation measure using physical columns.
Scenario You want users to be able to track the difference between the units ordered and units shipped by selecting a single fact column called CutsP. You will configure a formula for CutsP using physical columns as objects in the formula. The Expression Builder utility will help you configure the formula.
Outcome In the Business Model and Mapping layer, CutsP is added to the SalesFacts logical table. In the Presentation layer, CutsP is added to the SalesFacts presentation table.
Time 10 – 15 minutes
Instructions:
1. Since you will be opening the ABC repository in Online mode, verify that the Siebel Analytics Server service is started. a. Return to Services and verify that the Siebel Analytics Server status is Started. b. Leave Services open.
2. Start the Siebel Analytics Administration Tool and open the ABC repository in Online mode. a. Select Start > Programs > Siebel Analytics > Siebel Analytics Administration. b. Select File > Open > Online. c. In the Open Online Analytics Web dialog box, verify the following parameters:
User ID Administrator Password <blank>
d. Click Open.
3. Verify that a user preference is set to check out objects automatically. a. On the menu bar, select Tools > Options. b. Select the General tab. c. Make sure that the Check out objects automatically check box is selected. d. Click OK.
4. Configure a new column in the SalesFacts table that will use physical columns as its source.

Module 6: Adding Calculations to a Fact
82 Analytics: Server Architect (Siebel 7.7)
a. In the Business Model layer, right-click the SalesFacts table and select New Object > Logical Column.
b. Type CutsP in the Name field to name the column. c. Set the aggregation rule to Sum.
i. Select the Aggregation tab. ii. In the Default aggregation rule field, click the drop-down arrow and select Sum. iii. Click OK. Notice that the icon for CutsP is blue. This indicates that the logical column
has not yet been checked in to the server.
5. Map the new CutsP column to a physical source. a. In the Business Model and Mapping layer, expand the Sources folder for the SalesFacts table
and double-click D1_Orders2. b. Select the Column Mapping tab. c. Select the Show unmapped columns check box. d. To open the Expression Builder, click the CutsP ellipsis (…) button. e. Display the physical table and column names.
i. In the left pane of the Expression Builder, select the Physical Tables folder. ii. In the middle pane, select the table, D1_Orders2.
f. Following the process used in the previous exercise, create a formula that subtracts units shipped from units ordered using physical columns. Check your results:
g. Click OK to close the Expression Builder. h. Click OK to close the properties window.
6. Add the new column to the SupplierSales presentation catalog. a. Select CutsP from the SalesFacts logical table and drag it onto the SalesFacts presentation
table in the Presentation layer.
7. Check in the changes made to the repository: a. Select File > Check In Changes. b. Reply Yes to the Check consistency? message. c. Click OK.
8. Select File > Save to save the repository changes.
9. Select File > Exit to close the Administration Tool.
10. Reload the server metadata in Siebel Answers. a. Return to Siebel Answers. b. Click the Reload Server Metadata link to update the repository.

Module 6: Adding Calculations to a Fact
Analytics: Server Architect (Siebel 7.7) 83
11. Create the following request:
a. Click the Results tab to view the results. b. Verify that the CutsP calculation is accurate for the Frozen food type by manually subtracting
Units Shipped from Units Ordered. Is the value in the CutsP column accurate?
c. Verify that the CutsP calculation is accurate for the Lamb food type by manually subtracting Units Shipped from Units Ordered. Is the value in the CutsP column accurate?
12. Select File > Close to close Siebel Answers.
13. Examine the query log to see what query was sent to the database: a. Double-click C:\SiebelAnalytics\Log\NQQuery.log.
i. Note that CutsP is a column listed in the query, and that the two columns summed in the list of columns appear as sum(T56.UnitOrdd - T56UnitShpd). Also note that there is no subquery.
b. Select File > Exit to close the query log.

Module 6: Adding Calculations to a Fact
84 Analytics: Server Architect (Siebel 7.7)
Solutions 6-2 Creating Calculation Measures Using Physical Columns
Answers
11.a. Click the Results tab to view the results.
11.b. Verify that the CutsP calculation is accurate for the Frozen food type by manually subtracting Units Shipped from Units Ordered. Is the value in the CutsP column accurate? Yes, 0 is the correct value.
11.c. Verify that the CutsP calculation is accurate for the Lamb food type by manually subtracting Units Shipped from Units Ordered. Is the value in the CutsP column accurate? Yes, 39 is the correct value.

Module 6: Adding Calculations to a Fact
Analytics: Server Architect (Siebel 7.7) 85
Lab 6-3 Creating Calculation Measures Using the Calculation Wizard
Goals To modify a repository in Offline mode and create calculation measures using the Calculation Wizard.
Scenario You want to model two calculation measures using the Calculation Wizard, called Chg Units Shipped and % Chg Units Shipped. The Chg Units Shipped measure calculates the difference between the units ordered and units shipped. The % Chg Units Shipped measure calculates what percentage of the units ordered has not shipped. The calculation measures that are created by the wizard are based on existing logical columns. You will rename these columns to CutsW and Percent Not Shipped in the Presentation layer.
Outcome In the Business Model and Mapping layer, Chg Units Shipped and % Chg Units Shipped are added to the SalesFacts logical table. In the Presentation layer, CutsW and Percent Not Shipped are added to the SalesFacts presentation table.
Time 10 – 15 minutes
Instructions:
1. Stop the Siebel Analytics Server. a. Return to Services. b. Right-click Siebel Analytics Server and select Stop. c. Leave Services open.
2. Start the Siebel Analytics Administration Tool and open the ABC repository offline. a. Select Start > Programs > Siebel Analytics > Siebel Analytics Administration. b. Select File > Open > Offline. c. Double-click ABC.rpd to open it. d. Verify that the login parameters are the following:
User ID Administrator Password <blank>
e. Click OK.
3. To model two calculation measures using the Calculation Wizard, start the Calculation Wizard from the Analytics Administration Tool. a. In the Business Model and Mapping layer, expand the SalesFacts table and right-click the
Units Ordered column and select Calculation Wizard.

Module 6: Adding Calculations to a Fact
86 Analytics: Server Architect (Siebel 7.7)
b. In the Calculation Wizard – Introduction dialog box, click Next. c. In the Compare “Units Ordered” with section, select the Units Shipped check box. d. In the Generate Calculations section, verify that the Change and Percent Change check
boxes are both checked. e. In the Generate Calculations section, verify that Change is highlighted.
f. Specify what result you want if the Change value is not available or zero using the following
parameters:
g. In the Generate Calculations section, select Percent Change so that is highlighted.
h. Specify what result you want if a value is not available or is zero using the following parameters:
i. Click Next.
4. Review the two calculations measures that are modeled by the Wizard and click Finish. a. In the Business Model and Mapping layer, locate the two columns created by the Calculation
Wizard in the SalesFacts table. What are the new column names?

Module 6: Adding Calculations to a Fact
Analytics: Server Architect (Siebel 7.7) 87
5. Add the new columns to the SupplierSales presentation catalog. a. Drag the new Chg Units Shipped and % Chg Units Shipped columns from the SalesFacts
logical table onto the SalesFacts presentation table in the Presentation layer. b. Rename the columns to the following:
(Hint: You will have to deselect the Use Logical Column Name check box in the properties window to rename the presentation columns.)
From… To…
Chg Units Shipped CutsW
% Chg Units Shipped Percent Not Shipped
6. Select File > Check Global Consistency to validate your work.
7. Select File > Save to save your work.
8. Select File > Exit to close the Administration Tool.
9. Start the Siebel Analytics Server service and restart the Siebel Analytics Web service.
10. Start Siebel Answers. a. Select Start > Programs > Siebel Analytics > Siebel Analytics Web. b. Enter the following parameters:
User Administrator Password <blank>
c. Click Log In. d. Click the Answers link.
11. Click the SupplierSales subject area.
12. Create the following request:
a. Click the Results tab to view the results. Note that Percent Not Shipped is displayed in
dollars. You will change this to percentage in a later step in this lab. i. Verify that the CutsW calculation is accurate for the Frozen food type by manually
subtracting Units Shipped from Units Ordered. Is the value in the CutsW column accurate?
ii. Verify that the CutsW calculation is accurate for the Lamb food type by manually subtracting Units Shipped from Units Ordered. Is the value in the CutsW column accurate?

Module 6: Adding Calculations to a Fact
88 Analytics: Server Architect (Siebel 7.7)
iii. To verify that the Percent Not Shipped value is accurate, you would divide CutsW by Units Shipped. For example, for the Lamb food type, you would divide 39 by 961 to get 4.06. This tells you that 4.06% of the units ordered have not shipped.
13. Format the Percent Not Shipped column to display percentages instead of dollars. a. Click the Edit View icon for the table. b. In the Percent Not Shipped column, click the Format Column icon. c. Select the Value Format tab. d. Select the Override Default Data Format check box. e. In the Treat Numbers As drop-down list, select Percentage. f. In the Digits drop-down list, select 2. g. Verify your changes:
h. Click OK. i. Notice that the format of the Percent Not Shipped column is now changed from dollars to
percentages.
14. Select File > Close to close Siebel Answers.
15. Examine the query log to see what query was sent to the database. a. Double-click C:\SiebelAnalytics\Log\NQQuery.log. b. Note that CutsW is a column listed in the query. Also note the percentage calculation.

Module 6: Adding Calculations to a Fact
Analytics: Server Architect (Siebel 7.7) 89
c. Select File > Exit to close the log file.

Module 6: Adding Calculations to a Fact
90 Analytics: Server Architect (Siebel 7.7)
Solutions 6-3 Creating Calculation Measures Using the Calculation Wizard
Answers
4.a. In the Business Model and Mapping layer, locate the two columns created by the Calculation Wizard in the SalesFacts table. What are the new column names? Chg Units Shipped and % Chg Units Shipped
12.a. Click the Results tab to view the results.
12.a.i. Verify that the CutsW calculation is accurate for the Frozen food type by manually subtracting Units Shipped from Units Ordered. Is the value in the CutsW column accurate? Yes, 0 is the correct value.
12.a.ii. Verify that the CutsW calculation is accurate for the Lamb food type by manually subtracting Units Shipped from Units Ordered. Is the value in the CutsW column accurate? Yes, 39 is the correct value.

Module 6: Adding Calculations to a Fact
Analytics: Server Architect (Siebel 7.7) 91
13.i. Notice that the format of the Percent Not Shipped column is now changed from dollars to percentages.

Module 6: Adding Calculations to a Fact
92 Analytics: Server Architect (Siebel 7.7)

Module 7: Creating Dimensional Hierarchies and Level-Based Measures
Analytics: Server Architect (Siebel 7.7) 93
Lab 7-1 Creating Dimensional Hierarchies
Goals To create a dimensional hierarchy to represent explicit parent child relationships within dimensional data.
Scenario You need to implement ABC’s hierarchies: • The levels in the product hierarchy are (top to bottom): Type, Subtype,
Generic, and Specific
• The levels in the customer hierarchy are (top to bottom): Region, District, Sales Representative, and Customer
• The levels in the period hierarchy are (top to bottom): Year, Month, and Day
Outcome In the Business Model and Mapping layer, ProductDim, CustomerDim, PeriodDim dimension objects.
Time 20 – 25 minutes
Instructions:
1. Open the Siebel Analytics repository file. a. Shut down the Siebel Analytics Server service. b. Double-click C:\SiebelAnalytics\Repository\abc.rpd. c. Log in as Administrator with no password.
2. In order to create the dimension, you need to know the levels in the hierarchy, the columns that uniquely define each level, and the distinct values for each level. a. The business will determine the levels, and you will be given that. In the case of the product
hierarchy for ABC, the levels are (top to bottom): Type, Subtype, Generic, and Specific.

Module 7: Creating Dimensional Hierarchies and Level-Based Measures
94 Analytics: Server Architect (Siebel 7.7)
b. The database administrator (DBA) will generally be able to provide you the columns that define each level. In ABC’s case, the keys are: Level Column on D1_products table that identifies the level
Type TypeCode
Subtype SubtypeCode
Generic GenericDescription
Specific SpecificDescriptin (this spelling is correct) You can determine the values to use for the “Number of elements at this level” by determining the distinct values for each key. The DBA can provide them, or you can use Update Row Count or run SQL to determine them.
c. To use Update Row Count, do the following in the Analytics Administration Tool: i. Select Tools > Update All Row Counts. The update will take a few moments to complete. ii. In the Physical layer, hover the cursor over D1_products.Type Code. Notice that there are
21 rows for the Type Code column. This is a simple way to determine the number of rows when defining the number of elements at a hierarchical level.
d. To run SQL to determine, you may also do the following: i. Select Start > Programs > Microsoft SQL Server > Query Analyzer to start the database
query tool. ii. Log in as sa with no password. iii. Type the following SQL (case is important):
select distinct TypeCode from supplier2..D1_products iv. Select Query > Execute to run the command. v. In the bottom right of the window, observe the number of rows returned. This will be the
value you would use when specifying the level in the hierarchy. Note: The remaining values will be provided for you in later steps.
vi. Select File > Exit to close Query Analyzer and click No to save changes.
3. Now that you have what you need, you will begin by creating a dimension object to represent the hierarchy of products. a. In the Business Model and Mapping layer, right-click SupplierSales and select New Object
> Dimension. The Dimension dialog box opens. b. In the Name field, type ProductDim. c. Click OK. The new dimension appears in the Business Model and Mapping layer. Notice the
arrow-like icon.
4. Now that you have the dimension created, you will add the parent level of the hierarchy.

Module 7: Creating Dimensional Hierarchies and Level-Based Measures
Analytics: Server Architect (Siebel 7.7) 95
a. Right-click the ProductDim dimension and select New Object > Logical Level. b. In the Name field, type TotalProduct. c. Since this level represents the grand total for products, click the Grand total level check
box. Notice that when you do this, the field “Supports rollup to parent elements” is grayed out and protected.
d. Notice that the field, “Number of elements at this level” has the value of 1. Note: The TotalProduct level has only one element (the grand total); therefore, 1 is the appropriate value for this level and cannot be changed.
e. Click OK. The new level appears as a child of the ProductDim dimension.
5. Add the child levels. a. Right-click the TotalProduct level and select New Object > Child Level. b. In the Name field, type Type. c. In the “Number of elements at this level” field, type 21. Recall that this is the value you
determined above. Note: The Siebel Analytics Server uses the number of elements to determine the best table to use when a query involves aggregating data to a specific level. The number of elements refers to the row count. The value does not have to be precisely correct.
d. Verify that Supports rollup to parent elements is checked. Note: This field is checked because if data is stored at the Type level, it can be aggregated to produce the total for its parent level without double counting or leaving anything out. There are some hierarchies where certain levels might not include all the elements of the dimension.
e. Click OK. The new level appears as a child of the TotalProduct level. f. Repeat the above steps to add further child levels:
Name Number of elements at this level
Subtype 158
Generic 185
Specific 191 g. Verify that your results appear as follows:
6. Specify which columns from the logical dimension table are associated with which levels in the dimensional hierarchy, starting from top to bottom. a. In the Business Model and Mapping layer, expand the Products table, select the Type
column, and drag it up onto the Type level.

Module 7: Creating Dimensional Hierarchies and Level-Based Measures
96 Analytics: Server Architect (Siebel 7.7)
b. Drag the logical column TypeCode onto the Type level. Check your results:
c. Continue dragging logical columns from the table to the dimensional hierarchy levels: Logical Column Dimensional Level
Subtype Subtype
SubtypeCode Subtype
Generic Generic
Specific Specific
ProductKey Specific d. Check your results:
7. Specify the keys for each child level in the hierarchy, starting from top to bottom. a. Specify two keys for the Type level and designate one for drilldown.
i. In ProductDim, double-click the Type level. The Level properties dialog box opens. ii. Select the Keys tab. iii. Click the New button. The Level Key dialog box opens. iv. Select the check box for Type. v. Verify that the check box Use for drilldown is selected. vi. Click OK. The attribute displays a key icon. vii. Click the New button again. viii. Select the check box for TypeCode. ix. Deselect the check box Use for drilldown. x. Click OK. xi. Click OK.

Module 7: Creating Dimensional Hierarchies and Level-Based Measures
Analytics: Server Architect (Siebel 7.7) 97
xii. Verify your result:
b. Specify two keys for the Subtype level, and designate one for drilldown.
i. In the ProductDim, double-click the Subtype level. ii. Select the Keys tab. iii. Click the New button. iv. Select the check box for Subtype. v. Verify that the check box Use for drilldown is selected. vi. Click OK. vii. Click the New button again. viii. Select the check box for SubtypeCode. ix. Deselect the check box Use for drilldown. x. Click OK. xi. Notice the difference in the key color. When users drill down from the Type level to the
Subtype level, Subtype will appear instead of SubtypeCode. xii. Click OK.
c. Continue specifying the following level keys: Dimensional Level Key Use for drilldown
Generic Generic Yes
Specific Specific Yes
Specific ProductKey No d. Check your final results:
e. Check consistency on the business model before creating more dimensions.
i. Right-click SupplierSales and select Check Consistency. ii. Verify that the business model is consistent before continuing on to the next step.
8. Repeat the above process to create the customer dimensional hierarchy.

Module 7: Creating Dimensional Hierarchies and Level-Based Measures
98 Analytics: Server Architect (Siebel 7.7)
a. Create a dimension object called CustomerDim. b. Create the levels within CustomerDim:
Name Number of elements at this level
Grand Total Level
Supports rollup to parent elements
TotalCustomer 1 Yes Protected
Region 3 No Yes
District 12 No Yes
SalesRep 34 No Yes
Customer 136 No Yes c. Add columns to the hierarchy by dragging logical columns from the Customers table to the
CustomerDim hierarchy levels: Logical Column Level
Region Region
District District
Sales Rep SalesRep
Customer Customer
Customer Key Customer d. Create the keys for each child level:
Level Key Use for drilldown
Region Region Yes
District District Yes
SalesRep Sales Rep Yes
Customer Customer Yes
Customer Customer Key No

Module 7: Creating Dimensional Hierarchies and Level-Based Measures
Analytics: Server Architect (Siebel 7.7) 99
e. Verify your work:
f. Check consistency on the business model before creating more dimensions.
i. Right-click SupplierSales and select Check Consistency. ii. Verify that the business model is consistent before continuing on to the next step.
9. Repeat the above process to create the period dimensional hierarchy. a. Create a dimension object called PeriodDim. b. Create the levels within the PeriodDim:
Name Number of elements at this level
Grand Total Level
Supports rollup to parent elements
TotalPeriod 1 Yes Protected
Year 2 No Yes
Month 16 No Yes
Day 474 No Yes c. Add columns to the hierarchy by dragging logical columns from the Periods table to the
PeriodDim hierarchy levels: Logical Column Level
Year Year
Month Month
MonthCode Month
Day Day
Date Day
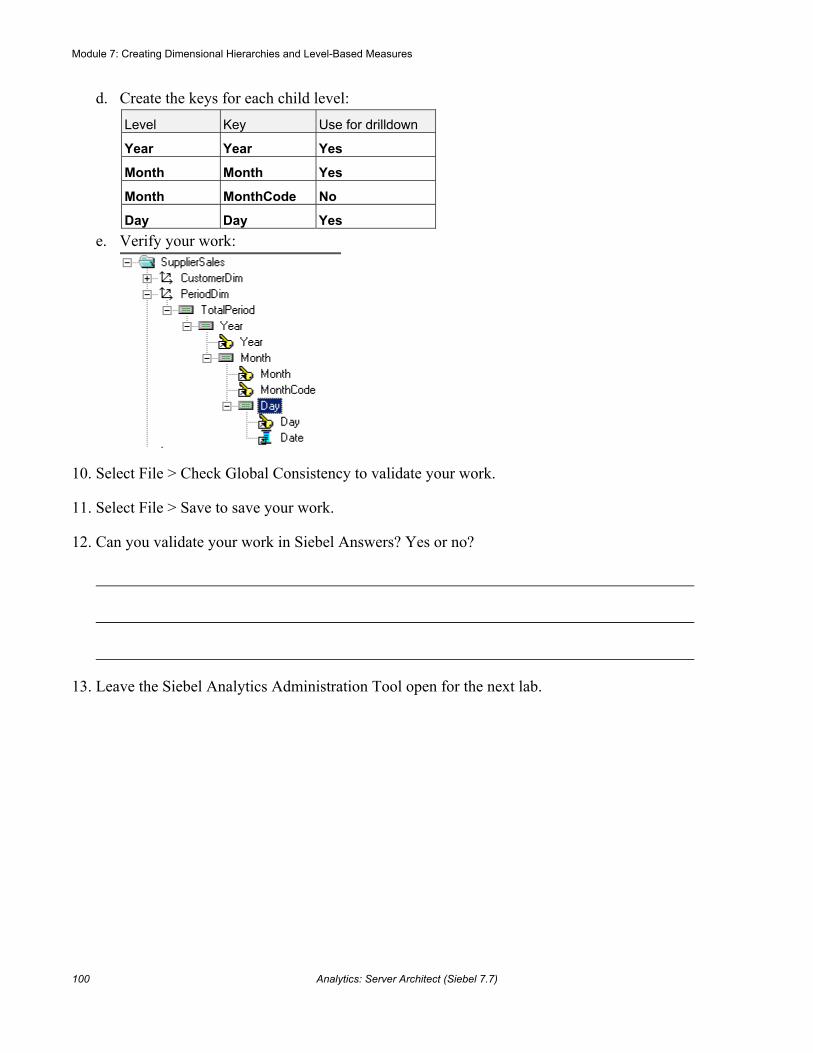
Module 7: Creating Dimensional Hierarchies and Level-Based Measures
100 Analytics: Server Architect (Siebel 7.7)
d. Create the keys for each child level: Level Key Use for drilldown
Year Year Yes
Month Month Yes
Month MonthCode No
Day Day Yes e. Verify your work:
10. Select File > Check Global Consistency to validate your work.
11. Select File > Save to save your work.
12. Can you validate your work in Siebel Answers? Yes or no?
13. Leave the Siebel Analytics Administration Tool open for the next lab.

Module 7: Creating Dimensional Hierarchies and Level-Based Measures
Analytics: Server Architect (Siebel 7.7) 101
Solutions 7-1 Creating Dimensional Hierarchies
Answers
12. Can you validate your work in Siebel Answers? Yes or no? Yes, in Siebel Answers, you can reload the server metadata and examine the dimensional hierarchies in the SupplierSales subject area through the drilldown capability that you have just configured. For example, you can create a request to query for Periods.Year and then drill down on year in the request results. You can also do the same for Customers.Region and Products.Type.

Module 7: Creating Dimensional Hierarchies and Level-Based Measures
102 Analytics: Server Architect (Siebel 7.7)
Lab 7-2 Creating Level-Based Measures
Goals To create level-based measures.
Scenario Now that you have created dimensional hierarchies, you want to use them to implement level-based measures that will calculate total dollars at various levels.
Outcome In the Business Model and Mapping layer, in SalesFacts, new logical columns: ProductTotalDollars, ProductTypeDollars, CustomerTotalDollars, RegionTotalDollars, PeriodTotalDollars, YearTotalDollars, MonthTotalDollars, and DayTotalDollars.
Time 20 – 25 minutes
Instructions:
1. Return to the Siebel Analytics Administration Tool or, if necessary, open the ABC.rpd for editing.
2. Create new logical fact columns to represent the product level totals based on existing fact columns. a. In the Business Model and Mapping layer, select the SalesFacts fact table. b. Right-click the SalesFacts table and select New Object > Logical Column. c. In the Name field, type ProductTotalDollars. d. Select the Use existing logical columns as the source check box. e. Click the ellipsis to open the Expression Builder. f. In the Expression Builder, select Logical Tables, SalesFacts, and Dollars and click Insert to
create this measure based on the existing Dollars fact column. The Dollars column has a default aggregation rule of SUM.
g. Click OK. h. Select the Levels tab. i. For the ProductDim, select TotalProduct from the Level drop-down list to specify that this
measure should be calculated at the grand total level in the product hierarchy. j. Click OK. Notice that setting the level causes the measure automatically to appear in the
dimensional hierarchy. k. Repeat to create a second level-based measure:
Name Dimension Level
ProductTypeDollars ProductDim Type

Module 7: Creating Dimensional Hierarchies and Level-Based Measures
Analytics: Server Architect (Siebel 7.7) 103
l. Check your final results for the Product dimension:
3. Expose the new columns to the users by dragging the new columns to the Sales Fact table in the SupplierSales catalog in the Presentation layer.
4. Rename the columns and rearrange them so that Product Type Dollars comes before Product Total Dollars:
5. Select File > Check Global Consistency to validate your work.

Module 7: Creating Dimensional Hierarchies and Level-Based Measures
104 Analytics: Server Architect (Siebel 7.7)
6. Repeat the above to create new logical fact columns to represent the customer level and period level totals. You can right-click and select Duplicate to copy and then change the properties: Name Dimension Level
CustomerTotalDollars CustomerDim TotalCustomer
RegionTotalDollars CustomerDim Region
PeriodTotalDollars PeriodDim TotalPeriod
YearTotalDollars PeriodDim Year
MonthTotalDollars PeriodDim Month
DayTotalDollars PeriodDim Day
7. Check your work:

Module 7: Creating Dimensional Hierarchies and Level-Based Measures
Analytics: Server Architect (Siebel 7.7) 105
8. Expose the new columns to the users by dragging the new columns to the SalesFact table in the Presentation layer. Rename and reorder them as appropriate.

Module 7: Creating Dimensional Hierarchies and Level-Based Measures
106 Analytics: Server Architect (Siebel 7.7)
9. Select File > Check Global Consistency to validate your work.
10. Select File > Save to save your work.
11. Select File > Exit to close the Siebel Analytics Administration Tool.
12. Test your results. a. Restart the Siebel Analytics Server and Siebel Analytics Web services. b. Start Siebel Analytics Web and log in as Administrator with no password. c. Click the Answers link. d. Click the SupplierSales subject area. e. Query for Products.TypeCode, SalesFacts.Product Type Dollars, SalesFacts.Product Total
Dollars, and click the Results tab:
i. Drill down on TypeCode to see more information.
f. Query for Customers.Region, SalesFacts.Region Total Dollars, SalesFacts.Customer Total Dollars, and click the Results tab:
i. Drill down on Region to see more information.

Module 7: Creating Dimensional Hierarchies and Level-Based Measures
Analytics: Server Architect (Siebel 7.7) 107
g. Query for Periods.MonthCode, SalesFacts.Month Total Dollars, SalesFacts.Period Total Dollars and click the Results tab:
i. Drill down on MonthCode to see more information.
13. Inspect the log file. a. Double-click C:\SiebelAnalytics\Log\NQQuery.log. b. Scroll to the bottom of the file and then back up to locate the SQL statement generated by the
results of the previous step. c. Notice the sum and group by clauses:
d. Select File > Exit to close the file.
14. Select File > Close to exit the Answers application.

Module 7: Creating Dimensional Hierarchies and Level-Based Measures
108 Analytics: Server Architect (Siebel 7.7)
Lab 7-3 Defining Share and Rank Measures
Goals To define share and rank measures.
Scenario Now that you have created level-based measures, you will use them to create share measures for products, customers, and periods. You will also add rank measures.
Outcome In the Business Model and Mapping layer, in SalesFacts, new logical columns: ProductShare, CustomerShare, PeriodShare, ProductRank, CustomerRank, PeriodRank.
Time 15 – 30 minutes
Instructions:
1. Open the repository for editing. a. Shut down the Siebel Analytics Server service. b. Double-click C:\SiebelAnalytics\Repository\abc.rpd. c. Log in as Administrator, no password.
2. Create a new share measure referencing existing logical columns. a. In the Business Model and Mapping layer, select the SalesFacts fact table. b. Right-click SalesFacts and select New Object > Logical Column. c. In the Name field, type ProductShare. d. Select the Use existing logical columns as the source check box. e. Open the Expression Builder by clicking the ellipsis. f. In the left pane, select the Functions folder. g. In the middle pane, select Mathematic Functions. h. In the right pane, select Round. i. Click Insert. The function appears in the edit box. j. Click between the first set of brackets (numExpr):
k. Type 100* followed by a [space]. l. Use the Logical Tables folder (left pane) to select the column, Dollars. m. Click Insert.
n. Using the toolbar, click the Division button. Another set of brackets appears (expr).

Module 7: Creating Dimensional Hierarchies and Level-Based Measures
Analytics: Server Architect (Siebel 7.7) 109
o. Click between the new brackets. p. Use the Logical Tables folder (left pane) to select the column, ProductTotalDollars. This is
the total measure for the hierarchy. q. Click Insert. r. Click between the last set of brackets (integer), and type 1. s. Check your results:
Note: When you create measures that involve a ratio, as you do with a share measure, you must be careful about data types and the potential for division by zero.
t. Click OK to close the Expression Builder. u. Click OK to close the Properties window.
3. Repeat the above to create two additional share measures: Hint: You can use duplicate. Name Reference in the Expression builder
CustomerShare CustomerTotalDollars
PeriodShare PeriodTotalDollars
4. Create a new rank measure referencing existing logical columns. a. In the Business Model and Mapping layer, select the SalesFacts fact table. b. Right-click the SalesFacts table and select New Object > Logical Column. c. In the Name field, type ProductRank. d. Select the Use existing logical columns as the source check box. e. Open the Expression Builder by clicking the ellipsis. f. In the left pane, select Functions. g. In the middle pane, select Display Functions. h. In the right pane, select Rank. i. Click Insert. j. Double-click numExpr. k. Select Logical Tables, SalesFacts, Dollars. l. Click Insert. m. Click OK.

Module 7: Creating Dimensional Hierarchies and Level-Based Measures
110 Analytics: Server Architect (Siebel 7.7)
n. Verify your calculation:
o. Click OK.
5. Repeat the process to create two additional rank measures: Name
CustomerRank
PeriodRank
6. Check consistency on the SupplierSales business model. If there are any consistency errors, correct them before continuing on to the next step.

Module 7: Creating Dimensional Hierarchies and Level-Based Measures
Analytics: Server Architect (Siebel 7.7) 111
7. Add the new measures to the Presentation layer by dragging them to the SalesFacts table in the SupplierSales catalog. Rename and order them so they are below the total dollar measures:
8. Select File > Check Global Consistency to validate your work.
9. Select File > Save to save your work.
10. Select File > Exit to close the Siebel Analytics Administration Tool.
11. Test your results. a. Restart the Siebel Analytics Server and Siebel Analytics Web services. b. Start Siebel Analytics Web and log in as Administrator with no password. c. Click the Answers link. d. Click the SupplierSales subject area. e. Query for Customers.Region, SalesFacts.Region Total Dollars, Customer Rank, Customer
Share and click the Results tab:

Module 7: Creating Dimensional Hierarchies and Level-Based Measures
112 Analytics: Server Architect (Siebel 7.7)
f. Modify your query to view results for Products.Type, SalesFacts.Product Type Dollars, Product Rank and Product Share:
g. Modify your query to view results for Periods.Year, SalesFacts.Year Total Dollars, Period
Rank and Period Share:
12. Select File > Close to exit the Answers application.

Module 8: Using Aggregates
Analytics: Server Architect (Siebel 7.7) 113
Lab 8-1 Using Aggregate Tables
Goals To use aggregate tables to speed processing.
Scenario The database administrator (DBA) for ABC has created aggregate tables:
• d1_salesreps contains one row for each sales representative, which can be considered an aggregation of the Customer dimension to the SalesRep level.
• d1_district contains one row for each district and region combination, which can be considered an aggregation of the Customer dimension to the District level.
• months contains one row for each year and month combination, which can be considered an aggregation of the Period dimension to the Month level.
• d1_order_agg1 contains sales facts aggregated to the Customer.Sales Rep level, and the Product.Type level and Period.Month level.
• d1_order_agg2 contains sales facts aggregated to the Customer.District level and Period.Month level. Product is at the lowest level (Specific).
• D1_product_type is already part of your model and contains one row for each product type, which can be considered an aggregation of the Product dimension to the Type level.
Outcome In the Physical layer, new physical sources for the aggregate tables listed above. In the Logical layer, new sources for Customers, Periods, and SalesFacts.
Time 30 – 35 minutes
Instructions:
1. Open the repository. a. Shut down the Siebel Analytics Server service. b. Double-click C:\SiebelAnalytics\Repository\abc.rpd to open the repository. Log in as
Administrator with no password.
2. Import the following physical aggregate tables from the ABC database into the Physical layer of the repository: Physical table
d1_salesreps

Module 8: Using Aggregates
114 Analytics: Server Architect (Siebel 7.7)
d1_district
months
d1_order_agg1
d1_order_agg2 a. Create the keys for the aggregate tables as follows:
Physical table Key columns
d1_salesreps SalesRep
d1_district District
months MonthCode
d1_order_agg1 repkey, typekey, and perkey
d1_order_agg2 distkey, prodkey, and perkey b. Create physical joins between the aggregate tables.
i. In the Physical layer, select dbo and click the Physical Diagram icon in the toolbar. ii. Select the New foreign key icon and click the tables (one side first, then the many side)
to create the following relationships. The joins use the following keys: Dimension aggregate (one side) Fact aggregate (many side)
d1_salesreps.SalesRep d1_order_agg1.repkey
d1_district.District d1_order_agg2.distkey
months.MonthCode d1_order_agg1.perkey
months.MonthCode d1_order_agg2.perkey
d1_product_type.TypeCode d1_order_agg1.typekey
d1_Products.ProductKey d1_order_agg2.prodkey
c. Select Manage > Joins to verify your work:
d. Close the Joins Manager.
3. Create new sources within the current logical fact that point to the aggregate tables. a. In the Physical layer, expand the d1_order_agg1 table. b. In the Business Model and Mapping layer, expand SupplierSales and SalesFacts.

Module 8: Using Aggregates
Analytics: Server Architect (Siebel 7.7) 115
c. Drag the following subset of columns (ActlExtnd, UnitShpd, UnitOrdd, and NetWghtShpd) from the physical aggregate table individually onto the corresponding SalesFacts logical columns. This will create the new d1_order_agg1 source and corresponding column mappings. Your result should look like this:
d. Repeat the process for the d1_order_agg2 table. Your result should look like this:
4. Specify the aggregation content for the new table sources for the SalesFacts table so that the Siebel Analytics Server knows what level of data is stored in the aggregate tables. a. Double-click d1_order_agg1 (in the Sources folder of the SalesFacts table). b. Select the Content tab. c. In the Aggregation content, group by field, verify that the value is Logical Level.

Module 8: Using Aggregates
116 Analytics: Server Architect (Siebel 7.7)
d. Use the drop-down menus in the Level field to specify the aggregation content as follows:
e. Click OK. f. Specify the content for the new table source, d1_order_agg2, in SalesFacts.
i. Double-click the table source d1_order_agg2 and select the Content tab. ii. Specify the aggregation content as follows:
iii. Click OK.
g. It is a leading practice to set the levels for the detail source to the lowest levels in the hierarchies. i. Double-click D1_Orders2 and select the Content tab. ii. Specify the aggregation content as follows:
iii. Click OK.
5. Create a new source within the Periods logical table (dimension source) that points to the month aggregate table. a. In the Physical layer, expand the months table. b. In the Business Model and Mapping layer, expand SupplierSales and Periods.

Module 8: Using Aggregates
Analytics: Server Architect (Siebel 7.7) 117
c. Drag the columns from the months aggregate table onto the corresponding Periods logical columns to create the mappings and the new source.
d. Check your results:
6. Specify the aggregation content for the new table source for the Periods table so that the Siebel Analytics Server knows what level of data is stored in the aggregate table. Recall that the months table contains data at the Month level within the period hierarchy. a. Select the Content tab in the months logical table source. b. In the Aggregation content, group by field, verify that the value is Logical Level. c. Use the drop-down menu in the Logical Level field to specify the aggregation content as
follows:
d. Click OK. e. It is a leading practice to set the level for the detail source to the lowest level in the hierarchy.
i. Double-click D1_Calendar2 and select the Content tab. ii. Specify the aggregation content as follows:
f. Apply a similar process as above to create new sources within the Customers logical table
(dimension source) that point to the d1_salesreps aggregate table and the d1_district table.

Module 8: Using Aggregates
118 Analytics: Server Architect (Siebel 7.7)
Your results should look like this:
7. Apply a similar process as above to specify the aggregation content for the new table sources for the Customers table so that the Siebel Analytics Server knows what level of data is stored in each aggregate table. Recall that the d1_salesreps table contains data at the SalesRep level within the Customer hierarchy, and the d1_district table contains data at the District level within the Customer hierarchy. Your results should look like this:

Module 8: Using Aggregates
Analytics: Server Architect (Siebel 7.7) 119
8. Inspect the Products source. a. In the Business Model and Mapping layer, expand the Sources folder within the Products
logical table and double-click Type. b. Select the Content tab and notice that the aggregation content is already specified at the
column level:
Since you now have a hierarchy defined for Products, you could change this to be level-based. However, this method will also work.
c. It is a leading practice to set the level for the detail source to the lowest level in the hierarchy. i. Double-click D1_products and select the Content tab.

Module 8: Using Aggregates
120 Analytics: Server Architect (Siebel 7.7)
ii. Specify the aggregation content as follows:
9. Select File > Check Global Consistency to validate your work.
10. Select File > Save to save your work.
11. Select File > Exit to close the Administration Tool.
12. Why don’t you need to change the Presentation layer?
13. Test your results. a. Start the Siebel Analytics Server service and restart the Siebel Analytics Web service. b. Start Siebel Analytics Web and log in as Administrator with no password. c. Click the Answers link. d. Click the SupplierSales subject area.

Module 8: Using Aggregates
Analytics: Server Architect (Siebel 7.7) 121
e. Query for Periods.MonthCode, Customers.Sales Rep, and SalesFacts.Dollars and click the Results tab:
14. Inspect the log file: a. Double-click C:\SiebelAnalytics\Log\NQQuery.log. b. Scroll to the bottom of the file and then back up to locate the last SQL statement. c. Verify that the query uses d1_order_agg1 and its related tables:

Module 8: Using Aggregates
122 Analytics: Server Architect (Siebel 7.7)
d. Select File > Exit to close the file.
15. Experiment with using Year in the query. a. Return to Answers and change your query to request Year instead of MonthCode. b. Run the query. c. Open the log file again and inspect the query. d. Notice that the query still uses the same aggregate tables. Why?
e. Close the log file.
16. Experiment with using Day in the query. a. Return to Answers and change your query to request Day instead of Year. b. Run the query. c. Open the log file and inspect the query. d. Notice that the detailed tables are accessed instead of the aggregate tables. Why?
e. Close the log file.
17. Experiment with queries against the d1_order_agg2 table. a. Return to Answers and change your query to request Products.Generic and
SalesFacts.Dollars. b. Run the query. c. Open the log file and inspect the query. d. Verify that the query uses the d1_order_agg2 and its related tables:
e. Close the log file. f. Return to Answers and change your query to request Customers.Sales District,
Periods.MonthCode, and SalesFacts.Dollars.

Module 8: Using Aggregates
Analytics: Server Architect (Siebel 7.7) 123
g. Run the query. h. Open the log file again and inspect the query. i. Notice that d1_order_agg1 is used instead of d1_order_agg2:
This is because the server determined it was cheaper to access d1_order_agg1 instead of d1_order_agg2 based on the levels specified in the dimension hierarchies. For example, to access d1_order_agg2, it estimates (12 districts * 12 months * 191 specific products) = 27504 potential rows versus (d1_order_agg1 at 34 sales reps * 16 months * 21 product types) = 11424 potential rows.
j. Close the log file.
18. You can force d1_order_agg2 to be used by changing the elements in the product dimension. a. Open the repository in Online mode. b. In the Business Model and Mapping layer, expand the ProductDim hierarchy and double-
click Type. c. Change the number of elements at this level from 21 to 2000:
d. Click OK. e. Continue to expand the hierarchy and double-click Specific.

Module 8: Using Aggregates
124 Analytics: Server Architect (Siebel 7.7)
f. Change the Number of elements at this level from 191 to 5:
g. Click OK. h. Select File > Check in Changes and click Yes to check consistency. i. Click OK. j. Return to Siebel Answers. k. Click Reload Server Metadata. l. Click the Criteria tab and add SalesFacts.Units Ordered to your request and run it. m. Look at the log and notice that this time, d1_order_agg2 is accessed:
n. Close the log file.
19. Repeat the prior step to reset the values back to their original values of 21 and 191, respectively.
20. Select File > Exit to close the Administration Tool. a. Click Yes to check in changes and save.
21. Select File > Close to exit Answers.

Module 8: Using Aggregates
Analytics: Server Architect (Siebel 7.7) 125
Solutions 8-1 Using Aggregate Tables
Answers
13. Why don’t you need to change the Presentation layer? You made changes in the business model that impact how the queries are processed and which sources will be accessed. The user interface remains the same, so there is no need to change the Presentation layer. It will automatically use the new sources.
15.d. Notice that the query still uses the same aggregate tables. Why? Year is at a higher level than month; therefore, the aggregate table can still be used.
16.d. Notice that the detailed tables are accessed instead of the aggregate tables. Why? The data requested is at a lower level than what is contained in the aggregate; therefore, the aggregate table doesn’t contain the data and the detail must be used.

Module 8: Using Aggregates
126 Analytics: Server Architect (Siebel 7.7)

Module 9: Using Partitions or Fragments
Analytics: Server Architect (Siebel 7.7) 127
Lab 9-1 Modeling a Value-Based Partition
Goals To model a value-based partition.
Scenario ABC wants to implement separate partitions for customer data. One partition will store data for customers A – M, the other will store data for customers N – Z.
Outcome In the Physical layer, new physical sources custAtoM and custNtoZ. In the Logical layer, changed sources for Customers.
Time 15 – 20 minutes
Instructions:
1. Examine the current results with all customer data in one source. a. If necessary, start the Siebel Analytics Server service. b. Start Siebel Analytics Web and log in as Administrator with no password. c. Click the Answers link. d. Click the SupplierSales subject area. e. Select Customers.Customer, SalesFacts.Dollars, and SalesFacts.Units Shipped and click
the Results tab. f. Record the name of the first customer in the list:
g. Click the last record button to move to the end of the list. h. Record the total number of customers in the list: i. Select File > Close to exit Siebel Answers.
2. Assume the role of the data base administrator (DBA) and create the new partitioned customer tables using Microsoft Query Analyzer. a. Select Start > Programs > Microsoft SQL Server > Query Analyzer. b. Log in as sa with no password.

Module 9: Using Partitions or Fragments
128 Analytics: Server Architect (Siebel 7.7)
c. Select supplier2 from the drop-down list to enter the supplier2 database:
d. Create the partitions using SQL. Type the following SQL in the window and click the green
arrow icon to run it: Note: Case is important. Select * into supplier2..D1_custAtoM from supplier2..D1_customer2 where Name < ‘N’
Select * into supplier2..D1_custNtoZ from supplier2..D1_customer2 where Name >= ‘N’
e. Select File > Exit and click No to close the application.
3. Open the repository file. a. Shut down the Siebel Analytics Server service. b. Double-click C:\SiebelAnalytics\Repository\abc.rpd to open the repository. Log in as
Administrator with no password.
4. Create the Physical layer in the repository to reference the new partitioned tables. a. Import the sources D1_custAtoM and D1_custNtoZ into the Physical layer:

Module 9: Using Partitions or Fragments
Analytics: Server Architect (Siebel 7.7) 129
b. Click the Physical Diagram and New foreign key icons to create the physical joins from the new customer tables to the D1_Orders2 table. The customer tables are on the one side of the one-to-many relationships. The joins use NewKey to CustKey.
c. Check your work:
5. Change the business model to use the new partitions instead of the original source. a. In the Physical layer, drag D1_custAtoM to Customers in the Business Model and Mapping
layer. b. Delete the following logical columns since they are duplicates and not needed: NewKey,
Name, and SalesRep. c. Double-click D1_custAtoM in the Sources folder and select the Content tab. d. Click the ellipsis button to open the Fragmentation Content expression builder. e. Select Logical Tables, Customers, and double-click Customer.

Module 9: Using Partitions or Fragments
130 Analytics: Server Architect (Siebel 7.7)
f. Click < and type ‘N’.
g. Click OK. h. Check This source should be combined with others at this level.

Module 9: Using Partitions or Fragments
Analytics: Server Architect (Siebel 7.7) 131
i. Select the Column Mapping tab and modify the mappings as follows:
j. Click OK. k. In the Physical layer, drag D1_custNtoZ to Customers in the Business Model and Mapping
layer. l. Delete the following logical columns since they are duplicates and not needed: NewKey,
Name, and SalesRep. m. Double-click D1_custNtoZ in the Sources folder and select the Content tab. n. Click the ellipsis button to open the Fragmentation Content expression builder. o. Select Logical Tables, Customers, and double-click Customer. p. Click >= and type ‘N’. q. Click OK. r. Check This source should be combined with others at this level.

Module 9: Using Partitions or Fragments
132 Analytics: Server Architect (Siebel 7.7)
s. Select the Column Mapping tab and modify the mappings as follows:
t. Click OK. u. Deactivate the original source by double-clicking D1_customer2, selecting the General tab,
and unchecking the Active flag. v. Click OK. w. Notice that you did not have to change the Presentation layer.
6. Select File > Check Global Consistency to validate your work.
7. Select File > Save to save your work.
8. Select File > Exit to close the Administration Tool.
9. Restart the Siebel Analytics Web service.
10. Test your results. a. Start the Siebel Analytics Server service. b. Start Siebel Analytics Web and log in as Administrator with no password. c. Click the Answers link. d. Click the SupplierSales subject area. e. Select Customers.Customer, SalesFacts.Dollars, and SalesFacts.Units Shipped and select the
Results tab. f. Compare your results to those in step 1. There should not be any difference.
11. Verify that the query being issued is accessing your new tables. a. Double-click C:\SiebelAnalytics\Log\NQQuery.log. b. Scroll to the end of the file. c. Scroll backwards to locate the last select statement.

Module 9: Using Partitions or Fragments
Analytics: Server Architect (Siebel 7.7) 133
d. Verify that it references your new tables:
e. Select File > Exit to close the log file.
12. Further test that your results are correct for names >= N: a. Return to Answers and add a filter to Customer to show names greater than N:
b. Run the query.
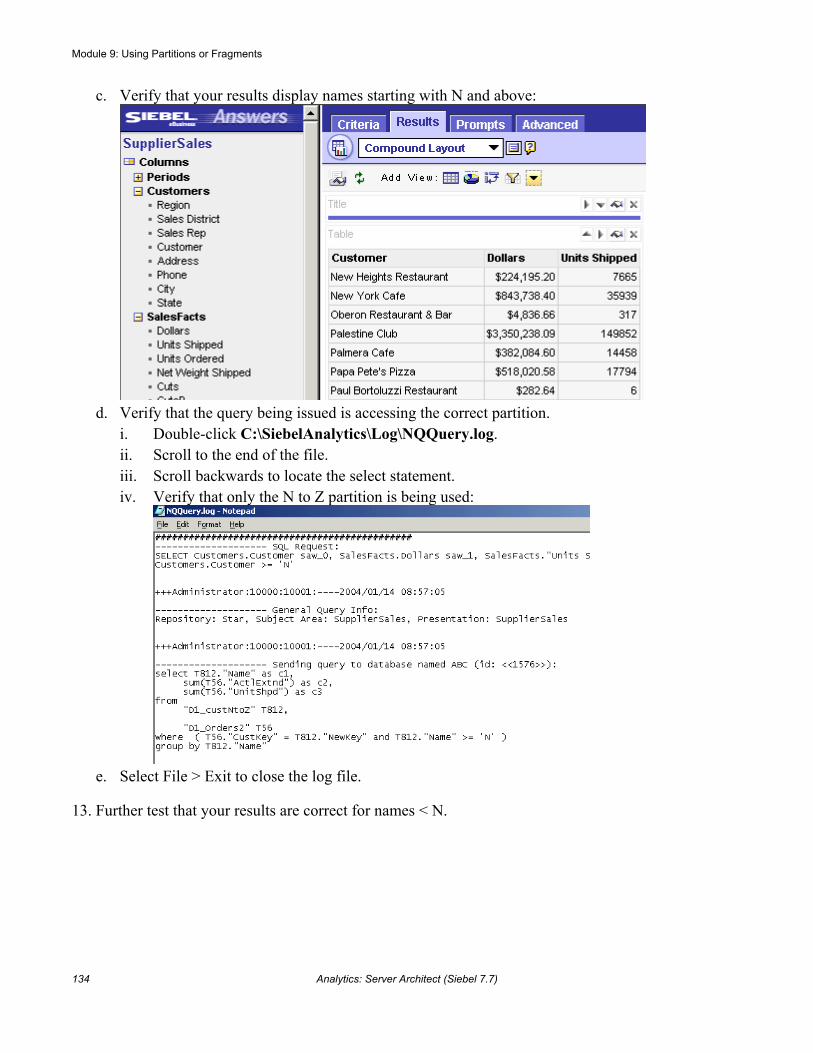
Module 9: Using Partitions or Fragments
134 Analytics: Server Architect (Siebel 7.7)
c. Verify that your results display names starting with N and above:
d. Verify that the query being issued is accessing the correct partition.
i. Double-click C:\SiebelAnalytics\Log\NQQuery.log. ii. Scroll to the end of the file. iii. Scroll backwards to locate the select statement. iv. Verify that only the N to Z partition is being used:
e. Select File > Exit to close the log file.
13. Further test that your results are correct for names < N.

Module 9: Using Partitions or Fragments
Analytics: Server Architect (Siebel 7.7) 135
a. Return to Answers and change the filter to show names less than N:
b. Run the query. c. Verify that your results display names less than N.
d. Verify that the query being issued is accessing the correct partition:
i. Double-click C:\SiebelAnalytics\Log\NQQuery.log. ii. Scroll to the end of the file. iii. Scroll backwards to locate the select statement.

Module 9: Using Partitions or Fragments
136 Analytics: Server Architect (Siebel 7.7)
iv. Verify that only the A to M partition is being used:
e. Select File > Exit to close the log file. f. Select File > Close to exit Siebel Answers.

Module 9: Using Partitions or Fragments
Analytics: Server Architect (Siebel 7.7) 137
Solutions 9-1 Modeling a Value-Based Partition
Answers
1.f. Record the name of the first customer in the list: 2nd & Goal Sports Cafe
1.h. Record the total number of customers in the list: 134

Module 9: Using Partitions or Fragments
138 Analytics: Server Architect (Siebel 7.7)

Module 10: Using Repository Variables
Analytics: Server Architect (Siebel 7.7) 139
Lab 10-1 Using Dynamic Repository Variable
Goals To create and use a dynamic repository variable.
Scenario ABC has implemented separate partitions for customer data. However, when the partitions get reloaded, 50% of the data will be loaded into the first partition and 50% of the data will be loaded into the second partition. The variable will determine how the data is split between the partitions.
Outcome New initialization block CustomerDataSplit with EndPartOne variable. In the Business layer, modified Customers sources.
Time 10 – 15 minutes
Instructions:
1. Open the repository file. a. Shut down the Siebel Analytics Server service. b. Double-click C:\SiebelAnalytics\Repository\abc.rpd to open the repository. Log in as
Administrator with no password.
2. Create the initialization block. a. Select Manage > Variables. b. Select Action > New > Initialization Block. c. In Name, type CustomerDataSplit to name the block. d. Click the Browse button. e. Select the ABC connection pool object SUPPLIER CP. f. Click the Select button.
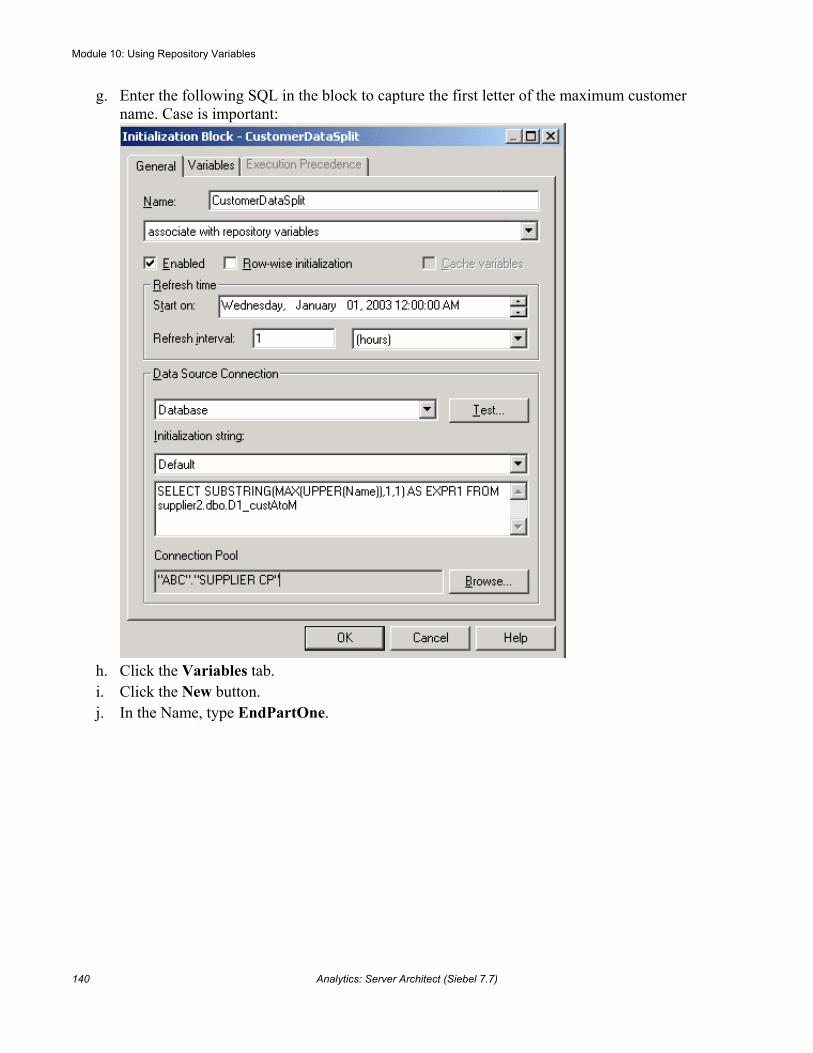
Module 10: Using Repository Variables
140 Analytics: Server Architect (Siebel 7.7)
g. Enter the following SQL in the block to capture the first letter of the maximum customer name. Case is important:
h. Click the Variables tab. i. Click the New button. j. In the Name, type EndPartOne.

Module 10: Using Repository Variables
Analytics: Server Architect (Siebel 7.7) 141
k. Enter ‘A’ in the Default initializer section:
l. Click OK. m. Select the General tab and click Test to test the variable:
n. Click Close. o. Click OK to save the initialization block just created. p. Close the Variable Manager window.
3. Use the variable to dynamically determine the content in the customer sources. a. In the Business Model and Mapping layer, expand Customers and its Sources. b. Double-click D1_customer2. c. Select the General tab and verify that the source is inactive. d. Click OK. e. Double click D1_custAtoM. f. Click the General tab. g. In the Name, enter CustPartOne. h. Verify that the Active box is checked.

Module 10: Using Repository Variables
142 Analytics: Server Architect (Siebel 7.7)
i. Select the Content tab. j. Change the expression to use the variable.
i. Open the Expression Builder by clicking the ellipsis button. ii. Highlight the < ‘N’ and press the BACKSPACE key to remove the text. iii. Click the <= button. iv. Select Repository Variables and double-click EndPartOne. v. Click OK. vi. Check your result:
k. Verify that the This source should be combined with other sources at this level check box
is checked. l. Click OK. m. Double-click D1_custNtoZ. n. Click the General tab. o. In the Name, enter CustPartTwo. p. Verify that the Active box is checked. q. Select the Content tab. r. Change the expression to use the variable.
i. Open the Expression Builder by clicking the ellipsis button. ii. Highlight the >= ‘N’ and press the BACKSPACE key to remove the text. iii. Click the > button. iv. Select Repository Variables and double-click EndPartOne. v. Click OK.

Module 10: Using Repository Variables
Analytics: Server Architect (Siebel 7.7) 143
vi. Check your result:
s. Verify that the This source should be combined with other sources at this level check box
is checked. t. Click OK.
4. Select File > Check Global Consistency to validate your work.
5. Select File > Save to save your work.
6. Select File > Exit to close the Administration Tool.
7. Test your results. a. Start the Siebel Analytics Server service and restart the Siebel Analytics Web service. b. Examine the initialization block in the log file.
i. Double-click C:\SiebelAnalytics\Log\NQQuery.log. ii. Scroll to the end of the file and scroll backwards to locate the initialization block:
c. Select File > Exit to close the log file. d. Start Siebel Analytics Web and log in as Administrator with no password. e. Click the Answers link. f. Click the SupplierSales subject area. g. Select Customers.Customer.

Module 10: Using Repository Variables
144 Analytics: Server Architect (Siebel 7.7)
h. Add a filter for customer names less than B:
i. Run the query. j. Verify that your results display names starting less than B:
k. Verify that the query being issued is accessing the correct partition.
i. Double-click C:\SiebelAnalytics\Log\NQQuery.log. ii. Scroll to the end of the file and scroll backwards to locate the select statement.

Module 10: Using Repository Variables
Analytics: Server Architect (Siebel 7.7) 145
iii. Verify that the D1_custAtoM table is being used:
l. Select File > Exit to close the log file.
8. Further test your results. a. Return to Answers and change the filter to provide names greater than X.
b. Run the query.

Module 10: Using Repository Variables
146 Analytics: Server Architect (Siebel 7.7)
c. Verify the results:
d. Verify that the SQL in the log file references the D1_custNtoZ table:
e. Select File > Exit to close the file. f. Select File > Close to exit Siebel Answers.

Module 11: Modeling Time Series Data
Analytics: Server Architect (Siebel 7.7) 147
Lab 11-1 Creating Comparison Measures
Goals Implement time comparison measures in the business model using the Time Series Wizard.
Scenario Users want to compare dollar performance against dollar performance a year ago and a month ago, and calculate the dollar change and the percent of the dollar change. You will use the Time Series Wizard to create the metadata for these comparison measures in the SupplierSales business model.
Outcome In the Business Model and Mapping layer, Year Ago Dollars, Chg Year Ago Dollars, % Chg Year Ago Dollars, Month Ago Dollars, Chg Month Ago Dollars, and % Chg Month Ago Dollars columns are added to the SalesFacts table.
Time 5 minutes
Instructions:
1. Open the Siebel Analytics repository file. a. Shut down the Siebel Analytics Server service. b. Double-click C:\SiebelAnalytics\Repository\ABC.rpd to open the repository. Log in as
Administrator with no password.
2. Use the Time Series Wizard to model comparison measures and a calculation measure that compares dollar performance against dollar performance a year ago. a. In the Business Model and Mapping layer, right-click SupplierSales and select Time Series
Wizard. b. Click Next on the Welcome… dialog box. c. Specify a naming convention for the new comparison measures created by the wizard.
i. In the Tag for comparison period field, enter Year Ago. ii. Select the Prefix radio button to add the Year Ago tag as a prefix to the comparison
measures and calculations that will be configured. iii. Select the Spaces radio button to specify that spaces be used as delimiters. iv. Click Next.
d. Specify the period table. i. Select the months period table. ii. Click Next.
e. Verify that the Override internal object generation check box is not selected and click Next. f. Specify the period table key column.
i. In the Comparison Period Key Column section, select YAGO. ii. Click Next.

Module 11: Modeling Time Series Data
148 Analytics: Server Architect (Siebel 7.7)
g. Specify Dollars as the comparison measure. i. In the Generate Comparison Measure section, select the Dollars check box. ii. Verify that Create is selected from the drop-down menu.
h. Specify the Change and Percent Change calculations for Dollars. i. In the Generate Calculations section, verify that the Change and Percent Change
check boxes are selected. i. Specify the result you want if the Change Year Ago Dollars comparison measure is NULL or
zero. i. In the Generate Calculations section, verify that Change is highlighted.
ii. Use the following parameters to specify what result you want if the Change Year Ago
Dollars comparison measure is NULL or zero:
j. Specify what result you want if the Percent Change Year Ago Dollars comparison measure is not available or zero. i. In the Generate Calculations section, select Percent Change so that is highlighted.

Module 11: Modeling Time Series Data
Analytics: Server Architect (Siebel 7.7) 149
ii. Use the following parameters to specify what result you want if the Percent Change Year Ago Dollars comparison measure is not available or zero:
k. Click Next. l. Review the comparison and calculation measures the wizard configured.
i. Verify that the Year Ago Dollars comparison measure appears. ii. Verify that the Chg Year Ago Dollars and % Chg Year Ago Dollars calculation
measures appear:
m. Review additional metadata the wizard created.
i. Select the Show also internal objects check box to see additional metadata.

Module 11: Modeling Time Series Data
150 Analytics: Server Architect (Siebel 7.7)
ii. Review the aliases, joins, logical table sources, measures, and calculations that will be modeled by the wizard:
n. Click Finish to close the wizard.
3. Use the Time Series Wizard to model comparison and calculation measures that compare dollar performance against dollar performance a month ago. a. To start the Time Series Wizard, right-click SupplierSales and select Time Series Wizard.
Follow the prompts to set the following parameters: Tag for comparison period Month Ago Using tag as Prefix Delimit words using Spaces Period Table months Override internal object generation [default] not selected Comparison Period Key Column MAGO Generate Comparison Measure Dollars Generate Calculations Change and Percent Change When Month Ago Dollars Change Is NULL return value = 0 When Month Ago Dollars Percent Change
Is not available return Is available but Dollars is not available return Is not available and Dollars is not available return
NULL
-100.00
NULL

Module 11: Modeling Time Series Data
Analytics: Server Architect (Siebel 7.7) 151
b. Verify that the measures and calculations created:
c. Click Finish.
4. Leave the Analytics Administration Tool and the ABC repository open for the next lab.

Module 11: Modeling Time Series Data
152 Analytics: Server Architect (Siebel 7.7)
Lab 11-2 Testing the Comparison Measures and Calculations
Goals Examine the metadata created by the Time Series Wizard and test the new comparison measures and calculations created with the Time Series Wizard.
Scenario You have created new measures and calculations to enable users to compare dollar performance a year ago and a month ago and calculate the dollar change and the percent of dollar change. You want to examine the metadata created by the wizard, add the new measures to the presentation catalog, and test the comparison measures using Siebel Answers.
Outcome In the Presentation layer, Year Ago Dollars, Change Year Ago Dollars, Percent Change Year Ago Dollars, Month Ago Dollars, Change Month Ago Dollars, and Percent Change Month Ago Dollars columns are added to the SalesFacts table. New comparison measures are tested using Siebel Answers.
Time 15 minutes
Instructions:
1. From the Analytics Administration Tool, examine the metadata created by the Time Series Wizard in the Physical layer. a. In the Physical layer, what alias fact tables now appear in the ABC physical database?
(Hint: Alias fact tables have icons with green arrows.)
b. Double click Month Ago d1_order_agg1 to open the properties window. c. On the General tab, how can you identify that this alias fact table was created by the Time
Series Wizard?
d. Click the Foreign Keys tab. i. This alias table is joined to which tables?

Module 11: Modeling Time Series Data
Analytics: Server Architect (Siebel 7.7) 153
2. Examine the metadata created by the Time Series Wizard in the Business Model and Mapping layer. a. In the Business Model and Mapping layer, expand the SalesFacts table. b. Verify that the following logical columns were added to the SalesFacts logical table:
c. Expand the Sources folder for the SalesFacts table. d. Verify that the following logical table sources were created:
e. Double click the Year Ago d1_order_agg1 source to open the Properties window. f. How can you identify that this source was created by the Time Series Wizard?
g. What fact table is this source based on?
h. Click the Column Mapping tab. i. What physical table does the Year Ago Dollars comparison measure map to?
3. Add the new measures and calculations to the SupplierSales presentation catalog. a. Drag the six new logical columns from the SalesFacts logical table onto the SalesFacts
presentation table in the Presentation layer. b. In the Presentation layer, rename the columns to the following:
Column Names
Dollars Year Ago
Change Dollars Year Ago
Percent Change Dollars Year Ago
Dollars Month Ago

Module 11: Modeling Time Series Data
154 Analytics: Server Architect (Siebel 7.7)
Change Dollars Month Ago
Percent Change Dollars Month Ago
4. Since you are no longer using separate partitions for customer data, activate the D1_customer2 logical data source for the Customers table and deactivate the two partitioned data sources. a. In the Business Model and Mapping layer, expand the Customers table and the Sources
folder. b. Open the properties for the D1_customer2 logical table source. Select the General tab,
select the Active check box, and click OK. c. Open the properties for the CustPartOne logical table source. Select the General tab,
deselect the Active check box, and click OK. d. Open the properties for the CustPartTwo logical table source. Select the General tab,
deselect the Active check box, and click OK. e. Check your results:
5. Select File > Check Global Consistency to validate your work.
6. Select File > Save to save your work.
7. Select File > Exit to close the Administration Tool.
8. Test your results. a. Start the Siebel Analytics Server service and restart the Siebel Analytics Web service. b. Start Siebel Analytics Web and log in as Administrator with no password. c. Click the Answers link. d. Click the SupplierSales subject area.
9. Test the new Year Ago measures a. Build the following request. Notice that the request has a filter on Year.

Module 11: Modeling Time Series Data
Analytics: Server Architect (Siebel 7.7) 155
b. Run the query and view the results:
Note: By default, the Percent Change Dollars Year Ago column displays in dollars. You may format the column to display the results as a percentage. Refer to previous labs if you need help on how to format this column.
c. To verify Percent Change Dollars Year Ago, divide the Change Dollars Year Ago value by the Dollars Year Ago value.
d. To verify Changed Dollars Year Ago, subtract Dollars Year Ago from Dollars.
10. Test the new Month Ago measures with the following request. Notice that the request has a primary sort on Region and a secondary sort on MonthCode.
a. Run the query and view the results:
b. You would verify the percentage change measure for a month ago by dividing the Change
Dollars Month Ago value by the Dollars Month Ago value.
11. Select File > Close to close Siebel Answers.

Module 11: Modeling Time Series Data
156 Analytics: Server Architect (Siebel 7.7)
Solutions 11-2 Testing the Comparison Measures and Calculations
Answers
1.a. In the Physical layer, what alias fact tables now appear in the ABC physical database? (Hint: Alias fact tables have icons with green arrows.) Month Ago d1_order_agg1, Month Ago d1_order_agg2, Year Ago d1_order_agg1, and Year Ago d1_order_agg2
1.c. On the General tab, how can you identify that this alias fact table was created by the Time Series Wizard? The text “Generated by Time Series Wizard” appears in the Description section.
1.d.i. This alias table is joined to which tables? D1_product_type, d1_salesreps
2.f. How can you identify that this source was created by the Time Series Wizard? Click the General tab and you will see the text “Generated by Time Series Wizard, based on: Period Table months” in the Description section.
2.g. What fact table is this source based on? d1_order_agg1
2.i. What physical table does the Year Ago Dollars comparison measure map to? Year Ago d1_order_agg1

Module 12: Modeling Slowly Changing Dimensions
Analytics: Server Architect (Siebel 7.7) 157
Lab 12-1 Modeling the Physical Layer for the Slowly Changing Dimension
Goals To model a physical source that supports a slowly changing dimension (SCD).
Scenario ABC has decided to implement a Type Two SCD for their customer data to account for changes in the sales representative alignments. Here you will model the physical source, the CustomersSCD table.
Outcome In the Physical layer, CustomersSCD table and joins.
Time 10 – 15 minutes
Instructions: You have consulted with your database administrator (DBA) and determined that the changes necessary in the source system are ready. You will now model the new physical source in Siebel Analytics. From this point forward you will be using the SupplierExtend database instead of the supplier2 database. It has all of the original tables and more.
1. Inspect the physical SCD table. This table is in the SupplierExtend database. a. Select Start > Programs > Microsoft SQL Server > Enterprise Manager to use the Microsoft
database utility to view the tables. b. Expand the entries in the left pane to expose the Databases. c. Expand the SupplierExtend database and click Tables to view the tables in that database. d. Right-click CustomersSCD and select Open Table > Return Top… e. Enter 10 and click OK. f. What are the names of the columns that help track the changes?
g. What are the values for SalesRep, EffStDate, and EffEndDate for the first row (Customer Name = Times On Bay) in the CustomersSCD table, and what do they represent?

Module 12: Modeling Slowly Changing Dimensions
158 Analytics: Server Architect (Siebel 7.7)
h. Click the SQL button at the top of the CustomersSCD window:

Module 12: Modeling Slowly Changing Dimensions
Analytics: Server Architect (Siebel 7.7) 159
i. Type Where (EffEndDate < 30000000) below the FROM clause in the top windowpane and click the ! button to run the SQL and determine which accounts have changed hands:
j. Notice that the New York Cafe account was owned by FRED FRIENDLY. Change the SQL
to query for all rows for the New York Cafe account by changing the Where clause to WHERE Name = ‘New York Cafe’ and clicking the ! button to run:
k. Who was the next person to take over the New York Cafe account, and on which date was
the ownership changed? Does that person still own the account?
l. Select Console > Exit to close Enterprise Manager.

Module 12: Modeling Slowly Changing Dimensions
160 Analytics: Server Architect (Siebel 7.7)
2. Create an ODBC data source to access the SupplierExtend database. a. Select Start > Programs > Administrative Tools > Data Sources (ODBC) to open the ODBC
Data Source Administrator dialog box. b. Select the System DSN tab. c. Click Add. d. Select the SQL Server driver. e. Click Finish. f. In the Name field, enter ABCEXTEND. g. In the Server field, select (local). h. Click Next. i. Specify authentication.
i. Select the With SQL Server authentication… radio button. ii. Select the Connect to SQL Server to obtain default settings… check box. iii. In the Login ID field, enter sa and leave the Password field blank. iv. Click Next.
j. Specify the default data source. i. Select the Change the default database to check box, then click the drop-down arrow
and select SupplierExtend. ii. Click Next.
k. Click Finish. l. Test that the data source connection is valid.
i. Click the Test Data Source button and verify that you get the message, “…TESTS COMPLETED SUCCESSFULLY!”
ii. Click OK. iii. Click OK.
m. Click OK to close the ODBC Data Source Administrator.
3. Open the repository. a. Shut down the Siebel Analytics Server service. b. Double-click C:\SiebelAnalytics\Repository\abc.rpd. c. Log in as Administrator, no password.
4. Change the connection pool for your existing model to use the new datasource. a. In the Physical layer, double-click the connection pool for ABC. b. In the Data source name field, select ABCEXTEND. c. Click OK.
5. Import the table definition for the SCD source table. a. Select File > Import > from Database and select ABCEXTEND and click OK to connect to
the SupplierExtend database. b. Expand the objects and select CustomersSCD and click Import. c. Click Close.

Module 12: Modeling Slowly Changing Dimensions
Analytics: Server Architect (Siebel 7.7) 161
d. Notice that another source was created in the Physical layer. Since all the tables you previously modeled are also in the SupplierExtend database, you can consolidate them all into one database. i. Expand ABC until you see dbo. ii. Expand ABCEXTEND until you see CustomersSCD. iii. Drag CustomersSCD from within dbo in ABCEXTEND onto dbo in ABC. iv. Right-click ABCEXTEND and select Delete and click Yes to delete.
6. Create the physical primary key for the CustomersSCD table. Set the composite key to include NewKey, EffStDate, and EffEndDate. Do not create multiple keys.
7. Create the physical join. Recall that customers are joined with orders through customer number. Since customer number or NewKey is no longer enough to distinguish a row, you must join on more than just this key. a. Use the physical diagram to create the complex join between D1_Orders and CustomersSCD
as follows. i. In the Physical layer, expand dbo, select Customers SCD and CTRL+click
D1_Orders2. ii. Click the Physical Diagram icon. iii. Click the New complex join icon, which is the icon in the toolbox that is to the right. iv. Click D1_Orders2 and then CustomersSCD.

Module 12: Modeling Slowly Changing Dimensions
162 Analytics: Server Architect (Siebel 7.7)
v. Use the Expression Builder and type in the criteria as follows:
vi. Click OK. vii. Why do you need to include the BETWEEN clause in the join?
b. Close the Physical Diagram.
8. Leave the Administration Tool open.

Module 12: Modeling Slowly Changing Dimensions
Analytics: Server Architect (Siebel 7.7) 163
Solutions 12-1 Modeling the Physical Layer for the Slowly Changing Dimension
Answers
1.f. What are the names of the columns that help track the changes? EffStDate and EffEndDate.
1.g. What are the values for SalesRep, EffStDate, and EffEndDate for the first row (Customer Name = Times On Bay) in the CustomersSCD table, and what do they represent? ALAN ZIFF, 19980101, and 30000000 represent the effective start date of 01/01/1998 with a maximum end date of 00/00/3000, which signifies that ALAN ZIFF has been the sales person of record for the Times on Bay customer since January 1, 1998 and still is.
1.k. Who was the next person to take over the New York Cafe account, and on which date was the ownership changed? Does that person still own the account? VIRGIL JOHNSTON; 06/16/1998; yes
7.a.vii. Why do you need to include the BETWEEN clause in the join? You want to make sure the right customer sales representative is associated to the order based on the time the order was placed.

Module 12: Modeling Slowly Changing Dimensions
164 Analytics: Server Architect (Siebel 7.7)
Lab 12-2 Modeling the Logical Layer for the Slowly Changing Dimension
Goals To model the Logical layer for a slowly changing dimension.
Scenario You need to mimic the work you did for the original customer dimension to create the new customer dimension that contains the historical information (the SCD Type Two physical source). This entails creating the dimension and supporting hierarchy.
Outcome In the Business Model and Mapping layer, CustomersSCD and CustomerHistoryDim.
Time 15 – 30 minutes
Instructions:
1. Create the new customer logical table, CustomersSCD, by dragging CustomersSCD from the Physical layer to SupplierSales in the Business Model and Mapping layer.
2. Create a complex join using the Business Model diagram. a. In the Business Model layer, right-click SupplierSales. b. Select Business Model Diagram > Whole Diagram. c. Click the New Complex Join icon. d. Click CustomersSCD and then click SalesFacts e. Select 0,1 for CustomersSCD. f. Select N for SalesFacts. g. Click OK. h. Close the diagram.

Module 12: Modeling Slowly Changing Dimensions
Analytics: Server Architect (Siebel 7.7) 165
3. Recall that the original customer dimension, CustomerDim, has this hierarchical structure:
4. Create a new hierarchy called CustomerHistoryDim for CustomersSCD that mimics CustomerDim that you previously created for Customers. (Hint: You can use duplicate to copy CustomerDim and then modify CustomerHistoryDim as necessary.) a. Create a dimension object called CustomerHistoryDim. b. Right-click and create the levels:
Name Number of elements at this level
TotalCustomer 1 (Remember to check the Grand total level check box)
Region 3
District 12
SalesRep 34
Customer 136 c. If you used duplicate to copy the dimension, delete the existing columns in
CustomerHistoryDim. d. Add columns to the hierarchy by dragging logical columns from the CustomersSCD logical
table to the CustomerHistoryDim hierarchy levels: Logical Column Level
Region Region
District District
Sales Rep SalesRep
Name Customer
NewKey Customer e. Create the keys for each child level:
Level Key Use for drilldown
Region Region Yes
District District Yes

Module 12: Modeling Slowly Changing Dimensions
166 Analytics: Server Architect (Siebel 7.7)
SalesRep Sales Rep Yes
Customer Name Yes
Customer NewKey, EffStDate, and EffEndDate (Note: This is a composite key including all three of the columns. When you define the key, click Add to add the additional columns.)
No
f. Verify your work:
g. You would next need to continue to create any necessary level-based measures. We will skip
this part for the purposes of our testing.
5. Set the level of CustomerSCD facts that are in the SalesFacts source. a. In the Business Model and Mapping layer, expand SalesFacts, open the Sources folder, and
double click D1_Orders2. b. Select the Content tab. c. For CustomerHistoryDim, select Customer for the Logical Level. d. Click OK.
6. Right-click SupplierSales and select Check Consistency to validate your business model.
7. Select File > Save and click No to Check Global Consistency.
Leave the Administration Tool open for the next lab.
Module 12: Modeling Slowly Changing Dimensions
Analytics: Server Architect (Siebel 7.7) 167
Lab 12-3 Modeling the Presentation Layer for the Slowly Changing Dimension
Goals To add the Presentation layer so Siebel Answers can query the new dimension.
Scenario ABC wishes to have the current customer data and the historical customer data visible to users in Siebel Answers.
Outcome In the Presentation layer, CustomersSCD table.
Time 10 – 20 minutes
Instructions:
1. In the Business Model and Mapping layer, select CustomersSCD and drag it on top of SupplierSales in the Presentation layer to create the new presentation table. You would normally delete the key columns since they are unimportant to users. However, during testing it will be helpful to you, so you will not delete them.
2. Select File > Check Global Consistency to validate your repository.
3. Select File > Save to save your work.
4. Select File > Exit to close the Administration Tool.
5. Test your results. a. Start the Siebel Analytics Server service and restart the Siebel Analytics Web service. b. Start Siebel Analytics Web and log in as Administrator with no password. c. Click the Answers link. d. Click the SupplierSales subject area. e. Query the original customer dimension by selecting Customers.Sales Rep,
Customers.Customer, SalesFacts.Dollars, and run the query.

Module 12: Modeling Slowly Changing Dimensions
168 Analytics: Server Architect (Siebel 7.7)
f. Scroll to see the sales for Kathy Lobo and Linda Rivero:
g. Notice that the Alley-Cats customer is listed as Linda’s account. h. Query the new Customer History table and compare your results.
i. Select CustomersSCD.Name, CustomersSCD.SalesRep, CustomersSCD.EffStDate, CustomersSCDEffEndDate, SalesFacts.Dollars, and run the query. Note: If you do not yet see the new presentation columns in the Answers UI, click
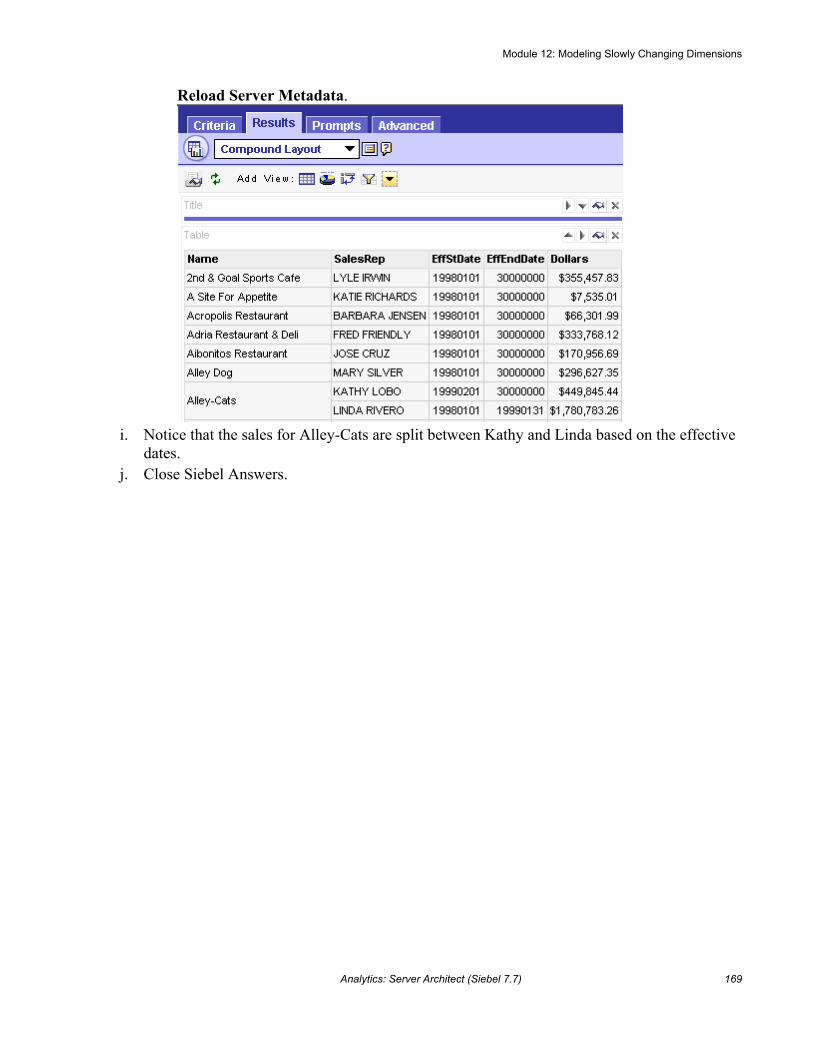
Module 12: Modeling Slowly Changing Dimensions
Analytics: Server Architect (Siebel 7.7) 169
Reload Server Metadata.
i. Notice that the sales for Alley-Cats are split between Kathy and Linda based on the effective
dates. j. Close Siebel Answers.

Module 12: Modeling Slowly Changing Dimensions
170 Analytics: Server Architect (Siebel 7.7)

Module 13: Modeling Extension Tables
Analytics: Server Architect (Siebel 7.7) 171
Lab 13-1 Modeling a Dimension Extension Table
Goals To model a dimension extension table.
Scenario ABC wants to show price category as an additional customer dimension attribute. It is stored on a physical extension table.
Outcome In the Physical layer, a Customer2x table. In the Business Model and Mapping layer, a modified Customers logical table. In the Presentation layer, a modified Customers presentation table.
Time 5 – 10 minutes
Instructions:
1. Examine the structure of the physical tables that store the customer data. The main customer information is in D1_customer2; the extension attributes are in Customer2x. a. Select Start > Programs > Microsoft SQL Server > Enterprise Manager to use the Microsoft
database utility to view the tables. b. Expand the entries in the left pane to expose the Databases. c. Expand the SupplierExtend database and click Tables to view the tables in the database. d. Right-click D1_customer2 and select Open Table > Return Top. e. Enter 10 and click OK. f. Right-click Customer2x and select Open Table > Return Top. g. Enter 10 and click OK. h. How do the tables relate? What is the primary/foreign key relationship?
i. Leave Enterprise Manager open because you will use it during the testing below.
2. Open the repository. a. Shut down the Siebel Analytics Server service. b. Double-click C:\SiebelAnalytics\Repository\abc.rpd. Log in as Administrator with no
password.
3. Create the physical source in the repository that points to the extension table. a. Select File > Import > from Database. b. Select ABCEXTEND and click OK. c. Expand and select Customer2x. d. Click Import.

Module 13: Modeling Extension Tables
172 Analytics: Server Architect (Siebel 7.7)
e. Click Close. f. Drag Customer2x from within dbo in ABCEXTEND to dbo in ABC and delete
ABCEXTEND.
4. Create the physical joins using the physical diagram. a. In the Physical layer, select Customer2x, D1_customer2, and D1_Orders2 and click the
Physical Diagram icon in the toolbar. b. Use the new foreign key icon to construct the joins. The extension table should be on the one
side. Click Yes to create the key prompts. Extension column Main column
Customer2x.Custkey D1_customer2.NewKey
Customer2x.Custkey D1_Orders2.CustKey c. Verify the physical joins:
d. Close the Physical Diagram.
5. Add a separate logical table source for the extension to the logical dimension table. a. In the Business Model and Mapping layer, expand Customers. b. Right-click Sources and select New Logical Table Source. c. In Name, type Customer Extension. d. Click Add. e. Select Customer2x. f. Click Select. g. Click OK.
6. Add the logical columns from the extension table. a. In the Physical Layer, expand Customer2x. b. Drag PriceCategory onto Customers in the Business Model and Mapping layer. c. Drag Custkey from the Physical layer onto CustomerKey in the Business Model and
Mapping layer.
7. Add the extension column to the Presentation layer by dragging PriceCategory to SupplierSales.Customers.

Module 13: Modeling Extension Tables
Analytics: Server Architect (Siebel 7.7) 173
8. Select File > Check Global Consistency to validate your work.
9. Select File > Save to save your work.
10. Select File > Exit to close the Administration Tool.
11. Test your results. a. Start the Siebel Analytics Server service and restart the Siebel Analytics Web service. b. Start Siebel Analytics Web and log in as Administrator with no password. c. Click the Answers link. d. Click the SupplierSales subject area. e. Run a request to display Customers.Customer and Customers.PriceCategory:
f. Compare the result in Siebel Answers with the result in Enterprise Manager.
i. Return to Enterprise Manager. ii. In the D1_customer2 window, click the SQL icon. iii. Enter where Name = ’93 Church Street’ and click ! to run. iv. What is the NewKey value for 93 Church Street?
v. In the Customer2x window, what is the PriceCategory associated with Custkey 1004?
vi. In Answers, verify the Price Category for 93 Church Street is 5.
12. View the SQL used to produce the result. a. Double-click C:\SiebelAnalytics\Log\NQQuery.log.

Module 13: Modeling Extension Tables
174 Analytics: Server Architect (Siebel 7.7)
b. Scroll to the end of the file and then backwards to locate the select statement:
c. Why is the SQL accessing both the main and extension table?
13. Validate that the SQL is optimal. a. Return to Answers and remove the PriceCategory from the Criteria and rerun the query. b. Close and open the log file and inspect the select statement:
c. Why isn’t the extension table in the query?
d. Return to Answers and remove the column. e. Query for Customers.PriceCategory, SalesFacts.Dollars. f. Close and open the log file and inspect the select statement.

Module 13: Modeling Extension Tables
Analytics: Server Architect (Siebel 7.7) 175
i. Which tables are used in the query, and why?
g. Select File > Exit to close the file. h. Select File > Close to exit Answers. Leave Enterprise Manager open for the next lab.

Module 13: Modeling Extension Tables
176 Analytics: Server Architect (Siebel 7.7)
Solutions 13-1 Modeling a Dimension Extension Table
Answers
1.h. How do the tables relate? What is the primary/foreign key relationship? The Custkey column in Customer2x is the foreign key to the primary key, NewKey column in the D1_customer2 table.
11.f.iv. What is the NewKey value for 93 Church Street? 1004
11.f.v. In the Customer2x window, what is the PriceCategory associated with Custkey 1004? 5
12.c. Why is the SQL accessing both the main and extension table? The request from answers asked for Price Category, which is on the extension table, and Customer Name, which is on the main table.
13.c. Why isn’t the extension table in the query? Because no data was requested from the extension table, and the way we modeled the extension will not force a join unless data is necessary.
13.f.i. Which tables are used in the query, and why? PriceCategory comes from the extension table Customer2x. D1_customer2 is joined to the extension table and main table D1_Orders2. Dollars comes from the main table D1_Orders2.

Module 13: Modeling Extension Tables
Analytics: Server Architect (Siebel 7.7) 177
Lab 13-2 Modeling a Fact Extension Table
Goals To model a fact extension table.
Scenario ABC wants to show credits as an additional order measure (fact). It is stored on a physical extension table.
Outcome In the Physical layer, d1_Orders2X. In the Business Model and Mapping layer, modified SalesFacts. In the Presentation model layer, modified SalesFacts (includes Credits).
Time 10 – 20 minutes
Instructions:
1. Examine the structure of the physical fact tables for order. The main order information is in D1_Orders2, the extension attributes are in d1_Orders2X. a. Return to Enterprise Manager. b. Right-click D1_Orders2 and select Open Table > Return Top. c. Enter 10 and click OK. d. Right-click d1_Orders2X and select Open Table > Return Top. e. Enter 10 and click OK. f. How do the tables relate? What is the primary/foreign key relationship?
g. Close Enterprise Manager.
2. Open the repository. a. Shut down the Siebel Analytics Server service. b. Double-click C:\SiebelAnalytics\Repository\abc.rpd. Log in as Administrator with no
password.
3. Create the physical source in the repository that points to the extension table. a. Select File > Import > from Database. b. Select ABCEXTEND and click OK. c. Expand and select d1_Orders2X. d. Click Import. e. Click Close.

Module 13: Modeling Extension Tables
178 Analytics: Server Architect (Siebel 7.7)
f. Drag d1_Orders2X from within dbo in ABCEXTEND to dbo in ABC and delete ABCEXTEND.
4. Add the ROW_WID column that stores the line item information to the orders table in the Physical layer. Note: The ROW_WID column stores the line item information on the D1_Orders2 table on the SupplierExtend database. Since the ABC database object in the Physical layer is now accessing the SupplierExtend database, you can add this column to the D1_Orders table. a. Double-click D1_Orders2. b. Click the Columns tab and click New. c. In the Name field, enter ROW_WID. d. In the Type field, select INT from the menu. e. Click OK to close the Physical Column dialog box. f. Click OK to close the Properties window.
5. Create the physical joins using the physical diagram. a. In the Physical layer, select d1_Orders2x and D1_Orders2 and click the Physical Diagram
icon. b. Use the New Foreign Key icon to construct the join. The extension table should be on the one
side. Click Yes to create the key prompts. Extension column Main column
d1_Orders2X.ROW_WID D1_Orders2.ROW_WID c. Verify the physical join:
6. Add the extension table to the existing source for the facts. a. In the Business Model and Mapping layer, expand SalesFacts and Sources. b. Double-click D1_Orders2. c. Select the General tab. d. Click Add. e. Select d1_Orders2X and click Select.
Note: In ABC’s case, every order has a row in the extension so a join type of Inner is appropriate. You would adjust this to Left Outer if rows might not be in the extension table.

Module 13: Modeling Extension Tables
Analytics: Server Architect (Siebel 7.7) 179
f. Verify your work:
g. Click OK.
7. Add the logical columns from the extension table. a. In the Physical Layer, expand D1_Orders2X. b. Drag CMDolrs onto SalesFacts in the Business Model and Mapping layer. c. Rename CMDolrs to Credits. d. Double-click Credits. e. Select the Aggregation tab. f. Select Sum. g. Click OK. h. In the Physical Layer, drag ROW_WID from d1_Orders2X onto SalesFacts in the Business
Model and Mapping layer.

Module 13: Modeling Extension Tables
180 Analytics: Server Architect (Siebel 7.7)
i. Verify your work:
8. Add the extension column to the Presentation layer by dragging Credits from the Business Model and Mapping layer onto SalesFacts in SupplierSales in the Presentation layer.
9. Select File > Check Global Consistency to validate your work.
10. Select File > Save to save your work.
11. Select File > Exit to close the Administration Tool.
12. Test your results. a. Start the Siebel Analytics Server service and restart the Siebel Analytics Web service. b. Start Siebel Analytics Web and log in as Administrator with no password. c. Click the Answers link. d. Click the SupplierSales subject area.
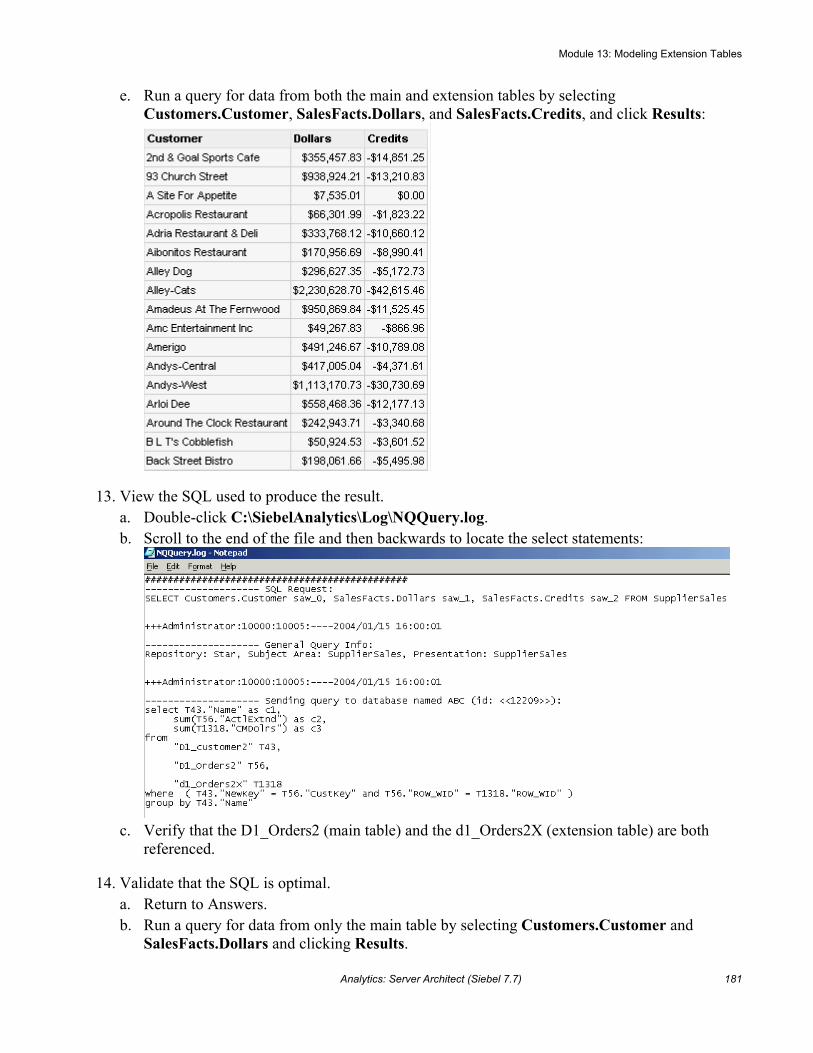
Module 13: Modeling Extension Tables
Analytics: Server Architect (Siebel 7.7) 181
e. Run a query for data from both the main and extension tables by selecting Customers.Customer, SalesFacts.Dollars, and SalesFacts.Credits, and click Results:
13. View the SQL used to produce the result. a. Double-click C:\SiebelAnalytics\Log\NQQuery.log. b. Scroll to the end of the file and then backwards to locate the select statements:
c. Verify that the D1_Orders2 (main table) and the d1_Orders2X (extension table) are both
referenced.
14. Validate that the SQL is optimal. a. Return to Answers. b. Run a query for data from only the main table by selecting Customers.Customer and
SalesFacts.Dollars and clicking Results.

Module 13: Modeling Extension Tables
182 Analytics: Server Architect (Siebel 7.7)
c. Close and open the log file and inspect the select statement. Verify that the extension table is not referenced in the query:
d. Return to Answers. e. Remove all columns from your query. f. Query for Periods.Month, SalesFacts.Credits. g. Close and open the log file and inspect the select statement. h. Why was the main fact table accessed even though no data was requested from it?
i. Why didn’t you model the extension table as a separate source?
15. Select File > Exit to close the log file.
16. Select File > Close to close Siebel Answers.

Module 13: Modeling Extension Tables
Analytics: Server Architect (Siebel 7.7) 183
Solutions 13-2 Modeling a Fact Extension Table
Answers
1.f. How do the tables relate? What is the primary/foreign key relationship? The extension table relates to the main table via ROW_WID.
14.h. Why was the main fact table accessed even though no data was requested from it? The only way to access the dimension is through the main fact table. There is no join from the extension to the dimensions.
14.i. Why didn’t you model the extension table as a separate source? There are no foreign keys on the extension to the dimension tables. The extension needs to go through the main table to get to the dimension data.

Module 13: Modeling Extension Tables
184 Analytics: Server Architect (Siebel 7.7)

Module 14: Analytics Security
Analytics: Server Architect (Siebel 7.7) 185
Lab 14-1 Creating Users and Groups
Goals To set up user access so that the Analytics Server can authenticate users and assign them appropriate permissions.
Scenario You have been instructed to create new users and groups using the Siebel Analytics Administration Tool. Once you have created these users, you will assign them to their appropriate group.
Outcome Newly created users and security groups. Assigned users as group members.
Time 10 – 15 minutes
Instructions:
1. Open the ABC repository in Online mode. a. Select Start > Programs > Siebel Analytics > Siebel Analytics Administration. b. Select File > Open > Online. c. Click Open to accept the default User and Password.
2. Create the user Sara Wright. a. Check out all objects in the ABC repository by selecting File > Check Out All. b. Open the Security Manager by selecting Manage > Security. c. Select Users in the left pane. d. Right-click in the right pane and select New User. e. Create the user with the following information:
User name SWRIGHT Full Name Sara Wright Password <Blank> Logging level 2
Note: Setting the logging level field to 2 ensures query activity will be recorded in the Query Log.
f. Click OK to close the User window.
3. Repeat this process and create the following users: User Name Full Name Logging Level
PSMITH Paul Smith 0
RMIND Rob Mind 0
JCRAFT Jen Craft 0

Module 14: Analytics Security
186 Analytics: Server Architect (Siebel 7.7)
MWEST Mary West 2
JMEYER Jacob Meyer 2
4. In the Security Manager window, verify that your results resemble the following:
5. Create the SalesManagers group and add Sara Wright and Paul Smith to this group. a. In the left pane of the Security Manager, select Groups. b. Right-click in the right pane and select New Security Group. c. Enter SalesManagers in the Name field and click the Add button. d. Select SWRIGHT. e. Press CTRL+PSMITH. This allows you to simultaneously select Wright and Smith. f. Click OK. Wright and Smith are now part of the SalesManagers group. g. Click OK to close the Group dialog box.
6. Repeat this process and create the following two groups and assign users to the groups: Group Name Add User
SalesUsers RMIND, JCRAFT
SalesHR JMEYER
7. Assign MWEST to the Administrators group. a. Double-click Administrators. b. Add MWEST.
Note: At this point, the group and user structure resembles the following:
SalesManagers Group SalesUsers Group SalesHR Group Administrators Group
SWRIGHT RMIND JMEYER Administrator
PSMITH JCRAFT MWEST
8. Select Action > Close to close Security Manager.
9. Jacob Meyer should not be given access to any of the SupplierSales data. Using the Administration Tool, explicitly prohibit Meyer’s access to this data.

Module 14: Analytics Security
Analytics: Server Architect (Siebel 7.7) 187
a. In the Presentation layer, double-click SupplierSales. b. Select the General tab. c. Click the Permissions button. d. Double-click the JMEYER check box. The X indicates that Meyer does not have access to
the SupplierSales data. e. Do the remaining users have read access?
f. Why or why not?
g. Click OK to close the Permissions window. h. Click OK to close the Presentation Catalog window.
10. Check in the changes you made into the ABC repository.
a. Select File > Check In Changes, or click the Check In Changes icon . b. Click No to check consistency.
11. Save the changes to the ABC repository by selecting File > Save or clicking the Save icon .
12. With your changes now saved, verify that you can start Siebel Answers as MWEST. a. Start Siebel Analytics Web and log in with the following parameters:
User ID MWEST Password
b. To the left of the Dashboards link, make sure you can see to verify that you are logged in as Mary.
c. Click the Answers link. d. What subject areas are available to Mary?
e. Click the SupplierSales link and notice the objects. f. Click Log Out in the upper-right corner.
13. Start the Siebel Answers application again, this time as JMEYER, and determine if Meyer has the same visibility that West has. a. To log back in, click the here link. b. Log in as JMEYER, leaving the password blank. c. Does the SupplierSales subject area display?

Module 14: Analytics Security
188 Analytics: Server Architect (Siebel 7.7)
d. Why is this?
e. Select File > Close to exit Siebel Answers. f. Leave the Administration Tool open for the next lab.

Module 14: Analytics Security
Analytics: Server Architect (Siebel 7.7) 189
Solutions 14-1 Creating Users and Groups
Answers
9.e. Do the remaining users have read access? Yes
9.f. Why or why not? The check box for Everyone is selected. By default, all users and groups are members of the Everyone group. Because the Everyone group has a check mark, all members inherit this permission, unless the member is explicitly denied access.
12.d. What subject areas are available to Mary? SupplierSales and SupplierSalesDM
13.c. Does the SupplierSales subject area display? No
13.d. Why is this? The SupplierSales subject area does not display because you explicitly denied read access to JMEYER.

Module 14: Analytics Security
190 Analytics: Server Architect (Siebel 7.7)
Lab 14-2 Assigning Permissions to Users
Goals To set up security access so the Analytics Server can authenticate groups and assign group members appropriate permissions.
Scenario You will first modify explicit permissions for Jacob Meyer. You will then modify the permission of the group that Jacob Meyer is a member of and examine the affect this has on Meyer. Lastly, you will add Meyer to another group and examine how this affects Meyer’s access.
Outcome Defined permissions for users and groups.
Time 10 - 15 minutes
Instructions:
1. From the Administration Tool, modify JMEYER’s permissions so that he is no longer explicitly denied access to SupplierSales, but that the group he resides in, SalesHR is. a. Check out all objects in the repository by selecting File > Check Out All. b. Double-click the SupplierSales catalog folder and click the Permissions button. c. Define permissions so that JMEYER is unchecked and SalesHR is explicitly denied. d. Your results should resemble the following:
2. Now that you have removed JMEYER’s explicit access restrictions from the SupplierSales data, will he be able to execute query requests against it in Siebel Answers? Explain.
3. Explicitly assign the SalesManagers group Read permission to the SupplierSales data.

Module 14: Analytics Security
Analytics: Server Architect (Siebel 7.7) 191
a. Select the SalesManagers group check box.
b. Click OK to close the Permissions dialog box. c. Click OK to close the Presentation Catalog window.
4. Add the SalesHR group to the SalesManagers group. a. Open the Security Manager. b. Select Groups and double-click SalesManagers. c. Click the Add button. d. Select the SalesHR group and click OK. The SalesHR group now belongs to the
SalesManagers group. e. Click OK to close the Group dialog box.

Module 14: Analytics Security
192 Analytics: Server Architect (Siebel 7.7)
Note: At this point, the group and user structure now resembles the following: SalesManagers Group
SWRIGHT
PSMITH SalesHR Group
JMEYER
SalesUsers Group
RMIND
JCRAFT
Administrators Group
Administrator
MWEST
f. Close the Security Manager.
5. Check in the changes you made into the ABC repository.
a. Select File > Check In Changes, or click the Check In Changes icon . b. Click No to check consistency.
Note: When asked to check for consistency, for the purposes of these labs it is not necessary. Always click No.
6. Save the changes to the ABC repository.
7. With the changes you have made thus far, will JMEYER be able to access the SupplierSales data?
8. Verify your answer. Start Siebel Answers as Administrator and register your changes on the Analytics server by updating the Analytics server metadata. a. Start Siebel Analytics Web and log in as Administrator with no password. b. Click the Answers link. c. Click Reload Server Metadata.
Note: Only users with administrator rights have the ability to reload server metadata. This link is not visible to other users.
d. Click Log Out. e. Log back in as JMEYER with no password. f. Does this user have access to the SupplierSales subject area now?
g. Why or why not?
h. Select File > Close to exit Siebel Answers.

Module 14: Analytics Security
Analytics: Server Architect (Siebel 7.7) 193
9. Return to the Administration Tool and modify the permissions so that JMEYER also belongs to the SalesManagers group. (Hint: Remember to check out all objects in the repository.) a. Open the Security Manager and double-click the SalesManagers group. b. Click the Add button. c. Select JMEYER and click OK. Meyer now belongs to both SalesHR and SalesManagers
groups.
Note: The group and user structure resembles the following:
SalesManagers Group
SWRIGHT
PSMITH JMEYER SalesHR Group
JMEYER
SalesUsers Group
RMIND
JCRAFT
Administrators Group
Administrator
MWEST
10. Close the Group window and close the Security Manager.
11. Check in the changes and save the repository.
12. Log in to Siebel Answers as Administrator and reload the server metadata.
13. Verify Meyer’s access to the SupplierSales subject area. a. Log in as JMEYER to Siebel Answers. b. Does this user have access to the SupplierSales subject area?
c. Why or why not?
14. Select File > Close to exit Siebel Answers.
15. Select File > Exit to close the Administration Tool.

Module 14: Analytics Security
194 Analytics: Server Architect (Siebel 7.7)
Solutions 14-2 Assigning Permissions to Users
Answers
2. Now that you have removed JMEYER’s explicit access restrictions from the SupplierSales data, will he be able to execute query requests against it in Siebel Answers? Explain. No; JMEYER is a member of the SalesHR group, which was explicitly denied.
7. With the changes you have made thus far, will JMEYER be able to access the SupplierSales data? No
8.f. Does this user have access to the SupplierSales subject area? No
8.g. Why or why not? JMEYER is a member of the SalesHR group, which is explicitly denied. If a user is a direct member of a group, the permissions granted or denied to that group take precedence over permissions granted or denied through other groups.
13.b. Does this user have access to the SupplierSales subject area now? Yes
13.c. Why or why not? JMEYER is a member of the SalesHR and SalesManagers groups. Since these groups have conflicting permissions, the user is granted the least restrictive permissions of the two groups.

Module 14: Analytics Security
Analytics: Server Architect (Siebel 7.7) 195
Lab 14-3 Authenticating Using an External Database
Goals To authenticate users using an external database.
Scenario An external database consisting of user login information has been provided for you so that you can import this information into the repository and use it to authenticate users during login. Once this information has successfully been imported, you will need to create an initialization block that will retrieve this data.
Outcome External database of login information used for authenticating users.
Time 15 – 20 minutes
Instructions:
1. Start Siebel Analytics Web and attempt to log in as Alan Ziff. a. Enter the following parameters:
User ID AZIFF Password az
b. Click Log In. Click No to remember password. c. Were you able to log in as this user?
d. Close the Siebel Analytics Log In window.
2. Create a new data source that connects to the security database. a. Select Start > Programs > Administrative Tools > Data Sources ODBC. b. Select the System DSN tab. c. Click Add. d. Scroll down to select SQL Server. e. Click Finish. f. Create a new data source with the following parameters:
Name SECURITY Server (local)
g. Click Next. h. Specify authentication.
i. Select the With SQL Server authentication… radio button. ii. Select the Connect to SQL Server to obtain default settings… check box.

Module 14: Analytics Security
196 Analytics: Server Architect (Siebel 7.7)
iii. Type sa in the Login ID field and leave the Password field blank. iv. Click Next.
i. Specify the default data source. i. Select the Change the default database to check box. ii. Select Security from the drop-down list. iii. Click Next.
j. Clear all the check boxes. k. Click Finish. l. Test that the data source connection is valid:
i. Click the Test Data Source button and verify that you get the message, “…TESTS COMPLETED SUCCESSFULLY!”
ii. Click OK. m. Click OK again. n. Click OK to close the ODBC Data Source Administrator.
3. Shut down the Siebel Analytics Server.
4. Double-click C:\SiebelAnalytics\Repository\abc.rpd and log in as Administrator with no password.
5. Import tables from the Security database into the repository’s Physical layer. a. Select File > Import > from Database. b. Locate and select the SECURITY data source. c. Click OK.
6. Import tables from the security database. a. Expand the Security folder until both tables appear.

Module 14: Analytics Security
Analytics: Server Architect (Siebel 7.7) 197
b. Select Security and securitylogons:
c. Click Import. d. Click Close.
7. Inspect the data that was imported into the Physical layer. a. In the Physical layer, expand the SECURITY source until both tables appear. b. Right-click securitylogons. c. Select View Data. A table appears. List the column header for each column that appears in
the table.
d. Who is the first Sales Rep. listed, and what is his or her username and password?
e. Click Close.
8. Create an initialization block. a. Select Manage > Variables. b. In the left pane, select Initialization Blocks. c. In the right pane, right-click and select New Initialization Block. d. In the Name field, type Security.

Module 14: Analytics Security
198 Analytics: Server Architect (Siebel 7.7)
e. Under the Name field, select associate with session variables from the drop-down list. f. Create a string that requests username, group, password, and log level variables from the
database. The values returned by the database will be assigned to the variables you define. These variables will be used in authenticating a user during login. i. In the Initialization screen window enter the following script:
g. Click Browse to assign the connection pool.
i. Expand Security and click Connection Pool. ii. Click Select.
h. Your results should resemble the following:
9. Because you requested four variables in the string, you will need to define each variable. These variables are USER, GROUP, DISPLAYNAME, and LOGLEVEL. a. From the Initialization Block window, click the Variables tab. b. Click New. c. Enter USER in the Name field. d. Click OK. e. Click Yes to acknowledge that this variable has a special purpose.

Module 14: Analytics Security
Analytics: Server Architect (Siebel 7.7) 199
f. Repeat the process for the remaining three variables. g. When complete, your table of variables should resemble the following:
Note: It is important that the order in which your variables are listed be the same as they are listed above.
10. Before validating the authentication of these new users in a Web application, conduct a test to see what data is returned for the user Alan Ziff. a. Click the General tab. b. Click Test. c. In the Value field of the USER row, enter AZIFF. d. In the Value field of the PASSWORD row, enter az.
Note: Notice that these values are populated in the initialization script. If this query returns data, the user is authenticated and session variables will be populated.
e. Click OK and view the results:
Note: The sequence in which this data is listed is in the same order you defined the variables earlier.
f. Click Close. g. Click OK to close the Initialization Block window. h. Close the Variable Manager window.
11. Save the changes in the repository and click No to check global consistency.
12. Select File > Exit to close the Administration Tool.
13. Start the Siebel Analytics Server service.
14. Start Siebel Analytics Web and log in as Alan Ziff. a. Enter the following parameters:
User ID AZIFF

Module 14: Analytics Security
200 Analytics: Server Architect (Siebel 7.7)
Password az b. Click Log In. c. Is there a personal greeting for ALAN ZIFF to the left of the Dashboards link?
d. Select File > Close to exit the Siebel Analytics Web.

Module 14: Analytics Security
Analytics: Server Architect (Siebel 7.7) 201
Solutions 14-3 Authenticate Using an External Database
Answers
1.c. Were you able to log in as this user? No
7.c. Select View Data. A table appears. List the column header for each column that appears in the table. Catalog_name, Group, Pwd, Sales Rep, Schema_name, Username
7.d. Who is the first Sales Rep. listed and what is their username and password? ALAN ZIFF is the rep., AZIFF is the username, and az is the password.
14.c. Is there a personal greeting for ALAN ZIFF to the left of the Dashboards link? Yes

Module 14: Analytics Security
202 Analytics: Server Architect (Siebel 7.7)
Lab 14-4 Setting Query Limits and Timing Restrictions
Goals To disallow queries that may consume too much of the system resources by setting query limits.
Scenario You want to prevent queries from consuming too many resources by limiting how long a query can run and how many rows a query can retrieve. You also want to disallow users from querying a database during batch processes at specific times on a specific day.
Outcome Set the maximum rows of any query to five rows, the maximum time of any query to 1 minute, and restrict access to a database on Sunday from 12:00 A.M. to 7:00 A.M.
Time 10 – 15 minutes
Instructions:
1. Open ABC.rpd in Online mode. a. Select Start > Programs > Siebel Analytics > Siebel Analytics Administration. b. Select File > Open > Online. c. Click Open.
2. Disallow queries that may consume too many system resources by setting query limits for the SalesManagers group. a. Check out all objects in the repository. b. Open the Security Manager. c. Double-click the SalesManagers group. d. Click the Permissions button. e. Select the Query Limits tab. f. Specify a maximum number of rows each query can retrieve from the ABC database:
i. Locate the ABC database and change its Max Rows value to 5. ii. In the Status Max Rows column, select Enable from the drop-down list.
g. Specify the maximum time a query can run on the ABC database: i. In the Max Time (Minutes) column, change the value to 1. ii. In the Status Max Time column, select Enable from the drop-down list.
3. Restrict the time period that users can access specified repository resources from midnight Sunday to 7:00 A.M. Sunday: a. Click the Ellipsis button in the Restrict column of the ABC database.

Module 14: Analytics Security
Analytics: Server Architect (Siebel 7.7) 203
b. Highlight the blocks from Sunday at midnight to 7 AM Sunday. (Hint: With the first block selected press the SHIFT key and select the 7 AM block.)
c. Click Disallow.
Note: If a time period is not highlighted, access rights remain unchanged. If access is allowed or disallowed explicitly to one or more groups, the user is granted the least restrictive access for the time periods that are defined.
d. Click OK to close the Restrictions dialog box. e. Click OK to close the User/Group Permissions dialog box. f. Click OK to close the Group dialog box. g. Close Security Manager.
4. Check in the changes and save the repository. You have successfully restricted access to the ABC database for the SalesManagers group.
5. Start Siebel Answers as Administrator and register your changes on the Analytics Server by updating the Analytics Server metadata. a. Start Siebel Analytics Web and log in as Administrator with no password. b. Click the Answers link. c. Click Reload Server Metadata. d. Click Log Out.
6. Verify that the changes you made to the maximum number of rows allowed per query works correctly. a. Start Siebel Analytics Web and log in as JMEYER with no password. b. If necessary, click the Answers link. c. Click the SupplierSales subject area. d. Select Customers.Customer and click Results.

Module 14: Analytics Security
204 Analytics: Server Architect (Siebel 7.7)
e. Did the results of the query display?
f. Expand Error Details to view message. What does the error message state?
g. Select File > Close to exit Siebel Answers.
7. Return to the Administration Tool and inactivate the query restriction you just created. a. Check out all objects in the repository. b. Open the Security Manager. c. Double-click the SalesManagers group. d. Click the Permissions button. e. Select the Query Limits tab. f. From the ABC row, select Ignore for both Status Max Rows and Status Max Time columns. g. Click OK. h. Close all dialog boxes and Security Manager.
8. Check in changes and save the repository.
9. Close the Siebel Analytics Administration tool.
10. Restart the Siebel Analytics Server and Siebel Analytics Web services.
11. When the services have completely restarted, test your results. a. Start Siebel Analytics Web and log in as JMEYER with no password. b. Click the Answers link. c. Click the SupplierSales subject area. d. Select Customers.Customer and click Results. e. What are the results now?
12. Select File > Close to exit Siebel Answers.

Module 14: Analytics Security
Analytics: Server Architect (Siebel 7.7) 205
Solutions 14-4 Setting Query Limits and Timing Restrictions
Answers
6.e. Did the results of the query display? No
6.f. What does the error message state? A general error has occurred. The user request exceeded the maximum query governing rows from the database.
11.e. What are the results now? The customer rows are returned in the query, since there is no longer a restriction on the number of rows that can be returned from the ABC database.

Module 14: Analytics Security
206 Analytics: Server Architect (Siebel 7.7)

Module 15: Cache Management
Analytics: Server Architect (Siebel 7.7) 207
Lab 15-1 Inspecting Cache Files
Goals To create a query request and inspect the cache file using the Cache Manager.
Scenario Create a request in Siebel Answers and verify that a cache file was created in the Cache Manager and that a log file was created. Create the same request again and verify that the results were fulfilled by the cache file and not from the database.
Outcome A request and its associated cache files located in the Cache Manager and Cache directory folder.
Time 15 – 20 minutes
Instructions:
1. Stop the Siebel Analytics Server service.
2. Enable the cache parameter in the NQSConfig.ini file. a. Double-click C:\SiebelAnalytics\Config\NQSConfig.INI. b. Locate the CACHE section and modify the ENABLE parameter as follows:
c. Save your changes and close the file. d. Close Windows Explorer.
3. Start the Siebel Analytics Server service.
4. Run a request and save it in Siebel Answers. a. Start Siebel Analytics Web and log in as MWEST with no password. b. Click the Answers link. c. Click the SupplierSales subject area. d. Create the following request:
e. Click the Results tab. f. Select File > Close to exit Siebel Answers.

Module 15: Cache Management
208 Analytics: Server Architect (Siebel 7.7)
5. Open ABC.rpd in Online mode. a. Select Start > Programs > Siebel Analytics > Siebel Analytics Administration. b. Select File > Open > Online. c. Click Open.
6. Open the Cache Manager and verify that the request you made is listed as a cache. a. Select Manage > Cache. b. Expand the Star directory. c. Select MWEST. By selecting the user, all cache entries associated to that user appear in the
right pane. d. Select the cache entry (there should only be one). e. Select SQL > Show. f. By inspecting the SQL, can you determine if this is the cache that represents the query you
just created?
g. Click OK to close the SQL. h. With this entry still selected, scroll to the Created and Last used columns. Are the values for
these fields the same?
i. Record the values for these two fields.
j. Do you think that the results for the query you created were satisfied from an existing cache or were returned directly from the database?
k. Close the Cache Manager.
7. Inspect the cache file and verify that the results of the query were stored as a file in the cache. The modified time of the file should coincide with the time you originally created the request (time recorded above). a. Double-click C:\SiebelAnalyticsData\Temp\Cache. b. Select View > Details to display the details of each file.
Note: The last file listed should be the cache that resulted from your query. Verify that the modified time of this file is the same as the time you created the request.
c. Close the Windows Explorer directory.
8. Start Siebel Analytics Web and log in as JMEYER. a. Click the Answers link

Module 15: Cache Management
Analytics: Server Architect (Siebel 7.7) 209
b. Click the SupplierSales subject area. c. Create the same request you created earlier and inspect its results:
d. Do you think the request was satisfied by the database or by a cache? Explain.
9. Examine the cache hit in the log file. a. Double-click C:\SiebelAnalytics\Log\NQQuery.log.
b. Close the log file.
10. Select File > Close to exit Siebel Answers.
11. In response to JMEYER’s request, determine if a new cache entry were made in the Cache Manager and filed in the Cache directory. If a new entry was made in the Cache Manager and filed in the directory, then an existing cache was not used to satisfy his request. a. Open the Cache Manager. b. Are there any entries listed with JMEYER as the user?
c. Was the Last used date for MWEST’s cache file updated? Explain.

Module 15: Cache Management
210 Analytics: Server Architect (Siebel 7.7)
d. Double-click C:\SiebelAnalyticsData\Temp\Cache. e. Notice that there was no new cache files created as a result of JMEYER’s request. Thus,
JMEYER’s request was satisfied by an existing cache. f. Close Windows Explorer. g. Leave the Administration Tool open for the next lab.

Module 15: Cache Management
Analytics: Server Architect (Siebel 7.7) 211
Solutions 15-1 Inspecting Cache Files
Answers
6.f. By inspecting the SQL, can you determine if this is the cache that represents the query you just created? Yes, the listed objects correspond to the columns selected for the request. These objects were also selected from the SupplierSales subject area as indicated from the SQL.
6.h. With this entry still selected, scroll to the Created and Last used columns. Are the values for these fields the same? Yes
6.j. Do you think that the results for the query you created were satisfied from an existing cache or were returned directly from the database? Results for this query were returned directly from the database. Because both Created time and Last Used time are the same, this is the first time this query has been requested. Thus, no cache file existed for this query until now.
8.d. Do you think the request was satisfied by the database or by a cache? Explain. JMEYER’s query was fulfilled by the cache that resulted from MWEST’s query earlier. Because JMEYER’s request was identical to the cache, the application used the cache (cache hit) instead of processing against the database.
11.b. Are there any entries listed with JMEYER as the user? No
11.c. Was the Last used date for MWEST’s cache file updated? Explain. Yes, because JMEYER’s query used this cache to satisfy his request and the last used date was updated to reflect this.

Module 15: Cache Management
212 Analytics: Server Architect (Siebel 7.7)
Lab 15-2 Modifying Cache Parameters
Goals To modify cache parameters in the NQSConfig file.
Scenario Using the Cache Manager, you will inspect the cache parameters. You will then modify the number of rows per cache as well as the number of cache entries allowed. In addition to modifying cache parameters, you will make certain tables non-cacheable.
Outcome A decrease in the number of rows per cache as well as a decrease in the number of cache entries allowed.
Time 10 – 15 minutes
Instructions:
1. What are some advantages of using a caching system for requests?
2. True or false: There is a list of criteria that can qualify a cache hit. If all but one of these conditions is met, a cache hit will not occur.
3. True or false: Cache files are stored in the C:\SiebelAnalyticsData\Temp\Cache directory.
4. True or false: Cache files can be stored anywhere.
5. If you wanted to store cache files in a different location, where would you need to indicate this?

Module 15: Cache Management
Analytics: Server Architect (Siebel 7.7) 213
6. From the Cache Manager, inspect the cache parameters. a. If necessary, open the Cache Manager. b. From the Cache Manager window, select Action > Show Info. c. Inspect the information and record the following values:
i. Number of entries currently in cache:
ii. Maximum allowable number of entries in cache:
iii. Maximum allowable number of rows per cache entry result set:
d. Click OK. e. Close the Cache Manager. f. Close the Administration Tool.
7. You have decided to decrease the number of rows per cache as well as the number of cache entries allowed. a. Stop the Siebel Analytics Server service. b. Double-click C:\SiebelAnalytics\Config\NQSConfig.ini. c. Locate the CACHE section and modify as follows:
d. Save the changes and close the file.
8. Validate your changes in the Siebel Analytics Administration Tool. a. Start the Siebel Analytics Server service. b. Open ABC.rpd in Online mode. c. Select Manage > Cache. d. Select Action > Show Info. Your results should resemble the following:
e. Click OK. f. Close the Cache Manager.

Module 15: Cache Management
214 Analytics: Server Architect (Siebel 7.7)
9. You have decided to make certain tables non-cacheable, meaning that if a request is made against it, a cache file will not be logged. a. Check out all objects in the repository. b. In the Physical layer, expand the ABC database so that you see all the tables. c. Double-click the D1_customer2 table. d. Select the General tab. e. Uncheck the Make table cacheable check box. f. Click OK. g. Repeat this process for the D1_Orders2 table. h. Check in your changes and save them to the repository. You do not need to check for
consistency.
10. Start Siebel Answers as MWEST and create the following request using columns from the SupplierSales subject area:
a. Click the Results tab and inspect the results.
11. Return to the Administration Tool and open the Cache Manager to validate your changes. a. Do you see an entry for the request you just created?
b. What happened to the other entries?
c. Close the Cache Manager. d. Close the Administration Tool.
12. Close Siebel Answers.

Module 15: Cache Management
Analytics: Server Architect (Siebel 7.7) 215
Solutions 15-2 Modifying Cache Parameters
Answers
1. What are some advantages in using a caching system for requests? Faster response time fulfilling a query from a cache versus searching through the database; minimize strain on database resulting in reduced database processing; and conservation of network resources
2. True or false: There is a list of criteria that can qualify a cache hit. If all but one of these conditions is met, a cache hit will not occur. True
3. True of false: Cache files are stored in the C:\SiebelAnalyticsData\Temp\Cache directory. True
4. True or false: Cache files can be stored anywhere. True; cache files can be stored anywhere, even on a separate machine.
5. If you wanted to store cache files in a different location, where would you need to indicate this? To define the location of where cache files are stored, you would need to indicate this in the NQSConfig.INI file, in the Cache Section.
6.c.i. Number of entries currently in cache: 1
6.c.ii. Maximum allowable number of entries in cache: 1,000
6.c.iii. Maximum allowable number of rows per cache entry result set: 100,000
11.a. Do you see an entry for the request you just created? No
11.b. What happened to the other entries? They were also removed because those requests were made against the tables you set as non-cacheable.

Module 15: Cache Management
216 Analytics: Server Architect (Siebel 7.7)