Embed Size (px)
Citation preview

Trend Report
IT Operations Monitoring &Analytics (ITOMA)
Disclaimer – This document has been prepared solely for Trace3's internal research purposes without anycommitment or responsibility on our part. Trace3 accepts no liability for any direct or consequential loss arisingfrom the transmission of this information to third parties. This report is current at the date of writing only andTrace3 will not be responsible for informing of any future changes in circumstances which may affect the accuracyof the information contained in this report. Trace3 does not offer or hold itself out as offering any advice relating toinvestment, future performance or market acceptance.
Trace3 Research
Seeing the difference between visibilityand insight in IT Ops
© 2019 Trace3, Inc. All Rights Reserved

IT Operations Monitoring & Analytics (ITOMA)Seeing the difference between visibility and insight in IT Ops
This report attempts to present a survey of current and emerging IT monitoring and analytics techniques, use cases,products and vendors by: • Identifying the various monitoring approaches. • Providing an overview of the various monitoring silos • Describe the IT Infrastructure Management (ITIM) use case and provide solution examples. • Introducing the IT Operations Analytics (ITOA) use case. • Exploring the emergence of AIOps. • Advancing Forecasts and Recommendations.This report does not, however, delve into the various use cases ancillary to, and supportive of, IT monitoring, such as ITService Management (ITSM), Capacity Planning, Notification Management, Incident and Event Management, RootCause Analysis, Ticketing or Tracking.
Executive SummaryIT Monitoring tools have been around for years. Yet many still only relay what happened, leaving IT operations teams tohandle today’s complexity, volumes, variety and rapid change. Today’s IT operations teams need solutions that automatelarge-scale data collection and present real-time analysis in a unified view across all IT operational silos, detectinganomalies, correlating events and determining root causes to separate real incidents from the background noise.Choosing the right IT monitoring and analytics solution can be the difference between success and failure of an ITorganization. As the IT monitoring field continues to grow and mature, innovations such as the integration of AI andMachine Learning into monitoring tools will enable businesses to make better decisions in real time.
Report Scope
This Trace3 Research Trend Report's scope was based on research requests received from Trace3 customers and fieldengineers. From these requests, relevant areas of the technical landscape were mapped out, including the identificationof affected 360 View use cases and the primary players in these use cases. From these use cases mandatory anddesirable feature sets were defined and key vendors were then given the opportunity to present, describe anddemonstrate their current product offerings. After detailed analysis forecasts and recommendations were drawn.
Research Method
2© 2019 Trace3, Inc. All Rights Reserved

IT Operations Monitoring & Analytics (ITOMA)Seeing the difference between visibility and insight in IT Ops
Today's IT infrastructure combines elements of physical,virtual and cloud environments in a multi-tier hierarchy,mixing both legacy and modern technologies. Thisheterogeneous conglomeration not only requires anextensive amount of configuration to deploy, it alsodemands an even larger level of effort and expertise tomonitor during daily operations. In general, IT Monitoringcan be loosely grouped into five broad categories,including:
• Monitoring Silos - Includes specialized monitoring toolsfor Application, Cloud, Database, Log, Network, Server,Storage and Web monitoring.
Analysis
Landscape
Storage
ITO
A
IT Monitoring Landscape
ITIM
Log Web
© 2019 Trace3, Inc. All Rights Reserved
Cloud DatabaseApp Network Server
AIOps
Siloed Monitoring
© 2019 Trace3, Inc. All Rights Reserved
App Cloud Database Log Network Server Storage Web
• IT Infrastructure Monitoring (ITIM) - collects real-time availability and utilization data from the various IT infrastructurecomponents from either cloud or on-prem resources, including server/hypervisor, networks, database and storageresources. Many of these tools have the ability to perform historical data analysis or trending patterns in this data.
• IT Operational Analytics (ITOA) - uses data science principles (e.g., mathematical algorithms and advanced analyticslike machine learning) to understand the patterns in data generated across an organization’s IT landscape, detectanomalies from baseline behavior and correlate these variances to a root cause. Many of the tools in this bucket haverecently been branded as AIOps tools, indicating that they have AI/ML embedded in their offering.
• Notification Management - a combination of software and hardware that provides a means of delivering operationalmessages, alerts and alarms to a group of operators based on rule sets and configuration parameters.
It is important to note, that the manufacturers noted above are only representatives of each space and this landscapediagram should not be considered to be all inclusive of the options available on the market today. Also, while each vendorabove is shown as a distinct, single use case solution, many products actually overlap into neighboring silos and usecases making the real-world IT monitoring landscape much more "fuzzy" than depicted, Nonetheless, despite thisfuzziness, it is useful to talk about a more delineated landscape in order to isolate use cases for easier analysis.
• The average cost of a data center outage costs is $740,357. [1]
• 65% of companies own more than 10 different commercial monitoring products. [4]
• 50% of surveyed companies indicated that 50% or fewer of their monitoring tools are actively being used. [4]
• The infrastructure monitoring market is expected to reach $2.47 billion by 2020 at a CAGR of 26.3%. [3]
• A performance monitoring solution can increase IT operating expenses an average of $800 per server, annually. [5]
Did You Know...
3© 2019 Trace3, Inc. All Rights Reserved

IT Operations Monitoring & Analytics (ITOMA)Seeing the difference between visibility and insight in IT Ops
Traditional IT monitoring often mirrors the traditional ITorganizational structure; network monitoring for thenetwork group, storage monitoring for the storage groupand so on. Although this approach avoids potentialpolitical/cultural friction, it results in a very singular view ofan operational component that is shared across theenterprise. While a practice of convenience, thissegregation often causes increased cost and decreasedefficiency as troubleshooting is based on limited views ofimpacted systems and applications, hinderingcollaboration and significantly increasing mean time toresolution (MTTR).
Many Panes of Glass
Siloed Monitoring
© 2019 Trace3, Inc. All Rights Reserved
App Cloud Database Log Network Server Storage Web
ITIM
IT Infrastructure Monitoring
© 2019 Trace3, Inc. All Rights Reserved
App Cloud Database Log Network Server Storage Web
ITIM
Although many tools on the market today span multiple related silos, the primary siloed monitoring tools focus onApplication Performance Monitoring (APM), Cloud Monitoring, Database Performance Monitoring (DPM - not to beconfused with Database Activity Monitoring), Log Management, Network Performance Monitoring, Server Monitoring,Storage Monitoring and Website Monitoring. For the scope of this report, the myriad vendors of vendors offering siloedmonitoring solutions will not be detailed.
Most enterprises today possess an accumulation of disjointed tools built for a static, generalized IT environment. Giventhe ever-increasing magnitude of change within an typical IT organization, siloed tools often relegate operational teamsinto a reactive defense as opposed to assuming a more proactive offensive stance. Because siloed monitoring solutionscause each team to focus on the behavior of their particular resources, root cause determination often takes aconsiderable amount of time, if even possible. With delayed or unavailable root cause analysis, what may start as atransient unexplained network anomaly could escalate into high severity outage.
Siloed monitoring tool indications are often left to subjective interpretation by the operational team before and duringdeployment. Rarely are the deployed rules revisited as the environment evolves over time, making it susceptible tounforeseen vulnerabilities. For example, an "impossible" alert is assigned no predetermined actions since it should neveroccur, but as things evolve over time what was impossible becomes possible, the alert fires, a ticket is created but noresponse action is identified. As this unexplained, seemingly inert error expands with enterprise volumes, it can generatea deluge of support tickets that are unmanageable, unadddressable and likely to spiral out of control before remediationcan be designed and implemented.
Nonetheless, siloed monitoring is present in almost every enterprise and is still forms the foundation that highermonitoring layers are built upon. Siloed tools provide in-depth visibility into a specific infrastructure resource and aretailored to the special nuances of an enterprise's deployment. These specialized tools also provide detailed informationon resource utilization for use in trending and capacity planning. Each infrastructure silo has its key indicators, technicalspecialties and dominant vendor profiles, resulting in custom monitoring tools specializing for the vagaries of eachresource discipline.
4© 2019 Trace3, Inc. All Rights Reserved

IT Operations Monitoring & Analytics (ITOMA)Seeing the difference between visibility and insight in IT Ops
When searching for the proverbial "Single Pane of Glass",the answer is not found in a mythical application thatreplaces all of the siloed monitoring tools. Successfulunification lies in monitoring both the parts and the wholeof the enterprise landscape. IT Infrastructure Monitoring(ITIM) takes siloed monitoring a good ways to thisunification.
ITIM solutions monitor the availability, capacity, events,utilization and performance telemetry from multiple silos(typically servers & hypervisors), network, storage, anddatabase resources). These tools are often purpose builtwith a largely static infrastructure combination in mind.However, reality dictates they must continuously evolve.
Single Pane of Glass 1.0 - ITIM
ITIM
IT Infrastructure Monitoring
© 2019 Trace3, Inc. All Rights Reserved
App Cloud Database Log Network Server Storage Web
ITIM
ITOA
IT Operations Analytics
© 2019 Trace3, Inc. All Rights Reserved
App Cloud Database Log Network Server Storage Web
ITO
A
ITIM tools are available as open-source, commercial open-source, proprietary software and SaaS offerings. Licensingoptions and costs vary greatly from per-device to number of metrics monitored. Pure-play ITIM leaders include Datadog,GroundWork, Icinga, LogicMonitor, ManageEngine, Nagios, Opsview, Paessler AG, ScienceLogic, Solarwinds, Zenoss(and many more). In addition to these pure play solutions, many large IT incumbents offer ITIM solution suites, includingHPE, CA Technology, IBM, Microsoft, VMware, and BMC.
Given this vast array of solution options available, and the gaps between them, many organizations deploy a combinationof ITIM tools (which, to some degree, obviates the unifying function of sought in an ITIM). The selection of ITIM solutioncombinations is often exacerbated by unclear understanding or under-evaluation of the current and future enterpriselandscape, emerging technologies, time to value, skill levels of operational teams and alignment with businessstakeholders.
Yet despite the aims and claims of many ITIM products in the market, there is no magical one size fits all "Single Pane ofGlass". While ITIM solutions do indeed offer IT operators an aggregated view of enterprise operations consolidatedacross their various silos, very few offer any form of event correlation or noise reduction on this amalgamated data flow tohelp filter the needle from the increased stack of hay. Some ITIM solutions do allow for programatic scripting andresponse to known or foreseen patterns and events, this is far from a correlation engine - the haystack still remains.
So how does the typical IT enterprise span this gap without purchasing and integrating every ITIM tool available?Unfortunately, today's enterprises must select solutions that not only meet the current infrastructure topology but can alsoadapt to the predicted landscape of tomorrow, foretelling, for instance, the impact technologies like converged andhyperconverged, cloud-based resources and services, containers and DevOps. This requires much more than a simplefeature comparison.
Despite these challenges, ITIM solutions do help span (but not replace) the various silo-based monitors and certainlysimplify the typical tasks facing an IT operations group. Even a semi-unified view into the enterprise resources providedby an ITIM solution can greatly speed fault isolation, remediation, root cause analysis and prescription corrective actions.
5© 2019 Trace3, Inc. All Rights Reserved
IT Operations Monitoring & Analytics (ITOMA)Seeing the difference between visibility and insight in IT Ops
Source: https://dzone.com/articles/aiops-the-future-of-it-ops
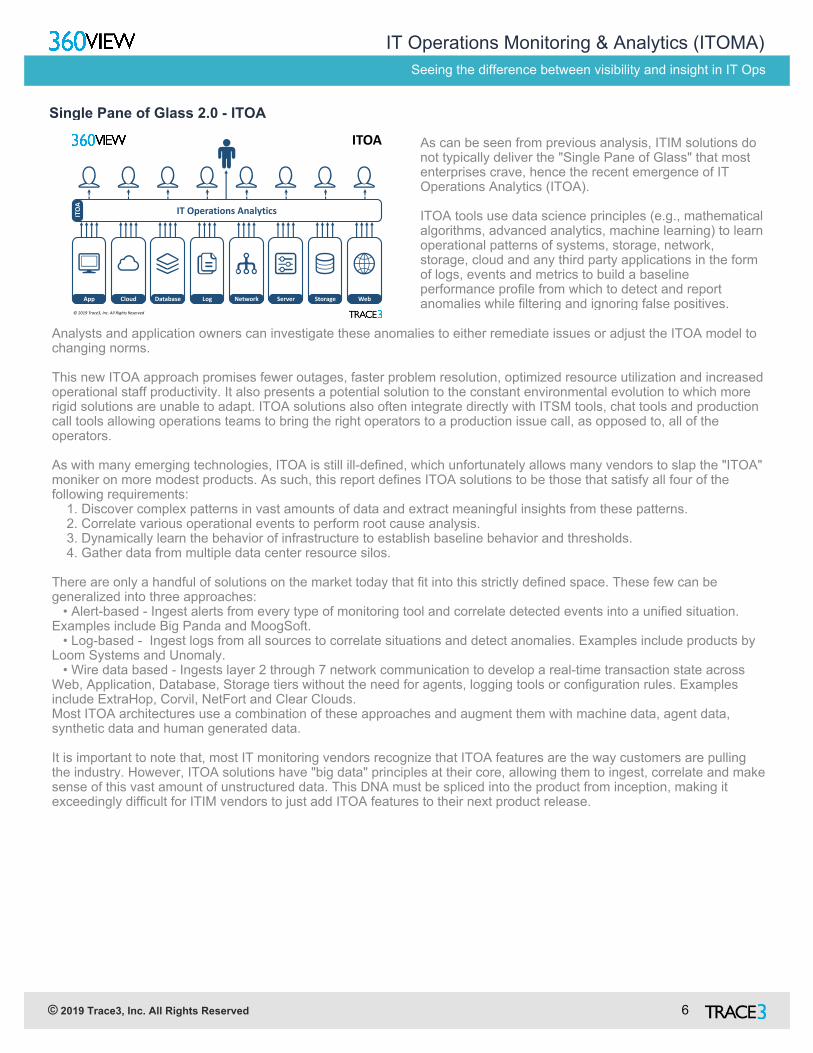
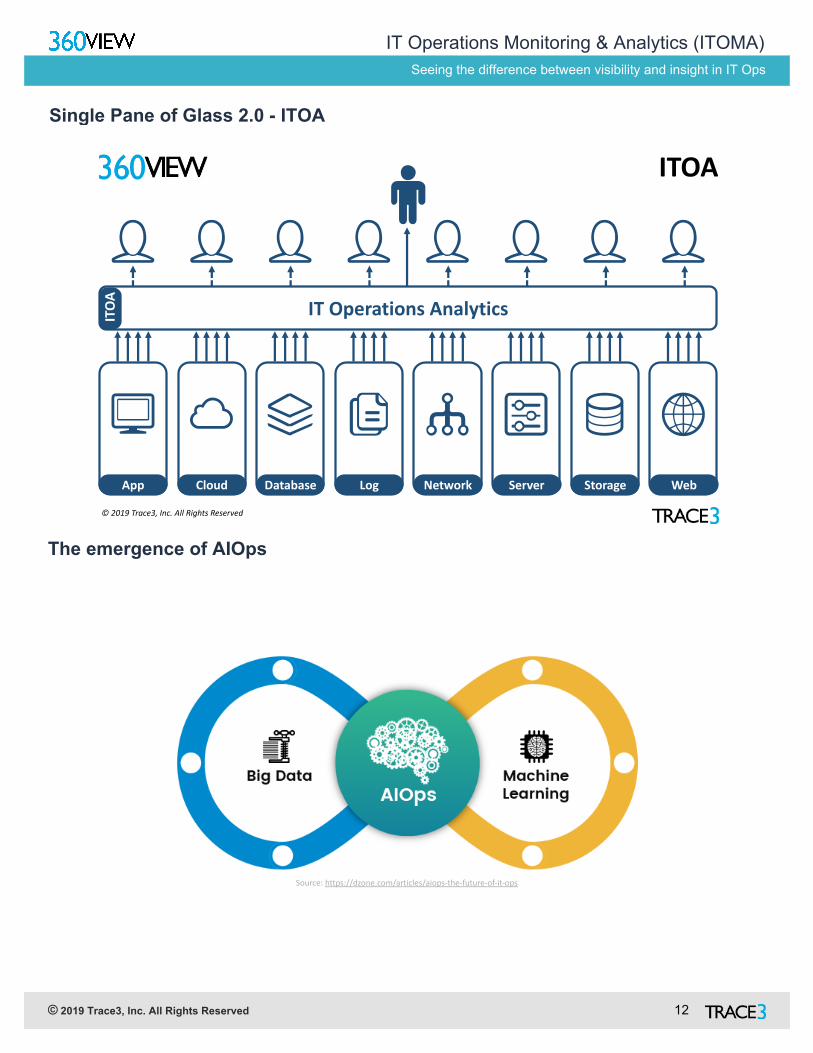
As can be seen from previous analysis, ITIM solutions donot typically deliver the "Single Pane of Glass" that mostenterprises crave, hence the recent emergence of ITOperations Analytics (ITOA).
ITOA tools use data science principles (e.g., mathematicalalgorithms, advanced analytics, machine learning) to learnoperational patterns of systems, storage, network,storage, cloud and any third party applications in the formof logs, events and metrics to build a baselineperformance profile from which to detect and reportanomalies while filtering and ignoring false positives.
Single Pane of Glass 2.0 - ITOA
ITOA
IT Operations Analytics
© 2019 Trace3, Inc. All Rights Reserved
App Cloud Database Log Network Server Storage Web
ITO
A
Analysts and application owners can investigate these anomalies to either remediate issues or adjust the ITOA model tochanging norms.
This new ITOA approach promises fewer outages, faster problem resolution, optimized resource utilization and increasedoperational staff productivity. It also presents a potential solution to the constant environmental evolution to which morerigid solutions are unable to adapt. ITOA solutions also often integrate directly with ITSM tools, chat tools and productioncall tools allowing operations teams to bring the right operators to a production issue call, as opposed to, all of theoperators.
As with many emerging technologies, ITOA is still ill-defined, which unfortunately allows many vendors to slap the "ITOA"moniker on more modest products. As such, this report defines ITOA solutions to be those that satisfy all four of thefollowing requirements: 1. Discover complex patterns in vast amounts of data and extract meaningful insights from these patterns. 2. Correlate various operational events to perform root cause analysis. 3. Dynamically learn the behavior of infrastructure to establish baseline behavior and thresholds. 4. Gather data from multiple data center resource silos.
There are only a handful of solutions on the market today that fit into this strictly defined space. These few can begeneralized into three approaches: • Alert-based - Ingest alerts from every type of monitoring tool and correlate detected events into a unified situation.Examples include Big Panda and MoogSoft. • Log-based - Ingest logs from all sources to correlate situations and detect anomalies. Examples include products byLoom Systems and Unomaly. • Wire data based - Ingests layer 2 through 7 network communication to develop a real-time transaction state acrossWeb, Application, Database, Storage tiers without the need for agents, logging tools or configuration rules. Examplesinclude ExtraHop, Corvil, NetFort and Clear Clouds.Most ITOA architectures use a combination of these approaches and augment them with machine data, agent data,synthetic data and human generated data.
It is important to note that, most IT monitoring vendors recognize that ITOA features are the way customers are pullingthe industry. However, ITOA solutions have "big data" principles at their core, allowing them to ingest, correlate and makesense of this vast amount of unstructured data. This DNA must be spliced into the product from inception, making itexceedingly difficult for ITIM vendors to just add ITOA features to their next product release.
6© 2019 Trace3, Inc. All Rights Reserved
IT Operations Monitoring & Analytics (ITOMA)Seeing the difference between visibility and insight in IT Ops
Source: https://dzone.com/articles/aiops-the-future-of-it-ops
1. Siloed offerings will continue to add features to monitor neighboring resources in the continuing quest for the SinglePane of Glass. These consolidations will result in monitoring platforms with similar limitations to those found in today'sITIM solutions but will be a cost effective alternative for small and medium enterprises.
2. IT Monitoring and APM products will continue to add features traditionally found in each others market's, blurring thedistinctions between application, database and infrastructure silos.
3. The adoption of big data principles by ITOA will follow a similar path to that of previous big data technologies resultingin an IT Operational data lake with a large analytics platform serving up intelligence, visibility tools, reporting andpredictive analytics.
4. IT Operations groups will shift from a tools-centric organization structure to a data-driven interdisciplinary approach.
5. Big Data solutions providers will refit their existing suite of tools to handle IT Ops data. This will be an easier transitionfor them than for the ITIM providers.
6. Advanced analytics and machine learning will become table stakes in monitoring tools. Initially this will create a flurry ofunsubstantiated rebranding efforts by vendors eager to catch up, but these will eventually either acquire their way intoITOA or exit the market.
7. ITOA and AIOps will help evolve tomorrow's IT organization from a reactive speeds and feeds provider focused oncapacity availability into a proactive data-driven fulfillment engine delivering stability, agility and innovation ahead ofbusiness needs.
Forecasts
Trace3's Take
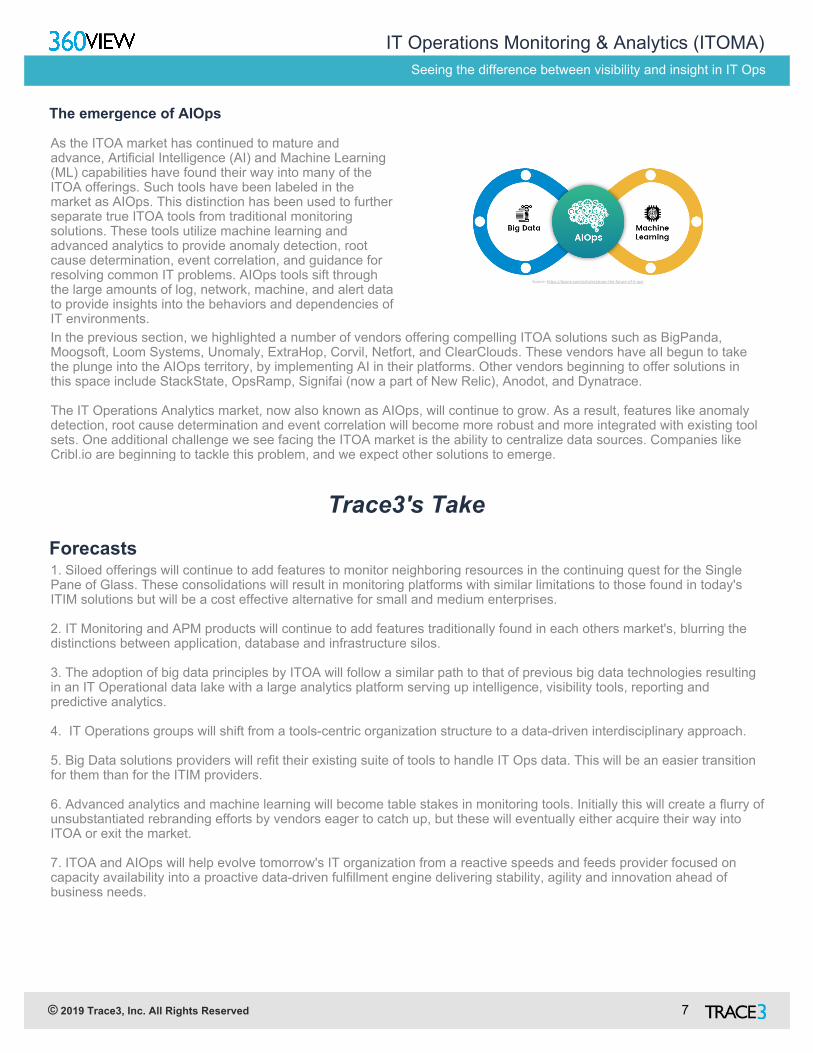
As the ITOA market has continued to mature andadvance, Artificial Intelligence (AI) and Machine Learning(ML) capabilities have found their way into many of theITOA offerings. Such tools have been labeled in themarket as AIOps. This distinction has been used to furtherseparate true ITOA tools from traditional monitoringsolutions. These tools utilize machine learning andadvanced analytics to provide anomaly detection, rootcause determination, event correlation, and guidance forresolving common IT problems. AIOps tools sift throughthe large amounts of log, network, machine, and alert datato provide insights into the behaviors and dependencies ofIT environments.
The emergence of AIOps
In the previous section, we highlighted a number of vendors offering compelling ITOA solutions such as BigPanda,Moogsoft, Loom Systems, Unomaly, ExtraHop, Corvil, Netfort, and ClearClouds. These vendors have all begun to takethe plunge into the AIOps territory, by implementing AI in their platforms. Other vendors beginning to offer solutions inthis space include StackState, OpsRamp, Signifai (now a part of New Relic), Anodot, and Dynatrace.
The IT Operations Analytics market, now also known as AIOps, will continue to grow. As a result, features like anomalydetection, root cause determination and event correlation will become more robust and more integrated with existing toolsets. One additional challenge we see facing the ITOA market is the ability to centralize data sources. Companies likeCribl.io are beginning to tackle this problem, and we expect other solutions to emerge.
7© 2019 Trace3, Inc. All Rights Reserved
IT Operations Monitoring & Analytics (ITOMA)Seeing the difference between visibility and insight in IT Ops
1. IT organizations implementing or overhauling their IT monitoring suite should define the objective and desired outcomeprior to choosing a tool. Tool selection must then be centered on fitting the stated requirements, constraints and processneeds (not vice versa).
2. Cultural inertia is one of the main inhibitors to adoption of new IT monitoring paradigms. Therefore, when makingtoolset selections, organizations should evaluate the skillsets of their existing operational staff and determine how muchcultural change can be tolerated.
3. When evaluating any monitoring tool, it is highly desirable to give preference to those that integrate their data with othertools or expose their APIs to allow for the loose coupling with other tools in the enterprises monitoring landscape. This willallow for future mix and match choices inevitable in an ever-evolving IT deployment.
4. There should be a continuous effort to not only use the features on existing tools more effectively and in deeperconjunction other platforms, but also to identify opportunities for rationalization and consolidation of monitoring tools.
5. IT Monitoring is but one facet of data collection and reporting within the enterprise. IT monitoring can, and should, bebrought into alignment with security and business intelligence reporting initiatives.
6. IT monitoring tool suites must integrate seamlessly with the often overlooked supporting operational tools such asITSM workflow, notification management, incident management, service tools, communication tools and alerting tools.
7. Apart from the primary features sets, ancillary characteristics of the tools should be included in the selection evaluation,including the required levels of technical knowledge, pricing models, levels of automation, ease of deployment, alerting,visualization and scalability when choosing a monitoring solutions
8. Remember that analytics goes beyond unstructured text searches and scaled down alerting. Pattern Discovery andinference are critical when choosing a solution.
Recommendations
8© 2019 Trace3, Inc. All Rights Reserved

IT Operations Monitoring & Analytics (ITOMA)Seeing the difference between visibility and insight in IT Ops
APM monitors and manages the performance and availability of software applications. APM strives to detect anddiagnose application performance problems to maintain an expected level of service. Mobile application performanceis defined by the user's perception of how well the application performs. This means that the performance of yourapplication is measured by how responsive it is, how quickly it starts up, how well it uses device memory, how well ituses device power.
Application Performance Management
Cloud monitoring is the process of reviewing, monitoring and managing the operational workflow and processes withina cloud-based IT asset or infrastructure. It is the use of manual or automated IT monitoring and managementtechniques to ensure that a cloud infrastructure or platform performs optimally.
Cloud Monitoring
Database activity monitoring (DAM) is a database security technology for monitoring and analyzing database activitythat operates independently of the database management system (DBMS) and does not rely on any form of native(DBMS-resident) auditing or native logs such as trace or transaction logs. DAM is typically performed continuously andin real-time.
Database activity monitoring and prevention (DAMP) is an extension to DAM that goes beyond monitoring and alerting
Database Monitoring
Operational monitoring and management refers to collecting key system performance metrics at periodic intervals overtime. This information gives you critical data to refine that initial configuration to be more tailored to your requirements,and also prepares you to address new problems that might appear on their own or following software upgrades,increases in data or user volumes, or new application deployments.
IT Infrastructure Monitoring
IT operations analytics (ITOA) is the practice of monitoring systems and gathering, processing, analyzing andinterpreting data from various IT operations sources to guide decisions and predict potential issues.
IT Operations Analytics
Log aggregation is an approach to store large volumes of computer-generated log messages (also known as auditrecords, audit trails, event-logs, etc.) in a centralized repository where they are used as data for IT operations orsecurity analytics or forensics.
Log Management
Network Performance Management is a system that continuously monitors a network and notifies a networkadministrator though messaging systems (usually e-mail) when a device fails or an outage occurs. Network monitoringis usually performed through the use of software applications and tools.
Network Performance Management
Featured Use CasesAppendix
9© 2019 Trace3, Inc. All Rights Reserved

IT Operations Monitoring & Analytics (ITOMA)Seeing the difference between visibility and insight in IT Ops
Storage
ITO
A
IT Monitoring Landscape
ITIM
Log Web
© 2019 Trace3, Inc. All Rights Reserved
Cloud DatabaseApp Network Server
AIOps
Siloed Monitoring
© 2019 Trace3, Inc. All Rights Reserved
App Cloud Database Log Network Server Storage Web
1 – Emerson Network Power – Emerson Network Power Study Says Unplanned Data Center Outages Cost CompaniesNearly $9,000 Per Minute – 20162 - Application Performance Monitoring - Industry Challenges, State of the Art, and the cause for unified monitoring - 20153 - Infrastructure Monitoring Market by Technology - Marketsandmarkets.com - 20164 - Current Enterprise Application Monitoring Tools Often Siloed and Underutilized by IT Organizations, Reports NewResearch - AppDynamics - 20155 - Avoiding the Hidden Costs of Performance Monitoring Tools - SevOne - 2016
Sources
Landscape
10© 2019 Trace3, Inc. All Rights Reserved

IT Operations Monitoring & Analytics (ITOMA)Seeing the difference between visibility and insight in IT Ops
ITOA
IT Operations Analytics
© 2019 Trace3, Inc. All Rights Reserved
App Cloud Database Log Network Server Storage Web
ITO
A
ITIM
IT Infrastructure Monitoring
© 2019 Trace3, Inc. All Rights Reserved
App Cloud Database Log Network Server Storage Web
ITIM
Siloed Monitoring
© 2019 Trace3, Inc. All Rights Reserved
App Cloud Database Log Network Server Storage Web
Single Pane of Glass 1.0 - ITIM
Many Panes of Glass
11© 2019 Trace3, Inc. All Rights Reserved
IT Operations Monitoring & Analytics (ITOMA)Seeing the difference between visibility and insight in IT Ops
Source: https://dzone.com/articles/aiops-the-future-of-it-ops
ITOA
IT Operations Analytics
© 2019 Trace3, Inc. All Rights Reserved
App Cloud Database Log Network Server Storage Web
ITO
A
ITIM
IT Infrastructure Monitoring
© 2019 Trace3, Inc. All Rights Reserved
App Cloud Database Log Network Server Storage Web
ITIM
The emergence of AIOps
Single Pane of Glass 2.0 - ITOA
12© 2019 Trace3, Inc. All Rights Reserved
IT Operations Monitoring & Analytics (ITOMA)Seeing the difference between visibility and insight in IT Ops
Source: https://dzone.com/articles/aiops-the-future-of-it-ops
(end of report)
To solve the IT problems of tomorrow, our research engineers leverage Trace3's unique access across the technologylandscape to derive impartial insights. By identifying and analyzing technology and market trends, we enable ourcustomers to prepare for and master tomorrow's challenges before they arrive. Trace3 Research leverages ourpartnerships with 500 established and emerging technology companies, the real-world experience of over 250 engineers,a 3000-client ecosystem and deep relationships with dozens of the top Silicon Valley venture capital firms to spot trendsahead of most industry pundits. This allows you to take advantage of Trace3's Research unique access to gain an insideadvantage on tomorrow's trends and reduce your technical and business risk.
About Trace3 Research
13© 2019 Trace3, Inc. All Rights Reserved