Embed Size (px)
DESCRIPTION
Analytical Tools for Improving Access, Retention and Net Tuition Revenue. College Board Middle States Regional Forum 2008 Daniel J. Rodas, Long Island University Heather Gibbs, Long Island University Jim Scannell, Scannell & Kurz, Inc. Thursday, February 14, 2008. Overview. Key Objectives. - PowerPoint PPT Presentation
Citation preview

Analytical Tools for Improving Access, Retention and Net Tuition Revenue
College Board Middle States Regional Forum 2008
Daniel J. Rodas, Long Island UniversityHeather Gibbs, Long Island University Jim Scannell, Scannell & Kurz, Inc.
Thursday, February 14, 2008

Overview

3
Key Objectives
Increase student accessImprove undergraduate retentionIncrease net tuition revenueAchieve key enrollment objectivesMission attainment

4
Long Island UniversityFounded in 1926 as a private, co-
educational, non-sectarian institution Mission of “Access and Excellence”18,600 degree-seeking students600 degree and certificate programs$360 million operating budget$100 million endowment$1 billion replacement value/physical
assets

5
Long Island University
Two residential campuses: BrooklynC.W. Post
Four regional campusesBrentwoodRiverheadRocklandWestchester
653 full-time faculty162,000 living alumni

6
Core Methodologies
Quantitative modeling Table analysis Regression
Qualitative research Document analysis Interviews Focus groups
Competitive analysis Benchmarking of best practices

7
Case Studies
Undergraduate Pricing and Net TuitionGraduate Program ReviewRetention and PersistenceDiscussion

Discounting Policies & Practices

9
Types
Historical/IncrementalTable AnalysisPredictive modeling & regressionOptimization

10
Historical / Incremental Discounts based on historical experience:
incremental, benchmarking, trial and error Tied to a pre-determined discount rate Works best in a steady state marketplace
and stable class characteristics Problematic under:
Changing market conditions (e.g. competitors raise scholarship offers)
Rapid tuition growth; and/or Attempts to reconfigure the class profile
(e.g. socio-economic, geographic mix, academic ability, etc.)

11
Optimization ModelsStrategic approach to allocating financial aidComprises quantitative techniques to
understand the relationship between grant and student characteristics on the probability of enrollment
Tools include:Table analysisPredictive analysisPrice sensitivity analysis

12
Table Analysis: Example 1
Yields for Quality Level B: SAT 1100-1150 Probability of enrollment does not increase very much from aid
between $5,000 - $6,000, and aid > $7,000. *Scannell & Kurz
YIELDS FOR A PARTICULAR QUALITY LEVEL
Need $10,001-$12,000
Aid $ >$7,000 .50
$6,001-7,000 .47
$5,001-6,000 .45
$4,001-5,000 .20
$2,001-4,000 .15
$1-2,000 .11
0 .08

13
Table Analysis: Example 2Financial Need
Need $0 $15,000-$18,000 >$18,000
Grant Aid $ >$12,000
$9,000-12,000 55/100 55%
$6,000-9,000 20/80 25%
$3,000-6,000 8/40 20%
$1,001-3,000
0
•Grant aid for 220 accepted students with need of $15,000 - $18,000
14
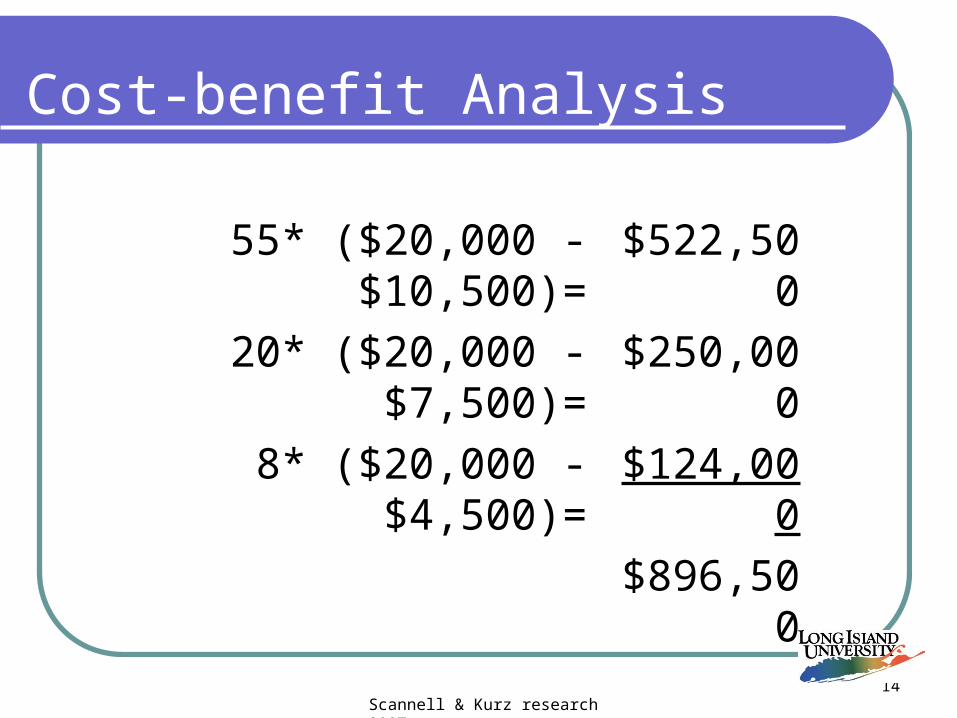
Cost-benefit Analysis
Scannell & Kurz research 2007
55* ($20,000 - $10,500)= $522,500
20* ($20,000 - $7,500)= $250,000
8* ($20,000 - $4,500)= $124,000
$896,500

15
Cost-benefit Analysis
What if all students in this need bracket received the top financial aid award?Projected enrollment:
220 * 55% = 121Projected net tuition revenue:
121 * ($20,000 - $10,500) = $1,149,500Gain in net tuition revenue:
$1,149,500 - $896,500 = $253,000

16
Benefits
$253,000 in additional net tuition revenueCritical massBetter residence hall utilization
(38 additional students at $4,000 = $152,000)
Improved per unit costs in diningBigger enrollment base for future years

17
Goals:Permits multivariate analysis Identify factors important in the enrollment
decisionDetermine the impact of institutional grant
on the probability of enrollmentDetermine the revenue-maximizing levels
of grants Identify alternative financial aid packaging
strategiesSuggest alternative admissions policies
Predictive Modeling and Price Sensitivity Analysis

18
Basic Regression equation: Probability of Enrolling a student =
(Student Need, Total Grant, SAT Scores, High School Grade Point Average, and “Other Student Characteristics”)
Collapse Quality into groups: Quality Group 1: SAT 1300+ and High School GPA 92+ Quality Group 2: SAT 1200+ and High School GPA 90+ Quality Group 3: SAT 1100+ and High School GPA 85+ Quality Group 4: SAT 1010+ and High School GPA 80+ Quality Group 5: SAT 900+ and High School GPA 80+ Quality Group 6: all others
Predictive Modeling and Price Sensitivity Analysis

19
Regression analysis:
Predictive Modeling and Price Sensitivity Analysis
Variable Marginal Effect
Calculation
Explanation
Total Grant 0.0294 For every $1,000 in grant, yield increases by 3%.
Need -0.0061 For every $1,000 in need, yield decreases by <1%.
FAFSA Filer 0.223 Students filing FAFSA forms are 22% more likely to enroll.
SAT -0.00062 For every extra 100 SAT points yield declines by 6.2%.
High School GPA Avg. -0.0098 For every 10 percentage point increase in HS average (e.g. 80 to 90), yield decreases by 9.8%.
Apply after 3/31 0.086 Students applying after 3/31 are 8.6% more likely to enroll.
Minority -0.08 Minority students are 8% less likely to enroll than majority students.
County A/County B 0.11 Students from Counties A and B are 11% more likely to enroll.
Large City HS -0.038 Students from large city high schools are 4% less likely to enroll.

22
Price SensitivitySimulation Summary Table #1
Predicted Class
(Baseline) Simulation #1 Simulation #4
Enrollment 945 952 1,074NTR $16,055,830 $16,401,210 $17,253,490Avg. NTR $17,000 $17,230 $16,070Institutional Grant $5,887,610 $5,706,670 $7,691,520Discount 27.0% 25.8% 30.8%Avg. SAT 1007 1008 1001H.S. Avg. 84 84 84out-of-state 144 144 162minority 233 233 289Aid applicants 826 833 955

23
Optimization: SummaryCreation of a data file is keyWillingness to create new packaging
policiesIs there slack in your system?May require a radical redefinition of how
you packageTest market versus total roll-outModel needs to be updated/refined
annually!

Graduate Program Review

25
Overview
Key QuestionsMethodologyObservationsPrice Sensitivity AnalysisRecommendationsConclusion

26
Key Questions
1. Is financial aid being used efficiently and effectively in support of enrollment goals?
2. Do recruitment processes ensure sufficient representation of target populations in the applicant pool?
3. Are there appropriate linkages between the programs and their campuses to ensure effective service to doctoral students and a “return on investment” to the University?

27
Methodology
Analysis of data file and departmental records (3 years)
Review of off-the-shelf materialsIn-person interviews and focus groups

28
Observations
Enrollment GoalsAdmissions PracticesFinancial Aid PracticesCompetitionIntegration with the CampusSummary

29
Enrollment Goals
16-18 new students admitted annuallyFaculty interest in increasing class
diversityDesire to improve yield on offers of
admissionPriority to enroll students who will serve
“underserved” populations (C.W. Post)

30
Admissions Practices
Little to no active effort to recruit students (primarily “word of mouth”)
Inefficient use of Web as recruiting toolLack of reports regarding InquiriesLittle effort to recruit LIU undergrads

31
Financial Aid Practices
Financial Aid offer made after applicant accepts offer of admission
Nearly identical level of funding is offered to all enrollees
Discount rate declined at both campuses from Fall 2004 to Fall 2006
Yield also declined at both campuses from Fall 2004 to Fall 2006

32
Financial Aid Practices (cont’d)
Brooklyn Campus2004 2005 2006
Admit 28 30 33
Enroll 16 16 15
Yield 57% 53% 45%
Avg Tuition & Fees $28,800 $30,530 $32,286
Avg Grant $23,363 $22,138 $23,704
Discount Rate 81.1% 72.5% 73.4%
Net Tuition Revenue $87,000 $134,280 $128,723
Avg GRE 1274 1262 1271
% Minority 18.8% 25.0% 13.3%

33
Financial Aid Practices (cont’d)
C.W. Post Campus2004 2005 2006
Admit 40 46 51
Enroll 16 17 16
Yield 40% 37% 31%
Avg Tuition & Fees $28,800 $30,530 $32,286
Avg Grant $11,070 $13,586 $10,531
Discount Rate 38.4% 44.5% 32.6%
Net Tuition Revenue $283,677 $288,050 $348,076
Avg GRE 1192 1185 1211
% Minority 37.5% 23.5% 12.5%

34
CompetitionLimited competition between two programsBoth compete with some of the same
institutions in the regionSome comparison and quality measures:
% of enrollees receiving tuition waivers or assistantships
Average GRE scoresU.S. News rankings# of APA approved internship placements

35
Integration with the Campus
Brooklyn program Highly integrated: Students work in Psychological Services Center,
which serves campus students Faculty teach at undergrad and master’s level
C.W. Post program Largely disconnected Clinic serves general public, not the campus Faculty teach exclusively in the PsyD program

36
Summary
Both campuses:Recruitment resources are not being used
strategically to meet stated goalsFinancial Aid resources are not being used
strategically to meet stated goalsPrice sensitivity must be investigated

37
Price Sensitivity AnalysisBrooklyn Campus
Net Tuition Revenue by Total GRE Score (2004 to 2006)
Year
2004 2005 2006
N Avg NTR N Avg NTR N Avg NTR
GRE Total Score
1000-1090 - - 1 $13,630 - -
1100-1190 3 $733 2 $4,780 1 $6,471
1200-1290 7 $5,057 5 $7,030 7 $8,179
1300-1390 5 $11,560 4 $9,805 4 $10,381
1400+ 1 $4,000 2 $5,130 2 $13,735
All 16 $5,437 14 $7,701 14 $9,480

39
Price Sensitivity Analysis (cont’d)C.W. Post Campus
Net Tuition Revenue by Total GRE Score (2004 to 2006)
Year
2004 2005 2006
N Avg NTR N Avg NTR N Avg NTR
GRE Total Score
no GRE 3 $19,066 2 $14,853 7 $20,428
<1000 1 $9,600 1 $30,530 - -
1000-1090 1 $21,031 3 $16,960 - -
1100-1190 4 $10,057 4 $17,070 5 $19,586
1200-1290 5 $20,383 4 $14,853 1 $21,286
1300-1390 2 $26,847 2 $14,853 3 $28,619
1400+ - - 1 $19,530 - -
All 16 $17,729 17 $16,944 16 $21,754

41
Recommendations
Use University’s new PeopleSoft system to capture data beginning at the point of initial inquiry.
Follow up with applicants who choose not to enroll in order to better understand the competitive environment.
Increase enrollment in each cohort by one or two students.
Use the Web more effectively to communicate distinctive program features, including lower cost of 4th year attendance.

42
Conclusion
Institutional investment in its programs is significant.
Recruitment efforts and decisions are not always consistent with expressed goals.
Institutional resources are not being used strategically to attract and enroll the populations of most interest.

44
Understanding and Responding to Retention Trends
Three Key Questions to Answer
1. How can we identify at-risk students?
2. How can we determine the impact of existing policies and programs?
3. Are there any “image versus reality” issues, fit issues, or service gaps?

45
Question #1: How Can We Identify At-Risk Students?
Analyze cohort retention and graduation rates by subpopulation.
Develop predictive models to isolate the impact of specific variables.

46
Cohort Retention / Graduation Rates by Subpopulation
Possible subpopulations to analyze: Financial aid group (need, income) Entry statistics (private HS vs. public HS) Academic Characteristics (SAT/ACT; HS GPA) Program area Gender GPA at institution Ethnicity Geography

47
Cohort Retention / Graduation Rates by Subpopulation
Excerpt from Sample Retention Table
Term 1No FAFSA 1141 673 59.0%$0 (No need) 664 513 77.3%$1-$10,000 514 391 76.1%10,001-16,000 535 403 75.3%$16,001-$22,000 694 503 72.5%$22,001-$28,000 1112 803 72.2%>$28,000 1002 714 71.3%
Term 3
Freshman to Sophomore Retention of Freshman Cohorts (2001-2006) by Need Level

48
Predictive Modeling
If students with Term 1 GPAs below a certain level are very unlikely to retain, build two models:One to predict who will have a low GPA One to understand the factors influencing
retention of achievers

49
Predictive Modeling – Excerptfrom Sample Predictive Model
Variable Marginal Effects Description
Total Grant 0.00834For every $1000 increase in total grant a person is .8% more likely to retain to Term 3
Need -0.00359For every $1000 increase in need a person is .3% less likely to retain to Term 3
FWS 0.054For every $1000 increase in on-campus earnings, students are 5.4% more likely to retain to Term 3
Term 1 GPA 0.0226For every additional GPA point (e.g. 2.5-3.5) a student is 2.3% more likely to retain.
Commuters 0.0434Commuters are 4.3% more likely to retain than students who live on campus.
In-State 0.0712State residents are 7.1% more likely to retain than out-of-state students.
Program for at-risk students 0.24663
Students in this program are 24.7% more likely to retain.
Funded Athletes 0.10274 Funded athletes are 10.2% more likely to retain.
*For Full Time Freshmen Who Achieved at Least a 2.0 GPA in Term 1

50
Possible Interventions Based on the Model
Increase on-campus work opportunities
Review residential life programming
Expand program for at-risk students
Predictive Modeling

51
Question #2: How Can We Determine the Impact of Existing Policies and Programs?
Capture participation data and then compare retention of participants and non-participants.
Be aware of national research on programs that have proven effective.
Conduct pilot programs.

52
Types of Participation Data to Capture
Athletic involvementStudent organization membershipHonors participantsFirst-year seminar participantsWork-study participantsEtc.

53
Question #3: Are There Any “Image Versus Reality” Issues, Fit Issues, or Service Gaps?
Know the national trends (from ACT) and trends among your competitors (from IPEDS).
Analyze student survey responses (NSSE, CSI, SOS, SSI, CIRP, etc.). Ideally responses would be tied back to
student ID. Conduct focus groups. Use National Student Clearinghouse data.
Note: Feedback loops and measurable goals are critical.

Discussion & Questions