Embed Size (px)
Citation preview

Chapter 7
Analytical Study of Organized Retail Outlets in Mumbai Metro
Division
7.1 Introduction
7.2 Retailing in Mumbai - Zonal Classification
7.3 Upcoming Supply Analysis
7.4 Rental Profile in Mumbai City
7.5 Research framework
7.6 Analyses of Sampling Profile
7.7 Analyses of the impact of organized retail sector in Mumbai
City
7.8 Testing of Hypotheses
7.9 Summary of the Study
7.10 Conclusion


332
Chapter 7
Analytical Study of Organized Retail Outlets in Mumbai Metro
Division
7.1 Introduction
Mumbai bears the tag of being the financial capital of the country and contributes
around 5 per cent of the country's GDP. The city is home to important financial
institutions like the Reserve Bank of India, the Bombay Stock Exchange and the
National Stock Exchange. Besides being the entertainment capital of the country, the
city has rich cosmopolitan demographics. These factors also ensure that the city
remains foremost in terms of the real estate development. The region referred to as
Mumbai Metropolitan Region (MMR), covers the city of Thane and Navi Mumbai
along with Mumbai city.
Mumbai, which houses the first Mall in the country, has a total organised retail stock
of 8.72 mn.sq.ft. and will witness 11.26 mn.sq.ft. of new retail development over the
next 3 years319
. The city is home to some of the most prominent and successful malls
in the country and the retail rentals are amongst the most expensive in the world.
While the size of the consumer market in the city is particularly large, the pace of
retail real estate development has outgrown the organised retail business over the last
4-5 years. This situation, coupled with the global financial crisis in 2008, forced
319
www.indiaretailing.com

333
retailers to curtail their expansion plans and put some large retailers on the brink of
bankruptcy. While the confidence of the retailers was shaken, the mall projects in the
city were stalled due to poor liquidity. Retail and commercial projects of the city were
on a negative list of the institutional lenders which made situation worse for
commercial real estate segment. While the situation has improved since mid 2009, the
retail space vacancy across the city still remains high. Many mall projects have been
marred because of poor design and also high concentration of malls in particular
catchment area. Taking cognizance of the poor demand situation, some malls with
high vacancy have started leasing space to office occupiers instead of waiting for
retailers.
Mumbai currently has 8.72 mn. sq.ft. of major operational mall space in the city.
These malls are spread all over the city, stretching from Nariman Point in South
Mumbai to Bhayander in the Western Suburbs and Kalyan in the Central Suburbs.
The city of Mumbai is divided into 4 zones: Island City, Western Suburbs, Central
Suburbs and Navi Mumbai. The malls in these zones have been analyzed and their
characteristics have been studied in order to provide a thorough examination of mall
space in Mumbai.
7.2 Retailing in Mumbai - Zonal Classification
Table 7.1
Zonal Classification of Retailing in Mumbai
S.No. Zone Locations
1 Island City Nariman Point, Haji Ali, Worli, Lower Parel,
Dadar, Mahim
2. Western Suburbs Bandra, Santacruz, Andheri, Goregaon, Malad,
Borivali, Dahisar, Mira Road- Bhayander stretch
3. Central Suburbs Matunga, Chembur, Ghatkopar, Mulund, Thane,
Kalyan, Bhandup
4. Navi Mumbai Airoli, Vashi, Kharghar
Source: Knight Frank Research.

334
As mentioned in table no 7.1 which shows the zonal classification in Mumbai. Retail
is an age old trade in the city of Mumbai. It has undergone considerable shift in the
last past decade and more radical changes are foreseen. Mumbai being a commercial
capital of India keeps vibrating with trade and commerce activities of all shapes and
forms. It’s been seen that retailing in Mumbai has undergone into drastic changes in
the last few years. The rising consumerism and increasing purchasing power of the
customer has led to significant growth of organized retail market in Mumbai. The
distribution of the Mumbai region on the basis of zonal aspects has been mentioned in
table no 4.1 which provides a clear idea of the location.
7.2.1 Island City
As mentioned in the table, the Island City zone of Mumbai encompasses all of South
Mumbai, Worli to Nariman Point, as well as Prabhadevi, Dadar and Mahim. The
major micro-markets covered in the Island City are Nariman Point, Worli-Prabhadevi,
Lower Parel and Haji Ali-Kemps Corner. Some of the major malls in the zone include
High Street Phoenix located at Lower Parel and Atria Mall located at Worli.
Since the Island City is considered to be a fairly up market residential area, there are a
large number of national and international brands present here. Two out of the three
major highstreets that were covered in this study are present in this zone, further
enhancing this zone's exclusive status.
Crossroads, the first mall in the country, located at Haji Ali was shut down and
bought by the Future Group in 2006 to convert it into office space with some amount
of retail space as well. The initially unorganised retail space has now been organised
and is referred to as SoBo (South Bombay) Central Mall, having a built up area of 0.1
mn. sq.ft. This name of the retail space was given as recently as 2009. Currently, there
is just a fraction of the space that is used commercially, with the majority comprising
retail space. This zone saw the development of a new mall called Palladium, which is
the newest part of the High Street Phoenix Mall at Lower Parel. It is referred to as

335
Phase 3, came into operation in 2009 and has a built up area of approximately 0.2 mn.
sq.ft.
The Island City only accounts for 15 percent of the major operational malls in
Mumbai with a total built up area of 1.3 mn. sq.ft. As mentioned earlier, owing to the
large volume of organised retail in this zone, there is a lack of dependence on mall
space. Furthermore, the average mall vacancy is only 4 percent since there are only 5
major malls in the Island City. With a smaller number of malls in the zone, it is
unlikely that any of them would operate without full capacity.
7.2.2 Western Suburbs
Some of the major micro-markets falling under the Western Suburbs include
Santacruz, Linking Road in Bandra, Andheri, Malad, Goregaon and Kandivali. All of
the major operational malls in this zone were covered, like Infinity Mall, Inorbit Mall
and Oberoi Mall.
In the last twelve months, only one new mall entered this zone- V Souk Mall located
in Kandivali West with a built up area of 0.2 mn. sq.ft320
. However, 2008 saw a
massive influx of mall space in this zone. Major malls that came into operation then
were Oberoi Mall, Mega Mall, Crystal Point Mall and Thakur Mall. The dominant
micro-markets in the Western Suburbs are Andheri (west) and Malad (west) with
these 2 micro-markets accounting for 6 large malls. A reason for this could be the lack
of organised retail in these spaces and hence the need for large malls. Another reason
could be the fact that a lot of individuals in these areas have an income higher than
individuals in the smaller micro-markets and therefore mall space is necessary.
Similar to the Island City, no major operational malls have been shut down in the last
twelve months. The Western Suburbs account for 43 percent of mall space in
Mumbai, the maximum of all the four zones. In all, this zone covers over 3.7 mn.
sq.ft. of operational mall space, with Oberoi Mall, situated in the micro market of
320
Devasahayam, Madona, ‘Big Deal’, Praxis Quarterly Journal on Management, August, Vol.2, No.2,
1998.

336
Goregaon, having more than 0.6 mn. sq.ft. of mall space. This zone has the most
number of malls as well, housing 14 major operational malls. The vacancy rates in
this zone are a lot higher than what was witnessed in the Island City. Here, the
average mall vacancy is around 21 per cent, primarily due to the fact that a lot of the
malls became operational within the last 2-3 years and have not found enough
retailers yet. Some of the older malls, like Inorbit Mall designed by K Raheja
Corporation and Growel's 101 designed by Garuel and Weil, have a 0 percent
vacancy.
7.2.3 Central Suburbs
The major micro-markets that were taken into consideration while studying the
Central Suburbs are Matunga, Chembur, Ghatkopar and Mulund. The micro-markets
of Thane and Kalyan, although normally considered an independent zone, were
clubbed along with the Central Suburbs. Over the past year, the major malls that
became operational in this zone were K Star Mall in Chembur with a built up area of
0.16 mn. sq.ft., and R City Mall in Ghatkopar having a built up area of 0.45 mn. sq.ft.
Both malls are retail only projects, containing multiplexes on the top floor. Similar to
the Island City and Western Suburbs, no major operational malls were shut down
during the last twelve months. Thane is an extremely dominant micro-market in this
zone. This is because Thane has seen major development in terms of residential real
estate. The micro-market has exponentially grown towards the Ghodbunder Road
with large scale residential projects coming up in the last few years. The rising
residential catchment has created a need for quality retail space and hence this micro-
market has seen an influx of new malls. Central Suburbs come second to the Western
Suburbs in terms of area occupied in Mumbai, accounting for 27 per cent of the total
stock in the city. The Central Suburbs have mall spaces aggregating to 2.4 mn. sq.ft.
but also have a high average mall vacancy, measuring approximately 29 per cent. This
is far higher than any of the other zones in Mumbai. A reason for this high vacancy
could be poor planning and designing of some of these malls. With poor designs,
people do not necessarily visit the full mall as it gets very complicated for them to
find their way around.
337
Retailers were unwilling to occupy a space which is difficult for consumers to get to
and hence those stores remain vacant. This is a possible explanation for the unusually
high vacancy rate in the Central Suburbs.
7.2.4 Navi Mumbai
The major micro-markets that fall under the Navi Mumbai zone are Airoli, Vashi and
Kharghar. There are only 6 major operational malls in this zone. Of the 6 major malls,
Inorbit Mall became operational in 2009 and has a very low vacancy rate; it is purely
a retail project. All the other 5 malls opened up in 2007-2008, hence all the malls in
this zone are relatively new malls. There were no major operational malls that shut
down in the last twelve months. Vashi is clearly the dominant micro-market in this
zone, housing 5 out of the 6 major malls. With the formation of Navi Mumbai, Vashi
was one of the major areas in that zone as it was seen as an entry point for commercial
activity. With an increase in commercial activity, there was a subsequent increase in
residential demand. And with an increase in commercial as well as residential demand
in that micro-market, the retail activity was forced to gather pace. Hence, more malls
are noticed in Vashi than any other micro-market in Navi Mumbai. Navi Mumbai has
relatively new malls and hence it only accounts for 15 percent of the total retail space
in Mumbai, covering 1.28 mn. sq.ft. of mall space. Vacancy in Navi Mumbai is also
relatively low, at 19 per cent average mall vacancy. This number translates to
approximately 237,000 sq.ft. of total mall vacancy in the zone. One reason behind this
vacancy could be the size of the malls. Most of the malls in Navi Mumbai are
relatively small in size, hence it is not possible to house tenants of all product
categories. Retailers do not wish to be a part of malls that cannot house other product
categories since that mall will not offer the consumers a complete shopping
experience. Hence, some retailers are hesitant to enter these malls and this could be a
potential reason behind the vacancy.

338
7.3 Upcoming Supply Analysis
Mumbai is set to witness a staggering 11.26 mn. sq.ft. of fresh retail space in the next
three years - 2010 to 2012321
. A possible reason behind such a huge amount of retail
space entering the market could be the fact that during the recent economic crisis, a
number of projects were stalled by developers. Now, with the economy on a sounder
foot, developers are keen to finish those stalled projects along with building new
projects. Hence the city is set to witness a great influx of retail space in the next three
years. There was an estimation of 11.26 mn. sq.ft., but approximately 7.4 mn. sq.ft.
was available by the end of 2010. There was another estimation of 3.1 mn. and 1.6
mn. This was set to come up by the end of 2011 and 2012 respectively and gradually
was achieved.
The Central Suburbs of Mumbai should experience maximum supply infusion over
the next three years. The zone would account for almost 7 mn. sq.ft. of retail space,
roughly 62 per cent of the total upcoming retail space in Mumbai. The micro-market
of Thane, which has been considered to be a part of the Central Suburbs, would be
accountable for 1.93 mn. sq.ft. of retail space. Thane has recently experienced a great
infrastructural boost and enhanced connectivity which has made projects easier to
develop. This could be a factor behind the relatively higher number of scheduled
projects. One major project planned to come up by 2011 is by Sheth Developers. The
mall will be called Viva City with a built up area of 800,000 sq.ft.
The Western Suburbs are the next most favoured destination for upcoming malls. Yet,
this zone still accounts for only 20 per cent of the upcoming retail space in Mumbai
with a total built up area of 2.26 mn. sq.ft. This shows how greatly the Central
Suburbs dominate the imminent mall space. The largest project in Western Suburbs
should be witnessed in the micro-market of Malad (west), where a 400,000 sq.ft.
project should be completed by end of 2011. Even though there are as many as 14
malls coming up in the Western Suburbs, none of them have a particularly large built
up area. The average size of all the 14 major upcoming malls is around 160,000 sq.ft.
321
Devasahayam, Madona, ‘Big Deal’, Praxis Quarterly Journal on Management, August, Vol.2, No.2,
1998.

339
so it is clear that the 400,000 sq.ft. project is by far the largest. Navi Mumbai accounts
for only 13 per cent of imminent retail space in Mumbai, with a total built up area of
approximately 1.4 mn. sq.ft. A major project that is scheduled to be developed by
2010 will be in the micro-market of Kharghar. The Green Valley Home Developers
are planning on building the Glomax Mall which will have a built up area of 350,000
sq.ft. Another key project will be witnessed in the Vashi micromarket, where Fantasia
Nano Shopping will be developed by Haware Builders and will occupy a total space
of 250,000 sq.ft. This project developed in 2010 and also have a small portion of
commercial space.
The Island City too experiences a very low built up area of upcoming retail space.
There are only 3 projects scheduled to come up in the next 5 years (2010-2015) in this
zone and hence the Island City accounts for only 620,000 sq.ft. or 6 percent of the
total upcoming supply. A possible reason behind this surprisingly low amount of
upcoming mall space could be the fact that the Island City has a large proportion of
organised retail.
Table 7.2
Supply Lag in Mumbai
S.No Year
Anticipated
Supply
(mn.sq.ft.)
Actual
Supply
(mn.sq.ft.)
Supply
Withdrawn
(mn.sq.ft.)
Supply
Stalled/Deferred
(mn.sq.ft.)
1 2006 4.64 0.36 - 4.28
2 2007 7.33 1.05 0.83 7.50
3 2008 3.67 3.13 1.37 2.10
4 2009 8.02 2.93 - 7.03
Source : Knight Frank India Research (Mumbai) 2002, ‘Searching for space’, Praxis Business Line,
January.
From analyzing Table 7.2, it is clear to understand that the Anticipated Supply for any
particular year, very rarely turns into the Actual Supply.
340
The years 2006 and 2007 were particularly difficult for developers, as 4.28 mn. sq.ft.
and 7.50 mn. sq.ft. of retail space respectively, was stalled or deferred. Although 2008
saw an Actual Supply of 3.13 mn. sq.ft., there was still approximately 3.47 mn. sq.ft.
of supply that was withdrawn or stalled. In 2009 there were greater delays in retail
projects where 75 per cent of the anticipated supply was stalled or deferred;
approximately 6 mn. sq.ft. of the anticipated 8 mn. sq.ft. failed to enter the market.
The above-mentioned Dreams Mall in Bhandup, which is highly anticipated amongst
consumers, had to reschedule its opening from 2008 to 2010. While the reasons for all
these delays vary from a lack of funds, to poor planning and designing, the fact
remains that retail projects are very often delayed.
7.4 Rental Profile in Mumbai City
While considering the anchor tenant rentals across the zones in Mumbai, it is clear
that their average monthly rentals range from Rs. 41-89/sq.ft. per month. While this is
not a very large range, it is also worth noting that rentals in the Island City are
considerably higher than rentals in Navi Mumbai. It stems from the value of property
in the two zones, with the Island City containing significantly higher property values
than Navi Mumbai. This scenario is evident while looking at the Vanilla tenant rentals
as well. The average monthly rentals range from Rs. 97267/sq.ft. per month322
. Once
again, the Island City has the highest rentals with Navi Mumbai having the lowest
rentals. It is also worth mentioning that anchor tenants in the Island City pay almost
the same amount of rent as vanilla tenants do in Navi Mumbai. This proves the
disparity between the two zones and clearly indicates where the property prices are
higher. brief look at the floor-wise variations between anchor and vanilla tenants
makes it clear that stores on the lower levels command much higher rentals than
stores on the higher levels. This is only normal with the lower level floors attracting a
significantly larger footfall than the upper level stores. This variation is clearly
noticed in anchor as well as vanilla tenants, with the same theory applying to both.
Vanilla tenants on the lower levels of malls are amongst the highest rent payers of all
322
Kannan, S., ‘Huge potential awaits retailing’, Business line, Thursday, September 1, 2001.

341
the tenants in the malls, with their small stores generally attracting the highest
footfalls in the mall. While observing Mumbai, as a whole, the rental values in malls
have actually appreciated by around 9 percent during the period March 2009-
February 2010. This is relatively surprising since during the same period, the national
average saw prices depreciate by around 30 percent. This proves that even though the
rest of the country was forced to slash prices due to low turnover from malls, Mumbai
was still functioning normally, with prices not only remaining constant but even rising
in certain micro-markets.
Retailing has now become a key growth area. There has been an attitude change in the
way the Indian consumer thinks about shopping. What, were and how they buy is now
the big question. Over the last decade, there has been a significant evolution in his
psyche, a change that has been carefully recorded and documented by behavioral
pundits. Although it is most noticeable in large metros, its impact is also seen in small
towns. The change was kicked off by the economic liberalization of the 1900's and
accelerated by the media (cable) boom following the Gulf War, when the radical
explosion in media images exposed the Indian consumer to the lifestyle enjoyed in
more affluent countries. Earlier, it was the lack of consumer culture along with low
incomes that prevented the development of such formats. But economic growth has
now triggered off a spending spree, with India's middle and high-in-come population
suddenly realizing that they have enough disposable income to go for the good times.
As the low-income base shrinks, there is an ever- increasing expansion of the higher
income groups, with a corresponding demand for consumer goods that allows the
deeper penetration of high quality and higher priced products. The early indicators of
this revolution are the mushrooming of better quality retail outlets, a profusion of
brands and various product options. The Indian consumer who can discern a clear
value propositions and unbeatable ranges at unbeatable prices served to him on a
platter. The retail industry is now beginning to evolve. Traditionally, most retailers
have very localized operations but this nature of the industry is fast changing with the
awareness that sources must be developed and a proper merchandising system put in
place. The pace of transformation has accelerated and today India has over 12 million
retail outlets. As a phenomenon, retail marketing has a radical impact and can bring in

342
new technologies, systems and mindsets. It can improve overall labor, productivity
and employment, all in the name of providing the consumer with a better range of
products at better prices in a better ambience. The nature of the economic system
(capitalism, socialism) in a country has a direct impact on the retailer’s business.
Therefore, a retailer should have a thorough a2understanding of the various economic
factors of a country that would influence their operations and profitability. Some of
the economic factors that affects the retailer are – Gross domestic product, rate
of inflation, purchasing power, interest rates, tax levels, employment growth etc.
higher growth rate of GDP (in real terms) implies that consumers have more income
and hence, they spend more, resulting in higher sales and more profits for retailers.
On the other hand, increase in inflation leads to a decrease in the purchasing power of
the consumers. The economic reforms of the1990’s have resulted in higher economic
growth than that observed in the previous decade.
Retail, India's largest industry is driven by the markets' ability to provide better
products in a comfortable ambience at affordable prices. The growth of large multi-
brand apparel outlets is one result. These outlets are usually 20,000-50,000 sq ft in
size, have their own parking space, and separate counters for perfumes, accessories,
men's wear, women's clothing and children’s clothing. Some stores also have toys,
books, home wear, footwear and music. Some of these retailers have begun to develop
a private label brand, to supplement their range and improve their margins. These
have become significant brands in their own right. Similar departmental stores/multi
brand outlets are likely to develop into a significant format in the Indian market
over the next decade. The players who can make organized retailing an integral part
of India will be the ones who reap the benefits at the end of the change process. The
industry however will have to work in tandem with the government and manufactures
to build a more positive environment for retail and cater to the demand for better
products and retailing from India's first generation of demanding cash rich consumer
An important aspect of the current economic scenario in India is the emergence of
organized retail. There has been considerable growth in organized retailing business
in recent years and it is poised for much faster growth in the future. Major industrial
houses have entered this area and have announced very ambitious future expansion

343
plans. Transnational corporations are also seeking to come to India and set up retail
chains in collaboration with big Indian companies. However, opinions are divided on
the impact of the growth of organized retail in the country. Concerns have been raised
that the growth of organized retailing may have an adverse impact on retailers in the
unorganized sector. It has also been argued that growth of organized retailing will
yield efficiencies in the supply chain, enabling better access to markets to producers
(including farmers and small producers) and enabling higher prices, on the one hand
and, lower prices to consumers, on the other. In the context of divergent views on the
impact of organized retail, it is essential that an in-depth analytical study on the
possible effects of organized retailing in India is conducted. There has been a creeping
internationalization of retailing over the recent period. As home markets have become
crowded and with opportunities in emerging markets rising, modern retailers from
developed countries have been turning to new markets.
Expansion of Organized Retail by Format
There has been an expansion of organized retail in terms of the different modern retail
formats.
The total number of organized retail outlets rose from 3,125 covering an area of 3.3
million sq. ft. in 2001 to 27,076 with an area of 31 million sq. ft. in 2007. Small-sized
single-category specialty stores dominated the organized retail in the beginning with
almost two-thirds of total space in 2001. Departmental stores came next with nearly a
quarter of total space and supermarkets accounting for the balance of about 12 per
cent of organized retail space. There were no hypermarkets in India in 2001. Specialty
stores are still the most common modern retail format with over a half of total modern
retail space in 2007. Supermarkets and department stores, occupied nearly an equal
space of 15-16 per cent each in 2007. In 2006, India had about 75 large-sized
hypermarkets carrying a tenth of the total modern retail space in the country. This
format is expected to gain more prominence in the future. To understand this growth
structure the researcher conducted an analytical study of the organized retail outlets in
Mumbai region.
344
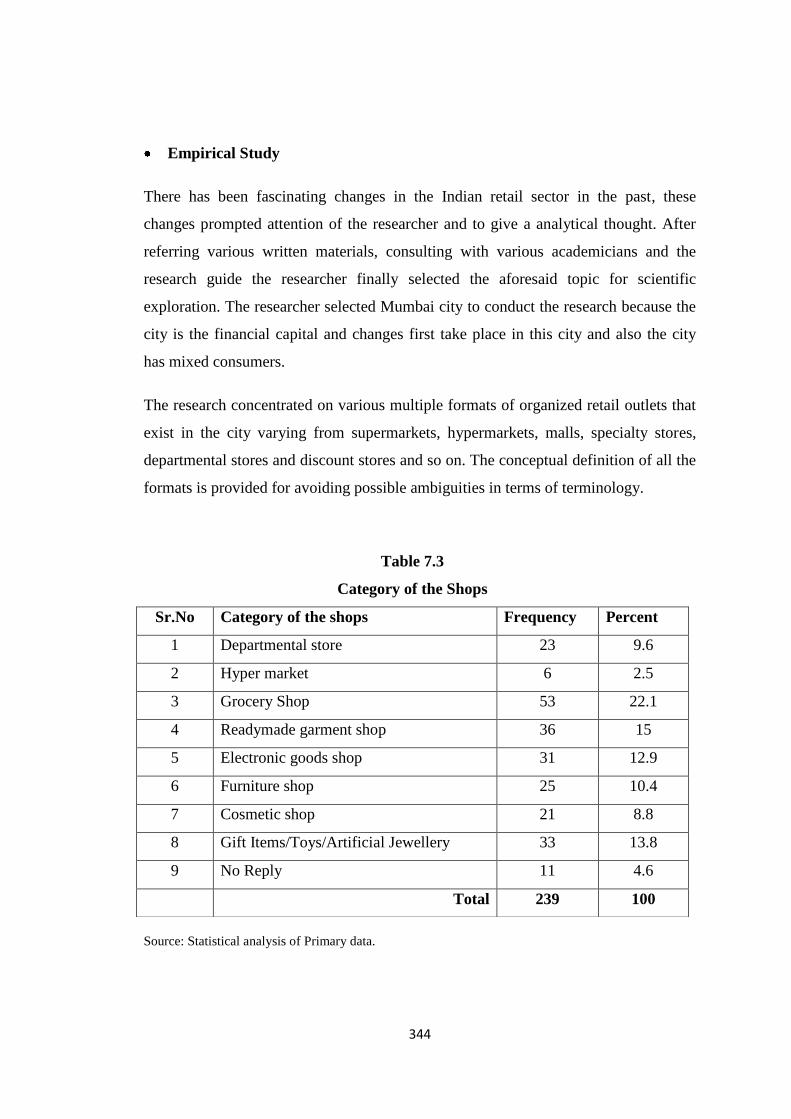
Empirical Study
There has been fascinating changes in the Indian retail sector in the past, these
changes prompted attention of the researcher and to give a analytical thought. After
referring various written materials, consulting with various academicians and the
research guide the researcher finally selected the aforesaid topic for scientific
exploration. The researcher selected Mumbai city to conduct the research because the
city is the financial capital and changes first take place in this city and also the city
has mixed consumers.
The research concentrated on various multiple formats of organized retail outlets that
exist in the city varying from supermarkets, hypermarkets, malls, specialty stores,
departmental stores and discount stores and so on. The conceptual definition of all the
formats is provided for avoiding possible ambiguities in terms of terminology.
Source: Statistical analysis of Primary data.
Table 7.3
Category of the Shops
Sr.No Category of the shops Frequency Percent
1 Departmental store 23 9.6
2 Hyper market 6 2.5
3 Grocery Shop 53 22.1
4 Readymade garment shop 36 15
5 Electronic goods shop 31 12.9
6 Furniture shop 25 10.4
7 Cosmetic shop 21 8.8
8 Gift Items/Toys/Artificial Jewellery 33 13.8
9 No Reply 11 4.6
Total 239 100

345
Graph 7.1
Categories of the Shops
The researcher conducted a research with organized retailers in Mumbai and the
results put in tabular form. The above Table 7.3 graph 7.1 shows that there are all
categories of shops in the organized section the market is evenly distributed with
various category shops but the maximum people belonged to grocery shop with 53
numbers and 22.1 percentage followed by readymade garment shop with 36 number
and 15 percentage. There is also presence of electronic good shop with 31 numbers
and 12.9 percent, furniture shops with 25 numbers 10.4 percent and even retailers
with cosmetics with 21 numbers 8.8 percent and gift and artificial jewelery categories
with 33 numbers and 13.8 percent have equal share in the market. This shows that
gradually organized outlets in Mumbai are capturing the market with every category
keeping the demand and needs of the consumers and therefore have been popular with
categories like grocery, readymade garments, electronic but after shift in the economy
a special category developed belonging to gift items/toys/artificial jewelery.
0
20
40
60
23
6
53
36 31 25 2133
11 Frequency
346
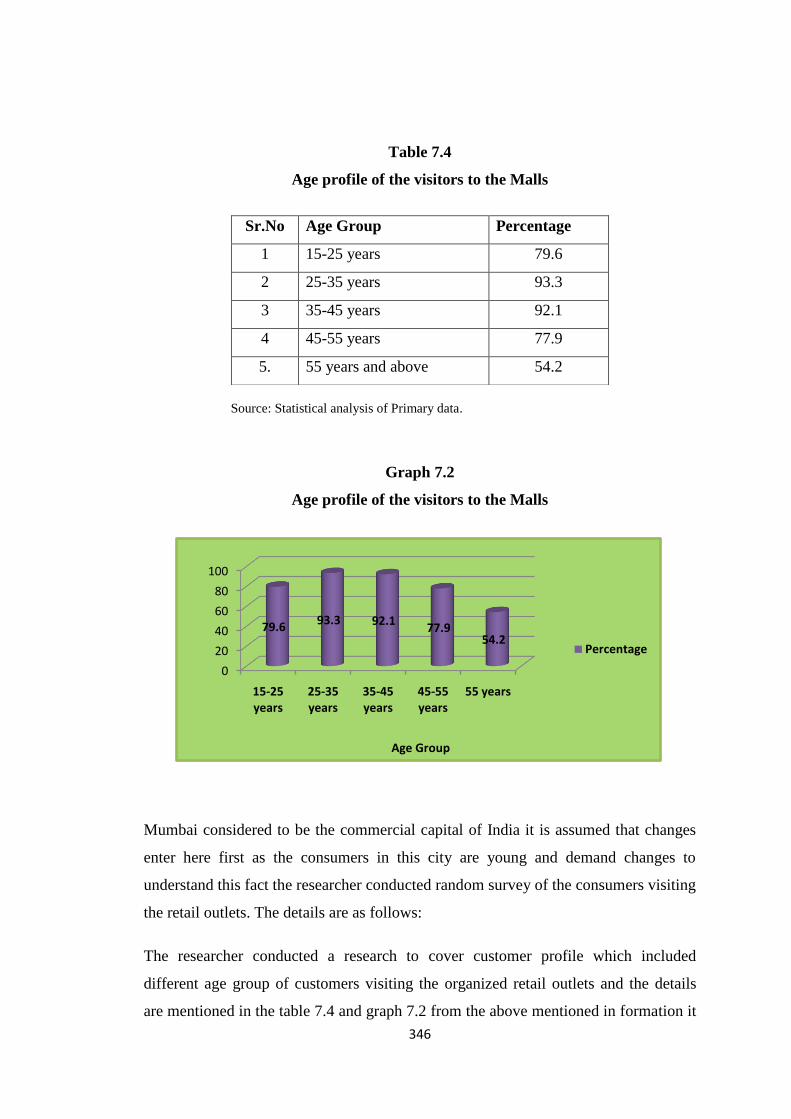
Table 7.4
Age profile of the visitors to the Malls
Source: Statistical analysis of Primary data.
Graph 7.2
Age profile of the visitors to the Malls
Mumbai considered to be the commercial capital of India it is assumed that changes
enter here first as the consumers in this city are young and demand changes to
understand this fact the researcher conducted random survey of the consumers visiting
the retail outlets. The details are as follows:
The researcher conducted a research to cover customer profile which included
different age group of customers visiting the organized retail outlets and the details
are mentioned in the table 7.4 and graph 7.2 from the above mentioned in formation it
Sr.No Age Group Percentage
1 15-25 years 79.6
2 25-35 years 93.3
3 35-45 years 92.1
4 45-55 years 77.9
5. 55 years and above 54.2
0
20
40
60
80
100
15-25 years
25-35 years
35-45 years
45-55 years
55 years
79.693.3 92.1
77.954.2
Age Group
Percentage

347
is been observed that there has been subsequent division of the crowd visiting the
outlets, but the major crowd belongs to the youngsters in the age bracket 25-35 and
the middle age group in the age bracket 35-45 its been observed that the customer
base beyond the age group of 55 occasionally visit malls. Therefore it is confirmed
that the age group 25-35 and 35-45 consisting of that the young people going to
college and the middle age group office going to college and the middle age group
goers patronized the organized retail outlets they seems to be influencing the market
as they are the major chunk of productive consumers.
Table 7.5
Types of Products displayed in the store in Malls
Sr.No Product category Response Percent
1 Branded 192 80
2 Ubranded 54 22.5
3 Private 58 24.2
Total 304 127.7
Source: Statistical analysis of Primary data.
Graph 7.3
Types of Products displayed in the store in Malls
0
20
40
60
80
100
120
140
160
180
200
Branded Ubranded Private
192
54 58
Product category
Response

348
Table 7.5 graph 7.3 gives a clear idea of products being displayed by the outlets. The
researcher took three categories and the results were that maximum outlets believe in
having branded goods in order to attract maximum consumers. It also justifies the
popularity of the organized outlets in comparison to unorganized outlets. The
researcher also unfolded that there is a section which also maintains unbranded
category and goods from private labels in order to maintain a balance in the turnover
and to have a regular flow of consumers belonging to lower middle class and lower
class who also happens to be attracted towards organized retail outlets. The survey
also revealed a fact that in Mumbai the consumers of the entire category differ in their
choice according to their needs; therefore the retailers have to stock branded
unbranded products. The survey also revealed a fifty eight percent of retailers relying
on private goods that is because a few of the shopkeepers have their own workshops
as well as marketing showrooms wherein their own products are displayed for sale
and sometimes they either directly purchase from the local distributors depending
upon their requirements.
Purchase Pattern
The purchasing pattern followed in Mumbai have a combination of the various
options available to the shopkeepers and that he decides on the basis of the their
requirements they depend on three sources directly from the companies, local
distributors and from the wholesalers. Following table provides the information about
their purchasing patterns:
Table 7.6
Area of purchases made by Retailers in the Malls
Sr.No Purchases Made Response Percent
1 Whole-sale dealer 179 74.6
2 Local distributors 94 39.2
3 Directly from the companies 118 49.2
Total 391 163.0
Source: Statistical analysis of Primary data.

349
Graph 7.4
Area of purchases made by Retailers in the Malls
Table 7.6 Graph 7.4 unfolds a major confusion of modern organized retailers in the
area of the buying the goods from and the researcher through the research justifies
that maximum retailers buy their goods from the wholesaler and further directly from
the companies as it has been mentioned earlier that they maintain branded goods. In
order to maintain stock for the local consumers at affordable price the retailer also
buys goods from the local distributors but at minimum amount.
Inventory Stock Maintenance
Inventory Stock Management is an important aspect of material management. It refers
to the stock of items which are held for sale. It covers the areas such as period of the
inventory which is normally maintained. It is important to maintain enough stock in
order to meet the demands of the consumers. The researcher tried to find out the
system followed by the organized retailers in inventory management the details are
put up below:
0 50 100 150 200
Whole-sale dealer
Local distributors
Directly from the companies
179
94
118
Response

350
Table 7.7
Maintaining stock of Inventory
Source: Statistical analysis of Primary data.
Graph 7.5
Maintaining stock of Inventory
Table 7.7 and Graph 7.5 unfold the inventory management of the retailers. Out of
total two hundred forty shops surveyed there was one hundred seventy one positive
reply who believed in maintaining stock of inventory to serve the consumers better
further sixty seven respondents believed in not maintaining the stock according to
them this will block their working capital and they further had practice of taking order
and then going for supply.
Sr.No Option Response Percent
1 Yes 171 71.3
2 No 67 27.9
3 No Reply 2 0.8
Total 240 100
0
50
100
150
200
Yes No No Reply
171
67
2
Response

351
The researcher was keen in knowing the policy of the retailers in maintaining the
stock turnover period he surveyed around two forty retailers and the results are put up
as below:
Table 7.8
Period of Inventory
Sr.No Period of Inventory No of Retailers Percent
1 1-3 months 59 24.6
2 3-6 months 24 10
3 6-9 months 8 3.3
4 > 9 months 81 33.8
5 No Reply 68 28.3
Total 240 100
Source : Statistical analysis of Primary data.
Graph 7.6
Period of Inventory
59
24
8
81
68
Frequency
1-3 months
3-6 months
6-9 months
> 9 months
No Reply

352
Table 7.8 and Graph 7.6 majority of shops 33.8 percent keep the stocks for more than
nine months therefore it can be seen that the retailers believe in maintaining stock for
longer period in order to avoid fluctuation in demand. Out of the total 59 retailers with
24.6 percent believed in rotating their inventory in one to three months thus it can be
inferred that these shops maintain fast moving consumer goods whose demand keep
shifting according to the time and 24 retailers with 10 percent rotate within three to
six months maintaining a steady and regular demand. The researcher also found it
difficult to get no reply from sixty eight retailers who choose to remain silent.
Thus with this survey the researcher concluded that the retailer in order to be
successful, face competition and bring in consumer satisfaction maintains stock of
inventory.
Customer Footfalls
Indian organized retail outlets have started making a remarkable impact on the
economy and gradually it started making an impact on consumer’s behavior. The
development of malls has specially created a change in the pattern of lifestyle of the
modern era consumer. This shift has been absorbed more in urban cities like Mumbai.
There is a gap between the customers visiting the malls and making purchases.
Mumbai consumer’s behavior pattern also differs during weekdays and weekends.
The researcher in order to understand this change conducted a survey and the results
put up as follows.
Table 7.9
Customer footfalls during Weekdays in the Malls
Sr.No Particulars Customer footfalls Percent
1 Up to 100 113 47.1
2 Up to 200 80 33.3
3 No Response 47 19.6
Total 240 100
Source: Statistical analysis of Primary data.

353
Graph 7.7
Customer footfalls during Weekdays in the Malls
The growth of the retail outlets is understood by the footfalls especially during
weekdays and weekends. According to table no 7.9 and Graph 7.7 shows that during
week days there are about 113 customers up to a range of 100 and 80 customers in the
category of up to 200.
Table 7.10
Customer footfalls during Weekends in Malls
Sr.No Particulars Customer footfalls Percent
1 Up to 100 65 27.1
2 101 to 200 112 47.7
3 201 to 300 11 4.6
4 301 to 400 3 1.3
5 No Response 49 20.4
Total 240 100
Source: Statistical analysis of Primary data.
113
80
47
Customer footfalls
Up to 100
Up to 200
No Response

354
Graph 7.8
Customer footfalls during Weekends in Malls
Table 7.10 and graph 7.8 shows the footfalls during weekends. Out of 240
respondents 49 respondents decided not to respond but according to the rest of
respondents the maximum footfalls during weekends is between 101-200 with 112
respondents confirming the category 65 respondents confirming upto 100.
This shows that in Mumbai the footfalls of consumers during weekdays and weekends
are almost similar.
Promotional Methods
This ‘P’ of marketing plays a very important role in today’s competitive business
world; It is been absorbed that in order to pull the consumer to the retail shop it is
very important to contact them with appropriate offers. The urban consumers a very
choose therefore it is important pull them with basic offers. . In this category an array
of offers are given to the prospects so that a competitive market environment can be
created and the details show below of contacting them on regular bases give an
interesting scenario.
020406080
100120
65112
113
49Customer footfalls

355
Table 7.11
Methods Followed by Retailers to contact customers on regular bases
Source : Statistical analysis of Primary data.
Graph 7.9
Methods Followed by Retailers to contact customers on regular bases
In table 7.11 and Graph 7.9 data pertaining to various promotional scheme offered by
retailers are presented. The most popular is festival offer (With discount) where 47.7
percent retailers thought in Mumbai consumers rush to the outlets more during festive
season which runs throughout the year, especially during ganapati, diwali and
christmas. This is followed by normal discount schemes with 22.5 percent of them
Sr.No Name of Promotional Schemes Frequency Percent
1 Discounts 54 22.5
2 Seasonal Sales 51 21.3
3 Exchange offer (with old) 18 7.5
4 Festival offer (discount) 112 47.7
5 Gifts with every purchase 24 10
6 Discount on Bulk Purchase 3 1.3
7 Any other 20 8.3
Total 282 100
020406080
100120
54 5118
112
243 20
Frequency

356
being optimistic in maintain the regular flow of consumers to their outlets, the
retailers were of the opinion that that today to pull the customers to their shops it is
important to provide them the discount schemes on regularity basis. In the
competitive environment where consumer has become so very choose the other most
popular offer shown in the table is seasonal sales with 21.3 percent. The analysis also
shows a unique feature which has developed more in the recent past that is banded
packs (buy one get one free) offers with 10 percent retailers opting for this scheme.
Development of nuclear family resulted in losing the impact of bulk purchases
therefore there is very small percentage which offers discount on bulk purchases.
Therefore it shows that to retain the consumers the retailer mostly follow the above
mentioned schemes regularly. This also helps the retailers to ascertain their
credentials.
Advertising and Publicity techniques
The competitive environment prevailing today requires consumers to be loyal. The
consumer of today requires awareness information and persuasion. The retailer
follows this marketing strategy which includes advertising and publicity through the
data analysis is presented in the following table.
Table 7.12
Publicity methods followed by retailers
Sr.No. Publicity methods Response Percent
1 Print Media 59 24.6
2 Outdoor Advertising (Banner/Hoarding) 28 11.7
3 Electronic media 6 2.5
4 Mouth to mouth publicity 30 12.5
5 Internet 96 40
6 Distribution of pamphlets 7 2.9
Total 226 100
Source : Statistical analysis of Primary data.

357
Graph 7.10
Publicity methods followed by retailers
Table 7.12 and graph 7.10 shows the detailed information about the various publicity
strategies used by the retailers. The most popular methodology in the modern era
being through Internet. This shows that most of the retailers are technology friendly
and believe in capturing maximum consumers in minimum time. The other area being
the traditional method print media with 24.6 percent as the retailers wants to reach to
every remote area where there is no internet connection. The print media being
cheaper in cost and has huge frequency in reaching maximum consumer at minimum
cost.
Further it has also been observed that most of the retailers believe in Personal touch in
marketing, therefore their publicity focus also has been to mouth to mouth publicity
with 12.5 percent.
The analysis also shows that there is less inclination towards distribution of pamphlets
with 2.9 percent in modern society. This result further highlights the fact that the
consumer does not get convinced merely by getting pamphlets. Therefore to attract
modern consumer the retailers have to do something unique to be on the top on mind
of the consumer.
0 20 40 60 80 100
Print Media
Outdoor Advertising …
Electronic media
Mouth to mouth publicity
Internet
Distribution of pamphlets
59
28
6
30
96
7
Response
358
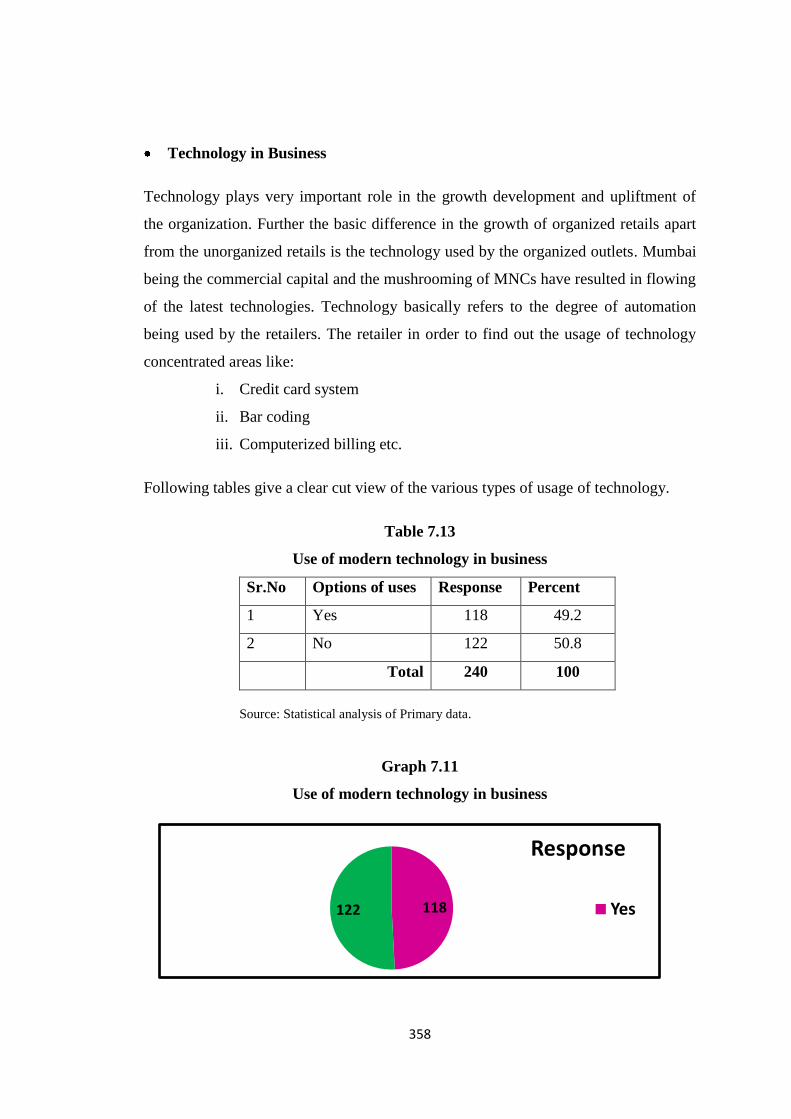
Technology in Business
Technology plays very important role in the growth development and upliftment of
the organization. Further the basic difference in the growth of organized retails apart
from the unorganized retails is the technology used by the organized outlets. Mumbai
being the commercial capital and the mushrooming of MNCs have resulted in flowing
of the latest technologies. Technology basically refers to the degree of automation
being used by the retailers. The retailer in order to find out the usage of technology
concentrated areas like:
i. Credit card system
ii. Bar coding
iii. Computerized billing etc.
Following tables give a clear cut view of the various types of usage of technology.
Table 7.13
Use of modern technology in business
Sr.No Options of uses Response Percent
1 Yes 118 49.2
2 No 122 50.8
Total 240 100
Source: Statistical analysis of Primary data.
Graph 7.11
Use of modern technology in business
118122
Response
Yes

359
As per the Table 7.13 and Graph 7.11 out of total two hundred forty retailers surveyed
there were around 50.8 percent of the responders who said they do not use any
modern technologies in their shop and 49.2 percent were very optimistic in stating
that they follow the trend and believe in serving the consumer with modern
technology. They further stated that using latest technology has made their work more
systematic and they are able to maintain proper records. According to the retailers
using the modern technology though initially costed on their budget but in the long
run it has become cost effective.
Table 7.14
Systems used in the shop
Source : Statistical analysis of Primary data.
Graph 7.12
Systems used in the shop
Sr.No Systems Used Response Percent
1 ERP 89 37.1
2 SAP/Tally 33 13.8
3 Bar coding and scanners 89 37.1
4 Credit card payments 9 3.8
5 Computerized billing 3 1.3
Total 223 100
0 20 40 60 80 100
ERP
SAP/Tally
Bar coding and scanners
Credit card payments
Computerized billing
89
33
89
9
3
Response

360
Table 7.14 and Graph 7.12 reveals that most of the retailers who follow the modern
technology have ERP (37.1 percent) Bar coding and scanners (37.1 percent) as most
prominent systems further followed by SAP/Tally (13.8 percent). It has been absorbed
that due to hacking and computer crimes being more prominent in the recent past the
retailers are hesitant to use those systems, therefore resulting in least response.
Human Resource Management
Retailing being a dynamic and growth oriented industry does require effective
management of human resources that organizational objectives and individual
objectives can be balanced effectively. The activities to be performed by the
employees working in a retail organization are very comprehensive and vary from
organization to organization but commonly used practices are followed by most of the
retailers in order to protect and nurture the talents of the human resources in the work
place. The researcher during the research found out that the retailers try to maintain a
balance between modern and traditional techniques in conducting human resource
management techniques, further it also has been found out that there is no
professional approach in maintaining human resource. The retailers mostly rely on
family members or close relatives. In order to justify this statement the researcher
conducted survey into the following human resource management areas:
i. Methods of Recruitment and Selection.
ii. Training of the employees.
iii. Facilities provided to the employees.
Recruitment and Selection of the employees
This is an important area in the process of human resource management since the
business depends on efficient manpower. The survey brought to the notice that
selection of staff is basically by maintaining traditional approach that is because in the
business of retail trust plays an important role.

361
Table 7.15
Method used for selection of employees
Sr.No Name of the methods Response Percent
1 Personal Contacts 146 60.8
2 Advertisement in Newspaper 25 10.4
3 Family Member 110 45.8
4 Any Other 18 7.5
Total 240 100
Source: Statistical analysis of Primary data.
Graph 7.13
Method used for selection of employees
As per the data presented in Table 7.15 and Graph 7.13 it is clearly evident that most
of the retailers believe in having their own family members into their business with
45.8 percent favoring it. This could reduce their expenses on the selection process and
further in Mumbai most of the retailers manage family business. There is also one
more area which is very strongly accepted by the retailers that is personal contacts
with 60.8. According to the result put in the table this is the area which is sought more
by the retailers, the personal contacts were distant relatives or people brought from
0%
20%
40%
60%
80%
100%
146 25 110 18
Response

362
native who come to Mumbai in search of livelihood. Appointment through
advertisements is not much preferred with 10.4 percent of the retailers opting for it.
This shows employee selection till date in retailing depends on personal contacts due
to trust factor in business.
Method followed in Training and development
All type of jobs require training and development of the employees for their efficient
performance therefore all the employees, new or old should undergo this process from
time to time. Further, in Mumbai the way retail outlets are developing and emerging it
becomes imperative for the organized retail outlets in the city to systematically
introduce planned training programmes aiming to increase the knowledge, skills,
abilities and aptitude of the employees to perform the new competitive task
effectively and efficiently. The researcher concentrated on two areas, on the job and
off the job he therefore with the help of the survey tried to find out the systems
followed by the retailers in Mumbai metro region the results are given below:
Table 7.16
The system followed by the retailers for training of employees
Source: Statistical analysis of Primary data.
Sr.No System of training Frequency Percent
1 on the job 89 37.1
2 off the job training 89 37.1
3 No Response 62 25.8
Total 240 100

363
Graph 7.14
The system followed by the retailers for training of employees
In Table 7.16 and Graph 7.14 out of two hundred forty retailers surveyed 25.8
percentage of responders were not very clear of the system followed by them
therefore they decided to remain silent. Further out of 179 responders it has been
found out that there is a balance between on the job (37.1 percent) and off the job
(37.1 percent) system being followed by them. This shows that the retailers in
Mumbai have tried to maintain both traditional (Job Rotation etc) as well as modern
techniques (Universities and Training Centers etc) and followed the principle of learn
by doing.
Facilities to the employees
Facilities represent a substantial part in any organization, it is equally important to the
organization and the employees. Hence it becomes imperative for the HR department
of any retail business to have clear cut policy guidelines which could benefit both the
employee and the organization.
Since the survey was of organized retail outlets it was found that areas like annual
salary and fringes were considered the most. It was also seen that these benefits were
differing from shop to shop.
89
89
62
0 20 40 60 80 100
on the job
off the job training
No Response
Frequency

364
The results further gives a clear idea of the system followed by most of the organized
retailers in Mumbai and further their popularity.
Table 7.17
Facilities provided by the retailers to employees
Graph 7.15
Facilities provided by the retailers to employees
Name of facilities provided to employees Response Percent
Annual Salary Increment 118 49.2
Bonus 19 7.9
Fringes 120 50
Medical facilities 50 20.8
Casual Leave 22 9.2
Annual Leave (Earned Leave) 5 2.1
Total 334 100
Source: Statistical analysis of Primary data.
0
50
100
150
118
19
120
5022 5 Response
365
Table 7.17 and Graph 7.15 provide information pertaining to the facilities provided to
the employees in the organized outlets in Mumbai. The result shows that the retailers
provide quite number of facilities to the employees like annual salary increment (49.2
percent) bonus (7.9 percent) Fringes (50 percent) based on performance medical
facilities (20.8 percent) casual leave (9.2 percent) and further few also followed the
system of annual leave (2.1). The results show that most of the concentrated on annual
salary increment and fringes, it also shows that the retailers do provide medical
facilities to their employees. Therefore from the results it is quite evident that
organized retails follow the proper system of human resource development
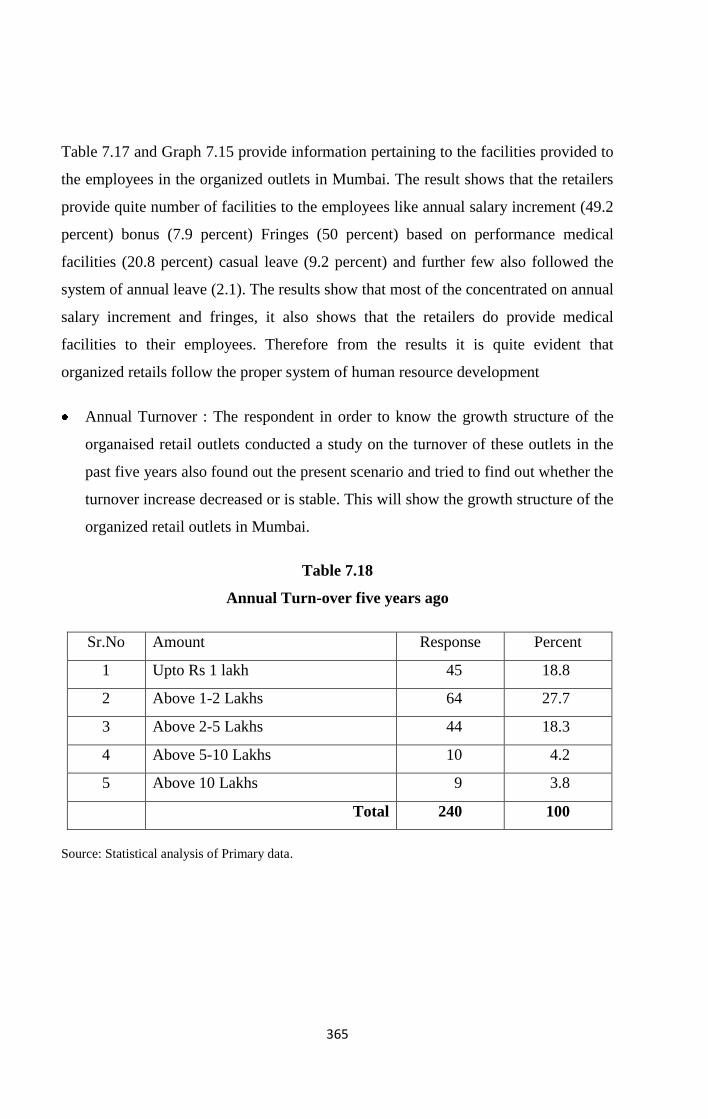
Annual Turnover : The respondent in order to know the growth structure of the
organaised retail outlets conducted a study on the turnover of these outlets in the
past five years also found out the present scenario and tried to find out whether the
turnover increase decreased or is stable. This will show the growth structure of the
organized retail outlets in Mumbai.
Table 7.18
Annual Turn-over five years ago
Sr.No Amount Response Percent
1 Upto Rs 1 lakh 45 18.8
2 Above 1-2 Lakhs 64 27.7
3 Above 2-5 Lakhs 44 18.3
4 Above 5-10 Lakhs 10 4.2
5 Above 10 Lakhs 9 3.8
Total 240 100
Source: Statistical analysis of Primary data.

366
Graph 7.16
Annual Turn-over five years ago
Table 7.18 and Graph 7.16 show the annual turnover in the last five years out of 240
respondents 45 respondents were of the opinion that their annual turnover is about one
lakh and 64 respondents replied it is between one to two lakhs with 44 responding that
it is between two to five lakhs and 10 were of the opinion that it is between five to ten
lakhs only there were 9 respondents who felt that there turnover is above ten lakhs.
The researcher believes that due to the infancy stage of the retail business in Mumbai
the turnover has been little less but the impact of globalization will gradually make
the difference in the future.
45
64
44
10
9
0 10 20 30 40 50 60 70
Upto Rs 1 lakh
Above 1-2 Lakhs
Above 2-5 Lakhs
Above 5-10 Lakhs
Above 10 Lakhs
Response

367
Table 7.19
Annual Turn-over now
Sr.No Amount Response Percent
1 Upto Rs 1 lakh 28 11.7
2 Above 1-2 Lakhs 43 17.9
3 Above 2-5 Lakhs 68 28.3
4 Above 5-10 Lakhs 21 8.8
5 Above 10 Lakhs 21 8.8
Total 240 100
Source : Statistical analysis of Primary data.
Graph 7.17
Annual Turn-over now
Further the researcher wanted to know the present status of these retailer therefore
Table 7.19 and Graph 7.17 shows the present picture of these retailers it is 28
respondents still feel that there turnover is still upto one lakh and 43 respondents
replied it is still maintaining between one to two lakhs with gradual increase in the
quantity of respondents in this category, 68 responding that it is between two to five
28
43
68
21
21
Response
Upto Rs 1 lakh
Above 1-2 Lakhs
Above 2-5 Lakhs
Above 5-10 Lakhs
Above 10 Lakhs

368
lakh and 21 were of the opinion that it is between five to ten lakhs only there were
further 21 respondents who felt that there turnover is above ten lakhs.
This shows that the organized retail outlets are gradually picking pace in Mumbai.
Therefore the change in economy and the change in consumer behavior has gradually
brought the difference in the annual turnover of the retailers.
To understand this researcher made an attempt to ascertain the annual turnover of the
organized retail outlets in the last five years. Since absolute figures of the annual sales
were not possible to obtain, therefore it is ascertain on the basis of the percentage.
Following table gives a clear scenario of the growth of the organized retail outlets.
Table 7.20
Annual turnover increased or decreased in the last five years
Sr.No
Response Percent
1 Increased 96 40
2 Decreased 88 37.7
3 Remained Same 13 5.4
4 No Reply 43 17.9
Total 240 100
Source : Statistical analysis of Primary data.

369
Graph 7.18
Annual turnover increased or decreased in the last five years
Table 7.20 and Graph 7.18 present picture of the growth of organized retail outlets in
Mumbai. The respondent surveyed 240 respondents to find out whether the annual
turnover in the last five years have increased or decreased or has remained the same
43 respondents decided to remain silent with no response 13 respondents felt that
there turnover has remained the same but the major difference could be seen when 96
respondent said there has been relative increase in the annual turnover and 88
respondents said there has been decrease. This study shows a conclusion that for
many retailers the development of organized outlets has been blessing by giving them
good turnover. Further the decrease can be covered in the future by systematically
handling the consumers
7.8 Testing of Hypotheses
Ho: Males and female opine equally that development of organized retail outlets
have reduced their visits to unorganized sectors.
0
10
20
30
40
50
60
70
80
90
100
Increased Decreased Remained Same
No Reply
9688
13
43
Response

370
H1: More female opine that development of organized retail outlets have
reduced their visits to unorganized sectors.
Mumbai a commercial capital and presence of an equal combination of gender
therefore there is least gender discrimination. The researcher wanted to find out
has the development of organized retail outlets reduced the visit of the
population to unorganized sector, to get a clear idea this result the researcher
wanted in gender wise and therefore framed a hypothesis. For testing this
hypothesis the researcher took parameter on the basis gender which justified the
opinion of women that it is the development of organized retail outlets that has
reduced their visits to unorganized outlets. Chi Square test is used on the various
primary survey and the results have been put up in the tabular form given
below:
Table 7.21
Calculation showing data of response on development of organized outlets
reduced visit to unorganized outlets
Source: Analysed from primary data.
Table 7.22
Chi-Square Test for impact of organized retail outlets on unorganized retail
outlets
Sr.No Response Sex Total
Male Female
1 Yes 237 (64.2%) 261 (73.7%) 498 (68.9%)
2 No 132 (35.8%) 93 (27.3%) 225 (31.1%)
369 (100%) 354 (100%) 723 (100%)
Value df
Asymp. Sig. (2-
sided)
Pearson Chi-Square 7.609(b) 1 .006
Continuity Correction(a) 7.172 1 .007
Source: Statistical analysis of primary data.

371
Chi Square test is applied to calculate the opinion of female who feel that due to
development of malls they totally have inclined to organized retail outlets and their
visit to unorganized outlets have been reduced, the researcher also tried to check the
frequency level of the increase. From Table 7.21 it is concluded that it is 261 (73.7
percent) of female respondent are of the opinion that malls have reduced their visit to
unorganized retail outlets. To this result Chi Square result in Table 7.22 gives an
indication of expected count less than 5 and the Pearson Chi Square result shows the
assume as .006 which is much less than the expected resulted. Thus Null hypothesis
that Males and female opine equally that development of organized retail outlets have
reduced their visits to unorganized sectors stands rejected. We conclude that more
female opine that development of organized retail outlets have reduced their visits to
unorganized sectors. Therefore the hypothesis stands to be authentic and it is proved.
Hypothesis 4
H0: Self employed, service class, Housewives and business class equally feel that
development of malls have created an impact on their budget.
H1: People from business feel that the development of malls has created an
impact on their budget.
Mumbai a city commercially viable and where there is assumption that
development is rapid. People belonging to business class have a belief that there
is an assumption that the development of the malls has created an impact on
their budget. The researcher wanted to find out has the development of
organized retail outlets have created an impact on their budget, to get a clear
idea an analysis is done taking the respondents belonging to various employment
parameters. Chi Square test is used on the various primary survey and the
results have been put up in the tabular form given below:

372
Table 7.23
Impact on the budget of consumers on the basis of Employment status
Source: Analysed from primary data.
Table 7.24
Chi-Square Test calculation on impact on the budget of consumers due to O.R
Value df
Asymp. Sig.
(2-sided)
Pearson Chi-Square 112.607(a) 10 .000
Likelihood Ratio 115.371 10 .000
Source: Statistical analysis of primary data.
Chi Square test is applied to calculate the opinion of people who belong to business
class on the development of malls and an impact on their budgets. From Table 7.23 it
is concluded that it is 36 (57.3%) of respondents belonging to business class feel that
there is an gradual impact on their budget due to the increase in malls in Mumbai. Chi
Square result in Table 7.24 gives an indication of expected count less than 5 and the
P-value shows the asymp as .000 which is much less than the expected count. Thus
Null hypothesis specifies that self employed, service class, housewives and business
class equally feel that development of malls have created an impact on their budget
stands rejected. We conclude that People from business feel that the development of
malls has created an impact on their budget. Therefore the hypothesis stands to be
authentic and it is proved.
S.No Response Employment Status Total
Self
Employed Service Business Retired
Not Employed
Currently
House-
wife
1 Yes,
Higher
spending
28 (45.2%) 162(48.9%) 36(57.3%) 8(15.7%) 95(57.2%) 31(67.4%) 360(49.8%)
2 Yes,
Lower
spending
15 (24.2%) 65(19.6%) 6(9.4%)
1(2.0%) 51(30.2%) 13(28.3%) 151(20.9%)
3 No 19(30.6%) 104(31.4%) 22 (34.4%) 42(82.4%) 23 (13.6%) 2(4.3%)
212
(29.3%)
Total 62 (100%) 331(100%) 64(100%) 51(100%) 169(100%) 46(100%) 723(100%)
373
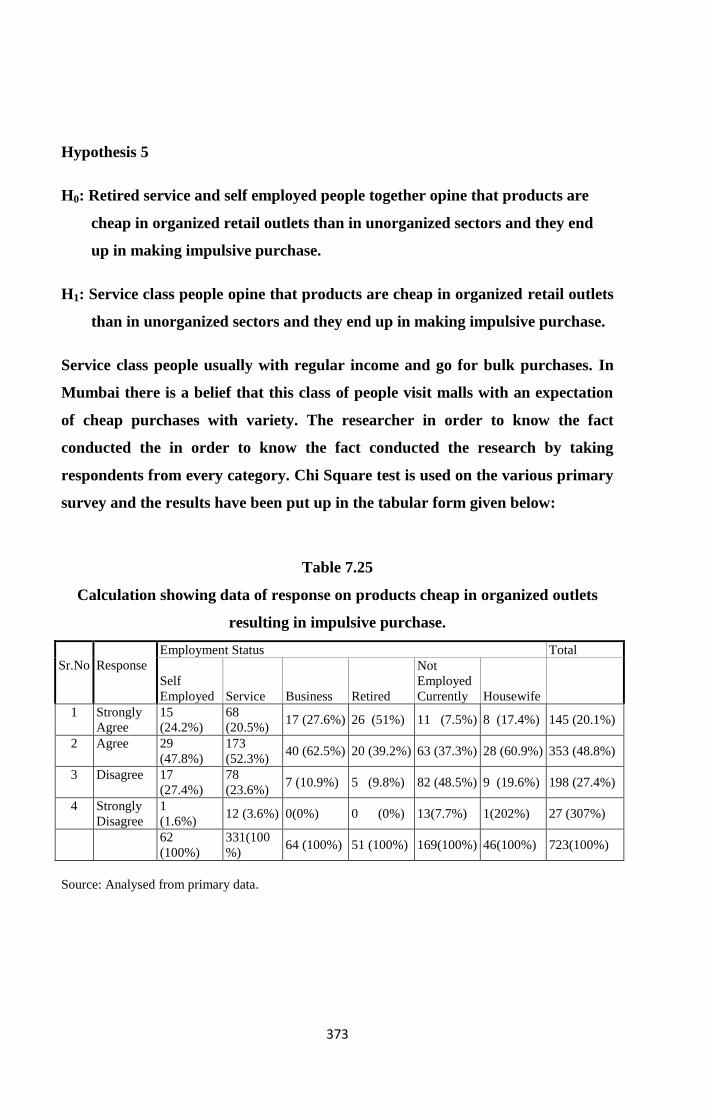
Hypothesis 5
H0: Retired service and self employed people together opine that products are
cheap in organized retail outlets than in unorganized sectors and they end
up in making impulsive purchase.
H1: Service class people opine that products are cheap in organized retail outlets
than in unorganized sectors and they end up in making impulsive purchase.
Service class people usually with regular income and go for bulk purchases. In
Mumbai there is a belief that this class of people visit malls with an expectation
of cheap purchases with variety. The researcher in order to know the fact
conducted the in order to know the fact conducted the research by taking
respondents from every category. Chi Square test is used on the various primary
survey and the results have been put up in the tabular form given below:
Table 7.25
Calculation showing data of response on products cheap in organized outlets
resulting in impulsive purchase.
Sr.No
Response
Employment Status Total
Self
Employed Service Business Retired
Not
Employed
Currently Housewife
1 Strongly
Agree
15
(24.2%)
68
(20.5%) 17 (27.6%) 26 (51%) 11 (7.5%) 8 (17.4%) 145 (20.1%)
2 Agree 29
(47.8%)
173
(52.3%) 40 (62.5%) 20 (39.2%) 63 (37.3%) 28 (60.9%) 353 (48.8%)
3 Disagree 17
(27.4%)
78
(23.6%) 7 (10.9%) 5 (9.8%) 82 (48.5%) 9 (19.6%) 198 (27.4%)
4 Strongly
Disagree
1
(1.6%) 12 (3.6%) 0(0%) 0 (0%) 13(7.7%) 1(202%) 27 (307%)
62
(100%)
331(100
%) 64 (100%) 51 (100%) 169(100%) 46(100%) 723(100%)
Source: Analysed from primary data.

374
Table 7.26
Chi-Square Test calculation on products cheap in organized outlets resulting in
impulsive purchase
Value df Asymp. Sig. (2-sided)
Value when
products are
cheap
Value when make
impulsive purchase df
Asymp. Sig. (2-
sided when
products are
cheap
Asymp.
Sig. (2-
sided)
Pearson Chi-
Square 107.998(a) 111.414(a) 15 .000 .000
Likelihood Ratio 107.892 89.525 15 .000 .000
Source: Statistical analysis of primary data.
Chi Square test is applied to calculate the assumption of why service class people visit
malls the most. From Table 7.25 it is concluded that it is 68 (20.5%) respondents
strongly agreed to this belief and 173 (52.3 %) of respondents agree to this fact .The
service class also feels that they end up in making an impulsive purchase due to the
products being cheap. Chi Square result in Table 7.26 gives an indication of expected
count less than 5 and the Pearson Chi Square result shows the asymp as .000 which is
much less than the expected count, therefore the hypothesis is proved further the
hypothesis also states that due to cheap products the service class people make an
impulsive purchases. Chi Square gives an indication of expected count less than 5 and
the Pearson Chi Square result shows the asymp as .300 which is less than the expected
count. Thus Null hypothesis that retired service and self employed people together
opine that products are cheap in organized retail outlets than in unorganized sectors
and they end up in making impulsive purchase stands rejected. We conclude that
Service class people opine that products are cheap in organized retail outlets than in
unorganized sectors and they end up in making impulsive purchase. Therefore the
hypothesis stands to be authentic and is proved.

375
7.9 Summary of the Study
Shopping in Malls has become the latest trend today. They are very popular among
people of all age groups. The reasons for their popularity are manifold. To begin with,
they sell all kinds of branded goods. People who opt for quality can get good products
here without much effort.
Furthermore, these Malls are not crowded and one can shop here with much comfort.
Shopping in these spacious places is indeed easy. Although they are crowded
sometimes, there is ample space for easy movement which makes shopping fun and a
memorable experience. To illustrate, since they are built in a large area they are very
spacious. In addition, climbing up and down the stairs can be avoided because of the
escalators as well as the lifts. Moreover, the malls not only sell commodities such as
garments, gadgets, cosmetics etc but also sell food items. In addition, there is a food
court on the top floor which sells various types of lip smacking food .These food
joints are obviously very much in demand by the teenagers.
Understanding these reasons the researcher tried to find out the range of popularity of
these malls and asked the respondents to rank the reasons of popularity in the scale of
1-5. The results are put up in tabular form given below.
376
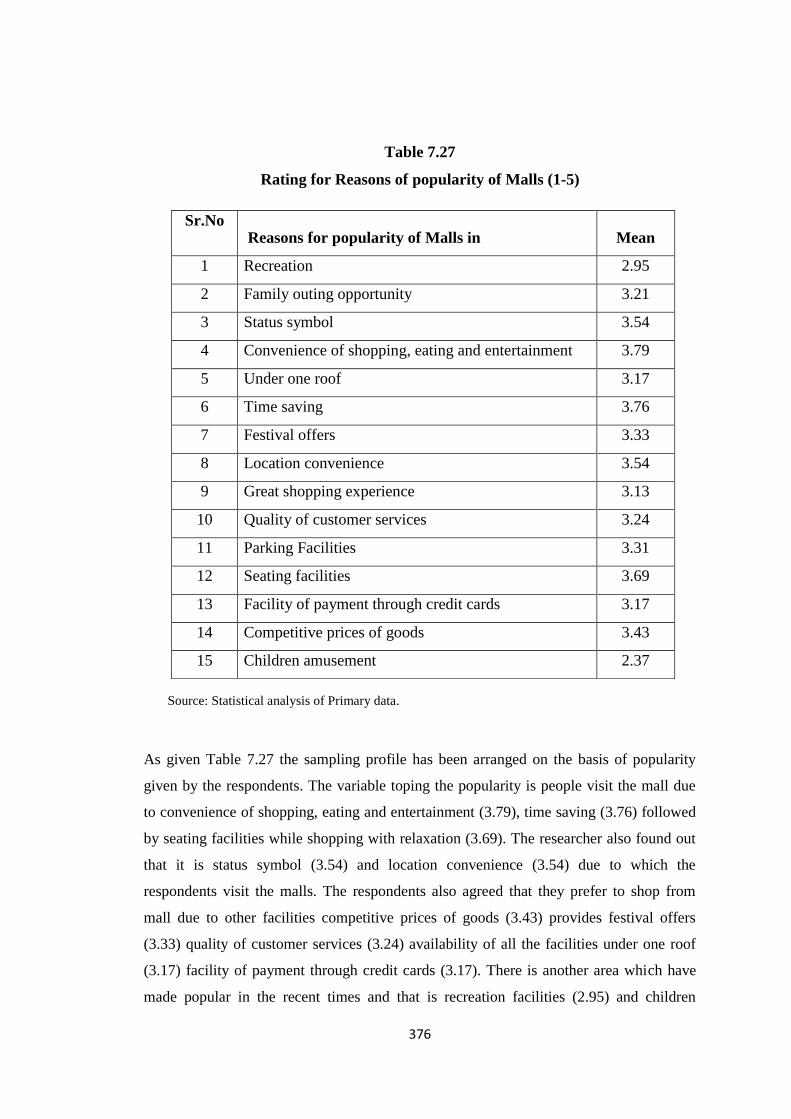
Table 7.27
Rating for Reasons of popularity of Malls (1-5)
Source: Statistical analysis of Primary data.
As given Table 7.27 the sampling profile has been arranged on the basis of popularity
given by the respondents. The variable toping the popularity is people visit the mall due
to convenience of shopping, eating and entertainment (3.79), time saving (3.76) followed
by seating facilities while shopping with relaxation (3.69). The researcher also found out
that it is status symbol (3.54) and location convenience (3.54) due to which the
respondents visit the malls. The respondents also agreed that they prefer to shop from
mall due to other facilities competitive prices of goods (3.43) provides festival offers
(3.33) quality of customer services (3.24) availability of all the facilities under one roof
(3.17) facility of payment through credit cards (3.17). There is another area which have
made popular in the recent times and that is recreation facilities (2.95) and children
Sr.No Reasons for popularity of Malls in Mean
1 Recreation 2.95
2 Family outing opportunity 3.21
3 Status symbol 3.54
4 Convenience of shopping, eating and entertainment 3.79
5 Under one roof 3.17
6 Time saving 3.76
7 Festival offers 3.33
8 Location convenience 3.54
9 Great shopping experience 3.13
10 Quality of customer services 3.24
11 Parking Facilities 3.31
12 Seating facilities 3.69
13 Facility of payment through credit cards 3.17
14 Competitive prices of goods 3.43
15 Children amusement 2.37

377
amusement (2.37). Due to the vast facilities people are diverting towards Shopping
Malls for the purpose of shopping of various products. One can shop for hours in air-
conditioned premises. Shopping Malls are getting more and more popularity mainly
among teenage youth. The researcher concluded that the modern generation slowly is
drifting towards malls due to time constrains.
The survey also throws light on the fact that shoppers do not shop exclusively at the
organized or the unorganized outlets. They shop at both outlets and the share of spending
varies from product to product. Even those who were interviewed at organized outlets,
declared that 43-46 per cent of their spending on vegetables, fruit, non-staple food items,
cooking oil and other packaged food items was from unorganized outlets. Table 7.28 and
Table 7.29 which clearly shows the ranking of organized and unorganized retail outlets
with the help of mean deviations.
On the whole, the sample shoppers at organized outlets make their spending on food and
grocery, and textiles and clothing at unorganized outlets. Similarly, consumers
interviewed at unorganized outlets also spend at organized outlets. The researcher
absorbed that on an average, the respondents spend their monthly shopping e at organized
outlets. The table below mentions the popularity of both the organized and unorganized
retail outlets on the basis of scales given.
To understand this researcher asked the respondents to rank the facilities provided by
both organized and unorganized retail outlets on 1-8 popularity scale. Further the results
collected are converted on mean deviations and presented in the Table 7.26 (ranking of
organized retail outlets) and 7.27 (Ranking of unorganized retail outlets).

378
Table 7.28
Ranks for Organized Retail Outlets
Sr.No. Particulars Mean
1 Display 5.62
2 Availability of all Brands 7.16
3 Status 5.95
4 Promotional Schemes 5.48
5 Financial Schemes 5.20
6 Sales person's interaction 5.56
7 Home Delivery 5.15
8 After sales services 5.60
Source: Statistical analysis of Primary data.
Table 7.28 shows the result of the popularity of organized retail outlets with the
consumers in Mumbai. It is basically the availability of all brands (7.16) due to which
the consumers visit organized retail outlets more. The organized retail outlets posses
the status (5.95) symbol a lot the consumer, are pulled towards them due to the
presentability of these outlets. Further it is the window display (5.62) which attract,
the consumers more to the outlets giving them the feel of touch and see. The
drawback of these outlets being lack of financial schemes (5.20) and home delivery
(5.15) due to which the unorganized outlets are popular in India and Mumbai.

379
Table 7.29
Rank for Un-Organized Retail Outlets
Sr.No. Particulars Mean
1 Proximity/Convenience 5.46
2 Trusted Brands 5.73
3 Trust worthiness of owner 5.58
4 Home delivery of all Products 4.39
5 Promotions 4.74
6 Availability of Financial Services 5.15
7 Hospitality provided by the owner 4.56
Source : Statistical analysis of Primary data.
Table 7.29 shows the result of the popularity of unorganized retail outlets with the
consumers in Mumbai. It is basically the trusted (5.73) due to which the consumers
visit unorganized retail outlets even today, Indian consumers make purchases only
after having confidence on the sellers because of their emotional attachment therefore
in spite of organized outlets moving fast in Mumbai still unorganized outlets are
popular due to trust worthiness on the owner (5.58). The consumers till date are
inclined towards the unorganized outlets due to the fact of proximity/convenience
(5.46), availability of financial service (5.15), home delivery (4.39) and most
importantly it is hospitality provided by the owner (4.56).
The results analyzed by the researcher clearly show an indication that it is both the
sectors that are equally surviving in Mumbai market with both sectors having their
own different place in the minds of the consumers.
7.10 Conclusion
The researcher made a sincere attempt to collect and analyze the data of retail outlets
in Mumbai and finally interpreted the same to arrive at the conclusion. The researcher
came to the conclusion that slowly and steadily organized retail outlets are capturing
the city but still there is an impact of unorganized outlets.

380
Furthermore the researcher was of the neutral view which rests on the possibility of
the co-existence of the organized and unorganized retailers in the country. Such co-
existence is justified largely by different combinations of benefits and conveniences
offered by each sector to its customers. While organized retail outlets offer
merchandise at cheaper prices and provide a convenient shopping environment,
unorganized retailers provide great convenience in the form of cash credit on goods
and home-delivery services. To justify this the researcher reviewed the report of AC
Nielsen presented in 2007, which focused on the buying behaviors of consumers from
organized and unorganized retail outlets, found that while penetration of grocery
retailing had occurred much more rapidly in processed, dry, and packaged foods,
household products and personal care items, for which supermarkets gain a cost
advantage due to economies of scale resulting from centralized procurement and
distribution, shoppers still mainly used wet markets and small vegetable stalls, where
they got low prices, credit, and personal service, for more frequent purchases of fresh
produce . Similarly, such different retail preferences for distinct categories of goods
should enable both modern and traditional retail stores in India to thrive. It is
estimated that even though the market share of organized retail will grow, the share of
unorganized retail will also increase having a corresponding growth in the overall
retail sector.