Embed Size (px)
Citation preview

Západočeská univerzita v Plzni
Fakulta filozofická
Bakalářská práce
ANALYTICAL REPORTS: THEIR EVOLVING
PREVALENCE IN TODAY´S BUSINESS ENVIRONMENT
Petra Pěchovová
Plzeň 2012
Západočeská univerzita v Plzni
Fakulta filozofická
Katedra anglického jazyka a literatury
Studijní program Filologie
Studijní obor Cizí jazyky pro komerční praxi
angličtina – francouzština
Bakalářská práce
ANALYTICAL REPORTS: THEIR EVOLVING
PREVALENCE IN TODAY´S BUSINESS ENVIRONMENT
Petra Pěchovová
Vedoucí práce: Alok Kumar M.B.A.
Katedra anglického jazyka a literatury
Fakulta filozofická Západočeské univerzity v Plzni
Plzeň 2012

Prohlašuji, že jsem práci zpracoval(a) samostatně a použil(a) jen
uvedených pramenů a literatury.
Plzeň, duben 2012 .........................................................
TABLE OF CONTENTS 1 INTRODUCTION .................................................................................................... 1
2 ANALYTICAL REPORTS ....................................................................................... 3
2.1 Report essentials, functions and types ....................................................... 3
2.1.1 Functions of Business Reports ........................................................................ 3
2.1.2 Classifications of Business Reports ................................................................ 4
2.1.3 Types of Business Reports............................................................................... 5
2.1.4 Difference between Informational and Analytical Reports ........................... 8
2.2 Analytical reports in business ...................................................................... 9
2.2.1 Justification/Recommendation reports ............................................................ 9
2.2.2 Feasibility reports ............................................................................................. 10
2.2.3 Yardstick reports .............................................................................................. 10
2.2.4 Selecting an Analytical Report Topic ............................................................ 10
2.2.5 Limiting an Analytical Report Topic ............................................................... 12
2.2.6 Writing an Analytical Report ........................................................................... 12
2.3 Writing style ................................................................................................. 17
2.3.1 The Basics of Business Writing ..................................................................... 17
2.3.2 The Writing Process ........................................................................................ 17
2.3.3 Types of Languages ........................................................................................ 18
2.3.4 Writing in Teams .............................................................................................. 18
3 BUSINESS ENVIRONMENT ................................................................................ 19
3.1 External Environment .................................................................................. 19
3.2 Internal Environment ................................................................................... 21
3.3 Organizational Strategies ........................................................................... 22
3.3.1 Indirect Strategy ............................................................................................... 22
3.3.2 Direct Strategy.................................................................................................. 23
4 ANALYTICAL REPORTS: THEIR EVOLVING PREVALENCE IN TODAY’S
BUSINESS ENVIRONMENT ....................................................................................... 24
4.1 Analytical Reports Used ............................................................................. 24
4.2 Which Tenses are used in the Reports ...................................................... 25
4.3 Phrasal Verbs and Idiomatic Expressions ................................................. 27
4.4 Active and Passive Voice ............................................................................ 28
4.5 The Grammatical Person ............................................................................ 29

4.6 Abbreviations and Acronyms ..................................................................... 30
4.7 Visual Aids ................................................................................................... 30
4.8 Questionnaire .............................................................................................. 32
5 CONCLUSION ...................................................................................................... 34
6 ENDNOTES .......................................................................................................... 36
7 BIBLIOGRAPHY .................................................................................................. 38
8 ABSTRACT .......................................................................................................... 39
9 RESUMÉ .............................................................................................................. 40
10 APPENDICES ...................................................................................................... 41

1
1 INTRODUCTION
As the title suggests, this Bachelor thesis deals with business
correspondence. However, the topic of business correspondence is very
wide, and hence this thesis deals with business reports, especially
analytical reports and their evolving prevalence in today’s business
environment.
The first part of my thesis is the theoretical part and it is divided into two
main chapters. The second part is the practical part and there will be
analysed three analytical reports.
In the theoretical part is covered all essential information concerning the
business reports, especially analytical reports. In the first chapter of the
theoretical part are described: essentials, functions and types of business
reports; differences between informational and analytical reports; features
of three main types of analytical reports; how to select the topic of
analytical reports; which parts should standard analytical report contain
and which writing style should the author of analytical report use. In the
second chapter is defined the business environment (internal and
external environment) and organizational strategies (direct and indirect
strategy). The purpose of this part is to gather all needful information
concerning analytical reports and it may help some beginners with
planning and writing analytical report.
In the practical part I will be analysing three given analytical reports.
These reports were provided to me by the consulting company PWC. In
analyses of reports I will be focusing on evaluation of the style, language
and lexis. Reports will be analysed from six points: which tenses are used
in the reports, phrasal verbs and idiomatic expressions, active and
passive voice, the grammatical person, abbreviations and acronyms,
visual aids. This part also contains summary of the answers from
questionnaire which can be found in the appendices. These questions
were answered by a representative of the company PWC. Analysed
reports can be found in the appendices of this thesis, but certain parts of
these reports are not included because of their length, and also for the
printed version I reduced the number of pages by putting 6 pages of the
report on 1 page of the thesis. The version which is not reduced can be
found in the electronic form in attached CD.
The reason why I chose this topic is fact that I found it very interesting
and current and it may be useful for my future career.

2
I gathered the information from English literature, mostly from: KUIPER,
Shirley. Contemporary Business Report Writing and GUFFEY, Mary Ellen
and LOEWY, Dana. Essentials of Business Communication.
The aim of this thesis is to find out whether analytical reports are
prevalent in today´s business environment.

3
THEORETICAL PART
2 ANALYTICAL REPORTS
Any business and professional communicator has already met with
reports because reports are a fact of life in business today. Business
reports are about analyzing the problems, gathering and studying the
facts, and then assessing the alternatives. There are different ways how
to submit business report: in writing, orally or digitally. Recently is very
popular to present the reports in a PowerPoint accompanied by a written
report. Business reports are very difficult to define because of their
diversity. They range from informal one-page reports to formal 250-page
reports. Some reports only give information while others also analyze and
make recommendations. They differ in many ways but they have one
thing in common: to answer questions and solve problems.
2.1 Report essentials, functions and types
2.1.1 Functions of Business Reports
Business reports have various functions. They must be planned and
presented with the regard of the receiver’s needs and the sender’s
objectives at the same time. Effective report writer is trying to achieve
desired action-it means what the sender wants the receiver to do. But to
accomplish that action, the sender must take information needs (data that
allow the receiver to understand and fulfil the sender’s desires) and ego
needs (person’s desire for recognition of his/her worth to the organization)
of the receiver into consideration.
There are two basic structures for most messages-the indirect and the
direct structure. Indirect structure moves from specific examples or facts
to generalized conclusions. It is used for complex or controversial
information. Direct structure moves from generalizations to specific
examples or facts to support them. It is used in case when the receiver is
likely to agree with the main thought of the message. It is also effective
with receivers who want to know the main thought immediately and it
does not matter if they agree or disagree with it.
Because reports are used in the decision-making process, the reader
must be able to believe the information which is contained in a report.
“Deliberately excluding information that may be unpleasant to the writer or
the receiver violates the objectivity criterion, which requires that all
available, relevant data be presented.” [1]

4
Report data may have many sources. Report can also contain the
observations of the writer. Personal observations or experiences may be
presented in addition to impersonal facts, but all information must be
presented objectively. Some reports provide information necessary for
making decisions; others impart information about decisions that have
been made and must be implemented. Reports are used in every kind of
job, because people at all levels of an organization have to carry out
decisions. Reports hold many functions in the organization, but the
primary function is to enhance the decision-making process and the
quality of actions based on those decisions.
2.1.2 Classifications of Business Reports
Reports take many forms. They are not standardized messages. Report
classifications can help with the decisions what type of report to choose
that will best achieve the reporting objective. There are six ways, in which
reports can be classified: by function, frequency, subject matter, level of
formality, reader-writer relationship and communication medium.
Function
There is two major functions of the reports: to inform or to analyze. More
details about this subject are in chapter 2.1.3.
Frequency
That means how often the reports are transmitted. Periodic reports are
transmitted at stated times (daily, weekly, monthly, quarterly or annually).
Another type of periodic report is a progress or status report. It is used to
inform decision makers about the status of an ongoing project. In
contrast, special reports refer to an one-time or an infrequent event.
Subject matter
Some organizations classify reports by areas which correspond to
functional divisions of the organization, such as accounting, production,
finance or engineering.
Level of formality
Level of formality can be identified by tone and structure. In some
contexts are expected formal tone and structure. Other contexts justify
informality. In formal report is typically used impersonal language, and is
followed a prescribed format. Formal reports are often presented in
manuscript form. Informal reports have more personal tone than formal

5
reports. There are used first-person and second-person pronouns and
near-conversational language. Many informal reports are presented
orally.
Reader – Writer relationship
It refers to the relationships that those parties have to one another. If the
report passes between writer and reader in the same organization, then it
is an internal report. It can be also management report, staff report or
committee report. If the report moves across organizational boundaries,
then it is an external report. For example audit report presented by an
independent accounting firm to a client is an external report.
Communication medium
Reports can be classified by the dominant communication tool or
medium. According to this classification reports are called written or oral,
narrative or statistical, illustrated or unillustrated. Multimedia reports use
combinations of communication tools. [2]
These classifications of reports demonstrate that reports are presented in
many forms.
2.1.3 Types of Business Reports
There are two bases of classifying the reports – according to function and
according to formality. According to functions, the reports may be divided
into three parts: Informational reports (this is further divided into five parts:
Periodic reports, Situational reports, Investigative reports, Compliance
reports, Progress reports), Analytical reports (this is further divided into
three parts: Justification/Recommendation reports, Feasibility reports,
Yardstick reports), Research reports. According to formality, the reports
may be divided into two parts: Statutory reports, Non statutory or
voluntary reports (this may further be divided into two parts again:
Routine reports, Non-routine reports).
Informational reports
Informational reports present facts about certain given activity in detail
without any note or suggestions. They give the needed insight to evaluate
a firm’s operations, profitability and stability. Informational reports are also
used to evaluate the experience of the business, and business
background of principals. They include valuable information that can help
make better business decisions. Informational reports are packed with
6
information, analysis, and interpretations to enhance decision-making
process. They include payment records, financial information, banking
commentary, and a description of the firm’s operation. [3]
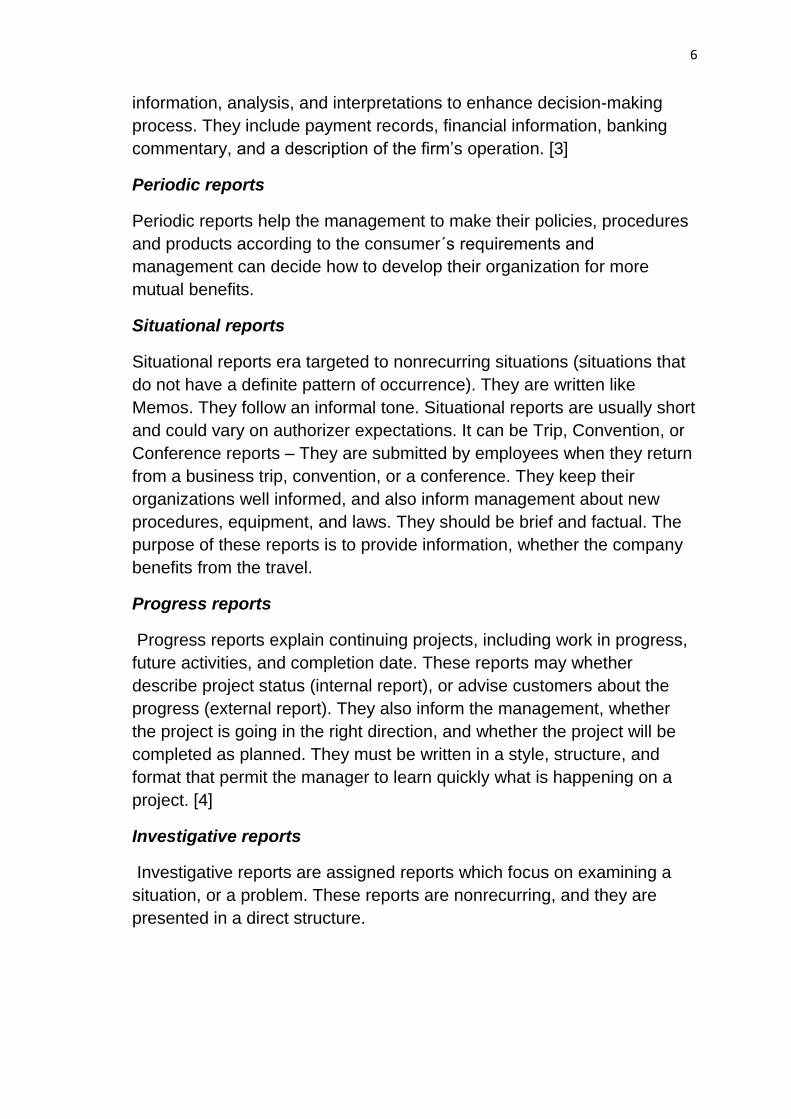
Periodic reports
Periodic reports help the management to make their policies, procedures
and products according to the consumer´s requirements and
management can decide how to develop their organization for more
mutual benefits.
Situational reports
Situational reports era targeted to nonrecurring situations (situations that
do not have a definite pattern of occurrence). They are written like
Memos. They follow an informal tone. Situational reports are usually short
and could vary on authorizer expectations. It can be Trip, Convention, or
Conference reports – They are submitted by employees when they return
from a business trip, convention, or a conference. They keep their
organizations well informed, and also inform management about new
procedures, equipment, and laws. They should be brief and factual. The
purpose of these reports is to provide information, whether the company
benefits from the travel.
Progress reports
Progress reports explain continuing projects, including work in progress,
future activities, and completion date. These reports may whether
describe project status (internal report), or advise customers about the
progress (external report). They also inform the management, whether
the project is going in the right direction, and whether the project will be
completed as planned. They must be written in a style, structure, and
format that permit the manager to learn quickly what is happening on a
project. [4]
Investigative reports
Investigative reports are assigned reports which focus on examining a
situation, or a problem. These reports are nonrecurring, and they are
presented in a direct structure.

7
Compliance reports
Compliance reports present data in compliance with local, state, and
federal laws. Government regulating agencies require submission of
these reports.
Analytical reports
More about Analytical reports in chapter 2.2.
Research reports
Research reports are based on some research work, which is done by an
individual, or a group of individuals on a given problem. They follow
indirect structure. Research reports start with problem discussion. Then
they explore possible solutions and give reason for selecting a particular
solution. There are two types of sources: Primary sources and Secondary
sources (more about primary and secondary sources in 2.2.4).
Statutory reports
Statutory reports are presented according to the requirements of a
particular law. They are usually prepared in the prescribed form.
Non statutory reports
Non statutory reports are reports of directors on some special issues, for
example, committee reports. They are not mandatory, but if there is an
important issue to be discussed at the meeting they are required to be
presented either by directors, or auditors.
Routine reports
Routine reports are required to be submitted periodically. They are
generally brief and only give the facts, for example, what is happening in
the organization, what is its progress, what measures have been taking in
solving problems, etc. For example, weekly production report is a routine
report. There are usually no comments, or explanations.
Non-routine reports
Non-routine reports are required to be prepared on matters of special
nature. Examples of non-routine reports are interview reports, exception
reports and staff reports.

8
Interview reports
Interview reports are not regular, but occasionally anyone can be
assigned to a special project that requires interview people to obtain
some information. Then is expected the summarization of the obtained
information in a report. There should also be mentioned the information
about when, where, and how the interviews were conducted, and also
relevant comments about the experience.
Exception reports
Exception reports bring information about differences from the normal
operations of the organization. They may present facts only about the
deviation, or they may include additional information. In these reports
should be used techniques, which simplify, and clarify the message.
Staff reports
Staff reports usually analyze a problem about which the manager must
take action. They may be prepared in any suitable format. Managers
assign these reports to their staff because they are too busy, and that is
why the staff reports should help quickly extract the essential information.
2.1.4 Difference between Informational and Analytical Reports
Informational reports present data without analysis or recommendations.
The writers collect and organize facts, but they are not expected to
analyze it for readers. These reports require routine operations,
observance of regulations, and company policies. Some informational
policies are highly standardized, such as police reports, or monthly sales
reports. Other informational reports are more personalized.
Analytical reports provide data, analyses and conclusions. Analytical
business reports offer information which is connected with a specific
company. Information is often presented in the form of graphs, or
statistics. Analytical reports are written for different purposes. It depends
on who needs the data. Analytical reports call on to answer questions, to
ask which product is the best, or is an idea good etc. They call for
research, interpretation, and recommendation. Good analytical reports
require critical thinking and the clear communication of ideas. Analytical
reports provide not only objective answers, but also provide company
executives with a view of any potential problem, or areas that need
attention. Although it may not have been the purpose, analytical reports
may reveal any patterns. Company executives may use analytical reports

9
to plan ahead. In view of the fact, that analytical reports provide answers
in term of trouble areas, executives can make changes to the products, or
budget, in order to get a more successful financial period in the upcoming
year. In spite of the fact, that future planning may not be the purpose, the
data can help plan for a more prosperous financial period. Analytical
reports may address two, or more analytical problems. They present the
findings of the writer’s research using quantitative, not qualitative
methods.
2.2 Analytical reports in business
2.2.1 Justification/Recommendation reports
Purpose of Justification/Recommendation reports is to make
recommendations to management, and to provide data to solve problems
and make decisions. In these reports can be used both, indirect or direct
structures. However, there are some steps to follow in decision-making of
which structure to use. If the subject is insensitive, and the readers are
perspicacious it is recommended to use a direct structure (for example
justifying a purchase). Otherwise, if the readers are sceptical, and the
subject is sensitive it is recommended to use an indirect structure (for
example justifying ways for employees to quit smoking). These reports
can be used on various topics, such as changing a procedure, hiring an
employee, consolidating departments, investing funds, or buying
equipment. If the author decides to use the direct structure, here are
some steps to follow. Firstly, there must be brief identification of the
problem. Secondly, author must write recommendation, solution, or
action, and explain the benefits of the recommendation, or what steps
should client take to solve the problem. He must also include the
discussion of pros, cons, and costs. In the final part must be
summarization which specifies recommendation, and action which is
necessary to be taken. On the other hand, if the author decides to use the
indirect structure, here are different steps to follow. In the subject line, the
author must make general reference to the problem. Secondly, the author
must describe the problem by the usage of some specific examples,
statistics, and authoritative quotes to show that the problem is serious.
Next there must be the discussion of alternative solutions, and the writer
should begin with the one which has minimal chances to succeed, and
terminate with the one which is the most promising. In the next part must
be emphasized that in recommendation the advantages overweigh
disadvantages. In the final part is summarization of the recommendation
and writer may ask for authorization to proceed. [5]

10
2.2.2 Feasibility reports
Purpose of feasibility reports is to analyze problems, and predict, whether
alternatives will be practical, or advisable. They also help in decision-
making process. The role of the writer is to present the decision
immediately because the person requesting the report is interested
especially in the recommendation. These reports are used, for example,
before large capital investment, a new product, or service, or a new plant
location. They answer these questions: What is the best location for the
company? Should the company rent, lease, or buy? Should the company
move to another part of the country? In writing feasibility reports there are
some steps to follow. Firstly, there must be an announcement of the
writer’s decision. Secondly, the writer has to give a description of the
background and the problem. Short discussion of the benefits of the
proposal and description of any problems that may result must be written
after this. In the final part, author must mention how much time will client
need to implement the proposal, and he may also calculate the costs. [6]
2.2.3 Yardstick reports
The term "Yardstick" is used in reference to anything which serves as a
test, or standard of measurement, comparison, or judgement. These
reports deal with problems with two, or more solutions. They measure
each of the solutions, and then make a final judgement according to
which solution would work the best. Yardstick reports can be used, for
example, to comparison of different manufacturers for buying a piece of
equipment. There are some steps to follow during the writing yardstick
reports. The beginning must contain the description of the problem.
Secondly, there must be explained possible solutions and alternatives.
Next step includes establishing criteria for comparison and their
discussion. In the final phase, the author draws conclusions and makes
recommendations. [7]
2.2.4 Selecting an Analytical Report Topic
The authors of analytical reports have several options when selecting a
topic. The most important choice is to select data sources. The validity
and reliability of the data used in report is one of the most important
things to make a good report. The quality of the data is basic element of
the quality of the report. Therefore, the author of report must be very good
at selecting appropriate data sources and must use them precisely. There
are two types of data: Primary Data and Secondary Data.

11
Primary data
Primary data are data which are obtained through original experiments,
interviews, observations, questionnaire surveys, and company records.
Primary source is a researcher’s direct report of his or her primary
research and experimentation. It contains measurable data and a detailed
discussion of methodology. There are both, active or passive methods to
obtain information from these sources. When the author of report just
makes observations of the people, or actions that are essential for the
report, and does not actively communicate with those subjects, this is
called Passive data collection. It includes search of company records,
observations, and some experimentation. On the other hand, there is
Active data collection. The author of report actively communicates with
the subjects. It includes questioning the subjects. Sometimes the only
way to get necessary information is through questioning. The writer must
decide, whether to choose active, or passive method according to ability
to obtain precise data and satisfy other important criteria.
Secondary data
Secondary data are data that have already appeared in books,
magazines, journals, and other published documents. They can also be
found on online services and CD-ROMs. Secondary source is a
summarization, or commentary of another researcher’s primary research.
It may contain some data from the original source, but it does not contain
all the data and conclusions of the original source. Secondary data can
help determine what must be examined. They may contain sufficient data
for solving problem without collecting primary data. The thing is, that in
some secondary sources writer may find more valid data than in primary
sources.
If the report writer wants to be effective in solving business problems, he
will use both, primary and secondary source. Some researchers think that
the primary data are better than secondary data, because information
straight from the source is better than secondary data. Others do not like
to sit in a library, search through documents. On the other hand, some
researchers think that primary data are not accurate. According to them
people can misrepresent self-reported information and other researcher
can make wrong observations. None of these attitudes can produce
consistently effective reports. When a problem and need for research are
recognized the writer should first look into secondary sources, because
they have information that can more clearly identify the problem, and

12
parts which the writer should investigate. If the problem is unique, the
writer probably has to use primary data, because it may be the only
information. But if there is some sufficient secondary data available, the
writer should use them instead of spending lot of time and effort on
correct and effective usage of primary data. [8]
2.2.5 Limiting an Analytical Report Topic
Some writers of analytical reports struggle to sufficiently narrow and limit
their topic when they are confronted with the task of writing an analytical
report. They may have topic in their mind, but they may be not sure how
to approach to it. Generally, the writer can limit the topic by date, locality,
category, or discipline/profession.
DATE
When the writer is limiting the topic by date he has to choose the time
frame in which he will be examining his topic. For example, the writer
decides to evaluate the death rate on tobacco products from 2000-2008.
LOCALITY
When the writer is limiting the topic by locality he has to choose specific
place in which he will be examining his topic. For example, the writer
wishes to investigate why New York has 200% higher death rate on
tobacco products than the national average.
CATEGORY
When the writer is limiting the topic by category he has to narrow the
scope of inquiry to one specific type, or aspect of the larger topic. For
example, the writer decides to explore the effectiveness of electronic
cigarettes to help people stop smoking.
DISCIPLINE/PROFESSION
When the writer is limiting the topic to a discipline, or profession he
examines how is the topic interacted with specific discipline, or profession
views. For example, the writer decides to examine why nurses of
maternity ward smoke more cigarettes than nurses of isolation ward.
2.2.6 Writing an Analytical Report
When the author has chosen the topic of analytical report, and has
selected appropriate data sources he can begin to write the analytical
report itself. Since the analytical reports are ranked among the formal
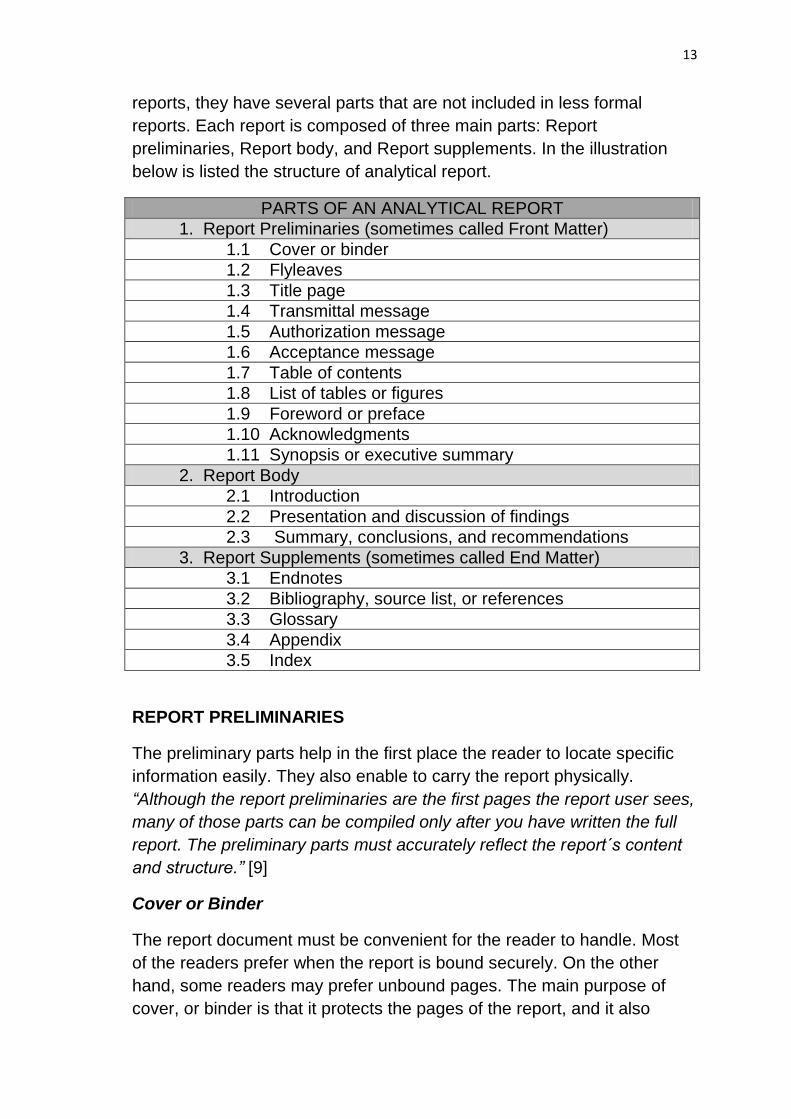
13
reports, they have several parts that are not included in less formal
reports. Each report is composed of three main parts: Report
preliminaries, Report body, and Report supplements. In the illustration
below is listed the structure of analytical report.
PARTS OF AN ANALYTICAL REPORT
1. Report Preliminaries (sometimes called Front Matter)
1.1 Cover or binder
1.2 Flyleaves
1.3 Title page
1.4 Transmittal message
1.5 Authorization message
1.6 Acceptance message
1.7 Table of contents
1.8 List of tables or figures
1.9 Foreword or preface
1.10 Acknowledgments
1.11 Synopsis or executive summary
2. Report Body
2.1 Introduction
2.2 Presentation and discussion of findings
2.3 Summary, conclusions, and recommendations
3. Report Supplements (sometimes called End Matter)
3.1 Endnotes
3.2 Bibliography, source list, or references
3.3 Glossary
3.4 Appendix
3.5 Index
REPORT PRELIMINARIES
The preliminary parts help in the first place the reader to locate specific
information easily. They also enable to carry the report physically.
“Although the report preliminaries are the first pages the report user sees,
many of those parts can be compiled only after you have written the full
report. The preliminary parts must accurately reflect the report´s content
and structure.” [9]
Cover or Binder
The report document must be convenient for the reader to handle. Most
of the readers prefer when the report is bound securely. On the other
hand, some readers may prefer unbound pages. The main purpose of
cover, or binder is that it protects the pages of the report, and it also

14
forestalls from loosening. On the report cover should be shown at least
the title of the report. If the writer wants to suggest the content of the
report, then can be included design, or illustration.
Flyleaves
Flyleaves are blank sheets which may be placed, either at the front of the
report, either at the back of the report. Their purpose is to protect other
pages, and to provide some space if the reader wants to leave
comments. These sheets are not obligatory. They are used in high level
of formality. For example, flyleaves can be found in most hard cover
books, but not so many in soft cover books.
Title page
On the title page can usually be found four facts: the full title of the report,
the identity of the person demanding the report (it includes full name and
address), the identity of the author (it includes full name, address and
telephone number or e-mail address), and the date of submission.
“ Although inclusion of the author’s identity is optional, it may be
advantageous to include such information on all reports unless you are
instructed not to do so. Such information will help readers provide
feedback, such as questions, commendations, or requests for new
projects.” [10] On the title page is no page number.
Transmittal message
The transmittal message presents the report to primary reader(s). Some
authors prefer to present transmittal message as a separate message
which accompanies the report, but most of the writers bind this message
within the report, and it is bound before, or after the title page.
Authorization and Acceptance messages
The authorization message gives evidence that the author got the
permission to undertake the project. The acceptance message affirms
that the task was agreed on.
Contents
The table of contents appears usually if the report is long. It helps the
reader to get a summary of the report and the reader can easily find
specific parts of the report. In the table of contents must be listed all items
which will follow the table of contents. The number of pages must be also

15
identified. If the report includes visual aids, the author will also write a list
of table or figures.
Preface
In the preface should be mentioned some special details about the report.
The author should be mentioning what encourages him to do the project,
and how significant is the project. If, however, that information is already
expressed in some part before the preface, the author can omit the
preface.
Acknowledgments
Acknowledgments page serves as opportunity to thank to people who
have assisted with the project. Acknowledgments are often written in the
first person.
Executive summary
It is also called synopsis. “In this summary, briefly state the research
problem, purpose, research methods, major findings, conclusions, and
recommendations. The summary must contain enough information to help
a reader decide how much of the full report he or she should read.” [11]
Many readers prefer if the executive summary is written in the direct
structure, although the rest of the report may be written in the indirect
structure. That means that the executive summary begins with author’s
recommendations. The length of executive summary is usually no longer
than one page and the way how to accomplish this reduction is that the
author reduces each important section into one paragraph. However, the
length of executive summary can be longer than one page. It depends
how long and complex is the analytical report.
REPORT BODY
Report body must contain all details and information of the study. When
the body of an analytical report is written in the indirect structure, it begins
immediately after the executive summary and it contains these parts:
introduction, complete presentation, discussion, summary of findings,
conclusions and recommendations.
Introduction
In the introduction part should be all necessary information to understand
the rest of the report. If the report is written in the indirect structure, the

16
introduction contains background of the problem, statement of the
research problem, scope of analysis, and the research methods.
Findings
Findings is the major part of the report. It contains presentation and
discussion of findings. In this part the author must present all data and
their complete and clear analysis. The author should also specify in the
first paragraph how this part will be organized.
Summary
Analytical reports should always contain summary of the findings. The
author may also make summary of findings at the end of each major part,
if the report is complex and lengthy. The summary can be separate, or
can be incorporated in the part with conclusions and recommendations.
Conclusions and Recommendations
Conclusions and recommendations create the final parts of the reports
which are written in the indirect structure. On the other hand, if the reports
are written in the direct structure, the conclusions and recommendations
may be presented at the beginning of the report. “Conclusions must be
logical inferences supported by the data analysis. Recommendations
propose actions that are justified by the analysis and conclusions;
recommendations may also suggest other research that should be
undertaken.” [12]
REPORT SUPPLEMENTS
In the report supplements can be found any information which is not
essential for understanding the report body, but it may be useful. Among
report supplements can be incorporated these parts: endnotes,
bibliography or source list, glossary, appendix, and index.
Source list
If the author decides not to use footnotes he must add at the end of the
report source list. In this list must be mentioned all the sources that
contributed data for the study.
Glossary
Glossary is a list of chosen words and their meanings. Glossary is
required only when the text of the report contains some terms or

17
expressions that may be unfamiliar to the readers. Author may also use
the glossary when among readers are some persons who know the
terms, and some who do not.
Appendix
In the appendix can be found all items which refer to the report body, but
they are not displayed in it. It can be various materials, such as copies of
interview guides and questionnaire, tabulations of data, statistical
formulas, graphs, charts, and diagrams. However, some of these
materials can be incorporated into the report narrative.
Index
“An index is a list of key words or topics found in the report. Generally, an
index is included only if the reader would not be able to locate specific
information without that aid. In most situations, a comprehensive table of
contents along with clear, concise division headings should be sufficient
to direct the reader to specific topics.” [13]
2.3 Writing style
2.3.1 The Basics of Business Writing
Business writing is different from other writings, the business writers have
different goals than other writers. Business writing should be purposeful
(solve problems and convey information), persuasive (persuade readers
to believe and accept the message), economical (present ideas clearly
but concisely), and audience oriented (concentrate on looking at a
problem from objective site). Many college graduates entering industry
think that in writing quantity enhances quality. But it is not true, longer is
not better. “Conciseness and clarity are what counts in business.” [14]
Not many people can compose a terrific report without training. However,
practicing and following a systematic process can make almost everyone
a good writer.
2.3.2 The Writing Process
The process is easier if the writer follows a systematic plan. The writing
process has three parts: prewriting, writing, and revising. However, the
process is not always strict. It is not always from Step 1 to Step 2. The
writer must often go back and repeat an earlier step. The first phase is
prewriting. It involves analyzing the target readers, and the purpose for
writing. It involves also anticipating how the readers will react to the
message. The second phase is writing. It involves researching,
18
organizing, and composing the message. The third phase is revising. It
involves revising, proofreading, and evaluating the message.
2.3.3 Types of Languages
There are many different types of languages in business writing. The first type is positive/negative language. The tone of a message is significantly improved if the author uses positive, rather than negative language. Positive language usually tells more information than negative language. Another type is courteous language. Courteous tone is against rudeness and is also trying to avoid words that sound demanding or preachy. Another type is inclusive language. “A business writer who is alert and empathic will strive to use words that include rather than exclude people.” [15] Words which seem to exclude females are called sexist.
2.3.4 Writing in Teams
Many of today’s workers work in teams to better achieve their objectives.
If the project is big, has short deadline, and requires the expertise of
many people, the team collaboration is necessary. Writing in the team
has many advantages and that is the reason why team-written documents
are standard in most organizations. The most important thing in team
writing is that many heads are better than one, and hence they can
produce a better product. And also working together helps socialize
members. However, the members of the team do not cooperate in each
phase of the writing process. At the beginning, the team members
assemble to brainstorm. Then they allocate segments of the project to
individual members. In the phase 1 (prewriting) teams work together. On
the other hand, in the phase 2 (writing) they work separately when they
draw up the first draft. During the phase 3 (revising) teams may work
together to combine their drafts. In case when team members are not
physically in the same location they are forced to use online collaboration
tools, such as e-mail, mailing lists, discussion boards, etc.

19
3 BUSINESS ENVIRONMENT
Business environment can be defined as set of conditions (social, legal,
political, institutional and economical) which affects the functioning of
organization. Business environment is composed from External
environment and Internal environment.
3.1 External Environment
External environment means that organizations are subjects which are
connected with the outside world. External environment is complex and
unstable. This environment can influence business activity in many ways,
such as economical, technological, legal, political, demographic, and
social. This can impact on transformation process. External environment
can be distinguished according to two types of external factors: 1.Those
who have more immediate influence (immediate or operational
environment), 2.Those who have more general influence (general or
contextual environment).
Into immediate environment can be classified suppliers, competitors,
customers, labour markets, and financial institutions.
Resources and resource markets are necessary for organizations, and
that is why the organizations are dependent on suppliers of those
resources. Success of an organization may be influenced by activities of
an individual supplier or resource markets. Similar situation occurs with
supplier, because he is often connected with the decisions of the
customer.
Customers are essential to all organizations. Every organization does its
best to satisfy both requirements: to identify and to meet consumer
needs. It is one of the most important things for organization to survive
and maintain the prosperity. This idea of producing things to satisfy
customer’s demands is a main principle of the market economy.
Competitors do direct and indirect competition. Both of them are very
important for many firms. Its effect can be seen at macro, as well as the
micro level, and it is obvious in changing structures of many advanced
industrial economies.
General environment is composed of factors such as technological,
economic, socio-cultural, political and legal influences. These influences

20
can come out from local and also international sources. The factors are
frequently referred to as the 'PESTLE' factors (political, economic, socio-
cultural, technological, legal and ethical). Some firm can use 'PESTLE'
analysis to analyse its current and future environment.
The political environment impacts on business activities from general
questions to more specific questions. Government has the biggest
influence on business activities. One of the questions is how the
government involves in the working of the economy. One of the crucial
aspects is public opinion in areas, such as corporate responsibility.
Another aspect is trend of globalisation of markets and international
trading. [16]
The difference between economic environment and political environment
is arbitrary, because government has a major role in the economy.
However, there are some other economical aspects which are not related
to politics, such as comparison of economic theory and practice.
The social, cultural, and demographic factors influence demand and
supply. These factors impact the type of products, the markets, and the
price. People are essential part of the market.
The technological environment represents technology. “Technology is
both an input and an output of business organizations as well as being an
environmental influence on them. Investment in technology and
innovation is frequently seen as a key to the success of an enterprise and
has been used to explain differences in the relative competitiveness of
different countries.” [17]
The legal environment represents the system of law which impinges on
aspects of business existence. The status of organizations is usually
directed by laws. They also direct organisation’s relationships with
customers and suppliers and also may influence market structure and
behaviour.
The importance of ethical environment has increased, because ethical
considerations have bigger influence (particularly among high profile
companies) on business behaviour. The firms should behave more
responsibly and they should consider what kind of impact they have on
people and their communities.

21
3.2 Internal Environment
Internal environment can be defined as a structure and functions of the
organization and the way how to accomplish specified organizational
objectives. Enterprise must adapt to new external circumstances and
balance different influences on the organisation to be constantly
successful. Organization’s management takes care of this responsibility
and its task is to mixing people, technologies, structures, and
environments. Management is a central subject connected with internal
environment. In the context of internal environment the management is
described as systems of roles which are occupied by persons who
manage the organization (entrepreneur, resource manager, co-ordinator,
leader, motivator, organiser), and also as a process which helps the
organization to identify and achieve its objectives and to adapt to change.
The important thing to be considered is that the management should be
perceived as a function of organizations, rather than as a controlling
element. Managers must incorporate many influences on the organization
(people, technology, systems, environment) to help the enterprise if it is
needed. Majority of business organizations are characterized by a
division of work which brings the opportunity to employees to specialize in
particular field and to occupy certain positions trying to achieve
organization’s objectives. Organization’s structure describes relationship
between individuals and roles and shows the way by which the purpose
and work of the enterprise is presented. The management is responsible
for establishing the formal structure of the organization and for that there
are many options available. Management can choose any form but it
should be the structure which will maintain the success of the enterprise.
The structure should consider future requirements of the organization.
The principle of structure is the labour division and the formal
organizational relationships. These relationships are described in an
organization chart. An organization chart is a scheme of role relationships
and interactions between individuals. [18]
Modern business organizations often make internal change. It means that
firm needs to restructure its organization and environment to remain
competitive. The firms can reduce the size and the shape of company
(downsizing) or redesign business processes (re-engineering).
Downsizing can make a cultural change through which employees notice
improvement and innovation and they must accept this structural reform.
Because of this structural change, implementing the chosen strategy is
strengthened by retraining and it also helps to fulfil the demands of the
changing environment. However, the firm may use changing the structure

22
to solve all of its problems, but in reality the source of its difficulties is in
its marketplace. In this situation, downsizing does not make the
unattractive products attractive.
The functional areas of the internal organization are Production, Finance,
Marketing, Personnel, Research, and Development. These areas and
individuals in them transform organizational inputs into output. The
management of these functions is the main subject to enterprise become
successful and to be able to respond to external needs for change. [19]
3.3 Organizational Strategies
Organizations have desired goals, and hence to achieve these goals they
have strategies. Organizations use special organizational processes to
guarantee that the strategies ate undertaken in appropriate ways to
achieve their desired goals. In business communication the main interest
is writing messages or business letters and the question which strategy to
use – direct or indirect. Messages or business letters can be either
positive, either negative. Most of the messages and letters written in
some organization will be positive, because they are dealing with routine
matters, and therefore the organization will simply use the direct strategy
because there are required straightforward answers. When delivering
negative or bad messages or news there are some rules by which the
writer should follow when he is deciding which strategy to choose. Every
writer must time to time deliver some bad news. This bad news can occur
when the goods are not delivered, or the customers are misunderstood.
These messages can also end business relationships, decline proposals,
refuse requests for donations, terminate employees, turn down
invitations, or respond to unhappy customers. They can also be apologies
for mistakes in orders, errors in pricing, rudeness of employees, faulty
accounting, defective products, substandard service, overlooked
appointments, or jumbled instructions. These negative messages must be
written carefully because they are disappointing, irritating, and sometimes
they bring the anger to the receiver. The receiver may not be so much
disappointed if he knows the reason for rejection, feels some sensitivity in
revealing the message, sees some seriousness in treatment with the
matter, and believes that the decision is fair.
3.3.1 Indirect Strategy
Positive messages are often revealed quickly. On the other hand,
negative messages are better to reveal gradually. They are then easier to
accept and it also shows sensitivity to the reader. If the reader is well

23
prepared it may reduce the impact of the bad news. If the receiver reads
blunt negative message he may quit reading it and throw the message
away. The indirect strategy is utilized to make the receiver finish reading
till the end of message, and thereby enable to the writer to explain the
reasons for the bad news. The indirect strategy has four parts: Buffer,
Reasons, Bad news, Closing.
Buffer is an introduction of the message. It should contain neutral
statement that does not mention anything about the negative message,
but makes the receiver continue reading.
In the part Reasons the writer gives an explanation of the causes of the
bad news and its necessity. The writer should also emphasize that the
matter was taken seriously before disclosing it to the reader.
Bad news part contains revelation of the negative message. It should be
clear announcement and the writer should not emphasize the negative
message. If it is possible this part may include an alternative or
compromise.
The final Closing part concludes the message with pleasant, forward-
looking statement. The writer may mention good wishes, or sales
promotion, but he should not refer to the negative news.
3.3.2 Direct Strategy
Indirect strategy is the best solution in writing many negative messages.
However, in some situations is better and more effective to use direct
strategy (with the negative message first). Here is a list of situations,
where the direct strategy is more appropriate:
1. When the receiver may overlook the negative message
2. When organization policy suggests directness
3. When the receiver prefers directness
4. When firmness is necessary
5. When the negative message is not damaging

24
PRACTICAL PART
4 ANALYTICAL REPORTS: THEIR EVOLVING
PREVALENCE IN TODAY’S BUSINESS
ENVIRONMENT
This part of the thesis will deal with practice in analytical reports. I will be
analysing three analytical reports. It was very difficult for me to find a
good source which would give me some examples of analytical reports,
and also answered my questions in the questionnaire which is enclosed
in the appendix. I contacted many companies dealing exclusively with
analytical reports, such as Ernst & Young, KPMG and
PriceWaterhouseCoopers (PWC). Ernst & Young and KPMG refused to
co-operate with me because they were too busy with their own projects,
and have no people available who could give me high-quality counselling.
Fortunately, my friend has a friend who works for PWC, so she
immediately arranged a meeting for us. PWC is located in Prague,
therefore our appointment also took place there. He told me that PWC is
a multinational consulting company, and they deal with (among other
activities, such as audit and taxes) consultancy. In pursuance of
consultancy, they prepare diverse analyses, which are then presented to
clients in the form of some conclusions. He also clarified the reason why
the firms probably refused to co-operate with me. Because one problem
with these analyses is that the companies often order them, and they are
not cheap, and they also frequently contain sensitive data. Then he
answered my prepared questions without any problems, and he also
provided me with three analytical reports which are open to the public on
their web sites. In these reports, I will be focusing on evaluation of the
style, language, and lexis.
1. Which tenses are used in the reports
2. If some phrasal verbs or idiomatic expressions are used
3. If there are more verbs used in passive or active voice
4. Which person the majority of the text is written in, if the author
preferred singular or plural
5. If there are some abbreviations
6. If the author used some visual aids
4.1 Analytical Reports Used
I will be analysing three analytical reports, which were provided to me by
the company PWC. Each of these reports is very different.

25
The first report is called Water: Challenges, drivers, and solutions, and as
the title suggests, the report deals with the big problem of this millennium:
water. It was published in March 2012, and was written by a collective of
six authors. It has 84 pages in total. The report contains a table of figures,
an introduction, the body of the report, the conclusion, and appendices.
The body of the report is divided into five sections, and every section has
several subsections.
The second report is called Asia: Analytical report for the White Paper on
Australia’s aid program. This report deals with Australia’s aid program
and suggestions for its future directions. It was published in September
2005, and written by two co-authors. It has 40 pages in total. The report
contains a table of contents, an executive summary, the body of the
report, recommendations, conclusions, and a glossary. The executive
summary of this report is written in a direct structure because it begins
with the author’s recommendations.
The third report is called EU – Eurobarometer survey on tobacco. This
report evaluates attitudes towards tobacco by EU citizens and
Norwegians. It was published in March 2009. It has 98 pages in total. The
report contains a table of contents, an introduction, the body of the report,
annex tables, and survey details. The body of the report is divided into
eight sections.
4.2 Which Tenses are used in the Reports
Verb tenses have several forms, such as the present simple, present
continuous, past simple, past continuous, present perfect, present perfect
continuous, past perfect, past perfect continuous, simple future, future
continuous, future perfect and future perfect continuous.
The simple present tense in the affirmative has the same form as the
infinitive but adds an –s for the third person singular. The simple present
tense is used when the action is general, for statements that are always
true, and when the action happens all the time or habitually.
The present continuous tense is used to express the idea that
something is happening now. It can also be used to show that something
is not happening now.
The past simple tense expresses the idea that an action started and
finished at a specific time in the past.

26
The past continuous tense is used to indicate that a longer action in the
past was interrupted. The interruption is usually a shorter action in the
simple past.
The present perfect tense is used to say that an action happened at an
unspecified time before now. Present perfect can be used with non-
specific expressions such as: ever, never, once, before, already, etc. On
the other hand, present perfect cannot be used with specific time
expressions such as: yesterday, one year ago, last week, etc.
The present perfect continuous tense is used to show that something
started in the past and has continued up until now.
The past perfect tense expresses the idea that something occurred
before another action in the past.
The past perfect continuous tense is used to show that something
started in the past and continued up until another time in the past.
The simple future tense has two different forms: will and be going to.
Will is used to express a voluntary action and to express a promise. Will
and be going to express a prediction. Be going to is used to express a
plan.
The future continuous tense is used to express an interrupted action in
the future.
The future perfect tense expresses the idea that something will occur
before another action in the future.
The majority of sentences in the first report are in the present simple
tense, present continuous tense, present perfect tense, and future tense.
The past simple tense also appears in the report, but is not as plentiful as
the previous tenses. The reason why authors use present and future
tenses is because this topic concerning the problem of water is current,
and will also most likely be in the future. The text of the report also
contains some modal verbs such as may, must, can, shall, and need.
Almost the same situation is in the second report as is in the first report.
The tenses which are most frequent in the second report are the present
simple tense, present continuous tense, present perfect tense, present
perfect continuous tense, and future tense. Past tenses are also used in
the report, but only in the parts where the author describes events which
happened in the past. Unlike the previous analytical report, the author of

27
this report used a lot of modal verbs in the text, especially in parts of
recommendations. The most common modal verbs used in the text are
should (shall) and could (can).
In the third report the most frequent tenses are the simple present tense
and the present perfect tense. However, there are also many sentences
which are in the past simple tense, some sentences which are in the
present continuous tense, and also one sentence which is in the past
perfect tense. The text of this report also contains some modal verbs,
such as might, would, and can.
4.3 Phrasal Verbs and Idiomatic Expressions
Phrasal verbs are a combination of a verb and a preposition, a verb and
an adverb, or it can be both a verb and a preposition plus an adverb.
Phrasal verbs often have a different meaning to the original verb. Phrasal
verbs are usually very informal, and they are used in everyday speech.
Phrasal verbs are either transitive (they take an object), or intransitive
(they do not take an object).
Idiomatic expressions are expressions that have a figurative meaning,
and mean something other than the literal meanings of the individual
words. As well as phrasal verbs, idiomatic expressions are most
commonly used in a colloquial way.
The first report contains a minimum of phrasal verbs and no idiomatic
expressions. The report contains some phrasal verbs, for example, to
point out = to indicate, to break down = to analyze in detail (in this text,
but it has also another meanings). The reason why there are almost no
phrasal verbs and idiomatic expressions in the text is that they are usually
used in everyday speech, and the usage of these verbs is not very formal,
whereas the report is a formal text.
The second report contains more phrasal verbs than the first report, and it
also contains one idiomatic expression. The phrasal verbs used in the
second report are, for example, to scale up = to increase, to build up = to
increase (in this text, but it also has another meaning), to leverage sth up
= to increase the amount of money borrowed, to spill over = when
something has a wider impact on other people or situations (in this text,
but it also has another meaning), to cut off = to isolate or make
inaccessible, to move up = to move to a higher level (in this text, but it
also has another meaning), to drive away = to force an animal or
someone to leave a place, to drive down = to make a price or amount fall

28
to a lower level. The only idiomatic expression used in text is get to the
heart of = find or determine the most important or essential facts or
meanings. The author used phrasal verbs and idiomatic expressions to
make the text of the report more interesting.
The third report contains more phrasal verbs than the first report, but less
than the second report. The phrasal verbs used in the third report are, for
example, to carry out = to perform a task (in this text, but it also has
another meaning), to stand out = to be extraordinary and different, to put
on = to deceive or lie (in this text, but it also has another meaning), to set
out = to display or show (in this text, but it also has another meaning), to
add up = to be a satisfactory explanation for something (in this text, but it
also has another meaning). This report does not contain any idiomatic
expressions.
4.4 Active and Passive Voice
In a sentence using active voice, the subject of the sentence performs the
action expressed in the verb. Active voice is used for most non-scientific
writing. If the author uses the active voice for the majority of the
sentences, it makes the meaning clearer for the readers, and keeps the
sentences from becoming too complicated. Sentences in active voice are
also more concise than those in passive voice, because fewer words are
required to express actions in active voice than in passive voice.
In a sentence using passive voice, the subject is acted upon; he or she
receives the action expressed by the verb. The agent performing the
action may appear in a “by the...” phrase, or may be omitted. There are
some reasons to generally avoid passive. For example, passive voice can
create awkward sentences, or overuse of passive voice in an essay can
cause the text to seem uninteresting. In writing business reports,
however, passive voice is more readily accepted, since using it allows
one to write without using personal pronouns or the names of particular
researchers as the subject of sentences. This method helps create the
appearance of an objective, fact-based discourse, because authors can
present research and conclusions without attributing them to particular
agents.
In all three analytical reports the authors used both - the active and the
passive voice. If I were to determine which voice is more frequent in these
reports, I would say passive voice, because as I have mentioned above,
this method does not use personal pronouns or particular names, and the
29
text looks more fact-based and objective, and hence the passive voice is
appropriate for writing analytical reports.
4.5 The Grammatical Person
The grammatical person shows the relationship between the speaker and
other participants in an event. More specifically, it is a reference to a
participant in an event, such as the speaker, the addressee (recipient of
the speaker’s communication), or others. The grammatical person usually
defines the set of personal pronouns used by the speaker. It also
frequently affects verbs, sometimes nouns, and possessive relationships
as well.
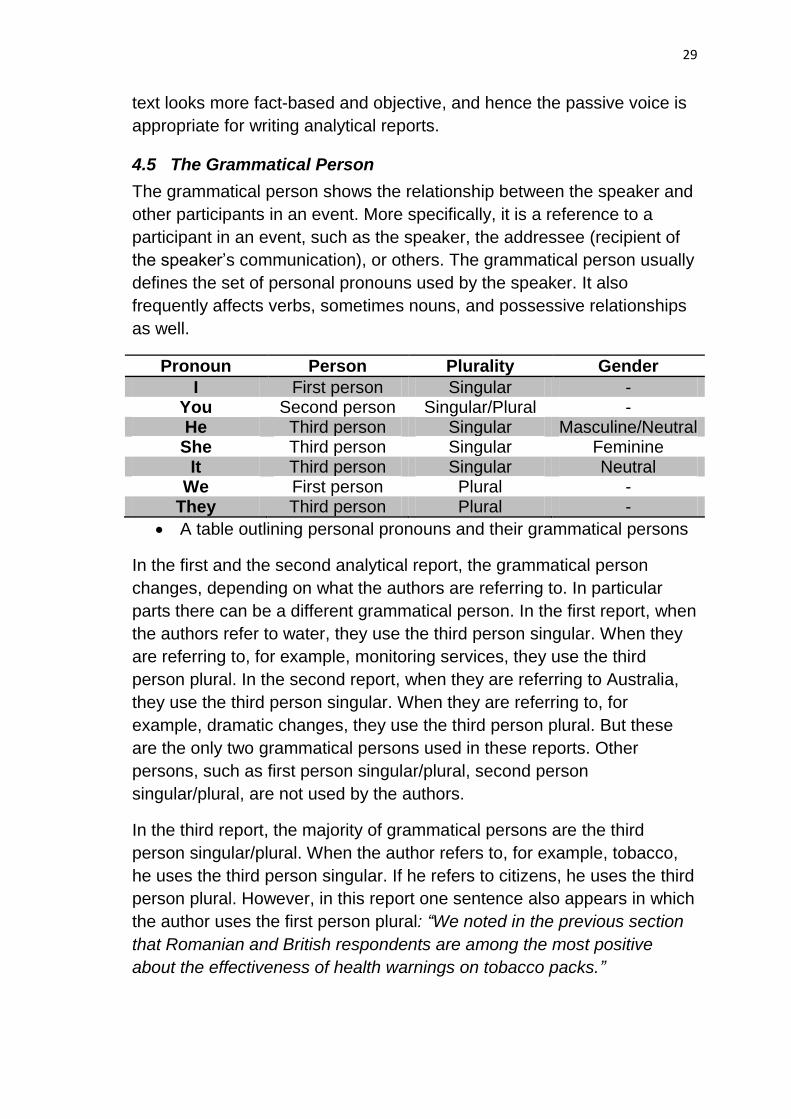
Pronoun Person Plurality Gender
I First person Singular - You Second person Singular/Plural - He Third person Singular Masculine/Neutral She Third person Singular Feminine
It Third person Singular Neutral We First person Plural -
They Third person Plural -
A table outlining personal pronouns and their grammatical persons
In the first and the second analytical report, the grammatical person
changes, depending on what the authors are referring to. In particular
parts there can be a different grammatical person. In the first report, when
the authors refer to water, they use the third person singular. When they
are referring to, for example, monitoring services, they use the third
person plural. In the second report, when they are referring to Australia,
they use the third person singular. When they are referring to, for
example, dramatic changes, they use the third person plural. But these
are the only two grammatical persons used in these reports. Other
persons, such as first person singular/plural, second person
singular/plural, are not used by the authors.
In the third report, the majority of grammatical persons are the third
person singular/plural. When the author refers to, for example, tobacco,
he uses the third person singular. If he refers to citizens, he uses the third
person plural. However, in this report one sentence also appears in which
the author uses the first person plural: “We noted in the previous section
that Romanian and British respondents are among the most positive
about the effectiveness of health warnings on tobacco packs.”
30
4.6 Abbreviations and Acronyms
An abbreviation is a shortened form of a word or phrase. Usually it
consists of a group of letters taken from the word or phrase. An
abbreviation is pronounced as individual letters. For example FBI from
Federal Bureau of Investigation.
An acronym is a word formed from the initial letters of the words in a
phrase. Acronym is pronounced as a word. For example laser from light
amplified by stimulated emission of radiation.
The first report contains several abbreviations. The authors, however,
give the full definition with every abbreviation. For example WHO = The
World Health Organization, AUE = Association des Usagers de l’Eau.
This report also contains one acronym: OFWAT = The Office of Water
Services.
In the end of the second report is a glossary section. This section
contains the list of abbreviations and acronyms used in the report, and
their definitions. For example ADB = Asian Development Bank, IBRD =
International Bank for Reconstruction and Development, WTO = World
Trade Organization and acronym AIDS = Acquired Immune Deficiency
Syndrome.
The third report contains a minimum of abbreviations and no acronyms.
The total number of abbreviations used in this report is three, and these
are EU = European Union, ETS = Environmental Tobacco Smoke and
EEA = European Economic Area.
4.7 Visual Aids
Visual aids can increase the effectiveness of business reports. Visual aids
are used to emphasize, clarify, simplify, reinforce, and summarize
information. They can also be used to add interest, improve credibility,
and increase the coherence of the text. The most common visual aids are
described below.
A bar chart is a chart that uses two or more rectangles, along with
vertical and horizontal axes to represent information. Bar charts are used
to compare discrete quantitative information. They provide a quick visual
impression of the relationships between or among the components that
are being compared.

31
Example of a bar chart
Pie charts are circles divided into segments. The circle represents the
whole amount (100 percent), and each segment represents a proportion
of the whole. They are also called circle charts. They are effective when
the author wants to emphasize relative proportions.
Example of a pie chart
Line charts display information as a series of data points connected by
straight line segments. A line chart consists of a vertical axis, a horizontal
axis, and one or more plotted lines. In a business report, one of the most
commonly used line charts is a time chart, which shows trends or
changes in a variable over time.
Example of a line chart
The pictures in the report emphasize the problem of the report more
effectively than just a written text. Pictures also create a sense of
precision, and they make a report more attractive.
0
2
4
6
2009 2010
Men
Women
Children
English dialects
USA
UK
Canada

32
The first report contains some pictures, bar charts, line charts, and pie
charts. Pictures used in this report make the report more attractive, and
emphasize the problem with water, because every picture is connected
with the subject of water. The charts have an appropriate proportion
according to the length of the text.
The second report has only two charts, and does not have any pictures.
The third report contains many charts, such as bar charts, line charts, and
pie charts. In the text of this report many numbers expressing percentage
appear, and therefore usage of these charts complement the content of
this report in an appropriate way. Nevertheless, this report does not
contain any pictures.
4.8 Questionnaire
The questionnaire contains 16 questions. These questions were created
based on the theoretical part, and were answered by the representative of
the company PWC. The summary of the answers is that - PWC provides
analytical reports as a part of a complex service to various clients, and
analytical reports are a fundamental part of their advisory and assurance
solutions. The main differences in analytical reports between today and
10 years ago are recognizable in the increased usage of digital and online
media (PowerPoint presentations, web pages, interactive content, etc.)
and respectively in the decreased amount of hard copies. PWC find
analytical reports useful for the clients, government, public institutions, as
well as for the company itself. The number of people who prepare
analytical reports in PWC is based on the scope, size, and difficulty of the
individual project. Publicly disclosed reports are available on their web
pages. Some reports are published annually, or with regular frequency.
PWC mostly use their internal sources (surveys, databases, networking,
knowledge base) for writing analytical reports. Analytical reports which
also contain recommendations are standard in advisory and assurance
related reports. PWC submits reports both in writing and digitally. The
number of pages is based on the scope, size, and difficulty of the
individual project. They use both, indirect and direct structures, but for
different types of reports. Public reports are written in an indirect
structure. Client reports are written in a direct structure. They use all
formats of reports I mentioned in the questionnaire (letter format, memo
format, manuscript format, digital format, printed forms) and also all
delivery methods (in person, by mail, by fax, by e-mail, online). PWC use
standardized templates and styles for writing analytical reports. PWC also

33
has a special person who deals exclusively with analytical reports, and is
a methodology specialist. They use all three types of analytical reports
(Justification/Recommendation reports, Feasibility reports, and Yardstick
reports) but it depends on the client’s requirements.

34
5 CONCLUSION
To conclude my Bachelor thesis, I would like to make a brief summary of
what was done and examined.
Firstly, it was necessary to give a theoretical framework to the whole
thesis so I used several sources. As a result, you read a complex
description of essential information of business reports, especially
analytical reports as well as examined areas.
The theoretical part talks about analytical reports, their types, features,
how to select the topic of analytical reports, which parts should standard
analytical report contain and which writing style should the author of
analytical report use. Further there is defined business environment and
organizational strategies.
Concerning the practical part, three analytical reports were analysed in
this thesis from three different viewpoints, which are as follows: the style,
language and lexis. Getting these reports for using them in writing this
bachelor thesis has been of extreme difficulty because the companies,
which had been contacted, were reluctant to provide any or if at all
confidential data concerning their clients. This part also contains
summary of the answers from questionnaire. These questions were
answered by a representative of the company PWC. This company was
the only company which provided me analyzed reports.
The analysis of these reports was supposed to serve the author mainly as
a way to compare how much the companies keep the formal layout, what
is the level of English language used in these reports and how frequent
do the authors of these reports use visual aids. I did not have any major
difficulties while analyzing these reports. Each of these reports is formal
and has high level of English language. The main difference is in using
visual aids. The first and, especially, the third report contain, concerning
the length of the report, many visual aids. On the other hand, the second
report does not contain many visual aids.
The reason why analytical reports are prevalent in today´s business
environment is that almost all companies and organizations use these
reports not only to get the information about the problems, but also to get
the recommendations how to solve them.
Elaboration of this bachelor thesis helped me to widen my knowledge of
business reports in general as well as one particular area – analytical

35
reports and I look forward to writing an analytical report for a company
myself in the near future.

36
6 ENDNOTES
[1] Kuiper, Shirley. Contemporary Business Report Writing, page 3
[2] Kuiper, Shirley. Contemporary Business Report Writing, page 6
[3] Guffey, Mary Ellen and Loewy, Dana. Essentials of Business
Communication, page 234
[4] Guffey, Mary Ellen and Loewy, Dana. Essentials of Business
Communication, page 233
[5] Guffey, Mary Ellen et al. Business Communication: Process and
Product, page 372
[6] Guffey, Mary Ellen et al. Business Communication: Process and
Product, page 377
[7] Guffey, Mary Ellen et al. Business Communication: Process and
Product, page 377
[8] Kuiper, Shirley. Contemporary Business Report Writing, page 275
[9] Kuiper, Shirley. Contemporary Business Report Writing, page 394
[10] Kuiper, Shirley. Contemporary Business Report Writing, page 395
[11] Kuiper, Shirley. Contemporary Business Report Writing, page 398
[12] Kuiper, Shirley. Contemporary Business Report Writing, page 400
[13] Kuiper, Shirley. Contemporary Business Report Writing, page 402
[14] Guffey, Mary Ellen and Loewy, Dana. Essentials of Business
Communication, page 32
[15] Guffey, Mary Ellen and Loewy, Dana. Essentials of Business
Communication, page 42
[16] Britton, Chris and Worthington, Ian. The Business Environment, page
34
[17] Britton, Chris and Worthington, Ian. The Business Environment, page
35
[18] Britton, Chris and Worthington, Ian. The Business Environment, page
45-51

37
[19] Britton, Chris and Worthington, Ian. The Business Environment, page
57

38
7 BIBLIOGRAPHY
Print sources
Guffey, Mary Ellen and Loewy, Dana. Essentials of Business
Communication. 8th ed. Masson : Cengage Learning, 2010. 558 p.
ISBN 978-0-324-58800-9
Guffey, Mary Ellen et al. Business Communication: Process and Product.
6th ed. Cengage Learning, 2008. 643 p. ISBN 978-0-324-54290-5
Kuiper, Shirley. Contemporary Business Report Writing. 4th ed. Cengage
Learning, 2009. 560 p. ISBN 978-0-324-58742-5
Britton, Chris and Worthington, Ian. The Business Environment. 5th ed.
Pearson Education, 2006. 554 p. ISBN 978-0-273-70424-9
Ashley, A., Oxford Handbook of Commercial Correspondence. Oxford
University Press, 2003. 304 p. ISBN 978-0-19-457213-2
Summers, Della, Longman Dictionary of Contemporary English.
Longman, 2003. 1949 p. ISBN 0-582-50664-6

39
8 ABSTRACT
The aim of this bachelor thesis was to focus on a business case first from
the theoretical perspective and after analyze a real business case. The
theoretical part contains essential information concerning analytical
reports. Theoretical part may also help some beginners with planning and
writing analytical reports. The practical part is focusing on analysing real
analytical reports such as evaluation of the style, language and lexis. The
practical part also contains questionnaire and answers from a consulting
company which participated in creating this thesis.

40
9 RESUMÉ
Tato bakalářská práce se věnuje analytickým zprávám a to jak z hlediska
teoretického tak i praktického. Teoretická část obsahuje základní
informace o analytických zprávách a může sloužit také jako příručka pro
psaní analytických zpráv pro začátečníky. V praktické části je důraz
kladen na rozbor skutečných analytických zpráv z hlediska stylistického,
jazykového a lexikálního. Praktická část také obsahuje dotazník s
odpověďmi, které poskytla poradenská firma, která se podílela na tvorbě
této práce.

41
10 APPENDICES
Appendix 1
QUESTIONNAIRE
1. Why do you use analytical reports?
2. Is there any difference in analytical reports between today and
before 10 years?
3. Do you find analytical reports useful for your company?
4. How many people work on the analytical reports?
5. How often does your company present analytical reports? (once a
month, every quarter,..)
6. Where you are looking for sources of information for
analytical reports?
7. Do you also supply recommendations in analytical reports?
8. Do you submit reports in writing, orally or digitally?
9. Do you use a PowerPoint presentation?
10. How many pages have usual reports?
11. Do you use direct or indirect structure during writing reports?
12. Which format of reports do you use? (letter format, memo
format, manuscript format, digital format, printed forms)
13. Which way of delivery do you use? (in person, by mail, by
fax, by email, online)
14. Do you use some templates for writing analytical reports?
15. Does PWC has a special person which deals exclusively with
analytical reports?
16. Which one of these types of analytical reports is most
common in your company-Justification/Recommendation reports,
Feasibility reports or Yardstick reports?

Appendix 2
Water:
challenges,
drivers and
solutions
March 2012

2 | Water: challenges, drivers and solutions | 2012

| Contents
Table of figures 4
Introduction 7
Section I - Major challenges and stabilising factors for the water sector 9
1.1. An abundant source in stable quantities, but of limited accessibility 9
1.2. Marked geographical disparities further impact water availability 11
1.3. Dwindling of resources of good-quality water owing to major structural factors 15
1.4. Human activity is accelerating the deterioration in the Earth’s water capital 19
Section II - Key players in the water sector value chain 21
2.1. Differing situations and needs… 22
2.2. …met by diverse players 24
Section III - Private operators: competitive forces, models and risks 35
3.1. The majors: Veolia Eau and Suez Environnement 36
3.2. Other large European companies and their international ambitions 37
3.3. A new breed of player: private operators from emerging and developing countries 38
3.4. Emergence of small private operators 39
3.5. Models and risks 40
3.6. Which models will be used in the future? 42
Section IV - Economic analysis 45
4.1. Analysis of cost structure 46
4.2. Price, cost recovery and financing of services 59
Section V - Pointers towards tomorrow’s solutions 65
5.1. Governance 66
5.2. Technological innovations 69
5.3. Financing 71
Conclusion 75
Appendices 77
Global and regional trends 78
The authors 79
Bibliography 80

| Table of figures
Figure 01: Availability of water on Earth 9
Figure 02: The water cycle 10
Figure 03: Freshwater availability and
water stress, 2007 11
Figure 04: Exploitation of water reserves
worldwide 12
Figure 05: Global and regional trends in water
supply in 2008 13
Figure 06: Global and regional trends
in sanitation practices in 2008 14
Figure 07: Change in water withdrawal and
the global population, 1950-2025 15
Figure 08: Trends in urban population density and
water consumption, 1950-2030 16
Figure 09: Use of withdrawn water by region,
2003 17
Figure 10: Water withdrawal and consumption
by region, 2010 18
Figure 11: Change in water resources 19
Figure 12: Worldwide market for industrial
and domestic water equipment 25
4 | Water: challenges, drivers and solutions | 2012
Figure 13: Breakdown of worldwide equipment
market 26
Figure 14: Water technology valuation continuum,
2008 26
Figure 15: Share of population in developing
countries served by private operators,
2009 38
Figure 16: Water infrastructure cycle 46
Figure 17: Investment in water supply
infrastructures 46
Figure 18: Investment in water supply by type
of cost, 2010 47
Figure 19: Investment in water infrastructure,
2010 vs. 2016 47
Figure 20: Theoretical availability of renewable
water per inhabitant 48
Figure 21: Municipal water supply (cubic metre
per inhabitant per year) and investment
per cubic metre 49
Figure 22: Investment in water withdrawal,
2010 vs. 2016 49

Figure 23: Investment in water withdrawal,
2010 vs. 2016 50
Figure 24: Water supply and investment in water
treatment per inhabitant, 2010 51
Figure 25: Quality of water from Chinese
river basins 51
Figure 26: Investment in water distribution
by type of cost, 2010 52
Figure 27: Investment expenditure
per inhabitant, 2010 52
Figure 28: Investment in water distribution,
2010 vs. 2016 53
Figure 29: Global investment in sanitation
infrastructure, 2010 54
Figure 30: Investment in wastewater sanitation,
2010 54
Figure 31: Investment in the water sector
by type of activity 55
Figure 32: Structure of investment, 2010 55
Figure 33: Level of collected wastewater
treatment, 2010 56
Figure 34: Investment in wastewater sanitation,
2010 vs. 2016 56
Figure 35: Summary of the cost of supplying
drinking water (in USD billions) 57
Figure 36: Summary of wastewater sanitation
costs (in USD billions) 58
Figure 37: Investment in production and
supply of water vs. investment in
sanitation, 2010 58
Figure 38: The 3Ts 59
Figure 39: Pledges of aid and aid payments
by domain, 2009 60
Figure 40: Water infrastructure decline cycle 61
Figure 41: Water infrastructure improvement
cycle 61
Figure 42: Global and regional trends in water
supply, 1990 vs. 2008 78
Figure 43: Global and regional trends in sanitation
practices, 1990 vs. 2008 78
PwC | 5


| Introduction
Water has become one of the foremost modern-
day challenges in this early part of the third
millennium. This is because one of the targets of
the Millennium Development Goals is to halve the
proportion of the population without sustainable
access to safe drinking water between 2000
and 2015 and subsequently achieve universal
coverage. Another reason is that the era of
free drinking water in unlimited quantity is
over. During recent decades, a combination of
human demographics and human activity has
in many global regions transformed water from
an abundant element to a scarce resource.
The automatic response to perceived resource
scarcity is typically conditioned by economics
and the principal aim then becomes the optimal
management of the resource in question. However,
water is essential to the existence of human beings
and of all our planet’s flora and fauna. This means
that it is not just an economic good; it is also a
social and environmental good. Although water
quantity on Earth has been stable for millions of
years, water quality has deteriorated considerably.
Climatic changes, whether temporary or lasting,
are another complicating factor: some parts of
the globe are facing an increased risk of flooding
even as others are at risk of severe drought.
Water management has consequently become
both difficult and complex. The difficulty lies in
providing access to drinking water for a global
population that has risen from 1.5 billion at the
beginning of the 20th century to 7 billion today.
The complexity comes from the multifarious
aspects of water management, beginning with
technical, institutional and organisational
issues, the application of new technologies, legal
and regulatory considerations and regulatory
effectiveness. Other aspects are standards,
investment, costs, financing, pricing, governance,
and economic, financial, social and environmental
sustainability. Admittedly, the digital revolution
has made itself felt, but the impact on the sector
has remained modest. Since Antiquity, man has
had to keep building pipe networks and aqueducts
to channel water; unlike information, millions
of cubic metres of water cannot be transferred
from one place to another with a mere click.
Today, the issue of water is inseparable from
that of the sanitation facilities needed for the
treatment of wastewater prior to its discharge
back into the environment. The challenge here is
no less formidable than that concerning drinking
water. Water is essential to life and public health,
and sanitation is essential to human dignity, the
environment and - ultimately - water conservation.
Thus, water-related issues, which up to several
years ago interested only specialists and scientists,
are now a central concern for many, including
public and private operators, elected officials,
associations and citizen-consumers. In less than
30 years, society has come to recognise that
water management concerns us all, that it needs
to be approached on a planetary scale and that
negligence and ignorance with regard to water
could lead to serious problems incompatible
with human survival. All players in the water
sector need to rally urgently to the task of
finding holistic solutions for securing water
supplies for existing and future generations.
PwC | 7

8 | Water: challenges, drivers and solutions | 2012
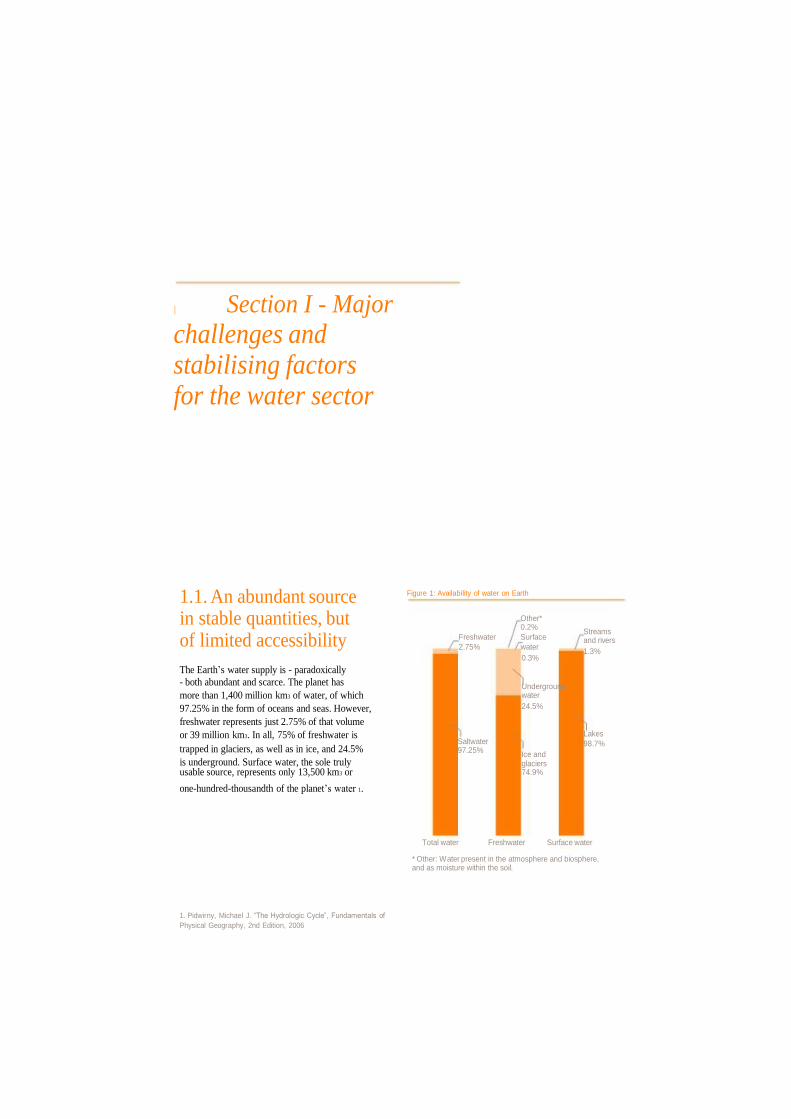
| Section I - Major
challenges and stabilising factors for the water sector
1.1. An abundant source in stable quantities, but of limited accessibility
The Earth’s water supply is - paradoxically
- both abundant and scarce. The planet has
more than 1,400 million km3 of water, of which
97.25% in the form of oceans and seas. However,
freshwater represents just 2.75% of that volume
or 39 million km3. In all, 75% of freshwater is
trapped in glaciers, as well as in ice, and 24.5%
Figure 1: Availability of water on Earth
Other* 0.2%
Freshwater Surface
2.75% water
0.3%
Underground water
24.5%
Saltwater 97.25%
Streams and rivers
1.3%
Lakes
98.7%
Ice andis underground. Surface water, the sole truly usable source, represents only 13,500 km3 or
one-hundred-thousandth of the planet’s water 1.
1. Pidwirny, Michael J. “The Hydrologic Cycle”, Fundamentals of
Physical Geography, 2nd Edition, 2006
glaciers 74.9%
Total water Freshwater Surface water
* Other: Water present in the atmosphere and biosphere, and as moisture within the soil.

The Earth’s water is renewed through a cycle
comprising evaporation, condensation and
return to the source. The cycle for surface water
averages less than 21 days, with nine days for
condensation/precipitation and 12 days for the
return of rainwater to the sea. Sixty percent of
rainwater evaporates in the atmosphere, 25%
infiltrates the soil and 15% finds its way into
lakes and rivers. The cycle for infiltration water
varies depending on the groundwater aquifers.
Figure 2: The water cycle
As we have seen, the Earth’s water supply is
abundant in absolute volume terms. However, only
a very small portion of it is available for human
requirements. The renewal of visible (surface)
water takes place over a nearly month-long cycle.
The length of the renewal cycle depends on
the nature of the water. The renewal cycle
for atmospheric water is eight days, that for
streams and rivers is 10 days to 20 days, that
for lakes is 20 years and that for underground
water and oceans is in excess of 1,000 years.
Condensation
Transpiration
Precipitation
Evaportation
Percolation Runoff
Water table Lake
River
Ocean
Groundwater flow
10 | Water: challenges, drivers and solutions | 2012

1.2. Marked geographical disparities further impact water availability
The availability of water is determined by
geographical location and climate. There are desert
areas (for example, the Sahara region and the
Middle East), regions with medium to high rainfall
(for example, some parts of South America, of
Figure 3: Freshwater availability and water stress, 2007
In 2007, several world regions were clearly
in a vulnerable situation or affected by water
stress. A number of regions, including Saharan
Africa, Southern Africa, the Middle East, central
Asia, central India and some parts of China,
were already experiencing waters shortages.
Water stress means that the supply of available and
accessible water is not sufficient, or will cease to be
sufficient in the near future, to meet the needs of users.
The pressure on water resources is already
evident. In some parts of the world, demand for
water exceeds the quantity available or produced
within regional frontiers. In 2000, a total of 508
million people in 38 countries were affected
by water stress. By 2025, 3 billion people in
48 countries could be in the same situation.
Sub-Saharan Africa and of tropical and equatorial
Asia) and places with a high density of water in the
form of ice (for example, Canada, northern Siberia
and the North Pole). At present, 85% of the world’s
inhabitants live in the more arid half of the Earth 2.
Depending on the available water supply, needs are
met through the exploitation of resources, which
may be renewable to a very limited extent or not
renewable at all. The Water Exploitation Index
(WEI), the reference index used by the United
Nations, measures the ratio between annual total
freshwater withdrawal and the long-term annual
average of renewable freshwater resources. The
index shows that regions with a severe water deficit
are those where over-exploitation of resources
and reserves is most acute 3. Such cases include
countries in North Africa, the Near East and the
Middle East, and some parts of Southern Europe
and Asia. The same situation applies in a number of
highly industrialised countries, such as the United
States, where the extent of water demand is causing
reserve depletion at a faster-than-normal rate.
2. OECD, OECD Environmental Outlook to 2030
3. UNDP Human Development Report 2006
PwC | 11

Figure 4: Exploitation of water reserves worldwide
The corollary to this situation is that the regions
where water resources are the least exploited are
those where access to water is least developed.
Access to water is assessed relative to population
density. In French-speaking North Africa, for
example, more than 80% of inhabitants have
1.2.1. Water supply
access to water. However, the water comes
from reserves that are overexploited.
Aside from the availability of freshwater and
“theoretical” access to water, there are the equally
important matters of water supply and sanitation.
The World Health Organisation (WHO) assesses drinking-water supply based on the type and quality of
access made available to people. The organisation recognises three types of drinking-water access - piped
water on premises, other improved drinking-water sources and unimproved drinking-water sources.
Table 1: The WHO and Unicef drinking water ladder
Piped water on premises
Other improved drinking-
water sources
Unimproved drinking-
water sources
Piped household water connection located inside the user’s dwelling,
plot or yard.
Public standpipes, tube wells or boreholes, protected dug wells, protected
springs and rainwater collection.
Unprotected dug wells, unprotected springs, carts with small tank/drum,
surface water (river, dam, lake, pond, stream, canal or irrigation channels),
and bottled water.
In 2008, 57% of the world’s population had
access to an improved source of drinking water
(piped water connection in the user’s dwelling,
plot or yard, or to water sources), 30% used
other improved drinking-water sources (public
taps or standpipes, tube wells, boreholes,
protected springs and rainwater collection)
and the remaining 13% relied on unimproved
sources (unprotected dug wells, unprotected
springs, surface water or irrigation channels) 4.
4. WHO and Unicef, 2010 Update Report on Progress on
Sanitation and Drinking Water

Figure 5: Global and regional trends in water supply in 2008
Thanks to the spread of piped household
connections, several world regions experienced a
strong improvement in water access between 1990
and 2008. Such regions include eastern Asia (use of
improved water sources by 83% of the population
in 2008 versus 55% in 1990) and North Africa
(80% in 2008 versus 58% in 1990). Direct access
to water is available to 33% of the population in
Southeast Asia, 23% in South Asia and 16% in Sub-
Saharan Africa. However, between 44% and 53%
of those three regions’ inhabitants still use water
obtained from public standpipes, wells, boreholes,
protected springs or rainwater collection.
Urban areas enjoy better water-supply coverage.
In 2008, 96% of the global urban population had
access to improved drinking-water sources versus
78% in rural areas. In developed regions, the rural
and urban water access rates are currently 98% and
100% respectively versus 76% and 94% in developing
regions. In Sub-Saharan Africa, 47% of the rural
population uses improved drinking-water sources
versus 83% in urban areas. In all, 84% of the 884
million inhabitants in the world without access to an
improved drinking-water source live in rural areas.
It must be pointed out that the figure of 884
million people without access to safe drinking
water is widely contested. Critics believe it to be a
considerable underestimation on the grounds that
it only takes account of persons who use water that
has been contaminated by animal faeces deemed
dangerous to human health. There are, indeed,
many other cases around the world of people not
having access to drinking water. The AquaFed 5
international federation of private water operators
has found that access to an “improved” source of
drinking water, i.e., water obtained from a tap
in the home or nearby, or from other “improved”
sources, is not always the same as access to safe
drinking water. Based on related estimations and
extrapolations, 1.9 billion people only have access
to unsafe water (it contains, for example, arsenic,
coliforms, or chemical, physical or biological
contaminants) and 1.6 billion people have access
to water of doubtful quality. On that premise, only
3.5 billion people have access to water that is safe,
meaning that two conditions for virtually-assured
safety are met: (i) the chemical and biological
quality of the water is appropriately verified;
and (ii) precautions are taken to ensure that no
contamination occurs during the transfer of the
water from the source to the place of use, not
least of all, the home. Based on that definition of
water safety, roughly 50% of the global population
uses water of dangerous or doubtful quality.
5. Les besoins en eau potable dans le monde sont sous-estimés :
des milliards de personnes sont concernées, Gérard Payen,
President of AquaFed, November 2011
PwC | 13

1.2.2. Sanitation
The situation with regard to sanitation is even more serious. The WHO recognises four types of access
to sanitation: improved facilities, shared facilities, unimproved facilities and open defecation.
Figure 6: Global and regional trends in sanitation practices in 2008
Sub-Saharan Africa and South Asia remain the
regions with the lowest use of improved sanitation
facilities. Between 1990 and 2008, progress in
the sphere of sanitation in those regions was
slower than in other developing regions.
Sanitation facilities are better in urban areas. In
2008, 76% of the global urban population had
access to improved sanitation facilities versus
just 45% in rural areas. In developed regions,
the rural and urban access rates are currently
96% and 100% respectively versus 40% and 68%
in developing regions. Sub-Saharan Africa and
South Asia are trailing behind, with respectively
76% and 74% of rural dwellers having no
access to improved sanitation facilities.
14 | Water: challenges, drivers and solutions | 2012
According to the WHO, by 2015, 2.4 billion
people will not have access to basic sanitation
and close to 4 billion people will not have
access to shared sanitation facilities.6 Rural
dwellers are expected to account for 70% of
people without access to improved sanitation
facilities. This increases the appeal of migrating
to urban areas and explains the steady demand
growth in towns and cities. In Asia, the nearly
60% projected surge in the urban population
by 2025 is likely to create water shortages. 7
Alongside localised water stress resulting from
the demand-supply imbalance is the issue of
water quality at both ends of the supply chain.
6. WHO and Unicef, 2008 Update Report on Progress on
Sanitation and Drinking Water
7. Asian River Restoration Network and the fresh and coastal
waters session, 2007

1.3. Dwindling of resources of good-quality water owing to major structural factors
1.3.1. Demographic and urbanisation growth mechanically
increases demand for domestic water
During the 20th century, water withdrawal worldwide rose sevenfold and projections through to 2025
are consistent with that trend. Water withdrawal exceeded the 4,000 km3 mark in 2000 and will top
5,000 km3 in 2025. The 80 million-strong growth in the human population each year has an impact of
nearly 64 km3 on annual freshwater demand.
Figure 7: Change in water withdrawal and the global population, 1950-2025 8
6,000 12
5,000 10
4,000 8
3,000 6
2,000 4
1,000 2
- -
1950 1970 1990 2000 2025
Agriculture use Industrial use Municipal/Domestic use Reservoirs Populations (billions)
*Loss of reserves: reduction in water through pollution or a decline in the quality of reserves.
An estimated 90% of the 2 billion people who are
expected to be added to the worldwide population
by 2050 will live in developing countries. Many
of them will live in regions already experiencing
water stress or without sustainable access to
drinking water and adequate sanitation. Water
volume requirements will be exacerbated by
the population’s greater life expectancy.
Coastal and urban areas will be the first to be
affected by massive migration. By 2030, nearly
60% of the global population will live in towns
and cities and 81% of urban humanity will
live in vulnerable and developing regions.
8. FAO 2010, UN Water 2009, World Bank 2008

Figure 8: Trends in urban population density and water consumption, 1950-2030 9
100% 6,000
75% 4,500
50% 3,000
25% 1,500
0% 0
1950 1960 1970 1980 1990 2000 2010 2020 2030
Africa Asia Latin America & Caribbean Europe Oceania North America
In 2010, water withdrawal for domestic use was estimated by the United Nations at 472 km3 or 11% of
total water withdrawal worldwide. It is used to supply towns, cities and rural communities. Withdrawal
should be 30% higher by 2025. The water is used for drinking, hygiene and various domestic purposes. 10
1.3.2. Production of water-intensive
foodstuffs is on a rising trend
Food security is an imperative and is inextricably
linked to the availability of water resources.
Agriculture has traditionally accounted for the bulk
of worldwide water consumption, representing
70% of water withdrawal on average. Agricultural
production has increased in line with global
demographic growth. The FAO expects demand
for food to remain on a rising trend in response
to demographic and income growth. Demand
for cereals (for human and animal consumption)
should reach 3 billion tonnes in 2050. Annual
cereal output will need to increase by nearly 1
billion tonnes from 2.1 billion tonnes today. Annual
meat production will need to rise by more than 200
million tonnes to 470 million tonnes in 2050, with
consumption in developing countries representing
72% versus 58% at present. According to the
FAO, water withdrawal for agricultural irrigation
is likely to increase at a nearly 11% annual
pace to 2,906 km3 by 2050 on the back of more
efficient water use and improved crop yields. 11
9. UN Water, FAO Aquastat 2010, World Urbanization Prospects,
FAO, PwC Analysis
10. http://webworld.unesco.org/water/ihp/db/shiklomanov/part’3/
HTML/Tb_18.html
11. FAO, How to Feed the World in 2050, 2009
16 | Water: challenges, drivers and solutions | 2012
Geographical and rainfall disparities, together with
the quest for productivity gains, have led to the
increased use of irrigation. Irrigated land increased
fivefold during the 20th century. In addition,
certain emerging and developing countries (for
example, Côte d’Ivoire, Brazil and Morocco)
increase production in order to raise export
levels. According to the FAO, rainfed agriculture
covers 80% of arable land and contributes 60%
of food production, whereas irrigated agriculture
covers 20% of arable land and contributes 40%
of food production. Water consumption varies
depending on foodstuffs: 1,500 litres of water for
1 kg of wheat, triple that amount for on average
1 kg of rice, 4,300 litres for 1 kg of poultry and
15,400 litres for 1 kg of beef 12. In 2010, the
United Nations estimated that water withdrawal
and consumption (respectively 3,189 km3 and
2,252 km3 at the time) would need to rise by 13%
by 2025 to meet the food requirements of a global
population with an additional 764 million people.
12. UNESCO - IHE: http://www.waterfootprint.org (5 October
2007)

1.3.3. Industrial requirements weigh
more and more heavily in the balance
In 2000, water withdrawal for industrial and
energy purposes taken together was 776 km3
or 19% of total water withdrawal 13. In 2010,
industry- and energy-related water withdrawal
exceeded 900 km3 and is expected to grow by
nearly 30% by 2025. Industrial demand, initially
powered by the industrialisation of the world’s
old economies, is experiencing a resurgence as
emerging and developing countries gradually close
the gap. This is because water is vital to industries
like hydropower, metallurgy, mining and paper.
The production of nuclear energy and hydropower
accounts for 57% of industry-related water
withdrawal versus 40% for industrial processes
and 3% for thermal power generation.
Figure 9: Use of withdrawn water by region, 2003 14
11% 10% 9% 4% 9%
19%
86% 82% 70%
1.3.4. Urbanisation is keeping
domestic use on an upward trend
Domestic use represents on average 11% of
total water withdrawal worldwide and is used
to supply towns, cities and rural communities.
Withdrawal should be 33% above the current
level of roughly 487 km3 by 2025. The water is
used for drinking, hygiene and various domestic
purposes. Note that only 1.5% of drinking water
is effectively used for drinking purposes.
1.3.5. The situation varies
across continents and regions,
reflecting differing realities
The use of withdrawn water varies across
world regions and is conditioned by each
region’s degree of development. In the long-
industrialised countries, water withdrawal for
industrial purposes is at least equal to water
withdrawal for use in agriculture. In emerging
and transitional economies, agriculture
remains the biggest water consumer.
15% 16% 19%
11%
43% 55%
70%
43% 29%
World Africa Asia Oceania North America Europe
Domestic use Industrial use Agricultural use
13. FAO Aquastat 201014. FAO - Aquastat. - www.fao.org/nr/water/aquastat (November 2010)
PwC | 17

Volumes of consumed and withdrawn water also vary markedly across regions. In 2010, the Asian
continent was by far the largest contributor to worldwide water consumption and withdrawal, accounting
for 66% and 59% respectively. Next in line were Europe and North America. Developing regions,
excluding Asia, were the smallest consumers.
Figure 10: Water withdrawal and consumption by region, 2010 15
15. State Hydrological Institute (St. Petersburg, Russia) edited by I. Shiklomanov

1.4. Human activity is accelerating the deterioration in the Earth’s water capital
For centuries, a very large portion of natural
freshwater could be used directly for human
purposes without special treatment. However,
the second half of the 20th century was
marked by the large-scale deterioration
and change in the water renewal cycle.
Human activity is the root cause of this situation.
In agriculture: the massive use of pesticides,
herbicides and nitrogenous fertilisers has grave
consequences for groundwater layers. The pollution
process is slow and the effect on water resources
is long-lived. At the same time, surface water is
polluted by waste discharges from livestock farms.
In industry: waste containing over 100,000
chemical components is discharged into
waterways. Eutrophication, a process resulting
from a high concentration of nutrients (mainly
phosphorus and nitrogen), significantly reduces the
suitability of water for use. Another contributing
factor is the increased transfer of very polluting
industries from high-income countries to emerging
market economies, which are less well equipped
to treat industrial waste and wastewater.
In urban areas: the natural runoff process is
hindered by solid buildings. In addition, rainwater
collects chemicals and other concentrated forms
of pollutant (such as zinc and lead), which are
then carried directly into streams and rivers.
Rainwater is discharged with no prior treatment,
especially in emerging and the least developed
regions. In developing countries, more than
80% of wastewater is currently discharged
into the environment in an untreated state,
polluting rivers, lakes and coastal areas.
In 2010, less than 20% of drainage basins
worldwide contained water of suitable quality.
The quantity of good-quality water is in
substantial decline. Another dimension is added
to the problem of water scarcity by the impact
of climate change, which might undermine the
“traditional” water cycle described earlier and,
thereby, the stabilising factors underpinning the
supply of water. Changes are already discernible:
concentrated bursts of torrential rainfall, runoff
incidents, flooding, droughts and other climatic
events increased sharply during the second
half of the 20th century, supporting the widely
held perception of an intensification of extreme
weather phenomena. Based on IPCC projections,
the incidence of severe weather phenomena
should remain on a rising trend through to 2050.
The growing use of natural freshwater
reserves and the spread of pollution have
caused a relentless decline in unpolluted
freshwater resources since the middle of the
19th century, as shown in the chart below. 16
Figure 11: Change in water resources
Reduction in fossil water and pollution Human
water 100% consumption
Natural freshwater reserves The gap
varies depending on place
0% and time
-4 billion years 1800 1900195020002025
16. The “World Water Vision”, presented by The World Water
Council at the Second World Water Forum in The Hague in March
2000
PwC | 19

20 | Water: challenges, drivers and solutions | 2012

| Section II - Key players
in the water sector
value chain
In this section, we present the key players in the water
value chain: operators, system designers/integrators,
equipment manufacturers and regulators. The diverse
profiles within each main player category reflect the
enormous differences in local conditions (scope of
operations, socio-economic service backdrop) and demand
(type of customer, nature of services), which highlight
the complexity of water issues around the world.

2.1. Differing situations and needs…
2.1.1. Socio-economic service backdrop
The socio-economic service backdrop is typically
major city centres and peri-urban and rural areas,
which pose distinct constraints for operators.
Urbain area
Water management priorities in urban
areas are determined by the degree of
development of the country concerned.
In developed countries, the provision of drinking
water and sanitation in towns and cities is
facilitated by the existence of infrastructure
and networks. As such, priorities are mainly:
• network maintenance and upgrades: action
required is largely determined by the continuity
and quality of past maintenance. There is a
relative increase in costs as a result of lower
consumption and the oversized nature of
networks;
• stringent water treatment and sanitation
requirements. These requirements are
established under national or international
regulations aimed at ensuring health security for
consumers by reference to public health priorities
(for example, those enshrined for more than a
century in France’s 1902 law). Environmental
protection is a more recent addition. The Water
Framework Directive (European Union, 2000)
and the New South Wales Water Management
Act (Australia, 2000) both contain ambitious
environmental objectives (which are cited by
UNEP 17).
Many emerging countries are experiencing
massive urban expansion that is often disorderly
and uncontrolled. Key players in the water
sector are faced with inadequate - or a lack of
- infrastructure, worsening water scarcity and
the rapid deterioration of water quality. In this
context, the main challenges are as follows:
17. The Greening of Water Law: Managing Freshwater Resources
for People and the Environment, UNEP, 2010
22 | Water: challenges, drivers and solutions | 2012
• the renovation of networks or the creation of
infrastructure from scratch, involving heavy
investment;
• the overexploitation of groundwater sources
(water withdrawal from increasingly deep or
distant aquifers in quantities exceeding recharge
rates), leading to a decline in the quality of the
water withdrawn (saline intrusion), increased
catchment/pumping costs and, over the longer
term, the possible exhaustion of water resources;
• the concentration of pollution resulting from
human residential and industrial activity, leading
to risks to public health and the environment, and
to the need for large-scale sanitation facilities.
Peri-urban and rural areas
Although different overall, peri-urban
and rural areas may present a number of
similarities from an operator standpoint.
This is because in the water sector, the term
“rural” is applied not only to villages, but also
to small towns with up to tens of thousands
of inhabitants. Key characteristics include:
• disorganised town planning (peri-urban areas)
or low population density (rural areas), resulting
in the need for heavy investment and high
running costs. Operators face coverage- and
efficiency-related challenges;
• a served population characterised by low
incomes and relatively low consumption, with a
potential impact on the operator’s revenue
streams;
• essential sanitation-related challenges, given
that the service is at best limited to the collection
of wastewater, without any subsequent
treatment, or may even be non-existent.
These circumstances make it difficult for
operators to keep providing a service over
the long term. The conventional networks
managed by operators remain the exception and
therefore two main categories of drinking-water
distribution systems prevail: (i) ancestral systems
like manually-operated wells and boreholes
that are traditionally managed by communities

(associations), but also increasingly (ii) small
networks of private connections or standpipes
that are managed by small private or public
operators. Professionalisation and compliance
with standards are critical considerations for these
very small-scale providers, which are now offered
technical and financial assistance services to
help them address the difficulties encountered.
2.1.2. Scope of operations
Depending on the historical policy choices in
the country concerned, water management may
be conducted at the grassroots level (i.e., at the
local-authority level, as in France, the United
States and Germany), or at an intermediate level
(as in Brazil and the United Kingdom), or at the
national level with a single operator empowered
to delegate the management of the service (as in
Senegal and Morocco). In recent years, the trend
has been towards the decentralisation of powers
and responsibilities to local authorities, which are
best acquainted with local realities in terms of the
state of water resources and user expectations.
2.1.3. Services provided and users
Water consumption volumes are highly uneven
across use categories, which are primarily
agriculture (70% of water withdrawal), industry
(19%) and domestic (11%). Agricultural use is
excluded from this analysis of key players in
the water value chain, as irrigation, although
extremely water-intensive, is rarely a feature of
conventional operator-based water distribution.
Industrial use
Services for industrial users comprise mainly the
supply of process water (for surface treatment,
electronic components, the agri-food industries
and so forth) and the treatment of industrial
wastewater. Demand is centred on both high-
volume consumption (for example, by the cooling
systems for energy-production units, refineries
and chemical industries) and the quality of the
water to be used. Many technological processes
call for water of a precise quality, with water
purity ensured through processes like ultra/
micro/nanofiltration. Industrial requirements
also involve wastewater treatment, which may be
very complex - zero liquid discharge, treatment
of the toxic compounds (mercury, arsenic and
cyanide) present in mining wastewater by means
of coagulation and flocculation, or biological
treatment of agri-food wastewater. In addition,
wastewater recycling and reuse have become key
concerns for many water-intensive industries.
Domestic use
The two major services for domestic customers
are the (i) distribution of drinking water and (ii)
wastewater collection and treatment. The two
services may be supplied by a single operator
or may be split between several operators.
Establishing a typology of water users is far
from straightforward. However, broad country
development stages (developed, emerging and
developing) may be a useful starting point.
Users’ differing needs and income levels must
also be factored into the equation. Another
aspect is users’ perception of the two major
services provided, which may vary appreciably,
especially across country categories.
In developed countries, expectations are
demanding with regard to service quality for
drinking water and sanitation. They go hand in
hand with stringent regulations and a relatively
high ability and willingness to pay for overall
water services. However, developed countries
also have a not inconsiderable proportion of low-
income users with diminished purchasing power.
In developing countries, low-income consumers
are very numerous and are more interested in
basic water services (small volumes, water quality
compatible with health requirements). In such
countries, the vast majority of the population
has little ability to pay. Willingness to pay may
be similarly low, particularly with regard to
sanitation services perceived as secondary in
importance to access to drinking water.
PwC | 23

In emerging countries, the ranks of
the poor are still relatively swollen
and the middle class is expanding at a
rapid pace. As a result, consumers in
emerging countries have characteristics
in common with those in both
developed and developing countries.
2.2. …met by diverse players
2.2.1. Equipment manufacturers
Equipment manufacturers produce end-
to-end equipment and technologies, from
basic network components like pipes to
complex treatment and desalination plants.
Some of the equipment and technologies are
sector-specific, whereas others have wider
uses, for example, construction, measurement,
plastics, chemical and mechanical applications,
and the transport of liquids in general.
Equipment manufactured for the water sector
is mainly used for the following purposes:
• catchment and drilling (pumps);
• transport (connections, pipes, pumps, sluice gate,
filters, taps, vents, fountains, etc.);
• treatment (filters, membranes, ventilators,
stirring rods, basins, and chemical, mechanical
and biological processes);
• disinfection (clarifiers, desanders, bioreactors
and non-collective sanitation systems);
•measurement (sampling, analyses and
metrology/electronic surveillance/recording/
continuous quality monitoring equipment);
• management of industrial effluents (process
equipment).
Estimates regarding the water equipment market
vary depending on the content of sub-sector
definitions. According to the GWI’s “Global
Water Market 2011” report, the worldwide
market for industrial and domestic water
equipment is worth an estimated USD 187.5
billion. This amount breaks down as follows:
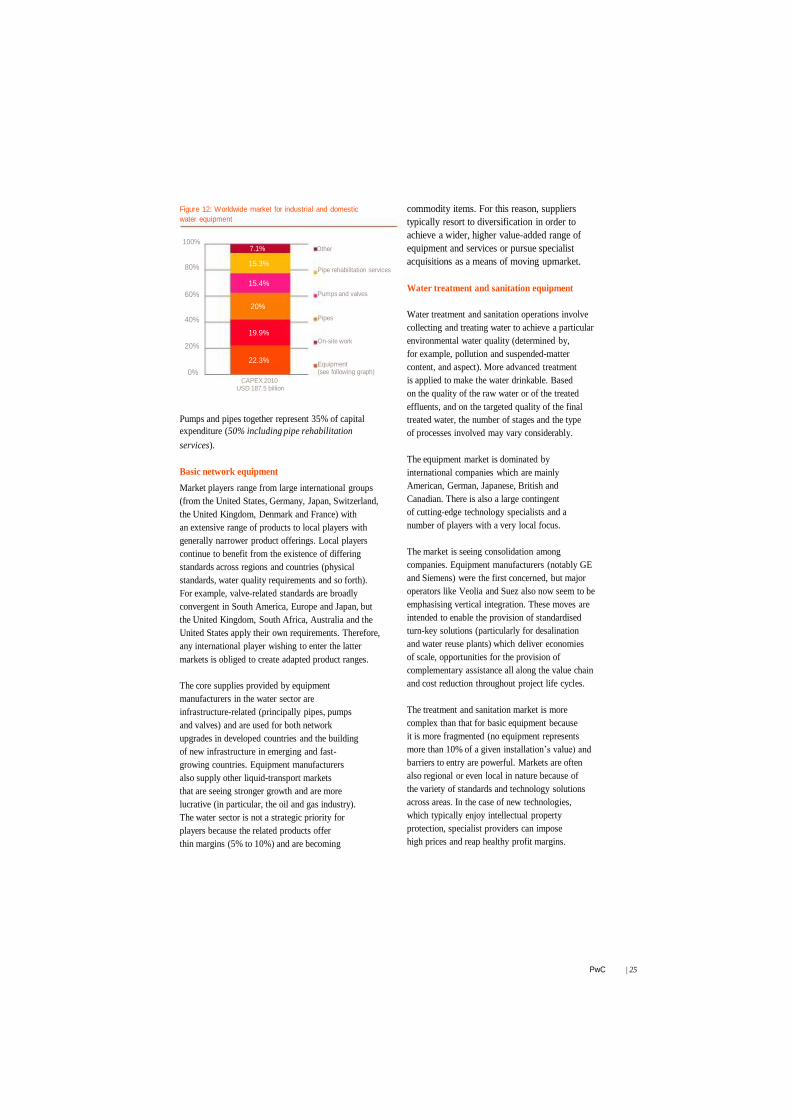
Figure 12: Worldwide market for industrial and domestic
water equipment
100% 7.1% Other
15.3%
commodity items. For this reason, suppliers
typically resort to diversification in order to
achieve a wider, higher value-added range of
equipment and services or pursue specialist
acquisitions as a means of moving upmarket. 80%
15.4%
60%
20%
40%
19.9%
20%
22.3%
0% CAPEX 2010
USD 187.5 billion
Pipe rehabilitation services
Pumps and valves
Pipes
On-site work
Equipment (see following graph)
Water treatment and sanitation equipment
Water treatment and sanitation operations involve
collecting and treating water to achieve a particular
environmental water quality (determined by,
for example, pollution and suspended-matter
content, and aspect). More advanced treatment
is applied to make the water drinkable. Based
on the quality of the raw water or of the treated
effluents, and on the targeted quality of the final
Pumps and pipes together represent 35% of capital
expenditure (50% including pipe rehabilitation
services).
Basic network equipment
Market players range from large international groups
(from the United States, Germany, Japan, Switzerland,
the United Kingdom, Denmark and France) with
an extensive range of products to local players with
generally narrower product offerings. Local players
continue to benefit from the existence of differing
standards across regions and countries (physical
standards, water quality requirements and so forth).
For example, valve-related standards are broadly
convergent in South America, Europe and Japan, but
the United Kingdom, South Africa, Australia and the
United States apply their own requirements. Therefore,
any international player wishing to enter the latter
markets is obliged to create adapted product ranges.
The core supplies provided by equipment
manufacturers in the water sector are
infrastructure-related (principally pipes, pumps
and valves) and are used for both network
upgrades in developed countries and the building
of new infrastructure in emerging and fast-
growing countries. Equipment manufacturers
also supply other liquid-transport markets
that are seeing stronger growth and are more
lucrative (in particular, the oil and gas industry).
The water sector is not a strategic priority for
players because the related products offer
thin margins (5% to 10%) and are becoming
treated water, the number of stages and the type
of processes involved may vary considerably.
The equipment market is dominated by
international companies which are mainly
American, German, Japanese, British and
Canadian. There is also a large contingent
of cutting-edge technology specialists and a
number of players with a very local focus.
The market is seeing consolidation among
companies. Equipment manufacturers (notably GE
and Siemens) were the first concerned, but major
operators like Veolia and Suez also now seem to be
emphasising vertical integration. These moves are
intended to enable the provision of standardised
turn-key solutions (particularly for desalination
and water reuse plants) which deliver economies
of scale, opportunities for the provision of
complementary assistance all along the value chain
and cost reduction throughout project life cycles.
The treatment and sanitation market is more
complex than that for basic equipment because
it is more fragmented (no equipment represents
more than 10% of a given installation’s value) and
barriers to entry are powerful. Markets are often
also regional or even local in nature because of
the variety of standards and technology solutions
across areas. In the case of new technologies,
which typically enjoy intellectual property
protection, specialist providers can impose
high prices and reap healthy profit margins.
PwC | 25

The “Equipment” category referred to in
Figure 12 may be broken down as follows:
Figure 13: Breakdown of worldwide equipment market
100% 3.2% Membranes
Figure 14: Water technology valuation continuum, 2008
20 Desalination, 20x
Filtration, 17x 4.8% 6.6%
80% 6.9% 8.6%
60% 16.5%
40% 25.4%
20% 28%
0% CAPEX 2010
Meters
Diversions and screens
Disinfection
Filtration systems and media
Mud treatment
Standard process equipment
Other
14
8
2
UV, 18x Treatment, 16x
Test, 16x
Automation, 13x Pumps, 9x Valves, 10x
Infrastructure / Pipes, 8x
Less Embedded water technology and growth More
USD 43 billion
Standard process and mud treatment equipment
represent more than 40% of the market. Next in
line are filtration systems, disinfection equipment,
and diversions and screens, each with 7% to 9%
of the market. Meters and membranes represent
respectively nearly 5% and 3% of demand.
Conventional treatment technologies like chlorine
treatment still account for the bulk of market
volume. However, complementary advanced
treatments, new disinfection solutions and the
intelligent technologies developed in recent
years (for example, UV, nano/ultrafiltration,
membranes, desalination, water reuse, energy
efficiency-enhancing equipment for installations
and intelligent measuring tools) all offer strong
added value and should see robust growth
of nearly 20% annually in some cases.
The Goldman Sachs water technology valuation
continuum 18 is presented in the chart below.
It shows a pronounced valuation differential
between companies based on the technologies
used, with an EV/EBITDA multiple 19 range of 8x
to 20x for basic equipment and new technologies.
18. Source: Goldman Sachs 2008, The Essentials of Investing in
the Water Sector; version 2.0
19. Ratio between LTM EV (Last Twelve Months Enterprise Value)
and EBITDA (Earnings Before Interest, Taxes, Depreciation and
Amortisation)
26 | Water: challenges, drivers and solutions | 2012
In developed countries, demand is supported by
increasingly stringent regulations and growing
public awareness of risks concerning water
quality (diseases, epidemics and so forth). In other
regions subject to severe water stress or intensive
urbanisation, new technologies are embraced
as a means of enhancing water supply coverage,
responding to public health concerns and ensuring
better quality of life. In particular, demand for
testing and measuring devices should be boosted
by regulatory requirements (for example, in
respect of new contaminants) and by the need
to assess the efficiency of water management.
We have chosen to focus here on two particularly
promising areas of technological innovation -
wastewater reuse and water desalination.
Wastewater reuse involves the collection
and treatment of effluents with a view to new
applications: recharge of groundwater layers,
rivers and oceans; industrial uses; irrigation;
cooling/heating systems; and even drinking water.
It is a means of limiting resource consumption
(provided that prices are appropriately adjusted)
and at the same time of avoiding the discharge
of dirty or polluted water into the environment.
Thanks to the progress made with advanced
treatment technologies, wastewater reuse is now
a technologically feasible solution. Those most

concerned include membrane manufacturers
and system providers (notably Asahi, Dow,
Eimco, GE Zenon, Hydranautics, Hyflux, Koch
Membrane Systems, Kubota, Norit X-Flow, Pall,
Siemens Memcor, Toray and Woongjin); suppliers
of UV disinfection solutions and other advanced
treatments (for example, Atlantium, BWT,
Degrémont Ozonia, Fuji, ITT Wedeco, MIOX,
Mitsubishi Electric Power Products, ProMinent,
Severn Trent Services, Siemens Water Technologies
and Trojan UV); designers and/or integrators
(for example, AECOM, Black & Veatch, CDM,
CH2M Hill and MWH); and operators of water
purification plants (in particular, Acciona, Acwa
Services, Aqualia, Befesa, Biwater, Degrémont,
GE Water, Hyflux, Keppel Seghers, Siemens
Water Technologies, Veolia Water Solutions &
Technologies and Wabag). The expertise applied
is derived from other applications, none of which
is wastewater recycling-specific (a factor that
makes it difficult to define sector boundaries).
In practice, the growth of the wastewater
reuse market is indirectly beneficial to an even
larger swath of companies encompassing all
equipment manufacturers involved in water
transport, water treatment and sanitation.
Wastewater reuse is practised in the United
States, Australia, Asia, the Persian Gulf and
the Mediterranean Basin (reuse of urban
wastewater in agriculture), and is largely the
norm in Israel (recycling of 70% of sewage).
Demand for wastewater reuse is growing strongly
worldwide. It is estimated that the volume of
recycled water will virtually double over the
next five years. According to recycling experts,
demand growth will be uneven across regions.
It should be very strong (40% to 60%) in areas
subject to severe water stress (Spain, Italy and
Australia) or intensive urbanisation (China) and
strong in industrialised countries (about 25%).
The main obstacles to massive expansion for
drinking water purposes are public unwillingness
to use water obtained from effluents and the high
financial cost involved, which is a deterrent to
risk-taking on the part of customers. Nevertheless,
on islands, in coastal towns and in areas where
the available supply of water is limited, or in
the event of water use conflicts, wastewater
recycling is an increasingly attractive option.
Desalination is the process of removing salt and
other minerals from water (sea water, brackish
water, river water, purified water and so forth).
The main technologies used are distillation and
reverse osmosis. Desalination currently meets
less than 0.5% 20 of water needs worldwide. This
apparent under-utilisation may seem astonishing,
given that one-quarter of the world’s inhabitants
live less than 25 km from a coast. However,
although salt water is both abundant and easily
accessible, there are two other requisites for
the installation of desalination facilities:
• the capacity to finance capital expenditure and
operating costs above levels for conventional
solutions;
• the absence of less costly alternatives.
Although desalination-related costs have fallen
considerably (operating costs are now one-
quarter of what they were 30 years ago), the
technology is still relatively expensive. It is also
overly energy-intensive, despite the improvement
achieved in recent years (to 4 kWh/m3 currently
versus about 8 kWh/m3 in the 1990s, with
a target of less than 2 kWh/m3 by 2015).
Desalination providers include Energy Recovery
(ERII), Degrémont, VWST and SITEM (for
heat-sourced desalination, in particular).
Another sticking point for desalination projects is
the matter of environmental and socio-economic
impacts, which can delay the granting of plant
permits. Concerns focus primarily on the impact
on marine life (from the discharge of brine
or the entanglement of marine organisms in
intake structures) and secondarily on potential
local opposition to development projects
made possible by the availability of water.
Desalination is nevertheless gaining currency in
coastal areas affected by severe water stress, with
demand growing at a nearly 10% annual pace.
20. Source: GWI, Global Water Market 2011

2.2.2. Designers/integrators
Designers/integrators provide engineering
and construction services for the installation
of equipment ranging from simple networks
to highly complex treatment facilities.
The line between companies that provide
engineering and construction services and
operators is increasingly blurred. This is because
engineering and construction providers have used
the expertise acquired in a particular technology
to lay claim to a number of markets in an operator
capacity. It is, therefore, more appropriate to
distinguish between international and local
companies which provide pure construction and
engineering services that may or may not be water
sector-specific, on the one hand, and companies
which also have the capacity to act as operators,
often in the sphere of treatment facility activities.
In recent times, the application of technologies
like desalination has enabled a number of
construction companies to develop operator-
type skills. Such companies include the Spanish
players mentioned later in this report in the
operator category and Singapore-based Hyflux.
28 | Water: challenges, drivers and solutions | 2012
2.2.3. Operators
Operators manage water services, i.e., the
supply of drinking water to consumers and/
or the management of resulting wastewater.
There are three major operator categories: public,
private and a combination of the two. The vast
majority of the global population is currently
served by public operators. However, since the
late 1990s, there has been a steady increase in
private operators’ share of global consumers.
Based on the most recent data available 21, the
proportion of the global population served by
the private sector in 2011 was 13% versus 5% in
1999. This means that the private sector’s share
of water management has more than doubled
in the space of a decade. The percentage is
expected to reach 16% in 2015 and 21% in 2025.
Public operators
The vast majority of the global population
is currently served - and will continue to be
served - by the public sector. A public operator
is defined as an organisation that is majority-
owned and controlled by the government.
Public operators may work within several
frameworks. Firstly, there is the decentralised
approach, corresponding to the widespread
model for municipal water management. There
are also parastatal-type public entities, which
have autonomy, but are subject to specific
legislation. Finally, there are public companies
that resemble conventional businesses, but their
shares are owned by local, regional or national
authorities. Their organisational structure
is typically like that of a private company
and they may be subject to private law.
21. The estimates and market shares concerning served
population cited in this section are derived from the Pinsent
Masons Water Yearbook 2010-2011. They take account of
inhabitants with drinking water and/or sanitation services
provided by a private operator

The World Bank 2006 report entitled
“Characteristics of well performing public
water utilities” describes the features that have
accompanied the spiralling decline (to varying
degrees) in public operators’ performances in
many countries. Such features are low tariffs
and low payment collection; inefficient water
use by consumers, cost inflation from high
consumption and substantial system losses;
postponed infrastructure investment and
maintenance; service deterioration; consumers’
lessening willingness to pay; operators living
off state subsidies; autonomy and incentive loss
by managers; a consistent decline in service
efficiency; increasing demand for subsidies, which
often fail to materialise; operators unable to pay
wages; and recurrent costs. Over time, assets and
service quality deteriorate, generating future
financing requirements of considerable proportion.
The two chief difficulties encountered in the
public management of water are low government
inducement for operators to perform and operators’
dependence on the government’s overall fiscal
situation, resulting in a lack of financial autonomy.
In such circumstances, business management
is dictated by short-term political interests that
do nothing to enhance service efficiency.
The World Bank report also outlines the
characteristics shared by public operators currently
considered to be well performing. They include a
degree of external autonomy (monitoring of cost
recovery, capacity to recruit and retain competent
staff at competitive salaries); performance targets
underpinned by KPIs (indicators assessing service
continuity, water quality, the level of receipts
and complaints handling) and by external
financial audits; internal financial management
accountability (performance-based remuneration
of management and employees, annual staff
appraisals and staff training); market orientation
(outsourcing of certain functions, benchmarking
in various spheres like customer satisfaction and
service quality); and customer orientation (opinion
polls, provision of timely information to customers,
response to customer complaints). Examples of
well-performing operators provided in the report
are PUB in Singapore, the Philadelphia Water
Department in the United States, SANASA in
Brazil, SONEDE in Tunisia and Uganda’s NWSC.
In developed countries, some public operators
have strengthened their technical and managerial
expertise by taking on employees of private
companies upon the expiry of certain delegated
management contracts. In certain places, this has
led to a degree of remunicipalisation of water and
sanitation management in the wake of delegation
to the private sector. In the coming years, it
will be interesting to observe the sustainability
of that trend based on the performances of
local government-operated waterworks,
particularly as regards the management of
assets, service quality and water tariffs.
Private operators
Two main models are used in the case of
management by a private operator:
• Total privatisation of service and infrastructure:
the United Kingdom and Chile are the only two
countries to have opted for the total privatisation
of their water sector, a decision made in both
countries in the late 1980s. Regulation is assured
by an independent regulatory body - the Office
of Water Services (OFWAT) in the United
Kingdom and the Superintendencia de Servicios
Sanitarios in Chile.
• Delegation of public water and sanitation services
to the private sector: this is the prevalent form of
private-sector participation in water management.
The extent of the private operator’s involvement
varies depending on the business model adopted
and the contract framework. However,
infrastructure always remains the property of the
authorities (or returns to ownership by the
authorities upon contract expiry in cases where
investments have been made by the private
operator during the term of the contract). There
are many, varied approaches to public service
delegation, which are dealt with in Section III.
PwC | 29
Since 2000, the private sector has undergone
profound changes. Operators of highly distinct
sizes encompassing two international giants,
national and regional operators, and private,
family-owned, small-scale players populate the
sector. Changes in the private operator landscape
have been accompanied by equally marked
shifts in strategy during the past decade.
In 2001, the “big five” (France’s Suez, Veolia
and Saur, Germany’s RWE and Spain’s Aguas de
Barcelonas 22) accounted for 73% of the population
served by the private sector, but their overall
market share had fallen to 31% by 2011. In that
year, Veolia and Suez each had nearly 125 million
customers, corresponding to 27% of the population
served by the private sector. Other notable players
making headway include FCC of Spain and SABESP
of Brazil, which each hold 3% of the market (i.e.,
the present combined market share of Saur and
RWE), and four Chinese operators (Shanghai
Industrial Holdings, Beijing Capital Co., Beijing
Enterprise Water and Chongqing Water Group)
with a combined market share of close to 10%.
The past decade notably marked the end
of market domination by the historically
present multinationals and the rapid rise of
national operators in developing and emerging
countries. A more detailed overview of these
private operators is provided in Section III.
Community and associative management
In the rural and semi-urban areas of developing
countries, water management may also be
provided at the community level. The traditionally-
informal nature of this ancestral approach to
water management has been changed by the
mid-1990s emergence, especially in Sub-Saharan
Africa, of entities with a clearer legal status,
such as consumer associations and management
committees. Such bodies aim first and foremost
to provide water services and represent users.
22. Aguas de Barcelonas (Agbar) has been a subsidiary of Suez
Environnement since May 2010
Mali and Benin, for example, have each seen the
establishment of an association of water users
(Association des Usagers de l’Eau - AUE) for the
purposes of promoting community drinking-
water supply systems and managing equipment.
In Senegal, several hundred operating permits
have been granted to associations of borehole
users (ASUFOR) since 2000. Such associations
remain very popular in Senegal, but Benin has
now introduced tripartite delegated management
contracts involving regional authorities, consumer
associations and private delegated managers.
However, the trend since the mid-2000s has
been towards delegating the role of operator to
private players rather than to associations, with
a view to aiding the professionalisation of water
services and thereby improving performance.
Associative management poses a number of
constraints. The participatory approach adopted
has the merit of allowing local populations to
express their views and thereby provides deeper
insight into users’ needs. However, mainly because
of their small scale, associations generally have
relatively limited technical skills and financial
wherewithal - a situation inhibitive to equipment
extension, upgrade and maintenance. If their
members are well trained, associations can easily
perform water distribution, but production is a
more complex matter. Assistance with technical
and financial issues is absolutely essential, and
advisory and monitoring units have been set
up to support associations in those fields. For
example, a technical and financial monitoring
service (STEFI) has been introduced in Mali and
subsequently in Chad and Niger. These monitoring
services are performed by private providers in
exchange for a fee factored into the price of water.

2.2.4. Regulators
The role of regulators is to establish and
enforce the rules governing the water sector.
This role embraces issues concerning water
prospecting and conservation; pollution
assessment and reduction; regulation of water
use; regulation of water tariffs; compliance
with health and water quality standards;
access to water; consumer satisfaction
levels; and infrastructure maintenance.
The role and prerogatives of regulators fall
within the province of governance, which
is dealt with later in this document.
Regulation, a necessity for the water sector
The water sector is a natural monopoly of a local
nature with a very low exposure to competitive
pressure as a result of the global and/or local
oligopoly formed by operators. Market forces
consequently cannot be relied upon to ensure
efficiency and optimal pricing. As such, regulation
is essential for the attainment of long-term
policy objectives, the equitable treatment of all
stakeholders and the protection of users (especially
the poor) from possible unfair practices by private
water operators. Regulation also serves to protect
the private sector from arbitrary political decisions.
Although approaches tend to be country-specific, it
is possible to identify common strands, as follows:
• There is no systematic correlation between a
given country’s institutional organisation (for
example, a federal structure) and the
organisation of sector regulation.
• There is no blueprint for defining the roles and
responsibilities of the various ministries and
government levels involved in the water sector.
However, observable trends include:
- the decentralised application of public policies,
not necessarily accompanied by an increase in
the financial and technical resources allocated
to regional/local authorities;
- a preference for water management at
basin level;
- the implementation of a coordinated framework
at the national level (supervisory ministry,
interministerial entity or mechanisms,
dedicated coordination entity), with a view to
improving information exchanges and avoiding
overlaps between areas of responsibility;
- increased recourse to the private sector in some
countries, for two main purposes: (i) the
operation of infrastructure and, in some cases,
infrastructure investment to counter public
spending cutbacks; and (ii) the securing of
technical and managerial expertise.
International supervision
The existence of transboundary rivers makes
it necessary to achieve cooperation among
several countries with regard to the exploitation
and conservation of water resources. Such
cooperation is key to sustainable water
management and, in some instances, to stability
between countries at risk of water stress.
Access to water resources is, therefore, an
issue of growing geopolitical importance.
At the World Summit on Sustainable Development
held in Johannesburg in August 2002, the
United Nations Organisation (UNO) established
a number of guiding principles for application
worldwide, notably concerning access to
drinking water and sanitation facilities. The
organisation also formulated the Millennium
Development Goals and is spearheading a large
number of water-related agreements, the terms
of which are to be transposed subsequently into
national law in countries around the globe.
Organisation of players at the national level
The allocation of roles and responsibilities
for national regulatory purposes is often
determined largely by a law or act specific
to the water sector. The three most common
forms of regulatory body are as follows:
•Ministry or government agency: the Israeli Water
Authority (part of the Ministry of National
Infrastructure), for example, formulates policies,
assures policy implementation monitoring, and
performs water distribution and sanitation
planning at the national level. Its mandate
includes the allocation of resources (drinking
water, recycled water and sea water) to uses
(agricultural, industrial and domestic), and the
recommendation and application of quotas,
regulations and tariffs based on the type of use.
PwC | 31

• Dedicated agency with broad regulatory powers
in the sphere of water, with varying degrees of
financial and/or political autonomy: this form of
regulatory body is generally used for
infrastructure-related services (water
distribution and sanitation) and is intended to
protect users and enhance efficiency. Agencies’
duties may include tariff approval, information
system management, the conduct of comparative
analyses of distributors and complaints handling.
In the United Kingdom, for example, the Office of
Water Services (OFWAT) is responsible for
economic regulation of water management,
which is entirely privatised. Two other bodies
play a role in water regulation - the Environment
Agency (in charge of environmental issues) and
the Drinking Water Inspectorate (in charge of
health issues).
• National body with specific regulatory powers: in
France, no single entity has powers as extensive
as those of OFWAT. Economic regulation is
provided by several parties. Parliament defines
the tariff-setting procedure and regulates the
Water Agencies’ revenues, but water pricing is
local and is decided jointly with local
government (with roughly 20% of the price
decided by other parties, including the Water
Agencies). The National Office for Water and the
Aquatic Environment (ONEMA) is responsible for
research and evaluation concerning the condition
of water resources and the aquatic environment
at the national level. ONEMA is involved in
regional water policy planning and in the
verification of regulatory compliance.
32 | Water: challenges, drivers and solutions | 2012
Institutional framework
Institutional frameworks reflect the history
and political organisation of countries. The
institutional framework may be determined by
one or more laws or even by the Constitution, or
may be organised in an ad hoc manner. However,
water issues are essentially local in nature and
are shaped by geographical and hydrographical
characteristics. This explains the generally
decentralised approach to water management.
Following a survey covering 17 countries,
the OECD has identified categories based on
the allocation of roles and responsibilities
at regional and local levels.
• Central players: these are mainly federal states
with pronounced geographical and hydrological
disparities or strong regional characteristics.
They are federation member-states and are in
charge of allocating water resources and
regulating water use.
• Joint role with central government: most often,
there is a national framework for the definition of
water-related priorities (by means of laws,
decrees and so forth). Prerogatives are then split
between regional/local and national policy-
makers. In France, for example, the Ministry of
Ecology formulates and coordinates the national
water policy, but water distribution and
sanitation services are the responsibility of local
authorities.
•Mainly in charge of implementation: there are
countries where local authorities act as
intermediate users. They purchase water from
the national system and then sell it to end-users.
There is no participation at intermediate
government levels. All is decided and managed at
the central government level and there is no
management system at basin level.

Particular case of small local operators
In the case of small local (and often informal)
private operators, especially in Sub-Saharan Africa,
regulations - when they exist - frequently cannot
be implemented because of a lack of monitoring
and penalty-enforcement resources. However,
some countries have set up national bodies to
coordinate policy in certain areas of the water
sector. In Mauritania, for example, small private
operators provide services in small towns with a
low population density and where scant economies
of scale limit larger operators’ presence. A national
body has been created to manage contract awards.
In Mozambique, small private players operate in
areas bordering those served by large operators,
for example, peri-urban areas like the Maputo
suburbs. In such places, the task is to regulate the
interface between the official operators and their
informal counterparts, not least of all to ensure
the long-term survival of the small providers. The
challenge for the regulator is to strike a balance
between the scope, purpose and implementation
of the rules imposed, on the one hand, and
allowing the market a degree of flexibility, on
the other hand. In practice, flexibility is central
to the success and survival of small operators.

34 | Water: challenges, drivers and solutions | 2012

| Section III -
Private operators: competitive forces, models and risks
The landscape of the water sector and the competitive
forces that shape the industry have changed profoundly
during the past 15 years. There are now four major
categories of private operators worldwide: the two major
players, European operators, operators in emerging and
developing countries, and small private companies.
Private operators have very varied operating formats,
which likewise are evolving rapidly in order to contain
the numerous risks associated with water management.
PwC | 35

3.1. The majors: Veolia Eau and Suez Environnement
Profiles of the Veolia and Suez groups
Veolia and Suez started out in a very similar
manner. They can each be traced back to the
mid-19th-century creation of a company to
provide water, gas and lighting services. The
nationalisation of France’s energy sector in the
wake of World War II enabled the two groups,
originally known as Compagnie Générale des
Eaux in the case of Veolia and Lyonnaise des Eaux
in the case of Suez, to refocus on water-related
activities and become global-scale leaders.
Development strategy implemented to date
Veolia
Veolia Eau is the world’s top private water
operator, providing a water supply to 100 million
people and sanitation services to 71 million
people. The company boasts a decentralised,
global organisation as well as a more centralised
subsidiary. There are six large operating
management units, reflecting the geographical
markets in which the company has operations,
and the Veolia Water Solutions and Technologies
(VWST) subsidiary, which specialises in
engineering, and the design and construction of
turn-key plants and technology solutions. Veolia
Eau manages roughly 40% of drinking-water
services and 28% of sanitation services in France.
Its Veolia Water North America subsidiary is the
leading operator in North America. In China, Veolia
built market share first in major cities and then
gradually in secondary cities, and is now the largest
private company in that country’s water sector.
Veolia’s global leadership is attributable to a
number of factors. These include the group’s
focus on research and development and
managing large-scale, long-term contracts
and the VWST subsidiary’s positioning as a
relatively centralised entity specialising in water
technologies, which has helped establish Veolia
as a frontrunner in cutting-edge technologies.
Veolia Eau is currently realigning its business base.
Signs are that the strategic emphasis in the coming
years will be on achieving an optimal balance
between growth and profitability, in particular
through the reorganisation of activities around
local-authority contracts which mobilize large
amounts of financial resources and the search
for contracts with lower capex requirements. To
this end, the group intends to accelerate its cost
reduction plan, while continuing to allocate major
resources to R&D activities, and move ahead with
its programme of disposals, including the sale of
the United Kingdom-based regulated activities.
After the recent acquisition of United Utilities,
little additional acquisition activity is planned.
Priority will be given to value-creating organic
growth, through the conquest of new markets and
the strengthening or consolidation of established
positions (in France, China and North America).
Organic growth will also be sought in the high
value-added environmental services market,
where demand is on a rising trajectory and
supply is still scarce. For this purpose, particular
emphasis will be placed on major manufacturers
in emerging countries, thanks to an increasing
focus on key account management policies,
and on adapting the French model of delegated
management to other European countries and
the United States. The Veolia Group is also
present in Latin America, through partnerships.
Suez Environnement
Suez Environnement is the world’s second-
largest private water operator, providing water
and sanitation services to 91 million and 61
million people, respectively. In addition, 1 billion
inhabitants benefit from services provided by
water treatment plants built by Degrémont. Suez
Environnement’s activities are centred on water
and waste management. The group’s strong
presence in France and abroad is founded on large
companies with clearly-defined geographical bases,
for example, Lyonnaise des Eaux in France (no. 2
after Veolia), Agbar in Spain (no. 1) and United
Water in the United States (no. 2 after VWST).
Since the 1990s, Suez has endeavoured to enter
a number of higher-risk emerging countries in
order to overtake archrival Veolia. For a certain
time, the strategy enabled the group to take the
lead in terms of population served. However,
the repercussions of the 1998 Asian crisis and
of the devaluation of the Argentine peso in the

2000s will doubtless lead to a withdrawal from a
number of emerging markets, particularly some
Latin American countries and the Philippines. In
addition to suffering heavy financial losses, Suez
has opted out of many contracts (Buenos Aires,
Santa Fe, La Paz El Alto, Atlanta, Puerto Rico, Tuas
in Singapore, Manila and Ho Chi Minh City). The
group still has footholds in China, Morocco and
Eastern Europe. The current strategy, of a more
conservative nature, is founded on two guiding
principles: low risk and low capital exposure
(or even withdrawal). This suggests that Suez is
now more interested in financial stability and
performance predictability than in growth.
Degrémont, the Suez subsidiary which
builds treatment plants, has a strong
reputation worldwide and remains
active in international markets for water,
desalination, sanitation and recycling.
3.2. Other large European companies and their international ambitions
Saur, France’s third-largest operator, and FCC/
Aqualia of Spain are present in their home
markets, in other European countries (Italy,
Portugal, Poland and the Czech Republic) and
on other continents, mainly in the Middle East,
North Africa and China. RWE, one of the few
electricity operators still with a presence in
the water sector, has exited a large number of
international markets since 2004 and is now
focused on Germany and Eastern Europe. Italy’s
Acea is present mainly in its home market and
in Latin America, where it intends to remain.
Proactiva, the joint venture between FCC
and Veolia, and Aguas de Barcelona (Agbar
- Spain), which is now a subsidiary of Suez
Environnement, are very present in Latin
America. The Latin American region is Proactiva’s
main focus. Agbar is on the look-out for new
contract opportunities in Brazil, Peru and Chile,
having established operations in China, North
Africa and the United Kingdom since 2006.
In the case of British companies, regulations
were tightened in the early 2000s and assets
are now predominantly owned by investment
funds. Nearly all British operators have forgone
international contracts in recent years. Only
three companies still have contracts outside
their home markets - Anglian Water, whose
sole foreign base is in Ireland, and Biwater
International and Severn Trent, which
have maintained their strategy anchored in
service contracts not requiring substantial
investment for the US and Italian markets.
Thanks mainly to its expertise in water treatment,
Remondis Aqua (Germany) is rapidly expanding
its business base in Europe (Spain and Poland),
Turkey, Russia (where it has become the first
foreign operator to win a PPP contract) and
India. Also noteworthy are Spanish construction
companies (including Cadagua, Acciona Agua,
OHL and, more recently, clean-technology
specialist Abengoa), which are making
strong progress and have won concessions
for desalination plants on all continents.
PwC | 37

3.3. A new breed of player: private operators from emerging and developing countries
Two figures 23 perfectly capture the emergence
of these new players during the past 10 years. In
2001, five international operators (Veolia, Suez,
Saur, Agbar and Thames Water) shared more than
80% of the population served by private operators
in developing countries. It is estimated that in 2008
national private operators in developing countries
served more than 40% of that population segment.
Figure 15: Share of population in developing countries served
by private operators, 2009
Three principal factors are at work here
a) Strong skills acquisition by local operators
(which are often construction players or industrial
diversification-minded industrial conglomerates),
thanks to knowledge transfer under successful
partnerships with international operators (the
case of Manila Water in the Philippines), or to
the recruitment of experienced employees with
a public-service background (as in Colombia),
or to technical assistance received from a
recognised foreign operator (for example, the
assistance provided to the Salta concession in
Argentina by Brazilian operator SANEPAR).
23. Water operators from emerging markets: new players for
public-private partnerships, GRIDLINES (World Bank), June 2010
38 | Water: challenges, drivers and solutions | 2012
In Latin America, national operators have gained
ground over the years, especially in Colombia,
Chile and Brazil. In Russia, two energy groups
(Rosvodokanal and Russian Communal Systems)
have become credible water operators and have
received generous funding from the EBRD. In
India, giant conglomerate Tata’s JUSCO subsidiary
operates in cities with several hundred thousand
inhabitants (Jamshedpur, Mysore and a sector
of Calcutta). In China, financial conglomerates
like Beijing Capital Co., infrastructure groups
like Shanghai Industrial Holdings and Cheung
Kong Infrastructure, and design/engineering
players like Shanghai Urban Construction
Group are expanding at a spectacular pace in
the water sector. In Brazil, SABESP, São Paulo
State’s water utility, has been partially privatised
since 2002 and its shares are traded on the
São Paulo and New York stock exchanges.
b) The undeniable success of certain local operators
with regard to improving access to water and water
service quality. Notable examples are Manila Water
in the Philippines, Conhydra in Colombia and
SABESP in Brazil, which is recognised as one of
the most financially solid operators in the region.
c) The withdrawal by major operators from
markets posing political and institutional risks,
which has given operators from developing
countries the opportunity to achieve significant
market share gains. The erstwhile pre-requisite
of historical expertise in water management has
been gradually superseded by an understanding
of socio-cultural issues, stakeholders, and
local political and regulatory imperatives.
These operators have also displayed broader
regional ambitions in recent years. Emboldened by
their success at the domestic level, some players
are looking to win contracts in neighbouring
geographical markets. LatinAguas of Argentina is
present in Peru. Manila Water of the Philippines
operates in Vietnam and India, and has set its
sights on China and Indonesia. Ranhill Utilities
of Malaysia is present in China and Thailand.

3.4. Emergence of small private operators
Small private operators are typically owned by
individual entrepreneurs or families. They differ
from small community- and association-managed
operators, which have served and continue
to serve in a largely transitional capacity.
Some regions and/or populations (chiefly in
peri-urban and rural areas, but also in urban
areas) are not served by the principal operator
categories presented above, mainly because of a
lack of flexibility and responsiveness on the part
of such providers and/or because of economic
considerations. The gap has been bridged by a
bevy of small formal or informal operators, of
which more than 10,000 were reported by the
World Bank in 2005. Their principal characteristic
is that they meet needs which are not (or are not
yet) addressed by traditional operators, i.e., the
“minimum” needs of low-income populations
and demand from newly-built residential areas
not yet connected to the mains. Such small-
scale players provide essential access to water
services for millions of people around the
world. In 2006, the OECD estimated that small
operators supplied about 25% of the urban
population in Latin America and Southeast
Asia and 50% of Africa’s urban population.
Russia’s Rosvodokanal operates in Ukraine and
the China Gezhouba Group Corporation has won
a sanitation contract in Nouakchott, Mauritania.
In Africa, a number of public operators likewise
have ventured beyond national borders
and have become private operators in other
countries on the continent. Examples include
Morocco-based ONEP’s projects in Cameroon
and assignments performed in Ghana by South-
Africa-based Rand Water in partnership with
Vitens-Evides International of the Netherlands.
Small operators fall into two main categories
based on service area - urban or rural. In urban
areas, they are generally responsible only for
water distribution, under the aegis of an official
operator (as in Abidjan, Manila and Ho Chi Minh
City). There is an observable growth trend in the
participation of such micro-services/mini-networks
backed by larger-scale operations. In rural areas,
small operators engage in both production, based
on a proprietary supply source, and in distribution,
as independent players either subject to regulation
(by the national operator or government) or with
completely informal status. In semi-urban areas,
a variety of situations may be encountered.
Small operators’ principal strength lies in the
provision of flexible, tailored services that
exactly match specific needs. Providers are
close to the consumers that they serve; they
know users’ requirements and constraints,
and are commercially savvy. This enables
them to offer specific services for users outside
conventional operators’ remit, including small-
volume supply, household access to water and
even filtered water, bottled water and ice.
However, because of the often very informal nature
of the activities performed, the prices charged
by small operators are frequently high: for lack
of a long-term investment strategy, profitability
maximisation becomes paramount. In addition,
small operators have difficulty accessing loans and
consequently have to commit equity capital, with
the result that rapid return on investment becomes
an absolute priority. Other areas of concern are
water quality control, together with inadequate
governance potentially leading to corruption-
induced cost overruns that are then reflected in
tariffs. Professionalisation is clearly essential and
will be aided by the organisation of technical and
financial assistance and regulatory oversight for
small operators. Negotiations between players and
public authorities are at different stages across
countries. In Laos and Madagascar, a formal
framework is in the pipeline. In Mauritania, small
operators already have official recognition under
the water code, since nearly 100% of drinking-
water supply networks in the country’s rural
and semi-urban areas are managed by stand-
alone private operators. Widespread discussion
is in progress concerning ways to promote the
financing, monitoring and control of these all-
important providers of drinking-water services.
40 | Water: challenges, drivers and solutions | 2012
3.5. Models and risks
During the past two decades, the myriad
constraints applicable in the water sector
have given rise to various forms of delegated
management of public services by the private
sector, which have been tested in practice.
The constraints notably include local realities
(degree of knowledge of the state of the
network, level of investment required), social
limitations (users’ demands as well as ability
and willingness to pay), economic constraints
(currency risk depending on the currency in
which debt is denominated, devaluation risk)
and regulatory considerations (requirements in
terms of drinking-water quality and wastewater
treatment or foreign investment compulsorily
through legally mandated vehicles, as in China).
Depending on the nature of the contract,
the extent of private-sector involvement
varies, from the lowest level (technical
assistance) to the highest (concession
arrangement). The scale and range of
risks incurred by the private operator are
correlated to the degree of involvement.
In the case of technical assistance contracts, the
operator undertakes to provide services for a short-
term period (less than two years) in exchange for a
pre-determined fee. Services covered include meter
installation, invoicing and payment collection.
The associated risk for the operator is very low.
In the case of a management contract, the
authorities delegate responsibility for service
operation and maintenance to the operator for a
period of three to five years. If the operator’s fee is
pre-determined, the operator has no commercial
risk - and little incentive to improve service
performance. Alternatively, if a portion of the
operator’s fee is based on performance in terms of
service quality and efficiency gains, the operator
bears a portion of the commercial risk. The public
authorities retain financial responsibility for the
service and all related capital expenditure, and
employees retain civil-servant status. Management
contracts of this kind are increasingly common and
allow the transfer of know-how from the private

sector to the public sector. The management of
water services can thus be optimised in a climate
of trust between the two parties, without excessive
involvement on the part of the private sector.
Another advantage concerns the problem of public
water operators’ lack of motivation to enhance
service quality, as mentioned above. Contracts
with a performance-based fee can help here by
encouraging the spread of operating-efficiency
good practices, notably in respect of water loss
reduction, payment collection and workforce
productivity. In developing countries especially,
such contracts have the potential to aid public
service reform by providing a transitional period
during which management capacities within
the public service are strengthened through
temporary recourse to private-sector expertise.
In the case of a lease, the operator is responsible
for the operation and maintenance of water and/
or sanitation services and receives remuneration
in the form of the revenues from the services in
question (which are often based on the volume
of water sold). The lease term is usually about
10 years to 15 years. The main feature of such
contracts is that all of the commercial risk
is transferred to the private operator. As the
operator is responsible for invoicing and payment
collection, there is a strong incentive to optimise
the service provided. In some circumstances,
the commercial risk may be particularly high. In
developing countries, for example, consumers’
ability to pay and collection rates are often
relatively low. Moreover, in developed countries,
the downward trend in overall demand has a
direct impact on operators’ revenue streams.
Therefore, the operator would be well-advised to
reduce Non-Revenue Water, which encompasses
unpaid bills, water leakages in the network
and defective meters. The operator is tasked
with network upgrades and maintenance and,
therefore, provides the necessary working capital.
The public authorities retain ownership of the
infrastructure and finance new investments
(network extensions) and major repairs. The
authorities further remain responsible for debt-
servicing, tariff-setting and the cost recovery
policy. In theory, if the total amount invoiced
to consumers exceeds the private operator’s
fee as provided for, the operator is required to
hand over the surplus to the public authorities
for use for debt-servicing and investments.
In the case of a concession, the most binding
contractual arrangement for a private operator, all
operating and maintenance responsibilities and all
investments (for example, for new infrastructure)
fall to the operator. The public authorities retain
ownership of the assets, which are provided to
the private operator during the concession period
and which must be returned at the end of the
concession period. The private operator is exposed
to a high financial risk corresponding to the
substantial investments that it is usually required
to fund. Concession contracts are of long duration,
typically 20 years to 30 years, to accommodate
return on investment. They were widely used in
the private sector during the 1990s, when the
major water utilities expanded their international
operations. At that time, insufficient budgetary
resources and huge investment requirements
prompted the public authorities in many countries
(especially in Latin America) to see the private
sector as a source of massive financing for the
water sector. The shortcomings of this thinking
soon became evident, as operators sought to
recoup their investments through frequently
large tariff increases. This was untenable in many
developing countries where investment needs
are substantial, the population’s ability to pay is
low and willingness to pay was dampened by the
price hikes. This is understandable because the
link between profits from the services provided
and service pricing is often poorly explained by
operators and badly perceived by users. Public
water tariffs were initially set at low levels divorced
from the real cost of providing water services. In
addition, private operators often lack transparency
and their time horizon differs from that of the
other stakeholders (operators, politicians and
consumers): the improvements delivered under
concession contracts in emerging and developing
countries are only gradually discernible and take
time because of the scope of the changes required.
Consequently, financial risk (impact of debt-
financing on gearing, combined with currency
risk resulting from borrowing in local currency) is
not the sole challenge faced by operators in such
countries. There are also significant social risks
(refusal to pay high tariffs, increasingly radical
PwC | 41

rejection of private management) and political
risks (attempted government interference in
operator pricing policy or instrumentalisation
of situations). High-profile examples of failed
concession contracts include several arrangements
in Argentina and Bolivia, which have simply been
cancelled and have triggered serious legal disputes.
3.6. Which models will be used in the future?
The past 20 years’ experience of projects involving
the private sector has shown that the transfer of
responsibility for water management from the
public sector to the private sector has not been a
straightforward matter in developing countries. In
most developed countries, infrastructure has been
financed historically by taxation. Furthermore,
total private-sector financing would mean that
tariffs would have to give an accurate reflection
of costs (including investments, however large),
which would have implications for users. Such a
model cannot be sustained if the majority of users
lack the ability to pay all of the costs involved.
A gradual approach
Past experience therefore suggests that the private
sector should be involved gradually, so as to allow
for the manifold risks resulting from the complexity
of the water sector. Management contracts provide
an opportunity to take stock of reality (state of the
network and equipment, management capacity
of the incumbent public operator’s teams) and
to enhance service operating efficiency. The
operator has the chance to assess potential future
investment requirements and make provision for
them with a moderate risk exposure. This means
that only contracts which bind the private-sector
partner over the longer term (i.e., leases, leases
with concession-type features and concession
arrangements) should be considered. In all cases,
it is vital to find the contractual balance that will
permit the tailoring of investments to needs,
together with sustainable cost recovery supported
by a range of financing strategies - tariffs, state
subsidies, international aid and private financing
(when financial markets are sufficiently mature).
The need to reconcile imperatives has given rise
to hybrid models. Most notable among these
are concessions involving state subsidies to
finance investments (Argentina, Colombia and
Ecuador) and semi-public, semi-private companies

| Section IV - Economic
analysis
Satisfying the demand for water assumes both sufficient
resource availability and an industrial network capable
of collecting and treating raw water, and transporting it
various distances in order to supply population centres.
These activities form part of the water value chain
and each is bound up with issues of cost, financing,
investment, pricing and value added.
An economic analysis gives us an understanding of
how and under what conditions this vital service
can be harnessed to an economic model.
This section will tackle the following issues:
•What is the cost structure of water? What are its
components? Can we speak about a single cost of water?
•What cost recovery systems exist and how are prices
formulated in such a context?

4.1. Analysis of cost structure
The water value chain comprises a continuous cycle divided into a number of stages, from water
withdrawal from the natural environment through to wastewater sanitation at the end of the cycle.
Figure 16: Water infrastructure cycle
Supply Use Sanitation
Waste waterWithdrawal Treatment Distribution Consumption Treatment
collection
Each stage of the cycle generates• operating costs incurred for the purpose of
two types of cost:
• investment costs used to set up or overhaul the
infrastructure. These are fixed costs; and
4.1.1. Drinking water supply drivers
The process of supplying drinking water begins
with capturing water at source and ends with
water distribution. The wastewater is then
returned to the environment. Water is drawn
from surface water or groundwater aquifers,
or obtained by desalinating sea water, before
being treated and transported to populations
via a dedicated distribution network.
Figure 17: Investment in water supply infrastructures
operating this infrastructure, including
labour, ancillary services or treatment
products. These are variable costs.
Greater demand for drinking water driven by
the increase in the world’s population, as well
as by increased urbanisation, will push up
the costs associated with water withdrawal,
treatment and distribution infrastructures by an
estimated annual average of 6% to 7% between
2010 and 2016. Based on these projections,
the costs of maintaining and extending these
distribution networks is set to reach USD 61
billion by 2016, an average increase of 6%.
CAG R USD billions
Forecast 140
120
100
80 17 18 15 16 16
60 25 24 24 30 27
40
20 41 45 43 43 45
-
2007 2008 2009 2010 2011(f)
Distribution Withdrawal (incl. sea water)
(1) New or renovated infrastructures
46 | Water: challenges, drivers and solutions | 2012
07-10 10-16
24 +4% +6% 22
22
18 23 46 +6% +7% 36 42
31 32
54 57 61 +2% +6% 48 49
2012(f) 2013(f) 2014(f) 2015(f) 2016(f)
Water treatment (new and recyc.)(1)

This overall picture masks a number of
different patterns. Analysing trends in several
different countries highlights certain drivers:
• An existing infrastructure for transforming
raw water and reflecting current national
priorities.
Figure 18: Investment in water supply by type of cost, 2010
Generally speaking, setting up a distribution
network is the biggest cost involved in supplying
drinking water while treatment and withdrawal
costs are roughly similar. Differences in cost are
usually a function of national characteristics
and issues in terms of water availability and
quality and the level of treatment required
to turn the resource into drinking water.
USD cents/m3
52.9 48.9 40.1
22% 25% 20%
18%
34% 21%
62%
44% 54%
France South Germany
Africa
Drinking water distribution network
33.8 20.1 9.9
17% 29% 34%
19%
19% 17%
64% 53% 49%
China United States Hungary
Sourcing (incl. desalination)
9.2 7.8 5.9
6% 7%
34% 36%
12% 66%
59% 54%
26%
Egypt Brazil India
Water treatment plant (new & renov.)
In the United States, water has to be treated
because of intensive household and industrial
pollution of water reserves. Hungary faces similar
problems because it lies downstream along
rivers that have been polluted by neighbouring
countries. In India, the government has
invested huge amounts in desalinating sea
water due to water withdrawal problems.
• Breakdown and population trends of a given
China, the United States and Brazil need to do the
opposite in order to improve the quality of water
provided, to cover the needs of the population
and to deal with an ageing infrastructure.
Figure 19: Investment in water infrastructure, 2010 vs. 2016
CAGR 2010-16
31,565 +11%
geographical area.
Countries with stable population growth
will slow down their investments whereas
those experiencing strong population growth
will have to increase their investments
significantly in relative terms.
For example, Germany and South Africa,
which are currently experiencing stable or
even negative population growth (negative
0.1% and positive 0.4% growth, respectively,
between 2010 and 2015) need to curb their
investments and focus on calibrating their
China
United States
Germany
South Africa
Brazil
India
Egypt
17,088
20,681
12,485 +9%
1,808
2,054 -2%
1,618 -3%
1,910
2,367 +13% 1,111
2,517 +8% 1,568
1,124
750 +7%
Capex FY16 (USD millions) Capex FY10 (USD millions) infrastructure in line with demand. However,
PwC | 47

4.1.1.1. Water withdrawal
Both new and renovated water withdrawal
infrastructures include reservoirs and water
towers, pumping stations and the network
of pipes and mains that links the pumping
station to the treatment facilities. In 2010,
drinking water withdrawal equipment costs
totalled USD 30.5 billion, including USD
11 billion for desalination equipment.24
Water withdrawal investment costs are a function
of (1) the location, access and availability of
water resources and (2) the existing situation,
i.e., the existence of an adequate infrastructure.
Theoretical availability of the
resource and productive capacity
Theoretical resource availability is related to
the geographical, hydrographical and climatic
situation of the area in question. Theoretical wealth
in terms of renewable resources per inhabitant is
one of the key variables for determining a country’s
capacity to meet the demands of its population.
Brazil is one of the best endowed countries with
over 8,200 km³/year of renewable resources and
117m³/day of renewable water per inhabitant.
Hungary only has 110 km³/year of renewable
resources and a theoretical availability of 31m³ of
water per day per inhabitant, while a US, French
or Egyptian inhabitant has renewable resources
of 27m³, 9m³ and 2m³ per day, respectively.
Figure 20: Theoretical availability of renewable water per inhabitant
9,000
7,500
6,000
4,500
3,000
1,500
-
120
100
80
60
40
20
8,233
3,051 2,720
1,880
204 154 110 57 50
Brazil United China India France Germany Hungary Egypt South
States Africa
Renewable water resources (in km3)
117
31 27
9 6 5 4 3 2
-
Brazil Hungary United France China Germany India South Egypt
States Africa
Theoretical water available (m3/day/inhab.)
24. Global Water Intelligence 2011

The difference between the theoretical volume of
water available and the volume of water actually
distributed lies in the capacity to withdraw and
treat water in a given geographical area. The
annual supply per inhabitant and the investment
per cubic metre of water gives us a more detailed
picture of the disparity in investment costs.
As regards water withdrawal costs, Hungary, Egypt
and Brazil have among the lowest unit costs, i.e.,
less than USD 0.04/m3. One explanation for this
is the location of the raw surface water. In Egypt,
the Nile is the main resource and all water drawn
from the river is managed in an optimal manner.
Figure 21: Municipal water supply (cubic metre per inhabitant per year) and investment per cubic metre
250
198200
150
100
50
-
USD/m3
93
62
38
Germany France China
0.07 0.18 0.07
101 87
73 78
22
Brazil United States Egypt Hungary India South
0.01 0.04 0.03 0.02 0.04 Africa 0.10
Municipal water supply (m3/inhab/yr)
Trends and outlook
China and the United States are among the biggest investors in infrastructure to capture and pump water
due to the needs of both local populations and industry. Both countries plan to double or even treble their
investment in order to enhance their water supply capacities, which would in turn boost their capacity to
capture the resource.
Figure 22: Investment in water withdrawal, 2010 vs. 2016
9,000 8,027
7,500
6,000 5,460
4,500 3,332
3,000 2,315
1,500
-
1,294 1,041 1,182 1,077
400 378 378 329 267 449 231
136 15 34
China United France India South Germany Egypt Brazil Hungary
States Africa
Invest. FY10 (million USD) Invest. FY16 (million USD)
PwC | 49
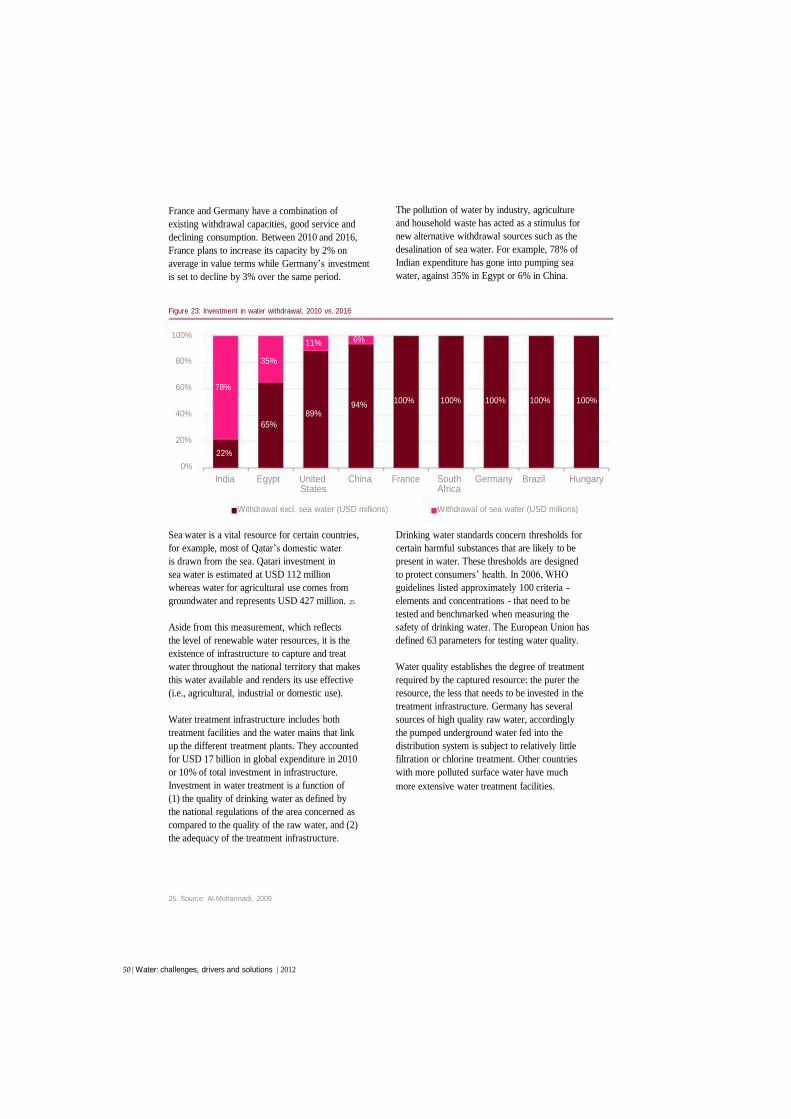
France and Germany have a combination of
existing withdrawal capacities, good service and
declining consumption. Between 2010 and 2016,
France plans to increase its capacity by 2% on
average in value terms while Germany’s investment
is set to decline by 3% over the same period.
Figure 23: Investment in water withdrawal, 2010 vs. 2016
The pollution of water by industry, agriculture
and household waste has acted as a stimulus for
new alternative withdrawal sources such as the
desalination of sea water. For example, 78% of
Indian expenditure has gone into pumping sea
water, against 35% in Egypt or 6% in China.
100%11% 6%
80% 35%
60% 78%
94% 40% 89%
65%
20%
22%
0%
India Egypt United China States
Withdrawal excl. sea water (USD millions)
Sea water is a vital resource for certain countries,
for example, most of Qatar’s domestic water
is drawn from the sea. Qatari investment in
sea water is estimated at USD 112 million
whereas water for agricultural use comes from
groundwater and represents USD 427 million. 25
Aside from this measurement, which reflects
the level of renewable water resources, it is the
existence of infrastructure to capture and treat
water throughout the national territory that makes
this water available and renders its use effective
(i.e., agricultural, industrial or domestic use).
Water treatment infrastructure includes both
treatment facilities and the water mains that link
up the different treatment plants. They accounted
for USD 17 billion in global expenditure in 2010
or 10% of total investment in infrastructure.
Investment in water treatment is a function of
(1) the quality of drinking water as defined by
the national regulations of the area concerned as
compared to the quality of the raw water, and (2)
the adequacy of the treatment infrastructure.
25. Source: Al-Mohannadi, 2009
50 | Water: challenges, drivers and solutions | 2012
100% 100% 100% 100% 100%
France South Germany Brazil Hungary Africa
Withdrawal of sea water (USD millions)
Drinking water standards concern thresholds for
certain harmful substances that are likely to be
present in water. These thresholds are designed
to protect consumers’ health. In 2006, WHO
guidelines listed approximately 100 criteria -
elements and concentrations - that need to be
tested and benchmarked when measuring the
safety of drinking water. The European Union has
defined 63 parameters for testing water quality.
Water quality establishes the degree of treatment
required by the captured resource: the purer the
resource, the less that needs to be invested in the
treatment infrastructure. Germany has several
sources of high quality raw water, accordingly
the pumped underground water fed into the
distribution system is subject to relatively little
filtration or chlorine treatment. Other countries
with more polluted surface water have much
more extensive water treatment facilities.

Figure 24: Water supply and investment in water treatment per inhabitant, 2010
4,000 3,603
198 3,000
2,000
1,000
-
United States
2,869
93 78
38 707 469
China France South Africa
Water treatment (USD millions)
73 62
22 403 378
113
Germany Brazil India
Water supply (m3/yr/inhab)
250
200
150
101 87 100
50
43 29 -
Egypt Hungary
Based on these figures, three countries stand
out: China which has a particularly low
ratio of “investment in treatment facilities
to water supply”, and the United States and
Hungary which occupy first and last place,
respectively, in terms of total investment.
China, which holds 6% of the world’s total water
resources, has a real level of water resources
per inhabitant that is four times lower than the
worldwide average. According to the Chinese
Ministry of Water Resources, 24% of Chinese
water can only be used for agricultural or
industrial purposes, nearly 21% is totally unfit for
consumption and 55% can be used for everyday
consumption after treatment (2008 data).
Figure 25: Quality of water from Chinese river basins 26
100%
90%
80%
70%
60%
50%
40%
30%
20%
10%
0%
The United States has the fourth largest renewable
water resources but it has to contend with
nitrogen pollution from agriculture, pollution
from heavy metals used in industry and an
ageing infrastructure. Water consumption
leads to overexploitation of resources which
automatically pushes up water treatment
costs. In 2007, USD 67 billion in additional
investment in water treatment was estimated
to be required over the next 20 years.
In the case of Hungary, 96% of its surface water
reserves come from adjoining countries and
46% are affected by cross-border pollution.
The country favours groundwater for meeting
household drinking water needs (95% of
requirements), however 42% of the population27
receives water that does not comply with the
standards laid down in EU Directive 98/93 and
27.4% of the population receives water that
contains chemicals such as arsenic and nitrates
that are likely to have a direct health impact.
Pearl Yangtze Songhua Yellow Huai Liao Hai
River River River River River River River
Worse then V IV to V I to III
26. Chinese Ministry of Water Resources, PRC 27. International Office for Water - Hungary, 2007

4.1.1.2. Distribution
Distribution involves getting drinking water
from post-treatment storage locations to
consumers. The distribution network comprises
the infrastructure, water mains and pumps
that supply local consumers. All networks are
subject to wear and tear and require investment
to renew facilities. In 2010, network investment
expenditure totalled USD 43 billion, including
USD 12 billion for extending existing networks.
Aside from geographical considerations, water
distribution costs depend on the standard of
Figure 26: Investment in water distribution by type of cost, 2010
infrastructure equipment, infrastructure building
costs and the volume of water to be transported.
Analysing the structure of investment in water
distribution highlights two main types of situation.
First, countries where network renovation/
maintenance expenditure is very high due to the
cost of maintaining the existing infrastructure
(Germany, the United States, France and Egypt) or
renovating outdated, substandard infrastructure
(Hungary and China). Second, countries that suffer
from infrastructure deficit that wish to develop their
distribution capacity and to provide better coverage
for their populations (India, Brazil and South Africa).
100%
18% 19% 23%
80%
60%
40% 82% 81% 77%
20%
0%
Germany China United
States
30% 33% 39%
70% 67% 61%
Egypt Hungary France
55% 56%
80%
45% 44%
20%
India South Brazil
Africa
Renov. & maintenance New networks
Figure 27: Investment expenditure per inhabitant, 2010
300
250
200
150
100
50
-
267 248 231
21 21
15
South Germany France
Africa
30
216 21
20
8 106 10
54 48 42
5 4 3 16 0 -
China United Egypt Hungary Brazil India States
Capex/m3 Capex USD/hab
52 | Water: challenges, drivers and solutions | 2012

Average investment per cubic metre highlights
the situation of the United States where average
cost per cubic metre is less than half of that in
the developed countries in our sample. This
is down to the high level of consumption of
the population, i.e., between two and three
times what it is in Germany and France.
As regards average investment per inhabitant
and per cubic metre, two trends emerge:
• an average cost of between USD 15 and USD 21
for developed countries.
France, the United States and Germany all have
distribution networks built over longer periods
than those in developing countries whose
distribution networks are already in place. As
pointed out previously, they are no longer actively
equipping their infrastructure so investment in
the water distribution system will increase only
moderately. Average cost per inhabitant will not
increase very much over the coming years.
• emerging and developing countries where the
average cost ranges between USD 0.30 and USD
5 per inhabitant.
Figure 28: Investment in water distribution, 2010 vs. 2016
The decrease in the investment per cubic metre
curve highlights differences in terms of network
organisation and investment to be undertaken
in the long term. This is due in particular to the
concentration of networks in urban and peri-urban
areas. The network has not been extended into
rural zones in either Brazil or India so investment
per inhabitant may remain at a fairly low level. In
the case of Egypt, the dispersion of the population
around the Nile and its tributaries - which are the
main source of raw water - also limit distribution
costs per inhabitant and per cubic metre.
Outlook
Declining requirements will lead certain
countries to gradually reduce their investments
in distribution infrastructure. Germany, whose
population could fall by 12 million between
now and 2060, should follow this pattern and
cut expenditure by an average of 2% between
2010 and 2016. South Africa with its stated goal
of more efficient infrastructure management
should also cut back its investment slightly.
India, China, Brazil and Egypt have committed to
various programmes to develop their basic distribution
capacities and enhance network service quality.
20,000 19,308
16,000
12,000 10,887
8,000
4,000
-
10,741
6,568
1,3871,608 1,273 1,121 1,041 882 597 1 334 1 385 415 440 829 42 87
China United France Germany South Brazil India Egypt HungaryStates Africa
Invest. FY10 (USD millions) Invest. FY16 (USD millions)
PwC | 53

4.1.2. Wastewater sanitation
Sanitation involves collecting and treating wastewater.
It is a key issue in the water cycle because wastewater
that is collected and/or treated is discharged back into
the environment where it again affects water quality.
Figure 29: Global investment in sanitation infrastructure, 2010
In 2010, USD 83 billion were invested in building,
extending and renovating wastewater collection
and treatment facilities and this total is set to
increase by a further USD 32 billion by 2016.
USD billions Forecast
140
120
100
80
60
40
20
-
35
38
2007
39 40 37
41 42 43
2008 2009 2010
Investment-collection facilities
49 53 45 48 49
43
52 55 58 62 48 50
2011(f) 2012(f) 2013(f) 2014(f) 2015(f) 2016(f)
Investment-treatment
While China invested more than developed countries in absolute terms, these developed countries
are still ahead in terms of sanitation practices. This is borne out by investment per inhabitant: the
developed countries, and notably the Western European countries and the United States, invest more
in wastewater treatment with amounts equal to or exceeding USD 46 per inhabitant in 2010.
Figure 30: Investment in wastewater sanitation, 2010
USD millions
15,00014,380 14,067
12,000
9,000
6,886
6,000
3,994
3,000
1,198 1,016 718 584 213-
United China Germany France Brazil South Egypt India Hungary
States Africa
USD/hab 46 11 84 62 6 20 9 0 21

In 2010, the total amount invested in sanitation
infrastructure was greater than that invested
in water supply infrastructure in the case of the
United States, Germany and France. The key
objective of emerging and developing countries
is to cover the demand for drinking water among
Figure 31: Investment in the water sector by type of activity
their own populations and, if possible, invest in
both activities. This is especially true in Brazil
where sanitation is a priority in urban areas,
and even more so in Egypt, where government
regulations aim to protect the waters of the Nile.
23% 29%
44%
77% 71%
56%
46% 48% 51% 55%
54% 52% 49% 45%
65% 73%
35% 27%
Germany Hungary France United Brazil Egypt China South India
States Africa
Wastewater treatment Water supply
In emerging and developing countries, wastewater collection facilities are the biggest cost involved in
sanitation and account for at least 60% of investment in Brazil, India and Egypt.
Figure 32: Structure of investment, 2010
USD millions
12% 11% 25% 28%
34% 36% 22% 26%
53% 53% 52% 46%
18% 30%
38%
29%
44% 40%
37%
25%
38%
45%
20%
35%
21%
57%
22%
Germany France China Hungary United South Egypt Brazil India
States Africa
Wastewater treatment Wastewater collection - renov. Wastewater collection - new
PwC | 55
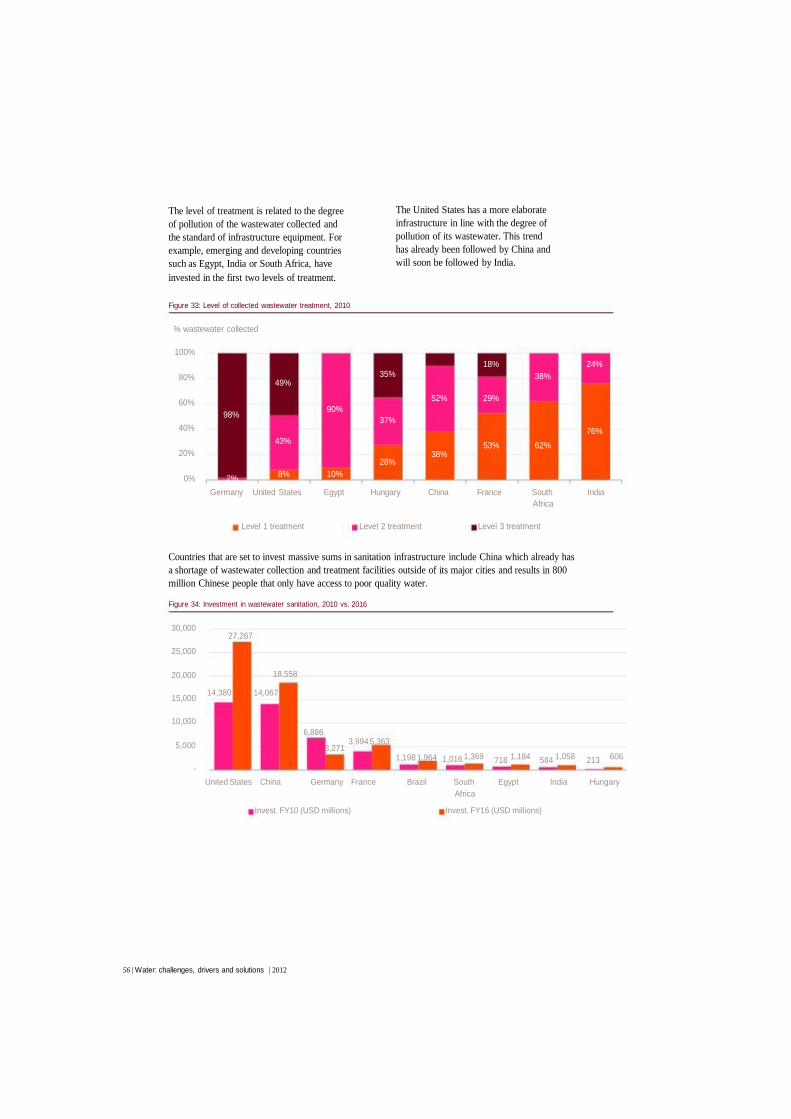
The level of treatment is related to the degree
of pollution of the wastewater collected and
the standard of infrastructure equipment. For
example, emerging and developing countries
such as Egypt, India or South Africa, have
invested in the first two levels of treatment.
Figure 33: Level of collected wastewater treatment, 2010
The United States has a more elaborate
infrastructure in line with the degree of
pollution of its wastewater. This trend
has already been followed by China and
will soon be followed by India.
% wastewater collected
100%
80%
60%
98%
40%
20%
0% 2%
35% 49%
90%
37%
43%
28%
8% 10%
18% 24%
38%
52% 29%
76%
53% 62% 38%
Germany United States Egypt Hungary China France South India
Africa
Level 1 treatment Level 2 treatment Level 3 treatment
Countries that are set to invest massive sums in sanitation infrastructure include China which already has
a shortage of wastewater collection and treatment facilities outside of its major cities and results in 800
million Chinese people that only have access to poor quality water.
Figure 34: Investment in wastewater sanitation, 2010 vs. 2016
30,000 27,267
25,000
20,000
15,000
10,000
5,000
-
18,558
14,380 14,067
6,886 3,994 5,363
3,271 1,198 1,964 1,016 1,369 1,184 1,058 606 718 584 213
United States China Germany France Brazil South Egypt India Hungary
Africa
Invest. FY10 (USD millions) Invest. FY16 (USD millions)
56 | Water: challenges, drivers and solutions | 2012

4.1.3. Summary of the cost of water
4.1.3.1. Supply of drinking water
The worldwide cost of providing drinking water
was estimated at USD 224 billion in 2010 and is set
to reach USD 286 billion by 2016, i.e., an average
increase of 4.2% per annum between 2010 and
2016. About 60% of this amount relates to the
cost of operating the different infrastructures
which will rise by 2.5% over the same period,
i.e., the same rate of increase as that noted
since 2007 (CAGR of 2.3%). Investments should
increase by a higher rate over the same period
(by a CAGR of 6.5% between 2010-2016).
Figure 35: Summary of the cost of supplying drinking water (in USD billions)
350
300
250 224 206 213 214
200
81 85 83 90 150
100
125 128 131 134 50
-
2007 2008 2009 2010
Operating cost
Forecast
247
227 237
97 104 90
140 143 137
2011(f) 2012(f) 2013(f)
Investment cost
CAGR 2010-16
271 286 +4.2% 258
121 131 +6.5% 112
146 150 155 +2.5%
2014(f) 2015(f) 2016(f)
The increase in investment will be in emerging, developing and Eastern European countries with major
equipment requirements. According to the same study, India, China and Brazil will increase their
investment by 22%, 11%, and 13%, respectively with a particular focus on boosting their withdrawal and
distribution capacities.
Between 2010 and 2016, France, Germany and South Africa will invest relatively little - or even
disinvest - in order to calibrate their infrastructures to bring them into line with demand: falling
population in Germany (average decrease of 0.1%) and falling consumption in France and South Africa.
4.1.3.2. Wastewater sanitation
The cost of wastewater sanitation is estimated at USD 171 billion and there is a fairly even 50/50 split in
the cost structure between operating and investment costs. Between 2007 and 2010, investment costs
increased by 4.4% on average which was more than the corresponding 3% average increase in operating
costs. According to the GWI’s 2011 report, investment costs worldwide will reach USD 115 billion by 2016.

Figure 36: Summary of wastewater sanitation costs (in USD billions)
Forecast CAGR 2010-16
250
200
150
100
50
-
161 166 171 153
83 73 78 81
80 83 85 88
2007 2008 2009 2010
Operating cost
195 181 188
100 91 95
90 93 95
2011(f) 2012(f) 2013(f)
Investment cost
207 218 +4.1% 202
115 +5.6% 104 107
98 100 103 +4.1%
2014(f) 2015(f) 2016(f)
There is more investment in sanitation in developed countries and this trend should continue with annual
investment projected to rise in France and the United States by 5% and 9%, respectively, between now
and 2016.
Emerging and developing countries will boost their sanitation capacities and particularly their
wastewater collection facilities (increases of 13% in Egypt and 6% in China) and treatment
infrastructures (increases of 21% in annual investment in India, 5% in South Africa and 9% in Brazil
between now and 2016).
Figure 37: Investment in production and supply of water vs. investment in sanitation, 2010
100%
80%
60% 77% 71%
40%
20% 23% 29%
0%
Germany Hungary
56% 54% 52%
46% 48% 44%
France United States Brazil
Production & supply
35% 49% 45%
65% 51% 55%
Egypt China South
Africa
Sanitation
27%
73%
India
58 | Water: challenges, drivers and solutions | 2012

4.2. Price, cost recovery and financing of services
Meeting water demand for populations and
industry is part of a complex cycle involving
overlapping activities: water withdrawal,
treatment and distribution in the upstream
phase, and collecting and treating wastewater in
the downstream phase. Operating the cycle and
developing adequate infrastructure requires the
involvement of many different players, including
central and local government and industrial
players. In the absence of adequate existing
infrastructure, levers need to be developed
that make it possible to raise the necessary
funding for setting up, renovating, operating
and maintaining the different facilities.
Pricing the different services is fundamental to
financing costs but we will also see that pricing
in the water sector is a complex notion and that
comparing prices in different countries or different
cities is a tricky business. Depending on the country,
legislation or the socio-economic environment,
price may be used to recover either a small part or
the totality of investment and operating costs.
The 3Ts Rule (Tariffs, Taxes, Transfer), presented
below illustrates the balancing act that each
national, regional or local system deploys in an
effort to finance operating and investment costs.
Figure 38: The 3Ts
Users
Tariff
Transfer (Government support development) Taxes
Bilateral and State
multilateral
agencies
4.2.1. Balancing arrangements
in the water sector
4.2.1.1. The role of public authorities in
the water sector: providing oversight,
regulation and investment
Public authorities and public administration
play a key role in the 3Ts. In a system where
there is no international aid, the portion not
paid by the user will be paid by central or local
government out of taxes. In a pricing system in
which the consumer is not the only source of
funding, the arrangement is not based on the
complete recovery of costs out of rates charged
to individual customers. Charging a reduced
rate for the lowest band of water consumption
creates a subsidy for households with a low rate
of consumption. A banded pricing system, free
subscription or giving a certain volume free of
charge may be provided through price-based cross-
subsidies, i.e., subsidisation by other consumers
or a public subsidy paid for by the taxpayer.
Public authorities also decide whether water
rates are a local or a national cost. In countries
that have opted to provide water free of charge,
such as Libya, Turkmenistan or Iraq, all of the
costs inherent in providing a water service are
borne by the taxpayer. In Egypt or Saudi Arabia,
water is considered a vital public good and costs
USD 0.07/m3 and USD 0.03/m3, respectively. 28
In South Africa, the water sector is kept afloat
by central government subsidies. Programmes
to promote access to water and sanitation for the
poorest populations are the principal recipients.
Once basic facilities have been set up, prices are
too low to improve the service or merely keep it
going, so the Federal Government has to step in.
In France, water utilities provide oversight
and investment. Their mission is twofold: (1)
optimising the use of water resources, combating
water pollution and protecting the aquatic
environment; and (2) coordinating the related
water planning and management strategy
(“SAGE” and “SDAGE” plans). User fees are treated
as financial aid to subsidise new investments
in the network and treatment facilities.
28. Ministry of Water and Electricity, Saudi Arabia (2009)
PwC | 59

4.2.1.2. Transfers in countries with
major infrastructure requirements
The OECD’s Development Assistance Committee
(DAC) defines aid to water and sanitation as
including water resources policy, planning and
programmes, water legislation and management,
water resources development, water resources
protection, water supply, sanitation and
education and training in water and sanitation.
In 2009, promises of aid for water and sanitation
projects totalled USD 8.7 billion, of which USD
5.6 billion was pledged by Japan, Germany
and Spain who are the principal donors.
This aid is mainly used to (1) build sanitation
networks and (2) develop basic services
providing access to water and sanitation.
Figure 39: Pledges of aid and aid payments by domain, 2009
1.5 0.2 2.3 0.6
2.9 5.1
4.2.1.3. Pricing water services for the consumer
Pricing of water services is the system
for recovering costs - both operating and
investment costs - from the consumer. Pricing
is determined not only by the standard of local
infrastructure equipment which is related to
the level of development of the territory in
question, but also by the public authority’s
water management and financing strategy.
These factors are interdependent and part of
the overall balance. Pricing will cover either
all or a portion of fixed costs, deemed to be
the cost of the assets, and variable costs, i.e.,
the costs of operating the infrastructure.
“Complete cost recovery” and “sustainable
cost recovery”: a “fair price” for water?
The notion of cost recovery is bound up with
consumers’ ability to bear the cost of water services
which in turn depends on household purchasing
power. A “complete cost recovery” pricing system
charges the totality of investment and operating
11.1 1.8
35.2
47.3
a percentage
Water resources policy
& admin. management
Water resources protection
Water supply & sanitation-
large systems
Commitments in 2009:
USD 8,696 million
17.5
2.1 22.1
50.3
Basic drinking water
supply & basic sanitation
River development
Waste management/ disposal
Payments in 2009:
USD 5,563 million
costs back to the user. Germany and Denmark
cover the costs of their water services using this
system and France’s system is very similar.
The GWI’s study of water prices in over
200 cities worldwide clearly shows that the
lowest prices are to be found in emerging and
developing countries (less than USD 1 per cubic
metre on average) in spite of the actual cost
of water services. But a system of providing
water completely free of charge is difficult to
reconcile with optimal resource management.
We should note that it is not water in itself that
has to be paid for but the services to provide
quality water and collect and treat wastewater.
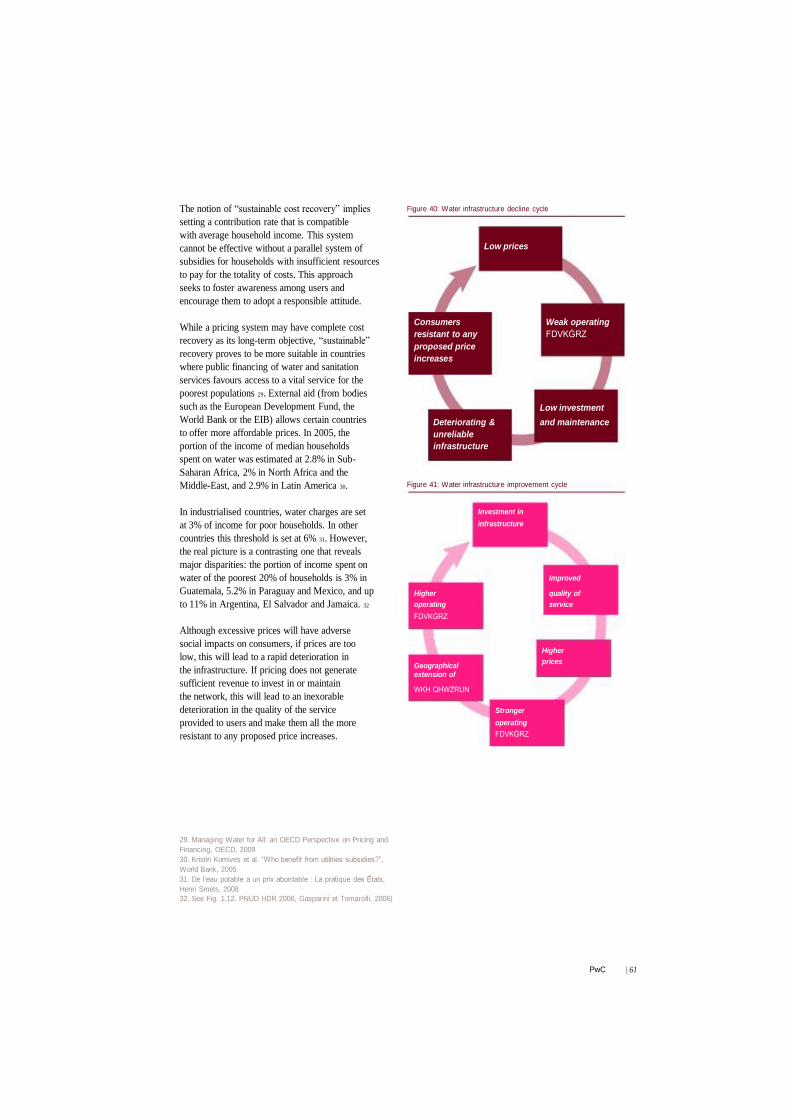
The notion of “sustainable cost recovery” implies
setting a contribution rate that is compatible
with average household income. This system
cannot be effective without a parallel system of
subsidies for households with insufficient resources
to pay for the totality of costs. This approach
seeks to foster awareness among users and
encourage them to adopt a responsible attitude.
While a pricing system may have complete cost
recovery as its long-term objective, “sustainable”
recovery proves to be more suitable in countries
where public financing of water and sanitation
services favours access to a vital service for the
poorest populations 29. External aid (from bodies
such as the European Development Fund, the
World Bank or the EIB) allows certain countries
to offer more affordable prices. In 2005, the
portion of the income of median households
spent on water was estimated at 2.8% in Sub-
Saharan Africa, 2% in North Africa and the
Middle-East, and 2.9% in Latin America 30.
In industrialised countries, water charges are set
at 3% of income for poor households. In other
countries this threshold is set at 6% 31. However,
the real picture is a contrasting one that reveals
major disparities: the portion of income spent on
water of the poorest 20% of households is 3% in
Guatemala, 5.2% in Paraguay and Mexico, and up
to 11% in Argentina, El Salvador and Jamaica. 32
Although excessive prices will have adverse
social impacts on consumers, if prices are too
low, this will lead to a rapid deterioration in
the infrastructure. If pricing does not generate
sufficient revenue to invest in or maintain
the network, this will lead to an inexorable
deterioration in the quality of the service
provided to users and make them all the more
resistant to any proposed price increases.
29. Managing Water for All: an OECD Perspective on Pricing and
Financing, OECD, 2009
30. Kristin Komives et al. “Who benefit from utilities subsidies?”,
World Bank, 2005
31. De l’eau potable a un prix abordable : La pratique des États,
Henri Smets, 2008
32. See Fig. 1.12. PNUD HDR 2006, Gasparini et Tornarolli, 2006)
Figure 40: Water infrastructure decline cycle
Low prices
Consumers Weak operating
resistant to any FDVKĠRZ
proposed price
increases
Low investment
Deteriorating & and maintenance
unreliable
infrastructure
Figure 41: Water infrastructure improvement cycle
Investment in
infrastructure
Improved
Higher quality of
operating service
FDVKĠRZ
Higher
prices Geographical extension of
WKH QHWZRUN
Stronger
operating
FDVKĠRZ
PwC | 61

Different pricing systems to reconcile
public good and economic sustainability
Pricing systems may be applied at national,
regional or local level and be classified as follows:
• Proportional and progressive pricing systems
that use a banded pricing system indexed solely
to water consumption. A number of countries and
regions have developed progressive pricing
systems including Portugal, Spain, Italy and the
Brussels capital region.
• Social pricing systems or targeted social aid
based on both consumption and certain user
socio-economic characteristics. In the Flemish
and Brussels systems, the price of water only
affects a limited number of people and is
frequently financed by solidarity between users,
i.e., a mechanism of cross-subsidies.
• Flat-rate pricing systems not correlated to
consumption based around socio-economic
characteristics such as the nature, size or value of
consumer dwellings.
4.2.2. Practices based on the 3Ts and
emergence of water economic models
Various different models that draw on the 3Ts appear
to be emerging, based in particular on the standard
of water infrastructure and sanitation equipment.
4.2.2.1. Countries with a historically
well-developed infrastructure
Most developed countries have well-equipped
infrastructures so the biggest items of
expenditure are operating, maintaining and
renovating the water infrastructure.
Countries such as England, Germany or Denmark
leave users let pay for operating expenditure and
to finance future investment in infrastructure.
Germany uses a national system which is
incorporated into the tax system of each state
62 | Water: challenges, drivers and solutions | 2012
(Land). Prices are set by local authorities and
must cover all operating, investment and
maintenance costs (infrastructure, distribution
networks and wastewater collection facilities).
In 2009, over 95% of drinking water and
sanitation costs were paid for by users, i.e.,
€1.88/m³ and €2.19/m³, excluding VAT.
In the United States, the operating surplus from
water services is not enough to finance capital
investment. In 2007, the investment required
for water services was estimated at nearly
USD 321 billion over 20 years.33 Investment
projects are financed out of subsidies or low-
interest loans. The ARRA Amendment, i.e., the
American Recovery and Reinvestment Act of
2009, earmarked nearly USD 6 billion to finance
water infrastructure and sanitation projects,
while USD 1.4 billion worth of subsidies and
loans went to the department that runs the
agricultural water and wastewater service. 34
In France, 100% of the population has access
to the domestic water service and 85% is
hooked up to a wastewater sanitation system.
Water services, sanitation and taxes represent
42%, 36% and 22% respectively, of the price.
35 The overall average price is €4.24/m3 and
100% of operating expenditure (water supply
and sanitation) is recovered from consumers.
Infrastructure financing (water supply and
sanitation) is mainly the prerogative of the
public authorities even though these costs are
included in the price of water: central and local
government accounted for 41% of revenue
and 66% of investment undertaken in 2008,
against 40% and 13% for private operators,
and 19% and 21% for the water agencies. 36
It should also be noted that fixed costs which are
traditionally very high in the water sector, fall
markedly when the infrastructure has been nearly
or totally depreciated and correctly maintained.
33. 2007 Drinking Water Infrastructure Needs Survey and
Assessment, EPA report to Congress 2009
34. EPA, Clean water and drinking water state revolving funds
allocation chart, 12 March 2009
35. Adapted from BIPE/FP2E, 2008 and Barucq et al., 2010
36. Adapted from BIPE/FP2E, 2008 and Barucq et al., 2010
4.2.2.2. Developed countries with
a more recent infrastructure
In Italy and Spain, costs recovered from users
represent only the costs of operating water services
and do not cover equipment requirements.
In Italy, 95% of the population has access to the
domestic water service and 85% is hooked up
to a wastewater sanitation system. The average
price corresponds to 0.7% of the average salary
of a three-person household. The average price
is €1.29/m3 and is projected to reach €1.57/m3 by
2020. It differs depending on the region and the
pricing system used. Almost 34% of Italian users
are covered by the CIPE rate which averages out
at €0.98/m3 and only covers operating expenses;
66% of users are subject to “Galli Law” rates and
pay €1.39/m3 on average which covers operating
expenses, asset depreciation expenses and the
return on productive investment. Investments
are partially funded by local authorities or
central government 37 and the current caps on
SII and CIPE rates mean that future needs are
not covered. These are estimated at over €60
billion by the ANEA and only 10% of this amount
will be funded by the public authorities.
Given its current economic situation, Spain is
largely dependent on European Union subsidies
and low-interest loans. EU funds are mainly
allocated to the east of the country and to regions
with major infrastructural deficit. In 2009,
one cubic metre of water cost €1.50 on average,
or €1.40 for domestic consumers and €1.81 for
industrial users. However, customer revenue
does not cover all of the costs of operating the
water service. The key pricing issue remains
agriculture which accounts for 70% of total
water consumption. The current concession
arrangement allows farmers to avail of very low
water rates - less than €0.50/m3 according to
the Ministry for the Environment - while certain
farms also get water from illegal boreholes.
37. Utilitatis and ANEA (2009)
4.2.2.3. Countries with major
infrastructure requirements: emerging
and developing countries
Emerging countries have to contend with a
number of water-related challenges. The volumes
of water provided to households and industry
and the volumes of wastewater treated need to
keep pace with economic growth. The standard
of services in countries like China, Brazil or India
remains well below that provided in developed
countries. In spite of investment levels that
exceed those of France, Brazil or Egypt, China
only provides 104 litres/per capita/day compared
to 264 litres in France, 199 litres in Brazil and
287 litres in Egypt. Both in terms of upstream
and downstream processes, the needs of the
three major emerging economies are and will
continue to be enormous over the next 15 years.
In South Africa, domestic, commercial and
industrial water rates are too low to cover
operating and investment expenditure. The
country has a vast system of federal subsidies
that help to keep the whole water sector going.
The Development Bank of Southern Africa
estimates that drinking water infrastructures
are 51%-funded by government subsidies,
30% by local taxes and 19% by various private
sector loans. Local municipalities are highly
dependent on central government and they are
discouraged from putting up prices so as to favour
access to water for the poorest populations.
For many developing countries that do not
have access to the same type of budgetary
resources, help comes in the form of subsidies
and loans granted as part of aid development
programmes by supra-national bodies such as
the World Bank, the European Investment Bank
and various multi-lateral regional banks.

64 | Water: challenges, drivers and solutions | 2012

| Section V - Pointers
towards tomorrow’s solutions
Achieving universal coverage and meeting the needs of human
beings more generally, i.e., not just in terms of domestic
water, but water for industrial and agricultural purposes
as well, will depend on the progress made in a number of
different areas. In the present circumstances, three major
areas need to be targeted in order to achieve these objectives
or to promote solutions that will help to achieve them:
governance, technological innovation and financing.
PwC | 65

5.1. Governance
Governance has been a sort of magic word that
has been bandied about the water sector over
the past fifteen years. Governance covers all
of the measures, regulations, decision-making
bodies, information and oversight mechanisms
that help control a State or a public or private,
regional, national or international institution or
organisation, and make it function more effectively.
Consequently, it concerns principles that have to be
implemented on a global scale and this is especially
difficult given the highly fragmented structure of
the water sector, run by hundreds of thousands
of municipal, regional or national structures.
5.1.1. Transparency
When discussing governance, the first notion that
comes to mind is transparency. This concerns
both the public sector and investment capacity,
the private sector and price setting as well as
the information to be provided to consumers.
In the public sector
The public sector dominates the global water
and sanitation industry and produces very mixed
results, ranging from some quite remarkable
performances in a number of developed and
less developed countries, to poor or even awful
results in countries in transition or developing
countries due to a lack of resources, training
or performance incentives. We also note
the existence of opaque practices leading to
corruption that usually comes in two forms:
• corruption in business relations with the private
sector: this concerns in particular the awarding
of delegated management contracts or
investments in public entities in murky
circumstances in exchange for large sums of
money (personal enrichment, use of funds
received for other purposes) that are not
subsequently reinvested in the water sector,
• corruption in public procurement contracts
concerning investment in water and sanitation
projects where, even though regulations do exist,
exceptionally high prices are paid for equipment
or treatment facilities generating unjustifiable
costs. These practices arise from arrangements to
inflate suppliers’ profits and pay secret
commissions, and culminate once again in
money being taken out of the water sector.
The first type of corruption involves money
from the private sector whereas the second type
concerns resources taken from the public sector
that have a negative impact on the price of water
and use part of public funds without creating
any value for the sector. This type of behaviour
is frequently uncovered only after inspections
and audits have been conducted and it is usually
too late to recover the money. In other cases
such practices are well known but never actually
come to light. Obviously, controls need to be
performed as far upstream as possible but we
can clearly see the enormous amount of work
that remains given the sheer number of water
services throughout the world even though,
thankfully, not all are plagued by the these types
of problems. Consequently, the optimisation of
financial resources earmarked for investment
in the water sector is contingent on generalised
application of these procedures and controls.
In the private sector
The private sector has mainly been confronted
with problems over the transparency of prices
charged for water. In the mid-1990s, certain
countries - albeit politically risky ones - managed
to achieve an internal rate of return on investment
in excess of 30%. Similarly, certain long-term
concession operators accumulated provisions for
infrastructure renewal over time without actually
using the provisions or transferring them to the
delegating authority. These charges were borne
by consumers but were not reinvested in the water
sector because they were used to finance other
non-water-related businesses or acquisitions.
We also note that private operators have been
able to transfer corporate expenses to concessions
that they operate in order to justify higher
costs, even though the costs in question are not
related to water production or distribution or
the collection and treatment of wastewater.

But here again, this lack of transparency was only
brought to light subsequently by controls and
audits and it was impossible to recover amounts
that had been used for other purposes. These
substantial lost earnings also served to tarnish
the image of the private sector. On a related note,
it may be a cause for concern to see investment
funds focusing on the water sector mainly for the
purpose of maximising their short-term earnings-
per-share ratio with no interest in creating
long-term value for the water sector itself.
For consumers and citizens
These examples demonstrate that we are
confronted with a problem of non-existent or
totally insufficient financial information and
with new models of cooperation between the
private sector and the delegating authorities when
a service is put out to delegated management.
Everyone agrees that the water sector is a global
commons, vital for the survival of humanity, and
cannot be treated as a speculative commodity
for maximising profits to the determinant of
the community. Any recourse to private sector
experience and know-how must be based on
balanced earnings arrangements that maintain
incentives to generate profits to be shared between
private operators and the delegating authorities. It
is therefore essential that water users are informed
not only of factors affecting water quality, but
of financial indicators such as costs and rates.
5.1.2. Decision-making
policies and timeframes
Another aspect of good governance is bound up
with political considerations: politics and the
water sector do not have the same time horizons.
In many parts of the world, politics is in thrall to
emotion and the urgency of the moment. Certain
media bear their fair share of responsibility for
manipulating public opinion and exploiting
sensationalism for commercial gain. Politics is
forced to continually adapt - and perform u-turns
- just to keep pace with opinion polls and electoral
trends. All too often such considerations are bound
up with the short-term and discontinuity whereas
water policy needs continuity and a long-term
focus. Clearly, decision-making horizons are not
the same for politicians and for the water sector.
In many, countries, water has suffered from
being used as a “political football”, especially
during local or national elections. Paradoxically,
we note that some autocratic regimes obtain
better results than countries with changing
democratically-elected governments precisely
because they are able to implement long-term,
continuous policies. In countries with more
democratic national or local systems, investment
programmes are sometimes deferred because of
political wrangling, leading to excess costs that
could have been avoided. This problem has even
greater repercussions in the water sector where
financing has always been difficult to come by.
Similarly, in certain emerging or developing
countries with undemocratic regimes, water is
not always a priority and certain “unenlightened
despots” may prefer to build other types of
more visible infrastructure - an airport or a
motorway, for example - as monuments to
their own glory, rather than water or sanitation
networks which will be much less visible.
Regardless of what region we refer to, the water
sector needs both time and space to develop.
It is bound up more with geography, whereas
politics is more concerned with history and
this hiatus hampers development in the water
PwC | 67

sector. Nevertheless, the political establishment -
regardless of its allegiances - should be capable of
agreeing upon a long-term strategy, particularly for
investment and financing the needs of the sector.
We now need to focus on explaining the challenges
and organising the relevant debates. It is vital to
strive for a concerted approach that transcends
traditional political rivalries in order to achieve
convergence. Democracy should constitute not
an obstacle but a lever for implementing coherent
and satisfactory long-term water policies.
5.1.3. The right to water
The right of every person to have access to water
has been the subject of much debate over the past
decade. The right to water was finally recognised
by the United Nations in July 2010 and has been
reaffirmed since then at various conferences,
however it really needs to be transposed into
the legislation of each country before it becomes
a legally enforceable right. Providing the
resources to effectively implement the right to
water is now an integral part of governance.
But what does affirming the right to water in a
forum such as the United Nations actually mean if
this affirmation remains a dead letter? The great
challenge now lies in finding the resources in each
region to satisfy this need and this will involve
our ability to identify all people throughout the
world without access to water either due to their
distressed circumstances or distance from a source
of drinking water. It will then be up to water
companies, with the support of the legislator, to
come up with solutions to enforce this right. They
may for example devise indicators for tracking the
manner in which the right to water is measured
in different parts of the world and assess the
progress that has been made in applying it.
More effective international water governance
is therefore contingent on coordinating different
countries by tracking indicators that ensure that
the right to water does not remain simply an
inconvenient declaration with no tangible effects
for the worlds’ most distressed communities.
68 | Water: challenges, drivers and solutions | 2012
5.1.4. Managing knowledge
Since the early 1990s, innumerable experiments
have been carried out in the water sector by
ministries, local authorities, operators, engineering
firms, NGOs or international financial institutions.
Regardless of whether they have been successes
or failures, all may be leveraged to provide
pointers for the future. The experiments focused
on institutional organisation, regulation, pricing,
bases of cost recovery, financially sustainable
technical solutions or funding policies. The
accumulated knowledge and experiments now
constitute a considerable asset. However the related
information is currently fragmented and dispersed
in innumerable documents throughout the world.
New information technology has had a
revolutionary impact that makes it possible to
collate these various experiments and it would
therefore be sound policy to identify and structure
all of this knowledge in order to make it available
to the greatest possible number of people. Setting
up a large library or a virtual university devoted
to water should be encouraged as this would bring
together all available knowledge and experiments
while helping to disseminate best practices.
Leveraging this information should also help to
avoid bad choices, gain time and generate major
savings - a precious commodity in the water sector.

5.2. Technological innovations
Research and development and innovation have
massive potential for devising solutions to:
• producing more in quantity and quality terms
to meet growing needs;
• distributing and consuming a scarce resource
more effectively;
•meeting the challenge of wastewater sanitation
and safeguarding public health, the environment
and the quality of the resource throughout the
life cycle;
all at sustainable cost.
The task is to make progress in treatment
technologies (drinking water, sanitation) and move
distribution and consumption methods forward.
The fact that water management is closely bound
up with its local context contains both advantages
and drawbacks (geographical and geological,
socio-economic and cultural) and the essence of
the challenge lies in tailoring dynamic, relevant
solutions to a vast array of circumstances.
5.2.1. Water production: leveraging
alternative sources of water - sea
water or marginal-quality water
Although desalination of sea water remains a
costly strategy (estimated at between two and
three times the cost of treating surface water),
it may become worthwhile in situations where
there is sufficiently easy access to large quantities
of sea water, major funding capacity to meet
high operational costs and an absence of cheaper
alternatives. In Israel, the state-sponsored
desalination programme targets a production
capacity of 750 million m3/year by 2020. If it
succeeds, desalination will become a major source
of water for the country and contribute 22% of
total water production in 2020 (Source: GWI).
Other countries and regions that are seeking
to develop desalination programmes include
certain Gulf States (Saudi Arabia, United Arab
Emirates), California (USA) and Australia.
For mature technologies, expected progress is
linked to improvements in energy efficiency,
upkeep and the useful life of equipment
(particularly membranes) culminating in a
cheaper desalination process with a higher output.
Reducing the environmental impact is also crucial
in terms of both energy (optimal consumption
practices and use of renewable energies) and the
dispersal of brine. Certain nascent technologies
would also appear promising, such as membranes
that use nanotechnologies to attain the required
level of molecular porosity, or biomimetic
membranes with powerful filtration mechanisms.
Reusing wastewater also appears to be a
solution for the future given the potential
resources (everywhere water is consumed,
there is wastewater) and numerous applications.

At the present time, the main uses for recycled
wastewater are for the irrigation of agriculture
(approximately 30% 38) and gardens (20%),
and industrial recycling (approximately
20%: cooling systems, process water, heat
source). These are followed by uses that seek
to preserve the environment and replenish
reserves (approximately 10%: preservation of
wet zones and replenishing lakes and ponds,
replenishing aquifers for storing water, and
naturally treating water). Finally, there
are domestic and municipal uses covering
both non-drinking water (fire fighting, air
conditioning, car washing) or drinking water
(reincorporation directly into the drinking
water system directly or indirectly upstream
into the reservoirs that feed this network).
There is still a major psychological barrier
regarding the reutilisation of wastewater in
drinking water for human consumption.
Projections bear out the potential of
agricultural and industrial uses for recycled
wastewater, but quality requirements for
treated water used for industrial purposes are
moving closer to those that apply to urban and
domestic uses. The most promising solutions
would appear to be three-step treatments
(ultra-filtration followed by reverse osmosis and
intensive disinfection using UV disinfection,
for example) and other advanced tertiary
treatments that deliver high-quality water
that can be used to meet industrial and urban
demands. Consequently, we note that membrane
filtration innovations (in terms of energy use
and membrane design) have been and will
continue to be of benefit in both desalination
and the reutilisation of wastewater.
38. Source : GWI, Global water market 2011
70 | Water: challenges, drivers and solutions | 2012
5.2.2. Efficient and increasingly
flexible distribution combined
with intelligent consumption
In developed countries, particularly in urban areas,
innovations should ensure that ageing networks are
efficiently maintained. Optimal use and extending
useful life are the key issues. There are two types
of solution. First, solutions that make it possible to
plan and anticipate what will happen to networks
by analysing and modelling their behaviour in
terms of materials and environments. Second, we
note innovations in the technical upkeep of buried
networks that are difficult to access which enhance
leak identification and defouling processes.
The gradual installation of intelligent computers
makes it possible to track consumption in real time
by remote meter reading. This will enhance the
detection of leaks and abnormal consumption and will
eventually make it possible to establish consumption
patterns (for both domestic and industrial users) with
a view to more efficient resource management.
In rural and urban areas, the focus is on the
distribution method, particularly network
sizing. Possibilities being explored consist in the
deployment of dynamic modular solutions at a
reasonable cost (decentralisation of catchment
areas into small units for a more local basis
of distribution, mobile desalination units).
5.2.3. Towards
“waste-to-energy” sanitation
Optimising sanitation techniques depends
on reducing energy consumption in the key
activities (pumping, aeration of tanks), reducing
consumption of chemical reagents and enhancing
purification yields for greater efficiency in terms
of the initial role of water purification plants,
i.e., cleaning wastewater and discharging it back
into the natural environment. The presence
of endocrine disrupting compounds and
pharmaceutical residues in wastewater represents
in itself a major challenge over the coming years.
Furthermore, the most promising developments
are mainly those that will soon make it possible to

5.3. Financing
recycle the entire output of wastewater treatment
plants. The recovery and conversion of biogas
(methane), excess pressure and sludge can already
be harnessed to make facilities self-sufficient in
energy, or even energy-positive. Nitrogen and
phosphorous compounds can already be recovered
and transformed into fertiliser and some research
even holds out the possibility of recycling organic
material as polymers for use in applications such
as bioplastics. By harnessing these advanced
processes, tomorrow’s wastewater may also be
recovered to help meet the needs of industry. So
water purification plants are promised a future
in which their activities will go way beyond their
primary functions and they are set to become
major sources of energy, water and biomaterials.
Financing comprises one of the three strategic
development vectors for the global water and
sanitation sector over the coming years. We already
referred to the crucial importance of financing
in the water sector in our March 2001 report
entitled “Water - A World Financial Issue”. In the
wake of the Camdessus Report, “Financing Water
For All” presented at the Kyoto Water Forum in
March 2003, there was increasing awareness of
the need to mobilise substantial financing on a
global scale. Governments, international financial
institutions, bilateral cooperation agencies
or regional initiatives such as the European
Union Water Initiative for the poorest countries
have made it possible to raise considerably
larger amounts over the past ten years.
PwC | 71

Good governance and technological
innovation should also avoid corruption and
unsuitable technical choices and optimise
the value created by such financing.
Financing in the water sector comes
from three different sources:
• public sector financing;
• water rates, i.e., the price charged for water;
• official development aid.
And this is reflected in the lexicon of the 3Ts
which we saw earlier (Tariffs, Taxes, Transfers).
Obviously, there is no single solution and financial
strategies must be locally based and reflect the
nature of the water project (urban or rural), the
planned technology and resulting investment
requirements, the number of inhabitants, local
socio-economic circumstances and cost recovery
potentialities. So very different strategies may be
pursued within the same country depending on the
characteristics of a given water/sanitation service.
Nevertheless, richer countries tend to use
public sector financing and water rates to fund
their projects. However, because of the afore-
mentioned right to water of certain poorer
sections of the population in such countries,
support arrangements have been developed
that involve delivering minimum annual
quantities of water per capita free of charge for
basic uses, i.e., drinking and washing water. In
intermediate countries, in certain regions such
as Central and Eastern Europe, or previously in
a number of Southern European countries, big
chunks of official development aid have been
mobilised through structural and social cohesion
funds. These are powerful levers for financing
infrastructure development but unfortunately, not
all intermediate countries enjoy the benefits of
an integrated economic area. Financial strategies
need to be found that incorporate differentiated
pricing for different types of water use and are
based on consumers’ ability to pay (differentiating
between different types of domestic consumer
and industrial consumers, for example).
In developing countries, while better off consumers
may be charged higher rates, other innovations
may also be considered. For example, countries
with a large tourist industry can develop specific
pricing arrangements for hotels catering to well-
off tourists. But other solutions clearly need to
be devised in addition to official development
aid, such as levying a consumption-based
contribution on the water rates charged by richer
countries that would finance infrastructure
development in poorer countries. The Oudin-
Santini Law has opened up possibilities in
France but this mechanism probably needs to
be applied at a more global level - e.g., in OECD
countries as a first step - before gradually being
extended as the per capita income of emerging
countries increases. For example, a tax of €0.10
per m3 in rich countries would represent a
contribution of €18 a year, or €1.50 a month for
a household that uses 180 m3 of water a year.
But despite the small amount of the annual
individual contributions involved, the political
difficulties of implementing such a tax on a large
scale should not be underestimated. Although most
countries understand and advocate international
solidarity, adopting and actually applying concrete
measures can encounter fierce resistance and all
too frequently good intentions fail to translate into
firm commitments. The need to get resolutions
adopted by a large number of countries at major
conferences such as the World Water Forum leads
to hybrid declarations based on the lowest common
denominator that have very little effect. But sitting
around waiting for the club of rich countries to
agree on extending this type of mechanism would
be wrong and merely a convenient excuse for
doing nothing. Where financing is concerned,
there tend to be many declarations and far fewer
decisions and it is clearly the responsibility of
each country to pursue this type of initiative. We
may then hope for a positive “snowball effect”
with enormous potential for financing access
to water and sanitation in poorer countries.

Furthermore, the gradual application of principles
of transparency based around indicators should
boost the amount of financing that can be raised
from international official development aid and
the major multilateral financial backers. Obviously,
this will be contingent on verifiable rules of good
governance to ensure that all monies raised have
actually been invested in the water sector.
PwC | 73

74 | Water: challenges, drivers and solutions | 2012

| Conclusion
Major changes have taken place over the past
twenty years. Certain trends have emerged and
much has been learned. A dynamic has been
formed by the key players on the ground, backed
by NGOs, associations, a multitude of private
operators of all sizes and the “majors” and
traditional public sector players, some of whom
are tending towards PPP-type arrangements.
Progress has definitely been achieved with
the support of multilateral banks, bilateral aid
and local development banks, as well as the
boost that has come from stricter regulations
and increasing awareness in corporate
circles of businesses’ “water footprint”. And
yet there is still much work to be done.
The big challenge remains investment capacity
and harnessing sufficient sources of funding.
Now more than ever, sustainable development in
the water sector requires massive investments,
not just in water and sanitation, but direct and
indirect investment in rainwater harvesting,
flood prevention and small and large dams/
reservoirs everywhere that water needs to be
stored. Clearly, we are talking about several
thousand billion euros in long-term investment.
This effort also needs to be sustainable and while
all the indicators suggest that it will be, the various
programmes will need to harness formidable
reserves of political will over a very long period.
Nobody believes that all countries everywhere are
suddenly going to converge around this priority
but what is essential is that each country accepts
its responsibilities and that leaders emerge in
all regions throughout the world in the hope of
creating a broad front in terms of the solutions to
be implemented. In many regions, development
programmes hold out the promise of a regular
supply of sufficient quantities of drinking water.
But as we have seen, problems remain in applying
genuine principles of good governance in the
vast number of water services throughout the
world and the benefits of investment in the
water sector are numerous, highly dispersed and
sometimes poorly evaluated: numerous and highly
dispersed because they affect many different
economic sectors, healthcare and protection of
the environment; and poorly evaluated because
it is difficult to measure the totality of benefits
due to the complexity involved in correctly
determining the revenue within an economic
framework, and cost savings in terms of health and
environment restoration work that would accrue
from a sustained initiative in the water sector.
Consequently, the scale of the necessary
investment constitutes a fantastic economic
vector for creating value and jobs both locally
and internationally. We tend to forget that such
investments are powerful drivers for public
works, the equipment industry and research and
development. As the financial crisis continues
to batter economies, the dynamic provided by
investment in essential infrastructure can and
surely must constitute a vector for sustainable
development and progress in terms of medium-
and long-term activities that generate revenue
at both the micro- and macro-economic level.
Hence, this is an economic priority that needs to
be resolutely reaffirmed as it will form part of a
wealth-creating virtuous circle that will condition
resource dynamics and the solutions of tomorrow.
The principal expected benefit is none other than
guaranteed access to water and sanitation for all.

76 | Water: challenges, drivers and solutions | 2012

| Appendices
Global and regional trends
The authors
Bibliography
PwC | 77

Global and regional trends Figure 42: Global and regional trends in water supply, 1990 vs. 2008
13
23
30
27
57
50
1990 2008
1
8
91
1990
0
6 8 6
16 15
29 25
21 13
35
32
94
69 72
71
49
39
2008 1990 2008 1990 2008 1990
7 11 14 14
28 9 31
6
28
14
53
84 55
83
55 58
33
17
2008 1990 2008 1990 2008 1990
8 14 10 13
25
8 12 8
40
51 64
54
80 78 82
44 23
21 34
15 16
2008 1990 2008 1990 2008 1990 2008
World Developed Commonwealth Developing Latin Eastern Southeastern Northern Western Southern Sub-Saharan
Regions Of Independent Regions America & Asia Asia Africa Asia Asia AfricaStates Caribbean
Unimproved Other improved Piped waterdrinking-water drinking-water on premises
The scale of water supply: global and regional trends, 1990 vs. 2008
Figure 43: Global and regional trends in sanitation practices, 1990 vs. 2008
17 25 21
32
11 44
14 14 66
11
7 18 13
9 10
2 10
61 7
54 52 41
36
25
1990 2008 1990 2008 1990 2008
World Developing Southern Regions Asia
Open Unimproved defecation facilities
4 14 17 1
6 27
36 32 6
8 5
9 16
22
20 6
20 89 16 69 72
46
31 28
1990 2008 1990 2008 1990 2008
Sub-Saharan Southeastern Northern Africa Asia Africa
Shared Improved facilities facilities
7 4 8 3 7
10 5
22 2 38
18
12
85
80
56
43
1990 2008 1990 2008
Eastern Western Asia Asia
The scale of sanitation: global and regional trends, 1990 vs. 2008
Sources: United Nations, Progress on sanitation and drinking-water 2010 update

The authors
Guy Leclerc
Water and Infrastructure
Director - Strategy
and Sustainable
Development Team
Benjamin Cros
Senior Manager, Strategy
and Transactions Team
Camille Rojot
Senior Consultant,
Strategy and Sustainable
Development Team
Thierry Raes
Partner, Strategy
and Sustainable
Development Team
Julie Koskas
Consultant, Strategy
and Sustainable
Development Team
Jocelyne Ndombo
Consultant, Strategy
and Transactions Team
PwC is organised by service line with a strong focus
on providing multi-disciplinary skills tailored to the
client’s business sector. This survey is the fruit of
skills and knowledge pooling by our sustainable
development and strategy teams and it was headed
up by Guy Leclerc, Water and Infrastructure Director.
It is part of a series of reports focusing mainly on
clean technologies and renewable energies (see also
our surveys of offshore wind power and solar energy).
Forthcoming publications will deal with new business
models and product service systems.
PwC | 79

Bibliography
Services d’eau et secteur privé dans les pays
en développement - Perceptions croisées et
dynamique des réflexions, AFD, 2011
Partenariats public-privé pour les services
d’eau urbains, Tendances et Orientations N 8,
Philippe Marin, World Bank and PPIAF, 2009
Private Sector Participation in Water Infrastructure,
OECD checklist for public action, OCDE, 2009
Global Water Market, Global
Water Intelligence, 2011
Pinsent Masons Water Year Book -13th
Edition, Pinsent Masons Editions, 2011
Characteristics of wellperforming public water
utilities, Water Supply & Sanitation Working
Notes, No. 9, World Bank May 2006
Enjeux et perspectives de la gestion de l’eau
potable en milieu rural, BTC - Belgian
Development Agency, December 2009
The role of the private sector in peri-urban or rural
water services in emerging countries, OCDE, 2006
Financer les services d’eau potable dans les
petites agglomérations via des opérateurs
privés locaux, collection débat et controverse
N 4, AFD and GRET, April 2011
Small-Scale Private Service Providers of
Water Supply and Electricity A Review of
Incidence, Structure, Pricing and Operating
Characteristics, World Bank, October 2005
Délégation de gestion du service d’eau en milieu
rural et semi urbain - Bilan sur sept pays africains,
Water and Sanitation program, October 2010
Compétitions dans le secteur de l'eau,
Dominique Lorrain, CNRS, July 2009
80 | Water: challenges, drivers and solutions | 2012
The greening of water law: Managing
Freshwater Resources for People and
the Environment, UNEP, 2010
Les besoins en eau potable dans le monde sont sous-
estimés: des milliards de personnes sont concernées
Gérard Payen, AquaFed, November 2011
"The Hydrologic Cycle", Fundamentals of Physical
Geography, 2nd Edition, Pidwirny, Michael J., 2006
OECD Environmental Outlook to 2030, OECD, 2011
Human Development Report, UNDP, 2006
2010 Update Report on Progress on Sanitation
and Drinking Water, WHO and UNICEF, 2010
Asian River Restoration Network and the fresh
and coastal waters session, UNESCO, 2007
FAO Aquastat, 2010
Water in a changing world, UNESCO
How to feed the world in 2050, FAO, 2009
http://www.waterfootprint.org
World water resources and their use, UNESCO 2001
The “World Water Vision”, presented by The
World Water Council at the Second World
Water Forum in The Hague, March 2000
Managing Water for All: an OECD Perspective
on Pricing and Financing, OECD, 2009
Kristin Komives et al. “Who benefits from
utility subsidies?”, World Bank, 2005
De l’eau potable a un prix abordable :
La pratique des États, Henri Smets, 2008

2007 Drinking Water Infrastructure Needs
Survey and Assessment, EPA, 2009
Clean Water and Drinking Water State Revolving
Funds Allocation Chart, EPA, March 2009
Ebb and flow of valve market, Global
Water Intelligence, 2006
Soutenir la compétitivité de la filière française
de l’eau et de l’assainissement, Comité
stratégique des éco-industries, July 2011
The essentials of investing in the water sector;
version 2.0, Goldman Sachs, March 2008
Water Governance in OECD Countries:
A Multi-level Approach, OECD, 2011
Production, Ludovic Vain, Studio Graphique PwC
Photo credits, PwC, Phovoir and Photolia
Edition, March 2012

Appendix 3
ASIA
ANALYTICAL REPORT FOR THE WHITE PAPER ON AUSTRALIA’S AID PROGRAM
Prepared by Dr Elsina Wainwright and Ian Anderson
September 2005

September 2005
Table of contents
Executive summary 1
Asia: the strategic and development context 6
A story of growth—at least for some 6
State strength, state weakness, and uneven internal growth and other challenges 7
State strength 7
State weakness 8
Uneven internal growth and other challenges 10
Transborder threats 11
Possible shocks 12
Australia’s national interest considerations 13
The response: making good development choices 14
Recommendations on what Australia should do 15
Consolidation of existing efforts 15
Economic governance 15
Trade and regional economic integration 16
Rural development 17
Significant scaling up 17
Scholarships for leadership and reform 17
Pandemics 19
New areas for Australian engagement 22
Physical infrastructure 22
Resources, especially clean energy 23
Political governance 24
Agents for change 25
Recommendations on how Australia should respond 25
Multilateral banks 25
Analysis and ideas 26
Changing aid architecture 27
Multilateral 27
Regional 27
Bilateral 28
Non traditional 28
Australian aid 29
Country strategies 29
Indonesia 29
East Timor 30
Phillipines 30
Mekong countries 32
China, India and South Asia 32
Resource implications 35
Conclusion 35
Glossary 37

Executive summary
The strategic context
1. The Asian story is important. Asia is home to more than half the world’s population, and two thirds of the world’s poor. It is also home to the fastest growing economies in the world, and by 2050 three of the four largest economies in the world—Japan, China, and India—could plausibly be in Asia. Asia has produced some of the most dramatic reductions in poverty in history, with India, China and Vietnam each halving their rates of poverty in a decade and lifting tens of millions out of poverty.
2. But growth is not uniform and poverty is still a major issue. Asia is home to seven of the world’s Least Developed Countries or 12 Low Income Countries, a number of fragile states, and countries with longstanding and poor records of growth and stability such as the Philippines. North Korea and Burma have poor growth histories and prospects in the near term. Inequalities are also emerging within national borders. And, despite great progress, there are still more than 700 million people living on less than US$1 a day in Asia. Importantly there are a further 1.9 billion living on less than US$2 a day, who can be tipped back into extreme poverty by external shocks or changes in circumstances.
3. Regional power dynamics are changing, and regional stability in the next ten years will depend upon how the great power relationships evolve and how the region accommodates the economic and political rise of China and India. Growth is amplifying the twin challenges of state strength and state weakness in Asia. Increasingly, national economic security for countries in the region will be determined by a country’s access to export markets, its capacity to retain international competitiveness, and its secure access to resources, especially water and energy. Stability is also affected by the fact that the Asia and Pacific regions are home to at least five countries with nuclear weapons and at least three potential flashpoints (Korean peninsular, Taiwan Straits, Kashmir). Peaceful, democratic elections in Indonesia last year were important for stability in Indonesia and the region more generally. But there remain several longstanding internal insurgencies in Asia (including in the Southern Philippines, Nepal and Sri Lanka), and terrorism has emerged as a key issue in the region.
Strategic development challenges in Asia
4. Asia faces enormous—and varied—development challenges, including poverty,
economic, demographic, social, environmental, and health.
5. Some challenges require large funding. East Asia alone requires approximately US$200 billion annually over each of the next five years if it is to alleviate the critical infrastructure bottlenecks already constraining growth. An estimated US$30 to US$40 per capita is needed annually to finance the minimum health service package in Asia, but Bangladesh, Cambodia, Laos, Pakistan, Mongolia, and Vietnam all spend less than US$10 per capita. Similar large-scale financing needs exist in the education sector.
6. Few growth and development challenges can be solved by money alone. Much
important work can be achieved through ideas, good policy and good leadership. Asia
White Paper Analytical Report - Asia 1
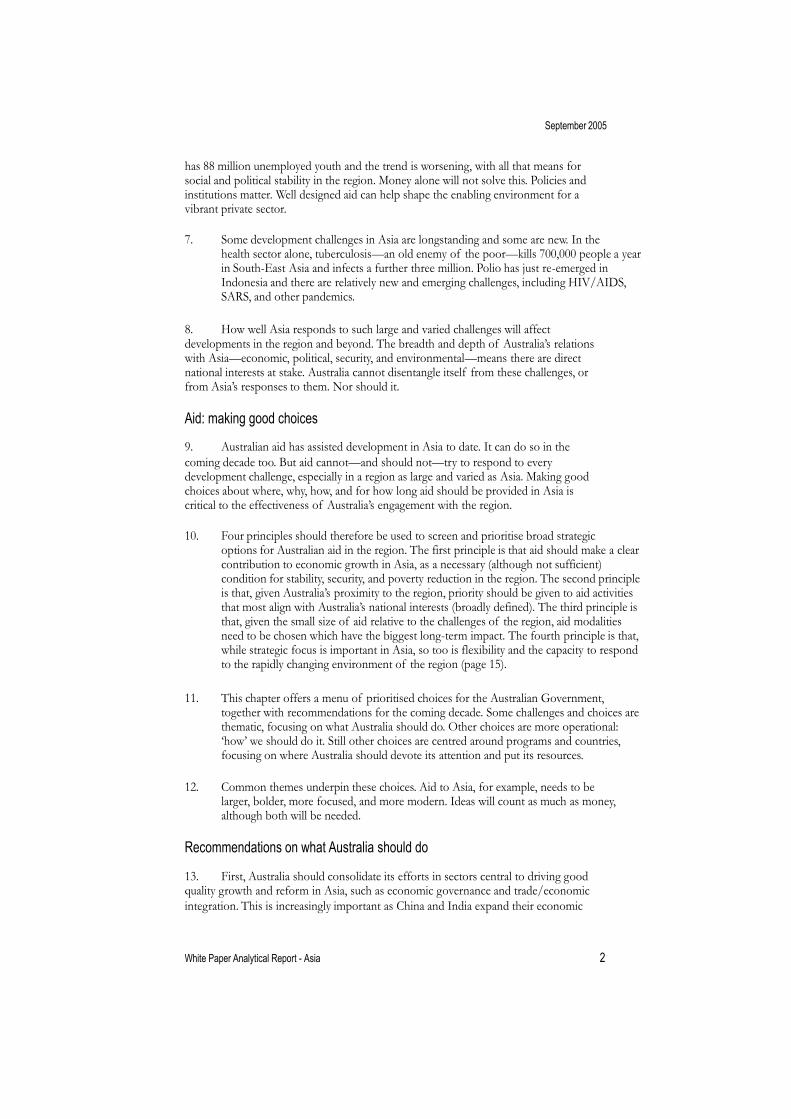
September 2005
has 88 million unemployed youth and the trend is worsening, with all that means for social and political stability in the region. Money alone will not solve this. Policies and institutions matter. Well designed aid can help shape the enabling environment for a vibrant private sector.
7. Some development challenges in Asia are longstanding and some are new. In the health sector alone, tuberculosis—an old enemy of the poor—kills 700,000 people a year in South-East Asia and infects a further three million. Polio has just re-emerged in Indonesia and there are relatively new and emerging challenges, including HIV/AIDS, SARS, and other pandemics.
8. How well Asia responds to such large and varied challenges will affect developments in the region and beyond. The breadth and depth of Australia’s relations with Asia—economic, political, security, and environmental—means there are direct national interests at stake. Australia cannot disentangle itself from these challenges, or from Asia’s responses to them. Nor should it.
Aid: making good choices
9. Australian aid has assisted development in Asia to date. It can do so in the
coming decade too. But aid cannot—and should not—try to respond to every development challenge, especially in a region as large and varied as Asia. Making good choices about where, why, how, and for how long aid should be provided in Asia is critical to the effectiveness of Australia’s engagement with the region.
10. Four principles should therefore be used to screen and prioritise broad strategic options for Australian aid in the region. The first principle is that aid should make a clear contribution to economic growth in Asia, as a necessary (although not sufficient) condition for stability, security, and poverty reduction in the region. The second principle is that, given Australia’s proximity to the region, priority should be given to aid activities that most align with Australia’s national interests (broadly defined). The third principle is that, given the small size of aid relative to the challenges of the region, aid modalities need to be chosen which have the biggest long-term impact. The fourth principle is that, while strategic focus is important in Asia, so too is flexibility and the capacity to respond to the rapidly changing environment of the region (page 15).
11. This chapter offers a menu of prioritised choices for the Australian Government, together with recommendations for the coming decade. Some challenges and choices are thematic, focusing on what Australia should do. Other choices are more operational: ‘how’ we should do it. Still other choices are centred around programs and countries, focusing on where Australia should devote its attention and put its resources.
12. Common themes underpin these choices. Aid to Asia, for example, needs to be larger, bolder, more focused, and more modern. Ideas will count as much as money, although both will be needed.
Recommendations on what Australia should do
13. First, Australia should consolidate its efforts in sectors central to driving goodquality growth and reform in Asia, such as economic governance and trade/economic
integration. This is increasingly important as China and India expand their economic
White Paper Analytical Report - Asia 2

September 2005
engagement within the region and beyond. All countries in Asia will have to manage the rapid structural change of their economies if they are to retain their international competitiveness and therefore their primary sources of growth. The Philippines and Indonesia face particular challenges here, given their declining competitiveness. But aid can play a catalytic and helpful role in supporting necessary economic reforms. Fine tuning of Australia’s work on economic governance is also recommended to give more explicit attention to private sector growth and investment: these main drivers of sustainable growth in Asia may have been underplayed in Australia’s strategies to date (pages 15 to 17).
14. Second, Australia should significantly scale up its engagement in certain sectors or the forms of aid which will increasingly drive growth and reform in Asia. For example, the Australian Development Scholarships program should be significantly expanded and further modernised, because scholarships can build supply and demand for reform within developing countries; drive reform from within; build the next generation of leaders and reformers; and build good people-to-people links. Tertiary education and scholarships can be potent forms of assistance in fragile states. Significant opportunities also exist for scaled up and high-impact engagement in the health sector where development issues
and Australia’s national interests closely coincide. Opportunities include an initiative for preparedness and response to pandemics; leveraging up the impact of some of the large funders of health in the region; addressing some larger system-wide failings of health service delivery; and helping to plug priority but overlooked public health needs. Similar strategic opportunities are available in education including upper secondary, tertiary, vocational, and girls’ education (page 17).
15. Third, if Australia is to help shape the main drivers of change in Asia, then it needs to work in new areas not traditionally large in the aid program. Physical infrastructure (especially transport) and resources (especially energy) are key drivers of the level—and quality—of economic growth in Asia, and for this reason alone should attract more Australian attention. The nature of those massive investments will have profound environmental impacts on the region and, arguably, even on climate change globally. There is a great deal Australia could do to help shape the directions these large investments will take, including by through regulatory environment and governance arrangements of public infrastructure; promotion of clean and efficient energy; and conservation of water and other resources (page 22).
16. There is also a case for considering initiatives in the relatively new field of political governance, especially building up the demand side of reform and the how of reform (page 25).
Recommendations on how Australia delivers aid to Asia in the coming decade
17. Australia already has a number of comparative advantages in the way it approaches and delivers aid in the region. But if Australia is to increase its impact over the coming decade it needs to consider three changes in the way it delivers aid.
18. First, Australia needs to be much more strategic and proactive in the way it
engages with the large multilateral development institutions operating in the region. TheWorld Bank and Asian Development Bank (ADB) lending to Asia was more than US$10
billion in 2004—some 30 times larger than Australia’s bilateral program to the region.
White Paper Analytical Report - Asia 3

The Global Fund to fight AIDS, Tuberculosis, Malaria—and similar new foundations—bring billions of dollars more to the region. Australia, an essentially grant donor with strong country presence and knowledge of the region, should be in a good position to leverage the policy and lending operations of such institutions. Even more importantly, however, Australia should contribute to the analytical, research, and advocacy agendas of these large, influential institutions in the coming decade (page 26).
19. Second, it needs to be recognised that ideas will be a more potent source of quality growth and development in much of modern Asia than will traditional technical assistance and projects. Australia should therefore pay more attention to supporting and disseminating analytical work and applied research on the how of reform; vigorously pursuing institutional links; promoting centers of excellence on priority issues directly relevant to Asia, including clean energy; and building people-to-people links to promote and sustain reform (page 26).
20. Third, aid architecture in Asia is rapidly changing and Australia needs to respond to, and help shape, these changes. At the multilateral level, the coming decade will see major changes to the way the World Bank and ADB engage in the region. The role of newer but potentially significant institutions like the Global Fund to fight AIDS, Tuberculosis and Malaria will also need attention. And many would argue that decisions made—or not made—under the World Trade Organization (WTO) will drive economic growth and development in a globalising region like Asia. There are also important
developments arising at a regional level in the coming decade, including the East Asian Summit, cooperation in the Mekong subregion, and similar initiatives. At the bilateral level, the coming decade will see the continued rise of new and important aid providers in the region (including China) at a time of when traditional Western donors change the levels and nature of their engagement and increasingly harmonise activities. Non traditional development—for example remittances and migration—will also be increasingly important in Asia in the next ten years although rapidly increasing cross border flows of money and people have ambiguous development impacts and carry security implications. There are policy, operational, and resource implications in all this for Australia, and AusAID (page 28).
Recommendations on where Australia provides aid
21. Situations can change quickly at the country level in Asia and aid programs need to respond accordingly: the rapid and large scaling up of aid to post Tsunami Indonesia and elsewhere is the latest illustration of this. Looking ahead, a significant shift in North Korea or Burma could require large and rapid responses from Australia. Flexibility and nimbleness of aid at a country level are therefore important.
22. On the other hand, a ten-year time horizon—as offered by the White Paper —provides an opportunity to have an aid program that is strategic, focused and of sufficient duration that it can make real differences.
23. More specifically, Indonesia should, quite properly, be the largest and broadest development program Australia has in Asia in the coming decade: Indonesia’s size, proximity and development challenges overlap with the national interests Australia has at stake with that country. For similar reasons, Australia should also continue with its broad spectrum relationship with East Timor, focused on maintaining stability, developing human capacity, and improving viable youth employment. In fragile states such as East
White Paper Analytical Report - Asia 4

September 2005
Timor, Cambodia and the Philippines, young people are potential agents for change in demanding reform. But they are also potential agents for instability, especially if unemployed. A development focus on education and employment opportunities for young people can therefore help promote governance and stability (page 29).
24. The Philippines—especially Southern Philippines—poses special developmental challenges and issues of national interest: innovative activities in education, building demand for reform and promoting stability in Mindanao may be the most fruitful strategic intervention. The Mekong region has special characteristics and opportunities for strategic aid engagement (pages 30).
25. Whether Australia should provide aid to fast-growing China and India in the coming decade is an important policy decision for Government. The arguments for and against this are discussed in this paper. A bold, forward-looking, flagship initiative for East and South Asia is canvassed that would demonstrate development impact and align closely with Australian national interests (pages 32 to 35).
Conclusion
26. Asia is large, highly varied and facing complex challenges that affect the lives of billions of people. How it responds to these challenges will directly affect Australia’s national interests. Aid, though small, can help shape the response to these challenges, but it needs to be selective and sustained if it is to have impact.
27. The package of recommendations in this chapter are tailored to the special needs of a rapidly changing and varied Asia. Taken together, they seek to get to the heart of promoting durable reform in Asia. The recommendations are coherent and self reinforcing: shifting upstream to engage more on analytical and applied research that will complement an expanded and new generation of scholarships, institutional links, and enhanced engagement with the policy and analytical agendas of the multilateral development banks. Each element of the package can be applied in varying degrees to the differing country needs of Asia: from large and fast growing East and South Asia, to small and vulnerable fragile states.
White Paper Analytical Report - Asia 5
September 2005
Asia: the strategic and development context
A story of growth—at least for some
1.1 The Asian region has experienced remarkable economic growth over the last 15 years, halving the rate of poverty in countries like India, China and Vietnam in a decade. The region has rebounded from the 1997 financial crisis, and East Asia in particular has seen dramatic growth, with China averaging 9.7 per cent growth over the last ten years. Growth in South Asia has also been strong, largely due to the trajectory of India. Growth in the region looks set to proceed over the next decade, as China and India continue to benefit from—and themselves drive—trade. The world’s economic centre of gravity will likely continue to shift to Asia: by 2050, based on current trends, China and India could well join the United States and Japan to form the four largest economies in the world.1
1.2 Economic growth has brought opportunities to the region, including an increase in linkages between East, South-East and South Asia. The search for further growth and the desire to prevent another shock such as the 1997 financial crisis will likely keep driving regional trade, economic and financial cooperation efforts. The economic interdependence of the region has increased—at least among the economic reforming countries—and a number of bilateral and regional trade agreements have been forged or are under negotiation. The imperatives of these trade arrangements and of WTO accession and membership are shaping policy and institutional reform throughout Asia and the pattern of growth in the region and beyond. Some sub-regional connections are also growing: strong trade flows with China, for example, are creating an economic growth corridor in the Mekong.
1.3 Linkages are also increasing politically, as the regional architecture evolves into a broader pan-Asian construct. China is continuing to look outward, India is looking to its east, and the East Asia Summit process is bringing together the ASEAN plus three (China, Japan and South Korea) states with India, New Zealand and Australia.
1.4 But the remarkable story of economic growth in Asia has to be seen in the context of the enormous challenges still remaining. Table One tells the story: growth is not uniform, with some 700 million people living on less than US$1 a day and 1.9 billion living on less than US$2 a day. Asia is also home to seven Least Developed Countries2, and using a slightly different classification system, is home to 12 Low Income Countries.
3 Tuberculosis—an ancient enemy of the poor—kills 700,000 people a year in South-
East Asia alone, and infects a further three million.4 Median fecal coliform levels in Asian
1 Goldman Sachs. Global Economic Paper Number 99. ‘Dreaming with BRICS: The Path to 2050’. October 2003.
2 Least Developed Countries are defined by the United Nations using three criteria: income per capita of less than $US750 per annum; weaknesses in human resource profile; and economic vulnerability. With these criteria, Asia is home to the following Least Developed Countries: Bangladesh, Bhutan, Cambodia, East Timor, Laos, Myanmar, and Nepal. The number rises to eight if Afghanistan is included in the definition of Asia.
3 Bangladesh, Bhutan, Burma, Cambodia, India, Indonesia, DPRK, Laos, Nepal, Pakistan, East Timor, and Vietnam. The number rises to 14 if Afghanistan is included in the definition of Asia.
4 HIV AIDS, Tuberculosis, Malaria. The Status and Impact of the Diseases. The Global Fund to Fight AIDS, Tuberculosis and Malaria. 2005. Page 32.

rivers (a key indicator of health risk) are three times the world average and 50 times
higher than the level recommended by the WHO.5
Table One
Selected indicators for countries in the Asia region
Country Total Total Gross Gross Share of Share ofpopulation expected national national population children under
2003 population income income per living on less five who are(millions) 2015 2003 capita 2003 than US$2 underweight
(millions) (billions (US$) day (%)US$ ) (%)
Australia 19.90 21.9 436.50 21,950 n/a 0
Afghanistan n/a n/a n/a n/a n/a n/a
Bangladesh 138.10 166.0 55.00 400 82.8 52
Bhutan 0.87 0.55 630 n/a n/a
Burma 49.40 55.7 n/a n/a n/a n/a
Cambodia 13.40 16.4 4.10 300 77.7 45
China 1,288.40 1389.5 1,416.80 1,100 46.7 10
DPRK 22.60 24 n/a n/a n/a 28
India 1,064.40 1231.6 570.80 540 79.9 46.7
Indonesia 214.70 246.8 173.50 810 52.4 27
Laos 5.70 7.3 1.90 340 73.2 40
Malaysia 24.80 29.6 96.10 3,880 9.3 n/a
Maldives 0.29 n/a 0.69 2,350 n/a n/a
Mongolia 2.50 2.9 1.20 480 74.9 13
Nepal 24.70 31.1 5.90 240 82.5 48
Pakistan 148.40 192.8 77.60 520 65.6 35
Philippines 81.50 98.2 87.80 1,080 46.4 n/a
Sri Lanka 19.20 21.5 17.80 930 50.7 n/a
Thailand 62.00 66.3 135.90 2,190 32.5 n/a
East Timor 0.87 n/a 0.37 460 n/a 43
Vietnam 81.30 92.4 38.80 480 n/a 34
Notes: n/a = data not available Source: World Bank, World Development Indicators 2005
State strength, state weakness, and uneven internal growth and other challenges
1.5 The region also faces the twin challenges of state strength and state weakness. Economic growth is fuelling a potentially destabilising change in regional great power dynamics, while amplifying the stresses on the states left behind.
State strength
1.6 Regional stability in the next ten years will depend upon how the great power
relationships—between the United States, Japan, China, India, and Russia—evolve, andhow the region accommodates the economic and political rise of China and India.
5 Environmental Challenges of Development in the East Asia and Pacific Region. World Bank.
White Paper Analytical Report - Asia 7

September 2005
1.7 China’s rise and its relations with the United States, Japan and India will be of particular importance to the regional balance of power. United States-China relations will depend on the degree to which the United States seeks to remain engaged in the region and how it responds to the increasing economic, political and diplomatic influence of an ascendant China. China-Japan rivalry remains deep seated, and may increase further as China continues to rise and Japan moves to adopt a more active strategic posture.
1.8 The Asia and Pacific regions are home to the world’s largest militaries and at least five nuclear powers. While interstate conflict in the next ten years is unlikely, there is a risk that the regional balance of power will fail, and interstate conflict ensues. Traditional flashpoints in the region include the Korean peninsula, the Taiwan Straits and Kashmir.
1.9 But new dimensions are being added to interstate relations by growing nationalism within some states, increasing pollution, and by growing rivalry for markets and access to natural resources, especially energy. In some instances these issues will breed cooperation, such as energy pipelines linking states, and the growth of regional and subregional bodies to oversee resource allocation and to mediate in disputes. But they could also breed competition and stoke tensions. The intensifying search for export markets and for secure sources of energy, for example, is already a key driver of China’s and India’s foreign policy. While the India-China relationship has been maturing economically and politically, scope still exists for competition in the over markets in South-East Asia and energy in Central Asia. Energy is also an increasing source of friction in the China-Japan relationship.
1.10 Fast economic growth has brought significant development and social challenges
to the states that have most benefited from it. The environment is one such issue: China
has 16 of the world’s 20 most polluted cities, and underground water reserves are only a
quarter of their level of 40 years ago as a result of urbanisation and inefficient and
excessive industrial use of water.6 China now has 52 river sections so contaminated they
are not suitable even for irrigation.7
State weakness
1.11 Some states are gaining little benefit from the region’s economic growth and the disparity in the performances of states looks set to grow starker over the coming years. Important parts of North-East Asian economies have by and large integrated into a globalised production chain. But all states, especially those in South-East Asia, also face the significant challenge over the coming decade of improving export competitiveness and moving up the value chain in light of the dramatic change in the economic landscape brought about by China and India’s growth and export prowess. States such as Taiwan, South Korea, Thailand, and Vietnam are well placed to continue to benefit from the region’s growth trajectory because they have demonstrated a capacity for rapid structural change in their economies.
1.12 Some states may not be able to adjust their economies quickly and deeply enough in response to the rise of China and India. Indonesia and the Philippines—home to more than 90 per cent of the population of South-East Asia—face challenges. As shown in Table Two, these countries already face deteriorating competitiveness across the board.
6 China 2001-2010: Political, Economic and Social Issues of Reform and Transformation. FitzGerald, Davies and
Tang. 2005. 7 Connecting East Asia. Page 22.
White Paper Analytical Report - Asia 8

September 2005
1.13 The slipping of Indonesia and the Philippines to last and second last rankings respectively on physical infrastructure is worrying, given the critical role of infrastructure in determining international competitiveness.
Table Two
Competitiveness rankings out of 60 countries
2001 2002 2003 2004 2005
Philippines
Economic performance 33 40 34 43 37Government efficiency 34 35 32 38 42
Business efficiency 31 36 40 48 49Infrastructure 42 43 47 56 59
IndonesiaEconomic 40 37 42 51 55
PerformanceGovernment efficiency 37 47 46 56 54
Business efficiency 43 44 49 57 58Infrastructure 46 48 48 59 60
Source: World Competitiveness Yearbook, 2004, and ADB8
1.14 Indonesia’s democratic elections last year went smoothly, and continued the trend of democratisation in the region. But Indonesia faces significant challenges, including weak institutions, separatist concerns, terrorism, and the pressing need for economic reform. The Philippines’ trajectory has been resolutely negative for a number of years: it is beset with a fiscal crisis, weak governance, poor service delivery, and political instability.
1.15 Several fragile states in Asia lack the human capacity, and physical, social and institutional infrastructure to capitalise on regional growth and risk lagging ever further behind. A vicious cycle exists in fragile states, in which weak governance and institutions, poor service delivery, a stalled economy, and instability combine to further corrode governance and institutions, reduce service delivery, erode state legitimacy, breed greater instability, increase the numbers of poor, drive investors further away, and drive the economy further down. This cycle is even more pernicious in conflict or post-conflict environments.
1.16 Cambodia, East Timor, Laos, and Nepal are among the poorest countries in the world, with weak governance, poor human development indicators and a chronic lack of human capacity due in part to their history of conflict. Cambodia, Laos and Nepal might benefit from their geography: Cambodia and Laos are in the Mekong growth corridor and Nepal is next to India. But they might also remain fragile and unstable and therefore havens for transnational crime. Cambodia also faces immediate challenges in adjusting to China’s rapid expansion of clothing and garment exports in Cambodia’s traditional
export markets.
1.17 East Timor has one of the highest fertility rates in the world, with an average ofnearly eight children per woman. Large numbers of young men have few job prospects: this fuels urban drift, social instability and crime, and can also lead to political instability as disaffected youth rally around any cause and any demagogue. Other states, including Cambodia and the Philippines, have similarly pronounced youth bulges, with population growth rates outstripping economic growth rates over the medium to long term.
1.18 North Korea and Burma have a different pathology: they have strong regimes and strong elements of the state apparatus combined with a closed and profoundly weak economy, weak governance, and weak society. The collapse of the apparatus of state power in either of these states could mean they lurch into acute crisis, with significant economic, humanitarian and security consequences including potentially sizeable refugee flows.9
1.19 Managing state weakness is a key issue facing the region in the next decade. Instability within fragile states can radiate out into the region in the form of refugees, violence, pandemics, and transnational crime. The security, economic and humanitarian impact would increase dramatically if they collapse.
Uneven internal growth and other challenges
1.20 Growth has not only been uneven among the states throughout the region. States such as China, India and Vietnam are experiencing starkly uneven growth internally. Uneven internal economic growth and the phenomenon of jobless growth are contributing to urban drift throughout the region as large numbers move to the cities in search of work. By 2020, two billion people—half of Asia’s population—will live in urban areas with about half of those in slums. Eighteen of the world’s 27 mega-cities will be in Asia.10
1.21 The World Bank notes that economic growth in China no longer has a dramatic
impact on reducing poverty: ‘Most of the remaining poor are cut off from the dynamic
market economy for one reason or another: they are in remote locations far from
markets and/or ethnic minorities not well integrated into society and/or disabled’.11 This
has led to a sharp rise in rural and urban inequality in recent years.
1.22 These trends have important implications for internal social and political stability, and could even derail growth in these states. There are significant interactions between large numbers of unemployed males and the potential for social and political violence, and security more generally. One study12 notes that ‘neither poverty alone nor worsening economic trends predictably produce acute conflict. Nor are economic conditions and
9That risk, however, is not an argument for turning a blind eye to such authoritarian and closed regimes or preferring the status quo. As noted in one recent study looking at the link between poorly governed states and
United States national security: ‘Local elites cannot be evaded or wished away…we know from decades of painful experience that benign neglect, indulgence, or isolation seldom loosen these groups’ hold on power’. (Reference: On the Brink: Weak States and US National Security: A Report of the Commission for Weak States and US National Security. Centre for Global Development. May 2004). Having said that, it is also clear that finding entry points to promote reform in such countries is difficult.
10 Megacities, Asian Development Bank Seminar Series. Megacities are defined as having a population of ten
million or more people. 11 Improving the Efficiency of China’s Growth is Important for the Whole World. David Dollar. World Bank.
12 Youth and Conflict: A Toolkit for Intervention. US Agency for International Development, Office of Conflict Management and Mitigation.
White Paper Analytical Report - Asia 10

September 2005
trends by themselves useful in explaining failed states. However a disproportionately
large youth cohort correlates with the potential for violence, especially if the youth have
frustrated aspirations through some level of education but limited employment
opportunities. Development agencies therefore need to note that education per se is not
always a force for stability.13 This is important, since Asia has an estimated 38 million
people aged 15 to 24 who are unemployed and this trend is worsening.14
1.23 Asia also faces the demographic challenge of ageing and the prospect of old age poverty. The United Nations notes that more than half of the world’s population already live in Asia and this will increase to 63 per cent by 2050; that the number of people aged
60 and over in China, India and Indonesia alone will increase from 222 million in 2000 to
831 million in 2050; and that population dynamics have created several gender related
issues which could worsen the welfare situation, particularly of women for countries in
Asia.15 The challenge of an ageing population is acute in Japan, but also will occur in the
next half century in China, Sri Lanka, Thailand, and several North and Central Asian
states still developing.16 Within the next decade or two, the demographic imperatives of
an ageing population in some states and youth bulges in others might lead to political
movement in the region on the issue of labour mobility.
1.24 Uneven access to state resources, service delivery, economic opportunity, and poor governance—combined with sectarian tensions—have given rise to internal conflicts (for example, in the Philippines). The state has little reach into parts of the Philippines, particularly in the south, and this political vacuum has been filled by both Muslim and Communist insurgents. Localised violence in parts of the region looks set to continue in the next decade.
Transborder threats
1.25 The increased movement of goods, services and people is exacerbating transborder security threats, including transnational crime and terrorism, pandemics and natural resource depletion.
1.26 Organised crime such as gambling, drugs and the sex industry is increasing along corridors of trade and economic growth. Transnational criminal networks are exploiting the increasing disparity between and within states. As some prospering states improve border controls and security infrastructure, transnational criminal networks move to states with weaker internal security. Fragile states can thereby become centres of operation for illicit activities such as the drug trade, people and sex trafficking, money laundering, and identity fraud. Laos, for example, with its porous borders shared with five neighbours, is considered to be at growing risk of becoming a destination for transnational crime.
1.27 Terrorist networks can also use fragile states with porous borders as bases in which to hide, train or from which to launch attacks against other states and interests in the region. Cambodia, for example, is an increasingly attractive haven for transnational criminal operatives as neighbours such as Thailand have tightened their border security
13 Youth and Conflict. Page 6.
14 Economic and Social Survey of Asia and the Pacific 2005. Page 41. 15 Economic and Social Survey of Asia and the Pacific 2005. Pages 219 and 223.
16 Economic and Social Survey of Asia and the Pacific 2005. Page 224.
White Paper Analytical Report - Asia 11

September 2005
and cracked down on crime. Cambodia has a growing drug trade and the terrorist operative Hambali spent several months in the state a couple of years ago.
1.28 Linkages with international terrorism have increased in South-East Asia. Al Qaeda has links with the regional terrorist network Jemaah Islamiah and these networks are taking advantage of state weakness, sectarian violence and separatist movements born of local grievances and have formed links with local militant organisations. The separatist conflict in the Southern Philippines, for example, has acquired an international overlay, as the terrorist network Jemaah Islamiah has exploited the instability, deprivation and extremely weak state apparatus in that part of the state. Terrorist operatives have moved across porous borders in the region to form links with local insurgent groups the Moro Islamic Liberation Front (MILF) and Abu Sayyaf.
1.29 Increasing interdependence will also likely increase the relevance of the Central Asian Republics to the rest of Asia. The republics are characterised by stalled economies, social and political instability, links with jihadi extremists, and bountiful supplies of energy. This makes them not only a possible theatre for great-power competition, but also a potential exporter of instability in the form of transnational crime (including weapons and the drug trade) and militant extremism, particularly into the restive, Muslim-majority, and energy rich Chinese province of Xinjiang.
1.30 Environmental damage and natural resource depletion are also transborder by-products of rapid economic growth in the region. Concerns about increasing pollution and resource depletion will drive the growth of nuclear energy and a demand for clean energy. Water will be a significant issue in the medium term, and will promote cooperation and competition. The Mekong River Commission is an example of efforts at cooperation among the Mekong states Thailand, Laos, Cambodia, and Vietnam (with Burma and China as dialogue partners) to discuss the sustainable management of water resources. But water tensions exist already, for example, between China and Pakistan, Bhutan, and Nepal, and in Central Asia, as well as in the Mekong.
1.31 HIV/AIDS and other pandemics are clearly important transborder issues in Asia:
paragraph 4.6 onwards.
Possible shocks
1.32 The above is the likely context in which the aid program will operate in Asia in the medium term. It is important, however, to be cautious and modest about predicting the likely strategic lay of the land. Economic growth in the region and the other trends outlined above might stall or cease as shocks emerge. One of the most significant would be if a nuclear terrorist attack occurs in Asia Pacific. Such an attack—for instance in the United States—would have a major impact on global stability and the global economy.
1.33 Another potential shock would be if China’s economic growth were to stall—for example as a result of a banking or financial crisis, triggered by bankruptcy of large, unviable, state owned enterprises. Alternatively—or maybe as a result of stalled growth—there may be political crises and internal turmoil. This is not implausible if social pressures arising from the disparity in wealth and internal pressures for political reform grow in China. An abrupt halt to China’s now seemingly inexorable rise would have significant consequences—first and foremost economic—for the region.
White Paper Analytical Report - Asia 12

1.34 India’s growth might also stall. There are varying schools of thought on therelative future performances of China and India. One school maintains that while China’s growth is the more dramatic, it is more vulnerable because of its political system and other internal pressures, whereas India’s fundamentals, including its democratic process, are more sound. Another school holds that the Chinese system has proved itself reasonably agile and able to calibrate the political response required at all stages of its growth, which puts it in a better position than does the more lumbering political system of India. Both views are plausible, and either might come to pass. Of course, China’s and India’s trajectories are not binary: both could stall or rise.
1.35 Asia is not necessarily more exposed, or vulnerable, to exogenous shocks than other regions. Indeed, evidence suggests the robust and flexible economies of East Asia are quite well placed in terms of shocks.17 On the other hand, when shocks occur, they can have a major impact on growth and poverty. The 1997 Asian financial crisis is estimated to have made 30 million people in Asia suddenly very poor and, according to the ADB, the Boxing Day Tsunami meant two million additional people joined the ranks of the ‘new poor’.18 Aid can make a big difference in the severity, cost and duration of such shocks. The UN notes that for every dollar spent on disaster reduction about US$10 is saved by limiting the needs of subsequent relief, but research also shows that of all aid received for disasters only two per cent goes on prevention.
Australia’s national interest considerations
1.36 Events in Asia matter to Australia. Australia is part of the region and cannot
insulate itself from the challenges the region faces: ever-increasing regional interdependence means these challenges directly affect Australia. A sharp deterioration in great power relations in Asia or a crisis on the Korean peninsula, for example, could destabilise the region, threaten prosperity and have significant security and economic implications for Australia. Fragile states can also destabilise the broader region, as refugees, violence, and transnational crime (such as people smuggling and trafficking), drug smuggling, and gun running spread across porous borders. Terrorist operatives can use weak states as bases in which to train and from which to attack other states in the region, including potentially Australia. Australia has of course already felt the brunt of terrorism in the region, with the Bali bombing in October 2002 that killed 202 people including 88 Australians, and the bombing outside the Australian Embassy in Jakarta in September 2004, with 11 victims. And pandemics in the region and environmental damage have consequences for Australia.
1.37 Our prosperity and security are inextricably bound up with the prosperity and security of Asia. Indonesia, East Timor and the Philippines most directly engage Australia’s interests: they are nearest to Australia of the states in Asia and their instability has a great capacity to affect Australia. But it is also in Australia’s interests that the rest of Asia prosper and be secure.
17 The World Bank notes that ‘what is remarkable about East Asia is not that it experienced a crisis in 1997 but that it experienced so few crises over the preceding decades. By and large, developing countries have one year of negative per capita growth roughly once every three years. In East Asia the average is half that rate. Korea has had only three years of negative per capita growth since 1961.’ See Economic Growth in the 1990s—Learning from a Decade of Reform. World Bank. 2005. Page 4.
18 Economic and Social Survey of Asia and the Pacific 2005: Dealing with Shocks. ESCAP. Page 38.
White Paper Analytical Report - Asia 13

September 2005
1.38 So what role can the aid program play within a whole-of-government approach to promote prosperity and stability in the region? This role needs to be grounded in a realistic assessment—as to what an aid program can and cannot achieve. Aid will have little bearing on most aspects of great power relationships in Asia Pacific, but it can help find further opportunities for economic growth and shape the policy environment to drive further growth. It can also have an impact on state weakness and uneven growth among and within states, and help minimise possible threats such as transnational crime, terrorism, financial shocks, pandemics, and the effects of resource depletion and environmental damage.
The response: making good development choices
2.1 The preceding section makes two points. First, strategic issues, growth and development are inextricably intertwined in Asia. Second, how well countries in the region manage these challenges has direct consequences for themselves, the region and Australia.
2.2 How Australia responds to these challenges is important. Making good choices is critical, especially in a region as large and varied as Asia. Aid cannot DO everything. Nor should it. This paper therefore recommends four principles to filter and prioritise Australia’s aid response to the strategic challenges of Asia over the coming decade.
2.3 The first principle is that preference should be given to activities that contribute to sustained, high quality, growth in the region. Sustained high quality growth19 is a precondition for prosperity, stability and security, and will do more than anything else to reduce poverty. As noted in a recent World Bank study of 14 countries: ‘The pace of overall economic growth is the main factor that determines how quickly poverty declines’ and that, on average, a one per cent increase in GDP per capita reduced poverty by 1.7 per cent.20
2.4 The second principle is that aid interventions in Asia needs to align with
Australia’s national interests. These interests are increasingly intertwined with the strategic and development challenges facing Asia by virtue of Australia’s location and increasing economic integration in the region. Australian aid can complement the broad and constructive engagement the country has with Asia, including whole-of-government engagement, and broader economic integration.
2.5 The third principle is that aid should be increasingly strategic and leverage up its
impact if it is to be effective over the coming decade. This is particularly true in a region
as large and varied as Asia, where even total aid—let alone Australian aid—is relatively
small (latest figures show, for example, that aid to Indonesia represents just 0.8 per cent
of Indonesia’s economy, or US$6 per capita per year. The relative size of aid in other
countries of Asia is similarly small).21 Australian aid to Asia should increasingly focus on
what it does best and where it can demonstrate comparative advantage.22
19 There are various definitions of ‘quality’ or ‘pro-poor growth. See for example The Quality of Growth. World
Bank Publication. September 2000 and What is Pro-Poor Growth and why do we need to know? DFID Pro-Poor Growth Briefing Note 1. February 2004. In essence, this paper uses the term ‘quality growth’ to mean growth that is environmentally and socially sustainable and reduces poverty.
20 Pro-Poor Growth in the 1990s: Lessons and Insights from 14 Countries. World Bank (and others). June 2005.
21 World Development Indicators 2004. World Bank. Page 335. Similarly, ODA accounts for approximately just one per cent of gross investment in low and middle income countries in East Asia generally; 0.1 per cent of
White Paper Analytical Report - Asia 14

September 2005
2.6 The fourth principle is that, while being strategic and focused, aid should also be
flexible and responsive to the rapidly changing environment of Asia. Many major events
that now characterise the region were not and could not have been predicted ten years
ago.23 The same applies now.
2.7 Using those four principles to screen the wide array of development challenges in Asia produces a package of recommendations and options for Government. These can be grouped under three broad headings: the challenges Australia should focus on in the coming decade; changed modalities for Australian aid; and changed country and regional priorities.
Recommendations on what Australia should do
3.1 The recommendations are options: not all could or should be applied in all cases or all countries. It is worth noting that many recommendations overlap and reinforce each other. Improved domestic economic governance—for example through more transparent and predictable application of domestic commercial law—can improve prospects for trade, foreign investment, and broader economic integration. This, in turn, can help sustain and lock in the pace of economic governance reforms.
Consolidation of existing efforts
3.2 Australia should continue and consolidate its existing efforts in areas central todriving growth and reform in Asia.
Economic governance
3.3 In practice, this means Australia should continue its focus on economic governance. International literature and experience demonstrate that good governance—especially economic governance—is at the core of quality economic growth. Evidence for this is overwhelming, including for Asia. One example emerges from the latest World Bank research on growth which reports that:
A successful pro poor growth strategy should have, at its core, measures to achieve sustained and rapid economic growth. These include macroeconomic stability, well defined property rights, a good investment climate, an attractive incentive framework, well functioning factor markets, and broad access to infrastructure and education.24
3.4 Australia has worked to support several—but not necessarily all—of those
drivers of pro poor growth. For example, Australia has a very good record of working in
China’s economy; and 0.7 per cent of the Philippine’s economy. It does, however, represent 17.3 per cent of the GNI of Lao PDR; and 12.7 per cent of Cambodia’s GNI.
22 The usual tests for good aid effectiveness should, of course, continue to apply over the coming decade. Good development is essentially about reform and change and aid programs should, at all times, support that process. Aid should not substitute for partner government’s own efforts nor should it substitute for the private sector, support reforms that would have happened anyway, or support reforms that will never be sustained because of intractable vested interests. The environment for aid is changing rapidly and aid modalities need to change too.
23 See separate paper entitled If the White Paper had been written in August 1995.
24 Pro-Poor Growth in the 1990s: Lessons and Insights from 14 Countries. Page 2.
White Paper Analytical Report - Asia 15

areas of broad macroeconomic stability, public sector financial management and land
tenure and property rights in Asia. But if sustained and sustainable economic growth was
to be the primary lens through which we maximise the impact of Australian aid, the time
may be approaching where we shift the current emphasis on civil service and public
administration reform as such and give more explicit attention to reforms that improve
the environment for private sector growth. There are now several effective, innovative
examples of how aid agencies can achieve high development impact in promoting, or
working with, the private sector that could serve as a model, including the World Bank’s
Doing Business approach and innovative work on what is termed ‘output based aid’.25
Trade and regional economic integration
3.5 Australia should also continue and its efforts with trade and regional economic integration. The justification for this is clear. First, trade and economic integration is highly correlated with growth.26 Second, the evidence27 suggests that the dynamic growth of China and India over the coming decade will be one of the single biggest drivers of the level and pattern of growth and development in the region— there are major opportunities but also major risks. Third, Australia has fundamental national and broad whole-of-government interests at stake in the trade and economic integration path Asia takes over the coming decade. Fourth, ‘trade is an opportunity, not a guarantee’28
for quality growth so there may be slippages and missed opportunities. Countries can easily fail to capture the economic and developmental benefits of trade. The public good nature of well designed aid means it can help respond to market and government failures and be a catalyst for reform.
3.6 Australia has a successful record of facilitating trade and economic integration in the region, including aid funded support for China’s accession to the WTO. New and significant opportunities are arising for aid to play a catalytic role in deepening economic integration in the region. Many of these initiatives have a major focus on economic growth and integration, and aid may therefore well have an important—albeit supporting—role to play.
3.7 However the sheer number of regional and subregional initiatives—see for example paragraph 5.11 below—means that aid interventions need to be selective and very strategic. Aid is likely to be most valued and effective in those regional and subregional institutions which drive the process of domestic internal reform for countries in the region; involve institutional or regulatory reform; or involve capacity building. The proposed greater use of applied research, ‘ideas’ and evaluation of reforms (paragraph 5.5) would also complement these activities. Australia could work with the ADB, which is clearly giving much higher priority to the regional economic integration.
25 See Doing Business in 2005: Removing Obstacles to Growth. World Bank. For output based aid see www.gpoba.org
26 Globalisation, Growth and Poverty—Building an Inclusive World Economy. World Bank. 2001. 27 Asia and China: Growing Together? Keynote Speech by President of the ADB, H Kuroda, at the Institute for International Economics. 23 June 2005. As one example: China’s imports from Asia have risen by an average annual rate of 31 per cent over the period 2001 to 2003 in US dollar terms.
28 Economic Growth in the 1990s: Learning from a Decade of Reform. World Bank. 2005..
White Paper Analytical Report - Asia 16

September 2005
Rural development
3.8 Rural development will remain a critical driver of growth for many countries in the region over the coming decade. Poverty will be concentrated in the rural sector through to 2025. World Bank analysis shows that:
increasing agricultural productivity is the most efficient path for many countries to reduce poverty and inequality; that agricultural growth has been more pro poor than industrial growth in Indian and in Indonesia; and that in China primary sector growth has about four times the impact on poverty reduction as secondary or tertiary sector growth. Rural and especially agricultural growth reduced inequality not only in rural areas but also between rural and urban areas.29
3.9 Good quality rural development is also a strong driver of employment opportunities for youth in developing countries, food security and protecting the natural resource base. This is particularly true in countries like East Timor where more than 80 per cent of the population is rural and the vast majority poor, but it is also in many other countries of Asia.
3.10 Australia has a great deal to offer here. The benefits of Australia’s agriculture, forestry and fisheries research and development continue to raise productivity and improve the sustainability of farming systems in much of Asia. Australia’s knowledge in water and river basin management and the prevention and treatment of soil salinity is widely recognised and adopted. Expertise in agri-business development and management, trade policy and practice, quarantine and phyto-sanitary standards and regulation, and rural finance are also widely accessed by Asian governments and the private sector. The coming decade is also likely to see rapid developments in genetic based research applications in agriculture. Australia would be well placed to support work here.
Significant scaling up
4.1 Australia should also significantly scale up its existing engagement in those sectors, or forms of aid, which will increasingly drive growth and reform.
Scholarships for leadership and reform
4.2 One specific recommendation is to scale up Australian Development Scholarships as a vehicle for the next generation of leadership and reform in Asia. The justification for this is clear. The dramatic changes expected in a dynamic Asia in the coming decade require continued reform—for the fast growing and reform minded countries of East and South Asia as well as the weaker and fragile states of Asia. But reform for reform to happen it needs reformers.
4.3 Many in Asia argue that the most effective and durable reform comes from having a critical mass of well trained and capable local leaders, who have exposure to international practices in positions of authority to make their own systems adapt and work better. Such reform from within is preferred to externally provided technical
29 Pro Poor Growth in the 1990s. Op cit. Page 42.
White Paper Analytical Report - Asia 17

September 2005
assistance from consultants. A constant theme of stakeholders in the region, including from multilateral banks, is that Australian Development Scholarships were possibly the most effective form of aid Australia delivered and that they should be expanded and made even more effective. Scholarships not only build capacity and the supply side of reform, they also build the demand side of reform, especially if they involve a critical mass of reformers.
Box One: Education, scholarships, leadership, and aid in fragile states.
‘The typical Low Income Country Under Stress (LICUS) not only has a small share of its population with above primary education, it also has a small population. Hence, the pool of educated people may well be too small either to generate or to manage the radical adaptations that are necessary in the transformation from LICUS status…Aid spent on providing a cadre of well educated people has an expected pay off far in excess of its likely cost.’
Development Effectiveness in Fragile States: Spillovers and Turnarounds. Lisa Chauvet and Paul Collier. Mimeo 2004.
4.4 Of course, scholarships do not automatically or always produce leaders and reform. Indeed, poorly conceived scholarship programs can become a tool of patronage that just help perpetuate a self-serving and closed elite that holds onto power and blocks reform. And development scholarships from Australia should never substitute for scholars who would have come here under privately funded sources. It is also important that development scholars return to their countries to contribute to the growth and reform process.
4.5 It is therefore important that Australia continue to look critically at the way it manages its scholarship program to ensure it maintains the standards of developmental effectiveness, integrity, efficiency, and accountability. Australia has an established and effective record of scholarships for development, dating back to the Colombo Plan. More, however, can be done to improve the impact of scholarships and ensure they meet the contemporary development needs of modern Asia. For example, scholarships could be better targeted in numbers and focus to meet the leadership, reform and capacity needs of fragile states. More can be achieved to ensure the impact of returning scholars is not diluted by perverse institutional incentives operating in the country to which they return. The people-to-people links that are a feature of scholarships could be better matched and consolidated with institutional-to-institutional links. And more progress could be made in building and supporting a professionally and developmentally oriented alumni of scholars.
4.6 It is also important to recognise that the largest contribution to growth and development will come, ultimately and quite properly, from the quality and effectiveness of a developing country’s national system of education, from the basic education system through to tertiary and adult education. Much of this drive and effort has to come from the developing country itself, because the challenges that need to be addressed are system-wide. But development agencies can and should support the reform of education systems (see also paragraph 4.15).

4.7 Significant scaling up of Australian aid could also occur in health. Thejustification for this is strong. Good health is an important development objective in its own right, is a strong contributing factor to economic growth, and has direct links with poverty reduction.
Pandemics
4.8 There is a strong case for scaling up Australian assistance to combat pandemics. Pandemics have large human, social and economic costs and can undermine development (see Box Two). Pandemics also directly affect Australian national interests by imposing potentially large health, social and economic costs on Australia. A significantly scaled up aid response is also warranted because of the strength of well-designed aid when public good arguments30 are involved in combating pandemics.
4.9 HIV/AIDS is probably the most obvious pandemic challenge in the region. Given its importance a separate paper on HIV/AIDS was commissioned for this White Paper process. However the following points are highlighted with respect to Asia. First, the path of HIV/AIDS in Asia will determine the global situation. As noted by the World Bank:
With almost half the world’s population, Asia will determine the future of the HIV/AIDS pandemic. If prevalence rates in China, Indonesia, and India increase to numbers similar to those seen in Thailand and Cambodia, the rate of HIV/AIDS would double globally. Such growth would be devastating for individuals—and for the region’s health systems, economies, and social fabric.31
4.10 Second, Asia faces important challenges. Estimates of the number of people living with HIV in East Asia grew by almost 50 per cent between 2002 and 2004—one of the fastest growing AIDS epidemics in the world.32 And worrying situations are likely to develop close to Australia over the coming decade. The latest UNAIDS Epidemic Update notes that HIV prevalence among sex workers in parts of the eastern most Indonesian province of Papua had reached 17 per cent, more than five times the national average for Indonesian sex workers. That same report shows that nearly six out of ten sex workers in East Timor have never heard of AIDS, four out of ten do not recognise a condom when shown one, and zero out of ten consistently use condoms with their clients. The concurrence of poverty, fragile states, poor public health systems, and heroin and drug trafficking is a particular challenge in parts of Asia.
4.11 Third, there are some important positive situations. Countries such as Bangladesh and Phillipines are still seeing low levels of HIV prevalence, even among
30 In brief, it may not just be lack of a critical mass of scientific and public health management capacity that
constrains developing countries from responding to pandemics—although they may well be factors. . Rather, individual developing countries may not have a strong incentive to invest scarce resources in fighting pandemics if they believe the actions—or inactions—of neighbouring countries will drive the course of the epidemic anyway, or if there is a fear neighbours will simply become free riders on any solution. Well designed and coordinated aid programs can compensate for these constraints.
31 Addressing HIV/AIDS in East Asia and the Pacific. Health Nutrition and Population Series. The World Bank.
2004. Page 1. 32 Global Fund. Op cit. Page 11.
White Paper Analytical Report - Asia 19

September 2005
people at high risk of exposure to HIV, and have significant opportunities to avoid
serious outbreaks. Thailand and Cambodia have been able to reduce prevalence rates.33
4.12 Newly emerging pandemics such as SARS can also have major health, financial, economic, and political repercussions in the region and beyond (Box Two). The link to zoonotic diseases appears particularly close in Asia. Bioterrorism is also a risk.
Box Two: the effects of SARS
Starting in rural China, SARS spread to five countries within 24 hours and to 30 countries on six continents within several months. One infected person traveled by plane from Hong Kong to Toronto: 438 people were later infected in Canada; 43 died; the Canadian Tourist Commission estimated the epidemic cost the nation’s economy $US419 million; and the Health Minister estimated SARS cost Ontario’s health care system about $US763 million. The economic impact of the six-month SARS epidemic on Asia Pacific is estimated at about $US40 billion.
SARS also had substantial political consequences. Chinese Premier Wen Jiabao said in a Cabinet Meeting on the epidemic that ‘the health and security of the people, overall state of reform, development, and stability, and China’s national interest and image are at stake.’
Preparing for the Next Pandemic M Osterholm in Foreign Affairs, July-August 2005
4.13 A major influenza epidemic in the coming decade would have substantial health, development, and economic effects in the region and beyond. The Director of the Centre for Infectious Disease Research and Policy, and Associate Director of the United States Department of Homeland Security, notes:
Consider this sobering information: the most recent influenza pandemic of 1968-9 emerged in China when its population was 790 million; today it is 1.3 billion. In 1968 the number of pigs in China was 5.2 million; today it is 508 million. The number of poultry in China in 1968 was 12.3 million; today it is 13 billion. Changes in other Asian countries are similar. Given these developments, as well as the exponential growth in foreign travel over the past 50 years, an influenza pandemic could be more devastating than ever before…The reality of a coming pandemic…cannot be avoided. Only its impact can be lessened. 34
4.14 An illustrative model for what could be done to respond to a major pandemic is
canvassed in Box Three.
33 Global Fund. Op cit. Page 20. And the example of Cambodia where HIV prevalence has declined from a high of
3.3 per cent of the adult population to 1.9 per cent shows that impact is possible if governments recognise the
problem and effective action is well targeted. 34 Michael Osterholm, Director of the Centre for Infectious Disease Research and Policy, in Foreign Affairs. Op cit.
White Paper Analytical Report - Asia 20

September 2005
Box Three: responding to a major pandemic in the region
Many believe that a major pandemic—for example of influenza—is inevitable in the region and would have major health, social and economic consequences.
What can Australia usefully do now? A coordinated whole-of-government response, including the aid program, could save lives and avert huge economic losses. Specific initiatives would involve significantly strengthening disease surveillance in countries in the region so that outbreaks can be detected and responses launched earlier: countries cannot be strategic in the absence of good data and that requires improved surveillance. It also requires improved laboratory diagnostic capacity and training and equipping of national and regional response teams. Reinforcing health control measures at national borders is critical to reducing transboundary spread of disease. Support to international collaborative research, including efforts to develop vaccines, is also important to finding more sustainable solutions.
4.15 While a new focus is needed on pandemics, continued attention is also needed
for endemic and communicable diseases. Malaria continues to be a major concern.
One third of the world’s TB cases are found in South-East Asia: nearly three million new
cases and 700,000 deaths per year.35 Multiple drug resistance and HIV/AIDS threaten to
undermine gains made in TB control and tend to disproportionately affect the poorest
and most vulnerable. After an absence of ten years, polio has re-emerged in neighbouring
Indonesia, with 219 cases being reported in Java and Sumatra.36
4.16 For strategic gains to be made in health there needs to be increased engagement with health system development.37 How governments in the region organise their financial and human resources to deliver public health is the strategic driver of longer term outcomes. Regional responses in Asia rest in many respects on the quality and depth of national responses and national capacities and there are significant weaknesses and gaps in Asia. Indeed, there are huge unmet health needs in Asia: an estimated US$30 to US$40 per capita is needed annually to finance the minimum health service package in Asia, but Bangladesh, Cambodia, Lao PDR, Pakistan, Mongolia, and Vietnam all spend less than US$10 per capita. Scaled up assistance that address the root causes of systems failure would have widespread and strategic impact. It would also help address currently neglected and underfunded priorities including maternal and child health care in Asia.
4.17 Similar opportunities for significantly scaled up, and strategically wide impact, apply in the case of education. Again, the rationale is clear: like health, education is a benefit in its own right that creates a foundation for economic growth and has spill over benefits for health. Scholarships to study in Australia are the first pillar in human capacity development assistance. The second pillar is support for reform and strengthening of the
35 Global Fund Report. Op cit. Page 32. 36 Polio vaccine scheme needs $7 million in The Australian. July 9-10 and August 16 2005.
37 It is not always clear what sort of health systems countries are trying to build with their own resources and
external aid. Sustainable financing of health care (with an appropriate public/private mix); human resource planning, development and management; and health commodity procurement and management, are key building blocks. Deficiencies in these areas are crippling health systems rather than technical aspects of addressing specific diseases. Expanding criminal activity in the manufacture and distribution of counterfeit pharmaceutical products is one example of an issue requiring regional collaboration that extends beyond the health sector. .

education system itself within the country. Mass education makes an important contribution to nation building and stability by enabling people to engage with law and justice systems and democratic processes. Education—including science, higher and technical vocational education—will be an increasingly important determinant in Asia of a country’s capacity to engage and compete in a global economy over the coming decade. Improving the access and strengthening the quality and rigour of higher and tertiary education can help produce the next generation of public and private sector leaders. Support for higher and tertiary education is particularly important in fragile states, in which a lack of human capacity constrains economic growth, good governance through mismanagement and problems with policy implementation, and development more broadly. Education will also be an important part of the response to growing inequality between and within countries in the region, and between genders. Girls’ education has been found to be one of the most effective and durable forms of aid investment possible.
4.18 There are significant, specific opportunities for larger scale initiatives in education at the specific country level. These relate to basic, higher and technical/vocational education and capacity building in East Timor, education systems reform in the southern Philippines (paragraphs 6.7 and 6.8), the option of a very large and bold initiative involving education, and girls’ education across East and South Asia (paragraph 6.22).
New areas for Australian engagement
Physical infrastructure
4.19 With some notable exceptions38 Australia has not concentrated on physical infrastructure in its aid program. However if Australia wishes to be engaged in the main drivers of future economic growth in Asia over the coming decade, then physical infrastructure should be looked at again. The evidence is clear: infrastructure bottlenecks are likely to choke off growth in Asia unless there is major change. One major recent study finds that East Asia alone has resourcing needs in infrastructure of US$200 billion per year over each of the next five years: a total of one trillion dollars.39 It is also clear that much of the multilateral—and even bilateral—aid flows to the region will GO TO INFRASTRUCTRE. It is not in Australia’s interests to be passive onlookers of such large flows, if only because the country is a shareholder in multilateral development banks and should be intelligently engaged in their core business.
4.20 Australia is unlikely to be a dominant funder of infrastructure in Asia—the financial costs are large and it is not necessarily the most appropriate use of grant aid. But there are opportunities for innovative engagement in this sector where Australia can help shape and direct the much larger investments flowing in which will shape growth and development in the region. For example, transport and growth corridors are vectors for HIV/AIDS transmissions—both at the construction phase and after completion—and Australia has recognised expertise, comparative advantage and interests in reducing HIV/AIDS transmission.
38 The My Thuan and Friendship bridges; post Tsunami Indonesia; some major infrastructure investments in the Philippines; and some large mixed credit activities in the 1980s and early 1990s, including significant investments in rural bridges in Indonesia. If water and sanitation is classified as infrastructure, then significant investments have occurred in this sector.
39 Connecting East Asia.
White Paper Analytical Report - Asia 22

September 2005
4.21 Australia has also demonstrated expertise in the economics and broader
development impact of infrastructure: analytical work on the My Thuan Bridge, for example, has been used as a model by other bilateral funders of infrastructure in the
region. Economic governance in infrastructure is also key: up to 30 per cent of
investments in infrastructure are lost to corruption and poor governance,40 while
Australia has good systems for improving the efficiency, accountability and value for money of large scale investments. Finally, and importantly, construction and maintenance of key infrastructure such as roads is a major opportunity for generating long-term employment—especially among the poor and unemployed—in ways that can simultaneously reduce the import demand for capital equipment by up to 30 per cent.
Resources, especially clean energy
4.22 Australian aid should also be directed at another new sector: resources,
especially secure sources of clean energy and more efficient use of energy resources. The rationale is clear. First, the sheer size and scale of resource use in Asia
over the coming decade is strategically important in its own right, driving everything
from economic growth to environment and climate change. Energy consumption in
China, for example, doubled between 1980 and 2000, and China is likely to displace the
United States as the biggest energy user by 2050.41 Between 1990 and 2025 China’s total
carbon emissions are projected to rise by more than the combined increase for the
United States, Western Europe and Japan.42 Much the same could be said for South
Asia.
4.23 It is not just the magnitudes that demand attention. The efficiency and cleanliness of resource use do too. China, for example, requires about three times as much energy as the United States to produce US$1 of economic output and emits nearly four times as much carbon dioxide per dollar of economic activity as the United States.
4.24 Secure access to energy has become a national security issue for many states in
Asia and nuclear energy is increasingly seen as the answer by some. According to the
World Nuclear Association, for example, China plans to build 27 nuclear plants to boost
nuclear energy four-fold by 2020, and India intends to build up to 24 reactors over a
similar period.43
4.25 In short, access to clean energy and its more efficient use is a major strategic issue affecting the pace and quality of economic growth and development in the region. Australia has significant expertise in promoting clean energy, is a major exporter of energy (as well as holding the second largest reserves in the world of uranium), and has a direct interest in avoiding greenhouse gas induced climate change or environmental damage in the region through effects such as acid rain.
4.26 This will inevitably involve a whole-of-government response from Australia. Within that response, opportunities for significantly increased Australian aid engagement
in this strategically important sector could include much greater and more specific
40 Connecting East Asia. Page 117.
41 China Human Development Report 2002—Making Green Development a Choice. UNDP and Stockholm
Environment Institute. Oxford University Press. Page 55. 42 ‘Coal Reliant China clouds environmental outlook’. The Australian Financial Review. 8 July 2005. Page 81. . The
article cites the Energy Information Administration as the source of the estimate. 43 ‘Glowing Outlook for Uranium’ in the Australian Financial Review. 8 July 2005. Page 67.
White Paper Analytical Report - Asia 23

September 2005
engagement with the ADB and World Bank policy and lending operations in energy (paragraph 5.3) and/or a large long-term pipeline of development scholarships aligned with institution to institution links (paragraph 4.2). The establishment of the Asia Pacific Partnership for Clean Development and Climate is timely and a welcome opportunity to elevate the role of clean and efficient energy production in the aid program to Asia. This is particularly so given that the members of the Partnership include India, China, and South Korea from Asia and, with the United States and Australia, account for more than
40 per cent of the world’s greenhouse gas emissions.
Political governance
4.27 Another possible option for a new area of engagement is in political
governance. Political leadership and governance clearly have direct and strategically significant effects on the rate and quality of economic growth: each of the economic histories of China, India, Indonesia, Vietnam, Cambodia, Laos, South Korea, Singapore, Philippines, Burma, and others over the last 50 years tell a vividly contrasting story about the central role of political governance in facilitating—or destroying—growth prospects. The importance of political governance on growth continues today. In July this year Moody’s downgraded its outlook for the Philippines sovereign debt from stable to negative, and Standard and Poor also downgraded ‘citing concerns over the direction of badly needed economic reforms in the light of the (political) turmoil’.44
4.28 Australian aid can assist the process of political governance without being unacceptably intrusive: the key is to have demand driven, not supply driven, responses. Some assistance can be quite direct, such as support for a country’s electoral process as Australia has done in East Timor, Cambodia and elsewhere.
4.29 In the right circumstances, Australia could also lever up its impact on the reform agenda more broadly by working in partnership with the multilateral development banks. These banks increasingly recognise the relevance and role of political governance in reform but are prevented from being involved in more direct ‘political’ activities by their founding charters. There may well be circumstances where a partner government in a developing country may welcome Australian aid-funded analytical research or pilot testing of a reform process that is initially in the domain of political governance that could later be supported by larger funding through a World Bank or ADB program.
4.30 In other cases the most valued, highest impact, and most durable assistance may be activities which enable the countries themselves to push reform from within. The Australian aid program has a lot to offer here. Helping build a critical mass of reformers through a modernised and expanded scholarships program is one major initiative open to the Australian Government (paragraph 4.2). Another option is to provide substantial support to centers of excellence that generate high quality—but applied— research: putting quality data in the hands of reformers (or the public) can be a potent force for reform. Shifting the emphasis in aid from the what of reform delivered through technical assistance to the how of reform through the power of ideas and applied analytical research is another option (paragraph 5.5). It is clear that demand driven assistance can enable
44 ‘Arroyo hangs on as middle class shops’. The Australian Financial Review. 14 July 2005. Page 12.
White Paper Analytical Report - Asia 24

Australian engagement in strategically significant but otherwise politically sensitive
institutions.45
Agents for change
4.31 Young people are potential agents for change in demanding reform, including in fragile states. But they are also potential agents for instability, especially if unemployed (paragraph 1.22). The challenge for an aid program is to help shape young people into forces for political reform, not forces for political instability. A development focus on education and employment opportunities for young people in fragile states can help reduce the disaffection among young men that can be so destabilising, and thereby help promote governance and stability. This can be done by working directly and innovatively to help build a vibrant private sector, putting more emphasis on technical and vocational education, and giving more attention to employment intensive approaches to
infrastructure investments and rural development.
4.32 There is also scope to promote the role of women as agents for change in situations of conflict and instability and to help drive demand for better governance, particularly in the Philippines where women have a successful record of driving change, including at the community level. Other possible agents for change might be the churches in countries like the Philippines and East Timor.
Recommendations on how Australia should respond
5.1 Australia already has a number of comparative advantages in the way it approaches and delivers aid. Based on conversations with stakeholders in the region, these include: policy coherence and a whole-of-government approach to development issues in the region (trade policy aligns with aid and development policy etc); a long-term commitment to engagement in the region (evidenced also by the ten-year timeframe of this White Paper); and positive characteristics of aid delivery (primarily grant aid, involving competent technical expertise, managed through a single, professional, devolved, aid agency).
5.2 But if Australia is to have impact in a rapidly changing Asia over the comingdecades, it needs to consider three changes in the way it delivers aid, as outlined in this
section.
Multilateral banks
5.3 First, Australia needs to be much more strategic and proactive in the way it
engages with large multilateral development institutions in the region. Loan
disbursements from the World Bank to Asia totaled US$5.27 billion in 2004.46 Loan
approvals from the ADB to the region in 2004 provided a further US$5.3 billion.
Lending from these two institutions alone is 30 times larger than the US$463 million
45 Australia discussed with China about aid supported research and training activities with the Communist Party School in Beijing which trains China’s elite. Discussions in Vietnam also indicate there would be no political impediment to Australia supporting research for the Office of the National Assembly.
46 US$2.7 billion to South Asia, of which US$1.835 billion was from the highly concessional International
Development Association (the IDA arm of the World Bank) and the balance from the regular IBRD arm of the bank; and US$2.55 billion to East Asia and the Pacific, of which US$1.7 billion was IBRD and the balance IDA. While lending to the Pacific is included in this grouping, actual levels are quite small.
White Paper Analytical Report - Asia 25

September 2005
Australian bilateral program to the region. Australia, an essentially grant donor with strong country presence and knowledge of the region, should be in a good position to leverage the policy and lending operations of such organisations.
5.4 But aid is more than development finance. Increasingly, effective development is about the transfer of ideas as much as it is about the transfer of resources. Many would say this seems to be particularly true in Asia, which has an insatiable appetite for learning the pragmatic lessons of reform. It is also true for fragile states where traditional or large financing packages may not be appropriate. Well-constructed and applied analytical research done jointly with the banks—particularly early in the banks’ consideration of issues—can help shape the banks’ subsequent approaches in the region. The banks are clear that they would welcome a much stronger analytical and advocacy role from Australia in the region (see also following paragraph).
Analysis and ideas
5.5 The second change that Australia should consider in the way it delivers aid is therefore to be much more proactive in the generation and dissemination of analysis and ideas related to development. Australia has a good base here. Australian aid is seen as particularly innovative and prepared to test new ideas and approaches. Several Australian universities specialise in, or have close formal links with, countries in Asia. These countries argue that, notwithstanding its developed country status, Australia’s reform experience over the past decades is instructive in areas as diverse as trade policy and industry restructuring, health financing, education policy, public sector reform, public financing, and public-private partnerships for infrastructure development. That these reforms occur within a federal system, and in a mixed economy, has resonance and lessons for reform minded Asia.
5.6 There is much Australia can do to generate analysis and ideas at a practical level.
Australian aid could more actively undertake the type of applied operational research that
the World Bank and ADB do and which can have such a large impact on ways of
promoting development in the region.47 More emphasis could be given to capturing and
disseminating the lessons of particular reform efforts, including but not limited to the
trial and pilot aid activities that occur in the region, but which often do not get scaled up.
5.7 The Australian Government may wish to establish a specialised research institute on development issues, similar to the UK Overseas Development Institute. Alternatively, the ten-year time frame of this White Paper could be an opportunity for developing longer term partnering links between AusAID and research institutions in Australia and overseas that address development issues. Another option could be to use the aid program as a means of fostering longer term partnering links between Australian research institutes and their counterparts overseas. Whatever option is chosen, increased use of research institutes could be designed to complement and reinforce the development benefits of an expanded role for scholarships in Asia.
47 Examples of high quality applied operational research include Achieving the Twin Objectives of Efficiency and Equity: Contracting Health Services In Cambodia. Indu Bhushan et al. ERD Policy Brief Series Number 6. Asian Development Bank. 2004. Examples from the World Bank include Doing Business in 2005: Removing Obstacles to Growth as well as the innovative work on output based aid (www.gpoba.org)
White Paper Analytical Report - Asia 26

September 2005
Changing aid architecture
5.8 The third change Australia should consider in the way it delivers aid in the
coming decade arises from the rapidly changing environment for aid and overall aid
architecture in Asia.
Multilateral
5.9 At the multilateral level, the coming decade will see major changes to the way the World Bank and ADB engage in the region. Both institutions are evaluating their future role, especially since some large middle income borrowers can access international capital markets readily and may not need to borrow from banks. Both institutions will need to develop how they engage with fragile states, especially when traditional lending products are not appropriate. And both will need to accommodate the increasingly active role being played by India and China as donors rather than borrowers to banks.
5.10 The role and significance of other multilateral institutions on Asia’s economic and development path will also change over the coming decade. Many would argue that in a dynamic and globalising region like Asia, decisions made—or not made— under the auspices of the WTO over the coming decade will have a greater impact on growth and development in Asia than will traditional development financing institutions. And others believe the International Monetary Fund’s (IMF) role in development in Asia may decline somewhat over the decade as more countries build strong foreign exchange reserves.
5.11 Aid architecture in the region over the coming decade will also be affected by new institutions such as the Global Fund to fight AIDS, TB and Malaria, the Global Alliance for Vaccine Initiative, and the Gates Foundation. The initiatives of these institutions are to be welcomed, but new challenges arise when their potentially large funding flows48 occur outside of traditional donor coordination mechanisms or without necessarily having strong capacity building support structures to make use of such funds. There is much Australia could do to work alongside these large, well funded, and innovative foundations. Examples include helping partner governments design and appraise their proposals to such funding bodies; building capacity for the operation of approved funding; and plugging the critical gaps that often emerge in interventions and which undermine broader development effectiveness.
Regional
5.12 Important initiatives likely to continue at a regional and subregional level in the coming decade include the East Asia Summit, Asia Pacific Economic Cooperation (APEC) and the Mekong subregion cooperation. Several regional arrangements have emerged since the Asian crisis, aimed at preventing and enabling better responses to future crises. These include the Association of South East Asian Nations (ASEAN) +3 group (ASEAN plus China, Japan and South Korea), which is becoming the key vehicle for policy dialogue and cooperation in Asia - though the East Asia Summit might evolve into this role over coming years; the Chiang Mai Initiative established by ASEAN+3 for cooperation in crisis financing; the G-20 which includes the major East Asian economies and is a forum for driving the international economic and financial agenda; and the Asian Bond Fund to deepen regional capital markets and increase countries’ capacities to
48 For example, the recently established Global Fund has $US6.9 billion proposals already approved.

borrow in their own currencies.49 An Asian Monetary Fund to promote regional financial
and economic stability has also been mooted several times and no consensus to establish
such an institution has been reached.50
Bilateral
5.13 At the bilateral level, several changes can be expected over the coming decade. Amongst traditional Western donors, there will be a consolidation of donor coordination and harmonisation, as per the Paris Declaration on Aid Effectiveness. This welcome move may occur just as some of the traditional European donors think about exiting programs to countries like Vietnam. On the other hand, new non OECD donors will continue to emerge in Asia. China already is emerging as a potentially significant aid donor51 and South Korea has been an aid donor for some time. Thailand is likewise emerging as a bilateral donor and Vietnam became a donor to the World Food Program in 2005. These trends are likely to increase over the coming decade.
Non traditional
5.14 Asia will also see dramatic changes in the nature of development and broader
capital financing over the coming decade. Foreign direct investment is likely to continue
to be a major source of finance52 for the region, although concentrated in certain
countries and bypassing fragile states and poorly managed countries. However non-
traditional sources of development—for example remittances and migration—will
also be increasingly important. In 36 countries worldwide already, remittances are greater
than all other sources of financial capital combined.53 This is particularly true for the
Philippines, where almost one-quarter of the domestic labour force works overseas,
worker remittances total around US$7 billion per year, and remittances represent nine
per cent of GDP and are six times larger than foreign direct investment.54Remittances
are also important for other countries in Asia such as Bangladesh, Indonesia, Nepal and
Sri Lanka.
5.15 While large and growing, the economic impact of remittances is ambiguous.55
Large flows may dull the demands for reform by poor communities on their national governments: some communities in the Philippines are more dependent on the quality of economic growth and economic governance in the United States, Japan, and Hong Kong than they are of their own country. Such large cross border flows of people and money
49 Martin Parkinson, Steve Kennedy and Gordon de Brouwer, ‘Economic growth stresses and opportunities in the Asia/Pacific, Address to the Leading Australia’s Future in Asia Program. ANU. 28 June 2004. Page 15. Peter Costello, ‘Australia and the Asia-Pacific: Moving forwards as partners, Address to The Macroeconomic Policy and Structural Change in Asia Conference, Sydney, 24 February 2005.
50 Gordon de Brouwer, ‘Institutions to promote financial stability: Reflections on East Asia and an Asian Monetary
Fund’, Treasury Working paper, February 2004, September 2004. Page 21. 51 Dragon in Paradise: China’s Rising Star in Oceania. John Henderson and Benjamin Reilly. The National
Interest. Summer 2003. 52 Asia and the Pacific region recorded more than US$166 billion in foreign direct investment in 2004. 53 The Future of Aid 1. World Bank Public Policy for the Private Sector. March 2005. And by 2020 remittances from developing countries could reach US$200 billion, dwarfing ODA, as workers fill the demographic deficit of richer, aged, OECD countries.
54 Migration and Foreign Remittances in the Philippines Burgess and Haksar. IMF Working Paper WP/05/111. June 2005.
55 Remittances As Development Finance. Mimeograph available from OECD Development Assistance Committee website. See also Migration and Foreign Remittances in the Philippines.
White Paper Analytical Report - Asia 28

September 2005
also raise security questions and facilitate the spread of HIV/AIDS. Some development
agencies anticipate the increased role of remittances in development generally and are
working on how they can improve the development impact of such flows.56 Australia
could do more here too. A good start would be to gear up research on and the analytical
base of trends and consequences of remittances in the region.
Australian aid
5.16 All of this has implications for Australian aid. The rapidly evolving ‘aid architecture’ in Asia suggests Australian aid must continue to be flexible and
opportunistic if it is to retain its relevance and impact in the region. But flexibility needs
to be balanced against the risk of an aid program being simply reactive and dissipating its
efforts across the welter of challenges that will continue to emerge in Asia. Several
informed stakeholders in the region have argued that if Australia is to maximise its
development impact it must identify key priority issues and stick with them.
Development is a long-term process, and reform takes longer than a typical three-year
project horizon.57 Above all, Australia was urged to avoid the temptation of chasing
development fads.
5.17 How Australia might balance this need for strategic focus in a region as large as Asia, while maintaining flexibility in a rapidly changing environment is addressed in the next section.
Country strategies
6.1 Previous sections have looked at the what and how issues of a modern
development program to Asia. This final section looks at where issues. This does not mean individual country-by-country recommendations for each country in Asia—space limitations prevent that. In any event, recommendations made now about country priorities will inevitably change in a region as vast and varied as Asia: reformist governments—or state collapse—in North Korea or Burma over the coming decade would likely see a rapid scaling up of Australian assistance to those countries and a reordering of country allocation priorities. With these comments in mind, these recommendations are made.
Indonesia
6.2 First, Indonesia should continue to be Australia’s major development partner in Asia. The reason is obvious. Indonesia has major development needs: for example just over half of the population lives on less than US$2 per day; less than 20 per cent of households have access to piped water; and only 40 per cent of those eligible are enrolled in senior high school.58 That is reason enough for an active aid program. But these deep development needs are overlaid by Australia’s own national interests which are closely intertwined with Indonesia being stable, prosperous, and well governed. The path
56 See Remittances As Development Finance. Mimeograph available from OECD Development Assistance
Committee website. See also Sending Money Home? A Survey of Remittance Products and Services in the United Kingdom. DFID and Banking Code Standards Board. 2005. 57The 2004 Review of ADB’s Poverty Reduction Strategy notes, for example, that on average ‘roads have a
seven-year lag from an increase in expenditure; expenditure an 11-year lag, and research and extension 13 years
before actual impacts can be achieved’. 58 Indonesia: New Directions. . World Bank CGI brief. . January 2005. . Pages 8 and 73.
White Paper Analytical Report - Asia 29

September 2005
Indonesia follows over the coming decade will affect not just the fourth largest country in the world, and Australia’s nearest neighbour, but the pattern of development in South-East Asia generally. It is therefore in Australia’s national interest to have active, broad engagement in the development of Indonesia. The issue is sufficiently important that there is a separate, stand alone, chapter prepared on Indonesia for the White Paper.
East Timor
6.3 Despite obvious differences, similar principles apply in East Timor: there is a
conjunction between deep development needs, proximity and broad Australian national
interests. More specifically, East Timor is a Least Developed Country with a non-
petroleum GDP per capita of just US$366; a well regarded and prudent approach to
managing potentially large oil revenues but severe institutional and capacity constraints;
and the world’s highest fertility rate of 7.8 children per woman.59 East Timor also faces
the potentially explosive challenge of youth employment, with all the implications this
has for social tension and political instability near to Australia.
6.4 Development need, proximity, and breadth of national interest would therefore again suggest that Australia has a broad spectrum, long term, and substantial program to East Timor. A strategic vision for this program over the coming decade would involve three pillars. The first pillar is a focus on maintaining stability in East Timor through support for its institutions of governance and the police. The second pillar would be developing human capacity in East Timor—an area of acute need and a significant constraint to economic growth and development on all other fronts. This would include support for basic, secondary and vocational education, as well as continuing to offer scholarships to Australian institutions. The third pillar involves improving viable youth employment by working more directly and innovatively to help build a vibrant private sector and giving more attention to employment intensive approaches to infrastructure investments, especially in rural environments.
Phillipines
6.5 Development need, proximity, and national interest—especially security
interests— would suggest that Australia give much more attention to the Philippines—
especially Southern Philippines. Fourteen of the 20 poorest provinces in the
Philippines are in Mindanao, and the incidence of poverty—already the highest in the
Philippines—has increased from 56 per cent in the early 1990s to more than 70 per cent
in 2000.60 This development challenge also overlaps with important security challenges:
one World Bank research paper concludes that the Mindanao conflict, having persisted
for five centuries, is now the second oldest on earth after Sudan; that there have been
more than 120,000 conflict related deaths in Mindanao since the 1970s; and an estimated
$US2 to $US3 billion in direct economic costs.61 The insurgent groups Abu Sayaff and
the Moro Islamic Liberation Front have links with Jemaah Islamiah, and Abu Sayaff has
links with Al Qaeda. The promotion of stability in Southern Philippines is essential to
attract investment and reduce the linkages with regional and international terrorism.
59 Source: World Bank at www.worldbank.org/timorleste
60 The Mindanao Conflict in the Philippines: Roots, Costs, and Potential Peace Dividend. Salvatore Sciavo—
Campo and Mary Judd. The World Bank. Social Development Papers: number 24. February 2005. 61 The Mindanao Conflict in the Philippines. Op cit. Page 5.

6.6 Four specific interventions would make a strategic impact in the SouthernPhilippines—albeit over a long-term horizon.
6.7 The first is education, which is the foundation of development, good governance,
and employment—all of which CAN help reduce a sense of alienation and the appeal of
terrorism. The Philippines has many challenges here: as just one example it has slipped to
a ranking of 42 and 43 out of 46 countries in mathematics and science.62 Particular
challenges arise in Southern Philippines: enrolment rates for secondary schools in the
Autonomous Region of Muslim Mindanao (ARMM) were just 32 per cent, and fewer
than two in ten children who enter grade one in ARMM complete high school.63
6.8 Australia already has a good model for strengthening and broadening educational opportunities for Muslim children in Southern Philippines, including improving the professionalism of teachers and upgrading physical facilities of schools. The approach adopted under the AusAID-supported Basic Education Assistance to Mindanao (BEAM) is so successful that it is being scaled up and rolled out nationally. More assistance in this area would seem justified.
6.9 The second area involves a focus on women as potential peace builders. Like young people, women can be agents of change in society, demanding reform and an end to conflict. Such an approach could draw on the role of women’s groups in helping to end hostilities in Bougainville and Solomon Islands, and involve support for women’s groups to create a demand for long-term peace and better governance in Mindanao.
6.10 The third area involves creating viable employment opportunities, thereby giving young men a stake in their own society. This, of course, is a long-term prospect and challenging, especially given lack of investment in the area and the weak and generally declining competitiveness of the Philippines (Table Two). And there are limits to what an aid program can do to create employment. The promotion of stability—a precondition for investment, economic growth and employment creation—is one area in which aid can assist.
6.11 The fourth area involves continued support for the peace process in the Southern Philippines, to lessen the instability affecting many lives and being exploited by external terrorist operatives. And continuing to build local security infrastructure, including policing, counter-terrorism and border security capacity, will help promote stability and is in Australia’s direct security interest.
6.12 The challenge for Australia is how to engage in this part of the Philippines which, in many ways, represents a failed state where basic security of aid personnel is at question. This also offers real opportunities for innovative designs and approaches: more will have to be done with and through local counterparts and NGOs, and less through expatriate consultants—an approach that, in itself, could be effective.
6.13 There is also scope to help build demand for better governance in the Philippinesmore broadly, through supporting potential agents for change such as womens’ groups.
62 Education Reforms in East Asia: Policy Process and Impact. East Asia Decentralises. World Bank. Page 181.63 Education Reforms in East Asia: Op cit. Pages 193 and 194.
White Paper Analytical Report - Asia 31

September 2005
Mekong countries
6.14 Further North are the Mekong countries. To have impact in this region over the coming decade a development strategy will need to take into account the following. First, the region is highly diverse and changing rapidly: in a decade’s time there will still be a need for a development program with Cambodia, and Lao PDR, but this is unlikely to be the case with Thailand. The engagement strategy will also need to keep pace with the rapidly changing nature of Vietnam. Second, Australia is just one of a number of
developed countries active in the region, so how to work with others, and have impact ourselves, will be different to working in, say, Melanesia. The third factor is the geographical proximity of these countries to fast growing China and India, and the range of social and economic consequences likely to arise over the coming decade from the dynamic changes in those two countries.
6.15 Australia has a broad range of development and national interests at play in these countries. But if Australia is to have identifiable impact in this region it must be increasingly selective, choose a few core areas, stick with them, and then work assiduously with bilateral and multilateral agencies to leverage up our impact. The self reinforcing package of interventions outlined in paragraphs 7.4 and 7.5 would maximise Australia’s impact. Australia must avoid having a range of isolated or fragmented activities that last only a few years and are then replaced by activities in new sectors.
6.16 One specific initiative where Australia could help shape areas of major strategic impact is the Greater Mekong Subregion (GMS). This grouping of six countries64
covers some 300 million people most of whom have a per capita income of US$1 per day. 65 The ADB is an active supporter of this grouping and helps facilitate activities in agriculture, energy, the environment, human resource development, investment, telecommunications, tourism, trade, and transport. The GMS offers an entry point to a region that is large, poor, facing major internal and cross-border challenges with the potential to affect Australia (such as environmental problems and transnational crime), and where well designed aid interventions from Australia could have disproportionately large impact.
China, India and South Asia
6.17 Should Australia be providing aid to China and India in the coming decade?
Many would argue that, with their size and rapid growth, aid to these two giants is no
longer appropriate. After all, China’s GDP is already larger than that of Italy, will
overtake that of France this year, and will probably overtake that of Germany by 2007.66
Similarly, India’s economy is projected to overtake Japan’s in the next five years to
become the third largest in the world.67 At a simplistic level it is hard to see how resource
64 Cambodia, China, Lao PDR, Myanmar, Thailand, and Vietnam. 65 ADB website: Greater Mekong Subregion.
66 Goldman Sachs Global Economic Paper. Op cit. China is also projected to be the third largest economy after the United States and Japan by 2015 and, even with growth rates slowing to 3.5 per cent by the mid 2040s, the world’s largest economy by 2041. While China and India’s emergence as global—not just regional—economic powers is impressive, it does not mean they will come to the table as ‘wealthy’ as the countries they displaced. Even by 2050 China’s GDP per capita is projected to be just US$31,357 (2003 constant dollars) and India’s just US$17,366 compared to that of the United States of US$83,710 and Japan’s of US$66,805.
67 A Tripolar World: India China and the US. Arvind Virmani. Indian Council for Research on International Economic Relations. May 18 2005.
White Paper Analytical Report - Asia 32

September 2005
transfers through Official Development Assistance (ODA) can make a difference in such
large economies: China’s foreign exchange reserves are now reportedly growing at
US$570 million per day or US$24 million per hour68—not a lot short of what Australia
provides per year in aid. Indeed, China and India are active providers of bilateral and
multilateral aid in their own right.
6.18 There are, however, two reasons why Australia should continue to have a
development program with China and India—albeit one that is more forward looking
and appropriate to the changing and contemporary realities of these countries.
6.19 The first is development need. Despite their rapid growth, China and India
account for 40 per cent of the developing world’s population.69 An estimated 212 million
people lived below the US$1 a day poverty line in China in 200170 and China still has an
estimated 594 million below the US$2 a day line. China also has major social challenges
to confront, one symptom of which is the estimated 156,841 women committing suicide
every year: 56 per cent of all female suicides in the world.71
6.20 India has similar challenges. As of 2001, per capita gross national income was just
US$460, and more than one-quarter of India’s population still live below the country’s
poverty line. As the World Bank notes: ‘This means that, with the world’s second largest
population—over one billion—India is home to over one third of the world’s poor
people.’72
6.21 In short, East and South Asia is still the epicenter of poverty and developmentneed in the world.
6.22 However an even more telling reason for continuing—but modernising—Australia’s program to China and India is Australia’s own national interest. A continued focus by China and India on economic reform, broad based and sustainable economic growth, and social and political stability will directly affect the prosperity and stability of one-third of the world’s population living within their borders. It will also be a principal determinant of the pace and pattern of economic growth and stability in the region. It is therefore in Australia’s national interest to use every instrument available to it—including the aid program—to help sustain the momentum of positive reform by those two giants. It makes no sense for Australia to disengage from the two largest drivers of growth and security in the region over the coming decade.
6.23 Five things need to occur if Australia is to make an impact on the directions China and India might take in the coming decade. First, any development program must be highly selective and essentially built around one, or at most two, central themes or flagships known to be of top priority to the leadership group of those two countries. Second, the flagship must be large enough in size; innovative enough in scope; and long
68 Money’s On August Revaluation in the Australian Financial Review. 19 July 2005. Page 11.
69 Economic Growth in the 1990s. Op cit. Page 7. 70 World Development Indicators 2004. Page 3.
71 China 2001-2010: Political Economic and Social Issues of Reform and Transformation. FitzGerald, Davies and Tang. Page 50.
72 India is still home to the world’s largest number of illiterate people and accounts for 20 per cent of the world’s out of school children and for 20 per cent of the gender gap in elementary education. Maternal deaths in India account for almost 25 per cent of the world’s childbirth related deaths.72 Similar challenges arise in the rest of South Asia.

enough in duration, to gain the attention of the leadership groups in these countries,
particularly so with India.73 (Having said that, it is also clear that the aid budget is finite
and priorities have to be set. The convergence of development needs, geographical
proximity, and the breadth and depth of national interests at stake suggest that Indonesia,
East Timor and the Philippines will usually get first priority from Australia.) Third, a
flagship must be as much about ideas as about finances. Fourth, all components of
development cooperation, including scholarships, analytical research and think tanks,
Australian engagement with the World Bank and the ADB, must be managed so they
work in harmony and reinforce each other. Fifth, a traditional donor-recipient model
needs to rapidly change to a more partnering approach to reflect the capacity and
sophistication of China and India.
6.24 Numerous options are available to the Australian Government. The boldest—yet
possibly the most cost effective and high-impact—is sketched out here.
A bold proposal: a single flagship for China and South Asia for the coming decade
Australia chooses one strategically important issue that is a core priority
for development across East and South Asia and which aligns with its
comparative advantage and national interests. This might be the technical,
scientific and policy aspects of clean energy and greenhouse gas
emissions. It might be an aspect of economic policy and governance,
such as public-private partnerships for infrastructure funding. It might be
girls’ education and/or professionalising basic education across the region
through to Pakistan. It might be work on pandemics, including
HIV/AIDS or TB.
Over time, Australia consolidates its funding efforts around this flagship.
By way of illustration, if all of Australia’s current aid program to China
and South Asia were consolidated, there would be a flagship intervention
worth around AUS$94.4 million, or AUS$940 million in current dollars
over ten years. This, by itself, would have more impact than a series of
fragmented bilateral programs.
The impact would be enhanced by the overlapping and reinforcing
components that would come with a scaled up and single focus initiative:
a large scholarships program would build a critical mass of leaders in the
region trained in Australia and networking with each other. The returning
scholars would link up with research institutes, think tanks, and broader
whole-of-government initiatives that AusAID was supporting under the
flagship. The ideas and reforms being generated by this interaction would
also feed into, and itself by influenced by, the analytical, policy and
operational programs of the World Bank and ADB in that area.
Such a model gives strategic focus, but also enables flexibility to respond
to changing circumstances. For example the degree of focus, and the
intellectual leadership role taken by Australia under this flagship model,
73 The level of Australian aid and broader engagement with India has gone through cyclical peaks and troughs
over the decades. Separately, India has recently decided to limit its aid relations to countries with larger programs, to reduce transaction costs and fragmented efforts. Any decision to re-engage with India would need to take this into consideration.
White Paper Analytical Report - Asia 34

September 2005
would enable a range of ongoing, well grounded, new initiatives to be developed for consideration by the Australian Government, each of which could meet the changing needs of the time or the country concerned. If necessary, a separate but relatively small rapid response facility could be available to allow Government to pursue initiatives outside of the single flagship—but without detracting from or diluting it.
6.25. Numerous and less radical permutations are also possible. Government might choose to have, for example, two larger, longer term flagship programs to India and China: one on the high tech side dealing with clean and efficient energy/global warming and the other on the humanitarian side dealing with girls’ education. Alternatively, one flagship could be economic governance and reform, and the other HIV/AIDS. The key is to have a focus, and then stick with it. A ten-year focus on two important streams would have impact, and balance and introduce further substance and ballast into the bilateral relationship with these two countries. Such a program could also be supplemented by a regional program for the other countries of Asia (Sri Lanka, Bangladesh, Pakistan, Nepal, Bhutan, and Maldives).
Resource implications
7.1 Moving Australia’s aid program upstream in the way outlined in this paper has resource implications for AusAID, other Australian Government departments, and Australian research institutions and universities. Aid is a finite resource and its development effectiveness needs to be regularly assessed and the lessons learnt better identified, disseminated and digested by development agencies, partner governments, and other stakeholders. If development shifts to a more upstream and analytical approach over the coming decade, there will also be resource implications for AusAID staff. This might include the need to develop even stronger analytical and technical skills—or ready access to those skills—to be able to engage productively with national counterparts, research institutions, the World Bank, and ADB.
Conclusion
8.1 The strategic starting point for this paper is that Asia is large, varied and changing rapidly. Growth will be an essential pre-condition—but not a guarantee—of poverty reduction, as well as stability in the region and beyond. Australia’s national interests are inextricably bound up in the path of economic and social development of Asia over the coming decade. Australia’s aid program, as part of a whole-of-government engagement in the region, can help shape the response to the challenges of the coming decade.
8.2 Achieving impact in such a large and varied region as Asia is a challenge. Several
recommendations are made.
8.3 First, in terms of sectors, Australia should further consolidate its efforts in economic governance, emphasising links to service delivery and the environment for the private sector. Opportunities exist for significant scaling up of existing work in health, education and rural development. And if Australia is to help shape some of the main drivers of change in Asia in the coming decade, it should also consider new fields like physical infrastructure and political governance.
White Paper Analytical Report - Asia 35

September 2005
8.4 Second, the ten-year timeframe of the White Paper is an opportunity for Australia to be much more strategic and forward looking in the way it delivers aid in the region. Australia should invest more attention and resources into its relations with the multilateral development banks to help shape the way these much larger institutions engage in Asia. Linked to this, Australia should give even greater priority over the coming decade to generating ideas and applied research about development, which can empower reformers in Asia to themselves push forward. This should be complemented with an expanded scholarships program, as well as stronger institution-to-institution links, to help build a critical mass of reform from within. And Australia should look carefully at the rapidly evolving aid architecture in Asia and work more closely with institutions that will shape the economic, social and development agenda in Asia over the coming decade.
8.5 These components—expanded scholarships, improved institution-to-institution links, generating ideas and research, working more closely with multilateral development banks and new institutions—complement and reinforce each other. They work best as a self reinforcing package. And, with adaptation to individual country circumstances, the package works well in fast growing large economies, smaller fragile states, and the range of countries in between.
8.6 Third, Australia should be focused and strategic in its choices about operating at a country level. Indonesia, East Timor, and, to an extent, the Southern Philippines share the characteristics of particularly strong development needs, proximity and a dense web of Australian national interests. That would suggest tailored country programs that might be reasonably large (Indonesia), broad based (East Timor) or innovative (southern Philippines). As the spotlight moves further North and West—through the Mekong countries and into the larger domains of China and South Asia—the need for strategic focus becomes even more pressing. There are ways of getting focus and impact in these regions, but this involves being increasingly selective and sticking with an area for longer periods. It also involves working creatively with large stakeholders such as the multilateral banks.
8.7 The package of approaches in this paper will give focus, coherence and strategic
direction to Australia’s aid program to Asia over the coming decade. But it will alsoenable the program to be sufficiently flexible and responsive to the varied, and rapidly
changing, countries of Asia.
White Paper Analytical Report - Asia 36

Glossary
ADB Asian Development Bank
APEC Asia Pacific Economic CooperationASEAN Association of South East Asian Nations
BEAM Basic Education Assistance to MindanaoGMS Greater Mekong Subregion
IBRD International Bank for Reconstruction and DevelopmentIDA International Development Association
IMF International Monetary FundLICUS Low Income Country Under Stress
MILF Moro Islamic Liberation FrontODA Official Development Assistance
WTO World Trade Organization

Appendix 4
A
Flash Eurobarometer European
Commission
Survey on Tobacco
Analytical report
Fieldwork: December 2008
Publication: March, 2009
This survey was requested by the Directorate General Health and Consumers, and
coordinated by Directorate General Communication.
This document does not represent the point of view of the European Commission.
The interpretations and opinions contained in it are solely those of the authors.

Flash EB Series #253
Survey on Tobacco
Conducted by The Gallup Organisation, Hungary
upon the request of Directorate General Health and Consumers
Survey co-ordinated by Directorate General Communication
This document does not represent the point of view of the European Commission.
The interpretations and opinions contained in it are solely those of the authors.
THE GALLUP ORGANISATION

Analytical report Flash EB No 253 - Survey on Tobacco
Table of contents
Table of contents 3
Introduction 4
Main findings 5
1. Smoking habits 7
1.1 Smoking cigarettes, cigars or pipe 7
1.2 Consumption of non-combustible tobacco 9
1.3 Proportion of tobacco users 10
2. Exposure to tobacco smoke 12
2.1 Second-hand smoke exposure at home 12
2.2 Exposure to tobacco smoke at the workplace 15
3. Smoking restrictions at work 19
4. Attitudes towards smoke-free regulations 22
5. Perceived effectiveness of health warnings 26
5.1 The effectiveness of health warnings on tobacco packs 26
5.2 The effectiveness of pictorial health warnings 31
6. Buying tobacco products over the Internet 34
7. Buying tobacco products in other EU countries 35
8. Contact with potentially smuggled tobacco products 37
I. Annex tables 39
II. Survey details 91
III. Questionnaire 94

Flash EB No 253 - Survey on Tobacco Analytical report
Introduction
Tobacco is the single largest cause of avoidable death; it accounts for over half a million deaths each year in the EU. It is estimated that 25% of all cancer deaths and 15% of all deaths in the Union could be attributed to smoking1.
In order to curb this epidemic, the EU is actively developing a comprehensive tobacco control policy.
This is characterised by legislative measures, support for Europe-wide smoking prevention and
cessation activities, mainstreaming tobacco control into a range of other Community policies (e.g. the
domains of agriculture, taxation and development) and, finally, establishing the EU as a major player
in tobacco control at a global level2.
The current Flash Eurobarometer on Tobacco (Flash No 253), requested by the Directorate General Health and Consumers, was conducted to evaluate the EU citizens’ and Norwegians’ attitudes towards tobacco.
In detail, the survey examined the:
• smoking habits and consumption of non-combustible tobacco products
• exposure to tobacco smoke at home and at the workplace
• status of workplace smoking restrictions
• attitudes towards smoking restrictions in public places
• perceived effectiveness of health warnings on tobacco packs
• extent of tobacco products being bought online
• purchasing of lower-priced cigarettes in other EU countries
• amount of contact with potentially smuggled tobacco products
Other surveys on this topic were conducted in 2002 (Special Eurobarometer 1833), 2005 (Special
Eurobarometer 2394) and 2006 (Special Eurobarometer 272c5). Although the current survey builds on
these earlier ones, it is different in several ways: Flash Eurobarometer 253 has covered different
countries than the previous ones, the questionnaire has been re-designed and telephone interviews
have replaced face-to-face discussions.
The Flash Eurobarometer on Tobacco (Flash No 253) fieldwork was conducted between 13 and 17
December 2008. Over 26,500 randomly-selected citizens aged 15 years and over were interviewed in
the 27 EU Member States and in Norway. Interviews were predominantly carried out via fixed-line
telephone, reaching ca. 1,000 EU citizens in each country (in Cyprus, Luxembourg and Malta the
targeted size was 500). Parts of the interviews in Finland, Austria, Portugal and Italy were conducted
over mobile telephones. Due to the relatively low fixed-line telephone coverage in Bulgaria, the Czech
Republic, Estonia, Latvia, Lithuania, Hungary, Poland, Romania and Slovakia, 300 individuals were
sampled and interviewed on a face-to-face basis.
To correct for sampling disparities, a post-stratification weighting of the results was implemented,
based on key socio-demographic variables. More details on the survey methodology are included in
the Annex of this report.
Please note that due to rounding, the percentages shown in the charts do not always exactly add up to
the totals mentioned in the text.
1 http://ec.europa.eu/health/ph_determinants/life_style/Tobacco/tobacco_en.htm 2 Ibid.
3 http://ec.europa.eu/public_opinion/archives/ebs/ebs_183_en.pdf 4 http://ec.europa.eu/public_opinion/archives/ebs/ebs_239_en.pdf
5 http://ec.europa.eu/public_opinion/archives/ebs/ebs_272c_en.pdf
page 4

Analytical report Flash EB No 253 - Survey on Tobacco
Main findings
Smoking habits and consumption of non-combustible tobacco
• Three out of 10 EU citizens aged 15 and over say they smoke: a quarter (26%) smoke daily and 5% occasionally. Men, the 25-54 year-olds and manual workers are the most likely to be daily smokers.
• Almost half of EU citizens claim that they have never smoked and 22% say they have quit smoking.
• The proportion of smokers is the highest in Greece (42%), followed by Bulgaria (39%), Latvia (37%), Romania, Hungary, Lithuania, the Czech Republic and Slovakia (all 36%).
• One-tenth of respondents (9%) have at least once in their life tried non-combustible tobacco products. Only 2% use such products at present time, either every day or occasionally (both 1%). Slightly more than one-tenth (14%) of the Swedes and 9% of Norwegians use such products either every day or occasionally.
Exposure to tobacco smoke at home and at the workplace
• Fourteen percent of non-smokers and 23% of smokers are exposed to other people’s tobacco
smoke at home on an almost daily basis.
• Home exposure to environmental tobacco smoke (ETS) is the lowest in Finland and Sweden - not more than 5% of Finns and Swedes are regularly exposed to other people’s tobacco smoke at home. Lithuanians, Cypriots, Greeks and Bulgarians are six times more likely to be exposed to ETS at home.
• More than a third of smokers in the EU expose others to ETS at home. The proportion of smokers who expose others to tobacco smoke at home ranges from 8% in Finland to half of the smokers in Poland, Greece, Bulgaria and Denmark.
• A fifth of respondents working outside the home have to do so in places where they are exposed to
tobacco smoke on a daily basis - over half of them for at least one hour a day.
• In Greece, six out of 10 working respondents are exposed to smoke at their workplace on a daily
basis. Nine out of 10 working respondents in Sweden, the UK and Finland are never, or hardly
ever, exposed to tobacco smoke at work.
Status of workplace smoking restrictions
• Seventeen percent of EU citizens - who work at an indoor facility - say there are no restrictions,
or only very weak restrictions on smoking in their workplace.
• More than six out of 10 Greek respondents (62%) report no or only weak restrictions on smoking in their workplace, followed by 47% of Bulgarians and 41% of Lithuanians and Cypriots. In Sweden, France and the UK, less than one-tenth of interviewees say that this is the case at their workplace.
• Working in an area where smoking is not restricted is more likely to occur for men, the over 54s, those with the lowest levels of education, the self-employed and manual workers.
Attitudes towards smoke-free public places
• A majority of EU citizens support smoke-free public places, such as offices, restaurants and bars. Support for workplace smoking restrictions is slightly higher than support for such restrictions in restaurants (84% vs. 79%). Two-thirds support smoke-free bars, pubs and clubs.
page 5

Flash EB No 253 - Survey on Tobacco Analytical report
• Support for smoking restrictions in public places is the highest in Italy and Sweden, while the
Czechs, Austrians and Dutch are each time found to be among the least supportive of such
restrictions.
• Smoke-free public places, such as offices, restaurants and bars, receive more support among non-smokers than among smokers. Half of the smokers are in favour of smoking restrictions in bars compared to seven out of 10 non-smoking respondents.
Perceived effectiveness of health warnings on tobacco packs
• Three out of 10 EU citizens think that health warnings on tobacco packs are effective in informing them about the health effects of tobacco.
• Three out of 10 non-smokers perceive health warnings as being effective in preventing them from smoking and a fifth of smokers think the warnings are effective in persuading them to smoke less or to quit.
• Respondents in Romania, Ireland, the UK and Lithuania perceive health messages as being more effective than their counterparts in the other Member States.
• Younger respondents, the less-educated respondents and manual workers across all groups - those who have never smoked, former smokers and current smokers - appear to be slightly more likely to perceive health warnings on tobacco packs as being effective.
• Adding a colour picture to a text-only health warning is perceived as being effective by more than
half of EU citizens: 20% say this would be very effective and 35% think it is somewhat effective.
Extent of tobacco products being bought online
• Less than 1% of EU citizens surveyed have ever purchased tobacco products over the Internet. This percentage is slightly higher among respondents who have tried non-combustible tobacco products - 3% of them have bought non-combustible tobacco over the Internet and 2% have bought other tobacco products online.
Purchasing of lower-priced cigarettes in other EU countries
• One-tenth of EU citizens participating in the survey have bought lower-priced cigarettes in another EU country in the year prior to the survey.
• Among the respondents who made a trip to another EU country, one-third brought home lower-priced cigarettes; British, French and Italian respondents are the most likely to have done so (between 63% and 70%).
Contact with potentially smuggled tobacco products
• Over one-tenth of EU citizens (12%) have seen tobacco products being sold in the past six months which they think might have been smuggled into the country.
• There are national variations, however: the proportion that has been in contact with potentially smuggled tobacco products in the past six months is the highest in Lithuania (36%) and the lowest in Belgium (4%).

1. Smoking habits
Three out of 10 EU citizens aged 15 and over say they smoke: a quarter (26%) smoke daily and 5% occasionally. Men, the 25-54 year-olds and manual workers are the most likely to be daily smokers.
Almost half of EU citizens claim that they have never smoked and 22% say they
have quit smoking.
The proportion of smokers is the highest in Greece (42%), followed by Bulgaria
(39%), Latvia (37%), Romania, Hungary, Lithuania, the Czech Republic and
Slovakia (all 36%).
One-tenth of respondents (9%) have at least once in their life tried non-combustible tobacco products. Only 2% use such products at present time, either every day or occasionally (both 1%). Slightly more than one-tenth (14%) of the Swedes and 9% of Norwegians use such products either every day or occasionally.
1.1 Smoking cigarettes, cigars or pipe
Three out of 10 EU citizens aged 15 and over say they smoke6: 26% smoke daily and 5% occasionally.
Almost half (46%) of the respondents claim that they have never smoked and 22% say they have quit
smoking.
Smoking cigarettes, cigars or pipe
You smoke every day 26
Smokers: 31%
You smoke occasionally 5
You used to smoke but you have stopped 22
You have never smoked 46
Q1. Regarding smoking cigarettes, cigars or a pipe, which of the following applies to you?
Base: all respondents % EU27, DK/NA not shown
Country variations
Current smokers
The proportion of respondents who say they smoke is the highest in Greece (42%), followed by
Bulgaria (38%), Latvia (37%), Romania, Hungary, Lithuania, the Czech Republic and Slovakia (all
with 36% saying they are smokers). Respondents in Slovenia (22%), followed by those in Sweden and
Finland (both 25%), are the least likely to be smokers.
Similarly, the proportion of interviewees who smoke daily ranges from approximately one-sixth in
Slovenia (17%), Sweden (18%) and Finland (19%) to more than one-third in Greece (35%). The
6 The validity of self-reported smoking, especially in phone interview situations, is sometimes questioned because of the widespread belief that smokers under-report the amount smoked or deny smoking completely. Since social norms do not view smoking as a desirable behaviour, a social desirability bias would result in underestimates of actual smoking habits.
page 7

Flash EB No 253 - Survey on Tobacco Analytical report
proportion of occasional smokers ranges from 3% in Belgium, Italy and Estonia to one-tenth in the
Czech Republic (10%) and Slovakia (11%).
A large majority of smokers in the EU say they smoke daily (84%); the share of regular smokers -
among all smokers - ranges from 70% in Slovakia to 90% in Belgium, Italy and Estonia.
Smoking cigarettes, cigars or pipe
You smoke every day You smoke occasionally You used to smoke but you have stopped You have never smoked
100
80 39
60
19
45 47 47 45 48 46 46 39 44 44 43 46 46 49 48 58 49 52 51 43 46 54 52
17 27
58 47 47 55 49
40 7 16 17 19 16
8 7 8 5 8
18 18 22 22 24 22 22 20
10 11 5 6 8 6 4 5 4
22 23 20 20 29 26 19 22 28 29 24 13 16 22
3 4 4 5 3 4 5 6 3 4 6 7 20 35 31
0
30 28 31 28 26 25 29 28 26 27 28 26 27 27 25 25 24 26 24 23 22 24 22 19
7 5
18 17 21
Q1. Regarding smoking cigarettes, cigars or a pipe, which of the following applies to you? Base: all respondents
% by country, DK/NA not shown
Those who have never smoked
In a few countries, more than half of the respondents claim that they have never smoked: Cyprus and
Portugal (both 58%), followed by Slovenia (55%), Malta (54%), Belgium and Luxembourg (both
52%) and Italy (51%). In Greece and Denmark, on the other hand, only four out of 10 interviewees say
they have never smoked (both 39%).
Former smokers
Although the Danes are among the least likely to have never smoked (see above), the proportion of
smokers in that country is only slightly above the EU average (34% vs. 31%) - more than a quarter
(27%) of the Danish respondents say they have quit smoking. It is, however, the Swedes, Finns and
Dutch who are the most likely to have quit smoking (28%-29%).
Socio-demographic considerations
More men than women say they smoke every day (32% vs. 21%), although a similar proportion of
men and women say they only smoke occasionally (6% and 5%, respectively). Furthermore, women
are more likely to have never smoked (55% vs. 37%), while men are more likely to have quit smoking
(26% vs. 19%).
Only 18% of the oldest respondents (over 54) are smokers - non-smokers have a statistically higher
chance to reach old age. Of the 25-39 year-olds, slightly more than four out of 10 are smokers: 36%
smoking daily and 6% occasionally. Similarly, 35% of the 40-54 year-olds smoke daily and 5% only
occasionally. Respondents between 15 and 24 are the most likely to be occasional smokers (9% vs.
23% who smoke daily). Furthermore, the 15-24 year-olds are the most likely to have never smoked
(60% vs. 46% average), while the over 54s are the most likely to have quit smoking (32% vs. 22%
average).
A similar pattern of differences occurred when looking at the age that respondents left the educational
system. Those still in education - and thus being younger than respondents in the other groups - are
less likely to be regular smokers, but more likely to be occasional smokers (9% vs. 5% average).
page 8

Analytical report Flash EB No 253 - Survey on Tobacco
Respondents with the lowest levels of education - of which a majority are older than 54 - are among
the least likely to smoke (24% vs. 31% average).
Within the group of 15-24 year-olds, the most-educated respondents are less likely than those with
lower levels of education to say they smoke daily or occasionally (32% compared to 42% of the least-
educated respondents). The same overall pattern is found within the group of 25-39 year-olds: while
only 36% of the most-educated respondents are regular or occasional smokers, almost half of those
with lower levels of education smoke (47%-48%). In the age groups over 40 year-of-age, smoking
habits do not show many difference when looking at the respondents’ level of education.
Manual workers are the most likely to smoke regularly (43%), followed by the self-employed (36%),
while the non-working respondents are the least likely to do so (19%). Similar proportions of
respondents in the different occupational groups say they smoke occasionally (4%-7%). Looking at the
respondents who do not smoke, the self-employed are more likely to have quit smoking (24% vs. 19%
of manual workers) and the non-working respondents to have never smoked (54% vs. 33% of manual
workers).
Smoking habits do not show many differences when looking at the respondents’ place of residence.
For more details, see annex table 1b.
1.2 Consumption of non-combustible tobacco
One-tenth of EU citizens have at least once in their life tried non-combustible tobacco products such
as snuff, snus or chewing tobacco. Only 2% use such products at present time, either every day or
occasionally (both 1%).
Note: Currently within the EU, Directive 2001/37/EC on the Manufacture, Presentation and Sale of
Tobacco Products bans the marketing and sales of snus and moist snuff; chewing tobacco and nasal
snuff are permitted.
Use of non-combustible tobacco
You take it every day 1
You take it occasionally 1
You used to take it regularly but you stopped 1
You have tried it at least once 6
You have never tried it 91
Q2. Regarding oral tobacco such as snuff, snus or chewing tobacco, which of the following applies to you?
Base: all respondents % EU27, DK/NA not shown
Country variations
In almost all Member States, a very small percentage (0%-2%) of respondents currently use non-
combustible tobacco products and only a minority have tried such products at least once (ranging from
virtually none of the respondents in Cyprus to 13% in Latvia and the Czech Republic). In the Czech
Republic, Portugal, Denmark, Slovakia and Romania between 3% and 6% of respondents use non-
combustible tobacco products either every day or at least occasionally.

Flash EB No 253 - Survey on Tobacco Analytical report
Sweden and Norway stand out from the pack - 40% of Swedish respondents and 27% of Norwegians
have taken snuff, snus or chewing tobacco at least once in their life. Slightly more than one-tenth
(14%) of the Swedes and 9% of Norwegians use such products either every day or occasionally.
Note: Although snus and moist snuff are prohibited in the EU, article 151 of the Act of Accession of
Austria, Finland and Sweden granted the Kingdom of Sweden a derogation from the provisions of
Directive 2001/37/EC. Norway, a member of the European Economic Area (EEA) is also exempt from
the ban on the marketing of snus and moist snuff on the basis of the EEA Agreement.
Use of non-combustible tobacco
40
You take it every day
You used to take it regularly but you stopped 30 21
20
6
1
10 13 10 5
You take it occasionally
You have tried it at least once
15
3
12
1 3
0
13 11 10 11
1 2 1 1
2 1 1 2 1 1 1
3 1
5
8 7 5 10 8 6 7
8 3 11 2 1 1 2 1 1
1 1 1 1 1
4 4 4 4 5
3 11 5 3 3 3 5 3 1 1 1 1 1 2 21
1 1 1 1 1 1 1
Q2. Regarding oral tobacco such as snuff, snus or chewing tobacco, which of the following applies to you? Base: all respondents
% by country, “You never tried it” and DK/NA not shown
Socio-demographic considerations
Given that only a minority of the respondents have tried non-combustible tobacco, and even less
respondents actually use it, not many differences are observed across socio-demographic groups. Men
are slightly more likely to have tried non-combustible tobacco (9% vs. 3% of women) and respondents
who smoke are also more likely to take non-combustible tobacco occasionally or even regularly (5%
vs. 2% of former smokers and 0.3% of those who have never smoked).
Focusing only on the results for Sweden - which has the highest proportion of non-combustible
tobacco users - it is noted that not only men (25% vs. 3%), smokers and former smokers (23% and
19%, respectively, vs. 6% of those who have never smoked) are more likely to take non-combustible
tobacco occasionally or regularly, but also the 25-54 year-olds (17%-19% vs. 13% of 15-24 year-olds
and 9% of the over 54s), the less-educated respondents (18%-19% vs. 11% of the most-educated
respondents, manual workers (46% vs. 13% of employees) and those living in a rural zone (17% vs.
12% in metropolitan areas).
For more details, see annex tables 2b and 2c.
1.3 Proportion of tobacco users
In the following chart respondents’ answers on the questions about combustible and non-combustible
tobacco use are combined - as such, we are able to get a more complete picture of tobacco use across
the EU Member States.
The proportion of respondents who say they smoke and/or use non-combustible tobacco products,
either every day or occasionally, is the highest in Greece (42%), followed by Bulgaria (39%), Latvia
(38%), Hungary, Slovakia, Romania, the Czech Republic and Lithuania (all 36%). Respondents in
page 10

Analytical report Flash EB No 253 - Survey on Tobacco
Slovenia (23%), followed by those in Finland (25%), Estonia (26%), Portugal and Malta (both 27%)
are the least likely to be tobacco users.
Tobacco users Regular or occasional use of combutible and/or non-combustibale tobacco
60
40
20 42 38 38 36 36 36 36 36
0
35 34 34 33 33 33 32 32 30 29 29 29 29 28 28 27 32
27 27 25 23
Q1. Regarding smoking cigarettes, cigars or a pipe, which of the following applies to you?
Q2. Regarding oral tobacco such as snuff, snus or chewing tobacco, which of the following applies to you? Base: all respondents
% by country
page 11
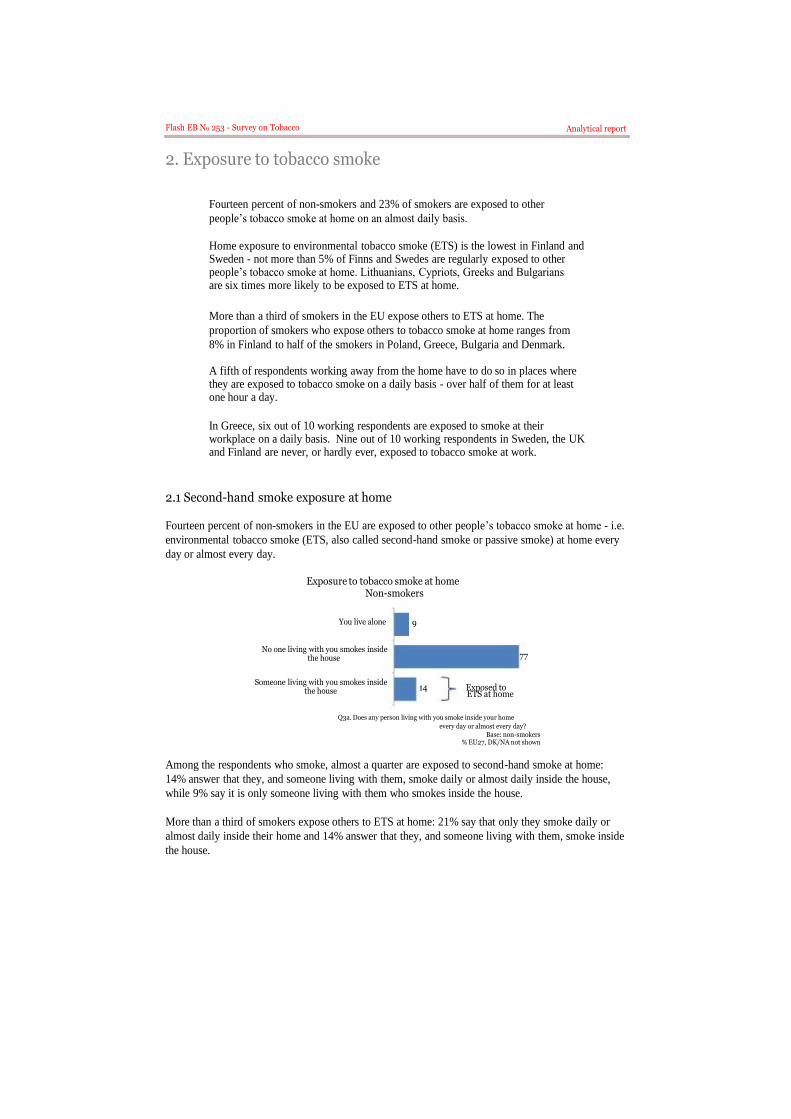
Flash EB No 253 - Survey on Tobacco Analytical report
2. Exposure to tobacco smoke
Fourteen percent of non-smokers and 23% of smokers are exposed to other
people’s tobacco smoke at home on an almost daily basis.
Home exposure to environmental tobacco smoke (ETS) is the lowest in Finland and Sweden - not more than 5% of Finns and Swedes are regularly exposed to other people’s tobacco smoke at home. Lithuanians, Cypriots, Greeks and Bulgarians are six times more likely to be exposed to ETS at home.
More than a third of smokers in the EU expose others to ETS at home. The
proportion of smokers who expose others to tobacco smoke at home ranges from
8% in Finland to half of the smokers in Poland, Greece, Bulgaria and Denmark.
A fifth of respondents working away from the home have to do so in places where they are exposed to tobacco smoke on a daily basis - over half of them for at least one hour a day.
In Greece, six out of 10 working respondents are exposed to smoke at their workplace on a daily basis. Nine out of 10 working respondents in Sweden, the UK and Finland are never, or hardly ever, exposed to tobacco smoke at work.
2.1 Second-hand smoke exposure at home
Fourteen percent of non-smokers in the EU are exposed to other people’s tobacco smoke at home - i.e.
environmental tobacco smoke (ETS, also called second-hand smoke or passive smoke) at home every
day or almost every day.
Exposure to tobacco smoke at home Non-smokers
You live alone
No one living with you smokes inside the house
Someone living with you smokes inside the house
9
77
14 Exposed to ETS at home
Q3a. Does any person living with you smoke inside your home
every day or almost every day? Base: non-smokers
% EU27, DK/NA not shown
Among the respondents who smoke, almost a quarter are exposed to second-hand smoke at home:
14% answer that they, and someone living with them, smoke daily or almost daily inside the house,
while 9% say it is only someone living with them who smokes inside the house.
More than a third of smokers expose others to ETS at home: 21% say that only they smoke daily or
almost daily inside their home and 14% answer that they, and someone living with them, smoke inside
the house.

Exposure to tobacco smoke at home Smokers
You live alone
You live with someone and none of you smoke inside the house
You live with someone and only you smoke inside the house
Both you and someone living with you smoke inside the house
Only someone living with you smokes inside the house
10
45
21 Exposed others to
ETS at home: 35%
14
Exposed to ETS at home: 24%
9
Q3b. Do you or any other person living with you smoke inside your home every day or almost
every day? Base: smokers
% EU27, DK/NA not shown
Country variations
Exposed to ETS at home
Home exposure to ETS is the lowest in Finland and Sweden - not more than 5% of Finns and Swedes
are exposed to other people’s tobacco smoke at home on an everyday basis. Other countries at the
lower end of the scale are Luxembourg, France and the UK - with approximately one in 10
respondents exposed to ETS at home. In Lithuania, Cyprus, Greece and Bulgaria, however,
respondents are six times as likely to be exposed to ETS at home (29%-30%).
Similar to the results for all respondents, exposure of non-smokers to ETS at home is the highest in
Cyprus (31%), Lithuania and Greece (both 28%) and the lowest in Finland (2%) and Sweden (3%),
followed by the UK, Luxembourg and France (7%-9%).
Exposure for smokers, on the other hand, is the highest in Bulgaria (38%), followed by Denmark, the
Czech Republic, Lithuania and Hungary (33%-35%). Finland, Sweden, France and Luxembourg are
found - once again - at the lower end of the distribution.
In all Member States, smokers are more often exposed to other people’s smoke at home than non-
smokers - the exception being Finland; only a very few Finnish smokers are exposed to other’s people
smoke at home (3%).
page 13

Flash EB No 253 - Survey on Tobacco
Proportion of non-smokers and smokers exposed to ETS at home
All respondents
50
40
30
20
Analytical report
10 30 29 29 29 25 24 23 23 23 20 19
0
18 17 17 17 16 16 16 15 15 15 14 12 11 11 10 5 2 9
Non-smokers
50
40
30
20
10
0
31 28 28 23 23 21 20 18 16 17 16 15 14 14 14 14 13 13 13 12 12 11 10 9 8 7 3 2 6
Smokers
50
40
30
20
10
0
38 35 35 34 33 31 30 30 30 30 25 24 24 23 22 21 21 20 19 19 19 18 17 17 17 15 19
11 3
Q3a. Does any person living with you smoke inside your home every day or almost every day? Q3b. Do you or any other person living with you smoke inside your home every day or almost every day?
Base: non-smokers/smokers % by country
Exposing others to ETS at home
The proportion of smokers who expose others to tobacco smoke at home ranges from 8% in Finland
and 16% in Sweden to half of the smokers in Poland (53%), Greece (51%), Bulgaria (50%) and
Denmark (49%).
Proportion of smokers exposing others to ETS at home
60
50
40
30 53
20
10
0
51 50 49 44 44 43 42 39 39 37 35 34
34 33 32 31 31 32 30 29 29 28 28 27 25 24 16
8
Q3b. Do you or any other person living with you smoke inside your home every day or almost every day? Base: smokers
% by country
Socio-demographic considerations
Of the non-smoking respondents, the 15-24 year-olds and the manual workers are the most likely to be
exposed to second-hand smoke at home (27% and 17%, respectively, vs. 14% average). The other
socio-demographic variables show almost no differences in exposure of non-smokers to ETS at home.
page 14
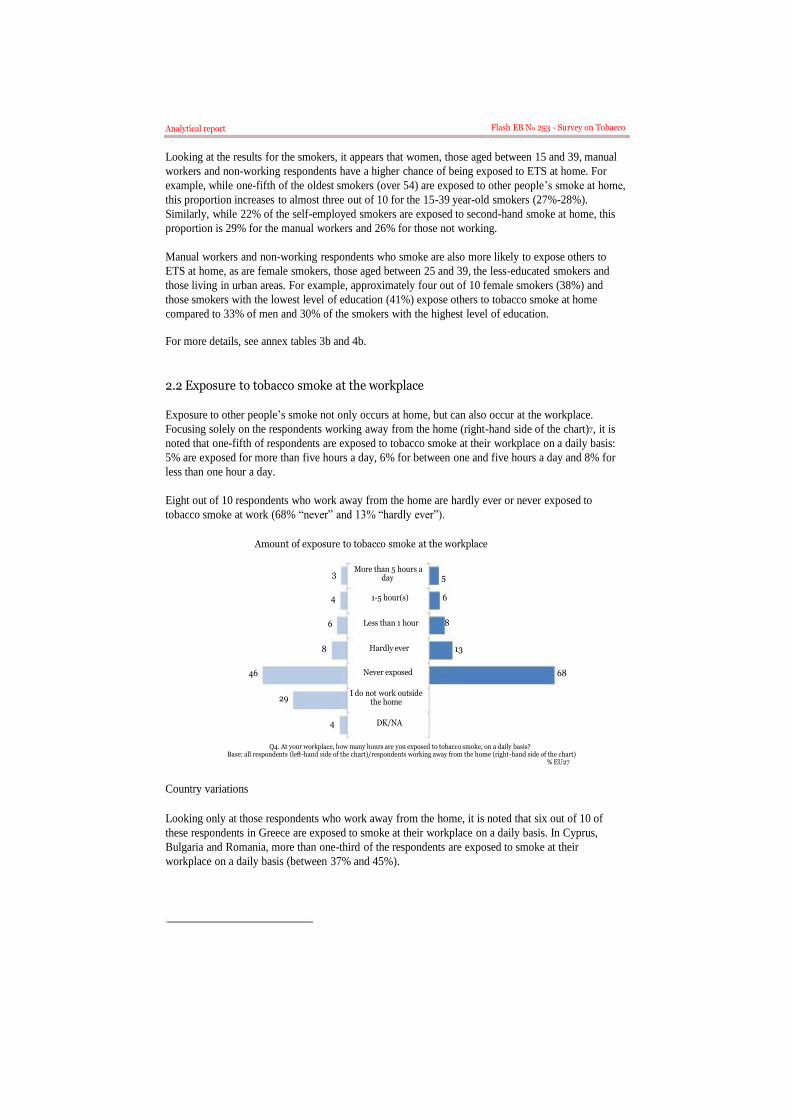
Analytical report Flash EB No 253 - Survey on Tobacco
Looking at the results for the smokers, it appears that women, those aged between 15 and 39, manual
workers and non-working respondents have a higher chance of being exposed to ETS at home. For
example, while one-fifth of the oldest smokers (over 54) are exposed to other people’s smoke at home,
this proportion increases to almost three out of 10 for the 15-39 year-old smokers (27%-28%).
Similarly, while 22% of the self-employed smokers are exposed to second-hand smoke at home, this
proportion is 29% for the manual workers and 26% for those not working.
Manual workers and non-working respondents who smoke are also more likely to expose others to
ETS at home, as are female smokers, those aged between 25 and 39, the less-educated smokers and
those living in urban areas. For example, approximately four out of 10 female smokers (38%) and
those smokers with the lowest level of education (41%) expose others to tobacco smoke at home
compared to 33% of men and 30% of the smokers with the highest level of education.
For more details, see annex tables 3b and 4b.
2.2 Exposure to tobacco smoke at the workplace
Exposure to other people’s smoke not only occurs at home, but can also occur at the workplace.
Focusing solely on the respondents working away from the home (right-hand side of the chart)7, it is
noted that one-fifth of respondents are exposed to tobacco smoke at their workplace on a daily basis:
5% are exposed for more than five hours a day, 6% for between one and five hours a day and 8% for
less than one hour a day.
Eight out of 10 respondents who work away from the home are hardly ever or never exposed to
tobacco smoke at work (68% “never” and 13% “hardly ever”).
Amount of exposure to tobacco smoke at the workplace
3
4
6
8
46
29
4
More than 5 hours a day 5
1-5 hour(s) 6
Less than 1 hour 8
Hardly ever
Never exposed
I do not work outside the home
DK/NA
13
68
Q4. At your workplace, how many hours are you exposed to tobacco smoke, on a daily basis? Base: all respondents (left-hand side of the chart)/respondents working away from the home (right-hand side of the chart)
% EU27
Country variations
Looking only at those respondents who work away from the home, it is noted that six out of 10 of
these respondents in Greece are exposed to smoke at their workplace on a daily basis. In Cyprus,
Bulgaria and Romania, more than one-third of the respondents are exposed to smoke at their
workplace on a daily basis (between 37% and 45%).

Furthermore, 29% of Greek respondents working away from the home are exposed to more than five
hours of smoke on a daily basis. This proportion is also significantly higher than the EU average of
5% in Bulgaria (17%), Cyprus (15%) and Romania (13%).
In sharp contrast, approximately nine out of 10 respondents working away from the home in Sweden
(92%), the UK (89%) and Finland (88%) are never, or hardly ever, exposed to tobacco smoke at work.
Amount of exposure to tobacco smoke at the workplace
More than 5 hours a day
100
30 80 37 40 44 45
51 53 51
11
1-5 hour(s) Less than 1 hour
52
69 63 68 66 68 72 71
Hardly ever Never exposed
71 71 70 60
11
40 20
20
29
0
18
13
17
15
21 20
11 12
12 11
17 13
23 18
19 23 24
14 13 7 15 14
12 9 10 9 13 9 7 9 6 7
10 8 7 7 7 4 6 6
75 77 77 77 77
11 14 13 6 10 12 13 14 16 7 8 9 10
11 8 6 9 5 11 5 9 7 7 7 5 4 6 8 10 7 4 9 6 4 4 4 3 6 4 6 4 5 4 4 4 4 3 13 4 3 2
81
6 2
6
76 77 78 82
12 9 12 10
8 6 8 3 6 3
13 2 02 2
Q4. At your workplace, how many hours are you exposed to tobacco smoke, on a daily basis? Base: respondents working away from the home
% by country
Looking at both the results for second-hand smoke at home and exposure to tobacco smoke at the
workplace, similarities can be seen: each time, the same countries appear at the higher and lower ends
of the distributions. For example:
• In Greece, Cyprus and Bulgaria, respondents are among the most likely to be exposed to other
people’s tobacco smoke at home on an everyday basis (all 29%). Working respondents in
these countries are also the most likely to be exposed to smoke at their workplace on a daily
basis (60%, 45% and 39%, respectively).
• Home exposure to ETS is the lowest in Finland and Sweden (2% and 5%, respectively), and
working respondents in Sweden and Finland are also among least likely to be exposed to
tobacco smoke at their workplace (8% and 11%, respectively).
The correlation coefficient for the relationship between a) the proportion of respondents exposed to
second-hand smoke at home and b) the proportion of respondents exposed to tobacco smoke at work
(among respondents who work away from the home) is .80 - this number signifies a strong correlation
between the two variables at the country level.
page 16

Analytical report Flash EB No 253 - Survey on Tobacco
Correlation between second-hand smoke exposure at home and exposure to tobacco smoke at work - country level
35
Correlation coefficient: rxy = .80
30
25
20
15
DK CZ ES
HU BE
IE EE NL
DE AT
LT CY
BG
RO
PL
SK
EL
10
5
0
0
PT SI LV
UK FR IT
LU MT
NO
SE
FI
5 10 15 20 25 30 35 40 45 50 55 60
% of working respondents who are exposed to tobacco smoke at their workplace on a daily basis
Exposure to ETS at home and the amount of exposure to tobacco smoke at the workplace
The chart on the right-hand side shows
that the likelihood to be exposed to other
people’s tobacco smoke at home
increases with the amount of exposure to
tobacco smoke at the workplace. Among
the working respondents who are never
exposed to tobacco smoke at the
workplace, only 15% are exposed to
second-hand smoke at home. Twice as
many (29%) respondents - who are
exposed to tobacco smoke at work for
more than five hours a day - are (also)
exposed to other people’s tobacco smoke
at home on an everyday basis.
Results by respondents’ characteristics
Proportion of respondents working away from the home who are exposed to ETS at home
by amount of exp osure to tobacc o smoke at wor k
Mo re th an 5 hou rs a day 29
1- 5 hou r(s) 26
Less than 1 hou r 23
Hardly ever 19
Never exposed 15
Q3a. Does an y pers on living w ith you smo ke inside your ho me every day or almo st every day? Q3b. Do yo u or an y oth er pers on livin g with yo u
smo ke in sid e yo ur ho me every day or almost every d ay? Ba se: res pondents working awa y from the hom e; % EU27
Smokers are also more likely to be exposed to smoke at their workplace than non-smoking
respondents: 86% of the non-smoking respondents (working away from the home) are never or hardly
ever exposed to smoke compared to 72% of the respondents who smoke.
page 17

Flash EB No 253 - Survey on Tobacco
More than one-tenth (14%) of
non-smokers have to work in
places where they are exposed to
other people’s smoke on a daily
basis - half of them (7%) for at
least one hour a day. The
proportion of smokers (working
away from the home) who are
exposed to smoke at their
workplace on a daily basis is,
nevertheless, twice as large
(28%).
Men, the 15-24 year-olds, those
still studying and the manual
workers (working away from the
home) are more likely to be
exposed to smoke at their
workplace. For example, only
two-thirds (68%) of manual
Analytical report
Amount of exposure to tobacco smoke at the workplace
Smokers 8
More than 5 hours a day Non-smokers 3
8 1-5 hour(s)
4
12 Less than 1 hour
7
12 Hardly ever
13
60 Never exposed
73
Q4. At your workplace, how many hours are you exposed to tobacco smoke, on a daily basis?
Base: respondents working away from the home % EU27
workers are never, or hardly ever, exposed to smoke at their workplace, compared to eight out of 10
(81%) self-employed respondents. Manual workers are more likely to say that they are exposed to
smoke for between one and five hours a day (10% vs. 5% of the self-employed) or for less than one
hour a day (13% vs. 6%). The proportions of manual workers and self-employed respondents who are
exposed to smoke for more than five hours a day, however, are the same (both 9%).
For more details, see annex tables 5b and 5c.

3. Smoking restrictions at work
Seventeen percent of EU citizens - who work at an indoor facility - say there are
no restrictions, or only very weak restrictions on smoking in their workplace.
More than six out of 10 Greek respondents (62%) report no or only weak
restrictions on smoking in their workplace, followed by 47% of Bulgarians and
41% of Lithuanians and Cypriots. In Sweden, France and the UK, less than one-
tenth of interviewees say that this is the case at their workplace.
Working in an area where smoking is not restricted is more likely to occur for men, the over 54s, those with the lowest levels of education, the self-employed and manual workers.
The right-hand side of the following chart shows that almost a fifth of EU citizens - who work at an indoor facility8 - say there are no restrictions, or only weak restrictions on smoking in their workplace: 8% say that smoking is not restricted at all at their workplace and 9% answer that it is allowed in some areas but not everywhere in the building.
Two-thirds of interviewees report a total restriction on smoking in their workplace (i.e. they answer
that smoking is not allowed anywhere indoors) and 17% say that smoking is allowed in a special
smoking room.
Smoking restrictions at work
40
10
5
5
5
29
5
Smoking is not allowed anywhere indoors 66
Smoking is allowed only in a special smoking room 17
Smoking is allowed in some areas but not everywhere within the building 9
Smoking is not restricted at all 8
I do not work indoors
I do not work outside the home
DK/NA
Q5. What best describes the smoking restrictions at your place of work?
Base: all respondents (left-hand side of the chart)/respondents working in an indoor facility (right-hand side of the chart) % EU27
8 In this section, we focus solely on the respondents who say they work in an indoor facility - as such, we are
able to get a more complete picture of the differences in workplace restrictions across the EU Member States.
page 19

Flash EB No 253 - Survey on Tobacco Analytical report
Smoking restrictions at work and the amount of exposure to tobacco smoke at the workplace
The chart on the right-hand side
shows that almost half of the
respondents who say there are no
restrictions, or only weak
restrictions on smoking in their
workplace are exposed to tobacco
smoke at work on a daily basis (20%
are exposed for more than five hours
a day, 13% for between one and five
hours a day and 13% for less than
one hour a day). The corresponding
proportion for respondents who
work in a location where smoking is
completely restricted, or where
smoking is only allowed in a special
smoking room is three times lower
(14% vs. 46%).
Country variations
Amount of exposure to tobacco smoke at work
No or w eak sm o king 20 restr ictio ns at w ork
Mo re than 5 hou rs a day 2
Sm o king is not allow ed or
is only allow ed in a sp ecial 13
1- 5 hou r(s) sm o king ro om 4
13 Less than 1 hou r
8
15 Hard ly ever
12
38 Never exposed
73
Q4 . At yo ur workp lace, h ow many h ours are you expos ed to tobacco s moke, on a daily b asis?
B ase : re sponde nts worki ng a wa y from the home % EU27
There is a large variation, across the EU Member States, in workplace smoking restrictions. More than six out of 10 (63%) of Greek respondents - working in an indoor facility - say there are no restrictions, or only very weak restrictions on smoking in their workplace; followed by 47% of Bulgarians and 41% of Lithuanians and Cypriots. In Sweden, France and the UK, on the other hand, less than one-tenth of interviewees say that this is the case at their workplace.
Furthermore, 38% of Greek respondents say that smoking is not restricted at all in their workplace,
followed by 28% of Cypriots and 21% of Bulgarians. In sharp contrast, less than 5% of British,
Swedish, French and Luxembourgish respondents answer that smoking is not restricted at all.
More than eight out of 10 British, Swedish and French respondents answer that smoking is not allowed anywhere indoors at their workplace. Respondents in Greece are more than four times less likely to report a total restriction of smoking in their workplace (88% in the UK, 85% in Sweden and 83% in France vs. 20% in Greece).
Smoking restrictions at work
Smoking is not restricted at all
Smoking is allowed only in a special smoking room
100
20
80 34 35 40 38 37 33 36 47 51 53
Smoking is allowed in some areas but not everywhere within the building
Smoking is not allowed anywhere indoors
47 52 17
60 19
24 23 19
40 33 34 26 26 13 22
29 20 38 16 18 11 15
21 28
57 72 66 71 66
46 46
23 20
7 15 17 12 13 12 8 11
10 8 11 9
70 72 74 72 77 79 78 85 83 88 82
36 36
7 16 14 13 15 10 10 11 8 5 7 9 10
12 13 0
page 20
17 9 6 7 5 7 7 5 11 12 11 11 13 9 8 11 8 8 9 8 4 4 4 5 7 6 5 6 7 5 4 4 4 3 3
Q5. What best describes the smoking restrictions at your place of work? Base: respondents working in an indoor facility
% by country

Analytical report Flash EB No 253 - Survey on Tobacco
Results by respondents’ characteristics
One-fifth of smokers - working in an indoor facility - say there are no restrictions, or only very weak
restrictions on smoking at their workplace; the corresponding proportion for non-smokers is 15%.
A slightly higher proportion
of non-smokers say they
work in a location that
restricts smoking completely
(i.e. smoking is not allowed
anywhere indoors - 68% vs.
62% of smokers).
A similar small difference is
found, for example, when
comparing men with women
(62% vs. 70%) or the 15-24
year-olds and the over 54s
with the 25-54 year-olds
Smoking restrictions at work
Smoking is not allowed anywhere indoors
Smoking is allowed only in a special smoking room
Smoking is allowed in some areas but not everywhere within the building
Smoking is not restricted at all
Smokers Non-smokers
62
68
18
16
10
8
10
7
(64% vs. 66%-67%). A
significantly larger difference
is found when comparing
Q5. What best describes the smoking restrictions at your place of work? Base: respondents working in an indoor facility
% EU27
respondents across occupational groups: only half of the manual workers say they work in a location
that restricts smoking completely compared to 63% of the self-employed and 71% of the employees.
Working in a place where smoking is not restricted at all is more likely to occur for men (11% vs. 6%
of women), the oldest respondents (12% vs. 7%-9% in the other age groups), those with the lowest
levels of education (14% vs. 6% in the highest educational category), the self-employed and manual
workers (15%-16% vs. 5% of employees).
For more details, see annex tables 6b and 6c.

4. Attitudes towards smoke-free regulations
A majority of EU citizens support smoke-free public places, such as offices, restaurants and bars. Support for workplace smoking restrictions is slightly higher than support for such restrictions in restaurants (84% vs. 79%). Two-thirds
support smoke-free bars, pubs and clubs.
Support for smoking restrictions in public places is the highest in Italy and
Sweden, while the Czechs, Austrians and Dutch are each time found to be among
the least supportive of such restrictions.
Smoke-free public places, such as offices, restaurants and bars, receive more support among non-smokers than among smokers. Half of the smokers are in favour of smoking restrictions in bars compared to seven out of 10 non-smoking respondents.
Almost three-quarters (73%) of the participating EU citizens are totally in favour of smoking
restrictions in offices and other indoor work places and 11% are somewhat in favour of such
restrictions. Only one-tenth of the respondents strongly oppose workplace smoking restrictions.
A large majority of the interviewees are also in favour of smoke-free restaurants (63% are totally in
favour and 16% somewhat in favour), but they are less likely to support smoke-free bars, pubs and
clubs (47% “totally in favour” and 18% “somewhat in favour”). One-fifth of the respondents do not
support smoking restrictions in restaurants and one-third are against smoking restrictions in bars, pubs
and clubs.
Attitudes towards smoke-free regulations
Totally in favour Somewhat in favour Somewhat opposed
Totally opposed DK/NA
Offices and other indoor workplaces 73 11 4 10 2
Restaurants 63 16 9 11 2
Bars, pubs and clubs 47 18 15 17 4
Q6. Are you in favour of smoking bans in the following places? Whould you say, you are totally in favour, somewhat in favour,
somewhat opposed or totally oppose of smoking bans in...
Base: all respondents
% EU27
Country variations
Over two-thirds of interviewees in all EU Member States and Norway favour smoking restrictions in
offices and other indoor work places; ranging from approximately seven out of 10 respondents in
Cyprus (66%), the Netherlands (71%) and Denmark (73%) to more than nine out of 10 in Italy (95%),
Sweden (92%) and Finland (91%).
In Italy, Sweden and Finland, approximately nine out of 10 respondents (87%-90%) are totally in
favour of smoking restrictions in offices and other indoor work places. In Cyprus, the Czech Republic
and Poland, on the other hand, slightly less than six out of 10 interviewees (57%-58%) share this
opinion. However, while a quarter of the Cypriots are totally opposed to smoke-free offices and other
indoor work places, less than one-tenth (8%) of the Czech and Polish interviewees hold that view.
page 22

Analytical report Flash EB No 253 - Survey on Tobacco
Attitudes towards smoking restrictions in offices and other indoor work places
Totally in favour Somewhat in favour
100 3
Somewhat opposed Totally opposed DK/NA
1 6
80
60
6 21
6 2 4
7 6 7 3 4 4
16 16 12
9 2
6
9 8 9 3 5 3
5 7 16
6 5
21
8 8 9 9 8 8 10 14 11 9 12 3 3 4 5 5 4 2 3 6 8 9 8 10 8 10 8 4
11 14 12
25
10 8 11 18 16 19 24 6 4 12 4
14 5 9 7 18 7 10 8 8
8
40 88 90 87 73 72 76 82 82 71 80 65 77
20
0
77 76 77 74 73 79 75 68 57
79 69 66 58 67 63 63
58
Q6. Are you in favour of smoking bans in the following places? Whould you say, you are totally in favour, somewhat in favour, somewhat opposed or totally oppose of smoking bans in...
Base: all respondents % by country
A majority of citizens in all Member States also support smoking restrictions in restaurants - ranging
from 62% in Austria to 95% in Italy.
The Italians, followed by the Maltese and Swedes, are the most likely to favour regulating smoking in
restaurants. Almost nine out of 10 Italian respondents (88%) and eight out of 10 Maltese and Swedish
respondents (both 81%) select the “totally in favour” response. In sharp contrast, only half as many
Austrians and Czechs give this response (38% and 41%, respectively).
In a majority of the countries, support for smoke-free restaurants is slightly lower than support for
smoke-free offices and other indoor work places. The most notable exceptions are Austria, Bulgaria,
Spain and the Czech Republic - in these countries, the difference in support for each type of smoking
restriction is larger. For example, 80% of Austrians are in favour of smoke-free offices but only 62%
support smoke-free restaurants (a difference of 18 percentage points).
Attitudes towards smoking restrictions in restaurants
100
Totally in favour Somewhat in favour
3 1 9 7 8 7 9 11 8 8
Somewhat opposed Totally opposed DK/NA
8 8 10 7
80
2 7
5 11 3 5 5 3 5 8 6
14 10 10 7 11
9 8 9 7 11 6 9 8 9 9 7 10 9 10 18 17
13 13 10 16 14 18 20 15 23 12 19 10
8 10 12 13 12 15 21 9
60
40 88 81 81
23 19 20
73 76 76 78 74 72 60 65 64 62 61
24 26 16 14 16
28 18 14
57 54 63 61 59 47 54
11 16 12
19 13 14 12
16
24 25
70
51 49 53 51 5320 41 38
0
Q6. Are you in favour of smoking bans in the following places? Whould you say, you are totally in favour, somewhat in favour, somewhat opposed or totally oppose of smoking bans in...
Base: all respondents % by country
Similar to smoking restrictions in offices and restaurants, citizens in Italy are the most prone to accept
smoking restrictions in bars, pubs and clubs (93% - 87% “totally in favour”). Sweden and Ireland
join Italy at the higher end of the scale with approximately eight out of 10 respondents supporting
smoke-free bars, pubs and clubs (70% in both countries is totally in favour). In three Member States
page 23

Flash EB No 253 - Survey on Tobacco Analytical report
support for smoking restrictions drops below 50%: Austria (47%), Germany (45%) and the
Netherlands (44%).
In all countries - except in Italy - smoking restrictions in bars, pubs and clubs are significantly less
accepted than smoking restrictions in offices or in restaurants. For example, 85% of Belgians are in
favour of regulating smoking in offices and 82% in restaurants, however, only 54% also agree with
regulating smoking in pubs, bars and clubs.
Attitudes towards smoking restrictions in bars, pubs and clubs
100 3 3
7
Totally in favour Somewhat in favour
9 13 10 9 10 10 14 15 16 11 11
Somewhat opposed Totally opposed DK/NA
12 17 16 18 17 19 12
80
60
40 87
6 6 8 13 10
25
13 13 14 10 11 13 16
7 12 28 20 22 17 16
18
26
18
29
18 21 18 15 25
12 15 17 17 11 16 20 14 16 18 15 16 12
25 19 21
23 21 31 29 32 12
22 17 20 27 11
17 21 20
25 22 13
70 70 54
20 46 54 52 56 65 53 56 41
0
50 37
47 48 47 41 37 39 47 33 34 41
24 23 17 13
61
27 24 28 31
Q6. Are you in favour of smoking bans in the following places? Whould you say, you are totally in favour, somewhat in favour, somewhat opposed or totally oppose of smoking bans in...
Base: all respondents
% by country
Results by respondents’ characteristics
Smoke-free public offices receive more support among interviewees who work at an indoor facility with strict smoking restrictions (i.e. smoking is not allowed anywhere indoors or it is only allowed in a special smoking room) - 86% of these respondents are in favour of smoking restrictions in offices and other indoor work places compared to 74% of respondents who say there are no restrictions, or only very weak restrictions on smoking in their workplace.
Attitudes towards smoking restrictions in offices and other indoor work places
Smoking is not allowed or is only allowed in a special smoking room
No restrictions or only weak smoking restrictions at work
77 10 4 9 1
61 13 7 17 3
Totally in favour
Somewhat in favour
Somewhat opposed
Totally opposed
DK/NA
Q6. Are you in favour of smoking bans in the following places? Whould you say, you are totally in favour, somewhat in favour, somewhat opposed or totally oppose of smoking bans in...
Base: respondents working away from the home % EU27
Smoke-free public places, such as offices, restaurants and bars, also receive more support among non-
smokers than among smokers:
• Eight out of 10 smokers (78%) are in favour of smoking restrictions in offices and other
indoor work places compared to more than eight out of 10 non-smokers (86%).
• More than eight out of 10 non-smokers also support smoking restrictions in restaurants, while
only seven out of 10 smokers accept such restrictions (83% vs. 68%). Furthermore, seven out

• Finally, half of the smokers (51%) are in favour of restricting smoking in bars, pubs and clubs
and a quarter (27%) are totally against such restrictions; the corresponding proportions for
respondents who do not smoke are 71% and 12%.
Attitudes towards smoke-free regulations
Offices and other indoor work places
Restaurants
Bars, pubs and clubs
Totally in favour
Smokers Non-smokers
Offices and other indoor 63 15 7 13 3 77 9 3 9 2
workplaces
50 19 13 Re17u2ants 69 14 7 9 2
34 18 19rs, pu27and3lubs 53 18 13 12 4
Somewhat in favour Somewhat opposed Totally opposed DK/NA
Q6. Are you in favour of smoking bans in the following places? Whould you say, you are totally in
favour, somewhat in favour, somewhat opposed or totally oppose of smoking bans in... Base: all respondents
% EU27
At least eight out of 10 respondents across all socio-demographic groups support smoking restrictions
in offices and other indoor work places - ranging from 80% of the self-employed to 88% of those
still in education. Women, the most-educated respondents, those living in urban areas and employees
are slightly more likely than their counterparts to select the “totally in favour” response. For example,
while three-quarters of employees are totally in favour of smoking restrictions in offices and other
indoor work places, only two-thirds of the manual workers agree with them.
The socio-demographic analysis for support for smoking restrictions in restaurants and bars, pubs
or clubs shows that men, older respondents, those in the middle educational category, respondents
living in metropolitan areas, manual workers and the self-employed appear to be less likely to accept
smoking restrictions in such public places. For example:
• Three-quarters of the self-employed and manual workers are in favour of smoking restrictions
in restaurants compared to eight out of 10 employees and non-working respondents.
Furthermore, 15% of the self-employed respondents and 13% of manual workers say they are
totally opposed to such restrictions compared to one-tenth of the latter.
• Half of the over 54 year-olds (51%) are totally in favour of smoking restrictions in bars, pubs
and clubs and only 14% are totally against such restrictions. The corresponding proportions
for the 15-24 year-olds are 44% and 18%.
For more details, see annex tables 7b, 8b and 9b.
page 25

Flash EB No 253 - Survey on Tobacco Analytical report
5. Perceived effectiveness of health warnings
Three out of 10 EU citizens think that health warnings on tobacco packs are
effective in informing them about the health effects of tobacco.
Three out of 10 non-smokers perceive health warnings as being effective in preventing them from smoking and a fifth of smokers think the warnings are effective in persuading them to smoke less or to quit.
Respondents in Romania, Ireland, the UK and Lithuania perceive health messages
as being more effective than their counterparts in the other Member States.
Younger respondents, the less-educated respondents and manual workers across all groups - those who have never smoked, former smokers and current smokers -appear to be slightly more likely to perceive health warnings on tobacco packs as being effective.
Adding a colour picture to a text-only health warning is perceived as being effective by more than half of EU citizens: 20% say this would be very effective and 35% think it is somewhat effective.
5.1 The effectiveness of health warnings on tobacco packs
Those respondents who have never smoked, and both former and current smokers are asked to
evaluate the effectiveness of such health warnings on tobacco packs in terms of: a) informing them
about the health hazards of tobacco and b) keeping them from smoking.
Note: The Tobacco Products Directive (2001/37/EC) introduced new health messages to be put on
tobacco products and dramatically increased the size of the warnings. The Directive set out two
general warnings - “Smoking kills” and “Smoking seriously harms you and others around you” - and
14 additional warnings, to be placed on the front and back of each pack.
Overall, three out of 10 (31%) EU citizens think that health warnings on tobacco packs are effective in
informing them about the hazards and effects of smoking. Warnings are perceived as similarly
effective in preventing respondents from smoking (in the view of never-smokers and former smokers -
30%) and somewhat less effective in persuading people to smoke less or to quit (in the opinion of
smokers - 22% and 19%, respectively).
One-third of those who have never smoked (32%) think that health warnings on tobacco packs are
effective in informing them about the health effects of tobacco. A similar proportion (31%) say that
health messages are effective in persuading them not to start smoking. Similarly, three out of 10
former smokers (31%) answer that health messages are effective for the former purpose and 28% say
the same for the latter.
Although a similar proportion of smokers say that such warnings are effective in informing them
about the health hazards and effects of smoking (29%), they are less likely to perceive them as being
effective in persuading them to smoke less or to try to quit smoking (22% and 19%, respectively).
page 26

Analytical report Flash EB No 253 - Survey on Tobacco
Effectiveness of health warnings on tobacco packs
Very effective Somewhat effective Not very effective Not at all effective DK/NA
Never-smokers
Informing you about the health effects of tobacco 12 20 24 31 13
Persuading you not to start smoking 14 16 20 35 14
Former smokers
Informing you about the health effects of tobacco 10 21 26 35 8
Persuading you not to start smoking again 14 14 21 42 10
Current smokers
Informing you about the health effects of tobacco 9 20 24 44 3
Getting you to smoke less 6 15 21 54 3
Getting you to try to quit smoking 5 13 21 58 2
Q7a/b/c. Thinking about the health messages that are on tobacco packs, have these messages been very effective, somewhat effective, not very effective or
not effective at all in each of the following ways?
Base: all respondents
% EU27
Country variations
Non-smokers (those who have never smoked and former smokers)
More than six out of 10 (62%) Romanian respondents, and approximately half of the Irish, British and
Lithuanian respondents (46%-51%), who have never smoked or who have quite smoking, answer that
health warnings on tobacco packs are effective in informing them about the health effects of
tobacco. In Romania, four out of 10 respondents say that warnings are very effective for this purpose;
in Ireland, the UK and Lithuania, the respondents are twice less likely to share this opinion (19%, 22%
and 17%, respectively).
In comparison with non-smokers in Romania, the Finns, Estonians, Czechs and French are almost
three times less likely to perceive health messages as being effective in informing them about the
health hazards and effects of tobacco (between 19% and 23%). Furthermore, in the latter list of
countries not more than 5% of non-smokers think the health messages are very effective for this
purpose.
Similar to the results for the effectiveness of informing people about the health effects of smoking, a
majority of non-smokers in Romania think that health warnings are effective in preventing them
from starting to smoke: 46% say they are very effective and 15% somewhat effective. In all of the
other Member States, however, less than half of non-smokers perceive health messages as being
effective for this purpose. The proportion of respondents who perceive the messages as being effective
ranges from slightly less than one-fifth in Estonia (18%), the Czech Republic, Finland and Austria (all
19%) to more than four out of 10 respondents in the UK (42%), Ireland (43%), Slovakia (46%) and
Lithuania (47%).
Focusing on the likelihood of choosing the other extreme answering category - not at all effective - it
is noted that more than four out of 10 Cypriot, Bulgarian, Hungarian, Italian, Portuguese and
Norwegian non-smokers think that health messages are not at all effective in informing them about the
health impacts and effects of smoking and more than half of the Norwegians and Cypriots say they are
not at all effective in preventing them from starting to smoke.
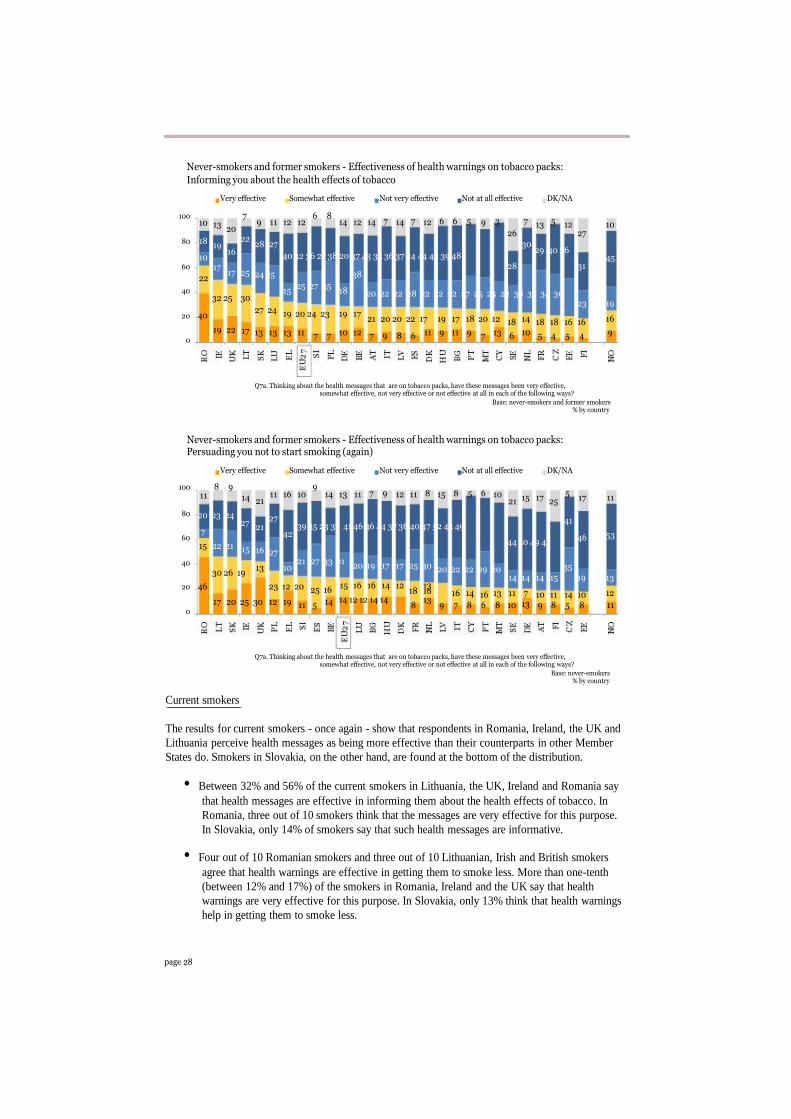
Never-smokers and former smokers - Effectiveness of health warnings on tobacco packs:
Informing you about the health effects of tobacco
Very effective Somewhat effective
100 7 6 8
Not very effective Not at all effective DK/NA
7 7 6 6 5 3 7 5 10
80 18
10 60
22
13
19
17
20 22
16
17 25
9 11 12 12 14 12 14 14 12 9
28 27
40 32 36 27 38 20 37 43 35 36 37 44 44 42 39 48
24 25 38
13 12 10 26 27
30 29 40 36
45 28 31
40 32 25 30
20 40
25 27 35 15 18
27 24 19 20 24 23 19 17
20 22 22 28 22 22 22 27 25 24 22 38 35 34 30 23 19
21 20 20 22 17 19 17 18 20 12 14 16
19 22 0
17 18 18 18 16 16
13 13 13 11 10 12 11 9 11 9 13 10 9 7 7 7 9 8 6 7 6 5 4 5 4
Q7a. Thinking about the health messages that are on tobacco packs, have these messages been very effective, somewhat effective, not very effective or not effective at all in each of the following ways?
Base: never-smokers and former smokers % by country
Never-smokers and former smokers - Effectiveness of health warnings on tobacco packs: Persuading you not to start smoking (again)
Very effective Somewhat effective
100 8 9 9
Not very effective Not at all effective DK/NA
7 9 8 8 5 6 5
80
60
40
11
20 23 24
7
15 22 21
14
27
15
21
21
16
11 16 10 14 13 11 12 11 15 10
27 39 35 23 37 41 46 46 44 37 36 40 47 52 43 49
42
27 21 27 33 21
15 17 17 11 21 25
41
53 46 44 50 49 41
13 10 30 26 19
20 46 23 12 20
20 19 17 17 25 30 20 22 22 29 20
15 16 16 14 12 13
35
14 14 14 15 19 13
25 16
17 20 25 30 12 19 14
18 16 14 12 12 14 14 13
16 14 13 11 7 12 16 10 11 14 10 13
0
Current smokers
11 5 8 9 7 8 6 8 10 9 8 5 8 11
Q7a. Thinking about the health messages that are on tobacco packs, have these messages been very effective, somewhat effective, not very effective or not effective at all in each of the following ways?
Base: never-smokers % by country
The results for current smokers - once again - show that respondents in Romania, Ireland, the UK and
Lithuania perceive health messages as being more effective than their counterparts in other Member
States do. Smokers in Slovakia, on the other hand, are found at the bottom of the distribution.
• Between 32% and 56% of the current smokers in Lithuania, the UK, Ireland and Romania say
that health messages are effective in informing them about the health effects of tobacco. In
Romania, three out of 10 smokers think that the messages are very effective for this purpose.
In Slovakia, only 14% of smokers say that such health messages are informative.
• Four out of 10 Romanian smokers and three out of 10 Lithuanian, Irish and British smokers
agree that health warnings are effective in getting them to smoke less. More than one-tenth
(between 12% and 17%) of the smokers in Romania, Ireland and the UK say that health
warnings are very effective for this purpose. In Slovakia, only 13% think that health warnings
help in getting them to smoke less.
page 28

Analytical report Flash EB No 253 - Survey on Tobacco
• Finally, slightly more than one-third of Romanian smokers and a quarter of those in Lithuania,
the UK and Ireland think that health messages influence them to try to quit smoking. One-
sixth of the smokers in Romania think the messages are very effective for this purpose - in
Slovakia, on the other hand, only half as many smokers say that health messages are very or
somewhat effective (8%).
Similar to the results obtained for the EU overall, smokers in all Member States perceive health
messages as being less effective in influencing their actual smoking behaviour. Furthermore, not much
variation is observed across most countries in smokers’ perceptions of the effectiveness of health
warnings to get them to smoke less (between 11% and 24% in 20 countries) and to persuade them to
try to quit smoking (between 10% and 20% in 20 countries). Some countries, nevertheless, stand out
from the pack with a higher proportion of smokers choosing the “not at all effective” response:
• More than seven out of 10 Austrian (77%), Finnish (74%), German (72%) and Norwegian
(73%) smokers say that health warnings are not at all effective in convincing them to smoke
less (vs. EU average of 54%).
• Similarly, at least three-quarters of the smokers in Austria (77%), Germany (75%), Finland
and Norway (both 74%) perceive health warnings as not being at all helpful in getting people
to try to quit smoking (vs. EU average of 58%).
Current smokers - Effectiveness of health warnings on tobacco packs: Informing you about the health effects of tobacco
Very effective Somewhat effective
100 3 1 2 3 3 1 3 3 1
Not very effective Not at all effective DK/NA
2 2 3 2 1 1 1 1 4
80 28
60 12
8 7
29 32
13
27 47
10 6 5 4 5 8 3 6
55 57 44 58 48 44 43 51 36 40 37 54 55 53 49 35 53 43 47 36 40 54 42 62
22 38
40 26
37
20
23
22 24 13 23 28 29 22 39 26 37 11 15
28 24 22 19 20 15 19 17
42 34
17 19 23 27 22 29 37 37 28 39 23
30 13 18
0 4
20 23 21 19 18 21 19 19 18 19 17 13 15 15 16 14 11 9 7 8 11 9 11 8 9 6 3 5 6 7 3 5 4 5 3 4 7 5 4 3 3 3
Q7c. Thinking about the health messages that are on tobacco packs, have these messages been very effective, somewhat effective, not very effective or not effective at all?
Base: smokers % by country
page 29

Flash EB No 253 - Survey on Tobacco Analytical report
Current smokers - Effectiveness of health warnings on tobacco packs:Getting you to smoke less
Very effective Somewhat effective Not very effective Not at all effective DK/NA
100 5 4 2 0 2 1 3 4 3 2 3 2 3 1 2 3 4 2 4 5 3 0 5 2
80
60
40
39
16
24
5 7
27 37
49 41 43
39
16 23 28 38
10
62 61 54 57 47 50 50 56 58 44 56 60
13 16 21 19 24 28 28 22 21 35 25 20
6 9
48
61 63 58 67 72
35 14 16 14 21
46 50
74 77
36 36
73
20
17 0
26 18 18
5 12 12
21 20 15 15 15
5 4 9 8 6 17 18 16 18 17 14 14 19 4 5 5 2 3 2 3
9 17 17 13 14 13 13 9 10
15 11 11 9 5 4 4 4 7 8 7 7 1 3 2 2 1 1 2
Q7c. Thinking about the health messages that are on tobacco packs, have these messages been very effective,
somewhat effective, not very effective or not effective at all? Base: smokers
% by country
Current smokers - Effectiveness of health warnings on tobacco packs: Getting you to try to quit smoking
Very effective
100 4 3 1 2 2 2 1
80 33
45 49
Somewhat effective Not very effective
1 2 2 1 2 2 2 4 2 3 1
39 47
Not at all effective DK/NA
5 3 5 2 1 1 1 0 5 3 2
54
60
40 16 38
59 58 61 54 66 62 55 58 51
41
50 65 62 68 62 64 54 59 59 53
75 74 77 74
18 20
17
26 20
20 19 17
16 19 19 25 21 13 18
18 15 14 12 13 16 14 13
29 33 26
16 19 15 19 19
14 16 15 13 12 10 9 10
26 24 26 33 37
12 16 15 12
10 12 10 11 8
0 5 5 7 6 5 6 3 7 6 5 5 4 2 3 4 4 6 6 5 5 3 4 2 482 62 62 82
Q7c. Thinking about the health messages that are on tobacco packs, have these messages been very effective,
somewhat effective, not very effective or not effective at all? Base: smokers
% by country
Socio-demographic considerations
Younger respondents, the less-educated respondents and manual workers across all groups - i.e. those
who have never smoked, former smokers and current smokers - appear to be slightly more likely to
perceive health warnings on tobacco packs as being effective.
Among the 15-24 year-olds, 41% of those who have never smoked, 39% of former smokers and 29%
of current smokers think that health messages effectively inform them about the health effects of
tobacco. The corresponding proportions for the over 54 year-olds are, respectively, 28%, 28% and
25%.
Four out of 10 of the 15-24 year-old respondents who have never smoked and 36% of the former
smokers in this age category say that health warnings help them not to start smoking (again). Only
slightly more than a quarter of the over 54 year-olds share this opinion (27% and 26%, respectively).
The 15-24 year-old smokers, however, are less likely than their older counterparts to perceive health
warnings as being a support to smoke less or to quit smoking.
A least one-third of the manual workers - those who have never smoked (35%), former smokers

Analytical report Flash EB No 253 - Survey on Tobacco
them about the health effects of tobacco. In all other occupational groups, not more than a third of
those who have never smoked, the former and current smokers share this opinion.
One-third of manual workers who have never smoked and three out of 10 who have quit smoking say
that health messages persuade them not to start smoking (again), compared to only, respectively, 29%
and 23% of the self-employed respondents who have never smoked and the former smokers. Similarly,
approximately a quarter of the manual workers who smoke say that health messages are effective in
persuading them to smoke less (25%) or to quit altogether (23%); the corresponding proportions for
the self-employed are, respectively, 19% and 12%.
Approximately one-third of the former smokers (34%) and current smokers (32%) with the lowest
level of educational attainment perceive health warnings as informative, compared to approximately
three out of 10 former smokers (31%) and current smokers (28%) in the highest educational category.
One-third of the least-educated former smokers also think these messages help them not to start
smoking again (32% vs. 24% in the highest educational category) and almost a quarter of the least-
educated smokers say that they help them to smoke less (23% vs. 18% in the highest educational
category). No significant differences are found when comparing the perceptions of those who have
never smoked across educational groups.
For more details, see annex tables 10b through 16b.
5.2 The effectiveness of pictorial health warnings
The EU is also promoting the use of pictorial warnings on tobacco packs and has established a library of 42 different images conveying messages on the effects of tobacco on people’s health. These pictorial warnings are starting to appear in Member States: Belgium introduced them in November 2006, Romania followed in July 2008 and the UK in October 2008.
Adding a colour picture, illustrating the health effects of smoking, to a written health warning is perceived as being effective by a slight majority of EU citizens: 20% say this would be very effective and 35% think that it would be somewhat effective. The corresponding proportions for Norway are 15% and 26%, respectively.
Comparing respondents’ answers on the question about the effectiveness of (text-only) health
warnings in informing them about the health hazards of smoking and the one about the perceived
effectiveness of pictorial health warnings, it is noted that:
• One-third of interviewees did not distinguish between the two types of health warnings in terms of their effectiveness (e.g. they select for both questions the “somewhat effective” response).
• More than four out of 10 (44%) interviewees perceive pictorial health warnings as more
effective than text-only health warnings.
• Only 11% of respondents think that text-only health warnings are more effective than the
pictorial health warnings, illustrating the health effects of smoking9.
9 One-tenth of respondents gave a “don’t know” response on the question about effectiveness of text-only health
messages and/or pictorial warnings.
page 31

Flash EB No 253 - Survey on Tobacco Analytical report
Effectiveness of pictorial health warnings on tobacco packs
Very effective Somewhat effective Not very effective Not at all effective DK/NA
100 2 2 4 7 7 7 4 6 4 6 6 5 6 7 6 5 6 6 4
80
60
40
20
0
14
9
34
41
10
14
38
36
9 16 12
9 16
32
40
40 25
11
19
33
29
18
13
43
20
15 18
17 18
36 36
25 23
8 8
11 17 12
22 20 23
41 42 40
18 16 17
8
21 16 11 22 26
26 15 19 23 19
32 35 37 40 36
23 20 18 15 18
11 11 8
16 27 25 32 30 28
23 26 33 36
29 18 20 20
17 18 19 27 31 15
36 33 35 34 32 30 26 23 26
29
14 16 14 11 13 15 16 15 15 8
Q8a. In your opinion, how effective would adding a colour picture illustrating the health effects of smoking be in strengthening the text-only health warning?
Base: all respondents in all countries with the exception of BE, RO and UK % by country
In all EU Member States, and Norway, pictorial health warnings are thought to be more effective than
text-only warnings. The proportion of respondents who think that adding such pictorial messages
would be effective ranges from slightly less than four out of 10 respondents in the Czech Republic
(37%) and the Netherlands (38%) to three-quarters in Ireland (75%) and Cyprus (74%). Similarly, the
proportion selecting the “very effective” response ranges from slightly less than one in 10 in the Czech
Republic (8%) to four in 10 in Ireland (41%) and Greece (40%).
Belgium, Romania and the UK
We noted in the previous section that Romanian and British respondents are among the most positive about the effectiveness of health warnings on tobacco packs. One element that can help explain the more positive attitude towards health warnings in these countries is that respondents did not only think about the text-only warnings but also about the pictorial warnings when judging the effectiveness of health warnings on tobacco packs. As mentioned above, both countries introduced these pictorial warnings during 2008. When asked specifically about the effectiveness of pictorial health warnings on tobacco packs, 61% of Romanian and 56% of British respondents say that such warnings are effective when added to a text-only warning.
Attitudes towards pictorial health warnings on tobacco packs
Very effective S omewh at effective
Not very effective Not at all effective
DK /NA
RO 31 30 10 19 9
UK 28 28 11 14 19
BE 12 27 29 17 15
Q8b. In you r o pinion , h ow effective h as addin g a co lou r pictu re illus tratin g the h ealth effects of s mok in g been in
strength ening the text-o nly health w arn in g? Bas e: al l re sponde nts in B E, R O and UK
% by country
Although Belgium also uses pictorial warnings on tobacco packs, the Belgian respondents are more sceptical about the effectiveness of health warnings than the Romanian and British interviewees. Twelve percent of Belgian respondents think that adding a colour picture to the text-only health warning, illustrating the health effects of smoking, is very effective and 27% say that this is somewhat effective.
page 32

Analytical report
Results by respondents’ characteristics
Respondents who have never smoked or who have quit smoking are slightly more optimistic about the effectiveness of adding pictorial warnings to text-only warnings on tobacco packs: half of the smokers think this is an effective strategy compared to 56% of the former smokers and 58% of those who have never smoked.
Younger respondents are also more likely to think that it would be effective to add a colour picture, illustrating the health effects of smoking, to a written warning (66% vs. e.g. 50% of the over 54s).
Although manual workers appear to be more positive about the effectiveness of
Flash EB No 253 - Survey on Tobacco
Effectiveness of pictorial health warnings on tobacco packs
Ver y effective Som ewhat effective
Not very effective No t at all effective
D K/NA
All respondents 20 35 19 21 6
Smo kers 18 32 20 27 4
Never-smokers 20 38 18 16 7
Form er smo kers 21 35 17 20 6
Q8a/ b. In your op in ion, ho w effect ive wou ld/h as ad ding a colou r p icture illu strating th e health effects o f sm oking be/ been in
strength ening the text-o nlyh ealth warn in g? Ba se: al l respondents in all countrie s with the e xce ption of BE , R O and UK
% Tota l
health warnings in general (see above), they are less likely to think that adding a pictorial warning
would be effective (50% vs. 57% of employees).
For more details, see annex table 17b.

Flash EB No 253 - Survey on Tobacco Analytical report
6. Buying tobacco products over the Internet
Less than 1% of EU citizens surveyed have ever purchased tobacco products over the Internet. This percentage is slightly higher among respondents who have tried non-combustible tobacco products - 3% of them have bought non-combustible tobacco over the Internet and 2% have bought other tobacco products online.
Less than 1% of EU citizens have ever bought tobacco products online. Czech, Danish and Latvian
interviewees are the most likely to have purchased tobacco products over the Internet - however, even
in these countries only between 2% and 3% of respondents have experience buying tobacco products
online.
Buying tobacco products over the Internet 5
4
3
2
3.2
1 2.5 2.2 1.8
0
1.5 1.4 1.2 1.1 1.1 1.1 1.1 0.8
1.01.0 0.8 0.7 0.6 0.6 0.5 0.4 0.4 0.4 0.3 0.2 0.2 0.2 0.2 0.1 0.0
Q9a. Have you ever bought tobacco products over Internet? Q9b. Have you ever bought oral tobacco (such as snuff, snus or chewing tobacco) or other tobacco products over Internet?
Base: all respondents % by country, “Yes” shown
Among the respondents who use non-combustible tobacco, or who have tried it at least once, slightly
more respondents have experience with buying tobacco products online: 2% have purchased non-
combustible tobacco, 1% have bought both non-combustible tobacco and “other” tobacco products
and 1% have only bought “other” tobacco products (see annex table 20a).
Respondents who use non-combustible tobacco at
present time, either every day or occasionally, are
the most likely to have purchased such products
online: 3% have purchased non-combustible
Buying tobacco products over the Internet
Base: Respondents who use oral tobacco
Yes, oral Yes, other tobacco and
tobacco products and another 3% have bought
both non-combustible tobacco products and
“other” tobacco products.
The Internet sales of non-combustible tobacco
products are concentrated in a number of
countries. In Bulgaria, the Czech Republic and
Latvia approximately one-tenth of the
respondents, who use or have tried non-
combustible tobacco, have purchased non-
tobacco
products, 1.4
Yes, oral
tob acco, 2 .8
oth er tob acco DK/NA, 0.1 p roducts, 3.2
Never, 92.6
combustible tobacco online.
Note: since not more than one-sixth of the
Q9 b. Have you ever bo ugh to ral to bacco (su ch as sn uff, sn us or chewin g to bacco) or oth er tob acco p ro ducts over I nternet?
Ba se : re sponde nts who use oral toba cco ev ery day or occa siona lly % EU27
Bulgarian, Czech and Latvian respondents use or tried non-combustible tobacco and only a minority
of them have actually bought tobacco products online, their proportion among all respondents is
actually less than 3.5%.
For more details, see annex table 20c.
page 34
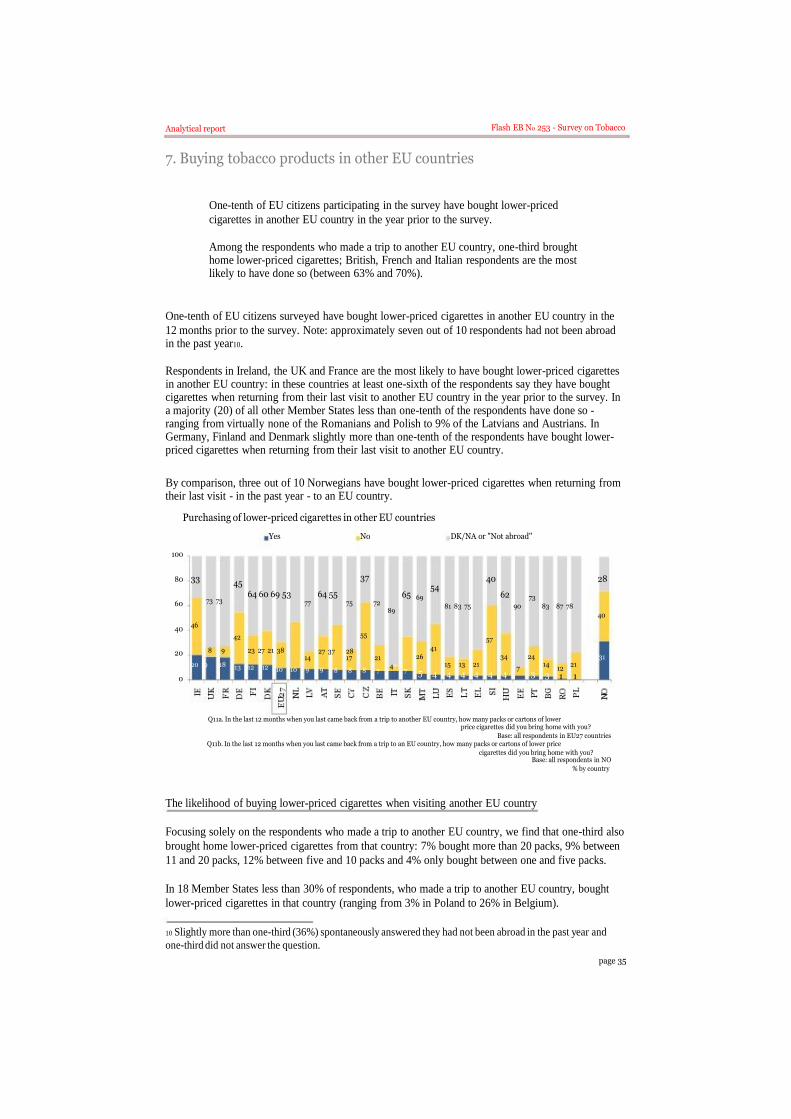
Analytical report Flash EB No 253 - Survey on Tobacco
7. Buying tobacco products in other EU countries
One-tenth of EU citizens participating in the survey have bought lower-priced
cigarettes in another EU country in the year prior to the survey.
Among the respondents who made a trip to another EU country, one-third brought home lower-priced cigarettes; British, French and Italian respondents are the most likely to have done so (between 63% and 70%).
One-tenth of EU citizens surveyed have bought lower-priced cigarettes in another EU country in the
12 months prior to the survey. Note: approximately seven out of 10 respondents had not been abroad in the past year10.
Respondents in Ireland, the UK and France are the most likely to have bought lower-priced cigarettes in another EU country: in these countries at least one-sixth of the respondents say they have bought cigarettes when returning from their last visit to another EU country in the year prior to the survey. In a majority (20) of all other Member States less than one-tenth of the respondents have done so -ranging from virtually none of the Romanians and Polish to 9% of the Latvians and Austrians. In Germany, Finland and Denmark slightly more than one-tenth of the respondents have bought lower-priced cigarettes when returning from their last visit to another EU country.
By comparison, three out of 10 Norwegians have bought lower-priced cigarettes when returning from their last visit - in the past year - to an EU country.
Purchasing of lower-priced cigarettes in other EU countries
100
80 33 45
Yes No
37
64 60 69 53 64 55
DK/NA or "Not abroad"
40 28 54
65 62 60
40
20
73 73
46
42
8 9 23 27 21 38
20 19 18
77 75 72 89
55
27 37 28 14 17 21
69 73
81 83 75 90 83 87 78
57
41 26 34 24
15 13 21 14 21
40
31
13 12 12 10 10 9 9 8 8 8 747
7 7 12
05 4 4 4 4 4 4 3 3 1 1
Q11a. In the last 12 months when you last came back from a trip to another EU country, how many packs or cartons of lower price cigarettes did you bring home with you?
Base: all respondents in EU27 countries Q11b. In the last 12 months when you last came back from a trip to an EU country, how many packs or cartons of lower price
cigarettes did you bring home with you? Base: all respondents in NO
% by country
The likelihood of buying lower-priced cigarettes when visiting another EU country
Focusing solely on the respondents who made a trip to another EU country, we find that one-third also
brought home lower-priced cigarettes from that country: 7% bought more than 20 packs, 9% between
11 and 20 packs, 12% between five and 10 packs and 4% only bought between one and five packs.
In 18 Member States less than 30% of respondents, who made a trip to another EU country, bought
lower-priced cigarettes in that country (ranging from 3% in Poland to 26% in Belgium).
10 Slightly more than one-third (36%) spontaneously answered they had not been abroad in the past year and
one-third did not answer the question.
page 35

Flash EB No 253 - Survey on Tobacco Analytical report
In the UK, France and Italy, however, more than half of these respondents bought lower-priced
cigarettes (70%, 67% and 64%, respectively). In Latvia, Finland and Estonia, the proportion of
respondents who brought home lower-priced cigarettes from a trip to another EU country is slightly
higher than the EU average (40%, 35% and 35%, respectively). By comparison, 44% of the Norwegian respondents bought lower-priced cigarettes in an EU country.
Amount of lower-priced cigarettes brought home from another EU country
100
80 30 33 36
12 4
20+ packs 11 - 20 packs
60 65 65 68 68 69 70 74
5 - 10 packs 1 - 5 packs none
56
60
19
40
13
20
75 76 77 18 12
20
27 17 3 10 4 5 3 19 8 8 4 1
25 14 12 13 11 8 8 5
79 80 80 81 83 83 85 87 88 90 91 91 94 97
16
5 1
26 17
0 6
16 9 6
4 3 5 5
9 15 9 12 9 8 8 11
11 3 6 5 7 6 5 4 2 2 3
10 13 2 6 3 2 22 7 8 8 5 5 1 1 4 5 6 4 3 22 5 6 3 4 3 4 2 3 3 1 5 5 5 2 2 2 2 4 2 3 22 2 51 2 1 2
Q11a. In the last 12 months when you last came back from a trip to another EU country, how many packs or cartons of lower
price cigarettes did you bring home with you? Base: EU27; respondents who had made a trip to another EU country
Q11b. In the last 12 months when you last came back from a trip to an EU country, how many packs or cartons of lower price cigarettes did you bring home with you?
Base: NO; respondents who had made a trip to an EU country % by country
The amount of cigarettes bought in another EU country
Respondents in the UK are the most likely to have bought more than 20 packs of lower-priced
cigarettes (26%), while respondents in France and Italy are more likely to have bought between 11 and
20 packs (27% and 25%, respectively). Respondents in Finland and Estonia, on the other hand, are
most likely to have bought between five and 10 packs (19% and 14%, respectively), while equal
proportions of the Latvians bought from one to five packs (17%) or from five to 10 packs (16%).
Results by respondents’ characteristics
Not surprisingly, smokers are a lot more likely to have bought lower-priced cigarettes in another EU
country: 57% of the respondents who smoke - and who made a trip to another EU country - say they
bought cigarettes when returning from their last visit to another EU country in the year prior to the
survey compared to only 17% of respondents who do not smoke.
Women, the over 54s and those not working are less likely to have bought lower priced cigarettes in
another EU country. For example, 23% of the over 54 year-olds bought cigarettes when returning from
their last visit to another EU country in the year prior to the survey compared to more than a third of
respondents younger than 55 (between 35% and 38%).
For more details, see annex tables 22c.
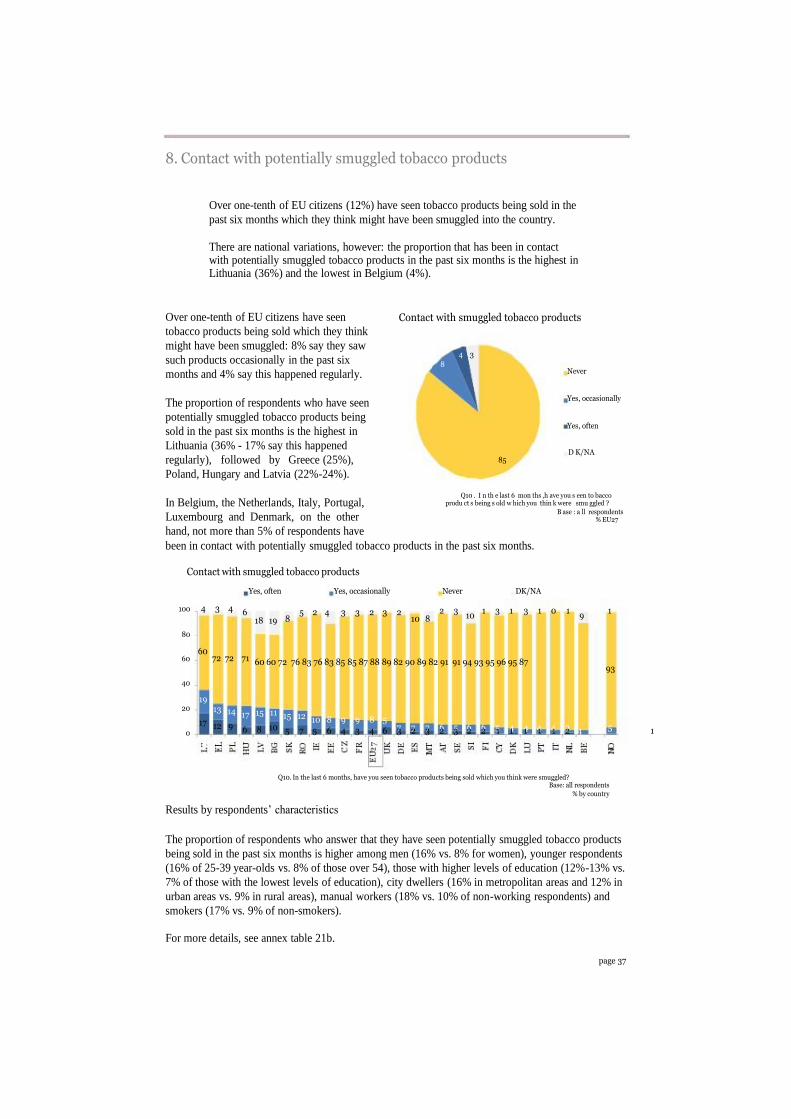
8. Contact with potentially smuggled tobacco products
Over one-tenth of EU citizens (12%) have seen tobacco products being sold in the
past six months which they think might have been smuggled into the country.
There are national variations, however: the proportion that has been in contact with potentially smuggled tobacco products in the past six months is the highest in Lithuania (36%) and the lowest in Belgium (4%).
Over one-tenth of EU citizens have seen
tobacco products being sold which they think
might have been smuggled: 8% say they saw
such products occasionally in the past six
months and 4% say this happened regularly.
The proportion of respondents who have seen
potentially smuggled tobacco products being
sold in the past six months is the highest in
Lithuania (36% - 17% say this happened
regularly), followed by Greece (25%),
Poland, Hungary and Latvia (22%-24%).
In Belgium, the Netherlands, Italy, Portugal,
Luxembourg and Denmark, on the other
hand, not more than 5% of respondents have
Contact with smuggled tobacco products
4 3
8 Never
Yes, occasionally
Yes, often
D K/NA 85
Q10 . I n th e last 6 mon ths ,h ave you s een to bacco produ ct s being s old w hich you thin k were smu ggled ?
B ase : a ll respondents % EU27
been in contact with potentially smuggled tobacco products in the past six months.
Contact with smuggled tobacco products
Yes, often
100 4 3 4 6 18 19
80
60 60 72 72 71
Yes, occasionally
5 2 4 3 3 2 3 2 8 10 8
Never DK/NA
2 3 1 3 1 3 1 0 1 1 10 9
60 60 72 76 83 76 83 85 85 87 88 89 82 90 89 82 91 91 94 93 95 96 95 8793
40
1920 13 14 1117
17 0
15
12 9 6 8
15 12 10 8 9 9 8 5 10 7 7 7 6 5 6 6 5 4 4 4 4 3 5 5 7 5 6 4 3 4 6 3 2 3 2 3 2 2 1 1 1 1 1 2 4 1
Q10. In the last 6 months, have you seen tobacco products being sold which you think were smuggled? Base: all respondents
% by country
Results by respondents’ characteristics
The proportion of respondents who answer that they have seen potentially smuggled tobacco products
being sold in the past six months is higher among men (16% vs. 8% for women), younger respondents
(16% of 25-39 year-olds vs. 8% of those over 54), those with higher levels of education (12%-13% vs.
7% of those with the lowest levels of education), city dwellers (16% in metropolitan areas and 12% in
urban areas vs. 9% in rural areas), manual workers (18% vs. 10% of non-working respondents) and
smokers (17% vs. 9% of non-smokers).
For more details, see annex table 21b.
page 37