Embed Size (px)
DESCRIPTION
analytical procedures
Citation preview

Pergamon
Journal of Accounting Education, Vol. 12, No. 3, pp. 245-268, 1994 Copyright 0 1994 Elsevier Science Ltd Printed in the USA. All rights reserved
0748-5751/94 $6.00 + .OO
074%5751(94)00012-3
Case
USING REAL-WORLD CASES TO ILLUSTRATE THE POWER OF ANALYTICAL PROCEDURES
Brian Patrick Green UNIVERSITY OF MICHIGAN -DEARBORN
Thomas G. Calderon UNIVERSITY OF AKRON
Abstract: Accounting instructors often introduce analytical procedures (APs) to students as a series of techniques that help to reduce audit time and cost. However, they do not generally provide students with sufficient real-world cases that encourage students to use data from multiple sources, exercise judgment, and evaluate risks. This paper uses MiniScribe Corpora- tion to illustrate how a real-world case might be incorporated into an auditing class to achieve some of the recommendations of the Accounting Education Change Commission and, at the same time, highlight the efficiency and effectiveness of APs. The case also reinforces the joint importance of qualitative and quantitative factors in detecting management fraud.
Recently, several accounting educators and practitioners have expressed concern about the content and process of accounting education (Arthur Andersen & Co. et al., 1989 [the “Big-Eight White Paper”]; Dugan, Gup, & Samson, 1991; Inman, Wengler, & Wickert, 1989; Mohr, 1991). Among the concerns of these critics is that students entering the profession are ill- prepared to use data, exercise judgment, evaluate risks, and solve real- world problems. The Accounting Education Change Commission has stim- ulated a considerable amount of discussion relating to the deficiencies in accounting education and has proposed alternatives for redressing the situa- tion. In its recent position paper. Objectives of Education for Accountants (1990), the Commission recommends that:
Students must be active participants in the learning process, not passive recipi- ents of information. They should identify and solve unstructured problems that require use of multiple information sources. . . . Teaching methods that expand and reinforce basic communication, intellectual, and interpersonal skills should be used. (p. 5)
The teaching of analytical procedures (APs) in the auditing course is an area in accounting education that is subject to the criticisms listed above. This paper presents a real-world case, MiniScribe Corporation, that may be
245

246 B. P. Green and T. G. Calderon
used to supplement instruction in the area of analytical procedures and risk assessment. The case helps to address many of the deficiencies and criti- cisms highlighted above, and at the same time, exposes students to issues relating to the efficiency and effectiveness of APs in signaling the existence of fraud. Some instructors may also find the case useful in discussing ethics. However, the focus of this presentation is on analytical procedures.
The teaching notes and analysis that accompany the case use a tandem approach that emphasizes both qualitative and quantitative factors in the analytical review process. This approach emphasizes signals derived from both quantitative APs and the qualitative environmental factors that sup- port the interpretation of these signals. Since the approach requires a sys- tematic and comprehensive evaluation of both quantitative and qualitative factors, it results in a more complete consideration of red flags in an audit situation. Use of a tandem approach in teaching APs is consistent with SAS No. 56 (AICPA, 1989), which requires auditors to use both quantitative and qualitative analytical procedures. Real-world cases that involve compa- nies in which management fraud has actually taken place represent an in- valuable resource for implementing the tandem approach. The case pre- sented in this paper, MiniScribe Corporation, illustrates how such cases might be incorporated into the auditing class to highlight the utility of APs, and helps in fostering the “active participant” role of accounting students.
The next section of the paper describes the MiniScribe case. A subsequent section, Teaching Notes, details the case requirements, briefly reviews the conceptual and authoritative background for the tandem approach, and presents the analysis. Details of the actual fraud are also presented. The analysis focuses on the sales, accounts receivable, and inventory accounts since most management frauds involve these areas (Loebbecke, Eining, 8~ Willingham, 1989).
THE MINISCRIBE CASE
Prior to 1985, MiniScribe Corporation (CUSIP #6603669; SIC #3572), ’ a manufacturer of computer disk drives, had sustained a series of losses. Contributing to those losses were the company’s huge investments in re- search and development, and the start-up of a new plant in Singapore. The net loss for fiscal year 1984 exceeded $5.7 million. The losses for the first and second quarters of 1985 were $12.5 million and $7.1 million, respec- tively. The disk drive industry was plagued with major employee layoffs during that period. MiniScribe had reduced its own workforce by 26% in 1984, and the company dismissed another 450 employees in 1985. Other disk drive producers, including Onyx & IMI, Priam, and Seagate Technol-
‘The details about MiniScribe Corporation were obtained from the company’s annual report, the company’s IO-K, and other documents filed with the SEC.

AnaIyticai Procedures 247
ogy, were also experiencing similar economic stress. Even with the industry facing losses and layoffs, survivors were beginning to emerge.
In May of 1985, an investor group led by Hambrecht & Quist (H&Q) provided a $20 million capital infusion into the company. As part of the new investment deal, Q. T. Wiles, who was the chairman of H&Q, became the chairman of MiniScribe. Immediately thereafter, he restructured the company’s senior management. As part of his restructuring efforts, Mr. Wiles divided the company into about two dozen profit centers. The com- position of those profit centers, however, changed often-almost quar- terly-because of internal conflict. Mr. Wiles managed the company from his offiees in California. All other management operations were headquar- tered in Colorado.
Mr. Wiles was a well-known figure in industry. Because of his history of taking and revitalizing ailing companies, he was popularly referred to as “Dr. Fix-it.” He was known for his forceful, target-oriented approach to m~agern~~t. After taking over MiniScribe~ Mr. Wiles held quarterly man- agement meetings in which he emphasized the need to set high targets and to achieve them. Each manager was required to set quarterly financial goals which became the basis for their performance evaluation and compensa- tion In many instances, achievement of those quarterly financial goals was the only basis for compensation. Meetings were regulariy used as a forum to reprimand nonperformi~g managers and on occasions, managers were actualliy fired at these meetings.
Each profit center at MiniScribe had its own financial staff who reported to the corporate controller. Profit centers were generally responsible for profits and day-to-day financial control. The corporate controller’s office was primarily responsible for consolidating the financial reports and for compiling financial statements. Financial statements were compiled from information supplied by the various profit centers. The financial staff in the profit centers were generally poorly trained.
The company did not have an internal audit department, although the external auditors had recommended one. An audit committee of the board of directors was established in 1985. Primary functions of the committee included (1) to recommend the external auditors and to evaIuate the scope of their work, and (2) to review the adequacy of financial control and financial management. The committee consisted of three members, all of whom had been employed in various capacities, at one time or another, in the investment banking activities of the company. The committee met, on average, no more than once a year.
MiniScribe’s financial statements indicated a recovery in the third quarter of 1985, posting a net income of $329,000. This was the beginning of 13 consecutive quarters of record-breaking earnings. During that period, sales increased almost exponentially, and the firm’s stock price quintupled. By 1987, MiniScribe was recognized in the financial press as the fastest-

248 B. P. Green and T. G. Calderon
growing firm in its industry. The following excerpts from the company’s 1986 and 1987 annual reports document the company’s successes:
The company’s 1986 results reflect a continuation of the recovery that began in the third quarter of 1985. Net sales increased 62% from 1985 to 1986. This increase was primarily due to the general recovery in the microcomputer industry which began in the third quarter of 1985, coupled with the market acceptance of the company’s families of 3-l/2 inch full-height and 5-s inch half-height disk drives, and its full 5-s inch full-height, high capacity drives (MiniScribe Corp, Annual Report, 1986).
Most of the company’s sales growth during the first half of 1986 was attributable to the company’s 5-“/a inch full-height, high capacity drives, which entered volume production in the second quarter of 1985 (MiniScribe Corp, Annual Report, 1986).
Sales of 3-s inch drives increased significantly in 1986, reflecting strong demand for an existing base of OEM customers, as well as the introduction in late 1986 of two new models: a 3-s inch drive with an SCSI interface and the ScribeCard (MiniScribe Corp, Annual Report, 1986).
The company ended the 1987 fiscal year in a strong financial position. Working capital increased to $118,073,000 from %53,451,000 in 1986, and cash and cash equivalents tripled to $48,956,000 (MiniScribe Corp, Annual Report, 1987).
In May 1987, the company issued $97,750,000 principal amount of 7-s % convertible subordinated debentures due 2012 resulting in net proceeds to the company of $95,061,875 net of underwriting discounts and commissions. The net proceeds are being used principally to fund increases in inventories and accounts receivable and to acquire capital equipment and to expand capacity. A portion of the proceeds were used to repay the full borrowings of $24,957,000 that were outstanding under the collateralized $25,000,000 bank credit facility (MiniScribe Corp, Annual Report, 1987).
The company is planning to spend $28,000,000 on capital expenditures in 1988. These expenditures are expected to be funded through internally gener- ated funds and existing bank lines of credit. As of January 3, 1988 the com- pany had no debt outstanding under its $25,000,000 line of credit agreement and approximately $875,000 under an equipment financing agreement (Mini- Scribe Corp, Annual Report, 1987).
The auditors had rendered unqualified opinions for the prior years’ audited financial statements. Comparative summary income statement and balance sheet information for the years 1982 to 1987 are presented in Tables 1 and 2.
Possible Questions 2 1. Using the data presented in the case, develop appropriate materiality
thresholds for 1986 and 1987. Consider only sales, accounts receiv- able, and inventory accounts.
*Some instructors may choose to focus on the ethical dimensions of the case.

Table 1. MiniScribe Corporation balance sheet (in thousands of’US$), December 31) 1982 to 1987
1982 1983 1984 1985 1988 1987
A S S e t s
Cash f7 967 1,025 23,244 16,329 48,956 Accounts receivable 2,929 16,941 19,290 16,041 39,766 57,144 Inventory 3,181 29,133 33,022 22,501 45,106 85,172 Other Total CA
PP&E Other Total assets
Liabilities
60 137 319 239 ‘936 976 6,187 47,178 53,656
-~ 62,025
-~ 102 137 A 192,248
1,437 11,931 20,942 19,58 33,606 71,540 8 10 287 2.5 1,134 9,818
7,632 59,119 74,885 81,366 136,877 273,606
Accounts payable Notes payable Current LTfY Accrued exp. Other Total CL Long-term liabifiiy
Owner’s equity Preferred Common Paid in cap. Retained earnings Treasury Other Total equfty Total
3,935 500
0 0
330 4,765 1,300
5,390 20
106 (4357)
14,165
: 1,730 1,395 17,290
0
0 182
41,371 437
(EY) 4t ,829 59,119
10,704
87: 2,926 f ,667 18,172
21,806
t8; 42,394 (5,307)
12,228 0
1,742 3,829 3,274 ---zJEF
20,771
133 193
62,021 (22,080)
37,160 0
946 4,875 3,705 46,686
23,877
118 226
65,348 631 (1;)
66,314 136,877
60,527
1,25:: 8,617 3,781
74,175 98,220
89 288
69,245 31,778

Table 2. MiniScribe Corporation income statement (in thousands of USS), for the year ended December 31,1982 to 1987
1982 1983 1984 1985 1988 1987
Sales COGS Gross margin R&D expen G&A expen. Other Interest exp. Income tax exp. Ex. items Net income Total common
shares
5,043 76,591 123,606 113,951 184,861 362,467 5,757 62,571 110,577 111,445 137,936 269,828
14,020 13,029 2,606 46,925 92,639 3,771 8,307 4,204 8,555 19,822
2,566 5,191 9,798 12,217 14,459 36,249 (50) (193) 2.466 (1,291) (2,777) 17 463 0 2,142 6,144 0 1,971 0 392 2,779 5,060
1,996,275 16,164,533 18,766,486 19,309,818 22,593,107 28,833,312

Analytical Procedures 251
2. Calculate expected account balances for 1986 and 1987, compare the expected amounts you computed with the balances reported in Mini- Scribe’s financial statements and evaluate the differences. Compare the ratios and trends evident in MiniScribe’s financial statements for 1986 and 1987 with industry ratios and trends. Does your analysis raise any questions about the validity and reliability of the financial statements for 1986 and 1987?
3. Review the authoritative and the empirical literature, particularly SAS No. 53 (AICPA, 1988) and the work of Loebbecke and Willingham (Loebbecke et al., 1989; Loebbecke & Willingham, 1988). Develop a model to identify and analyze the qualitative red flags in the case. Based on the model you have developed, what red flags are evident in the case? Do these red flags fuel any skepticism relating to the validity and reliability of the reported results for 1986 and 1987.
4. Integrate the findings of the quantitative and qualitative analyses to draw conclusions about the likelihood of errors in the financial state- ments of MiniScribe.
252 B. P. Green and T. G. Calderon
TEACHING NOTES
The case may be presented after audit planning is discussed. Prior expo- sure to both SAS No. 53 and 56 is required. Class discussions on the Treadway Commission’s recommendations (Treadway, 1987), and the Loebbecke-Willingham fraud risk assessment model (Loebbecke et al., 1989; Loebbecke & Wilhngham, 1988) would enhance the student’s ability to analyze the case. Both SAS 53 and the Loebbecke-Will~ngham model are reviewed below.
In teaching this case, the analysis is conducted in two stages without letting students know that a fraud actually existed. In Stage 1 of the analy- sis, students are asked to develop appropriate materiality thresholds, calcu- late relevant expectations, and analyze the rest&s for 1986 and 1987. Stu- dents are required to obtain, and incorporate into their analysis, relevant exogenous information such as industry ratios and trends, and general busi- ness conditions, En the Stage 2, students are asked to conduct a qualitative evaluation of the case using SAS 53 and the Loebbecke-Willingham fraud risk assessment model. Students are then asked to consider their evaluation of the quantitative and qualitative factors in tandem and to assess the risk of management fraud. 3
The remainder of this section reviews the tandem approach, including a discussion of the Loebbecke-Willingham model and SAS 53, and presents the qu~titative and qualitative analyses. Aspects of the actual fraud that would be of interest in discussing the case in an auditing class are also detailed.
The Tandem Approach
APs have long been used to produce audit evidence. Over half a century ago, auditors used “scanning” as an analytical procedure. At that time, auditors believed that simply scanning a client’s financial statements was sufficient to detect risk areas. A 1934 editorial in the Accounting Review (Editorial, 1934, p. 257), for example, notes that ‘Yhere are accountants who can barely glance at a balance sheet and come away with a good many significant facts in their minds.” Today, as then, APs are used to reduce both audit time and cost. Recently, the focus on APs has shifted from using APs for audit efficiency to using them to enhance audit effectiveness. This change in focus resulted primarily from the 1987 Treadway Commission Report (p. 13), which called for changes in Generally Accepted Auditing Standards (GAAS) so as to “make greater use of analytical review proce- dures to identify areas with a high risk of fraudulent financial reporting.”
Since the release of the Treadway Commission’s report, fraud detection analysis has taken two separate tracks, The first approach has examined
‘Instructors who use this case may consider disguising the names (e.g., the name of the corporation, the chief executive, and the product) used in the case to limit hindsight bias,

Analytical Procedures 253
the general effectiveness of quantitative APs in detecting both errors and irregularities4 Quantitative APs include such tools as trend analysis, ratio analysis, and time series and regression analyses. However, the effective- ness of these APs may be compromised by an auditor’s subsequent discus- sion with the client. For example, a quantitative procedure may correctly signal a management irregularity, but the auditor may choose not to fully investigate the signal because subsequent discussion with the client may provide a plausible (albeit inaccurate) explanation for it (Kinney, 1987).
The second approach used in fraud detection analysis focuses on qualita- tive factors that may amplify the signals observed by the auditor. Loeb- becke and Willingham (1988) pioneered work in this area. They hypothe- sized that the probability of a material irregularity is a function of the extent to which three factors exist in a particular business situation. These factors are (1) conditions allowing the commission of an irregularity (C), (2) motivation for the commission of an irregularity (M), and (3) personal attitudes allowing the commission of an irregularity (A). If all three factors are present, there is a high probability that material management fraud will occur. If any of the three factors is missing, then there is less likelihood that a management fraud will occur.
Loebbecke and Willingham (1988) identified (and classified into the three categories) 55 “red flags” that may alert the auditor to possible irregularities in the client’s financial statements. In a subsequent validation study, Loeb- becke, Eining, and Willingham (LEW) (1989) verified that several of the proposed red flags would indeed alert auditors to management fraud and irregularities. A list of red flags adapted from the LEW validation study is presented in Table 3. A similar, though somewhat less comprehensive, list of red flags appears in SAS No. 53. This list is categorized into red flags relating management characteristics, operating and industry characteristics, and engagement characteristics. Table 4 details the red flags in SAS No. 53.
SAS No. 53 (AU 316.05) requires auditors to design the audit to provide reasonable assurance of detecting management fraud. The Statement de- fines management fraud as the intentional reporting of misleading financial statements. In order to increase the probability of fraud detection, SAS 56 (AU 329) requires that APs, which consist of quantitative as well as qualita- tive analysis, be used in both the planning and review stages of the audit. A tandem approach is, therefore, clearly indicated in the standard.
Using a tandem approach to teach APs, as proposed in this paper, expo-
‘See, for example, Knechel, 1986, 1988; Coglitore and Berryman, 1988; and Kunitake and Glezen, 1987. Analytical Review Procedures,” Decision Sciences (Summer 1986), pp. 376-394; W. Knechel, “The Effectiveness of Statistical Analytical Review as a Substantive Auditing Procedure: A Simulation Analysis,” The Accounting Review (January, 1988), pp. 74-95; F. Coglitore and R. Berryman, “Analytical Procedures: A Defensive Necessity,” Auditing: A Journal of Practice and Theory (Spring, 1988), pp. 150-163; and W. Kunitake and G. Glezen, “The Use of Analytical Review Procedures and their Effectiveness in Signaling Financial Statement Errors,” The Ohio CPA Journal (Summer, 1987), pp. 45-49.

254 B. P. Green and T. G. Calderon
Table 3. Qualitative fraud risk assessment model adapted from Loebbecke, Eining, and Willingham (1988)
Primary indicators of C are: decisions dominated by a single person or few persons major transactions have a material effect on company significant related party transactions weak internal control environment transactions which are difficult to audit
Secondary indicators of C are: material account balances are determined by judgment high management turnover decentralized organization assets subject to misappropriation new audit client rapid growth of company inexperienced management conflict of interest within company management
Primary indicators of M are: industry decline inadequate profits management places undue emphasis on earnings projections company is subject to significant contractual commitments
Secondary indicators of M are: rapid growth of company rapid industry change operating results are sensitive to economic factors incentive compensation is based on recorded pe~ormance adverse legal circum~ances company holdings represent a significant portion of management’s personal wealth management’s job threatened by poor performance
Primary indicators of A are: dishonest management management places undue emphasis on earnings projections prior year irregularities management has lied to the auditor or has been evasive management has an aggressive attitude toward financial reporting personality anomalies
Secondary indicators of A are: weak internal control conflict of interest within company management poor reputation of management in the business community management has frequent disputes with the auditor client or management places undue pressure on the auditor client or management displays disrespectful attitude
ses students to the combined strengths of such traditional quantitative pro- cedures as trend analysis, ratio analysis and time series modeling, and the innovative qualitative procedures suggested by LEW. In addition, present- ing this approach to the auditing student is consistent with the recent thrust toward quantitative and qualitative procedures that is evident in the author- itative literature.

Analytical Procedures 255
Table 4. SAS No. 53 management fraud risk factors
Management characteristics Includes the attitude of management toward financial reporting, the concentration of management decision making power, and the reputation of management in the business community. Red flags in this category are listed below.
Management operating and financing decisions are dominated by a single person. Management attitude toward financial reporting is unduly aggressive. Management . . turnover is high. Management places undue emphasis on meeting earnings projections. Management’s reputation in the business community is poor.
Operating and industry characteristics Includes the profitability of the firm relative to the industry, the sensitivity of the industry to economic changes, and the firm’s ability to continue as a going concern. Red flags in this category are listed below.
Profitability of the entity relative to its industry is inadequate or inconsistent. Sensitivity of operating results to economic factors . . is high. Rate of change in entity’s industry is rapid. Direction of change in entity’s industry is declining with many business failures. Organization is decentralized without adequate monitoring. Matters that raise substantial doubt about the entity’s ability to continue as a going
concern are present.
Engagement characteristics Includes the difficulty of the firm to audit, such as related-party transactions, or the firm being a new client with no prior audit history. Red flags in this category are listed below.
Many contentious or difficult accounting issues are present. Significant difficult-to-audit transactions or balances are present. Significant and unusual related-party transactions not in the ordinary course of busi-
ness are present. Nature, cause (if known), or the amount of known and likely misstatements detected in
the audit of prior period’s financial statements is significant. It is a new client with no prior audit history, or sufficient information is not available
from the predecessor auditor.
Quantitative Analysis
Instructors may use several quantitative methods to compute the audi- tor’s expectation. These methods range from simple techniques such as a random walk model to sophisticated techniques such as regression and advanced time series modeling. If available, a more sophisticated model such as Deloitte and Touche’s Statistical Technique for Analytical Review (STAR) may be used (Stringer & Stewart, 1986). The MiniScribe case is fairly robust to a variety of expectations models.
One quantitative model that has worked in teaching this case is a martin- gale model with a drift factor that is computed using the weighted average change method (McKee, 1989). The expected account balance or ratio is calculated by summing the prior years’ account balance or ratio and the

256 B. P. Green and T. G. Calderon
expected change. 5 This model allows the student to calculate an expected change in an account balance or ratio that places more weight on the most recent account balances. This is consistent with the assumption that changes in account balances or ratios during recent years have more predictive power than changes during earlier years (Blocher & Willington, 1985).
Table 5 presents the auditor’s expectations for 1986 and 1987 computed using the martingale model described above. Actual figures for 1986 are compared with the expectations calculated using data for the period 1982 through 1985. Similarly, actual amounts for 1987 are compared with expec- tations calculated using data for the period 1982 through 1986.
After the auditor’s expectations are computed, the student must deter- mine which materiality threshold should be used in analyzing the data. There are several possible materiality thresholds that may be used in teach- ing the case. These range from the simple 5 and 10% materiality rules that dominate current practice (Schmutte, 1990) to sophisticated statistical rules that have been used in the auditing literature (Kinney, 1978; 1987; Wheeler & Pany, 1990). Although the sophisticated decision rules tend to generate more precise signals, the simple judgement rules that dominate practice appear to result in signals that are reasonably robust (Wilson & Colbert, 1989).
Use of a simple 10% materiality threshold has been fairly effective in teaching this case. This 10% threshold implies that if the actual amount differs from the expected value by 10% or more, the student should con- sider expanding substantive testing for that account balance or area. A simple 10% materiality level is used in the analysis presented in Table 5.
‘The weighted average change method uses the following model to compute the auditor’s expectation:
Auditorsexpectation = B, + C(GB,[N - t + I]/[N/2 * {N + l}])
where,
SB, = Change in account balance in year 1.
B, = Account balance in the year prior to the fraud.
t = Number of years prior to the fraud. That is 1 = 1, one year prior to the fraud; 1 = 2, two years prior to the fraud, etc.
N = The total number of years in the time series.
Two other methods were used to calculate the expected account balances. These other methods are (1) a simple average expectation model, and (2) last year’s account balance plus or minus 10%. All three models resulted in similar signals. The weighted average expectation model, the model used in the study, signaled the fewest red flags. The quantitative analysis would have produced significantly stronger red flags if either of the other two models were used.

Analytical Procedures 251
Table 5. Quantitative analytical procedures: Account balances for 1988 and 1987
(in thousands of US$)
Expected Actual Difference Materiality
1966
Net sales Cost of goods sold Inventory Accounts receivable Net income Gross margin
percentage Accounts receivable
turnover Inventory turnover
$136,720 $184,861 130,899 131,496
4,399 8,009 17,535 39,766
(24,459) 22,711
$48,141 $13,672* l
597 13,090 3,610 440”
22,231 1,753” 47.710 2.446’ l
0.060 0.289 0.229 0.006’ l
5.91 6.63 0.72 0.59’ l
29.31 22.78 6.53 2.93* l
1967
Net sales Cost of goods sold Inventory Accounts receivable Net income Gross margin
percentage Accounts receivable
turnover inventory turnover
$226,866 $362,467 $135,801 $22,689* * 156,044 258,551 102,507 15,604**
10,317 17,242 6,925 1,032** 50,152 57,144 6,992 5,015** 33,893 31,147 2,746 3,389
0.376 0.287 0.089 0.038* *
6.44 7.48 1.04 0.64* * 14.09 20.48 6.39 1.41**
l *Indicates a significant difference given a materiality level of 10% of the expected account balance or ratio.
With the exception of the 1986 cost of goods sold and the 1987 net income, the deviation from each expectation exceeded the 10% threshold. For each of the 2 years, the quantitative APs would have acted as a red flag in 7 of the 8 account balances or ratios reported in Table 5. These results should signal to the student the need to further investigate the causes of unexpected changes in the sales, cost of goods sold, accounts receivable, and inventory accounts.
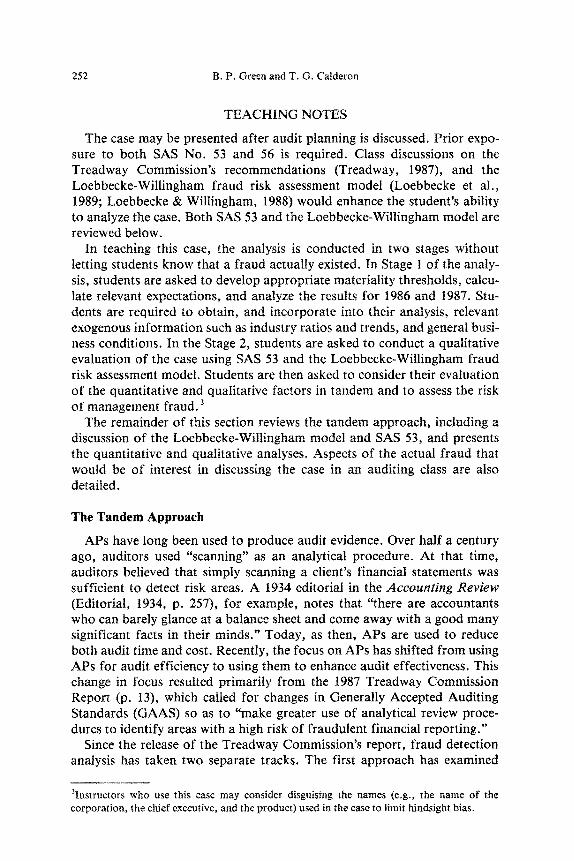
At this point, students are asked to focus on exogenous data and conduct an analysis from the perspective of industry and general economic perfor- mance. This is particularly important since it adds both depth and breadth to the quantitative analysis and helps students assess the plausibility of the results obtained from the analysis of endogenous data. A simple graphical display of company and industry data is typically very useful. Figure 1, which displays the percentage change in net sales of MiniScribe and its industry, provides a useful illustration. Several disturbing trends are clearly visible from the graph. From the beginning of 1984 through the third quar-

258 B. P. Green and T. G. Calderon
1.1 , I
z 0 0.9 m 0.8 z Z 0.7
.G 0.6 & 3.5 El 6
0.4
0.3 6 0.2 Y if 0.1
0 -0.1 1 1 f
a4 85 86 a7
0 MINISCRIBE + INDUSTRY AVE
Figure 1. Percent change in net sales, firm to industry.
ter of 1985, MiniScribe’s sales were falling much faster than the general decline in the industry. After 1985, however, MiniScribe’s sales increased substantially. A similar graph is depicted in Figure 2. It shows a comparison between the trend in the percentage change of net income for the firm versus the rest of the computer industry. Again, the results subsequent to the arrival of Q. T. Wiles in late 1985 show a marked improvement that was substantially better than the industry’s as a whole. These trends are remarkable and should arouse the suspicion of auditing students.
Other disturbing trends are evident in Figures 3 and 4. Figure 3 demon- strates the rapid improvement in ~iniscribe’s gross margin percentage in 1986, after the fraudulent reporting activities began. Figure 4 illustrates an alarming change in the relationship between accounts receivable and net sales. Prior to Wiles’ management, both sales and receivables were increas- ing moderately. The increase in both accounts was approximately equal, with sales increasing slightly faster than accounts receivable. A dramatic reversal in this relationship occurred after Q. T. Wiles took control of MiniScribe late in 1985. Both accounts showed large increases, with ac- counts receivable growth now exceeding sales growth. At times, the ac- counts receivable growth rate exceeded the sales account growth rate by over 100%. Such a relationship raises questions concerning the validity of net sales.
Students must be warned that the presence of the foregoing red flags does not guarantee the discovery of irregularities. The MiniScribe fraud was a

Analytical Procedures 259
3
E 2 8 f
-41 ’ 84 85 86 87
0 MINISCRIBE + INDUSTRY AVE
Figure 2. Percent change in net income, firm to industry.
0.35
0.30
0.25
0.20
0.15
0.10
0.05
0
-0.05
-0.10
-0.15 82 83 84 85 86 87
Figure 3. Gross margin percent, 1982 to 1987.

260 B. P. Green and T. G. Calderon
84 85 86 87
ggg Soles m Accounls Receivable
Figure 4. Percent change in accounts, accounts receivable to sales.
case of extensive management collusion, false documentation, and fraudu- lent financial reporting. Under these circumstances, the auditor may find plausible, but inaccurate, reasons for the deviations from expected values. It is quite possible, for example, that auditing students would rationalize that the aggressive, results-oriented management style of Mr. Wiles lends credibility to the rapid changes in quantitative factors noticed here. How- ever, when students consider the qualitative factors in tandem with the quantitative APs, they may view the situation with greater skepticism and may find the foregoing quantitative evidence to be more plausible.
Qualitative Analysis
At this point in the case, students should have fully evaluated the quanti- tative APs, as well as have an understanding of Mr. Wiles’ reputation for turning poor performance companies around. The instructor, depending on time constraints and/or level of course, may select three options for teach- ing the qualitative section of the case. Instructors teaching a standard three- semester-hour undergraduate course may wish to use only the qualitative factors from SAS No. 53 found in Table 4. Graduate courses, or those who wish to allot more time, can use the Loebbecke-Willingham Model pre- sented in Table 3, A third and more fulfilling option is to present both models, but give the student only some of the actual red flags from each list. This option can eliminate time-constraint problems, allowing the student to

Analytical Procedures 261
focus on a few key red flags. It also allows the instructor to rotate the use of red flags, thus changing the case parameters during semesters with multiple sections of the auditing course.
For completeness, the second option incorporating both SAS No. 53 qualitative factors as well as the more comprehensive model proposed by LEW are used in the following analysis. Given both sets of factors, a student should be able to detect the need for further investigation in the case.
SAS No. 53
The student can now be given Table 4 identifying the 16 risk factors (red flags) from SAS No. 53 that, when combined with quantitative APs, may heighten the student’s skepticism that the financial statements contain mate- rial irregularities. After a brief discussion of the 16 factors, the instructor should supply Table 6, containing the 11 red flags present in the MiniScribe
Table 6. SAS No. 53 and the MiniScribe Corporation
Management characteristics Are management operating and financing deci-
sions dominated by a single person? What is management’s attitude toward financial re-
porting?
suggested = 5 present = 4a Yes, Q. T. Wiles.
Unduly aggressive.
Is management (particularly senior accounting per- Yes, several controllers either sonnel) turnover high? quit or were fired.
Does management place undue emphasis on meet- Yes, and some of the projections ing earnings projections? were unrealistic.
Operating and industry characteristics What is the entity’s profitability relative to its indus-
try?
suggested = 6 present = 5a Inconsistently high.
What is the rate of change in the industry? Is the direction of change in the entity’s industry de-
clining with many business failures? Is the organization decentralized without adequate
monitoring?
Rapid Yes.
Yes.
Are there internal or external matters that raise sub- stantial doubt about the entity’s ability to con- tinue as a going concern?
Yes. MiniScribe was near bank- ruptcy in 1985, and had sub- sequently lost its major cus- tomers.
Engagement characteristics Are there significant difficult-to-audit transactions
or balances present?
Were there known or likely misstatements detected in the audit of prior periods’ financial state- ments?
suggested = 5 present = 2” Yes, shipments in transit and ma-
jor just-in-time customers created cutoff problems.
Yes. In 1986 management at- tempted to book a freighter shipment at year-end that did not exist.
“Summary of red flags suggested in SAS No. 53 and red flags present in the MiniScribe case.

262 B. P. Green and T. G. Cafderon
case. The case contains significant numbers of red flags relating to manage- ment characteristics, operating and industry ~b~a~ter~stjcs, and engage- ment characteristics. Thus, all three categories of risk suggested by SAS No. 53 are represented. The list of red flags shown in Table 6 should heighten professional skepticism and, at a minimum, indicate a need for further investigation in carrying out the fieldwork. After reviewing the red flags, the student should focus on at least the following key questions:
1. What effect does the presence of these red flags have on the evaluation of control and inherent risk’? Here, the instructor must stress qualita- tive factors that suggest weaknesses in MiniScribe’s internal control structure such as “management operating and financing decisions are dominated by one person”and “the organization is decentralized with- out adequate monitoring.” Inherent risk factors including “rapid rate of industry change” dso exist. Both of these risk components increase the chance that misstatements will occur and go undetected by the company’s internal control structure.
2. What effect does the quantitative AP results have on the evaluation of audit risk? The quantitative APs show deviations that are materially different from both the expected account balances and industry aver- ages. Audit risk is increased when auditor expectations materially dif- fer from actual account balances. Further investigation through an increase in substantive testing may be required to reduce overall audit risk to an acceptable level.
3. What insights do the quahtative factors offer when evaluating quanti- tative AP results? quantitative APs do not answer the question “why,” but signal what should be examined. For example, the quantitative APs show large increases in sales and accounts receivable that are materially different from expectations. The validity of these increases is questionable due to inconsistencies that are clearly evident when MiniScribe’s results are evaluated relative to industry profits and a general decline in the industry.
4. When examining both quantitative and qualitative rest&s in tandem, what is the effect on detection risk and the need to gather any addi- tional evidence? Students should realize the need to increase substan- tive testing in order to decrease detection risk, compensating for the increase in both inherent and control risk. However, there is a limit to the amount by which detection risk can be reduced in order to achieve an acceptable audit risk. At some point, the financial statements be- come unauditable.
Past experience has shown that student group discussions followed by open class discussion works best to fully exploit the case benefits. The instructor should facilitate the discussion by acting as a “devil’s advocate,” or by taking the part of Mr. Wiles giving plausible explanations for his company’s financial statement results.

Analytical Procedures 263
Loebbecke-Willingham Model
The instructor may repeat the above process with the Loebbecke- Willingham model, or combine both sources of red flags into one activity to avoid time constraints. The student should be supplied with the complete model from Table 3, as well as the results described in Table 7. The Loeb- becke-Willingham model, as revised by LEW, identifies 36 specific red flags that should enhance the student’s understanding of the cause of unexpected changes in the account balances and ratios observed in the quantitative analysis. Table 7 shows that 23 of the 36 red flags in the LEW risk assessment model are present in the case. Each of the three categories in the LEW model-conditions that a material management fraud could be committed, management motivation to commit a fraud, and attitude of management to commit a fraud-are significantly represented in the MiniScribe case. Once again, the findings should clearly indicate a need for further investigation in
Table 7. Red flags in the Loebbecke-Willingham model directly relating to MiniScribe Corporation (C = Condition;
M = Motivation; A = Attitude)
Management operating and financial decisions are dominated by a single per- son or a few persons who generally act in concert.
The company has entered into one or an aggregation of transactions that have a material effect on the financial statements.
The company has a weak control environment. There are accounts that are material to the financial statements for which ex-
tensive judgment is involved in determining the balance. Management turnover is high. Organization is decentralized without adequate monitoring. There are inadequacies in the company’s accounting system. The client’s industry is declining with many business failures. The rate of change in the industry is rapid. Profitability relative to the industry is inadequate or inconsistent. Compensation arrangements are based on recorded performance. Management places undue emphasis on meeting earnings projections. There are adverse conditions in the client’s industry. Management personnel perceive their jobs are threatened by poor perfor-
mance. Management displays a propensity to take undue risks. There have been instances of irregularities in prior years. Management has lied to the auditor or has been overly evasive. Management displays an overly aggressive attitude toward financial report-
ing. The client places undue pressure on the auditor. Client management displays a significant lack of moral fiber.
C
C C, A
C C, A
C C M M M M
M A M
Summary of red flags suggested in the above model and red flags present in the Mini- Scribe case:
C M A
Suggested in the model Red flags present in the case
13 11 12
7 8 8

244 B. P. Green and T. G. Caideron
carrying out the audit. Again, with the instructor acting as a “devil’s advo- cate,” the above questions from the SAS No. 53 section should be discussed.
After allowing time for discussion, the instructor may wish to demon- strate the strength of the signals obtained from qualitative analysis. For example, the students can be directed to consider three of the red flags in the Loebbecke-Willingham model: (1) compensation arrangements are based on recorded performance, (2) management personnel perceive their job is threatened by poor performance, and (3) profitability relative to the industry is inadequate or inconsistent. The MiniScribe management reward system placed undue emphasis on achieving sales and income targets, and loss of employment was threatened if targeted levels were not met. Sales and net income trends were clearly inconsistent with what was happening in the rest of the industry as shown in Figures 1 and 2. An auditor may interpret items (1) and (2) above as relatively benign given that these prac- tices are not uncommon in industry. Nonetheless, the undue emphasis on these items along with the inconsistency between MiniScribe’s profitability and that of the rest of the industry should signal a strong likelihood of account misstatements. In addition, the internal control environment at MiniScribe was weak, whiIe management adopted an aggressive attitude toward financial reporting. The presence of these factors at MiniScribe and, in particular, the significant deviation of post-1986 changes in the accounts receivable to sales ratio from the pre-1986 ratio should have prompted a thor- ough examination of unusual sales and receivable activities.
Although the auditor’s judgment, given the situation, is the best guide in determining the appropriate action, students should be encouraged to de- velop logical decision rules for processing the multitude of red flags that will be encountered in the analysis. After presenting the student with the qualitative factors from Tables 6 and 7, the instructor should direct the students’ discussion towards if and how the new information affects their earlier risk assessment based on the quantitative analysis. The discussion should emphasize the need for and amount of additional substantive test- ing, the assigned risk level of the audit, and the reasoning that supports their conclusions. Students should be encouraged to blend both the quanti- tative and qualitative factors, thereby fully utilizing the tandem approach.
Finally, the instructor needs to remind students that, even though APs may indicate the possibility of management fraud, the auditor is not as- sured of finding the actual cause of the misstatement. A misstatement may not even actually exist. Nonetheless, the use of quantitative APs in conjunc- tion with qualitative analysis provides the auditor and student a judgement tool for improving their ability to detect management fraud.
The Fraud Many of the positive financial results were fraudulently fabricated by the
firm’s management in order to appease Mr. Wiles’ “motivation” strategies, These tactics included both economic rewards for meeting unrealistic sales

Analytical Procedures 265
levels and intimidation or loss of employment for failure to meet Wiles’ objectives. Key employee reorganization and turnover were common as Wiles maintained tight control over all of MiniScribe’s major decisions. Compounding the problem, several key employees responsible for finance and budgetary decisions lacked the training or experience needed to make sound decisions (MiniScribe Form 8-K, 1989).
Some of Miniscribe’s fraudulent activities, included:
1. the recording of an unordered $9 million shipment as a sale; 2. underrecording sales returns by 1 ,SOO%; 3. the recording of F.G.B. destination shipments as sales on the date of
shipment; 4. the recording of nonexistent shipments as sales; 5. breaking into the auditor’s trunks to falsify inventory records; 6. overshipments to customers exceeding $100 million; 7. simply falsifying inventory and sales records; and 8. several senior management personnel unlawfully sold a total of
323,051 shares of MiniScribe common stock at artificially high prices, while in possession of material nonpublic information about Mini- Scribe’s true financial condition.
The bulk of the MiniScribe management fraud occurred under the steward- ship of then CEO and major investor, Q. T. Wiles, during the fiscal years of 1986, 1987, and midway through 1988. Among the senior management personnel named in the fraud were: Patrick Schleibaum, Chief Financial Officer; Steven Wolfe, CPA, Controller; Kenneth Huff, CPA; Warren Perry, Executive Vice President; and Gerald Goodman, Director and Presi- dent of the company. The following excerpt from the enforcement release issued by the Securities and Exchange Commission (SEC, 1991, p, 13) provides additional insight into the extent of fraudulent activities at Mini- Scribe:
In 1986 certain of the defendants took various steps to conceal a $4 to $4..% million inventory shortfall. . . . Among other things, defendants Perry and Wolfe, with the approval of defendants Schleibaum and Huff, broke into MiniScribe’s auditor’s trunks to obtain copies of the list of inventory items that had been test-counted by the auditors, so that they could inflate the number of high-value inventory items that the auditors had not sampled.
At the end of September 1987, certain of the defendants took various steps to conceal an inventory shortfall of approximately $15 million. The . . . cover-up scheme had several major components: (a) creating fictitious inven- tory in transit; (b) transferring $9 million of nonexistent inventory from Mini- Scribe’s United States books to the books of MiniScribe’s Far East subsidiar- ies, and creating a corresponding amount of fictitious inventory in the Far East; and (c) receiving raw materials into inventory must prior to the end of the fiscal year without recording the corresponding accounts payable liability. . * . Certain of the defendants created fictitious inventory by shipping boxes of bricks labeled as disk drives to two of MiniScribe’s distributors and created

266 B. P. Green and T. G. Calderon
a computer program called “Cook Book” to generate fictitious inventory numbers.
The fraud continued in 1988. Throughout 1988, the company, among other things, accumulated scrap that had been written off the company’s books, and, instead of discarding it, repackaged it and counted it as good inventory. . . . Employees prepared false inventory tickets to increase recorded inven- tory. From May 1985 through fiscal year 1987, defendants Wiles, Goodman, Schleibaum and Wolfe implemented a policy of managing MiniScribe’s re- ported earnings. . . . Through this policy, MiniScribe deliberately under- stated profits by overstating certain reserves during 1985 and the first two quarters of fiscal 1986, in order to provide a cushion of reserves that they could use to project an image of steady growth. . . . These cushions were used during subsequent periods of slower growth to pad earnings and con- tinue the appearance of steady growth.
By January 1, 1990, MiniScribe had filed for Chapter 11 bankruptcy. Their reported net worth of $145 million was actually a negative $171 million. In April, 1990, Maxtor Corp won a $46 million bid in cash and stock to acquire the assets of MiniScribe. Maxtor named the new unit that resulted from the acquisition Maxtor Colorado Corp.
Numerous lawsuits were filed by the bondholders, stockholders, and other creditors against the external auditors, audit committee members, and Wiles. A jury initially awarded a $568 million judgement against the auditors, Coopers & Lybrand, and the California investment firm, Ham- brecht & Quist. This award was subsequently set aside by the courts, and a lower settlement was reached. U.S. Bankruptcy Judge Charles Matheson subsequently approved an agreement by Coopers & Lybrand, whose share of the original $568 million judgement was $200 million, to pay $95 million to settle claims against the firm. The Wall Street Journal (April 16, 1992, Sec. A, p. 4) later reported that Coopers eventually paid between $45 mil- lion to $50 million, or 10% of its net worth, to settle a Texas bondholder suit against the firm. Colorado regulators, on July 7, 1992, fined the Den- ver office of Coopers & Lybrand $250,000 for its faulty audits, including the failed audit of MiniScribe. Attorneys representing MiniScribe investors were paid up to $7 million in legal fees for their involvement in the case. In March, 1993, Q. T. Wiles, the former CEO, was indicted on federal securi- ties and wire fraud for his role in the MiniScribe fraud.
CONCLUSION
This paper shows that a tandem approach that uses both quantitative APs and qualitative environmental factors may be used to help students assess the risk of management fraud in a real-world setting. Evaluation of qualitative factors exposes students to a richer interpretation of the signals given by quantitative APs, and incorporation of exogenous information

Analytical Procedures 267
such as industry averages and general business conditions adds rigor to the analysis. Classroom exposure to cases such as MiniScribe offers students the opportunity to see how APs may be realistically applied in the audit process. Moreover, the use of such cases avoids the problem of jumping from one technical area to another without “planting in the [student’s] mind a seed of any of the larger questions” (Zeff, 1980, p. 660). The proposed case ap_ roach also encourages the development of broad problem-solving skills, qualitative judgment, and the evaluation of risk. The type of applica- tion suggested here should challenge students to obtain and use information from multiple sources under conditions that approximate the real-world.
REFERENCES Accounting Education Change Commission [AECC]. (1990, Fall). Objectives of education for
accountants: Position statement no. one. Issues in Accounting Educatian, 307-312. American Institute of Certified Pubhc Accountants [AICPA]. (1988). The auditors’responsi-
bifity to detect and report errors and irregularities (Statement on Auditing Standards No. 53). New York: Author.
American Institute of Certified Public Accounts [AICPA]. (1989). Analytical review proce- dures (Statement on Auditing Standards 56). New York: Author.
Arthur Andersen & Co., Arthur Young, Coopers & Lybrand, Deloitte Haskins & Sells, Ernst & Whinney, Peat Marwick Main & Co., Price Waterhouse, t Touche Ross. (1989, April). Perspectives on education: Capabilities for success in the accounting profession [Big-Eight White Paper]. New York: Authors.
Blocher, E., & Willington, J. (1985). Anafytical review: A guide to evaluating financialstate- menfs. New York: McGraw-Hill.
Coglitore, F., & Berryman, R. (1988, Spring). Analytical procedures: A defensive necessity. Auditing: A Journal of Practice and Theory, 7, 150-163.
Dugan, M. T., Cup, B. E., & Samson, W. D. (1991, Spring). Teaching the statement of cash flows. Journal of Accounting Education, 9, 33-52.
Editorial. (1934, September). Scanning. The Accounting Review, 14,257-258. Inman, B. C., Wengler, A., & Wickert, P. (1989, Spring). Square pegs in round holes: Are
accounting students well suited to today’s accounting profession? Issues in Accounting Education, 4, 29-47.
Kinney, W. R., Jr. (1978, January). ARIMA and regression in analytical review: An empirical test. The Accounting Review, 53,48-60.
Kinney, W. R., Jr. (1987, Spring). Attention-directing analytical review using accounting ratios: A case study. Auditing: A Journal of Practice and Theory, 6, 59-73.
Knechel, W. (1986, Summer). A simulation study of the relative effectiveness of alternative analytical review procedures. Decision Sciences, I7, 376-394.
Knechel, W. (1988, January). The effectiveness of statistical analytical review as a substantive auditing procedure: A simulation analysis. The Accounting Review, 63, 74-95.
Kunitake, W., & Glezen, Cl. (1987, Summer). The use of analytical review procedures and their effectiveness in signaling financial statement errors. The Ohio CPA Journal, 46, 45- 49.
Loebbecke, L., Eining, M., & Willingham, J. (1989, Fail). Auditors’ experience with material irregularities: Frequency, nature, and detectability. Auditing: A Journal of Practice and Theory, 8, l-28.
Loebbecke, L., & Willingham, J. (1988). Review of SECaccounting and auditfng enforcement refeases. Unpublished working paper.

268 B. P. Green and T. G. Calderon
McKee, T. (1989). Modern analytical auditing. New York: Quorum Books. MiniScribe Corporation. (1989, September). Current report (Form 8-K). Mohr, R. (1991, Spring). Illustrating the economic consequences of FASB Statement No. 94,
Consolidation of All Minority-Owned Subsidiaries. Journal of Accounting Education, 9, 123-136.
Securities and Exchange Commission [SEC]. (1991). Litigation Release No. 12942, Release No. AE-308: 1991 WL 286429.
Schmutte, J. L. (1990, Autumn). Statistically based analytical procedures: The gap between research and practice. The Ohio CPA Journal, 49, 13-18.
Stringer, K. W., & Stewart, T. R. (1986). Statistical techniques for analytical reviews in auditing. New York: John Wiley & Sons.
Treadway, J. T. (Chairman). (1987, October). Report of the National Commission on Fraudu- lent Financial Reporting. National Commission on Fradulent Financial Reporting.
Wheeler, S., & Pany, K. (1990, July). Assess the performance of analytical procedures: A best case scenario. The Accounting Review, 65, 557-577.
Wilson, A., & Colbert, J. (1989, December). An analysis of simple and rigorous decision models as analytical procedures. Accounting Horizons, 3, 79-83.
Zeff, S. A. (1980, October). Intermediate and advanced accounting: The role of economic consequences. The Accounting Review, 55, 658-663.