Embed Size (px)
Citation preview
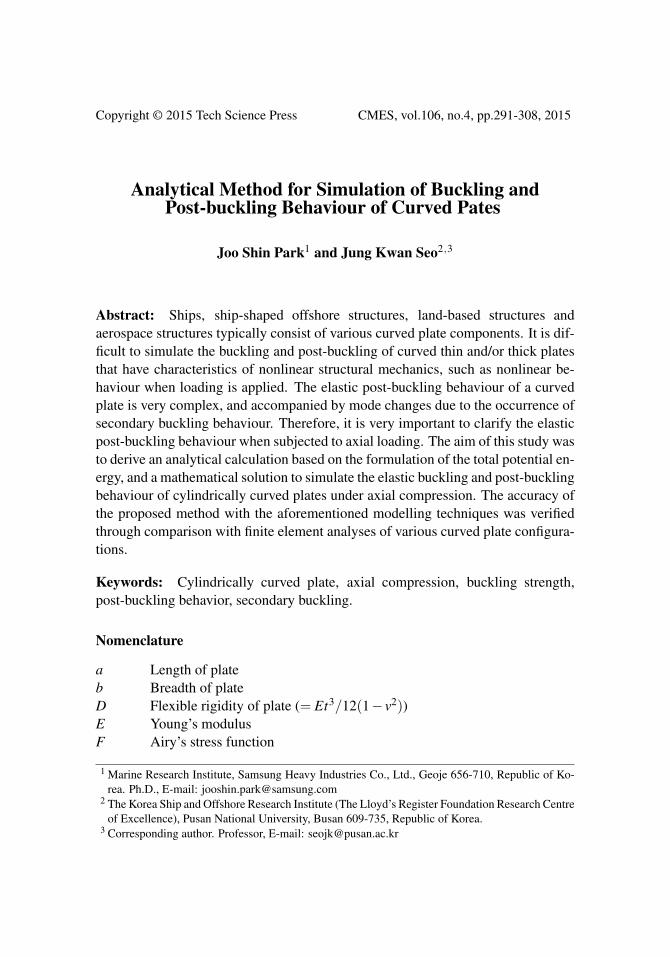
Copyright © 2015 Tech Science Press CMES, vol.106, no.4, pp.291-308, 2015
Analytical Method for Simulation of Buckling andPost-buckling Behaviour of Curved Pates
Joo Shin Park1 and Jung Kwan Seo2,3
Abstract: Ships, ship-shaped offshore structures, land-based structures andaerospace structures typically consist of various curved plate components. It is dif-ficult to simulate the buckling and post-buckling of curved thin and/or thick platesthat have characteristics of nonlinear structural mechanics, such as nonlinear be-haviour when loading is applied. The elastic post-buckling behaviour of a curvedplate is very complex, and accompanied by mode changes due to the occurrence ofsecondary buckling behaviour. Therefore, it is very important to clarify the elasticpost-buckling behaviour when subjected to axial loading. The aim of this study wasto derive an analytical calculation based on the formulation of the total potential en-ergy, and a mathematical solution to simulate the elastic buckling and post-bucklingbehaviour of cylindrically curved plates under axial compression. The accuracy ofthe proposed method with the aforementioned modelling techniques was verifiedthrough comparison with finite element analyses of various curved plate configura-tions.
Keywords: Cylindrically curved plate, axial compression, buckling strength,post-buckling behavior, secondary buckling.
Nomenclature
a Length of plateb Breadth of plateD Flexible rigidity of plate (= Et3/12(1− v2))E Young’s modulusF Airy’s stress function
1 Marine Research Institute, Samsung Heavy Industries Co., Ltd., Geoje 656-710, Republic of Ko-rea. Ph.D., E-mail: [email protected]
2 The Korea Ship and Offshore Research Institute (The Lloyd’s Register Foundation Research Centreof Excellence), Pusan National University, Busan 609-735, Republic of Korea.
3 Corresponding author. Professor, E-mail: [email protected]

292 Copyright © 2015 Tech Science Press CMES, vol.106, no.4, pp.291-308, 2015
m, n Maximum half-waves number of the assumed added deflection functionin the x and y directions, respectively
R Radius of curvature of cylindrically curved plateri Arc length at step it, tp Plate thicknessw Added deflection of plate due to action of external loadsw0 Initial deflection of platex,y,z Principal axesβ Plate slenderness ratio (= b/t
√σY/E)
εcl Strain of flat plateεcr Strain of curved plateεxb, εyb Bending strains in the x and y directions, respectivelyσcl Elastic buckling strength of flat plateσcr Elastic buckling strength of curved plateσx Normal stress in the x direction (compressive stress)σxb, σyb Bending stresses in x and y directions, respectivelyσY Yield stressτ = τxy Shear stressν Poisson’s ratio
1 Introduction
Curved plates are used in various parts of ships and offshore structures (deck platingwith a camber, fore and aft parts, bilge parts, gunwale parts, etc.) and in variouscivil engineering structures (web panels in horizontally curved steel plates, boxgirder bridges, etc.). In ship structural design, accurate prediction of the structuralbehaviour of curved plates is a most important step, as the shape of the hull iscritical to the overall strength performance of a ship. The structural performanceof a curved plate is influenced by different types of failure modes, and the ultimateand buckling strength and structural behaviour must be investigated for structuraldesign.
A number of researchers have made important contributions in this area by devel-oping numerical, experimental and analytical approaches for investigating struc-tural behaviour [Maeno, Yamaguch, Fujii, and Yao (2004); Park, Kohei, Shin-suke, Iijima, and Yao (2006); Park, Iijima, and Yao (2008); Kwen, Park, Paik,and Lee, (2004); Cho, Park, Kim, and Seo (2007); Levy (1943); Dai, Paik, andAtluri (2011)]. Buckling behaviour associated with the plastic collapse behaviourof unstiffened and stiffened curved plates is also well documented in the literature[Park (2008)].

Analytical Method for Simulation of Buckling and Post-buckling Behaviour 293
The elastic post-buckling behaviour of curved plates sometimes occurs as sec-ondary buckling behaviour. Simulation of this phenomenon is highly complex us-ing a nonlinear analytical solution accompanied by mode change. This occurrenceis related to thin rather than thick plates, according to previous research [Kim, Kim,and Lee (2004); Hao, Cho, and Lee (2000)]. In ship structures, the curved platestend to be thick, so that plastic buckling takes place but elastic buckling does not.However, recent design concepts tend to favour bigger ships with optimised struc-tural scantling for greater lightness and speed. This means that thick plates can betreated as thin plates from a geometrical point view; thus it is necessary to simulatethe elastic post-buckling behaviour, which is considered to be secondary bucklingwhen subjected to axial loads.
During the motion of a ship through extreme waves, bending of the hull girderscan produce axial loading on the curved plates. It is well known that curvatureincreases the buckling strength of a circular cylinder subjected to axial loading. Atthe same time, plates with curvature are expected to increase not just the bucklingstrength but also the ultimate strength. To simulate the influence of curvature on thebuckling and post-buckling behaviour of cylindrically curved plates, the structuralphenomena must be identified through a series of elastic large deflection analysesand elastic eigenvalue analysis. At the beginning, elastic eigenvalue analysis shouldbe performed on a cylindrically curved plate under axial compression to clarify theinfluence of curvature on elastic buckling strength. To develop an analytical formu-lation, fundamental equations should be derived involving elastic large deflectionanalysis.
Some researchers have successfully simulated the geometrically nonlinear post-buckling behaviour of unstiffened cylinders, stiffened cylindrical panels and lam-inated composite double curved shells using commercial finite element (FE) codeand a semi-analytical solution [Guggenberger (1995); Buermann, Rolfes, Tessmer,and Schagerl (2006); Kundu and Shinha (2007)]. However, although the finite el-ement analysis (FEA) method is a powerful tool for simulating the behaviour ofcomplex structures under extreme loads, this may require a great deal of modellingand computational effort. Moreover, there is limited information for developingan analytical method to simulate both snap-though and snap-back post-bucklingbehaviour accompanied by mode change.
The paper proposes to clarify these issues. Fundamental equations are derived forelastic large deflection analysis to simulate the elastic buckling and post-bucklingbehaviour of cylindrically curved plates under axial compression. An explicit buck-ling solution is obtained from a formulation of the total potential energy for cylin-drically curved plates. The accuracy of the proposed method is verified by compar-ing its results with that of FEA code.

294 Copyright © 2015 Tech Science Press CMES, vol.106, no.4, pp.291-308, 2015
2 Elastic large deflection analysis of cylindrically plates by the energymethod
The system examined, shown schematically in Figure 1 is a beam of variable crosssection, This study reports an accurate energy method-based solution for the elasticpost-buckling behaviour of cylindrical plates subjected to axial compression. Theanalytical method uses Kirchhoff’s thin plate theory with the following assump-tions: (a) the material is linear elastic, homogeneous and isotropic; (b) the plate isa perfect plane and stress free; (c) the thickness “t” of the plate is small comparedto its other dimensions; (d) the in-plane actions pass through its middle plane; (e)the transverse displacements “w” are small compared to the thickness of the plate;(f) the slopes of the deflected middle surfaces are small compared to unity; (g) thedeformations are such that straight lines, initially normal to the middle plane, re-main straight and normal to the deflected middle surface; (h) the stresses normal tothe thickness of the plate are of negligible magnitude; and (i) the distortion due totransverse shearing can be ignored.
The method developed and proposed here derives and expresses an explicit solu-tion for the simulation of post-buckling behaviour. For this purpose, the methodderivation is combined with the arc-length increment method.
2.1 Initial deflection mode
The cylindrically curved plate shown in Figure 1 is considered. All edges are as-sumed to be simply supported and kept in a straight line when subjected to in-planemovements. The initial deflection of the following form of the Fourier series isassumed.
wo = ∑m
∑n
Womn sin(mπx
a)sin(
nπθ
χ) (1)
The total deflection under axial compression is assumed to be represented by thesame components as those of the initial deflection, that is
w = ∑m
∑n
Wmn sin(mπx
a)sin(
nπθ
χ) (2)
where b = Rχ, y = Rθ
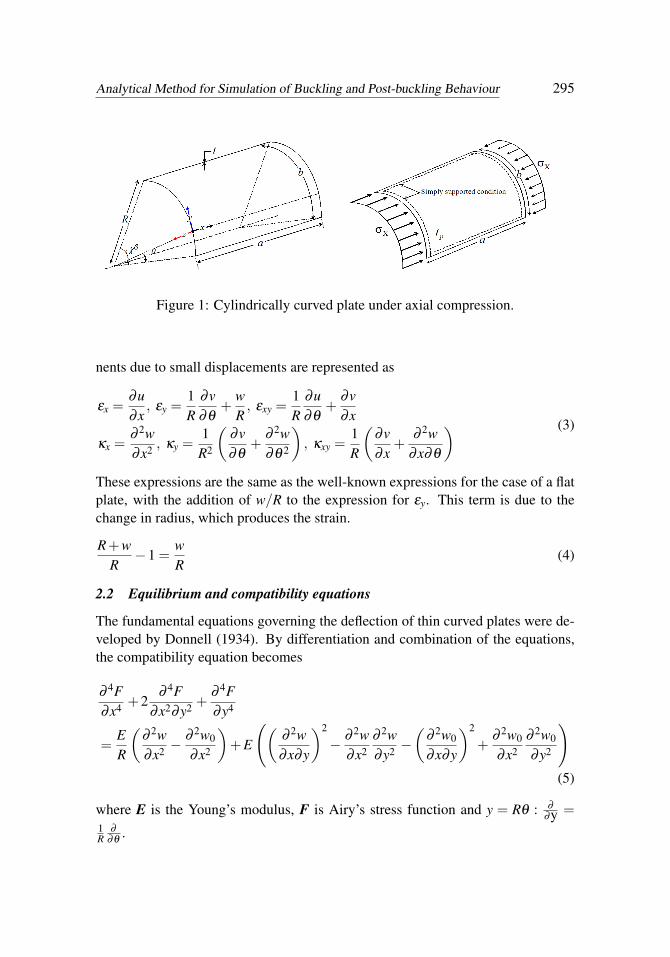
The coordinate system and dimensions of a curved plate under axial compressionare shown in Figure 1. Here u, v, w denote the displacement components in thex, y and z directions, respectively, at the middle surface, and wo denotes the initialdeflection. According to Timoshenko and Gere (1961), the in-plane strain compo-
Analytical Method for Simulation of Buckling and Post-buckling Behaviour 295
Figure 1: Cylindrically curved plate under axial compression.
nents due to small displacements are represented as
εx =∂u∂x
, εy =1R
∂v∂θ
+wR, εxy =
1R
∂u∂θ
+∂v∂x
κx =∂ 2w∂x2 , κy =
1R2
(∂v∂θ
+∂ 2w∂θ 2
), κxy =
1R
(∂v∂x
+∂ 2w
∂x∂θ
) (3)
These expressions are the same as the well-known expressions for the case of a flatplate, with the addition of w/R to the expression for εy. This term is due to thechange in radius, which produces the strain.
R+wR−1 =
wR
(4)
2.2 Equilibrium and compatibility equations
The fundamental equations governing the deflection of thin curved plates were de-veloped by Donnell (1934). By differentiation and combination of the equations,the compatibility equation becomes
∂ 4F∂x4 +2
∂ 4F∂x2∂y2 +
∂ 4F∂y4
=ER
(∂ 2w∂x2 −
∂ 2w0
∂x2
)+E
((∂ 2w∂x∂y
)2
− ∂ 2w∂x2
∂ 2w∂y2 −
(∂ 2w0
∂x∂y
)2
+∂ 2w0
∂x2∂ 2w0
∂y2
)(5)
where E is the Young’s modulus, F is Airy’s stress function and y = Rθ : ∂
∂y =1R
∂
∂θ.

296 Copyright © 2015 Tech Science Press CMES, vol.106, no.4, pp.291-308, 2015
The in-plane stress components are derived as follows.
σxp =∂ 2F∂y2 , σyp =
∂ 2F∂x2 , τxyp =−
∂ 2F∂x∂y
(6)
Assuming the plane stress state, the in-plane strain components are derived as fol-lows,
εxp =1E(σxp−νσyp) =
1E
(∂ 2F∂y2 −ν
∂ 2F∂x2
)(7)
εyp =1E(σyp−νσxp) =
1E
(∂ 2F∂x2 −ν
∂ 2F∂y2
)(8)
γxyp =2(1+ν)
E(τxyp) =−
2(1+ν)
E∂ 2F∂x∂y
(9)
where E is the Young’s modulus and ν is the Poisson’s ratio.
2.3 Bending strain and stress components
The bending strain components are expressed in the following forms.
εxb =−z∂ 2
∂x2 (ω−ω0) =π2za2 ∑
m∑n
m2 (Wmn−W0mn)sinmπx
asin
nπθ
χ(10)
εyb =−z∂ 2
∂y2 (ω−ω0) =π2z
χ2R2 ∑m
∑n
n2 (Wmn−W0mn)sinmπx
asin
nπθ
χ(11)
γxyb = 2z∂ 2
∂x∂y(ω−ω0) =−
2π2zaχR ∑
m∑n
mn(Wmn−W0mn)cosmπx
acos
nπθ
χ(12)
The bending stress components are
σxb =E
1−ν2
(εxb +νεyb
)=
π2zE1−ν2∑
m∑n
(m2
a2 +νn2
χ2
)(Wmn−W0mn)sin
mπxa
sinnπθ
χ
(13)
σyb =E
1−ν2
(εyb+νεxb
)=
π2zE1−ν2 ∑
m∑n
(νm2
a2 +n2
χ2R2
)(Wmn−W0mn)sin
mπxa
sinnπθ
χ
(14)
τxyb =E
2(1+ν)γxyb =−
π2zEaχR(1+ν) ∑
m∑n
mn(Wmn−W0mn)cosmπx
acos
nπθ
χ(15)

Analytical Method for Simulation of Buckling and Post-buckling Behaviour 297
2.4 In-plane strain displacement relationships
Given that large deflections are considered, nonlinear strain displacement relation-ships are used [von Karman and Tsien (1941)]. The membrane strain can be writtenas Equation (16), where w and wo are the additional and initial out-of-plane deflec-tion of the curved plate, respectively. Denoting displacements in the x, y and zdirections as u(x,y,z), v(x,y,z) and w(x,y,z), respectively, the in-plane strain dis-placement relationships are expressed as follows.
εx =∂u∂x
+12
(∂w∂x
)2
− 12
(∂wo
∂x
)2
εy =∂v∂y− w
R+
12
(∂w∂y
)2
− 12
(∂wo
∂x
)2
=1R
∂v∂θ− w
R+
12
(1R
∂w∂θ
)2
− 12
(∂wo
∂x
)2
τxy =
(1R
∂u∂θ
)+
∂v∂x
+
(∂w∂x
1R
∂w∂θ
)where,
∂v∂y
=1R
∂v∂θ
(16)
Where Equation (16) takes the derivative with respect to x, the end-shortening dis-placement is obtained as follows
u =1
Rχ
∫ a
0
∫ Rβ
0
{εxp−
12
(∂ 2w∂x2
)+
12
(∂ 2wo
∂x2
)}dxdy
=− aE
σ − π2
8a ∑m
∑n(W 2
mn−W 2omn)m
2(17)
where aRχ is (m-k=0 and n-l=0) and 4aRχ/mnπ2 is (m, n = odd numbers).
The average in-plane strain in the loading direction is evaluated by dividing Equa-tion (17) by length a, and given as follows.
ε =− 1E
σ +π2
8a2 ∑m
∑n
∑k
∑l
[m2 (2Wmn∆Wmn +∆W 2
mn)
δ∆u =−π2
4a ∑m
∑n
∑k
∑l
[m2 (Wmn +∆Wmn)δ ∆Wmn
(18)
2.5 Application of the principle of virtual work
To derive the average stress and average strain relationship coefficients, the princi-ple of virtual work is applied in an incremental form. Here, it is assumed that the

298 Copyright © 2015 Tech Science Press CMES, vol.106, no.4, pp.291-308, 2015
plate is in an equilibrium state with stress components (σxp +σxb),(σyp +σyb
)and(
τxyp + τxyb)
under the average stress σ . The coefficient of the deflection compo-nents in this equilibrium state is wm. Here, the average stress is increased by ∆σ ,and the increments of the stress components (∆σxp +∆σxb),
(∆σyp +∆σyb
)and(
∆τxyp +∆τxyb)
are produced with increments of the deflection coefficient ∆wm.The virtual work by the external load is represented as follows.
δ∆We =−Rχt (σ +∆σ)δ∆u
δ∆We =−Rχt (σ +∆σ)δ∆u
=π2Rχt
4a(σ +∆σ)∑
m∑n(Wmn +∆Wmn)m2
δ∆Wmn
=π2Rχt
4a ∑m
∑n
m2(σWmn +∆σWmn +σ∆Wmn)δ∆Wmn
(19)
However, the virtual work by the internal force is expressed as
δ∆Wi =∫ a
0
∫ b
0
∫ t2
− t2
(σxp +σxb +∆σxp +∆σxb)δ (∆εxp +∆εxb)+(σyp +σyb +∆σyp +∆σyb
)δ(∆εyp +∆εyb
)+(τxyp + τxyb +∆τxyp +∆τxyb
)δ(∆τxyp +∆τxyb
)dzdydx
(20)
δ∆We =π2Rχ
4a ∑m
∑n
m2 (σwmn +∆σwmn +σ∆wmn +∆σwAmn)δwAmn (21)
δ∆Wi =t ∑m
∑n
∑k
∑l
∑p
∑q
∑r
∑s
(WmnWkl−WomnWokl +Wmn∆Wkl +∆Wkl∆Wmn){(Wpq +∆Wpq)δ∆Wrs +(Wrs +WArs)δWApq
}H(m,n, p,q,r,s)+
π2DaRχ
4 ∑m
∑n
(m2
a2 +n2
R2χ2
)2
(Wmn−Womn +∆Wmn)δ∆Wmn
(22)
In this manner, adoption of the principle of virtual work is written in the followingform.
δ∆We = δ∆Wi (23)

Analytical Method for Simulation of Buckling and Post-buckling Behaviour 299
Equation (24) can be represented as follows.
δ∆Wi =t ∑m
∑n
∑k
∑l
∑p
∑q
∑r
∑s
(WmnWkl−WomnWokl +Wmn∆Wkl +∆Wkl∆Wmn){(Wpq +∆Wpq)δ∆Wrs +(Wrs +∆Wrs)δ∆Wpq
}H(m,n, p,q,r,s)+
π2DaRχ
4 ∑m
∑n
(m2
a2 +n2
R2β 2
)2
(Wmn−Womn +∆Wmn)δ∆Wmn
− π2Rχ
4a ∑m
∑n
m2 (σWmn +∆σWmn +σ∆Wmn +∆σ∆Wmn)δ∆Wmn = 0
(24)
Where coefficients H (m, n, k, l, p, q, r, s) represent the dimensions of the plate,elastic modulus, half waves number, these are functions from m to s. In the previousequation, we derived the relationships of the coefficients of bending ∆Wmn and theincrement of the average compressive stress. This relationship can be representedby inducing a first order equation about the bending coefficient of the increments
[K]{∆Wmn}= ∆σ {R}+{Q} (25)
where {∆W} represents the increment of bending
{∆W}= b∆W11 ∆W12 ∆W13 · · · · ∆WmncT (26)
∆σ {R} is the external increment and {R} is a function of the deflection coefficientsWmn and Womn, respectively. The term {Q} is used to modify the unbalanced forceinduced by linear approximation during the increment.
2.6 Increments using the arc-length method
Step i-1 can be represented as
[K(Wi−1)]{
∆W 0i}−∆σ
0i {R(Wi−1)}= {Qi−1} (27)
Then the arc length must satisfy the following relation,
‖∆W‖2 +(∆σ
0i)2
= r2i (28)
whereri is the arc length at step i, and the first increment of the arc length at stepi{
∆W 0i ,∆σ0
i
}separately, the two parameters have the same direction, so can be
linearised as{l
∑m=0
∆W mi−1
}T {∆W 0
i}+
l
∑m=0
∆σmi−1∆σ
0i = r2
i (29)

300 Copyright © 2015 Tech Science Press CMES, vol.106, no.4, pp.291-308, 2015
Figure 2: Arc-length increment method.
As a linear system we get Equations (30) and (32), and then{
∆W 0i
}and ∆σ0
i canbe calculated as in equation (33). K(Wi−1) −R(Wi−1)
l∑
m=0∆W mT
i−1
l∑
m=0∆σm
i−1
{ ∆W 0i
∆σ0i
}=
{Qi−1
r2i
}(30)
During the repeat and convergence calculations of step n, we can represent thestiffness matrix equation as[
K(Wi−1 +n
∑m=0
∆W mi )
]{∆W n
i }−∆σni
{R(Wi−1 +
n−1
∑m=0
∆W mi )
}={
Qn−1i
}(31)
where{
Qn−1i
}represents the non-parallel force shown in Equation (32).
The arc length (ri) needed to satisfy the same length can be represented as∥∥∥∥∥n−1
∑m=0
∆W mi +∆W n
i
∥∥∥∥∥2
+
(n−1
∑m=0
∆σmi +∆σ
ni
)2
= r2i (32)
Analytical Method for Simulation of Buckling and Post-buckling Behaviour 301
Equation (32) can be linearised as shown.{n−1
∑m=0
∆W mi
}T
{∆W ni }+
n−1
∑m=0
∆σmi ∆σ
ni = 0 (33)
A system of linearisation produces Equations (31) and (33), and then {∆W ni } and
∆σni can be calculated as K(Wi−1 +
n−1∑
m=0∆W m
i ) −R(Wi−1 +n−1∑
m=0∆W m
i )
n−1∑
m=0∆W mT
i−1
n−1∑
m=0∆σm
i−1
{ ∆W ni
∆σni
}=
{Qn−1
i0
}(34)
In this calculation, equation (34) is repeated until the non-parallel force {Qi} isequal to zero.
3 Verification of the analytical method
3.1 Investigation of curvature and slenderness ratio of commercial ship struc-tures
Before calculation, we investigated the curvature and slenderness ratios for actualship structures. Figure 3 shows the curvature and slenderness ratios from investi-gations of several kinds of ships. The bilge structure of a tanker and bulk carrierhas a curvature ranging from 2,000 to 2,500 mm. However, container ships have alarger curvature due to the increased length of these ships, ranging from 3,500 to6,500 mm. The slenderness ratio ranges from 1.4 to 3.0 around the bilge structureand midship section. In the present paper, the range of design parameters for thecalculations were based on the investigation of real data.
3.2 Verification of the analytical method
To demonstrate the accuracy and validity of the proposed analytical method, theelastic buckling strength of curved plates was computed using both the proposedenergy method and FEA programs [ANSYS (2013)]. For the elastic large deflectionanalyses, the FEM code ANSYS was used with the shell 181 element, which issuitable for analysing thin to moderately thick shell structures. This element is afour-noded Reissener-Mindlin shell element with six degrees of freedom at eachnode and is applicable to simulate large strain behaviour. The arc-length methodwas applied in conjunction with the modified Newton-Raphson method in bothstandard and modified forms.

302 Copyright © 2015 Tech Science Press CMES, vol.106, no.4, pp.291-308, 2015
Figure 3: Investigation of curvature and slenderness ratios in ship structures.
To examine the rationality of the proposed model, a series of calculations was car-ried out changing the aspect ratio, slenderness ratio and curvature. Typical averagestress–average strain relationships are shown in Figures 4 and 6 (A), (B), (C) and(D), respectively. The solid line with symbols indicates the results of FEM andthe isolated solid line shows the results of the analytical method. Figure 4 showsthe relationships between average stress and average strain of a curved plate withflank angles of 5 and 20 degrees and varying plate thickness under axial compres-sion. The unloading behaviour of a thin-walled curved plate with a flank angle of5 degrees showed a change of deflection after primary buckling under axial com-pression, as indicated in Figures 4 (A) and 6 (A), respectively. When small loadincrements are applied to the curved plate, the middle surface compressive stressbuilds up and then suddenly releases the internal strain energy in the form of ex-ternal work done, causing secondary buckling behaviour. The secondary bucklingis generally accompanied by snap-through or snap-back buckling phenomena withchanging deflection shape. This is the most difficult problem in nonlinear structuralanalysis. For most practical problems, it is unnecessary to find such uncertain loadsand deflection paths. In most cases, the analysis of buckling and post-buckling be-haviour using FEM can follow the unloading path using the arc-length method.However, using the analytical method it did not occur, so slightly different buck-ling stress is shown. The post-buckling behaviour shows good correlation betweenthe FEM and analytical methods. Figure 4 (B) shows an increase in thickness withthe same flank angle. Increasing the plate thickness also rapidly increases bucklingstrength, and unloading behaviour was not observed. When the increased flank

Analytical Method for Simulation of Buckling and Post-buckling Behaviour 303
angle, elastic buckling strength also increased and cylindrical buckling deflectiontook place at the loading edges, as shown in Figures 4 (C) and 6 (B), respectively.Figure 4 (D) shows a thick curved plate with almost perfectly linear elastic bucklingbehaviour.
between the FEM and analytical methods. Figure 4 (B) shows an increase in thickness with the
same flank angle. Increasing the plate thickness also rapidly increases buckling strength, and
unloading behaviour was not observed. When the increased flank angle, elastic buckling strength
also increased and cylindrical buckling deflection took place at the loading edges, as shown in
Figures 4 (C) and 6 (B), respectively. Figure 4 (D) shows a thick curved plate with almost
perfectly linear elastic buckling behaviour.
0 3 6 9 12 150
2
4
6
8
cr
cl
crcl
cr
cl
cr
cl
205800 , 0.3
3000 , 1000 , 10
11459.216 , 5deg
5 1sin sin , 0.01
σ : buckling strength of curved plate
σ : buckling strength of flat plate
: strain of curved plate
: str
o o o
E MPa
a mm b mm t mm
R mm rees
x yw A A t
a b
ain of flat plate
Elastic Large Deflection Behaviour (FEM)
Elastic Large Deflection Behaviour (AM)
yσ/σ =0.464
yσ/σ =0.600
C
B
A:
0 1 2 3 4 5 60
1
2
3
4
5
6
cr
cl
crcl
cr
cl
cr
cl
205800 , 0.3
3000 , 1000 , 30
11459.216 , 5deg
5 1sin sin , 0.01
σ : buckling strength of curved plate
σ : buckling strength of flat plate
: strain of curved plate
: str
o o o
E MPa
a mm b mm t mm
R mm rees
x yw A A t
a b
ain of flat plate
Elastic Large Deflection Behaviour (FEM)
Elastic Large Deflection Behaviour (AM)
Simply supported B.C
t
b
a
xσ
x
z
y
xσ
Simply supported condition
a
b
Xσ
Xσ
pt
(a) thickness: 10 mm, 5 degrees (b) thickness: 30 mm, 5 degrees
0 1 2 30
1
2
3
cr
cl
crcl
cr
cl
cr
cl
205800 , 0.3
3000 , 1000 , 10
5729.57 , 20deg
5 2sin sin , 0.01
σ : buckling strength of curved plate
σ : buckling strength of flat plate
: strain of curved plate
: stra
o o o
E MPa
a mm b mm t mm
R mm rees
x yw A A t
a b
in of flat plate
Elastic Large Deflection Behaviour (FEM)
Elastic Large Deflection Behaviour (AM)
A
B
C
Simply supported B.C
t
b
a
xσ
x
z
y
xσ
Simply supported condition
a
b
Xσ
Xσ
pt
0 0.2 0.4 0.6 0.8 10
0.2
0.4
0.6
0.8
1
cr
cl
crcl
cr
cl
cr
cl
205800 , 0.3
3000 , 1000 , 30
5729.57 , 20deg
1 2sin sin , 0.01
σ : buckling strength of curved plate
σ : buckling strength of flat plate
: strain of curved plate
: stra
o o o
E MPa
a mm b mm t mm
R mm rees
x yw A A t
a b
in of flat plate
Elastic Large Deflection Behaviour (FEM)
Elastic Large Deflection Behaviour (AM)
Simply supported B.C
t
b
a
xσ
x
z
y
xσ
Simply supported condition
a
b
Xσ
Xσ
pt
(c) thickness: 10 mm, 20 degrees (d) thickness: 30 mm, 20 degrees
Figure 4: Comparison of calculated results (a/b=3.0, flank angle = 5 degrees) Figure 4: Comparison of calculated results (a/b=3.0, flank angle = 5 degrees).
Figure 5 shows the relationship between the average stress and average strain curvesfor elastic large deflection analysis under axial compression. The plate thicknessis taken as 10 and 20 mm, the aspect ratio considered is 3.5, and the maximummagnitude of initial deflection is 0.1% of plate thickness. Two kinds of calculation

304 Copyright © 2015 Tech Science Press CMES, vol.106, no.4, pp.291-308, 2015
0 4 8 12 160
2
4
6
8
cr/
cl
cr/cl
cr
cl
cr
cl
205800 , 0.3
3500 , 1000 , 10
11459.216 , 5deg
5 1sin sin , 0.01
σ : buckling strength of curved plate
σ : buckling strength of flat plate
: strain of curved plate
: str
o o o
E MPa
a mm b mm t mm
R mm rees
x yw A A t
a b
ain of flat plate
Elastic Large Deflection Behaviour (FEM)
Elastic Large Deflection Behaviour (AM)
Analytical Method
FEM
0 4 8 12 160
4
8
12
16
cr
clcrcl
cr
cl
cr
cl
205800 , 0.3
3500 , 1000 , 10
1273.23 , 45deg
1 2sin sin , 0.01
σ : buckling strength of curved plate
σ : buckling strength of flat plate
: strain of curved plate
: stra
o o o
E MPa
a mm b mm t mm
R mm rees
x yw A A t
a b
in of flat plate
Elastic Large Deflection Behaviour (FEM)
Elastic Large Deflection Behaviour (AM)
Simply supported B.C
t
b
a
xσ
x
z
y
xσ
Simply supported condition
a
b
Xσ
Xσ
pt
(a) thickness: 10 mm, 5 degrees (b) thickness: 10 mm, 45 degrees
0 1 2 3 4 50
0.5
1
1.5
2
2.5
cr
cl
crcl
cr
cl
cr
cl
205800 , 0.3
3500 , 1000 , 20
11459.216 , 5deg
5 1sin sin , 0.01
σ : buckling strength of curved plate
σ : buckling strength of flat plate
: strain of curved plate
: str
o o o
E MPa
a mm b mm t mm
R mm rees
x yw A A t
a b
ain of flat plate
Elastic Large Deflection Behaviour (FEM)
Elastic Large Deflection Behaviour (AM)
FEM
Analytical Method
0 1 2 3 40
1
2
3
4
cr
cl
crcl
cr
cl
cr
cl
205800 , 0.3
3500 , 1000 , 20
1273.23 , 45deg
1 2sin sin , 0.01
σ : buckling strength of curved plate
σ : buckling strength of flat plate
: strain of curved plate
: stra
o o o
E MPa
a mm b mm t mm
R mm rees
x yw A A t
a b
in of flat plate
Elastic Large Deflection Behaviour (FEM)
Elastic Large Deflection Behaviour (AM)
Simply supported B.C
t
b
a
xσ
x
z
y
xσ
Simply supported condition
a
b
Xσ
Xσ
pt
(c) thickness: 20 mm, 5 degrees (d) thickness: 20 mm, 45 degrees
Figure 5: Comparison of calculated results (a/b=3.5)
Figure 5 shows the relationship between the average stress and average strain curves for elastic
large deflection analysis under axial compression. The plate thickness is taken as 10 and 20 mm,
the aspect ratio considered is 3.5, and the maximum magnitude of initial deflection is 0.1% of
plate thickness. Two kinds of calculation are compared for validation. The pre-buckling behaviour
of the cylindrically curved plate is approximately linear just before buckling occurs. The curved
plate with a flank angle of 5 degrees shows slightly different post-buckling behaviour around the
occurrence of primary buckling, but the overall behaviour appears similar to that indicated in
Figures 6 (A) and 6 (C), respectively. The pre-buckling behaviour of the cylindrically curved plate
Figure 5: Comparison of calculated results (a/b=3.5).
are compared for validation. The pre-buckling behaviour of the cylindrically curvedplate is approximately linear just before buckling occurs. The curved plate with aflank angle of 5 degrees shows slightly different post-buckling behaviour around theoccurrence of primary buckling, but the overall behaviour appears similar to thatindicated in Figures 6 (A) and 6 (C), respectively. The pre-buckling behaviour ofthe cylindrically curved plate is approximately linear just before buckling occurs. Itis interesting to see that the buckling and post-buckling behaviour is well predictedby both the analytical and FEM methods.

Analytical Method for Simulation of Buckling and Post-buckling Behaviour 305is approximately linear just before buckling occurs. It is interesting to see that the buckling and
post-buckling behaviour is well predicted by both the analytical and FEM methods.
xyz
xyz
xyz
x
y z
xy z
xy z
(A)
xyz
xyz
xyz
xy z
xy z
xy z
(B)
xyz
xyz
xyz
xy z
xy z
xy z
(C)
Figure 6: Comparison of buckling deflection at each check point obtained by FEM (a/b=3.0),
(left) t = 10 mm, flank angle = 5 degrees, (right) t = 10 mm, flank angle = 20 degrees
0 10 20 30 40 500
400
800
1200
1600
2000
cr
flank angle (
FEMAnalytical Method
10t mm
FEMAnalytical Method
15t mm
FEMAnalytical Method
20t mm
Figure 7: Relationships between elastic buckling stress and flank angle at varying plate
thicknesses; comparison of FEM and analytical methods (a/b=3.0)
Figure 6: Comparison of buckling deflection at each check point obtained by FEM(a/b=3.0), (left) t = 10 mm, flank angle = 5 degrees, (right) t = 10 mm, flank angle= 20 degrees.
Figure 7: Relationships between elastic buckling stress and flank angle at varyingplate thicknesses; comparison of FEM and analytical methods (a/b=3.0).

306 Copyright © 2015 Tech Science Press CMES, vol.106, no.4, pp.291-308, 2015
Figure 7 shows the distribution of elastic buckling stresses against varying flankangles for a cylindrically curved plate subjected to axial loading. When the flankangle increases, buckling stress increases to almost linear behaviour. Althoughsome differences are observed in the case of a thin curved plate with a small flankangle, the agreement between results calculated by the proposed analytic methodand FEM is considered satisfactory. This is evidence that the analytical formulationis sufficiently accurate compared to the FEM method.
4 Conclusions remarks
This paper proposed to clarify the simulation of elastic buckling and post-bucklingbehaviour with secondary buckling. Fundamental equations were derived for elas-tic large deflection analysis to simulate the elastic buckling and post-buckling be-haviour of cylindrically curved plates under axial compression. An explicit buck-ling solution was obtained from a formulation of the total potential energy for cylin-drically curved plates. The accuracy of the proposed method was verified by com-paring its results with those of FEA code.
The calculated results found that the elastic primary buckling strength of a cylin-drically curved plate increases with an increase in flank angle. After the occur-rence of primary elastic buckling, buckling deformation increases with reducedaxial rigidity. Secondary buckling then follows. After the secondary buckling, theequilibrium path is unstable, so that both axial load and displacement decrease withchanges in buckling shape. This equilibrium path can be simulated by applying thearc-length method.
The analytical method derived here can be adopted as a basis for an advanced the-oretical method to predict the nonlinear buckling strength of a curved plate withvarying flank angles and thickness configurations. It is recommended that this so-lution be used to determine the elastic and post-buckling strength of curved plates,with no need for more complex FEA programs.
Acknowledgement: This work was supported by a 2-Year Research Grant ofPusan National University.
References
ANSYS (2013): User’s Theory Manual V15.0 (2013), Chapter Four, Introductionto material nonlinearities. ANSYS Inc.
Buermann, P.; Rolfes, R.; Tessmer, J.; Schagerl, M. (2006): A semi-analyticalmodel for local post-buckling analysis of stringer and frame-stiffened cylindricalpanels. Thin-Walled Structures, vol. 44, pp. 102-114.

Analytical Method for Simulation of Buckling and Post-buckling Behaviour 307
Cho, S. R.; Park, H. Z.; Kim, H. S.; Seo, J. S. (2007): Experimental and numer-ical investigations on the ultimate strength of curved stiffened plates. Proceedingsof 10th International Symposium on Practical Design of Ships and other FloatingStructures, Houston, Texas, USA.
Donnell, L. H. (1934): A new theory for the buckling of thin cylinders under axialcompression and bending. Transactions ASME, vol. 56, pp. 795-806.
Hao, B.; Cho, C.; Lee, S. W. (2000): Buckling and post-buckling of soft-coresandwich plates with composite facesheets. Computational Mechanics, vol. 25,no. 5, pp. 421-429.
Dai, H.; Paik, J. K.; Atluri, S. N. (2011): The Global Nonlinear Galerkin Methodfor the Analysis of Elastic Large Deflections of Plates under Combined Loads: AScalar Homotopy Method for the Direct Solution of Nonlinear Algebraic Equa-tions. Computers, Materials & Continua, vol. 23, no. 1, pp. 69-100.
Guggenberger, W. (1995): Buckling and post-buckling of imperfect cylindricalshells under external pressure. Thin-Walled Structures, vol. 23, pp. 351-366.
Kim, J.; Kim, Y. H.; Lee, S. W. (2004): Asymptotic Postbuckling Analysis ofComposite and Sandwich Structures via the Assumed Strain Solid Shell ElementFormulation. CMES: Computer Modeling in Engineering & Sciences, vol. 6, no.3, pp. 267–276.
Kundu, C. K.; Shinha, P. K. (2007): Post buckling analysis of laminated compos-ite shells. Composite Structures, vol. 78, pp. 316-314.
Kwen, Y. W.; Park, Y. I.; Paik, J. K.; Lee, J. M. (2004): Buckling and ultimatestrength characteristics for ship curved plate structures. Proceedings of the AnnualAutumn Meeting of SNAK, Sancheong, Korea.
Levy, S. (1943): Large-deflection theory of curved sheet. National Advisory Com-mittee for Aeronautics, Technical Note No. 895.
Maeno, U.; Yamaguch, H.; Fujii, Y.; Yao, T. (2004): Buckling/plastic collapsebehaviour and strength of bilge circle and its contribution to ultimate longitudinalstrength of ship’s hull girder. Proceeding of the 14th International offshore andpolar engineering conference, Toulon, France.
Park, J. S. (2008): Buckling/plastic collapse behaviour of unstiffened and stiffenedcurved plates. Thesis for the degree of Doctor of Engineering, Department of NavalArchitecture and Ocean Engineering, Osaka University, Japan.
Park, J. S.; Kohei, Y.; Shinsuke, K.; Iijima, K.; Yao, T. (2006): Buckling andpost-buckling behaviour of cylindrically curved plates under axial compression.Proceedings of the Society of Naval Architects and Ocean Engineers, Japan.
Park, J. S.; Iijima, K.; Yao, T. (2008): Characteristics of buckling and ultimate

308 Copyright © 2015 Tech Science Press CMES, vol.106, no.4, pp.291-308, 2015
strength and collapse behaviour of cylindrically curved plates subjected to axialcompression. Applied Mechanics and Materials, pp. 1195-1200.
Timoshenko, S. P.; Gere, J. M. (1961): Theory of elastic stability. McGraw HillKogakusha Ltd. UK.
Von Karman, T.; Tsien, H. S. (1941): The buckling of thin cylindrical shells underaxial compression. Journal of the Aeronautical Sciences, vol. 8, no. 8, pp. 303.
![Investigation on Simulation of Buckling of Aluminium Sheet ......The simulation of buckling geometry according [8] under an uniaxial tension load with the material properties of an](https://img.dokumen.tips/doc/110x75/60ed22dd6dffd264b06ed3b7/investigation-on-simulation-of-buckling-of-aluminium-sheet-the-simulation.jpg)