Embed Size (px)
Citation preview
Analytical Issues:
Making the numbers real
Dr. Rob Bowell – SRK Consulting (UK)
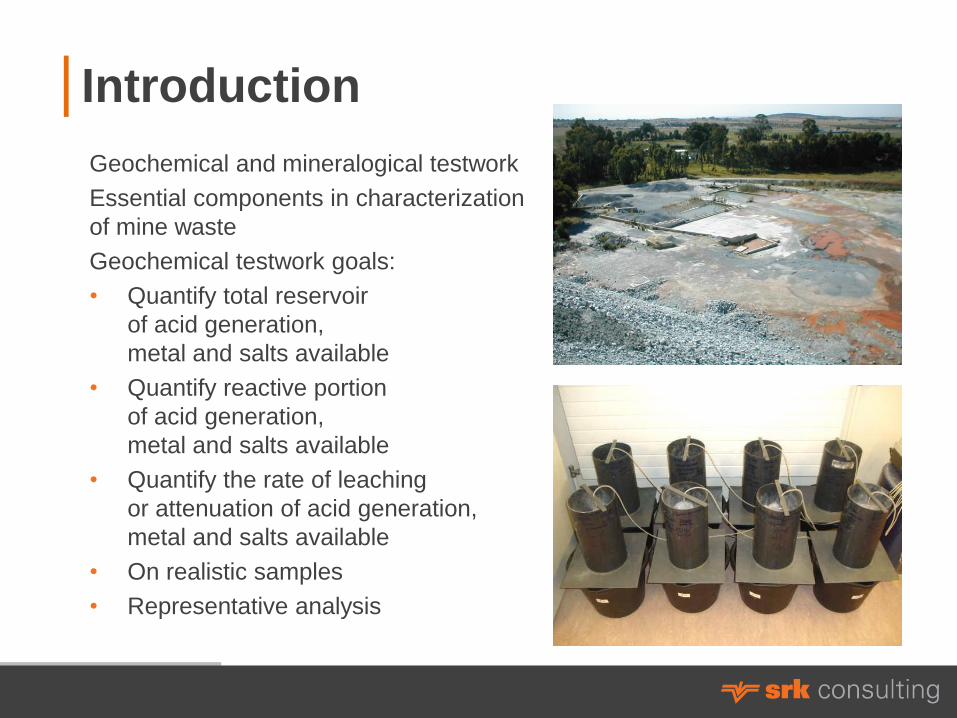
Introduction
Geochemical and mineralogical testwork
Essential components in characterization
of mine waste
Geochemical testwork goals:
• Quantify total reservoir
of acid generation,
metal and salts available
• Quantify reactive portion
of acid generation,
metal and salts available
• Quantify the rate of leaching
or attenuation of acid generation,
metal and salts available
• On realistic samples
• Representative analysis

Gaps in Predictive Knowledge
Sampling approach
• Representation
• Heterogeneity
• Number of samples
Verification of data
Assessment of non-standard
protocols
Application of field tests
Kinetic tests
Assessment of ecotoxicology
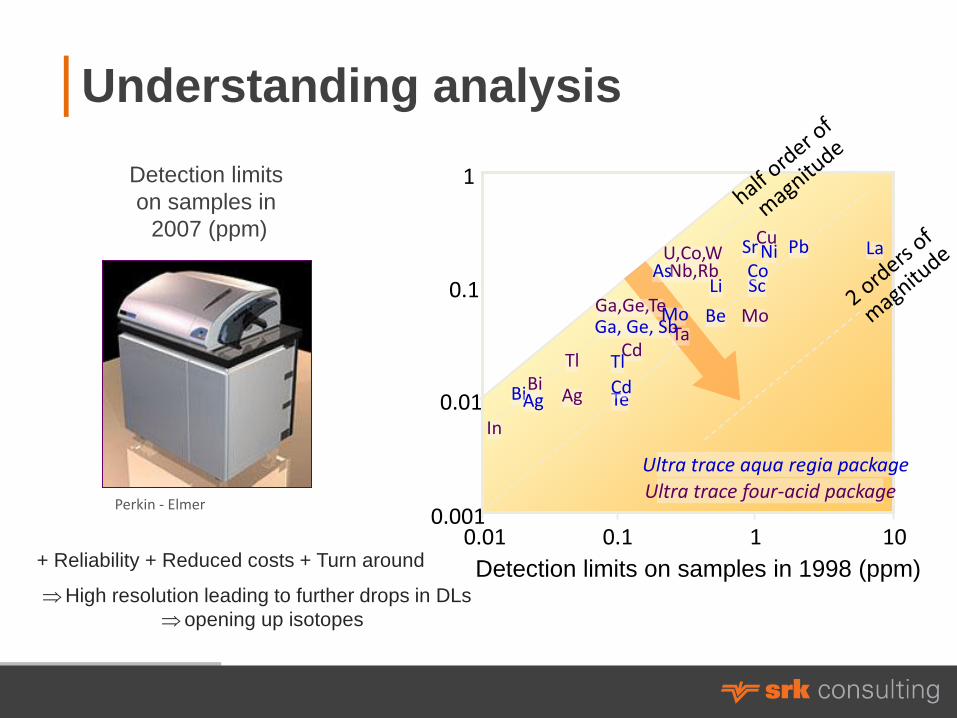
Detection limits
on samples in
2007 (ppm)
Perkin - Elmer
Detection limits on samples in 1998 (ppm)
0.001
0.01
0.1
1
0.01 0.1 1 10
Ultra trace four-acid package
Mo
Cu
Tl
Ag Bi
In
Ultra trace aqua regia package
La Pb Sr
Sc
Ni Co
Bi Ag
U,Co,W Nb,Rb
Li
Be Ta
Ga,Ge,Te
Cd
Mo
Tl
Te
Ga, Ge, Sb
Cd
As
+ Reliability + Reduced costs + Turn around
High resolution leading to further drops in DLs
opening up isotopes
Understanding analysis

QA-QC
• Essential role of a geochemist
• Ensure numbers collected are
representative
• Common commodities e.g. gold, copper,
nickel, iron obtain international standards
• New commodity types or data collection
methods need to generate site specific
standards
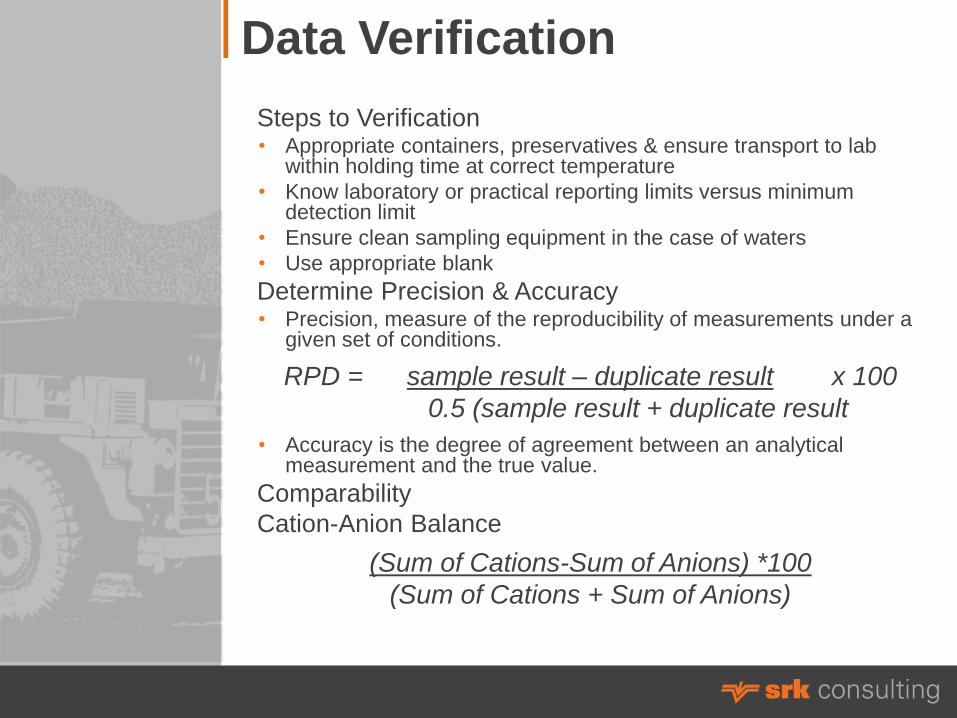
Data Verification
Steps to Verification • Appropriate containers, preservatives & ensure transport to lab
within holding time at correct temperature
• Know laboratory or practical reporting limits versus minimum detection limit
• Ensure clean sampling equipment in the case of waters
• Use appropriate blank
Determine Precision & Accuracy • Precision, measure of the reproducibility of measurements under a
given set of conditions.
RPD = sample result – duplicate result x 100
0.5 (sample result + duplicate result
• Accuracy is the degree of agreement between an analytical measurement and the true value.
Comparability
Cation-Anion Balance
(Sum of Cations-Sum of Anions) *100
(Sum of Cations + Sum of Anions)

Data assessment
Qualifier Description
R Rejected: The data are rejected due to deficiencies in meeting QC criteria
and may not be used for decision making.
J Estimated: The analyte was positively identified and is an estimate
due to discrepancies in meeting analyte-specific quality control criteria.
B Blank contamination: The analyte was found in an associated blank
above the RL, as well as in the sample.
UJ Estimate: The analyte was not detected; however, the result is an estimate
due to discrepancies in meeting analyte-specific quality control criteria.
D
The reporting limit is elevated due to matrix interference.
This is a laboratory applied qualifier and is incorporated in this report
for completeness.
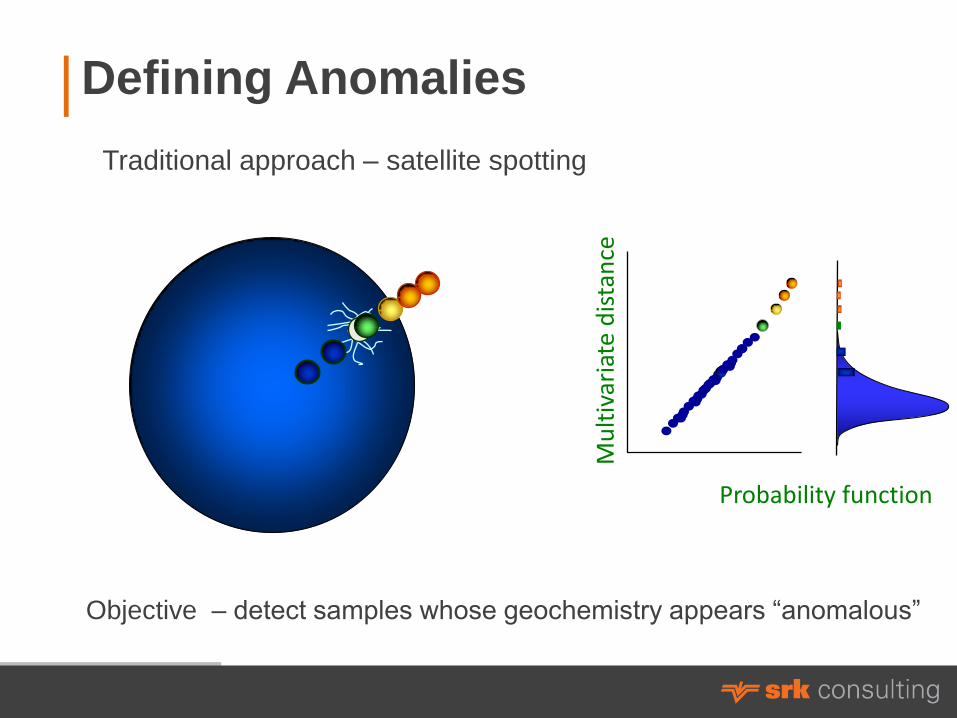
Mu
ltiv
aria
te d
ista
nce
Probability function
Traditional approach – satellite spotting
Objective – detect samples whose geochemistry appears “anomalous”
Defining Anomalies

Discriminating Variability
e.g, K-means clustering
Clustering and “anomaly” detection
e.g, PCA, FA and SVD
Pattern Recognition
Stretch Process
X1
X3
X2

Lixiviants in environmental studies
Typically we use water
Are there alternatives?
• Simulated mine
or process water
• Actual mine
or process water
• Reagents e.g. H2O2,
H2SO4
• Selective extraction
studies

(based on Gray, 1999)
Carbonates Resistate minerals
Silicates Mn-oxides
& am. Fe-ox.
Soluble phases
Cryst. Fe-oxides
Adsorbed & Exch. species
Organics
Acetate + HOAc
HF / fusion
Aqua regia
Mixed acids
Weak acidified NH2OH
EDTA / H+
Water (US
beer)
Strong acidified NH2OH
Regoleach
HCl
Ammonium acetate
MMI
Guinness
Na-pyro / H2O2
Enzyme Leach / H2O2
Increasing age of mineral phase in regolith Less transitory metal contents
Partial or Selective Extractions

Example of selective extraction
results, heap leach solid
0%
10%
20%
30%
40%
50%
60%
70%
80%
90%
100%
Antimony Arsenic Copper Beryllium Cadmium Lead Aluminium Nickel Zinc Iron
Residual
Pyrite
Reactive Sulfides
Crystalline FeOx
Amorphous FeOx
Labile
Soluble
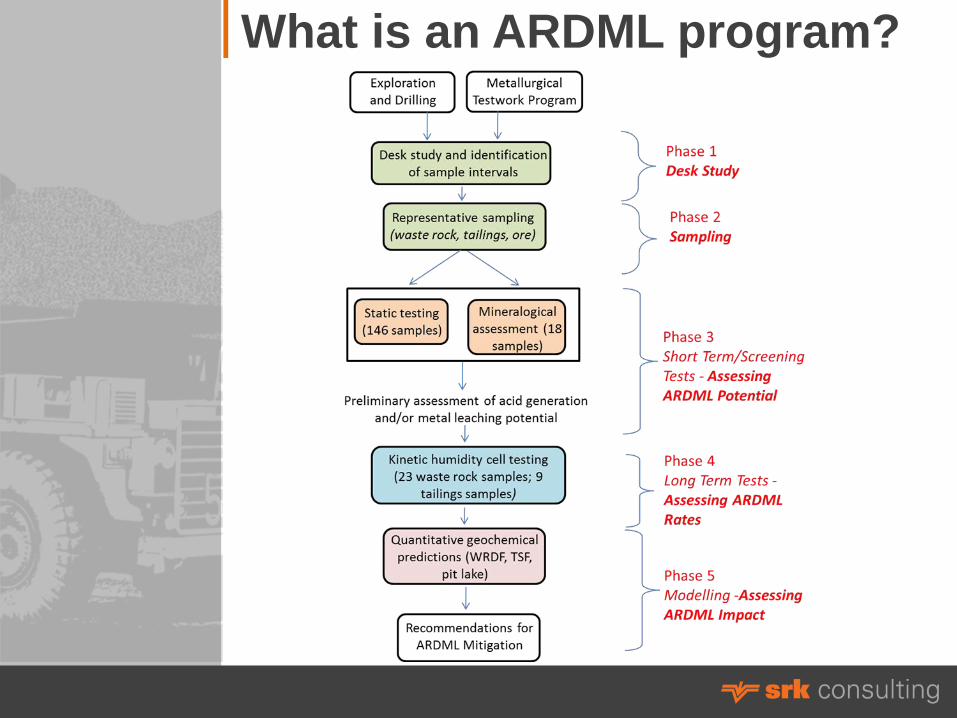
What is an ARDML program?
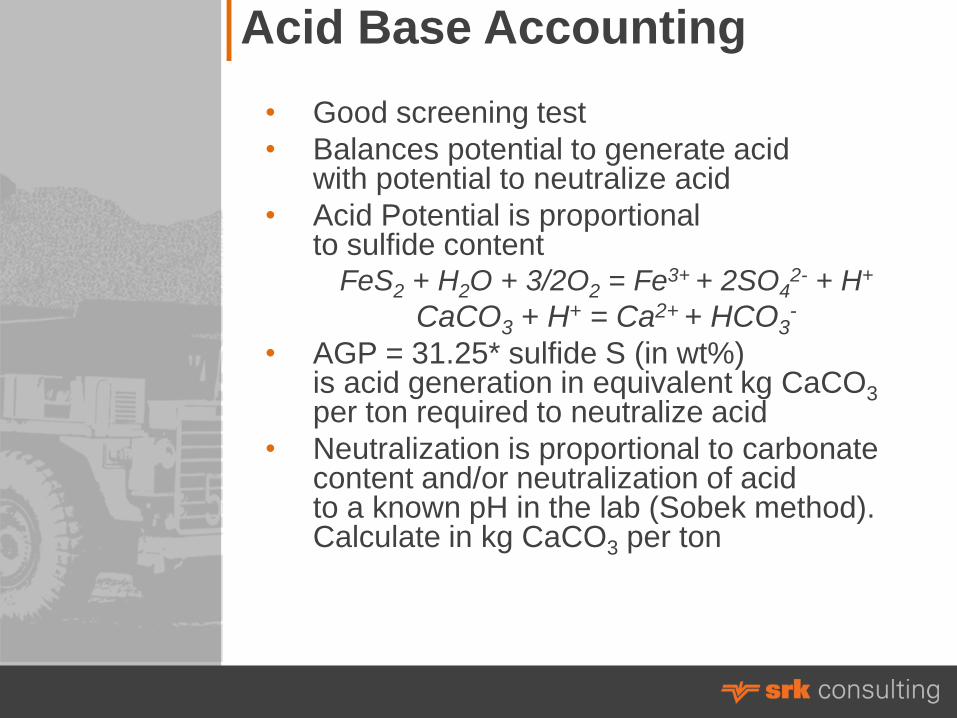
Acid Base Accounting
• Good screening test
• Balances potential to generate acid with potential to neutralize acid
• Acid Potential is proportional to sulfide content
FeS2 + H2O + 3/2O2 = Fe3+ + 2SO42- + H+
CaCO3 + H+ = Ca2+ + HCO3-
• AGP = 31.25* sulfide S (in wt%) is acid generation in equivalent kg CaCO3 per ton required to neutralize acid
• Neutralization is proportional to carbonate content and/or neutralization of acid to a known pH in the lab (Sobek method). Calculate in kg CaCO3 per ton

Assessment of Acid Generation
Geological controls to acid generation
Map areas of high acid generation in pit
Relate to mining plans or geological units
Management criteria
• NAF, Not Acid Forming- > 20 eq.kg CaCO3/ton of rock of buffering capacity
• IND, Indiscriminate, Between ±20 eq.kg CaCO3/ton of rock of buffering capacity
• PAF, Potentially Acid Forming- < -20 eq.kg CaCO3/ton of rock of buffering capacity

Acid Base Accounting

Comparison of Static Test
Methods
• Both Sobek ABA and
Net Carbonate Value methods
are commonly used in Nevada
• Methods differ in both
the quantitation of ANP and AGP
• Are the methods comparable?
• Which method is better?

Comparison of AGP

Comparison of NNP

Comparison of NPR to Sulfide Sulfur

Neutralization Potential

What Defines Neutralization?

Comparison of ANP

Other Methods
• Net Acid Generation
or Hydrogen Peroxide test
• Useful in that it oxidizes
sulfide exposed in sample –
estimate of reactivity
• Measure metals in leachate
• Neutralize to a set pH to determine
acid content and calculate
to equivalent kg H2SO4 per ton
generated by sulfide oxidation

NAG test
Caption/Description of XX 25
Acid Generation Capacity Final NAG pH
(s.u.) Static NAG
(kg H2SO4 eq/ton)
Potentially Acid Forming (PAF)
Higher Capacity < 4 >10
Lower Capacity < 4 <10, >1
Non-Acid Forming (NAF) > 4 0
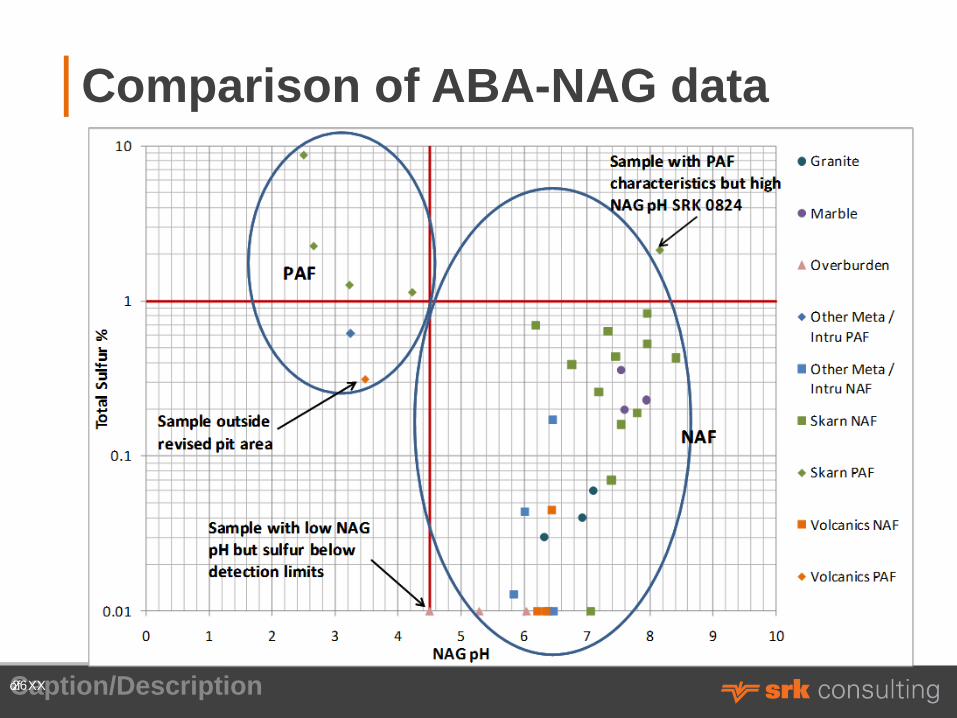
Comparison of ABA-NAG data
Caption/Description of XX 26

More methods
of XX 27
• Sequential NAG test
• Kinetic NAG test
• Oxygen consumption test
• Rising head test
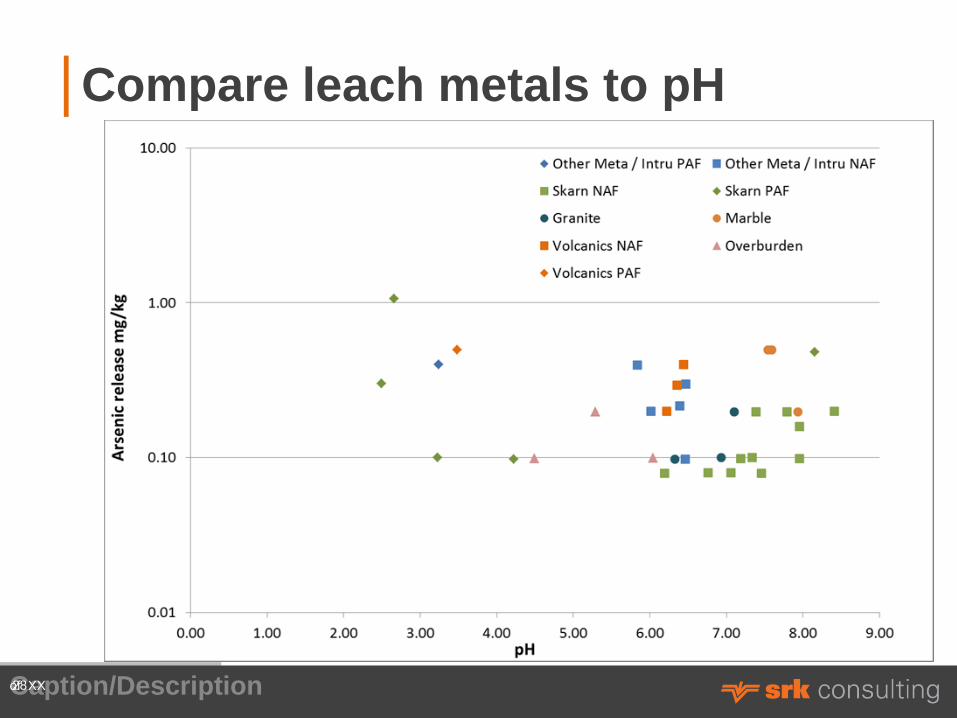
Compare leach metals to pH
Caption/Description of XX 28

Kinetic NAG
Caption/Description of XX 29

Whole Rock Geochemistry
of XX 30
• Good screening test- determine
potential metals of concern

GAI index
Caption/Description of XX 31
GAI Value Interpretation
0 < 3 times average crustal concentrations
1 3 to 6 times average crustal concentrations
2 6 to 12 times average crustal concentrations
3 12 to 24 times average crustal concentrations
4 24 to 48 times average crustal concentrations
5 48 to 96 times average crustal concentrations
6 >96 times average crustal concentrations
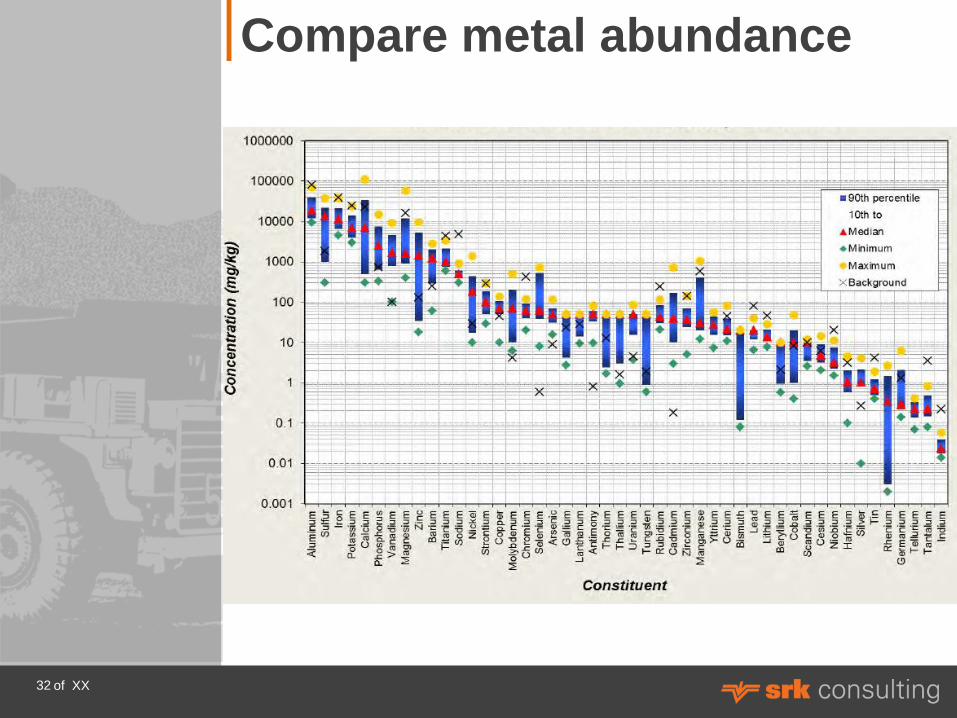
Compare metal abundance
of XX 32

Compare to mineralization
Caption/Description of XX 33

Partial leaching to assess metal mobility
Static approach • TCLP; pH adjusted water:
solid ratio
• SWEP; pH adjusted water:
solid ratio
• EPA 1312 test; 20:1 pH
adjusted water: solid ratio
• Bottle roll test; typically
with DI
• MWMP (Nevada); pH
adjusted water of 1 pore
volume to solid ratio
Kinetic approach • Different columns as an
approach
Standard Cell Tall Cell Broad Cell
94 mm64 mm 144 mm
20
0 m
m
50
0 m
m
150
mm
Adjustable clip with screw to tighten
Rubber bung with glass tube running through centre
Plastic piping for draining cell into collection vessel
Perspex base plate with drilled holes for sample drainage
Filter Funnel, attached to base place with silicone sealant

Example: static tests on a Carlin
waste rock sample
Element
mg/L
SPLP
Test Porewater MWMP
Reaction with 10%
aqua regia 15% H2O2
Aluminium 14.9 11.7 16.3 15.8 10.8
Arsenic 0.766 0.85 1.61 21.3 13.9
Cadmium 0.031 0.024 0.155 2.54 1.66
Copper <0.005 <0.005 0.037 4.15 3.89
Fluoride 0.18 0.21 0.24 Not analysed 1.18
Iron 1.86 0.78 2.33 67.5 59.2
Lead 0.014 0.011 0.022 1.9 1.84
Mercury <0.002 <0.0005 <0.002 1.72 1.65
Nickel 0.71 0.43 0.96 7.91 8.21
Selenium 0.04 0.051 0.076 1.33 0.86
Sulfate 128 146 337 Not analysed 835

Metal Leaching Risk
Test Extractant Water:Rock
Ratio
Comments
MWMP DI water 1:1 Most common test
SPLP (1312) Wk HNO3,H2SO4 20:1 EPA std, very dilute
EN1457 (EU) DI water 2:1 & 8:1 EU approved
Humidity Cell DI water ~1.5:1 / wk Best for assessing rate of
release
Columns Any Progressive $$, most flexible &
representative
NAG Metals
H2O2
100:1
New, holds promise for core
samples
Pilot Tests Meteoric water <<1:1 Early operation stage
Predicting soluble Constituents in Mine Water
NWMA - Reno, NV 36

Metal Leaching Risk
Compared contact water chemistry with:
• MWMP, SPLP (1312), Column tests
Variable agreement between test and result
• Failure to use weathered sample – real need for test that accelerates weathering
• Inappropriate water:rock ratio
• Failure of current test methods mitigated by predictable solubility behavior for some constituents or over certain pH ranges
December 3, 2008 NWMA - Reno, NV 37

38


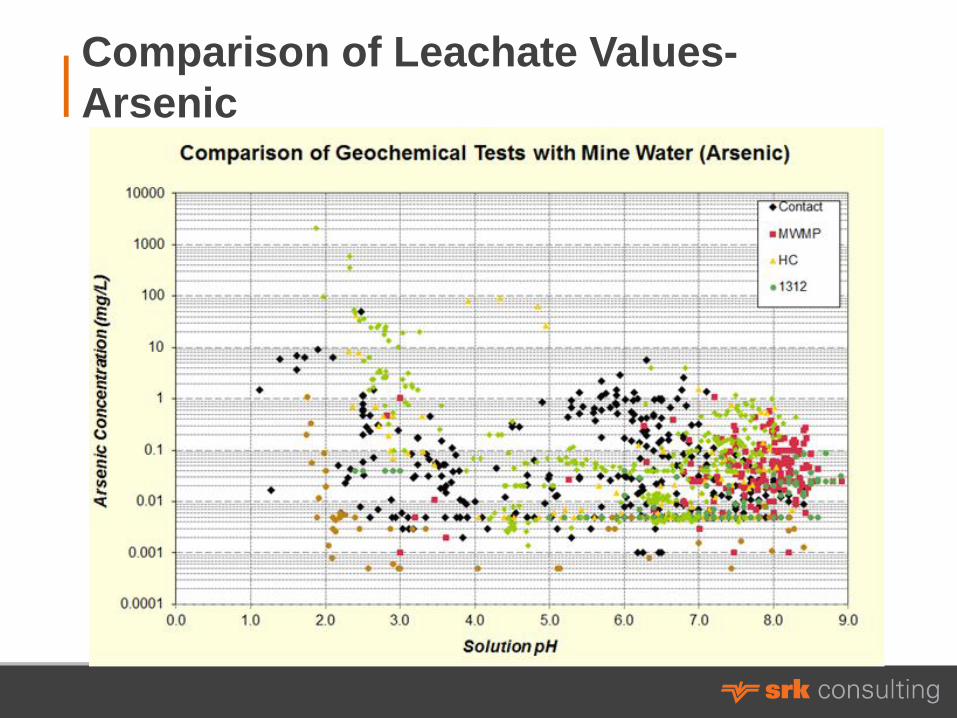
Comparison of Leachate Values-
Arsenic

Compare parameters – Ficklin plot

Kinetic testing
• Purpose to define rate
of leaching not to remove
all mobile constituents
• The relative rates of acid
generation and neutralisation,
(important in determining
if a sample will “go acid”)
• The time to ARD onset
• Drainage chemistry
and the resulting
downstream loading

Kinetic testing
• Which protocol to run?
• How long do you
operate?
• What parameters to
run?
• Type of cell utilized?
• What lixiviant to use?
• Termination analysis?
Dry air & MoistAir In
Air OutRinse water in
Waste Rock Sample
PerforatedSupport
Leachate Out
PlexiglasTube

Selection of Humidity Cells
• Select on rock
types/alteration types
• Select on highest WRA
constitutes e.g. As
• High/low S/C values
• Proportional to ore
grade?
• Proportional to static
results?
0
1
1
2
2
3
3
4
4
0.00 0.05 0.10 0.15 0.20 0.25 0.30 0.35 0.40
Su
lfid
e S
ulf
ur
(wt%
)
Gold Grade (opt)
Skip Samples
Muck Samples
HCT Samples
Ore
Gra
de
Cu
t-O
ff=
0.1
4 o
pt

Interpretation of Kinetic data
• Use sample volume
of leachate to same mass
of solid
• SG and porosity varies
from rock to rock
so ratio varies
• Convert mg/L from cell
analysis to mg/kg/week leach
rate
• Calculate removal rates-
cumulative or sequential

Example of mine tailings acidification
-40
-20
0
20
40
60
80
100
120
0 2 4 6 8 10 12 14 16 18 20 22 24 26 28 30 32 34 36 38 40
Time (Weeks)
Nu
trali
zin
g P
ote
nti
al
(%)
T3_G4
T3_BH4_30
T3_BH4_10
T10_BH3_05
T10_BH1_220
T10_BH1_130
T10_BH1_7.5
T1_BH7_90
T1_BH7_50
T5_BH25_40
T6_BH24_20
T1_BH9_60,BH27_15
T5_BH25_50,BH12_50
T6_BH23_70

Metal/metalloid release:
Sulfide waste rock
As, Zn, Mn, Ni Leached (mg/kg/week) - Carlin sulfide waste
0
5
10
15
20
25
30
35
40
0 1 2 4 6 10 15 20 24 28 32 36 40 48 52 60 70 80 95
Time (weeks)
Leachin
g R
ate
(m
g/k
g/w
eek)
As
Zn
Mn
Ni

Influence of aeration
Forced aeration common
in kinetic testwork
Periodic cycling of dry
and moist air
Effects questioned e.g. Lapakko
& White, 2000 demonstrated
no appreciable effect
Aerated (APSA) vs.
non-aerated (APSN) cells

Effects of aeration on pH
2.0
3.0
4.0
5.0
6.0
7.0
8.0
0 10 20 30 40 50 60 70
Cycle Number
pH
AP-S-A
AP-S-N
VMS-S-A(1)
VMS-S-A(2)
VMS-S-N(1-6)
VMS-S-N(2)
VMS-S-N(3)
VMS-S-N(4)
VMS-S-N(5)
VMS-S-N(6)

Effects of aeration on sulfate production
0
500
1000
1500
2000
2500
3000
3500
4000
0 10 20 30 40 50 60 70
Cycle Number
Su
lfate
Rele
ase (
mg
/kg
/cycle
)
AP-S-A
AP-S-N
VMS-S-A(1)
VMS-S-A(2)
VMS-S-N(1-6)
VMS-S-N(2)
VMS-S-N(3)
VMS-S-N(4)
VMS-S-N(5)
VMS-S-N(6)

Influence of secondary minerals
Importance of mineralogy
Formation dependent
on reaction rates in cell
Secondary minerals-
are they wanted?
Problems with sulfur
mass balance

Fe:S ratio
0.0
0.1
0.2
0.3
0.4
0.5
0.6
0.7
0.8
0 10 20 30 40 50 60 70
Cycle Number
[F
e] /
[S
O4
2-]
VMS-S-A(1)
VMS-S-N(2)
VMS-S-N (14 day)
VMS-S-N (28 day)

Conceptual model

Influence of Particle Size
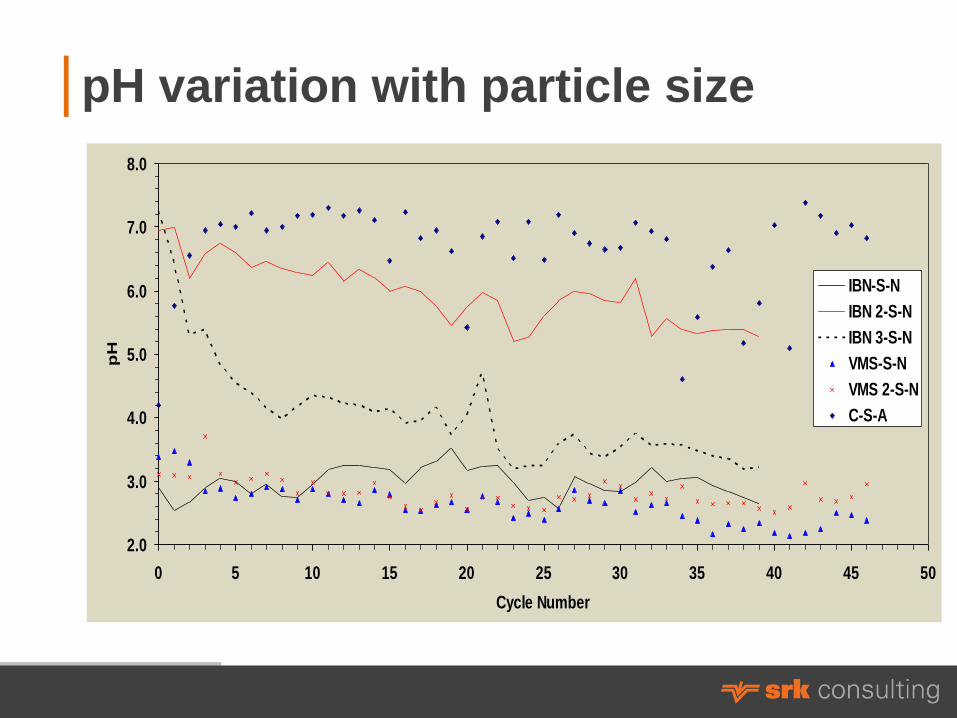
pH variation with particle size
2.0
3.0
4.0
5.0
6.0
7.0
8.0
0 5 10 15 20 25 30 35 40 45 50
Cycle Number
pH
IBN-S-N
IBN 2-S-N
IBN 3-S-N
VMS-S-N
VMS 2-S-N
C-S-A
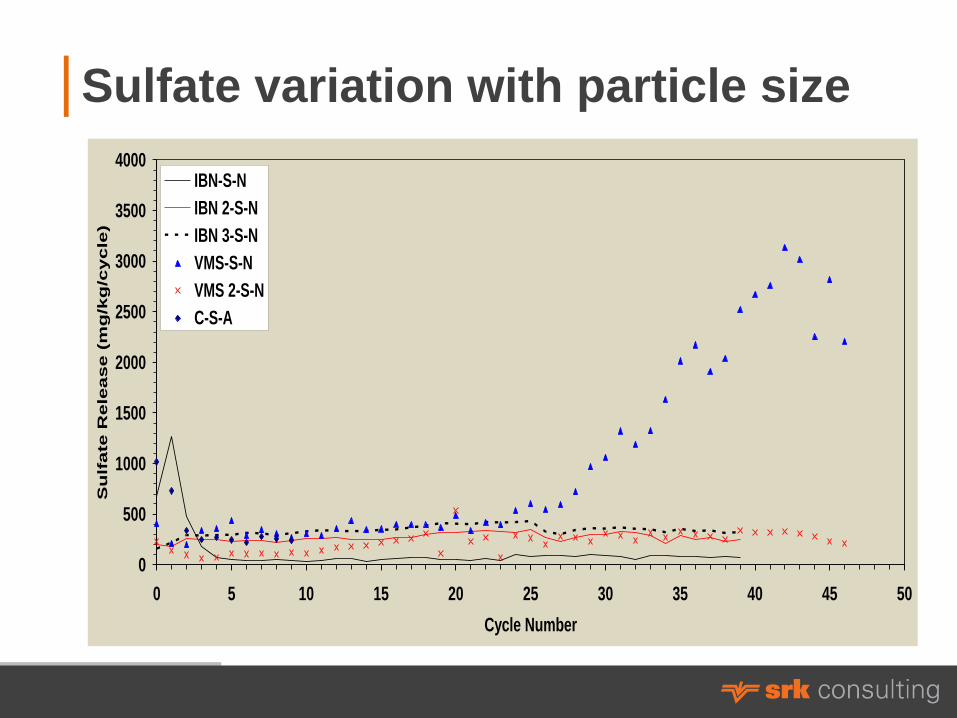
Sulfate variation with particle size
0
500
1000
1500
2000
2500
3000
3500
4000
0 5 10 15 20 25 30 35 40 45 50
Cycle Number
Su
lfa
te R
ele
as
e (
mg
/kg
/cy
cle
)
IBN-S-N
IBN 2-S-N
IBN 3-S-N
VMS-S-N
VMS 2-S-N
C-S-A

Effect of sample mass on pH
2.0
3.0
4.0
5.0
6.0
7.0
8.0
0 10 20 30 40 50 60 70
Cycle Number
pH
VMS-L-N(1)
VMS-L-N(2)
VMS-S-N(1-6)
VMS-S-N(2)
VMS-S-N(3)
VMS-S-N(4)
VMS-S-N(5)
VMS-S-N(6)

Effects of sample mass on sulfate
0
500
1000
1500
2000
2500
3000
3500
4000
0 10 20 30 40 50 60 70
Cycle Number
Su
lfa
te R
ele
ase m
g/k
g/c
ycle
)
VMS-L-N(1)
VMS-L-N(2)
VMS-S-N(1-6)
VMS-S-N(2)
VMS-S-N(3)
VMS-S-N(4)
VMS-S-N(5)
VMS-S-N(6)

Influence of flushing frequency on pH
2.0
3.0
4.0
5.0
6.0
7.0
8.0
0 10 20 30 40 50 60 70
Cycle Number
pH
IBN 2-S-N
IBN 2-S-N (21 day)
VMS-S-N (14 day)
VMS-S-N (28 day)
VMS-S-N(1-6)
VMS-S-N(2)
VMS-S-N(3)
VMS-S-N(4)
VMS-S-N(5)
VMS-S-N(6)

Influence of flushing frequency on sulfate
0
500
1000
1500
2000
2500
3000
3500
4000
0 20 40 60 80 100 120
Test Duration (weeks)
Su
lfa
te R
ele
as
e (
mg
/kg
/we
ek
)
IBN 2-S-N
IBN 2-S-N (21 day)
VMS-S-N (14 day)
VMS-S-N (28 day)
VMS-S-N(1-6)
VMS-S-N(2)
VMS-S-N(3)
VMS-S-N(4)
VMS-S-N(5)
VMS-S-N(6)

How long should they run?
• Consistent release rates
over 3-4 weeks
• No obvious increases
in trace elements
• Is there a Minimum period?
• Comparison to static tests

Comparison HCT to NAG
Compare HCT results
to statics
Gauge if reactions
are complete or
if predictions reasonable
Scale factor from static
testwork to HCT
• useful to apply static data
as a substitute for HCT
release data for preliminary
assessment (factor of 250x)

Alternative Approach
Europe
ARDML assessment still relatively new
Focus from Landfill/ Radionuclide
assessment/ Chemical Contamination –
Risk Based Approach
• Risk Screening test - WRA
• pH solubility testing
• Kappa testing
• Flushing tests
• Diffusion assessment
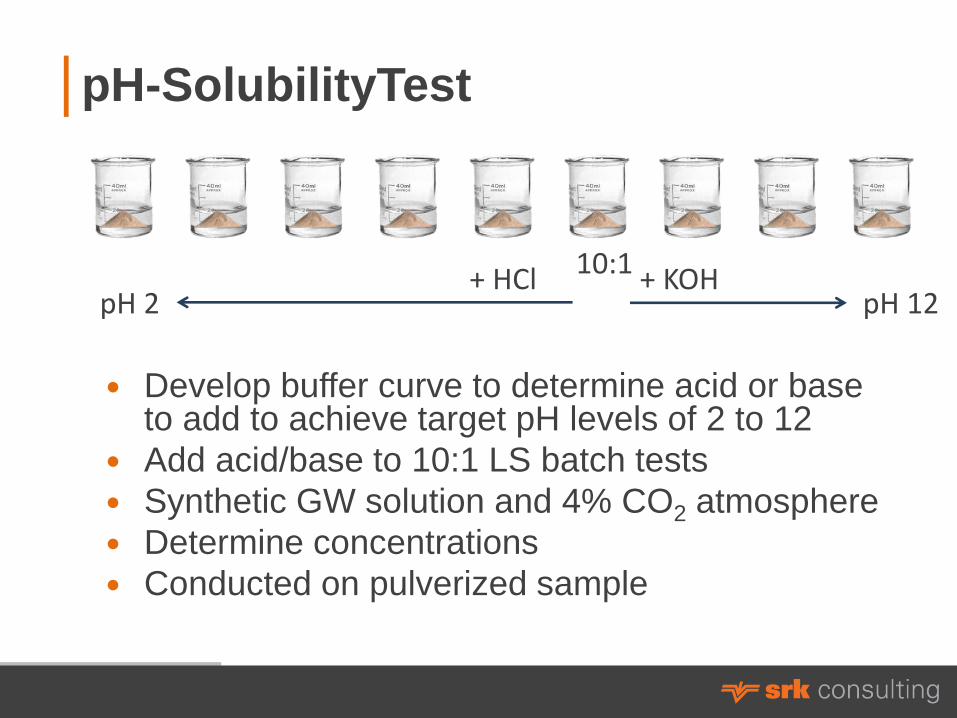
pH-SolubilityTest
10:1 + KOH + HCl pH 12 pH 2
Develop buffer curve to determine acid or base to add to achieve target pH levels of 2 to 12
Add acid/base to 10:1 LS batch tests
Synthetic GW solution and 4% CO2 atmosphere
Determine concentrations
Conducted on pulverized sample

Kappa test: Short term leach test
2:1
100:1
10:1
Batch tests at 2:1, 5:1, 10:1, 50:1
and 100:1 LS ratio
Synthetic GW solution and 4%
CO2 atmosphere
React for 24 hours
Determine concentrations
Conducted on pulverized sample
CLS = C0 e –κ(LS)
Where CLS is the concentration at any leaching proportion LS
C0 is the first flush concentration,
κ is a derived parameter, kappa
LS is the liquid:solid ratio
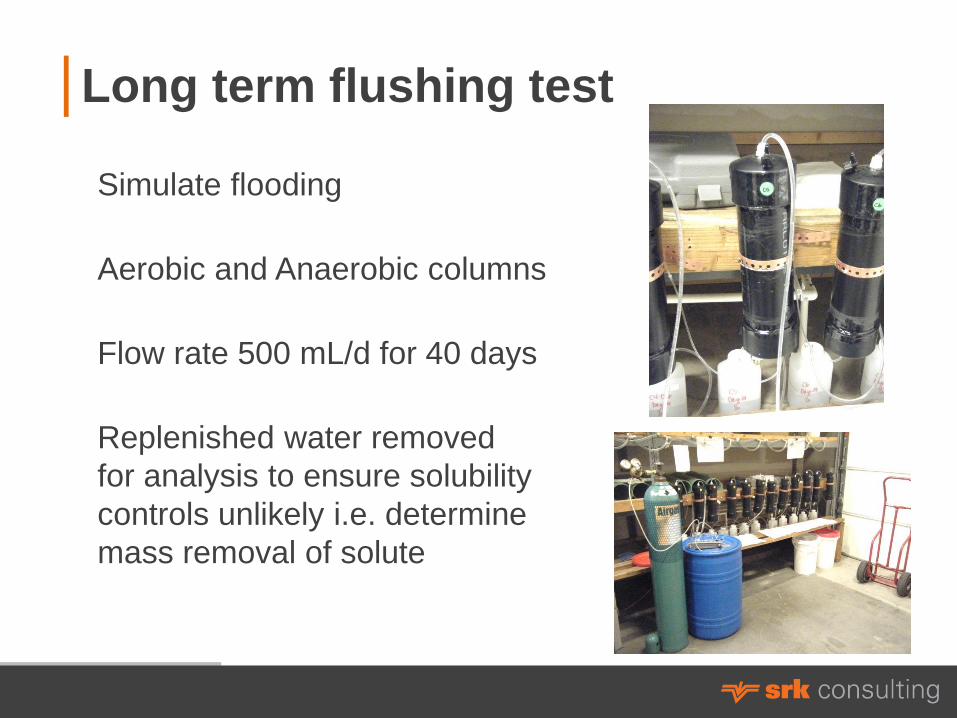
Long term flushing test
Simulate flooding
Aerobic and Anaerobic columns
Flow rate 500 mL/d for 40 days
Replenished water removed
for analysis to ensure solubility
controls unlikely i.e. determine
mass removal of solute

Diffusion tests: ASTM C1308
Developed for evaluating diffusive release of radioactive constituents
from cemented waste
Application in assessment of Paste Backfill or Encapsulated tailings
Varying contact time
Uses synthetic groundwater
Numerical evaluation assess whether diffusion or chemical dissolution
is controlling concentrations
𝐶𝐹𝐿 =
𝑎𝑛𝐴0= 𝐼𝐹𝐿 = 2
𝑆
𝑉
𝐷𝑎𝑡
𝜋
1/2
Where an is the mass of constituent in the nth batch solution
Ao is the total available constituent mass in the cylinder
S is the cylinder surface area (cm2)
V is the cylinder volume (cm3)
Da is the apparent diffusivity cm2/s
T is time in s
3 hr 3 hr 12 hr 6 hr 24 hr 24 hr 24 hr

Case Study: Paste backfill, Sappes, Greece
• Underground mine fill
• Corrosive to conventional cement
• Rapid mix-key (less time for oxygen/water reaction)
• Develop understanding of geochemical stability in
order to determine physical stability
• Roaster tailings treated to reduce cyanide levels
• Tailings are hydro-cycloned to obtain coarse fraction
• Cyclone underflow filtered to reduce water content
• Binder added to filtered U/F, mixed and adequate
water added for hydration
• Paste pumped underground. Residual water absorbed
through chemical hydration reactions
• Strength develops as paste cures over several month
period
• Formation of hydrated cement minerals decreases
mobility of constituents in tailings
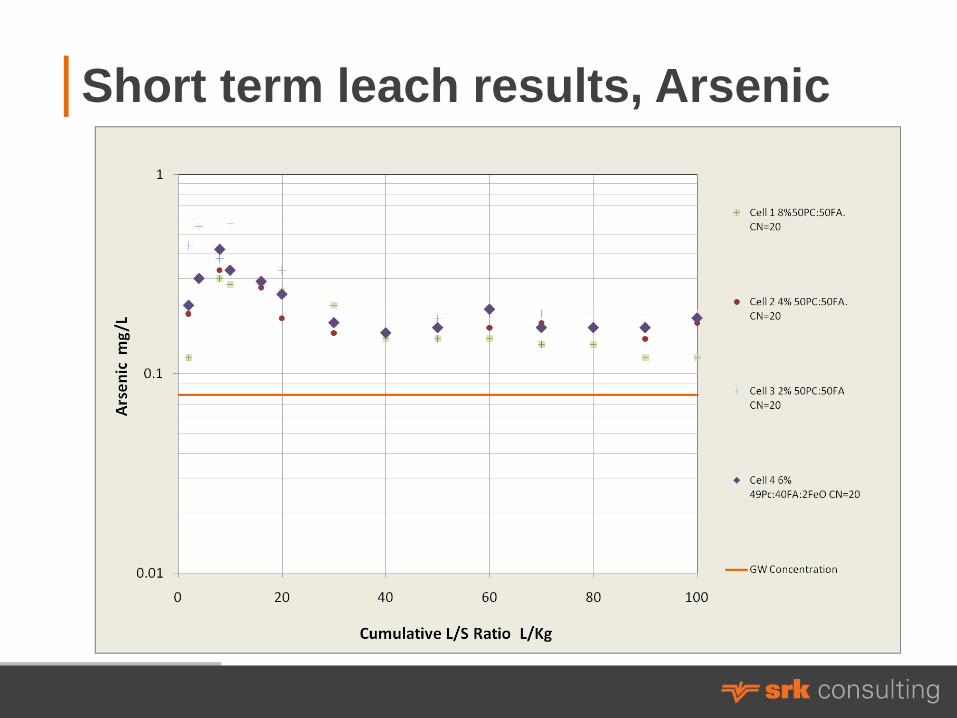
Short term leach results, Arsenic

Long term leachate results, Arsenic

Diffusion test conditions

Diffusion test results, Arsenic
Static testing metal leaching
• Mobilize labile metals, dissolve reactive
minerals
• Simulates short term rain water
or meteoric rinsing
• Only indicates reactive component, nor
quantitative
• Over estimate versus initial kinetic test
leachates due to high water: solid ratio
• Physical flushing and chemical leaching

Example of mine tailings acidification
-40
-20
0
20
40
60
80
100
120
0 2 4 6 8 10 12 14 16 18 20 22 24 26 28 30 32 34 36 38 40
Time (Weeks)
Nu
trali
zin
g P
ote
nti
al
(%)
T3_G4
T3_BH4_30
T3_BH4_10
T10_BH3_05
T10_BH1_220
T10_BH1_130
T10_BH1_7.5
T1_BH7_90
T1_BH7_50
T5_BH25_40
T6_BH24_20
T1_BH9_60,BH27_15
T5_BH25_50,BH12_50
T6_BH23_70

Metal/metalloid release- sulfide waste rock
As, Zn, Mn, Ni Leached (mg/kg/week) - Carlin sulfide waste
0
5
10
15
20
25
30
35
40
0 1 2 4 6 10 15 20 24 28 32 36 40 48 52 60 70 80 95
Time (weeks)
Le
ach
ing
Ra
te (
mg/k
g/w
ee
k)
As
Zn
Mn
Ni
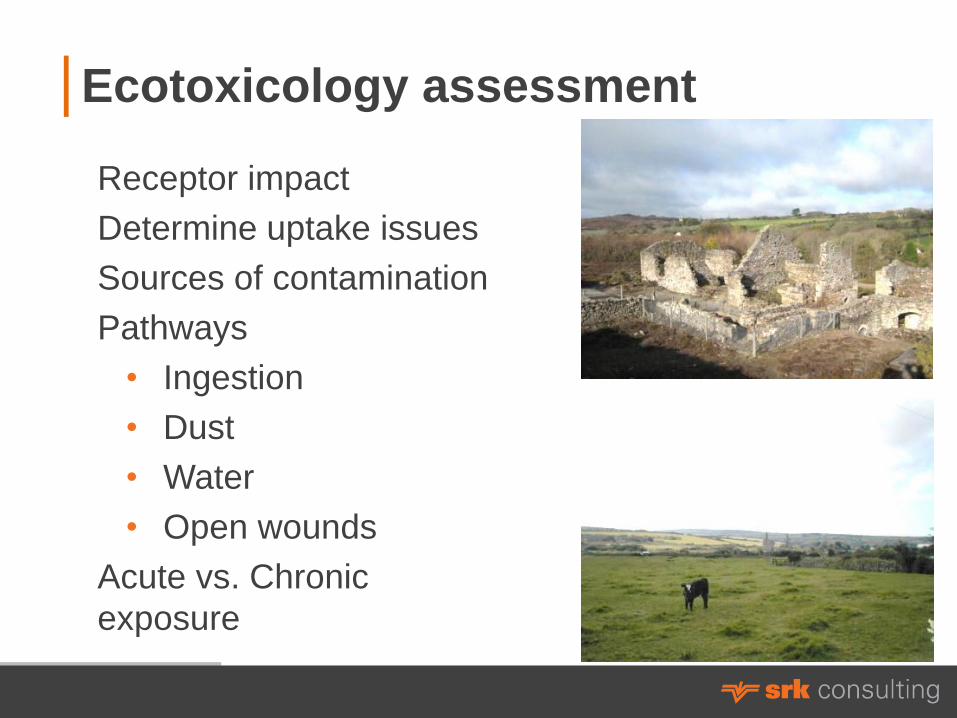
Ecotoxicology assessment
Receptor impact
Determine uptake issues
Sources of contamination
Pathways
• Ingestion
• Dust
• Water
• Open wounds
Acute vs. Chronic
exposure

Example: Arsenic rich waste in Cornwall
• Exposed mine waste
and processed waste
• Arsenic concentration
reported up to 12%
in soil and waste
• Developed recreational area
• Potential for arsenic
ingestion by humans
and animals
• Balance human health
and cultural sustainability

Arsenic geochemistry
Arsenic occurrence
in nature
• As (III), sulfides,
reducing
• As (V), ambient, oxide
• MMAA/DMAA/organic-
rich environments
Arsenic mobility
• reducing
• low Al/Fe
• v.acidic (pH <2) or
alkaline (pH > 8.5)

Arsenic selective extraction
• Selective extraction to determine potential hosts
of soluble arsenic
• Used approaches of Keon et al. 2001; Hall, 2004

Results of SE

Arsenic release

Arsenic toxicity test
PBET test
Simulate gastrotestinal
consumption
Several sequential
extractions at 37°C
Bioavailability
risk assessment
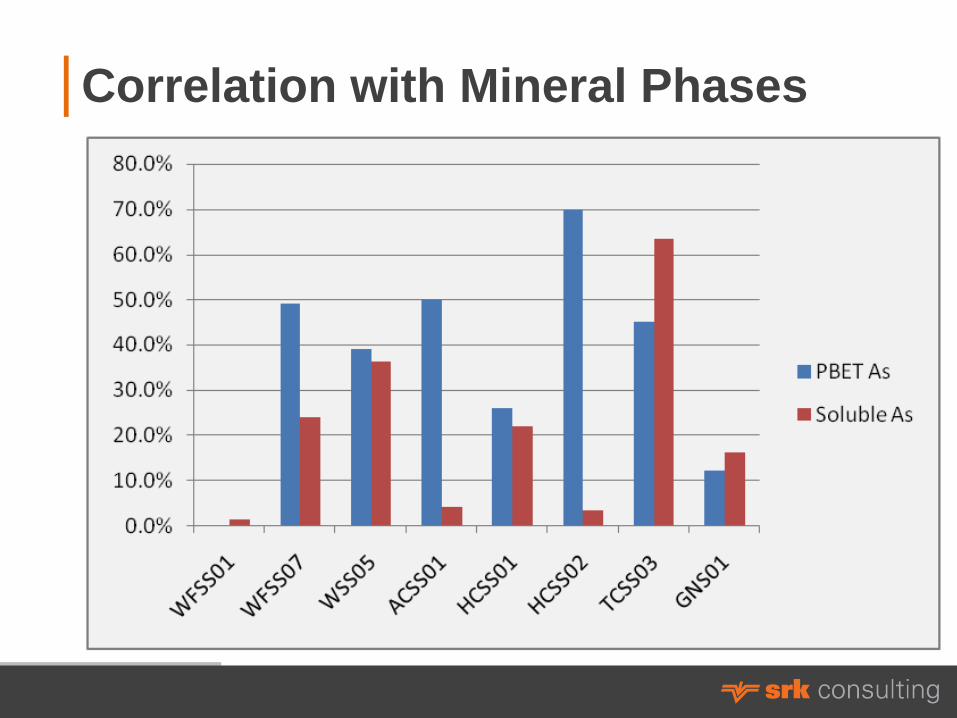
Correlation with Mineral Phases
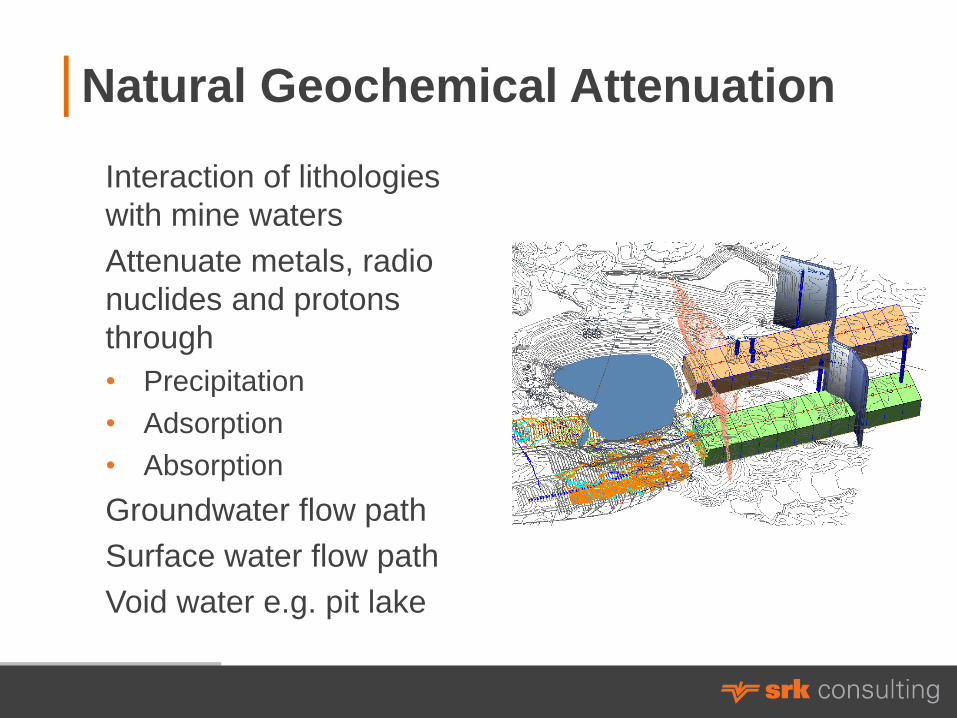
Natural Geochemical Attenuation
Interaction of lithologies
with mine waters
Attenuate metals, radio
nuclides and protons
through
• Precipitation
• Adsorption
• Absorption
Groundwater flow path
Surface water flow path
Void water e.g. pit lake

Attenuation assessment
High HFO content
Large columns
Compaction to field densities
Saturate loaded column
Drain column completely
Repeat to obtain break-
through (i.e. loss
of attenuation capacity)

Arsenic attenuation Glamis Attenuation Studies
Arsenic Attenuated (%)
-100%
-80%
-60%
-40%
-20%
0%
20%
40%
60%
80%
100%
PV
1
PV
3
PV
5
PV
7
PV
9
PV
11
PV
13
PV
15
PV
17
PV
19
PV
21
PV
23
PV
25
PV
27
PV
29
Time (Pore Volume)
% A
tte
nu
ate
d
Alluvium
Edna Mountain
Havalla
Valmy

Take Home Points Sampling
• Representation/Repeatability
• Account for Heterogeneity
Field Assessment
• Screening approach
• Provide informed sampling approach
Analysis
• Data verification
• Use of laboratory QA to confirm valid analysis
Data Assessment
• Account for variability
• Identify trends
Kinetic testing influenced by
• Internal factors eg particle size, mineralogy, mineral reactions in cell, biota activity
• External factors eg aeration, sample size, frequency of flush
Protocols
• GARD manual has excellent range of methodologies that cover >90% of requirements
• Consider site specific or problem specific approaches
• Greater use of mineralogy & selective extraction
• Kappa approach as an alternative to humidity cells
• Assess directly potential toxicity – useful where direct receptors can be identified