Embed Size (px)
Citation preview

ANALYTICAL BIOCHEMISTRY 4, 26%283 (1962)
Analytical Techniques for Cell Fractions.
II. A Spectrophotometric Column Monitoring System
N. G. ANDERSON
From the Biology Division, Oak Ridge National Laboratory,’ Oak Ridge, Tennessee
Received November 9, 1961
IKTRODUCTION
To follow changes in the composition of cells and tissues occurring as responses to experimental variables, it is necessary to have available rapid aut.omat.ed analytical systems for the major cell constituents. Initially it is prudent to develop t,hose systems that have the widest application. Continuous recording of absorbance of coIumn effluents at one or several wavelengths in the ultraviolet range allows the quantita- tion not only of proteins, nucleotides, and nucleotide derivatives (4), but also of peptides (with or without aromatic groups) (l-3,5), and, as will be shown in a subsequent paper, lower fatty acids. In addition, enzymic activities producing changes in ult,raviolet-absorbing substrates or cofactors may be monitored.
In this paper the details of two ultraviolet absorbance recording sys- tems are reported. Subsequent papers will deal with methods using them for analyzing specific mixtures.
AXALTTICAL SYSTEMS
Of the four uhraviolet-monitoring systems that we have investigated, two have been found useful for routine analysis.
Single-Beam, Two-Wavelength Systems
The system we have used for more than 2 years (Fig. 1) includes either two Beckman DU spectrophotometers, with spectral energy adapters* and power supplies,3 or one DU and one DUR spectrophotome- ter.4 While the lat,ter is not useful below 216 rnp, its electronic stability
‘Operated by Union Carbide Corporation for the U. S. Atomic Energy Com- mission.
’ Spectral energy adapter, Catalogue No. 5800, Beckman Instruments, Inc., Fullerton, Calif.
‘Power supply, Beckman Catalogue Ko. 23700. “ilvailable only on special order from Berkman.
269

270 ANDERSON
FIG. 1. Single-beam, two-wavelength system. Beckman DU and DUR spectro- photometers (center) are arranged to record absorbance at two wavelengths on the multipoint recorder (top). A recording pH meter with a small-volume electrode assembly is shown in the lower left, while the pump is mounted in the lower right. Columns and gradient-producing devices are mounted on the bars along the right side of the instrument. Control panel (upper right) allows control of each com- ponent separately.
is of considerable advantage. The spectrophotometers were attached to a IO-mv Honeywell Multipoint Recorder5 having a chart speed of 2 in./ hr, a 2.5-set balancing motor, and a 5-set printing time. The voltages to the spectrophotometers and the recorder were stabilized by a constant-
s Model Y 153X67-V12H-II-III-(H16)-A8A9K la-point cyclic balance strip-chart recorder with a dual nonshorting E-point selector switch, a separate chart drive motor to obtain a chart speed of 2 in./hr, and a 4~ amplifier. Available from Minneapolis Honeywell Inc., Minneapolis, Minn.

COLUMN MONITORING SYSTEM 271
voltage transformer. 6 The flow cells (0.2 and l.O-cm light path)’ and methods for connecting them to fine plastic tubing have been described (2).
By careful tube selection and maintenance it is possible to obtain very stable baselines. Since considerable drift is seen when the instruments are first turned on, it is our practice not to turn them off unless they are to be idle for more than three days.
The great advantage of these simple single-beam systems is that any two wavelengths from 205 mp to the near-infrared may be monitored. However, for very prolonged runs (approximately 25 hr) they show a small drift in the dark-current (infinite absorbancy) set,tings. For this reason a new and relatively inexpensive double-beam spectrophotometer has been modified for flow monit,oring.
Double-Beam Monitoring System.
The completed system is shown in Fig. 2. A Beckman DB spectro- photometer was modified by t,he addition of the pneumatic wavelength- shifting mechanism shown in Figs. 3 and 4. A piston, attached through a linkage to the wavelength dial, moves the dial alternately from 260 to 280 rnp (other wavelengths 20 rnp apart may also be selected) in syn- chrony wit,h the printing cycle of the recorder (Fig. 5). An additional 12-point, nonshorting switch8 is mounted in the recorder and is driven by the same mechanism moving the 12-point circuit selector switch. The second switch actuates alternately two power relays9 that energize the solenoid valves,1o which, in turn, drive the pneumatic wavelength- shifting mechanism. The baselines for two wavelengths may be inde- pendently adjust,ed using the arrangement schematically presented in Fig. 5.
If absorbancy at only two wavelengths is to be recorded, the second 12-point switch may be omitted and the signal fed directly into the recorder, in which instance the baseline adjusting circuit cannot be used. The 12-point switch normally in the recorder may then be used for
6 Harmonic-neutralized, con&ant-voltage transformer Model CVH-I, Sola Elec- tric Co., Chicago 50, Ill.
‘Available as Oak Ridge flow cells from Pyrocd Mfg. Co., 207-11 E. 84th St., NW York 28, N. Y., or Quaracell Products Co., 401 Broadway, New York 13, N. Y.
’ Additional la-point thermocouple switch available with mounting bracket from Minneapolis Honeywell, Inc.
“Relay, 115-volt, 60-cycle, 20-amp contact SPDT, Ward Leonard Electric Co., 45 South Street, Mount Vernon, N. Y., No. 105-6512.
“Solenoid valve No. V5D18360-V-10, 115-volt, 60-cycle, s-inch NPT, s-way, bleed-type, Skinner Electric Valve Division of Skinner Chuck Co,, 100 Edgewood ,4vr., New Britain, Conn.

272 ANDERSOh’
FIG. 2. Complete analytical system for nucleotides, proteins, or other ultraviolet- absorbing materials. Circulating water bath is mounted inside the cabinet in lower left compartment; pump (if not mounted on fraction collector) is in lower right space; hydrogen lamp power supply is mounted in upper right section. Baseline adjusting potentiometers are mounted above the multipoint recorder. The control- ling multimeter is mounted between the recorder and the spectrophotometer table. Ion-exchange columns are mounted on a panel projecting from the main cabinet (left) a sufficient distance to allow the column jacket water lines to be easily reached.
wavelength shifting. However, in the present instrument, provision is made for recording pH, conductivity, and radioactivity, in addition to absorbancy, on the same chart. These signals must also pass through a selector switch.
We have used Milton Roy chromatographic pumps.ll Connections to the pump are made with y&in. Tygon tubing through swagelock con- nections.12 In early work, salt rings occurred around these connections
“Minipump, CHMMI-B-29R, Milton Roy Co., 1300 E. Mermaid Lane, Phila- delphia 18, Pa.
“Swagelock fitting No. 600-l-2-316, Crawford Fitting Co., 834 E. 140th St., Cleveland 10, Ohio.

COLUMN MONITORING SYSTEM 23
FIG. 3. Air-operated, wavelength-shifting mechanism. The air piston mounted outside the spectrophotometer housing moves a shaft linked to the wavelength dial. Stops are provided in the piston housing to adjust the travel of the piston and to posit,ion accurately the wavelengths to be read, in this case 260 and 280 mp.
because sealing compounds were avoided. However, no leakage is ob- served when the male threaded parts are wrapped in Teflon tape.13
In a specific system, which will be described in a subsequent paper, a change in pumping rate occurs during chromatography. This is ac- complished by lifting a flat stainless-steel spacer from between the cross head and set screw with a small, continuous-duty solenoid,14 as shown in Fig. 6. The solenoid is actuated by a timer that energizes it at the end of a preset time.
Connection from the pump to the top of the chromatographic column is through a polyvinyl chloride ball connector fitted with a silicone rubber “0” ring.15 All columns are jacketed, with 18/9 top ball con- nections and 12/2 effluent ball connections. Both glass frit columnsl” and Teflon frit columnsl’ of 0.9-cm i.d. were used. Column temperatures were controlled with a circulating constant-temperature bathI equipped with
13Thread-tape, Crane Packing Co., Morton Grove, Ill. I4 No. lR-11-Cont-115Ac, 60-cycle solenoid, Guardian Elrrtric Mfg. Co., 1621
W. Walnut St., Chicago 12, Ill. ‘“Connector assembly PVC ball 18/l, tubing to column. part No. 120-9100 with
“0” ring No. 1209036, Spinco Division of Beckman Instruments, Inc., Palo Alto, Calif.
“Available from Scientific Glass Apparat,us Co., Bloomfield, N. J. “Available from Spinco Division of Beckman Instruments, Inc., Palo Alto, Calif. I8 Constant-temperature circulating bath. Catalogue No. 3050, Lahlinc Inc.,
3070432 W. Grand Ave., Chicago 22, Ill.

274 ANDERSON
FIG. 4. Assembly of wavelength-shifting mechanism. (1) Lower jaw of wavelength dial clamp. (2) Upper jaw of wavelength dial clamp. (3) Washer. (4) Bracket con- necting piston shaft to driving arm. (5) Adjustment for upper wavelength to be read. (6) Lock nut for 5. (7) Nut for holding piston to spectrophotometer housing. (8) Air piston cylinder. (9) Bearing connector between wavelength dial-clamp and driving arm. (10) Driving arm. (11) Washer. (12) Bolt with bearing surface for connecting parts 4 and 10. (13) Air piston shaft. (14) Teflon washers. (15) Piston. (16) Leather washer. (17) Brass washer. (18) Brass piston nut. (19) Piston cylinder end closure. (20, 21) Brass nuts. Note: Number corresponds to parts on engineering drawings available from author.

COLUMN MONITORING SYSTEM 275
WOW Length Shifting Circuit
%I. SW. A = Selecbr Switch on Recorder
K, and K2 = Relay
5, and S2 = Solenoid Air Valves”
bse Line Companwtion Circuit
RI and R2 = 1OW ohm ten turn Helipak
SOI SW. I = Second Selector Switch in ~ecombr
I = Odd-nunbned Points on 12 Point Rccordst Jdac~r Switch
2 = Even-numbered Points
FIG. 5. Circuit for independent adjustment of two baselines and circuit for wavelength switching.
coils for rapid cooling of the bath with tap water. All fluid-handling lines beyond the columns are of TeflonI joined as previously described (2), or by heat-shrinking expanded Teflon t,ubing.‘O
‘@NO. PF 22 Teflon tubing, Pennsylvania Fluorocarbon Co., Inc., 1115 N. 38 St., Philadelphia, Pa.
‘“Expanded Teflon AWC# 19 STD Satural tubing available from Pennsylvania Fluorocarbon Co., Inc. When heated, tubing mill shrink to form a tight bond with No. PF 22 Teflon tubing.

FIG. 6. Timer-operated mechanism for changing pumping rate. At preset time, the timer energizes the solenoid, which raises the stainless-steel plate from between the cross head and set screw, increasing the pump stroke. The blade is shown in down position.
FIG. 7. Quartz flow cell assemblies.
276

COLUMN MONITORING SYSTEM 277
FIG. 8. Assembly of quartz flow cells (see Note, Fig. 4). (1) Teflon tubing. (2) Upper pressure plate adjustment screw. (3) Cuvette housing block. (4) Bottom plate of cuvette housing. (5) Front beam guide. (6) Rear beam guide. (7) Swivel fitting pressure screw. (8) Swivel fitting sleeve. (9) Swivel fitting. (10) Upper pressure plate. (11) “0” ring. (12) Quartz cuvette. (13) Lower pressure plate. (14, 15) Screws.
The quartz flow cells (Figs. 7 and 8) are modifications of those previously described (2) with optical paths of 0.2 and 1 cm and volumes of 0.056 and 0.25 ml, respectively.7 Connections are made through Teflon end blocks and swivel connections .21 The free area for the light beam is 0.2 by 1 cm. The cell holder completely fills the cell space of the Beckman DB spectrophotometer. For baseline correction the elution fluid may flow through the reference cell before being pumped through the column.
Flow Rate. Quantitative chromatography requires t.hat t,he flow through
“Swivel fitting assembly for standard wall Teflon tubing A.W.G. 22 0.012-in. wall, part 120-311, Spinco Division of Beckman Instruments, Inc., Palo Alto, Calif.
278 ANDERSON
Controlling Multimeter ZP
c- on Recorder
Timing System”
Fraction ColIectorr5
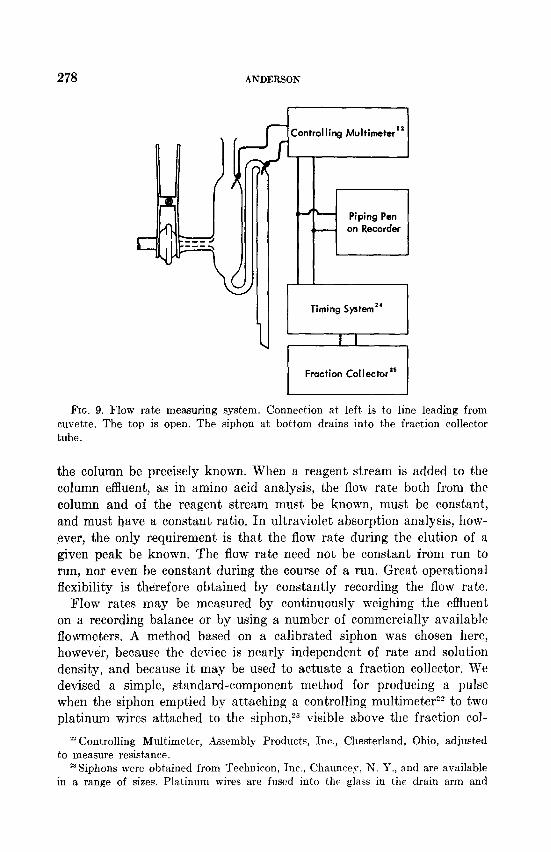
FIG. 9. Flow rate measuring system. Connection at left is to line leading from cuvette. The top is open. The siphon at bottom drains into the fraction collector tube.
the column be precisely known. When a reagent stream is added to the column effluent, as in amino acid analysis, the flow rate both from the column and of the reagent stream must be known, must be constant, and must have a constant ratio. In ultraviolet absorption analysis, how- ever, the only requirement is that the flow rate during the elution of a given peak be known. The flow rate need not be constant from run to run, nor even be constant during the course of a run. Great operational flexibility is therefore obtained by constantly recording the flow rate.
Flow rates may be measured by continuously weighing the effluent on a recording balance or by using a number of commercially available flowmeters. A method based on a calibrated siphon was chosen here, however, because the device is nearly independent of rate and solution density, and because it may be used to actuate a fraction collector. We devised a simple, st,andard-component method for producing a pulse when the siphon emptied by attaching a controlling multimeterzz to two platinum wires attached to the siphon,23 visible above the fraction col-
” Controlling Multimeter, Assembly Products, Inc., Chesterland, Ohio, adjusted to measure resistance.
23Siphons were obtained from Technicon, Inc., Chauncey, W. Y., and are available in a range of sizes. Platinum wires are fused into the glass in the drain arm and

COLUMN MONITORING SYSTEM 279
lector in Fig. 2. Since the actual resistance may be observed constantly, a setting can be obtained that allows actuation with a variety of salt concentrations, but leaves the circuit open when the siphon is not draining.
The multimeter actuates a right-hand piping pen on the recorder, and a collector timer (Fig. 9). The collector timing system is start,ed by a pulse from the controlling multimeter, which, in turn is actuated by the siphon. The timing system runs 20 set (to allow the siphon to drain fully) and then delivers an impulse to the fraction collector, which has been switched to Countz6 In this way, constant-volume collections may be made and the flow rate recorded during t.he entire chromatographie run. The multimeter may also actuate a printing timer, which may record the actual time t.he siphon drains.
A mounting rack (Fig. 2) holds the constant-temperature bath (lower left), pump (lower right, or under fraction collector), and hydrogen lamp power supply (upper right). Space is provided for four columns, which may be long (150 cm), medium (50 cm), short’ (15 cm), in any combination. No space or facilities for st.oring eluting solutions is provided, since requirements differ.
It is a prime rule in the design of automated analytical apparatus that all electrical lines be above and separate from fluid-handling lines. Tubing to the columns exit, from the main part of the cabinet a foot or two from floor level and runs up in the readily accessible space between the cabinet and the column mounting board. All lines and connections are within sight and reach. More elaborate flow manifolds for connect- ing any one of four column e to t,he spectrophotometer and the rest, t,o dra.in have been constructed using three precision microvalves.“’ For most applications this is not, necessary, however.
Performance of Flow Cells
Since all flow cells contain a finite volume of fluid, it is not possible to avoid completely measurement artifacts when large differences in density, viscosity, or absorbancy occur over a very small volume inter-
in the body of the siphon so that a current can flow between the two wires only during the period when the siphon is draining.
“Series RC timing system, for operating two rircuits. for single-cycle, nonrepeat- ing operation with cycle time of 30 set: Meylan St0pwatc.h Corp., 264 W. 40 St.,
New York 18, N. Y. x Technicon Fraction Collector, Tcchniron, Inc., Chnunrey. N. Y. n Detailed circuitry available from thr author. ST Circle Seal Precision Valve, Model P4 418T, Four Way 3Q61 B obtained from
Circalc &al Products Co., Inc.. 2181 East Foothill Blvd.. Pasadena, Calif.

280 ANDERSON
val. Measurement of the rate of equilibration of the cell contents with the incoming column effluent may be made, but these are of little value in instances in which a small volume of dense fluid (generally the original sample volume containing excess salts and sugars) remains in the cell and convects back through the incoming stream. In the present work the volume of the cells has been reduced as far as is consistent with a good optical cross section. Flow from the bottom of the cell to the top ensures that bubbles are swept out, and results in minimal con- vective disturbance when gradients of increasing physical density are used for elution.
The correct test with a given system is to observe the performance with the sharpest (contained in the least volume) peaks expected. In our experience these occur at the beginning of the nucleoside-base-nucleotide separation method (4) worked out with the DU-DUR system described
FIG. 10. Comparison of results obtained with l.O-cm end 0.2-cm light path flow cells. The samples used are described in the text. The elution order is (from left to right) cytosine, cytidine, uridine, uracil, and thymine. These compounds were eluted from a 150 x 0.9 cm Dowex-I X8 column with 0.15 M sodium acetate at pH 4.4 at 40°C as described in reference (4). Each mark below the baseline is equivalent to 4.033 ml of column effluent. Absorbance is recorded at 260 and 280 m/l.

COLUMN MONITORING SYSTEM 281
here. With a l-ml sample of a mixture containing 2 pmoles each of cytosine, cytidine, uridine, uracil, and thymine per milliliter with the 0.2-cm cell (0.056-ml cell volume), and 0.2 ml of the same sample with the l.O-cm (0.25-ml) cell, the recordings shown in Fig. 10 indicate negli- gible differences between the two cells. The volume width of the first (cytosine) peak is approximately 3 ml. The rest of the peaks are wider and would not be expected to differ. To obtain comparable resolution by reading manually fraction collector samples, a very large number of very small fractions must be collected.
Some difficulty is experienced with the l-cm cell at the very start of the base-nucleoside-nucleotide analysis when the sample contains a large amount of sucrose. Inverting the cell for about two minutes just after one column volume has passed through eliminates this difficulty. Alter- natively, the 0.20- and l.O-cm cells may be connected in series and the 0.20-cm cell placed in t,he spectrophotometer until t.he column volume plus 4-5 ml have passed, during which time the 1.0~cm cell is kept inverted outside the spectrophotometer. The l.O-cm cell may then be reinserted. If the 0.20~cm cell is to be used for the entire run, no diffi- culty is experienced. With this single exception no difficulties attributable to the flow cells has been experienced in several hundred runs. The fluid volume below the sint,ered glass plate in most ion-exchange columns is larger than the volume of the flow cells used here, and is probably a greater source of error t,han is anomalous flow or back-mixing in the flow cells.
Qucntitation of Results
If all of the column &rent containing one ultraviolet-absorbing com- pound is collected in a single vessel, the amount of that substance may be obtained from the familiar relation
mg solute = MW * As . ml/e (1) where As is the observed absorbance at a given wavelength in a cell of l-cm light path, and z is the Molar Absorptivity at the same wavelength,
When the data are obtained in the form of recorded Gaussian curves, the following relations may be used to calcuIate the amount of a given substance present. In the normal density function the relation between the true area under the curve and the area of a triangle obtained by multiplying the height of the curve by t,he widt,h at, half-height is given by:
C=G/H-W (2) where G is the true area under the curve. and H a,nd J$’ the lleigllt, and

282 ANDERSON
width at half height, respectively. Since the area G = 1 in t,he normal density function, and the height is (2~)- 1/z, the width at half-height is given by setting @(X) equal to (2~) -l/“/2 in the equation:
which gives X = 1.177, and W = 2.354. By substitution in Eq. (2), C is found to be 1.064.
In the graphic results, however, the height of the curve is given in absorbancy units (A) and the width at half-height in minutes. The curve may be considered comparable to a volume of fluid V having an absorbance A, since:
and :
or:
A v * V = HA * Wmin + C * ml/min
mg solute = (MW/c) * HA . Wmin * ml/min . C
mmoles = (HA * Wmin/e) . ml/min . C
DISCUSSION
(4)
(5)
(6)
While the system described here was intended primarily for work with nucleic acid-derivatives, it is applicable to analysis of a wide variety of other absorbing substances including peptides by far-ultra- violet absorption, or substances absorbing in the visible range. Its use- fulness in spectrophotometric methods for enzyme analysis will be shown in subsequent papers.
One of the greatest advantages of stable alltomatic analytical systems is the confidence given to evidence of minot* components. A “peak” 0.005 absorbancy unit high stands out, wherea? me tube in a manually read series that is increased by this amount is gen~:rally disregarded. Also very sharp peaks, which would be blurred in plots of discrete fractions, may be followed.
It is often advantageous to use a ratio recorder to distinguish between the light transmitted through the reference and the experimental cells. A recording potentiometer has been used in place of a ratio recorder in the present application because signals generated by a pH meter, conductivity bridge, and a count ratemeter or thermocouple may be conveniently reduced to a millivolt signal and recorded on the same chart.
The analytical system described was developed as a part of the Cell Fractionation Project of the Oak Ridge National Laboratory. Many of the principles are derived from the amino acid analyzer of Spackman, Stein, and Moore (5).

COLUMN MONITORING SYSTEM 283
SUMMARY
Two systems for recording absorbancy of chromatographic effluent streams are described. The first utilizes two separate single-beam spec- trophotometers and can record at any two wavelengths between 205 and 1100 rnp. The second utilizes a double-beam spectrophotometer and a pneumatic wavelength-shifting device. The latter is specifically designed for the analysis of nucleotides and nucleotide derivatives, and other compounds absorbing at 260 or 280 mp.
REFERENCES
1. ANDERSON, N. G., hat. Record 132, 404-405 (1958). 2. ANDERSON, N. G., Anal. Chem. 33, 970 (1961). 3. ANDERSON, N. G., AND ALBRIGHT, J. F., Federation Proc. 17, 4 (1958). 4. ANDERSON, N. G., AND LADD, F. C., Biochim. et Biophys. Acta 55, 275-276 (1962). 5. ANDERSON, N. G., AND LEVINBON, J. A., ASB Bulletin 6, 20 (1959). 6. SPACKMAN, D. H., STEIN, W. H., .%ND MOORE, S., Anal. Chem. 30, 1190-1206 (1958).