Embed Size (px)
Citation preview

Machine Learning Part 1
KMK Online
Analytic Team | Fajri KotoData Scientist
Data Science Weekend

Machine Learning Part 1
Outline
1. Machine Learning at glance2. Vector Representation3. Evaluation Measurement in Machine Learning4. Clustering vs Classification5. K-Means Algorithm6. Linear Regression

Machine Learning Part 1
Outline
1. Machine Learning at glance ✔2. Vector Representation 3. Evaluation Measurement in Machine Learning4. Clustering vs Classification5. K-Means Algorithm6. Linear Regression

1. Machine Learning at Glance
DATA1. CHOOSE FEATURES2. DATA PREPROCESSING (data
distribution, outliers, manual labelling :(, data cleansing, data splitting, etc)
3. VECTOR REPRESENTATION(Tf, Idf, Tf-Idf, )
4. OPTIMIZATION (Feature selection, Matrix factorization, PCA, etc)
METHODS / ALGORITHM
1. CHOOSE TYPE (classification, clustering, regression, rank, association )
2. CHOOSE ALGORITHM(linear regression, svm, decision tree, etc.)
3. EVALUATION(accuracy, precision, recall, f1 score, ctr, etc)
Data and the Methods

1. Machine Learning at Glance
Overview of Training stage

1. Machine Learning at Glance
Overview of Testing stage

Machine Learning Part 1
Outline
1. Machine Learning at glance ✔2. Vector Representation ✔3. Evaluation Measurement in Machine Learning4. Clustering vs Classification5. K-Means Algorithm6. Linear Regression

2. Vector Representation
TF Vector Space Model
→ The main point is to form every problem into set of vectors. Example:
2. Vector Representation
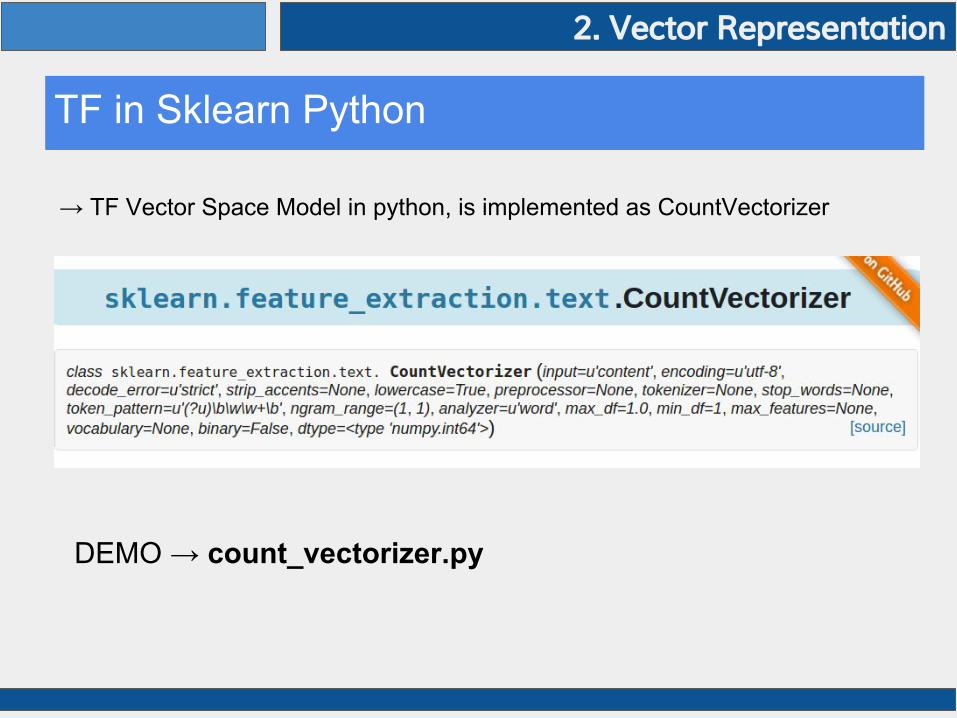
TF in Sklearn Python
→ TF Vector Space Model in python, is implemented as CountVectorizer
DEMO → count_vectorizer.py

2. Vector Representation
TFIDF Vector Space Model
→ Another example of feature extraction result:

Machine Learning Part 1
Outline
1. Machine Learning at glance ✔2. Vector Representation ✔3. Evaluation Measurement in Machine Learning ✔4. Clustering vs Classification5. K-Means Algorithm6. Linear Regression

3. Evaluation measurement
Machine Learning Overview

3. Evaluation measurement
Evaluation in General
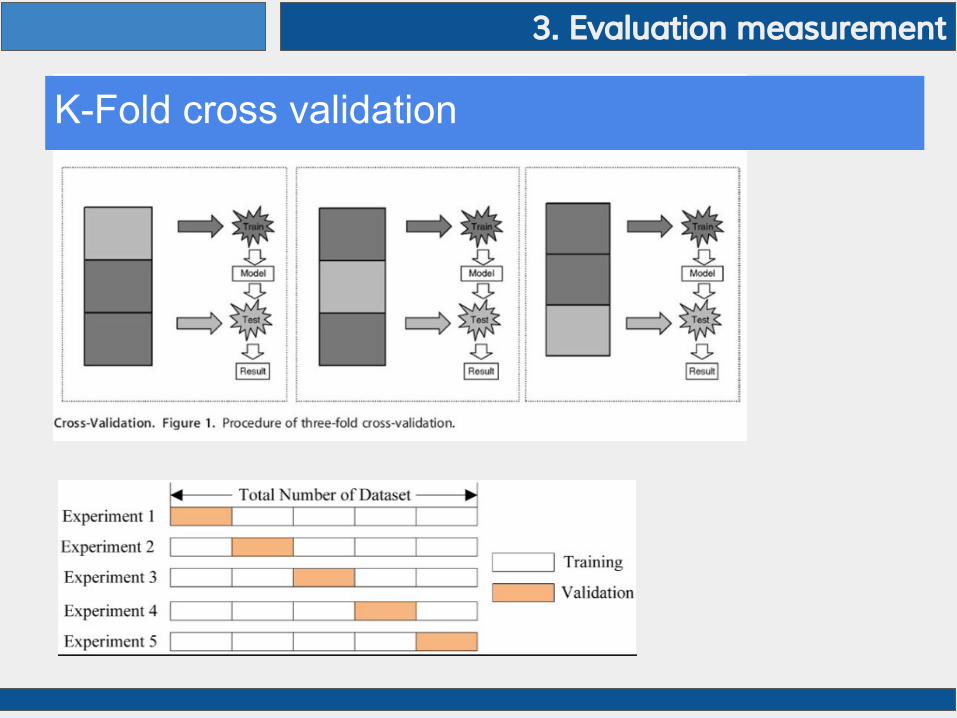
3. Evaluation measurement
K-Fold cross validation

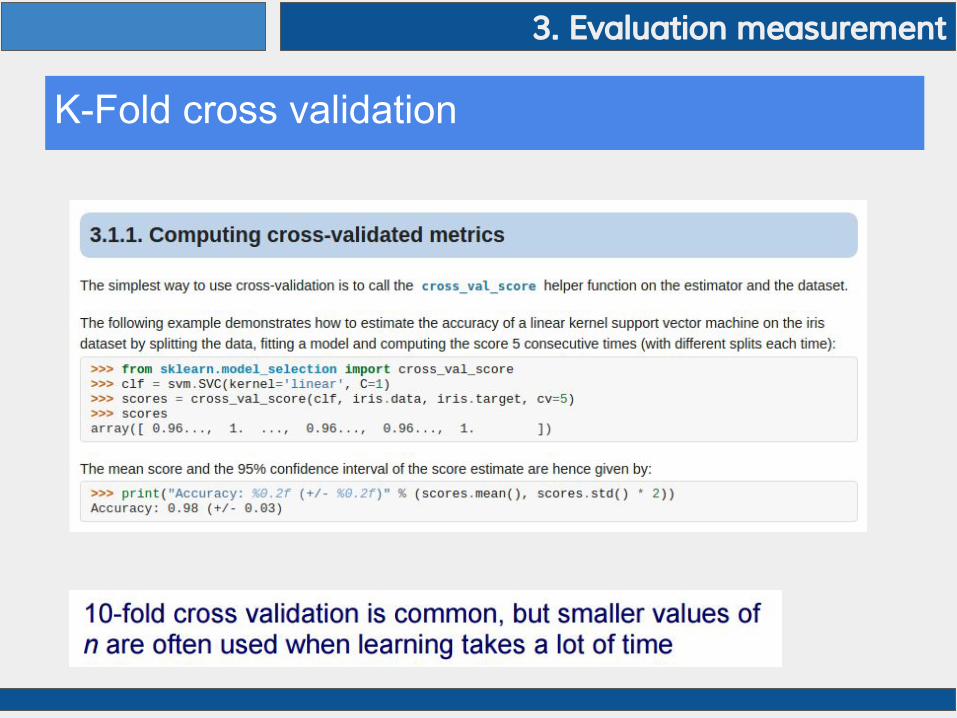
3. Evaluation measurement
K-Fold cross validation
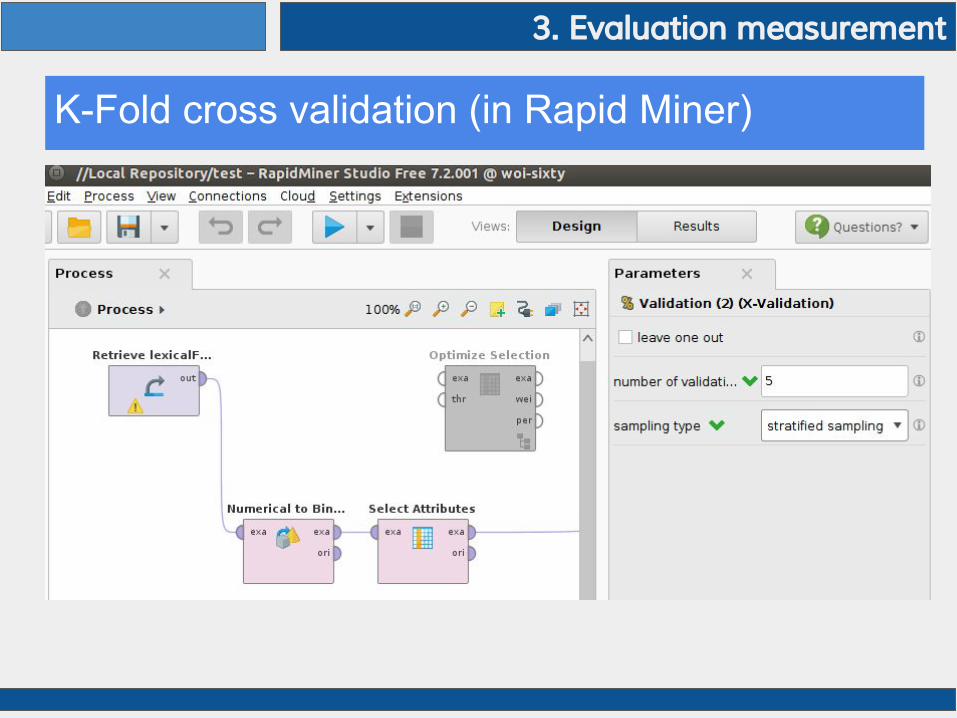
3. Evaluation measurement
K-Fold cross validation (in Rapid Miner)

3. Evaluation measurement
K-Fold cross validation - Sampling
1. Linear Sampling
The Linear sampling simply divides the ExampleSet into partitions without changing the order of the examples i.e. subsets with consecutive examples are created.
2. Shuffle Sampling
The Shuffled sampling builds random subsets of the ExampleSet. Examples are chosen randomly for making subsets.
3. Stratified Sampling √
The Stratified sampling builds random subsets and ensures that the class distribution in the subsets is the same as in the whole ExampleSet.
3. Evaluation measurement
K-Fold cross validation

3. Evaluation measurement
Confusion Matrix
Predicted
Actual
0 1
0 1 2
1 1 4
Pred: 1 0 1 0 1 1 1 1
Act : 1 1 1 0 0 1 0 1

3. Evaluation measurement
Precision, Recall, Accuracy
3. Evaluation measurement
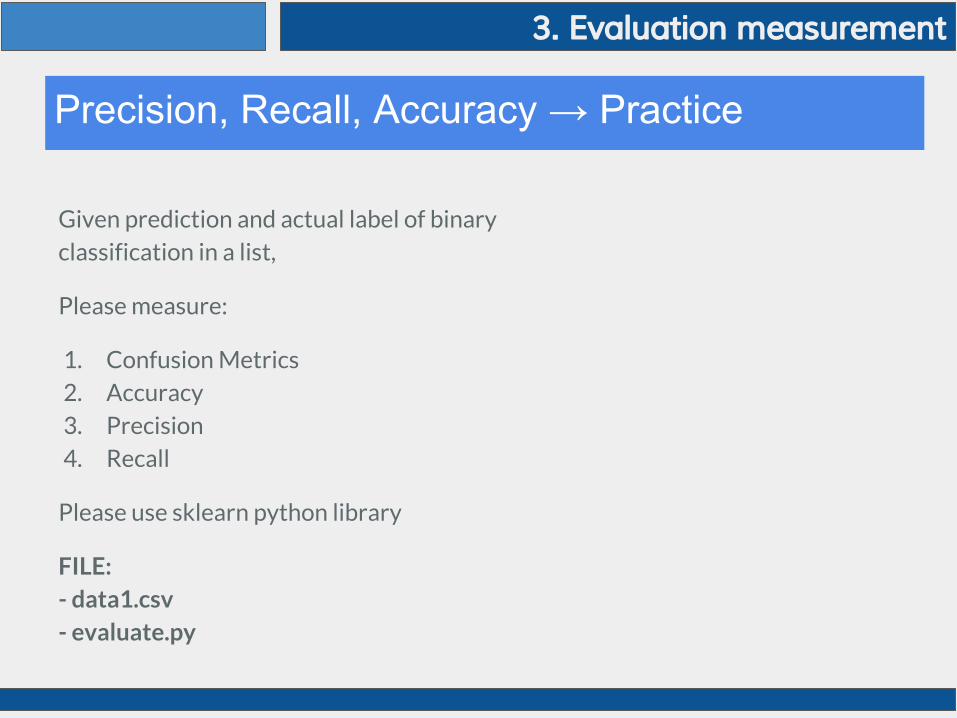
Precision, Recall, Accuracy → Practice
Given prediction and actual label of binary classification in a list,
Please measure:
1. Confusion Metrics2. Accuracy3. Precision4. Recall
Please use sklearn python library
FILE: - data1.csv- evaluate.py

Machine Learning Part 1
Outline
1. Machine Learning at glance ✔2. Vector Representation ✔3. Evaluation Measurement in Machine Learning ✔4. Clustering vs Classification ✔5. K-Means Algorithm6. Linear Regression

Classification:→ Mengelompokkan data berdasarkan class/Label yang diberikan
Clustering:→ Mengelompokkan data berdasarkan data itu sendiri, tanpa memperhatikan class/Label
Clustering algorithms divide a data set into natural groups (clusters). Instances in the same cluster are similar to each other, they share certain properties
4. Clustering vs Classification

4. Clustering vs Classification

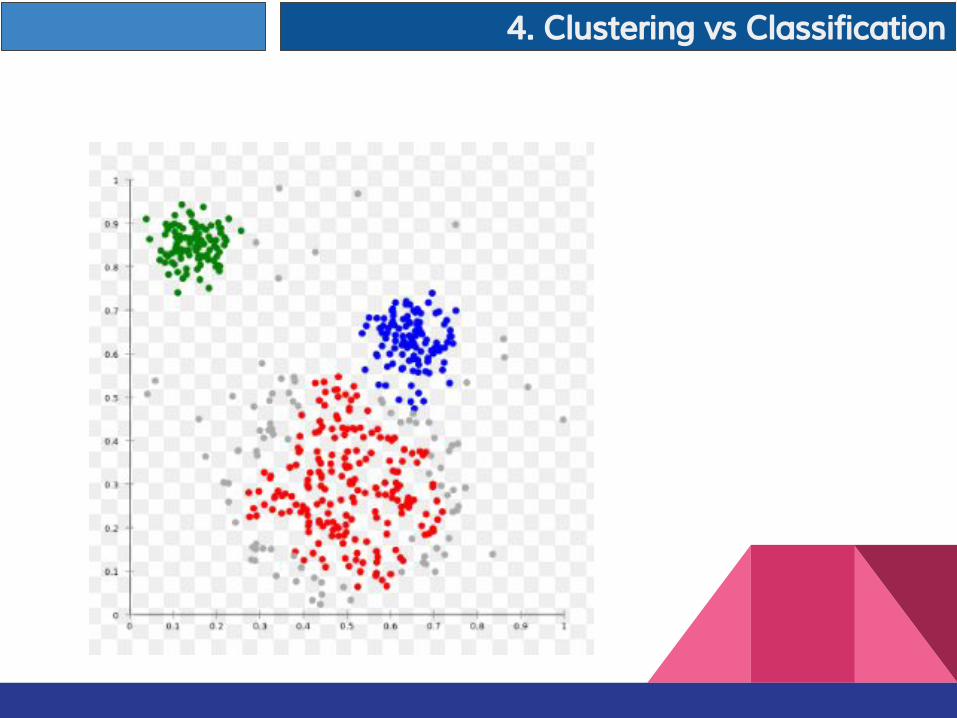
Example of Clustering
4. Clustering vs Classification
4. Clustering vs Classification
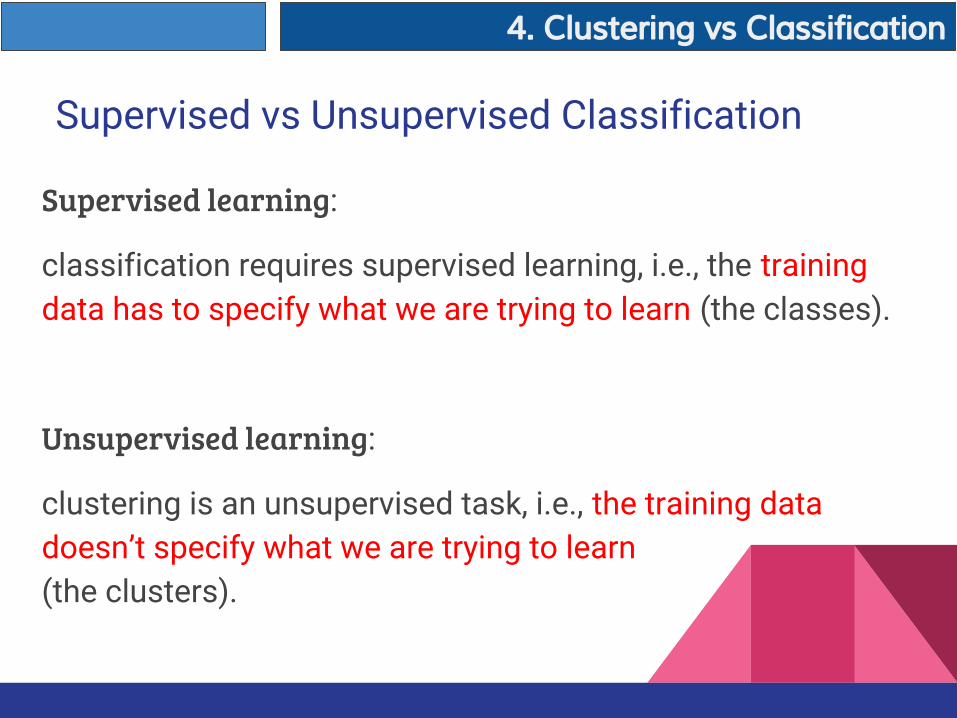
Supervised vs Unsupervised Classification
Supervised learning:
classification requires supervised learning, i.e., the training data has to specify what we are trying to learn (the classes).
Unsupervised learning:
clustering is an unsupervised task, i.e., the training data doesn’t specify what we are trying to learn (the clusters).
4. Clustering vs Classification

Supervised vs Unsupervised Learning
Unsupervised / Clustering Supervised / Classification
1. K-Means (✔)2. HCS clustering3. Canopy4. DBSCAN5. Fuzzy Clustering6. K-SVD7. Pitman
More than 100 approaches
1. Naive Bayes2. Linear Regression (✔)3. Decision Tree4. Random Forest5. Support Vector Machine6. Neural Network7. Deep Neural Network
4. Clustering vs Classification

Machine Learning Part 1
Outline
1. Machine Learning at glance ✔2. Vector Representation ✔3. Evaluation Measurement in Machine Learning ✔4. Clustering vs Classification ✔5. K-Means Algorithm ✔6. Linear Regression

Why Clustering
5. K-Means Algorithm

When Clustering
5. K-Means Algorithm
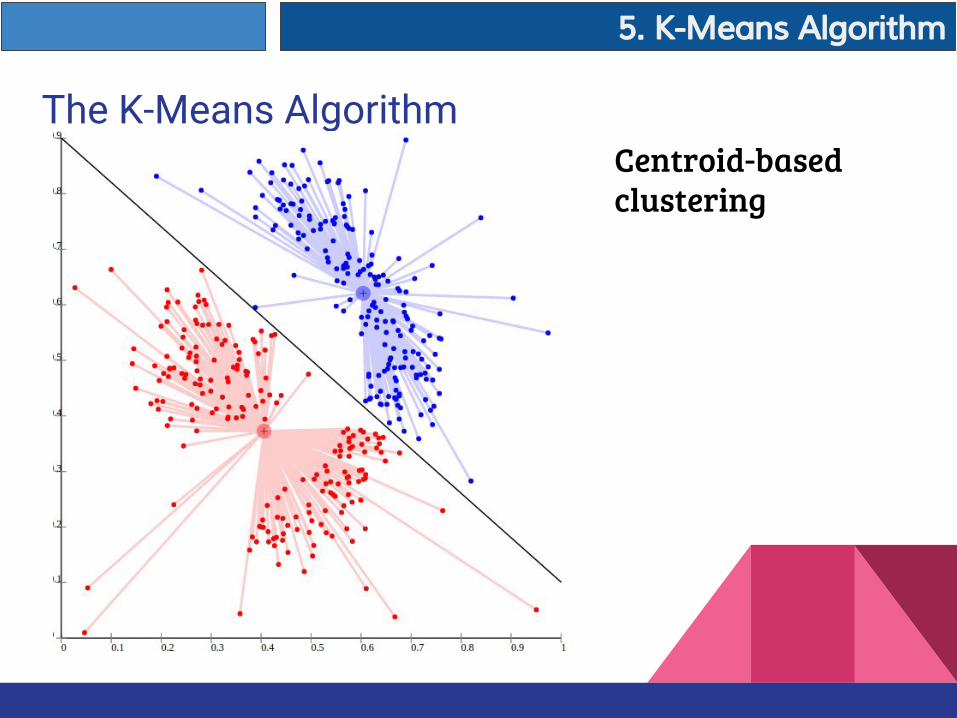
The K-Means AlgorithmCentroid-based clustering
5. K-Means Algorithm
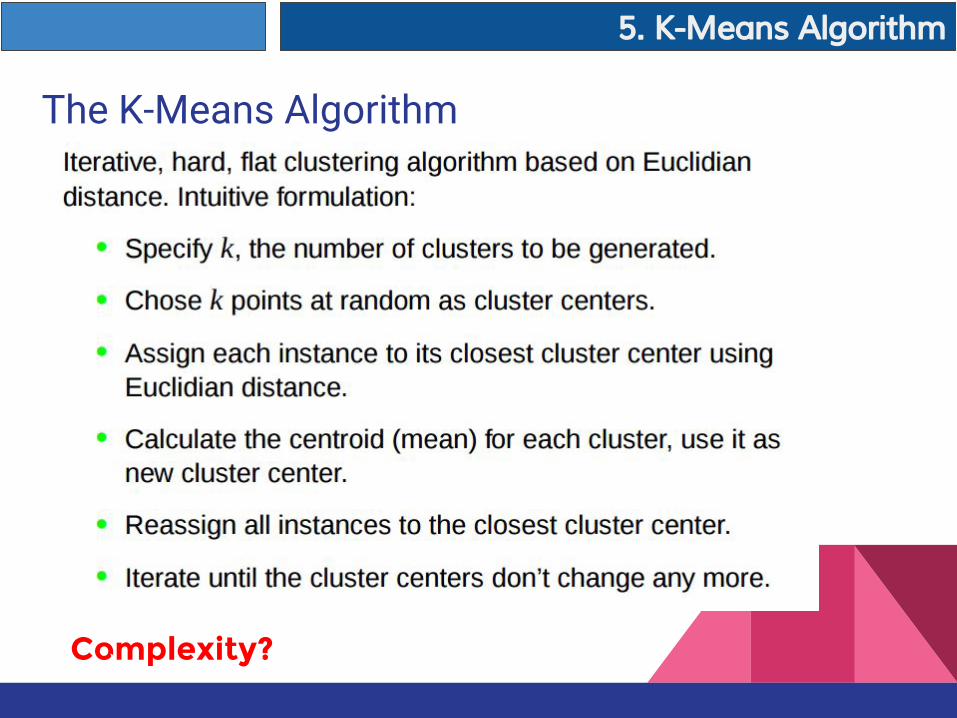
The K-Means Algorithm
Complexity?
5. K-Means Algorithm
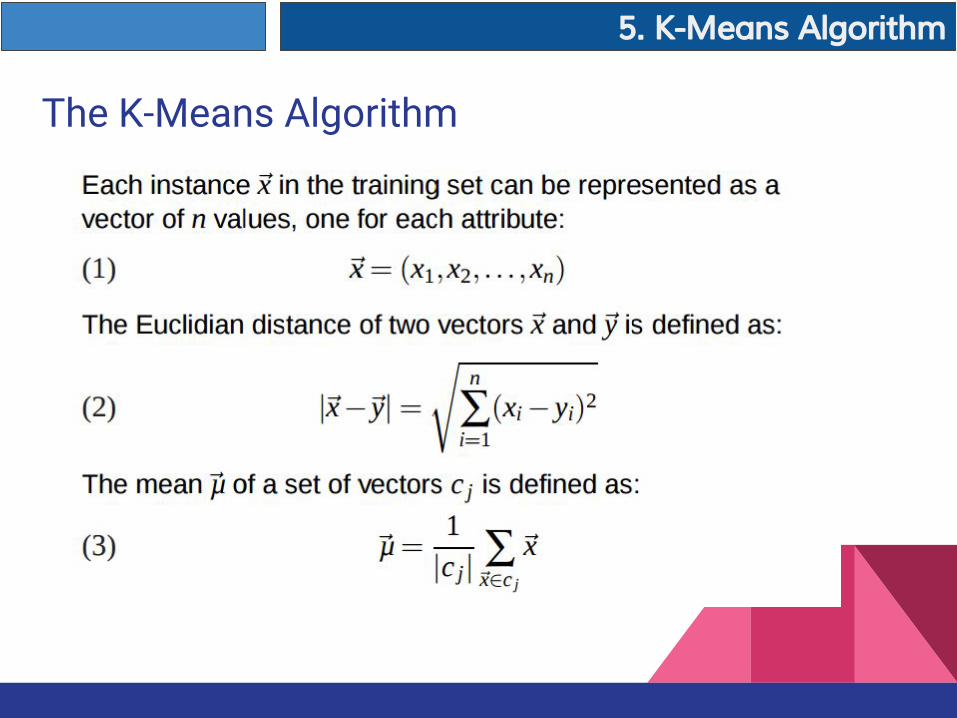
The K-Means Algorithm
5. K-Means Algorithm

The K-Means Algorithm
5. K-Means Algorithm

The K-Means Algorithm: ExampleStep1: Pick the centroid randomlyDATA
Step2 ITERATION
5. K-Means Algorithm
Machine Learning Part 1
Outline
1. Machine Learning at glance ✔2. Vector Representation ✔3. Evaluation Measurement in Machine Learning ✔4. Clustering vs Classification ✔5. K-Means Algorithm ✔6. Linear Regression ✔

Regression VS Classification
- Regression is used to predict continuous values.
- Classification is used to predict which class a data point is part of (discrete value)
6. Linear Regreession

Regression5. K-Means Algorithm

3. Regression
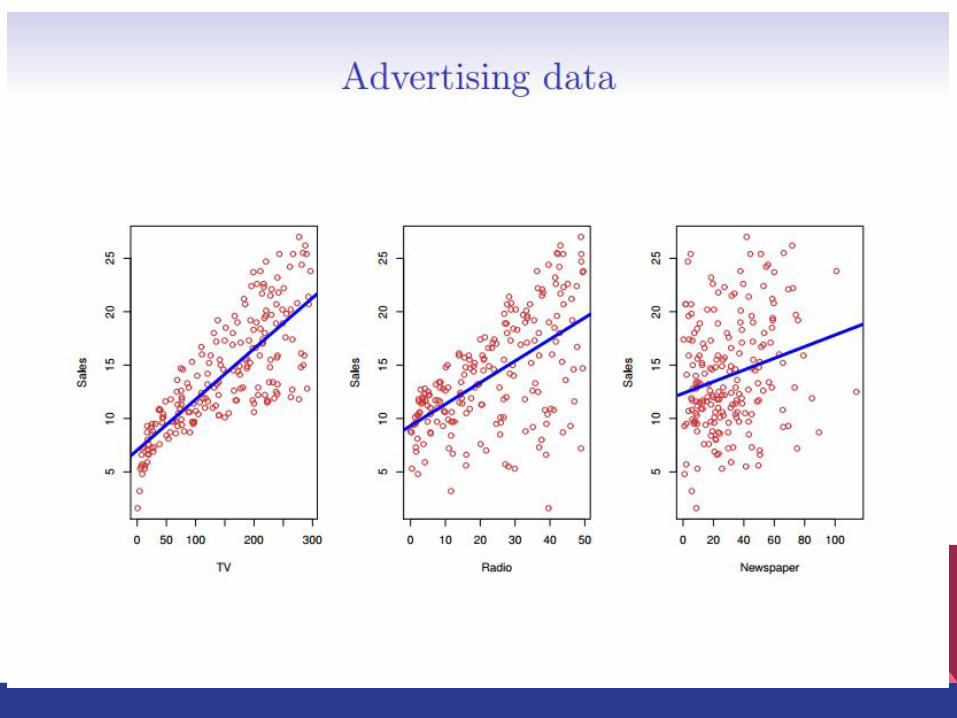

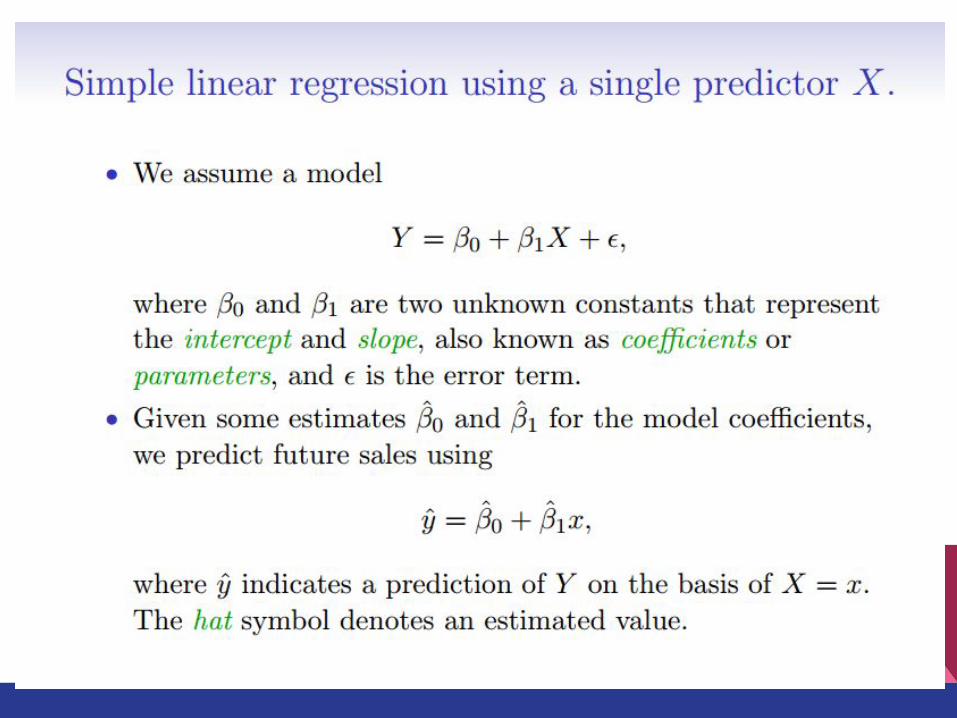
Model Representation
6. Linear Regression

How to Determine β0 and β1 ?
Simple Matrix Multiplication
β = X-1.y
6. Linear Regression
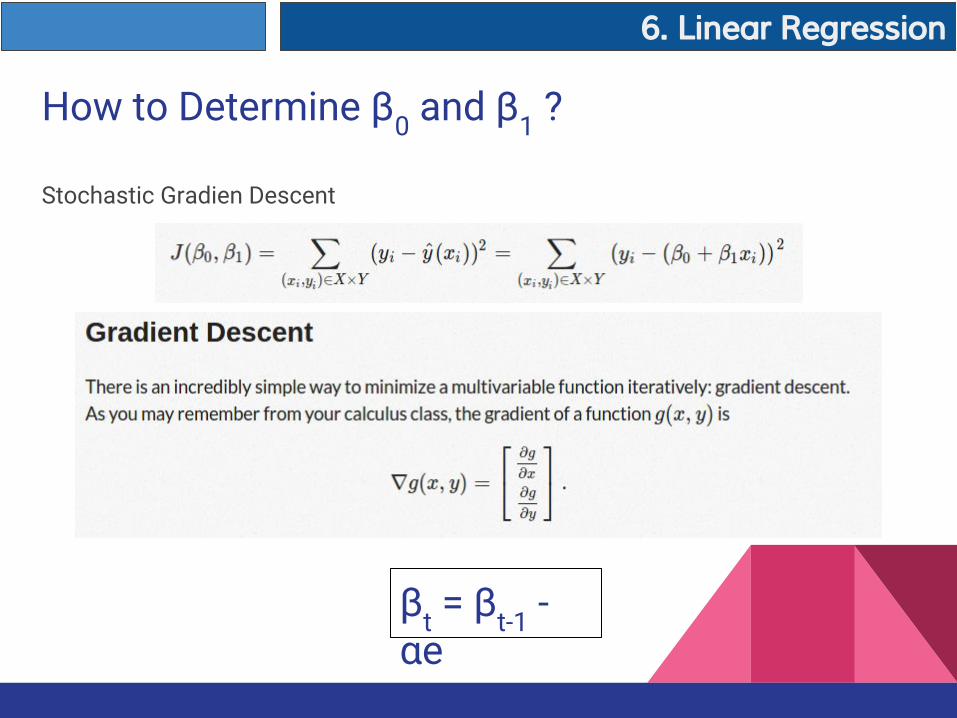
How to Determine β0 and β1 ?
Stochastic Gradien Descent
βt = βt-1 - αe
6. Linear Regression


Linear Regression On Sklearn
6. Linear Regression
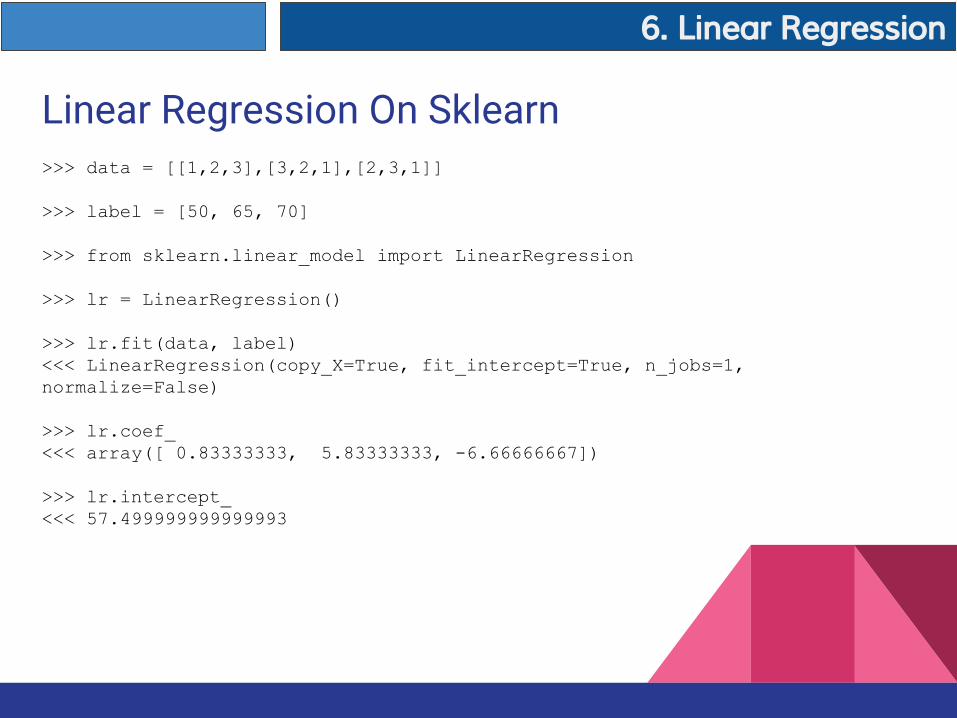
Linear Regression On Sklearn>>> data = [[1,2,3],[3,2,1],[2,3,1]]
>>> label = [50, 65, 70]
>>> from sklearn.linear_model import LinearRegression
>>> lr = LinearRegression()
>>> lr.fit(data, label)<<< LinearRegression(copy_X=True, fit_intercept=True, n_jobs=1, normalize=False)
>>> lr.coef_<<< array([ 0.83333333, 5.83333333, -6.66666667])
>>> lr.intercept_<<< 57.499999999999993
6. Linear Regression

Evaluating Linear Regression
R2 (Coefficient of Determination)
6. Linear Regression

Evaluating Linear Regression
R2 (Coefficient of Determination)
>>> data_test = [[1,2,1],[1,1,3],[2,2,1]]
>>> label_test = [45, 60, 68]
>>> lr.predict(data_test)<<< array([ 63.33, 44.16 64.17])
>>> lr.score(data_test, label_test)<<< -1.2059902200489008
6. Linear Regression

Thank YouQuestions ?
KMK Online
Analytic Team | Fajri KotoData Scientist
Machine Learning Part 1