Embed Size (px)
Citation preview
Analytic Memo: Evaluation Data from the First Year of REACH
Jennie Y. Jiang
Susan E. Sporte
Stuart Luppescu

Preface
This analytic memo presents an analysis of ratings data from the first year of Chicago’s new REACH teacher evaluation system. The primary purpose of this memo is to provide implementation support for key stakeholders in Chicago. The data and analysis presented here can also provide context for the findings in Teacher Evaluation in Practice: Year 2 Teacher and Principal Perceptions of REACH. A more in-depth report analyzing both Year 1 and Year 2 ratings data will be released in 2015.
Analytic Memo: Evaluation Data from the First Year of REACH 2
Introduction
Past methods for evaluating teacher effectiveness have had well-documented shortcomings.1 In particular, previous teacher evaluation systems produced the same general ratings for all teachers, providing little information on which teachers excelled and which needed improvement. They failed to provide a way for teachers to receive feedback and rarely provided actionable information to teachers about how they could improve their practice. Moreover, they were based only on the ratings of a school principal, which may or may not have been consistent with the ratings of principals in other schools. To address these shortcomings, new teacher evaluation systems have been instituted in more than 40 states.2 Although the mechanisms of these new evaluation systems vary across districts and states, the basic theory behind this new wave of assessing teacher effectiveness is relatively constant: New teacher evaluation systems will yield objective, valid information about teacher performance, as well as information that will illuminate areas of improvement. This information will provide two main paths toward improved student outcomes. First, it should lead to informed and appropriate personnel decisions and, second, it should lead to viable and targeted opportunities for teachers to improve instructional practice. Chicago Public Schools (CPS) was one of the first large urban districts to implement a new teacher evaluation system. REACH (Recognizing Educators Advancing Chicago’s Students) was implemented beginning in the fall of 2012 in all of CPS’s almost 600 schools. REACH incorporates both a structured observation process and measures of student growth into a teacher’s evaluation rating. As part of our ongoing study of REACH, we focus on the REACH scores and ratings and the information they provide. We will continue to work to understand the key elements and levers of REACH and to analyze the information it provides.
1 For example, see Hanushek & Rivkin (2010); Nye, Konstantopoulos, & Hedges (2004); Wright, Horn, & Sanders (1997). 2 Banchero (2013); Heitin (2012).
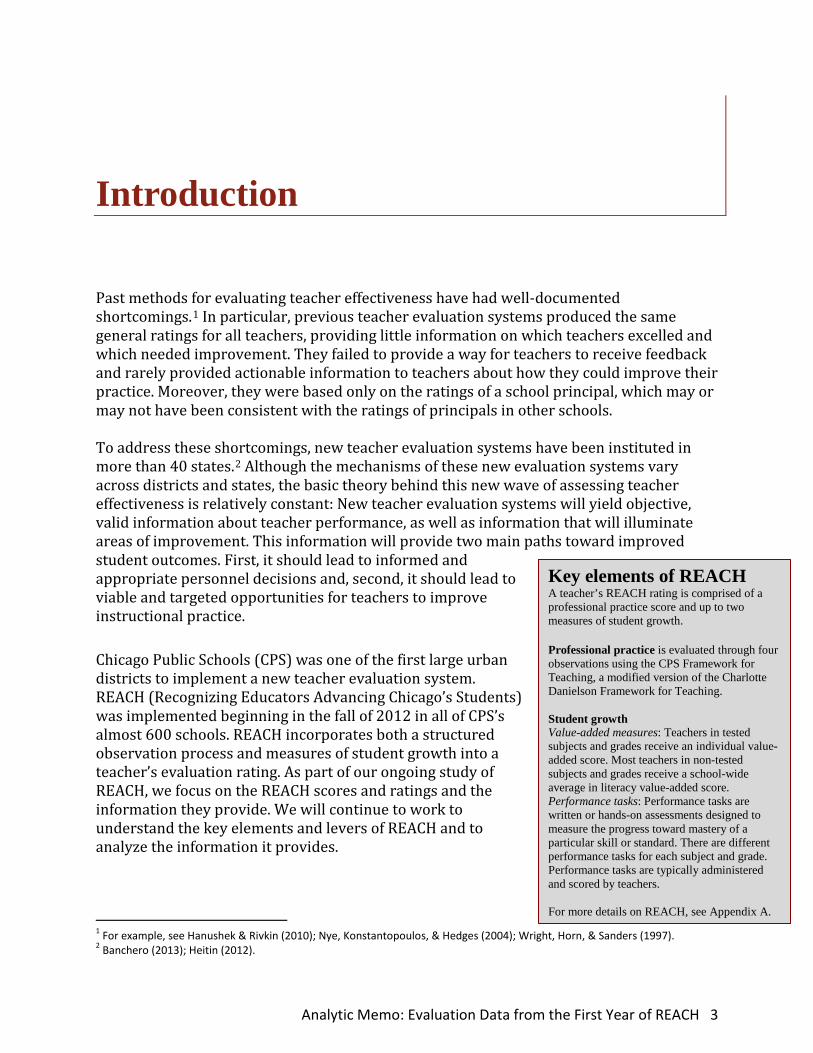
Key elements of REACH A teacher’s REACH rating is comprised of a professional practice score and up to two measures of student growth. Professional practice is evaluated through four observations using the CPS Framework for Teaching, a modified version of the Charlotte Danielson Framework for Teaching. Student growth Value-added measures: Teachers in tested subjects and grades receive an individual value-added score. Most teachers in non-tested subjects and grades receive a school-wide average in literacy value-added score. Performance tasks: Performance tasks are written or hands-on assessments designed to measure the progress toward mastery of a particular skill or standard. There are different performance tasks for each subject and grade. Performance tasks are typically administered and scored by teachers. For more details on REACH, see Appendix A.
Analytic Memo: Evaluation Data from the First Year of REACH 3

We present preliminary findings, based on ratings data from the first year of Chicago’s new evaluation system. We describe the results of observation ratings, student growth scores, and the overall REACH ratings. We also look at the interrelationships among those elements. Finally, we provide an initial look at rater consistency and severity.
Five Key Takeaways from REACH Year 1 Data
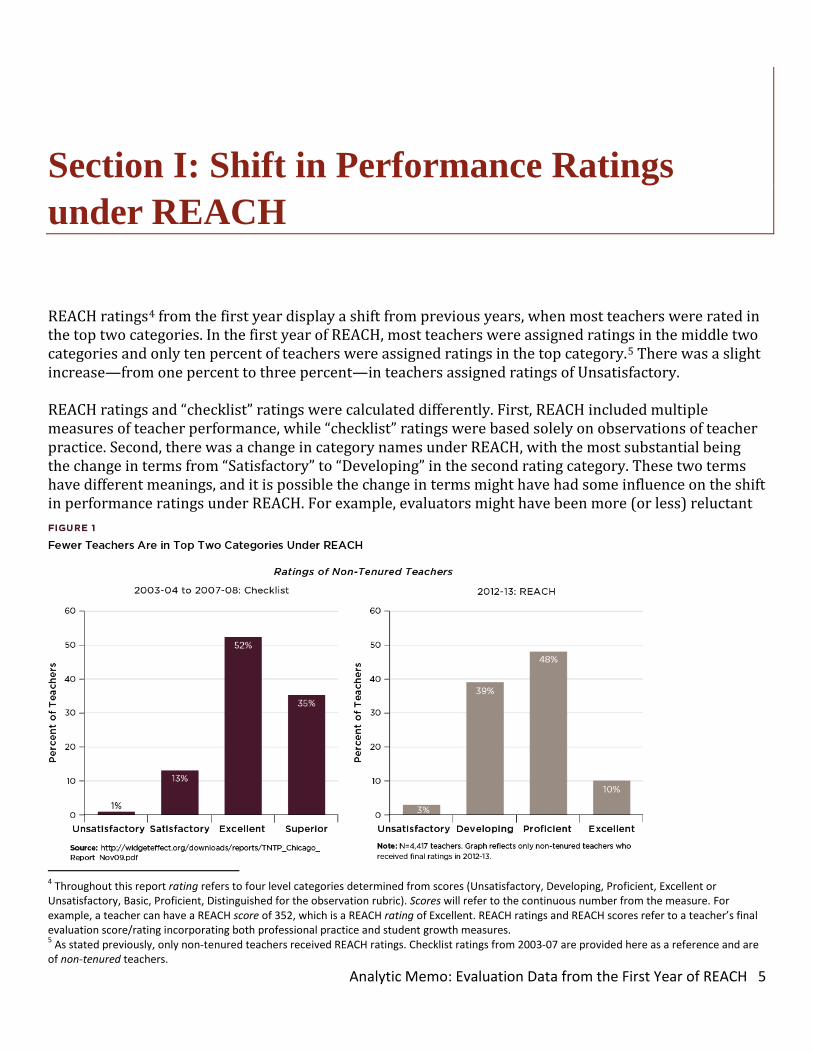
• REACH ratings of non-tenured3 teachers from the first year of REACH show a shift from ratings under the previous “checklist” system, when most teachers were rated in the top two categories. Fewer teachers are rated in the top two categories under REACH than under the past “checklist” system. Both scales have four categories, but 87 percent of teachers were in the top two categories on the previous scale, compared to 58 percent on the new scale.
• Teachers received a range of scores on the observation and value-added measures, but not on the performance tasks. Incomplete and missing data was a challenge for the system in its first year. Observation and value-added scores showed variation. However, almost all teachers received high scores on performance tasks. Missing data for both observation ratings and performance tasks was a major challenge in the first year of REACH. Many teachers failed to receive REACH ratings, due to missing observation ratings; a substantial number of teachers received a default score on performance tasks.
• There is a modest positive association between the observation and student growth components of REACH. The correlation between observation scores and individual value-added scores is similar to the correlation found in other research on teacher evaluation metrics. Performance task and school-wide literacy value-added scores have only a very weak association with observation scores.
• The vast majority of evaluators were able to rate teacher practice in a consistent manner. In general, evaluators were internally consistent. In other words, most evaluators were able to apply the same criteria to individual component ratings across all the teachers they observed.
• There is considerable variation in evaluator severity, but few evaluators were more than half a point more severe or lenient than the average. Using a sample of evaluators, we found some are consistently rating teacher practice higher or lower than others. However, fewer than ten percent of our sample of evaluators were more than half an observation rating point more severe or lenient than average.
3 Non-tenured teachers are typically teachers with three or fewer years of experience in the district and include Probationary Appointed Teachers (PATs) and Temporary Appointed Teachers (TATs).
Analytic Memo: Evaluation Data from the First Year of REACH 4
Section I: Shift in Performance Ratings under REACH
REACH ratings4 from the first year display a shift from previous years, when most teachers were rated in the top two categories. In the first year of REACH, most teachers were assigned ratings in the middle two categories and only ten percent of teachers were assigned ratings in the top category.5 There was a slight increase—from one percent to three percent—in teachers assigned ratings of Unsatisfactory. REACH ratings and “checklist” ratings were calculated differently. First, REACH included multiple measures of teacher performance, while “checklist” ratings were based solely on observations of teacher practice. Second, there was a change in category names under REACH, with the most substantial being the change in terms from “Satisfactory” to “Developing” in the second rating category. These two terms have different meanings, and it is possible the change in terms might have had some influence on the shift in performance ratings under REACH. For example, evaluators might have been more (or less) reluctant
4 Throughout this report rating refers to four level categories determined from scores (Unsatisfactory, Developing, Proficient, Excellent or Unsatisfactory, Basic, Proficient, Distinguished for the observation rubric). Scores will refer to the continuous number from the measure. For example, a teacher can have a REACH score of 352, which is a REACH rating of Excellent. REACH ratings and REACH scores refer to a teacher’s final evaluation score/rating incorporating both professional practice and student growth measures. 5 As stated previously, only non-tenured teachers received REACH ratings. Checklist ratings from 2003-07 are provided here as a reference and are of non-tenured teachers.
Analytic Memo: Evaluation Data from the First Year of REACH 5
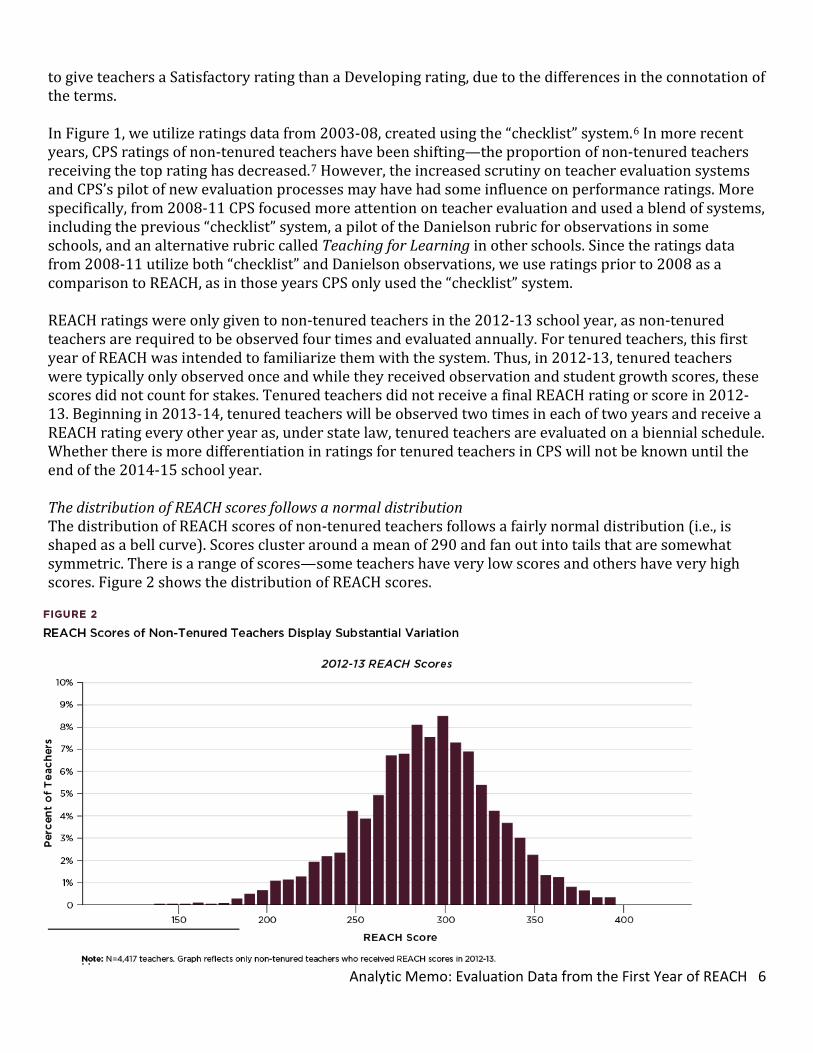
to give teachers a Satisfactory rating than a Developing rating, due to the differences in the connotation of the terms. In Figure 1, we utilize ratings data from 2003-08, created using the “checklist” system.6 In more recent years, CPS ratings of non-tenured teachers have been shifting—the proportion of non-tenured teachers receiving the top rating has decreased.7 However, the increased scrutiny on teacher evaluation systems and CPS’s pilot of new evaluation processes may have had some influence on performance ratings. More specifically, from 2008-11 CPS focused more attention on teacher evaluation and used a blend of systems, including the previous “checklist” system, a pilot of the Danielson rubric for observations in some schools, and an alternative rubric called Teaching for Learning in other schools. Since the ratings data from 2008-11 utilize both “checklist” and Danielson observations, we use ratings prior to 2008 as a comparison to REACH, as in those years CPS only used the “checklist” system. REACH ratings were only given to non-tenured teachers in the 2012-13 school year, as non-tenured teachers are required to be observed four times and evaluated annually. For tenured teachers, this first year of REACH was intended to familiarize them with the system. Thus, in 2012-13, tenured teachers were typically only observed once and while they received observation and student growth scores, these scores did not count for stakes. Tenured teachers did not receive a final REACH rating or score in 2012-13. Beginning in 2013-14, tenured teachers will be observed two times in each of two years and receive a REACH rating every other year as, under state law, tenured teachers are evaluated on a biennial schedule. Whether there is more differentiation in ratings for tenured teachers in CPS will not be known until the end of the 2014-15 school year. The distribution of REACH scores follows a normal distribution The distribution of REACH scores of non-tenured teachers follows a fairly normal distribution (i.e., is shaped as a bell curve). Scores cluster around a mean of 290 and fan out into tails that are somewhat symmetric. There is a range of scores—some teachers have very low scores and others have very high scores. Figure 2 shows the distribution of REACH scores.
6 The 2003-08 data on non-tenured teachers is from The New Teacher Project (2007). 7 See Appendix B for more details.
Analytic Memo: Evaluation Data from the First Year of REACH 6
The current REACH point system has cutoffs at 210, 285, and 340. Teachers with scores below 210 are assigned a rating of Unsatisfactory. Teachers between 210 and 284 are assigned a rating of Developing and those between 285 and 310 are assigned ratings of Proficient. Anyone with scores of 340 and above receives a rating of Excellent. The cutoffs determine the number of teachers who are Unsatisfactory, Developing, Proficient, and Excellent. If cutoff points were to change, then the number of teachers in each REACH rating category would change as well. REACH provides more detailed information to teachers and principals than the previous system8 Under the “checklist” system, teachers were assigned a rating on the four-level scale and there was no formal system describing how teachers’ observation ratings translated into a final evaluation rating. At the end of the year, teachers were simply told whether they were Superior, Excellent, Satisfactory, or Unsatisfactory. REACH provides much more information. Each teacher is provided a detailed report; teachers and principals know how close or far each teacher is from moving up or down one rating category. These reports also provide detailed information for each of REACH’s measures. The professional practice part of the report provides scores for each component of the observation framework. Thus, teachers and principals are able to have information about which components are their strengths and which might need improvement.
8 We use the term “principals” to also include assistant principals as both can be certified as evaluators. Analytic Memo: Evaluation Data from the First Year of REACH 7
Section II: The Multiple Elements of REACH
The different metrics in teacher evaluation systems often need to serve dual purposes; 1) providing information to engage teachers in using and talking about data to improve their instruction and 2) measuring and differentiating teachers’ performance. These purposes can sometimes be at odds. For example, a measure might be a useful tool for providing teachers with data for formative purposes, but not be an accurate measure of student learning or teacher performance over the course of a year. Our September 2013 report on REACH gave some insight into teachers’ perspectives on the multiple measures as tools to guide instruction.9 Ultimately, we want to know whether these measures are able to identify teachers who perform poorly or well. Here, with just one year of data, we provide a preliminary look at each measure (observations, performance tasks, and value-added) and whether there was variation in each. We find teachers scored a range of scores on observation and value-added; however, almost all teachers received high scores on performance tasks. Missing data was a challenge in this first year of REACH, resulting in teachers either receiving default scores on performance tasks or being given an “inability to rate” on their REACH reports.
Student Growth: Performance Tasks Most often developed by teams of teachers and content specialists, REACH performance tasks serve as one assessment for student growth. There is a different performance task for each subject and grade, including subjects such as art and music, as well as reading and math. In 2012-13 over 90 performance tasks were created. They are administered by teachers, both in the fall and the spring, and are intended to measure change in student mastery over one or two skills or standards. Currently, there is little research evidence nationwide on the reliability of such alternative growth measures.10
9 Sporte, Stevens, Healey, Jiang, & Hart (2013). 10 Gill, Bruch, & Booker (2013).
Analytic Memo: Evaluation Data from the First Year of REACH 8
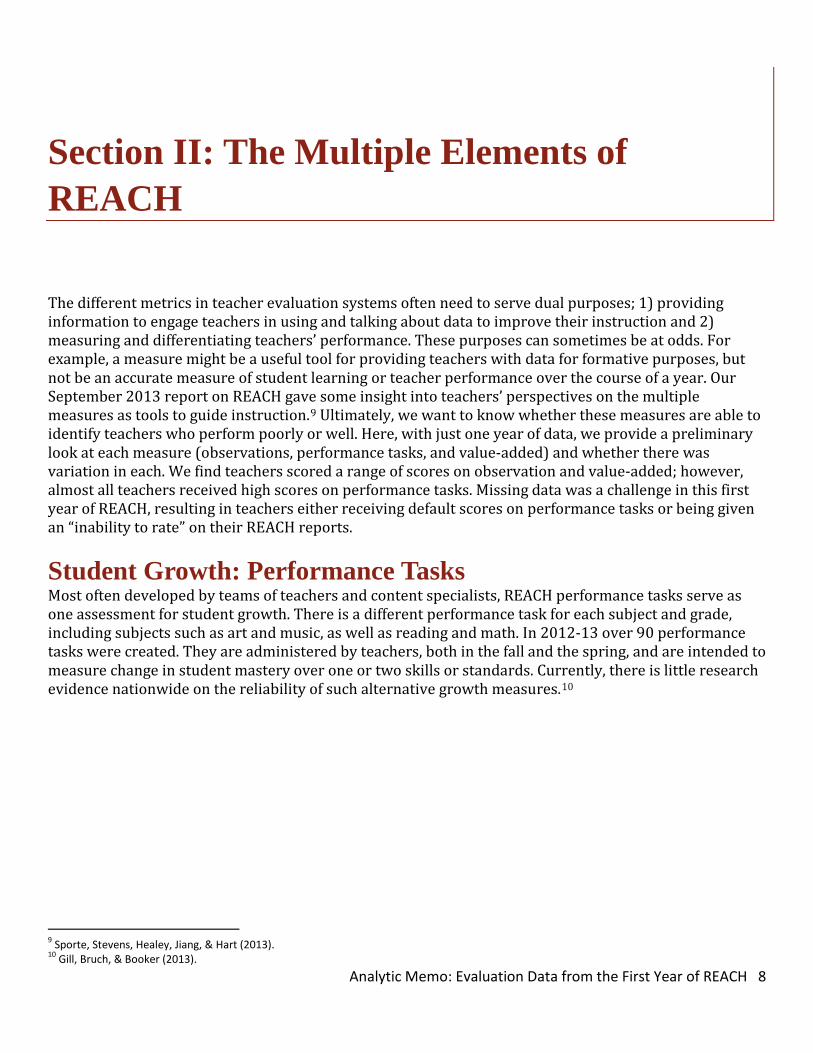
Most teachers received high scores on performance tasks. Across the district, over 11,000 teachers received a performance task score. However, performance tasks did little to differentiate among teachers, as almost all teachers received high scores. Over 20 percent of teachers with performance task scores “topped out” at the highest performance level, receiving the highest possible score of 4.0; 74 percent received a 3.0 or greater (see Figure 3). Although performance tasks may not help differentiate among teachers, they may provide information useful for instruction—an important goal of REACH. In fact, according to our September 2013 REACH study, 70 percent of the teachers who had given a beginning-of-year REACH performance task reported that it was somewhat or very useful for their instruction.11 Over a third of teachers received default scores on performance tasks due to missing data. Thirty-six percent of teachers did not receive an individual performance task score and, instead, received CPS’s default score of 3.12 due to incomplete or missing data. One particular challenge was that, in order to receive a performance task score, a teacher needed to be the teacher-of-record for the same class in September and May; late hires, transfers, and class changes could cause teachers to have different classes at these two points in time. Teachers were also responsible for grading performance tasks, as well as uploading scores; implementation or technical difficulty may also have resulted in missing data.
11 Sporte et al. (2013). Analytic Memo: Evaluation Data from the First Year of REACH 9

Measuring Student Growth for Teachers in Non-Tested Grades and Subjects: States across the nation require evaluation systems to include measures of student achievement growth, with some, such as Illinois, requiring two measures. But value-added scores, a measure used by many states, usually cover only reading and math in limited grades. Many districts are exploring alternatives for teachers in non-tested subjects or grades. A few types of alternative growth measures are described below:
• Commercially available alternative tests are standardized tests that are not utilized for accountability purposes by states. Examples of these include End of Course exams, curriculum-based assessments, the Stanford Achievement Test, the Balanced Assessment in Mathematics, and the Scholastic Reading Inventory.
• Pre/Post rubric calculations are based on tests administered at the beginning and end of the year, both of which are scored on a rubric. The district determines a methodology to calculate growth between the two. These are most analogous to CPS’s performance tasks.
• Goal setting is a process of setting measurable, classroom-specific goals or objectives that are chosen by individual teachers and approved by the principal(s). These are often referred to as Student Learning Objects (SLOs).
• Measures of collective performance assess the performance of groups of teachers, such as the school, grade level, and
department teams. These include school-wide student growth measures and team-based collaborative achievement projects. These are most analogous to CPS’s use of school-wide value-added in literacy.
Source: Gill et al. (2013); Reform Support Network (2011).
Analytic Memo: Evaluation Data from the First Year of REACH 10

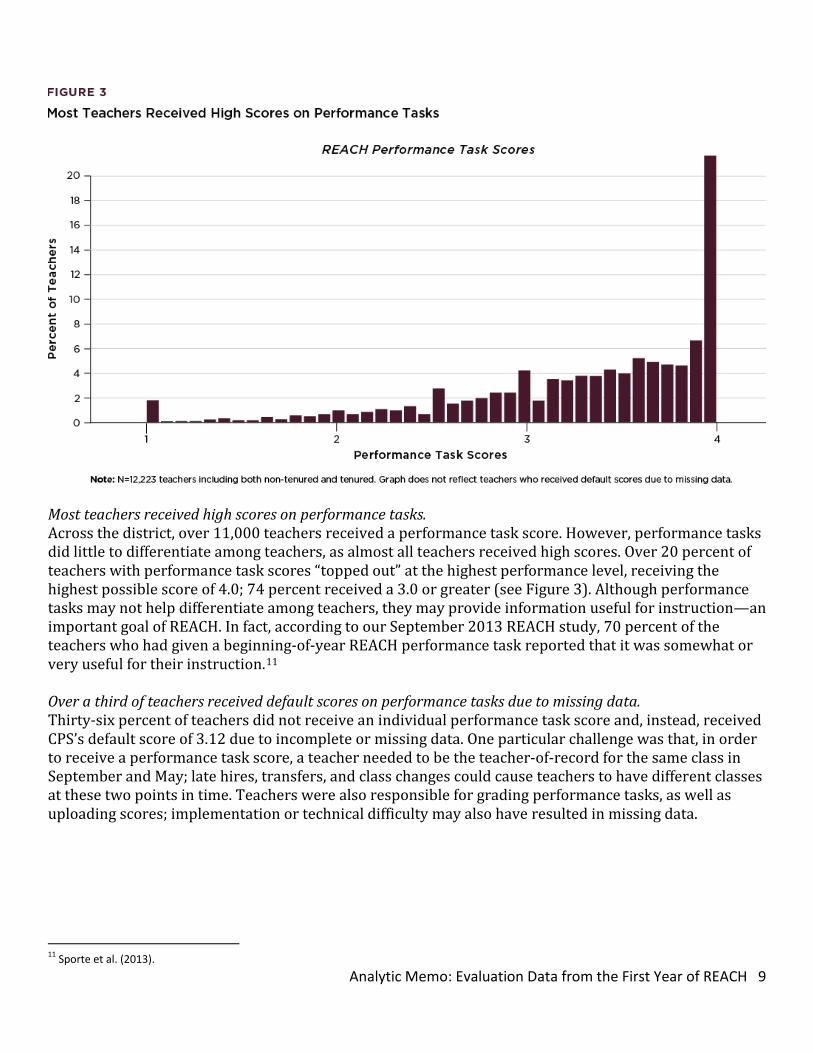
Student Growth: Value-Added Measures Value-added measures are designed to capture the contribution of a school or teacher on student growth on standardized tests, while holding demographic and school variables constant.12 There continues to be scholarly debate about the usefulness of value-added measures.13 In this memo, we do not focus on the advantages or disadvantages of the actual value-added model used by CPS; instead we look at the distribution of value-added scores and their relationships with other metrics used in the REACH system. As stated previously, in 2012-13, elementary teachers in grades 3-8 who taught reading or math received an individual value-added score. The term individual value-added refers to a value-added score received by a single teacher based on their students’ growth. An individual value-added score can only be computed for a teacher who teaches reading or math in grades 3-8. All other teachers in elementary schools received a school-wide value-added in literacy.14 School-wide literacy value-added scores are utilized for teachers in non-tested subjects and grades. This is the average value-added score in literacy for all students in grades 3-8 at a school. All teachers within a school who receive a school-wide value-added in literacy receive the same score. High school teachers did not receive a value-added score in 2012-13. Figure 4 shows the distributions of teacher scores for school-wide and individual-level value-added scores. Both value-added scores range from -3.0 to 3.0. A value-added score of zero indicates that students grew at a rate that was equal to the CPS average amount over the year; a score below zero indicates that students had below-average growth, while a score above zero indicates that students had above-average growth.15 Individual-level value-added scores for math and reading in CPS in 2012-13 were normally distributed, with the majority of teachers clustered within one standard deviation of the mean of approximately zero. The normal distribution is not surprising, as value-added metrics are modeled to create a normal distribution. We see differences between the distributions of school-wide and individual value added scores. Teacher scores in school-wide value-added have more spikes. This is due to multiple teachers in a school receiving the same school-level value-added score. In large schools, many teachers receive the same school-level value-added score, making the overall distribution lumpy.
12 Koretz (2008). 13 For examples, see Chetty, Friedman, & Rockoff (2011); Glazerman, Loeb, Goldhaber, Staiger, Raudenbush, & Whitehurst (2010); Kane, McCaffrey, Miller & Staiger (2013); Rothstein (2008). 14 For more details on which teachers receive which measures and the numbers of teachers receiving value-added scores, see Appendix A. 15 For REACH score calculations, CPS transforms the original value-added score to a 1-4 scale. We use the original -3 to 3 scale throughout this report.
CPS Value-Added Measures • Developed by the Value-Added Research Center (VARC) at the University of
Wisconsin. • The model controls for grade level, gender, race, ethnicity, low-income status,
ELL status, IEP status, homelessness, and mobility. • Based on the NWEA MAP, an adaptive computer-based test administered to
students in grades 3-8 reading and math. • In 2012-13, individual value-added scores were calculated for teachers in grades
3-8 reading or math. Teachers in non-tested subjects or grades received a school-wide literacy value-added score.
• A value-added score of zero indicates that the teacher’s students grew at a rate equal to the CPS average amount over the year; a score below zero indicates that the teacher’s students had below-average growth; a score above zero indicates that the teacher’s students had above-average growth.
• For high school teachers, CPS is developing an expected-gains metric, utilizing the EPAS suite of tests (EXPLORE, PLAN, and ACT) to measure expected student gains for possible use in 2013-14. In 2012-13, EPAS assessments were administered without stakes and teachers did not receive scores.
Analytic Memo: Evaluation Data from the First Year of REACH 11
Only about 25 percent of all teachers received an individual value-added score. Across the district, twice as many elementary teachers are in non-tested subjects or grades as those in tested subjects or grades. In 2012-13, almost 10,000 teachers received the school-wide literacy value-added score, while only about 5,000 received an individual-valued-added score. High school teachers did not receive a value-added score in 2012-13.
Analytic Memo: Evaluation Data from the First Year of REACH 12

Professional Practice: Observation Scores The main element of the REACH evaluation system is the observation process used to rate professional practice.16 Drawing on roots in the Danielson Framework, the classroom observation process is structured to provide teachers with information they can use to improve their teaching practices. It includes a pre- and post-conference between teachers and principals to foster professional conversations and constructive feedback. CPS focused heavily on the observation process, preparing and training almost 1,200 principals and assistant principals to be certified evaluators and hiring 18 specialists to serve as coaches and calibrators. In 2012-13, almost 40,000 observations were completed, with most principals completing four observations for non-tenured teachers and one observation for tenured teachers. Here, we give an overview of observation scores from the first year of REACH.17 In the next section, we discuss evaluators and observation ratings in more detail. There is variation in observation scores for both non-tenured and tenured teachers. Figure 5 shows the distribution of observation scores from 2012-13 for both non-tenured and tenured teachers. For both we see teachers clustered around an average score, with few teachers scoring very high or very low. Scores ranged from the lowest possible score of 1.0 to the highest possible score of 4.0. The distribution of observation scores for tenured and non-tenured teachers differed. Overall, tenured teachers received higher observation scores than non-tenured teachers. As previously stated, in 2012-13 tenured teachers did not receive a REACH rating and were only required to have one observation. Thus, tenured teacher observation scores were mostly calculated from a single observation. It is possible, in this first year of REACH, that principals treated observations for tenured teachers differently from observations for non-tenured teachers.
16 For an overview of the CPS Framework for Teaching, please see Appendix A. 17 Throughout this report, when we refer to observation scores we are referring to CPS’s weighted averages of observations. CPS may also refer to them as “professional practice scores.” Since they calculated from observations, we use the term observation scores for ease. For details on the calculation of these scores from observation ratings see Appendix C.
Analytic Memo: Evaluation Data from the First Year of REACH 13

Missed observations resulted in teachers unable to be rated. Twenty four percent of non-tenured teachers did not receive a REACH rating in 2012-13. Teachers missing even one of the required four observations were unable to receive ratings and instead were assigned an “Inability to Rate.” Principals not completing the required number of observations and teachers moving in and out of schools may be among the reasons for missed observations. This issue is widespread across the district and is a particular issue for a smaller number of schools. Over 400 schools had at least one non-tenured teacher missing the required number of observations. There were 47 schools18 in which 100 percent of their non-tenured teachers did not have the required number of observations and thus were assigned an “Inability to Rate.”19 Many of these schools with high percentages of missed observations were undergoing major organizational changes, such as principal turnover, being closed, turned around, or re-located.
18 Please note that of these 47 schools, five only had one non-tenured teacher. 19 Teachers missing any of the required four observations were assigned an “Inability to Rate” on their REACH reports. These teachers’ REACH ratings then defaulted to a REACH rating of Proficient.
Analytic Memo: Evaluation Data from the First Year of REACH 14

Section III: Associations among REACH’s Metrics
The REACH system includes multiple ways to measure teacher effectiveness to capture different dimensions of teacher practice. Combining these metrics should result in differentiating teachers’ overall performance. We saw in Section I that REACH does provide a different distribution of teacher evaluation ratings from the earlier checklist system and that the distribution of REACH scores follows a fairly normal statistical distribution. We saw in Section II that observation ratings and value-added scores considered alone did differentiate among teachers, while performance tasks showed less variability. In this section, we explore the extent to which the components provide consistent or contradictory information, and the degree to which they may be redundant or provide a different assessment of teachers’ skills. There is a positive association between the observation and the student growth components of REACH. Performance tasks and school-wide value-added have only a weak association with observation scores. Observation scores are composed of ratings on multiple components, such as questioning and discussion, student engagement, and classroom environment.20 We compared the relationship of each of these components to teachers’ value-add scores. First, we focused on observation ratings at the component
20 See Appendix A for details on the components rated. Analytic Memo: Evaluation Data from the First Year of REACH 15

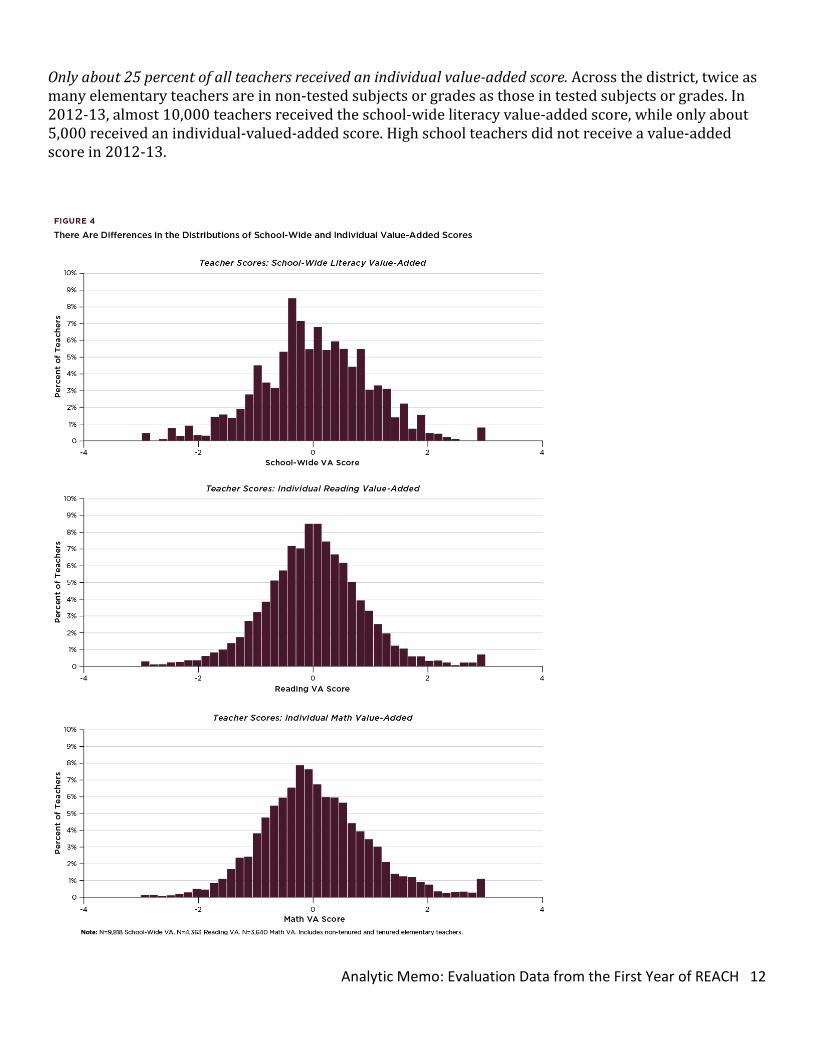
level21 and compared observation ratings for each component to individual value-added measures. We found teachers with the lowest component ratings also had the lowest average value-added score and teachers with the highest component ratings had the highest average value-added score. This pattern is the same for both reading and math value-added and for almost all components.22 See Figure 6 for an example. Second, we looked at the relationship between composite observation scores23 and the three measures that comprise student growth: Individual value-added, school-wide value-added in literacy, and performance tasks. Table 1 shows the correlations of observation scores, value-added, and performance task scores.24 We see that the association between observations and the combined individual value-added displays the strongest association, with an adjusted correlation of 0.349. Individual math and reading value-added are correlated at 0.28 and 0.29. These correlations are similar to findings in the research-evidence base on teacher evaluation.25 Performance tasks and school-wide value-added, however, are only weakly associated with observation scores, with correlations of 0.108 and 0.119, respectively.26 There is variation in teachers’ value-added scores across all levels of observation scores. We found that observation scores and individual value-added scores are positively associated; on average, as observation scores increase, value-added scores also increase. Observation scores and individual value-added scores are correlated at about 0.3 as shown in Table 1. However, while there is a positive relationship, teachers with the same observation scores can have very different value-added scores. Figure 7 displays boxplots of teachers’ individual value-added scores by observation score quintile. Teachers in quintile 1 have the lowest observation scores and those in quintile 5 have the highest observation scores. The average value-added of teachers in any category is higher than the average value-added of the teachers in the lower category. However, as we can see from the boxes and whiskers in the figure, there is considerable overlap between the value-added scores of teachers in different categories of observation scores. This overlap shows that there are teachers in each quintile who have the same score as teachers in any other quintile. Looking more closely at those teachers in the top quintile on observation scores, we find 11 percent scored in the bottom quintile on value-added. If the correlation were stronger, there would be less overlap.
21 An observation rating at the component level refers to the four-level ratings for each component. For example the ratings for component 3d can be Unsatisfactory, Basic, Proficient, or Distinguished. See Appendix A for more details. 22 Except for d4c2, d4c3, and d4c4, which are all components in Domain 4: Professional Responsibilities. See Appendix A for details on all components. 23 Again observation scores refers to CPS weighted averages of observations. Please see Appendix C for the calculation of these scores. 24 Estimation error in value-added and observation measures understate the correlation. We adjust for measurement error to estimate the correlation coefficient disattenuated of measurement error. See Appendix E for more details. 25 Gallagher (2004); Harris & Sass (2007); Jacob & Lefgren (2008); Kane & Staiger (2012); Kimball, White, Milanowski, & Borman (2004). 26 There is little information on the reliability of performance tasks score. Since reliability cannot be calculated, only unadjusted correlations were calculated for performance tasks. Analytic Memo: Evaluation Data from the First Year of REACH 16
There is no clear consensus about how strong the correlation among the multiple measures should be. On the one hand, these multiple measures should each be measuring something different. If they were perfectly correlated there would be no need for multiple measures. If they were not correlated at all (or negatively correlated) there may be concerns for including them together in a model of teacher effectiveness. That they are modestly positively correlated is consistent with what would be expected with the intention of the policy—both metrics are likely measuring effective practice, but they are measuring it in different ways. Future work includes continued analysis on the relationships between these multiple measures as REACH moves into its second and third year of implementation.
HOW TO READ FIGURE 7 In Figure 7, each box represents all of the teachers with observation scores in that quintile. The white line is the average value-added score for teachers in that quintile; the top of the box represents the value added score of the 75th percentile of teachers in that box while the bottom of the box represents the 25th percentile. The “whiskers” above and below the boxes represent the scores of most teachers above the 75th percentile and below the 25th percentile (ignoring outliers). For example, teachers in the third quintile have individual value added scores ranging from about -2.0 to about 1.9, with an average of about 0.0.
Analytic Memo: Evaluation Data from the First Year of REACH 17

A Closer Looks at Evaluators’ Ratings Ratings from observations are the most heavily weighted component of REACH, currently accounting for 75-100 percent of a teacher’s REACH rating. Since observation ratings inherently rely on an evaluator’s judgment, there is always a question of how much a teacher’s rating is based on their actual performance and how much might be dependent on their particular evaluator. Ensuring that ratings are consistent and fair is a particular concern for districts; many are spending considerable time and energy focusing on the calibration of their evaluators. In Chicago, principals had ongoing professional development throughout the school year in the form of four workshops and ongoing one-on-one support from Instructional Effectiveness Specialists. Principals also had to pass a certification assessment prior to conducting any observations. In this section, we share our findings on evaluator consistency and severity. In general, the vast majority of evaluators were able to award ratings in a consistent manner. We analyzed all observation data, looking for unusual patterns in the ratings. Just as adding fractions is more difficult than adding whole numbers, some components are more difficult to get higher ratings on. Indeed, empirical evidence confirms that the average ratings given to some components are higher than others (“easy” components) and the average ratings for other components are lower than others (“hard” components). We found that, in general, evaluators were able to apply the rating rubric in ways that were consistent with what we would have predicted, given component difficulty. We identified two different types of patterns that were not consistent with our prediction: “muted” and “erratic.” About 3 percent of principals were found to be “muted,” meaning that a principal would award almost the same rating to all teachers, regardless of the component difficulty. On the opposite end of the consistency spectrum, about 5 percent of evaluators were judged to be “"erratic.” With these evaluators, “easy” components were rated low, and “hard” components were rated high. Instead of being consistent, erratic principals gave more random ratings. There is considerable variation in rater severity, but few are so extreme as to have a very substantial effect on teacher ratings. Another set of analyses focused on a randomly selected sample of 46 principals across the district. It utilized independent, joint observations with 16 specialists. Using approximately 1,400 observations and 125 joint observations, we were able to determine how severe or lenient each evaluator (principal and specialist) was. A more severe evaluator will award systematically lower ratings to an average teacher; a more lenient evaluator will give systematically higher ratings. For example, the average rating for all teachers in our study sample was 2.73. If an evaluator of average severity rated an average teacher, they would assign an average score of 2.73. If an evaluator were more severe, they would assign this average teacher a score lower than 2.73. If an evaluator were more lenient, they would assign this average teacher a score greater than 2.73.
INSTRUCTIONAL EFFECTIVENESS SPECIALISTS Specialists conduct joint classroom observations with principals in their schools, after which they lead calibration sessions for the evaluators at a particular school. During these sessions, specialists hone evaluators’ ability to assign unbiased ratings based only on the evidence they collected during observations. There were 18 specialists in 2012-13, one for every school network (although some were not hired by the time school started in the fall). Specialists are certified and trained to ensure evaluator quality and inter-rater reliability as well as identify evaluators’ professional development needs.
Analytic Memo: Evaluation Data from the First Year of REACH 18
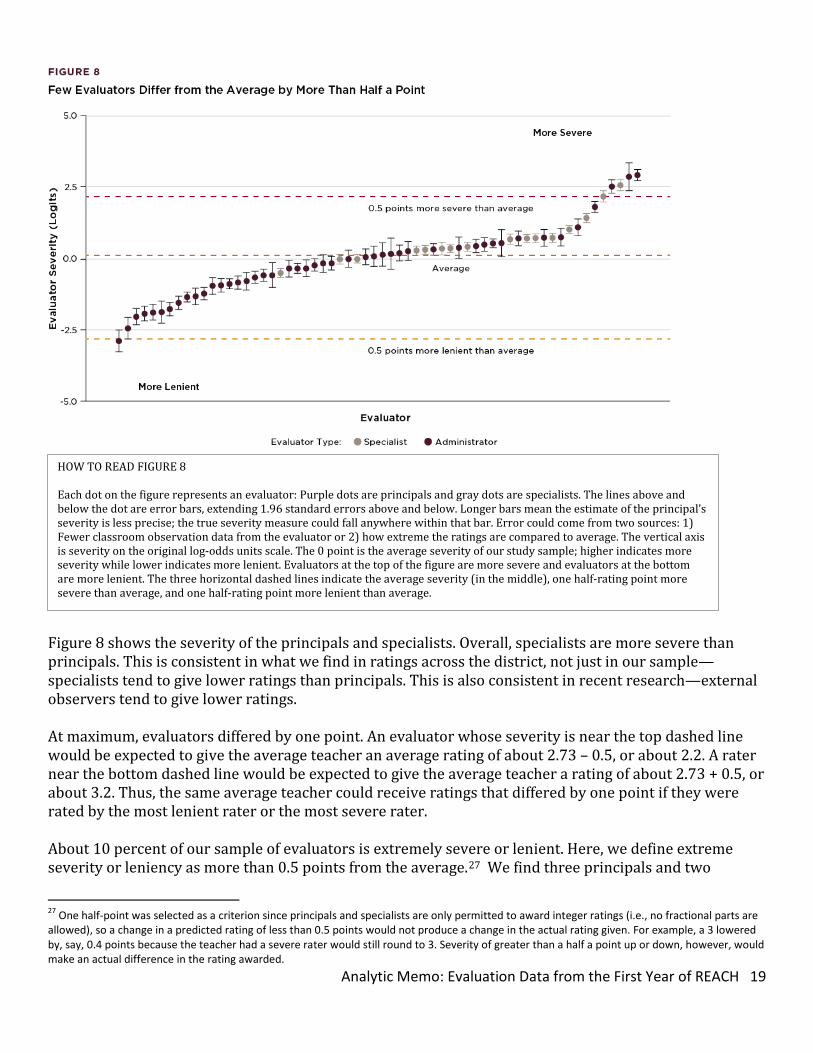
Figure 8 shows the severity of the principals and specialists. Overall, specialists are more severe than principals. This is consistent in what we find in ratings across the district, not just in our sample—specialists tend to give lower ratings than principals. This is also consistent in recent research—external observers tend to give lower ratings. At maximum, evaluators differed by one point. An evaluator whose severity is near the top dashed line would be expected to give the average teacher an average rating of about 2.73 – 0.5, or about 2.2. A rater near the bottom dashed line would be expected to give the average teacher a rating of about 2.73 + 0.5, or about 3.2. Thus, the same average teacher could receive ratings that differed by one point if they were rated by the most lenient rater or the most severe rater. About 10 percent of our sample of evaluators is extremely severe or lenient. Here, we define extreme severity or leniency as more than 0.5 points from the average.27 We find three principals and two
27 One half-point was selected as a criterion since principals and specialists are only permitted to award integer ratings (i.e., no fractional parts are allowed), so a change in a predicted rating of less than 0.5 points would not produce a change in the actual rating given. For example, a 3 lowered by, say, 0.4 points because the teacher had a severe rater would still round to 3. Severity of greater than a half a point up or down, however, would make an actual difference in the rating awarded.
HOW TO READ FIGURE 8 Each dot on the figure represents an evaluator: Purple dots are principals and gray dots are specialists. The lines above and below the dot are error bars, extending 1.96 standard errors above and below. Longer bars mean the estimate of the principal’s severity is less precise; the true severity measure could fall anywhere within that bar. Error could come from two sources: 1) Fewer classroom observation data from the evaluator or 2) how extreme the ratings are compared to average. The vertical axis is severity on the original log-odds units scale. The 0 point is the average severity of our study sample; higher indicates more severity while lower indicates more lenient. Evaluators at the top of the figure are more severe and evaluators at the bottom are more lenient. The three horizontal dashed lines indicate the average severity (in the middle), one half-rating point more severe than average, and one half-rating point more lenient than average.
Analytic Memo: Evaluation Data from the First Year of REACH 19
specialists to be extremely severe and one principal extremely lenient. In general, most principals and specialists were rating within 0.5 points of the average. Continued Research Needed Over the next several months, we will be adding to our analyses of these first-year data to deepen our understanding of the different elements of REACH and their interrelationships. We will look at characteristics of teachers, classrooms, and schools that appear to be related to the elements themselves or to the way they are correlated. These empirical insights into the nature of these interrelationships are a necessary first step. Ultimately, over time, we will also work to develop a theoretical conceptualization of what level of relationships produce accurate differentiation and good information that can improve instruction and student outcomes.
Analytic Memo: Evaluation Data from the First Year of REACH 20

References
Banchero, S. (2013, August 26) Biggest changes in a decade greet students. The Wall Street Journal. Retrieved from http://online.wsj.com/article/SB10001424127887323980604579029303538525902.html. Chetty, R., Friedman, J.N., & Rockoff, J.E., (2011). The long term impact of teachers: Teacher valued-added and student outcomes in adulthood (Working Paper No. 17699). Washington, DC: National Bureau of Economic Research. Retrieved from http://www.nber.org/papers/w17699. Florida Department of Education. (2013). Personnel evaluation data for classroom teachers by district, 2011-2012. Tallahassee, FL: Florida Department of Education. Gallagher, H.A. (2004). Vaughn Elementary’s innovative teacher evaluation system: Are teacher evaluation scores related to growth in student achievement? Peabody Journal of Education, 79(4), 79-107. Gill, B., Bruch, J., & Booker, K. (2013). Using alternative student growth measures for evaluating teacher performance: What the literature says. Washington, DC: Institute of Education Sciences. Glazerman, S., Loeb, S., Goldhaber, D., Staiger, D., Raudenbush, S., & Whitehurst, G. (2010). Evaluating teachers: The important role of value-added. Brown Center on Education Policy. The Brookings Brown Center. Hanushek, E.A., & Rivkin, S.G. (2010). Generalizations about using value-added measures of teacher quality. American Economic Review, 100(2), 267-271. Harris, D.N., & Sass, T.R. (2007). Teacher training, teacher quality, and student achievement (CALDER Working Paper 3). Washington, DC: The Urban Institute. Heitin, L. (2012, September 12). Chicago strike puts spotlight on teacher-evaluation reform. Education Week. Retrieved from http://www.edweek.org/ew/articles/2012/09/12/04strike-eval.h31.html?tkn=MPVFJ4%2FuwtY00iRpmHVQ4TFNDbIhG3w8%2FA3f&cmp=ENL-TU-NEWS2 Jacob, B.A., & Lefgren, L. (2008). Can principals identify effective teachers? Evidence on subjective performance evaluation in education. Journal of Labor Economics, 26(1), 101-136. Kane, T.J., McCaffrey, D.F., Miller, T., & Staiger, D.O. (2013). Have we identified effective teachers? Validating measures of effective teaching using random assignment. Seattle, WA: Bill & Melinda Gates Foundation. Kane, T.J., & Staiger, D.O. (2012). Gathering feedback for teaching: Combining high-quality observations with student surveys and achievement gains. Seattle, WA: Bill & Melinda Gates Foundation.
Analytic Memo: Evaluation Data from the First Year of REACH 21

Keesler, V., & Howe, C. (2012). Understanding educator evaluations in Michigan. Results from Year 1 of implementation. Lansing, MI: Michigan Department of Education. Retrieved from https://www.michigan.gov/documents/mde/Educator_Effectiveness_Ratings_Policy_Brief_403184_7.pdf Kimball, S.M., White, B., Milanowski, A.T., & Borman, G. (2004). Examining the relationship between teacher evaluation and student assessment results in Washoe County. Peabody Journal of Education, 79(4), 54-78. Koretz, D. (2008). A measured approach: Value-added models are a promising improvement, but no one measure can evaluate teacher performance. American Educator, Fall, 18-39. Nye, B., Konsantopoulos, S., & Hedges, L.V. (2004). How large are teacher effects? Educational Evaluation and Policy Analysis, 26(3), 237-257. Reform Support Network. (2011). Measuring student growth for teachers in non-tested grades and subjects. Washington, DC: U.S. Department of Education. Rothstein, J. (2008). Teacher quality in educational production: Tracking, decay, and student achievement. (Working Paper No. 14442). Washington, DC: National Bureau of Economic Research. Retrieved from http://www.nber.org/papers/w14442. Sporte, S.E., Stevens, W.D., Healey, K., Jiang, J., & Hart, H. (2013). Teacher evaluation in practice: Implementing Chicago’s REACH Students. Chicago, IL: University of Chicago Consortium on Chicago School Research. The New Teacher Project. (2007). Hiring, assignment, and transfer in Chicago Public Schools. New York, NY: The New Teacher Project. Retrieved from http://tntp.org/assets/documents/TNTPAnalysis-Chicago.pdf Wright, S.P., Horn, S.P., & Sanders, W.L. (1997). Teacher and classroom context effects on student achievement: Implications for teacher evaluation. Journal of Personnel Evaluation in Education, 11(1), 57-67.
Analytic Memo: Evaluation Data from the First Year of REACH 22
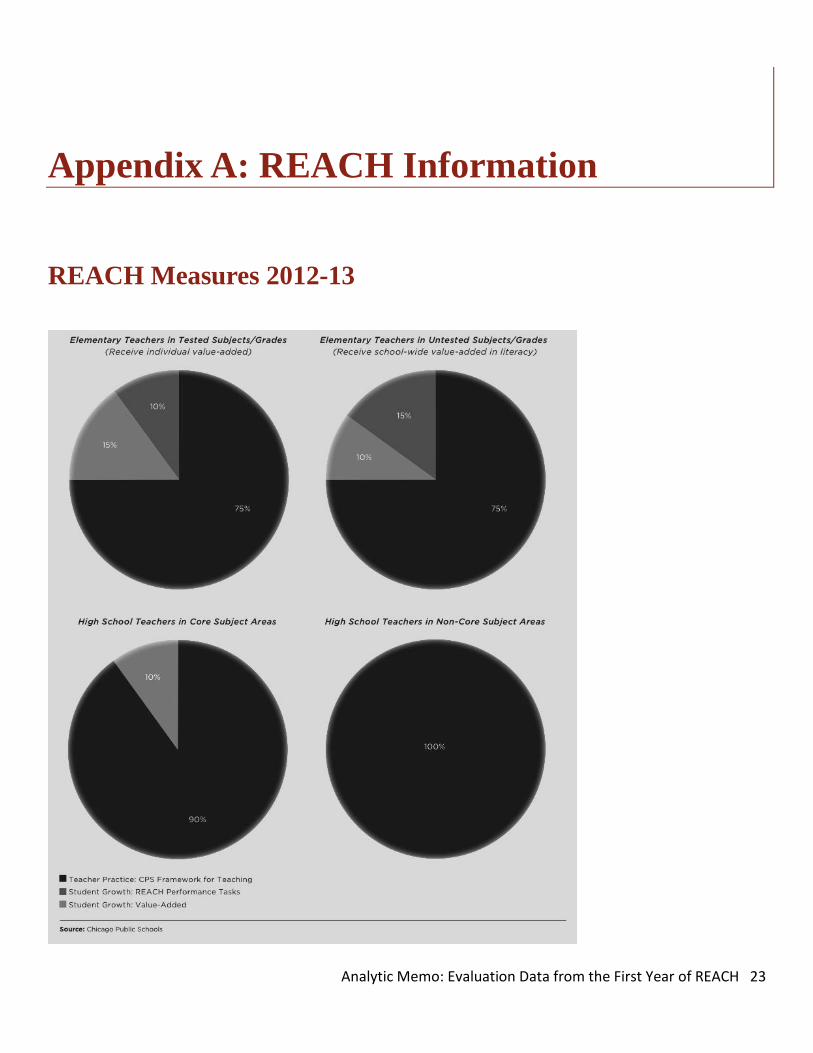
Appendix A: REACH Information
REACH Measures 2012-13
Analytic Memo: Evaluation Data from the First Year of REACH 23
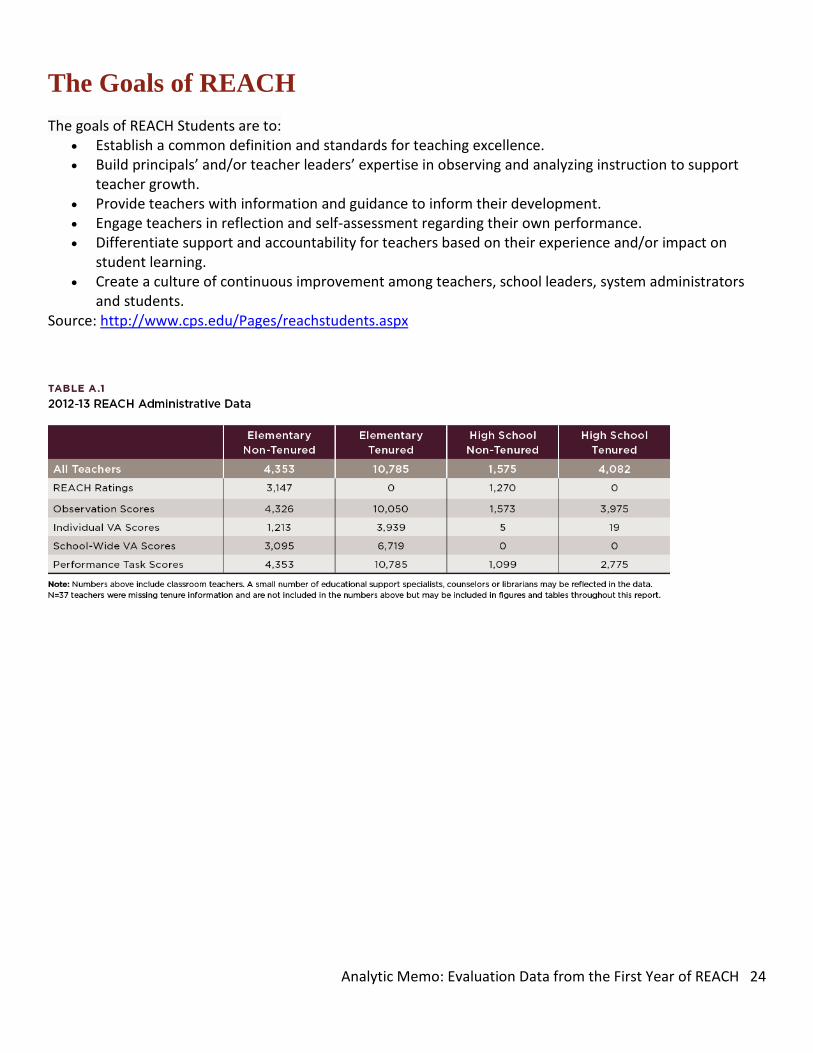
The Goals of REACH
The goals of REACH Students are to: • Establish a common definition and standards for teaching excellence. • Build principals’ and/or teacher leaders’ expertise in observing and analyzing instruction to support
teacher growth. • Provide teachers with information and guidance to inform their development. • Engage teachers in reflection and self-assessment regarding their own performance. • Differentiate support and accountability for teachers based on their experience and/or impact on
student learning. • Create a culture of continuous improvement among teachers, school leaders, system administrators
and students. Source: http://www.cps.edu/Pages/reachstudents.aspx
Analytic Memo: Evaluation Data from the First Year of REACH 24

CPS Framework for Teaching Placemat
Analytic Memo: Evaluation Data from the First Year of REACH 25
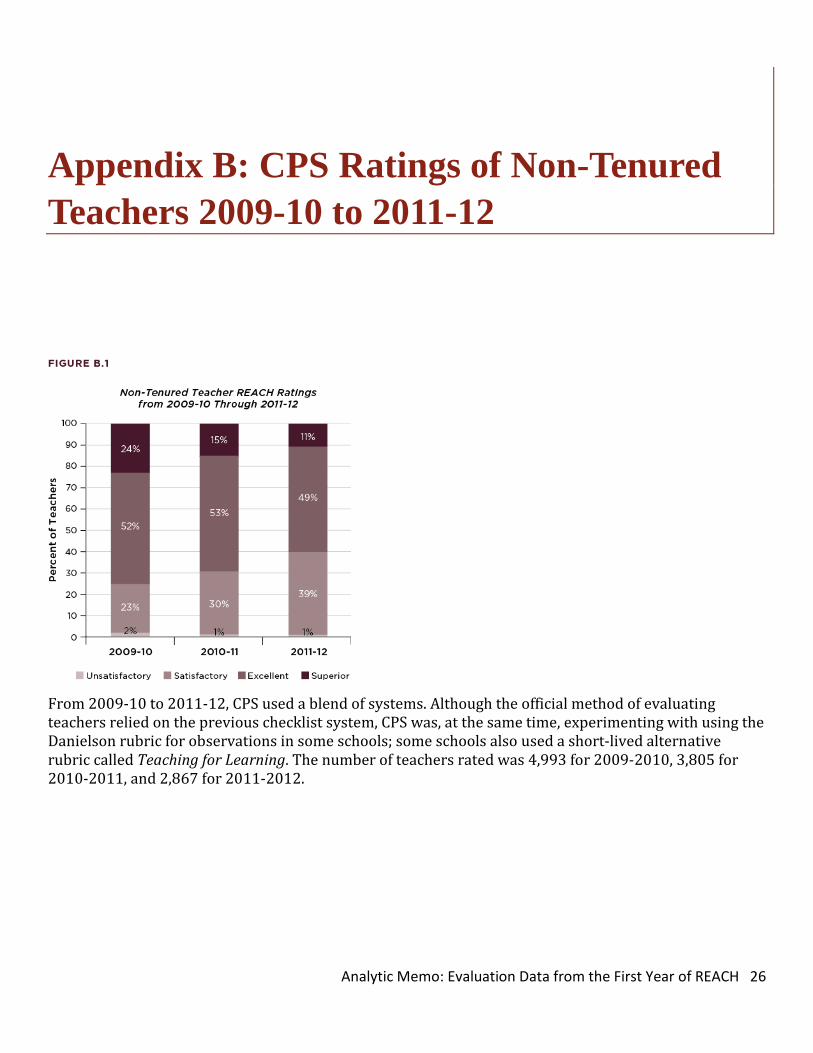
Appendix B: CPS Ratings of Non-Tenured Teachers 2009-10 to 2011-12
From 2009-10 to 2011-12, CPS used a blend of systems. Although the official method of evaluating teachers relied on the previous checklist system, CPS was, at the same time, experimenting with using the Danielson rubric for observations in some schools; some schools also used a short-lived alternative rubric called Teaching for Learning. The number of teachers rated was 4,993 for 2009-2010, 3,805 for 2010-2011, and 2,867 for 2011-2012.
Analytic Memo: Evaluation Data from the First Year of REACH 26
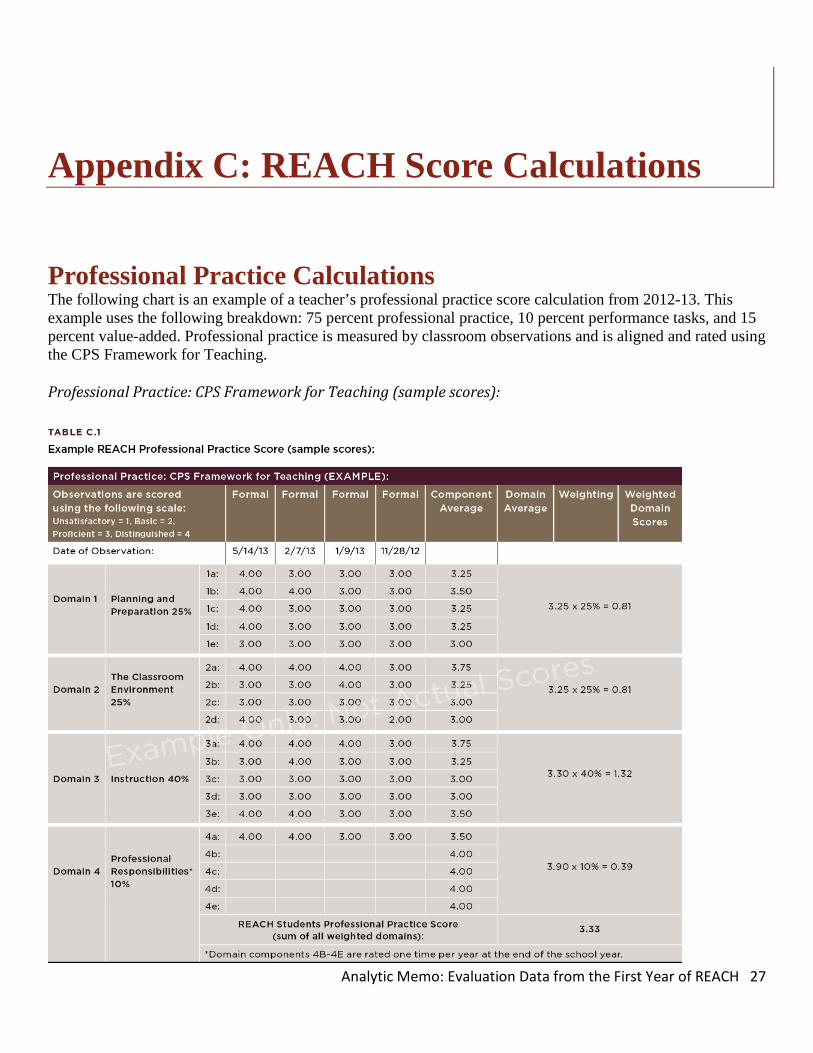
Appendix C: REACH Score Calculations
Professional Practice Calculations The following chart is an example of a teacher’s professional practice score calculation from 2012-13. This example uses the following breakdown: 75 percent professional practice, 10 percent performance tasks, and 15 percent value-added. Professional practice is measured by classroom observations and is aligned and rated using the CPS Framework for Teaching. Professional Practice: CPS Framework for Teaching (sample scores):
Analytic Memo: Evaluation Data from the First Year of REACH 27

Performance Task Calculations REACH Performance task growth scores are based on two parallel assessments: Beginning of the Year (BOY) and End of the Year (EOY). Performance tasks are scored from 0-3. The REACH performance task score that counts toward a teacher’s summative REACH rating is based on the percentage of students who grow. Below is an example of a teacher’s classroom and how students count toward performance task growth:
REACH performance tasks are based on the percentage of students who count as making growth. The REACH performance tasks score uses the same scale as all other REACH. To calculate the adjusted REACH score for performance tasks, the following formula is applied:
% of Students who Showed PT Growth multiplied by (100 divided by 3) plus 1 = Adjusted REACH Score
Analytic Memo: Evaluation Data from the First Year of REACH 28

Example REACH Rating Summary Report How the rating is calculated: Each REACH measure (i.e., observations, performance tasks, value-added) is scored on a scale of 1.00-4.00. Each score is multiplied by the weighting of each measure, which results in a total from 100-400 for each measure. The final totals for each measure are then added and assigned a REACH rating.
Analytic Memo: Evaluation Data from the First Year of REACH 29
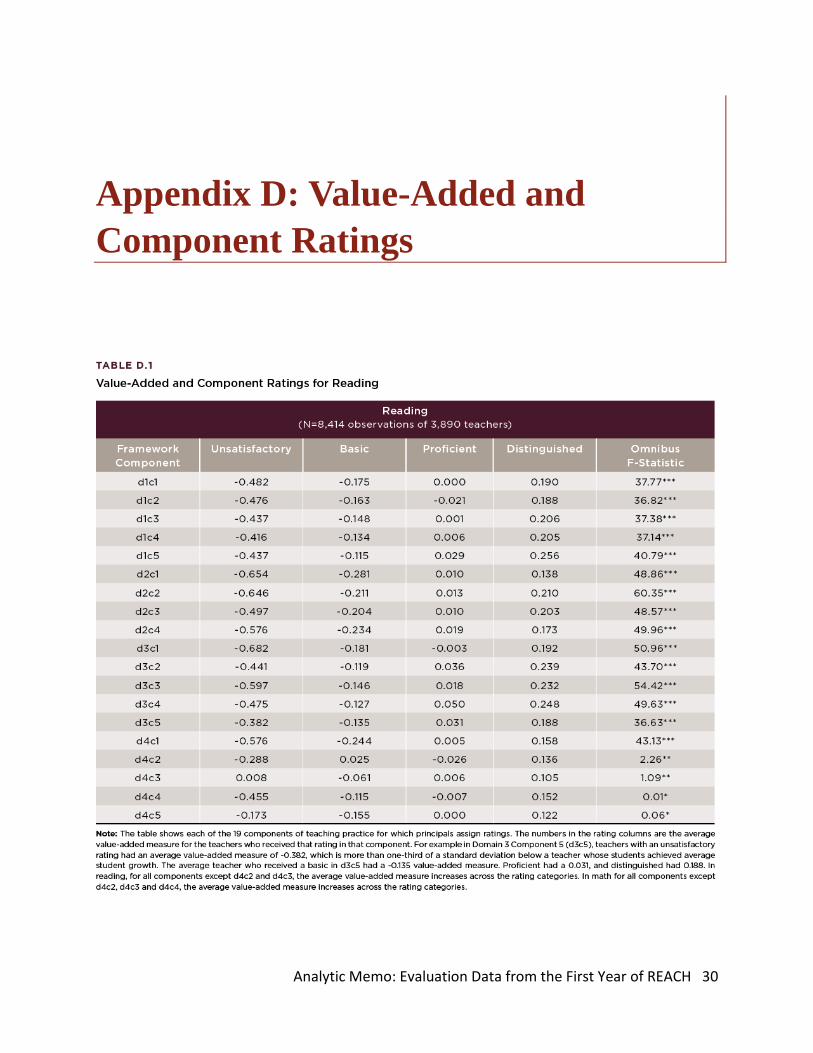
Appendix D: Value-Added and Component Ratings
Analytic Memo: Evaluation Data from the First Year of REACH 30

Analytic Memo: Evaluation Data from the First Year of REACH 31

Appendix E: Disattenuated Scores
When two sets of measures are correlated, measurement error lowers the correlation coefficient below the level it would have reached had the measures been precise. Since the reliability of a measure is the proportion of observed variance that is not due to measurement error, we estimated the reliability of both individual value-added scores and the reliability of observation scores to remove some of the error variance in the raw correlations. To estimate the reliability of the individual value-added scores, we first estimated the error variance by using this formula, where se is the standard error of the value-added score for each teacher.
𝑉𝑉𝑉𝑉𝑉𝑉𝑒𝑒𝑒𝑒𝑒𝑒 =1𝑛𝑛Σ𝑠𝑠𝑠𝑠2
We then calculated the reliability of the value-added scores using the formula below:
𝑅𝑅𝑠𝑠𝑅𝑅𝑅𝑅𝑉𝑉𝑅𝑅𝑅𝑅𝑅𝑅𝑅𝑅𝑅𝑅𝑅𝑅 =𝑉𝑉𝑉𝑉𝑉𝑉tot − 𝑉𝑉𝑉𝑉𝑉𝑉err
𝑉𝑉𝑉𝑉𝑉𝑉tot
We calculated the reliability of the observation scores of both tenured and non-tenured teachers by using Brennan’s Generalizability Theory model, arriving at an estimate of 0.68.28 After computing both reliabilities, we calculated the correlation coefficient 𝝆𝝆𝒙𝒙𝒙𝒙∗ disattenuated for measurement error by dividing the raw correlation coefficient 𝝆𝝆𝒙𝒙𝒙𝒙, by the square root of the reliabilities, as the formula below shows:
𝝆𝝆𝒙𝒙𝒙𝒙∗ = 𝝆𝝆𝒙𝒙𝒙𝒙�𝒓𝒓𝒙𝒙𝒓𝒓𝒙𝒙
28 A detailed report and analysis of the reliability of observation scores is forthcoming.
Analytic Memo: Evaluation Data from the First Year of REACH 32
About the Authors
Jennie Y. Jiang Jennie Y. Jiang is a Research Analyst at UChicago CCSR. She is currently working on an evaluation of the Urban Teacher Education Program (UChicago UTEP) in addition to her work on teacher evaluation. Previously, she was a teacher in both Chicago Public Schools and in Shenzhen, China. She earned an MPP in public policy at the University of Chicago and an MS in education at Northwestern University. Jiang’s research interests include teacher preparation, quality and support, school leadership and school choice.
Susan E. Sporte Susan E. Sporte is Director for of Research Operations at UChicago CCSR. Her current research focuses on teacher preparation, measuring effective teaching, and schools as organizations. She serves as main point of contact with Chicago Public Schools regarding data sharing and research priorities; she also oversees UChicago CCSR’s data archive. Sporte received a BS in mathematics from Michigan State University, an MA in mathematics from the University of Illinois at Springfield, and an EdM and EdD in administration, planning, and social policy from the Harvard Graduate School of Education.
Stuart Luppescu Stuart Luppescu is Chief Psychometrician at UChicago CCSR, specializing in educational measurement. He received a BA and an MA in linguistics from Cornell, an MA in English as a second language from the University of Hawaii, and a PhD in educational measurement from the University of Chicago. Before coming to Chicago, Luppescu taught English in Japan and Hawaii for 13 years. His research interests include language acquisition, Rasch Measurement, and multi-level modeling of achievement data.
This report reflects the interpretation of the authors. Although UChicago CCSR’s Steering Committee provided technical advice, no formal endorsement by these individuals, organizations, or the full Consortium should be assumed.
Analytic Memo: Evaluation Data from the First Year of REACH 33

Consortium on Chicago School Research
Directors ELAINE M. ALLENSWORTH Lewis-Sebring Director EMILY KRONE Director for Outreach and Communication JENNY NAGAOKA Deputy Director MELISSA RODERICK Senior Director Hermon Dunlap Smith Professor School of Social Service Administration PENNY BENDER SEBRING Founding Director SUE SPORTE Director for Research Operations MARISA DE LA TORRE Director for Internal Research Capacity
Steering Committee KATHLEEN ST. LOUIS CALIENTO Co-Chair Spark, Chicago
KIM ZALENT Co-Chair Business and Professional People for the Public Interest
Ex-Officio Members TIMOTHY KNOWLES Urban Education Institute Institutional Members JOHN R. BARKER Chicago Public Schools CLARICE BERRY Chicago Principals and Administrators Association AARTI DHUPELIA Chicago Public Schools CHRISTOPHER KOCH Illinois State Board of Education KAREN G.J. LEWIS Chicago Teachers Union SHERRY J. ULERY Chicago Public Schools
Analytic Memo: Evaluation Data from the First Year of REACH 34

Individual Members VERONICA ANDERSON Communications Consultant JOANNA BROWN Logan Square Neighborhood Association CATHERINE DEUTSCH Illinois Network of Charter Schools RAQUEL FARMER-HINTON University of Wisconsin, Milwaukee KIRABO JACKSON Northwestern University CHRIS JONES Stephen T. Mather High School DENNIS LACEWELL Urban Prep Charter Academy for Young Men LILA LEFF Umoja Student Development Corporation RUANDA GARTH MCCULLOUGH Loyola University, Chicago LUISIANA MELÉNDEZ Erikson Institute CRISTINA PACIONE-ZAYAS Latino Policy Forum PAIGE PONDER One Million Degrees LUIS R. SORIA Chicago Public Schools BRIAN SPITTLE DePaul University
MATTHEW STAGNER Mathematica Policy Research AMY TREADWELL Chicago New Teacher Center ERIN UNANDER Al Raby High School ARIE J. VAN DER PLOEG American Institutes for Research (Retired)
Analytic Memo: Evaluation Data from the First Year of REACH 35

Our Mission
The University of Chicago Consortium on Chicago School Research (UChicago CCSR) conducts research of high technical quality that can inform and assess policy and practice in the Chicago Public Schools. We seek to expand communication among researchers, policymakers, and practitioners as we support the search for solutions to the problems of school reform. Chicago CCSR encourages the use of research in policy action and improvement of practice, but does not argue for particular policies or programs. Rather, we help to build capacity for school reform by identifying what matters for student success and school improvement, creating critical indicators to chart progress, and conducting theory-driven evaluation to identify how programs and policies are working.
Analytic Memo: Evaluation Data from the First Year of REACH 36


![OSEP RTI/Evaluation Memo 01 21 11[1]](https://img.dokumen.tips/doc/110x75/55d331adbb61eb29468b4785/osep-rtievaluation-memo-01-21-111.jpg)