Embed Size (px)
Citation preview

Dassault SystèmesAnalysts Meeting Q1 2010
Bernard Charles, President and CEO Thibault de Tersant, Senior EVP and CFO
“Q1 2010: a Defining Moment.”

Forward Looking Information
Statements herein that are not historical facts but express expectations or objectives for the future, including but not limited to statements regarding the Company’s non-IFRS financial performance objectives, are forward-looking statements.
Such forward-looking statements are based on DS management's current views and assumptions and involve known and unknown risks and uncertainties. Actual results or performances may differ materially from those in such statements due to a range of factors. In preparing such forward-looking statements, the Company has in particular assumed an average U.S. dollar to euro exchange rate of US$1.40 per €1.00 and an average Japanese yen to euro exchange rate of JPY130 to €1.00 for 2010; however, currency values fluctuate, and the Company’s results of operations may be significantly affected by changes in exchange rates. The Company has tried to factor in the potential impact of the current global economic environment on its 2010 second quarter and full year objectives, but conditions may not improve as the Company has anticipated or could worsen. Further the
Dassault Systèmes – Q110Results – April 2010 - Page 2
year objectives, but conditions may not improve as the Company has anticipated or could worsen. Further the Company has assumed that its increased responsibility for its direct PLM sales, in particular resulting from the integration of the IBM PLM acquisition which was completed on March 31, 2010, and the resulting commercial and management challenges, will not cause it to incur substantial unanticipated costs and inefficiencies. The Company’s actual results or performance may also be materially negatively affected by the current global economic crisis, difficulties or adverse changes affecting its partners or its relationships with its partners, including the Company’s longstanding, strategic partner, IBM; new product developments and technological changes; errors or defects in its products; growth in market share by its competitors; and the realization of any risks related to the integration of IBM PLM within DS and of any newly acquired company and internal reorganizations. Unfavorable changes in any of the above or other factors described in the Company’s regulatory reports, including the Document de référence, as filed with the French “Autorité des marchés financiers” (AMF) on April 1, 2010, could materially affect the Company’s financial position or results of operations.

Non-IFRS Financial Information & Information in Constant Currencies
Readers are cautioned that the supplemental non-IFRS (previously referred to as “adjusted IFRS”) information presented in this press release is subject to inherent limitations. It is not based on any comprehensive set of accounting rules or principles and should not be considered as a substitute for IFRS measurements. Also, the Company’s supplemental non-IFRS financial information may not be comparable to similarly titled non-IFRS measures used by other companies. Further specific limitations for individual non-IFRS measures, and the reasons for presenting non-IFRS financial information, are set forth in the Company’s annual report for the year ended December 31, 2009 included in the Company’s 2009 Document de référence filed with the AMF on April 1, 2010. In the tables accompanying this press release the Company sets forth its supplemental non-IFRS figures for revenue, operating income, operating margin, net income and diluted earnings per share, which exclude the effect of adjusting the carrying value of acquired companies’ deferred revenue, stock-based compensation
Dassault Systèmes – Q110Results – April 2010 - Page 3
effect of adjusting the carrying value of acquired companies’ deferred revenue, stock-based compensation expense, the expenses for the amortization of acquired intangible assets and other income and expense, net (in each case, as explained respectively in the Company’s 2009 Document de référence filed with the AMF on April 1, 2010) and all adjustments to IFRS income data reflect the combined effect of these adjustments, plus with respect to net income and diluted net income per share, the income tax effect of the non-IFRS adjustments and the exclusion of certain one-time tax restructuring effects in 2009. The tables also set forth the most comparable IFRS financial measure and reconciliations of this information with non-IFRS information.
When the Company believes it would be helpful for understanding trends in its business, the Company provides percentage increases or decreases in its revenue (in both IFRS as well as non-IFRS) to eliminate the effect of changes in currency values, particularly the U.S. dollar and the Japanese yen, relative to the euro. When trend information is expressed herein "in constant currencies", the results of the "current" period have first been recalculated using the average exchange rates of the comparable period in the preceding year, and then compared with the results of the comparable period in the preceding year.

A Defining Moment for DS
An important milestone in DS history with the IBM PLM integration
A well executed first quarter
Showing DS strengths for the
Dassault Systèmes – Q110Results – April 2010 - Page 4
Showing DS strengths for the years to come
Updating FY objectives for currency, raising EPS to +18-23%

Agenda
1. Q1 2010 Business Highlights
2. Q1 2010 Financial Highlights
3. Q2 2010 & FY 2010 Objectives
4. Financial Information Appendix
Dassault Systèmes – Q110Results – April 2010 - Page 5

Q1 2010 Business HighlightsQ1 10
Revenue (€m) 312.0
Growth +0.4%
Growth ex FX +1%
Operating Margin 22.1%
Operating Margin Growth +2.7 pts
Non-IFRS*
Dassault Systèmes – Q110Results – April 2010 - Page 6
EPS 0.43
EPS Growth +16%
• Revenue slightly above high-end of guidance at guidance currency rates
• New licenses revenue growth:+19% ex fx
• Good execution on IBM PLM closing with no related disruption in Q1
• With a modest revenue growth delivering operating margin expansionand strong EPS growth
•For a reconciliation to IFRS financial information, please refer to the tables in the Appendix

Q1 2010 Business HighlightsNon-IFRS*
208.2 203.7
100
150
200
250
In M
illio
ns
€
64.6
76.1
20
40
60
80
In M
illio
ns
€
Periodic Licenses, Maintenance and Product Development Revenue
New Licenses Revenue
+17.8%+19% ex FX
-2.2% -1% ex FX
Dassault Systèmes – Q110Results – April 2010 - Page 7
• Good new licenses revenue growth across brands & sales channels
• Progressive economic recovery
• As expected, slight decrease of recurring revenue
0
50
1Q09 1Q10
0
20
1Q09 1Q10
* In accordance to IFRS, New licenses revenue was €64.6 in 1Q09 and €76.1m in 1Q10. In accordance with IFRS, Periodic licenses, Maintenance and Product development revenue was €207.2m in 1Q09 and €203.6m in 1Q10.

Non-IFRS*
Q110
PLM +4%
CATIA +4%
ENOVIA +8%
Mainstream 3D +1%
Software revenue growth ex FX by product line
Q1 2010 Business Highlights
1Q 2010
39%
11%17%
23%
10%
Dassault Systèmes – Q110Results – April 2010 - Page 8
*For a reconciliation to IFRS financial information, please refer to the tables in the Appendix
Mainstream 3D +1%
Total +3%
• Good new licenses revenue growth
• ENOVIA showing +29% new licenses revenue growth

Q1 2010 Business Highlights
1. Version 6
2. High-Tech industry
3. IBM PLM closing
4. Sales channels capacities
Dassault Systèmes – Q110Results – April 2010 - Page 9
4. Sales channels capacities

Relevance and Differentiation
Key features & differentiators Online
Single PLM Platform to experiment, design, simulate, produce and collaborate
Business value for customersEnabler for collaboration across disciplines and localizations
1- Version 6
Dassault Systèmes – Q110Results – April 2010 - Page 10
Enabler for collaboration across disciplines and localizations
Easy to use
Lower cost of ownership
“In the coming years, we will develop collaborative engineering. The partnership with Dassault Systèmes will contribute to this strategy. We chose the V6 platform because its integrated PLM environment brings our global teams together through real-time collaboration and online-enabled design anywhere,” said Odile Desforges, EVP engineering and quality, Renault.

Meyer Werft Selecting V6
Context:Leading cruise liner shipyard
2,400 employees
Headquartered in Germany
Achievement: Selecting ENOVIA V6
1-Version 6: Relevance & Differentiation
Dassault Systèmes – Q110Results – April 2010 - Page 11
Selecting ENOVIA V6
Migrating to CATIA V6
“Our decision for the V6 solution was based on several key factors, including its powerful combination of 3D and PLM infrastructure, as well as IBM’s and DS’s commitment to partnership and openness” said Lambert Kruse, Managing Director, MEYER WERFT

Meyer Werft Selecting V6
Dassault Systèmes – Q110Results – April 2010 - Page 12

Optimal Energy Selecting V6
Context:Privately owned car manufacturer
Headquartered in South Africa
Number of employees: ~100
Achievement:Selected CATIA & ENOVIA V6 to build
1- Version 6: Relevance & Differentiation
Dassault Systèmes – Q110Results – April 2010 - Page 13
Selected CATIA & ENOVIA V6 to build an electric vehicle
“Everything is in the same platform and interconnected. If someone needs information on the product, there is only one place they have to go and look,” said Anton Greeff, Chief Mechanical Engineer, Optimal Energy.
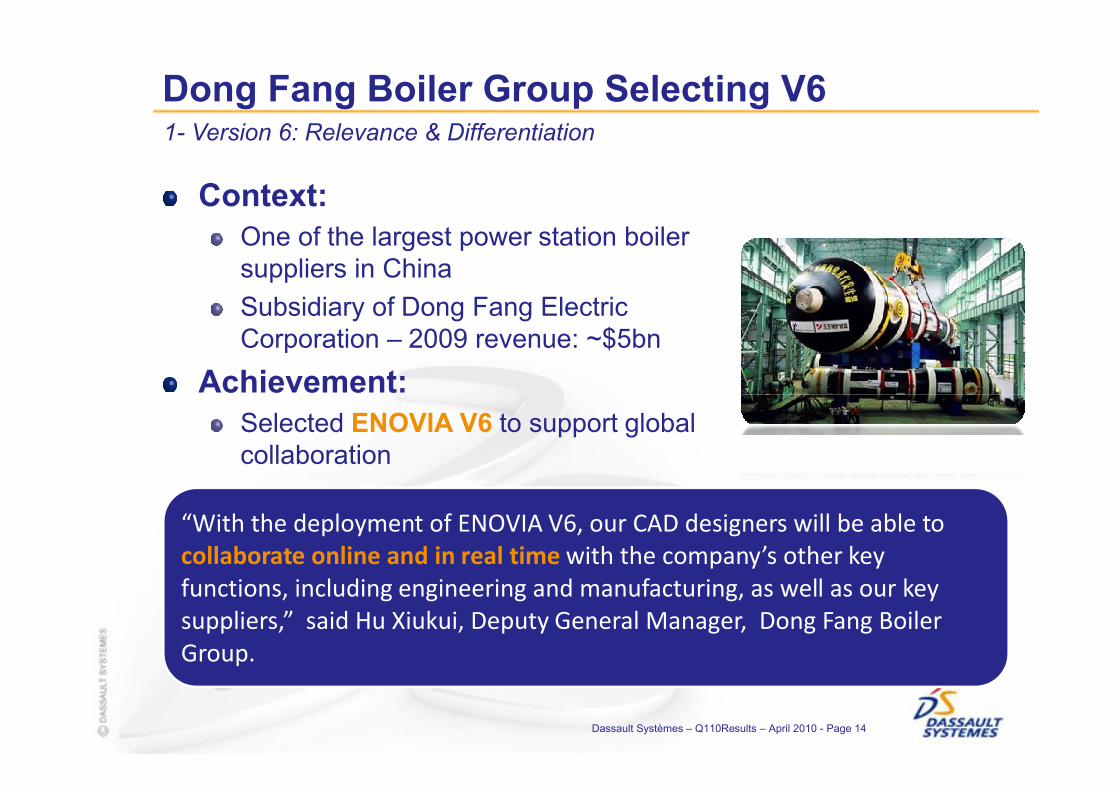
Dong Fang Boiler Group Selecting V6
Context:One of the largest power station boiler suppliers in China
Subsidiary of Dong Fang Electric Corporation – 2009 revenue: ~$5bn
Achievement:
1- Version 6: Relevance & Differentiation
Dassault Systèmes – Q110Results – April 2010 - Page 14
Achievement: Selected ENOVIA V6 to support global collaboration
“With the deployment of ENOVIA V6, our CAD designers will be able to collaborate online and in real time with the company’s other key functions, including engineering and manufacturing, as well as our key suppliers,” said Hu Xiukui, Deputy General Manager, Dong Fang Boiler Group.

A Production-Proven Collaborative Platform
Building a track-record of new V6 customers 320 new V6 customers since V6 first release (November 2008)
Partnering with leading companies in the 11 industries served
Major deals in high tech & energy in Q1 2010: ~20% new
1- Version 6
Dassault Systèmes – Q110Results – April 2010 - Page 15
Major deals in high tech & energy in Q1 2010: ~20% new licenses revenue for large accounts, ~60% of V6
Bringing solutions to manage key business processes across industries
New product development and introduction, product portfolio management, regulatory compliance, supplier relationship management …

s.Oliver Selecting V6
ContextLeading fashion & retail company headquartered in Germany
Revenue 2008: € 816 million
Achievements
1- Version 6: Building a Track-record of New V6 Customers
Dassault Systèmes – Q110Results – April 2010 - Page 16
Selected ENOVIA V6 Apparel Accelerators (Design & Developmentand Sourcing & Production) to improve quality and reduce costs

Charles Vögele Group Selecting V6
Context:One of Europe’s leading vertical fashion companies
Headquartered in Switzerland
2009 sales: CHF 1.5 billion
Number of employees: ~7,800
DE | EN
1- Version 6: Building a Track-record of New V6 Customers
Dassault Systèmes – Q110Results – April 2010 - Page 17
Number of employees: ~7,800
Achievement:Selected ENOVIA V6
Apparel Accelerators for Design & Development and Sourcing & Production
www.charles-voegele.com
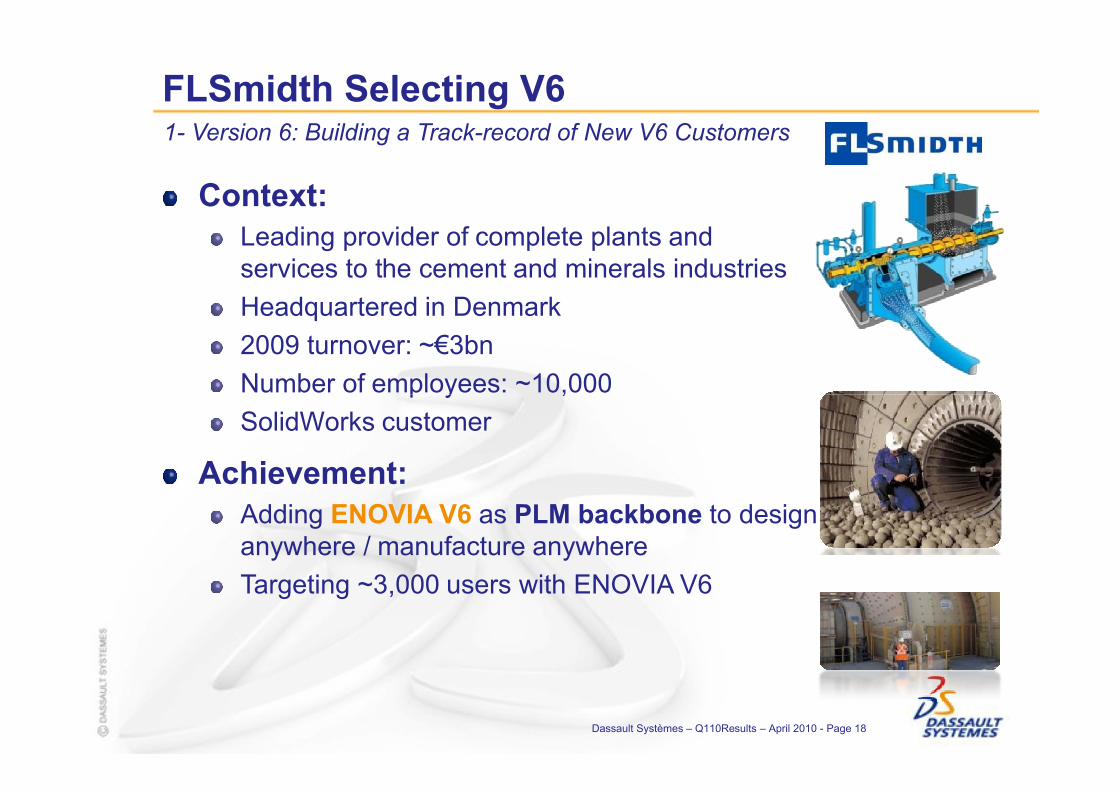
FLSmidth Selecting V6
Context:Leading provider of complete plants and services to the cement and minerals industries
Headquartered in Denmark
2009 turnover: ~€3bn
Number of employees: ~10,000
1- Version 6: Building a Track-record of New V6 Customers
Dassault Systèmes – Q110Results – April 2010 - Page 18
Number of employees: ~10,000
SolidWorks customer
Achievement:Adding ENOVIA V6 as PLM backbone to design anywhere / manufacture anywhere
Targeting ~3,000 users with ENOVIA V6

Increasing DS Penetration in High Tech
An important market2nd largest PLM Market after Auto (~20% PLM market)
Pervasive in all industries
DS already well present in High-TechDS largest new industry with ~9% of 2009 DS end-user revenue
De facto standard for semiconductor companies with
2- High Tech Industry
Dassault Systèmes – Q110Results – April 2010 - Page 19
De facto standard for semiconductor companies with ENOVIA Synchronicity
More than 25 leading global consumer electronic manufacturers using DS solutions
High tech customers facing tough challengesIntense competition
Pace of technologies players need to form alliances
Complex value chain
Increasing DS Penetration in High-Tech
Challenges driving customers processes transformation
Portfolio management
Collaborative systems engineering
Compliance and sustainable development
Component supplier management
Bringing industry-solution approach with
2- High Tech Industry
Dassault Systèmes – Q110Results – April 2010 - Page 20
Bringing industry-solution approach with largest portfolio of PLM industry
ENOVIA based solutions for collaboration
CATIA/CATIA Systems for product design and system engineering
DELMIA for digital manufacturing
SIMULIA for realistic simulation
3DVIA for online consumer experience

Successfully completing IBM PLM acquisitionClosing transaction in 27 countries exactly on time
Very high level of former IBM PLM employees satisfaction
Strong execution and focus on customers no disruption in Q1
The right acquisition at the right timeIntegrated sales force to sell integrated V6
Successfully Closing IBM PLM Acquisition 3- IBM PLM Closing
Dassault Systèmes – Q110 Results – April 2010 - Page 21
Serving customers better Direct access to DS for software sales while benefiting from partnership with IBM for services, financing, middleware
Leveraging partnership with IBM thru signature of a Global Alliance
Model enabling IBM to bring their deployment expertise in a large set of industries

Maintaining Sales Capacities4- Sales Channels Capacity
Increased number of resellers in indirect channels (Value Selling & Professional channels)
Number of resellers: ~+7% compared to December 2008
Combined DS & IBM sales force capacity kept unchanged
Dassault Systèmes – Q110 Results – April 2010 - Page 22
Sales force maintained within IBM PLM and DS now combined, which enables:
large accounts coverage increase
broadening to the full DS PLM portfolio for accounts managers
Agenda
1. Q1 2010 Business Highlights
2. Q1 2010 Financial Highlights
3. Q2 2010 & FY 2010 Objectives
4. Financial Information Appendix
Dassault Systèmes – Q110Results – April 2010 - Page 23

Q1 2010 Business HighlightsNon-IFRS*
208.2 203.7
100
150
200
250
In M
illio
ns
€
64.6
76.1
20
40
60
80
In M
illio
ns
€
Periodic Licenses, Maintenance and Product Development Revenue
New Licenses Revenue
+17.8%+19% ex FX
-2.2% -1% ex FX
Dassault Systèmes – Q110Results – April 2010 - Page 24
• Good new licenses revenue growth across brands & sales channels
• Progressive economic recovery
• As expected, slight decrease of recurring revenue
0
50
1Q09 1Q10
0
20
1Q09 1Q10
* In accordance to IFRS, New licenses revenue was €64.6 in 1Q09 and €76.1m in 1Q10. In accordance with IFRS, Periodic licenses, Maintenance and Product development revenue was €207.2m in 1Q09 and €203.6m in 1Q10.

150
200
250
300
Software Recurring Revenue EvolutionNon-IFRS*
% of Software Revenue
(€m)
73%76%
Dassault Systèmes – Q110 Results – April, 2010- Page 25
0
50
100
1Q09 1Q10
Recurring Non Recurring
* For a reconciliation to IFRS financial information, please refer to the tables in the Appendix.
NB: Recurring software revenue excludes product development
Recurring software revenue non-IFRS ex FX growth of -1% in 1Q10
27%24%

5,372 5,264
2,000
4,000
6,000
9,070 9,843
5,000
10,000
15,000
Price & Units Evolution – SolidWorks
ASP (€)Number of Units
+9%
-2.0% +0% ex FX
Dassault Systèmes – Q110Results – April 2010 - Page 26
0
1Q09 1Q10
Price per seat Price per seat ex FX
0
1Q09 1Q10
• Double-digit seats growth in North America, Asia Pacific and Japan
• Good customer interest in broad solution set (PDM Enterprise, simulation, product documentation in combination with SolidWorks)
• Maintaining price point reflecting business value
Note: assuming a 45% average VAR margin
* SolidWorks seats excluding add-on products
* *

Non-IFRS*
Q110
Americas -0%
Europe +2%
Asia +1%
Revenue growth ex FX by region
Q1 2010 Business Highlights
1Q 2010
30%
45%
25%
Dassault Systèmes – Q110Results – April 2010 - Page 27
*For a reconciliation to IFRS financial information, please refer to the tables in the Appendix•Note: Ex FX data for Europe assumes that all the revenue in Europe is recognized in € and in GBP
Asia +1%
Total +1%
• Double-digit new licenses revenue growth in all regions

Service Revenue and Margin EvolutionNon-IFRS*
37.9
32.2
10
15
20
25
30
35
40
In M
illio
ns
€
Services Revenue
-15% -14% ex FX
Dassault Systèmes – Q110 Results – April, 2010- Page 28
* For a reconciliation to IFRS financial information, please refer to the tables in the Appendix.
• As expected Q1 10 services revenue impacted by lower level of new software business throughout 2009
0
5
10
1Q09 1Q10
Service Gross Margin 0.3% -5.9%

Operating Income & EPS EvolutionNon-IFRS*
60.4
69.1
20
40
60
80In
Mil
lio
ns
€
Operating Income
0.37
0.43
0.20
0.30
0.40
0.50
€
EPS Growth
+16.2%
+14.4%
Dassault Systèmes – Q110 Results – April, 2010- Page 29
* For a reconciliation to IFRS financial information, please refer to the tables in the Appendix.
• Operating margin and EPS above objectives
• Operating margin expansion driven by continued attention to cost control
• EPS growth driven by margin expansion, positive financial results and positive impact of currencies
0
1Q09 1Q10
Operating Margin 19.4% 22.1%
0.00
0.10
1Q09 1Q10

Change in Net Financial PositionIFRS
Net cash provided by operating activities = €133m
858
+38+20
+75
-7
+40
800
900
1,000
1,100
Dassault Systèmes – Q110 Results – April, 2010- Page 30
Note: Net financial position is defined as Cash and Cash Equivalents + Short Term Investments – Total Debt
704-321
+1+40
500
600
700
Net Financial Position FY
2009
Net Income Non cash P&L items
Change in working capital
Capital expenditure
IBM PLM Acquisition
Other FX Impact Net Financial Position Q1
2010

Agenda
1. Q1 2010 Business Highlights
2. Q1 2010 Financial Highlights
3. Q2 2010 & FY 2010 Objectives
4. Financial Information Appendix
Dassault Systèmes – Q110Results – April 2010 - Page 31
Dedicated to Prepare Multi-Year Growth Pattern
Solid Drivers for the Years to Come
Version 6 to become an important driver of DS growth
Increased adoption of PLM 2.0 across new industries
On-going 2D to 3D migration
Solid sales channels well-positioned on their respective
Dassault Systèmes – Q110Results – April 2010 - Page 32
Solid sales channels well-positioned on their respective markets
Financial model with inherent leverage to drive higher returns
Strong balance sheet

Guidance evolution – February to April
Revenue (€m) EPS (€)
2.20
2.25
2.30
2.35
2.40
2.45
2.50
2.19 - 2.28+0.101,420.0
1,440.0
1,460.0
1,480.0
1,500.0
1,455 - 1,475
+40
Dassault Systèmes – Q110 Results – April, 2010- Page 33
2.00
2.05
2.10
2.15
Initial Obj. FX New Obj.
2.09 - 2.19
+0.10
Mid-range 1,425 1,425 1,465 Mid-range 2.14 2.24
1,380.0
1,400.0
1,420.0
Initial Obj. New Range FX New Obj.
1,410 - 1,440 1,415 - 1,435
ex FXGrowth
+15-17% +15-17%+15-17%
Growth +12-18% +18-23%
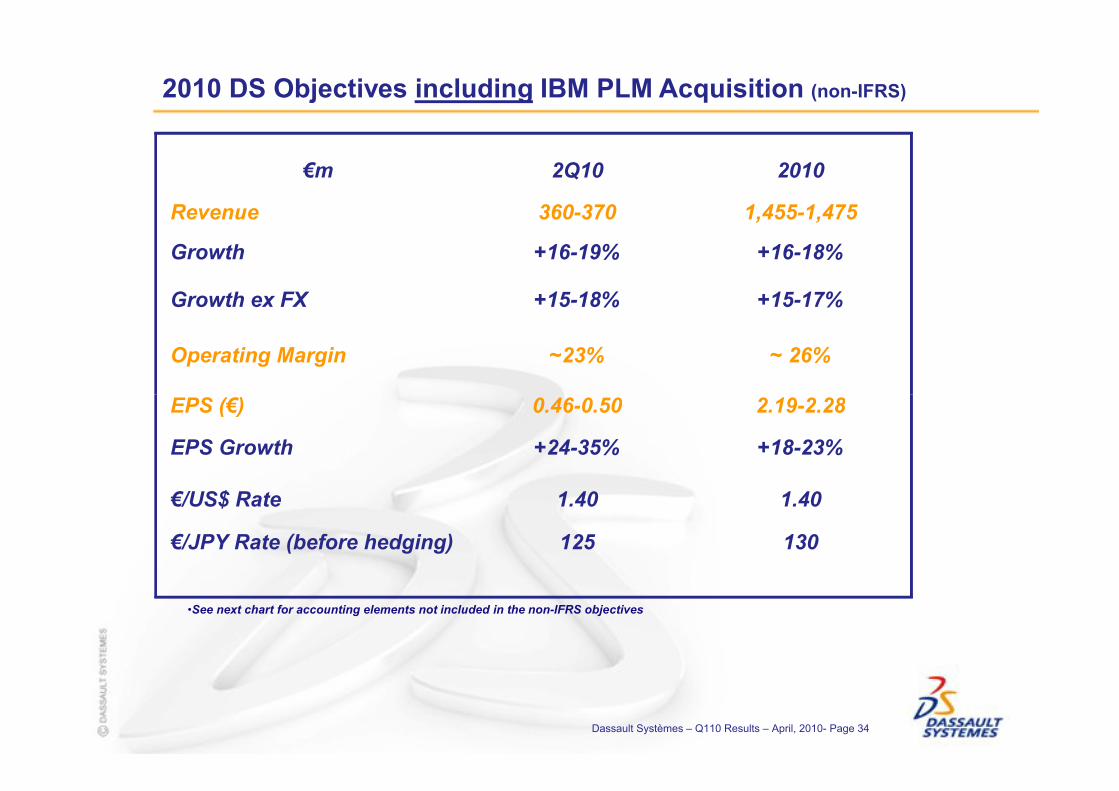
2010 DS Objectives including IBM PLM Acquisition (non-IFRS)
€m 2Q10 2010
Revenue 360-370 1,455-1,475
Growth +16-19% +16-18%
Growth ex FX +15-18% +15-17%
Operating Margin ~23% ~ 26%
EPS (€) 0.46-0.50 2.19-2.28
Dassault Systèmes – Q110 Results – April, 2010- Page 34
•See next chart for accounting elements not included in the non-IFRS objectives
EPS (€) 0.46-0.50 2.19-2.28
EPS Growth +24-35% +18-23%
€/US$ Rate 1.40 1.40
€/JPY Rate (before hedging) 125 130

Accounting elements not included in the non-IFRS 2010 Objectives
FY 2010 estimated deferred revenue write-down of about €40m*
FY 2010 estimated share-based compensation expenses: about €15m. As existing plans only are taken into account, there is no impact from IBM PLM.
Quarterly estimated amount of amortization of acquired intangibles: about €18m (€62m* for the FY)
Dassault Systèmes – Q110 Results – April, 2010- Page 35
about €18m (€62m* for the FY)
Other operating income and expense, netIBM PLM acquisition costs estimated at €12m
These estimates do not include the impact of new stock options or share grants, nor new acquisitions or restructuring which could take place after April 29th, 2010.
* The impacts from the IBM PLM acquisition are estimated at this point, as final accounting will be done with our Q2 results

Acquisition price & financing
Asset valuation: $600m
Deferred revenue: $140m
Paid $460m in Q1
Retirement asset liabilities to be paid by IBM to DS in Q3
Contracting a 5-year loan in JPY for ~$160m, hedging JPY risk
Closing IBM PLM Acquisition
Dassault Systèmes – Q110 Results – April 2010 - Page 36
Contracting a 5-year loan in JPY for ~$160m, hedging JPY risk (all inclusive rate: ~1%)
Historical data
IBM share of named-account software revenue by quarter (in millions of Euros)*:
* Calculation based on
Q2 2009 Q3 2009 Q4 2009 Q1 2010€ 53 € 45 € 53 € 50

Agenda
1. 2009 Business Highlights & Strategic Achievements
2. 2009 Financial Highlights
3. 2010 Objectives
4. Financial Information Appendix
Dassault Systèmes – Q110Results – April 2010 - Page 37

Revenue by RegionIFRS
Note: Ex FX data for Europe assumes that all the revenue in Europe is recognized in € and £
in €m1Q10 1Q09 Growth
Growthex FX
Americas 91.7 97.4 -6% -0%
Europe 140.9 137.6 +2% +2%
Asia 79.3 74.7 +6% +2%
Total Revenue 311.9 309.7 +1% +1%
Dassault Systèmes – Q110 Results – April, 2010- Page 38
1Q 2010 1Q 2009
Americas Europe Asia
32%
44%
24%30%
45%
25%

Revenue by RegionNon-IFRS*
Note: Ex FX data for Europe assumes that all the revenue in Europe is recognized in € and £
in €m1Q10 1Q09 Growth
Growthex FX
Americas 91.8 97.8 -6% -0%
Europe 140.9 137.7 +2% +2%
Asia 79.3 75.2 +5% +1%
Total Revenue 312.0 310.7 +0% +1%
Dassault Systèmes – Q110 Results – April, 2010- Page 39
* For a reconciliation to IFRS financial information, please refer to the tables in the Appendix.
1Q 2010 1Q 2009
Americas Europe Asia
32%
44%
24%30%
45%
25%

Revenue by Product LineIFRS
in €m1Q10 1Q09 Growth
Growthex FX
PLM SW 208.8 200.7 +4% +4%CATIA SW 120.7 116.5 +4% +4%ENOVIA SW 36.2 34.1 +6% +8%Other PLM SW 51.9 50.1 +4% +4%
Mainstream 3D SW 70.9 71.1 -0% +1%Services 32.2 37.9 -15% -14%
Total Revenue 311.9 309.7 +1% +1%
Dassault Systèmes – Q110 Results – April, 2010- Page 40
1Q 2010 1Q 2009
CATIA SW ENOVIA SW Other PLM SW Mainstream 3D SW Services
39%
11%17%
23%
10%
38%
11%16%
23%
12%

Revenue by Product LineNon-IFRS*
in €m1Q10 1Q09 Growth
Growthex FX
PLM SW 208.9 201.7 +4% +4%CATIA SW 120.7 116.5 +4% +4%ENOVIA SW 36.2 34.1 +6% +8%Other PLM SW 52.0 51.1 +2% +2%
Mainstream 3D SW 70.9 71.1 -0% +1%Services 32.2 37.9 -15% -14%
Total Revenue 312.0 310.7 +0% +1%
Dassault Systèmes – Q110 Results – April, 2010- Page 41
* For a reconciliation to IFRS financial information, please refer to the tables in the Appendix.
1Q 2010 1Q 2009
CATIA SW ENOVIA SW Other PLM SW Mainstream 3D SW Services
39%
11%17%
23%
10%
38%
11%16%
23%
12%

IFRS P&L(In millions of €, except per share data) Three months ended March
2010 2009 y/y
Software revenue 279.7 271.8 +2.9%New licenses 76.1 64.6 +17.8%Product development 0.0 1.2 N/SPeriodic licenses and Maintenance 203.6 206.0 (1.2%)
Service and other revenue 32.2 37.9 (15.0%)Total revenue 311.9 309.7 +0.7%
Cost of Software revenue (16.4) (14.0) +17.1%Cost of Service and other revenue (34.3) (37.9) (9.5%)Research and development (77.4) (82.1) (5.7%)Marketing and sales (92.1) (93.9) (1.9%)
Dassault Systèmes – Q110 Results – April, 2010- Page 42
Marketing and sales (92.1) (93.9) (1.9%)General and administrative (27.5) (28.8) (4.5%)Amortization of acquired intangibles (9.7) (10.7) (9.3%)Other operating income and expense, net (5.0) (2.1) +138.1%
Total operating expenses (262.4) (269.5) (2.6%)
Operating income 49.5 40.2 +23.1%Financial revenue and other, net 5.7 0.3 N/SIncome before income taxes 55.2 40.5 +36.3%Income tax expense (17.4) (11.7) +48.7%
Minority Interest 0.0 0.0 +0.0%
Net Income (to equity holders of the parent) 37.8 28.8 +31.3%
Diluted net income per share (EPS) 0.32 0.24 +33.3%Average shares (Million) 119.8 118.3

IFRS P&L (%)Three months ended March
2010 2009
% of revenue
Software revenue 89.7% 87.8%New licenses 24.4% 20.9%Product development 0.0% 0.4%Periodic licenses and Maintenance 65.3% 66.5%
Service and other revenue 10.3% 12.2%Total revenue 100.0% 100.0%
Cost of Software revenue 5.3% 4.5%Cost of Service and other revenue 11.0% 12.2%Research and development 24.8% 26.5%
Dassault Systèmes – Q110 Results – April, 2010- Page 43
Marketing and sales 29.5% 30.3%General and administrative 8.8% 9.3%Amortization of acquired intangibles 3.1% 3.5%Other operating income and expense, net 1.6% 0.7%
Total operating expenses 84.1% 87.0%
Operating income 15.9% 13.0%Financial revenue and other, net 1.8% 0.1%Income before income taxes 17.7% 13.1%Income tax rate (% of IBIT) 31.5% 28.9%Minority Interest 0.0% 0.0%Net Income (to equity holders of the parent) 12.1% 9.3%

Non-IFRS P&L(In millions of €, except per share data) Three months ended March
2010 2009 y/y
Software revenue 279.8 272.8 +2.6%New licenses 76.1 64.6 +17.8%Product development 0.0 1.2 N/SPeriodic licenses and Maintenance 203.7 207.0 (1.6%)
Service and other revenue 32.2 37.9 (15.0%)Total revenue 312.0 310.7 +0.4%
Cost of Software revenue (16.4) (14.0) +17.1%Cost of Service and other revenue (34.1) (37.8) (9.8%)Research and development (74.6) (78.4) (4.8%)Marketing and sales (91.2) (92.7) (1.6%)
Dassault Systèmes – Q110 Results – April, 2010- Page 44
Marketing and sales (91.2) (92.7) (1.6%)General and administrative (26.6) (27.4) (2.9%)
Total operating expenses (242.9) (250.3) (3.0%)
Operating income 69.1 60.4 +14.4%Financial revenue and other, net 5.7 0.3 n/aIncome before income taxes 74.8 60.7 +23.2%Income tax expense (23.5) (17.3) +35.8%Minority Interest 0.0 0.0 +0.0%Net Income (to equity holders of the parent) 51.3 43.4 +18.2%
Diluted net income per share (EPS) 0.43 0.37 +16.2%Average shares (Million) 119.8 118.3
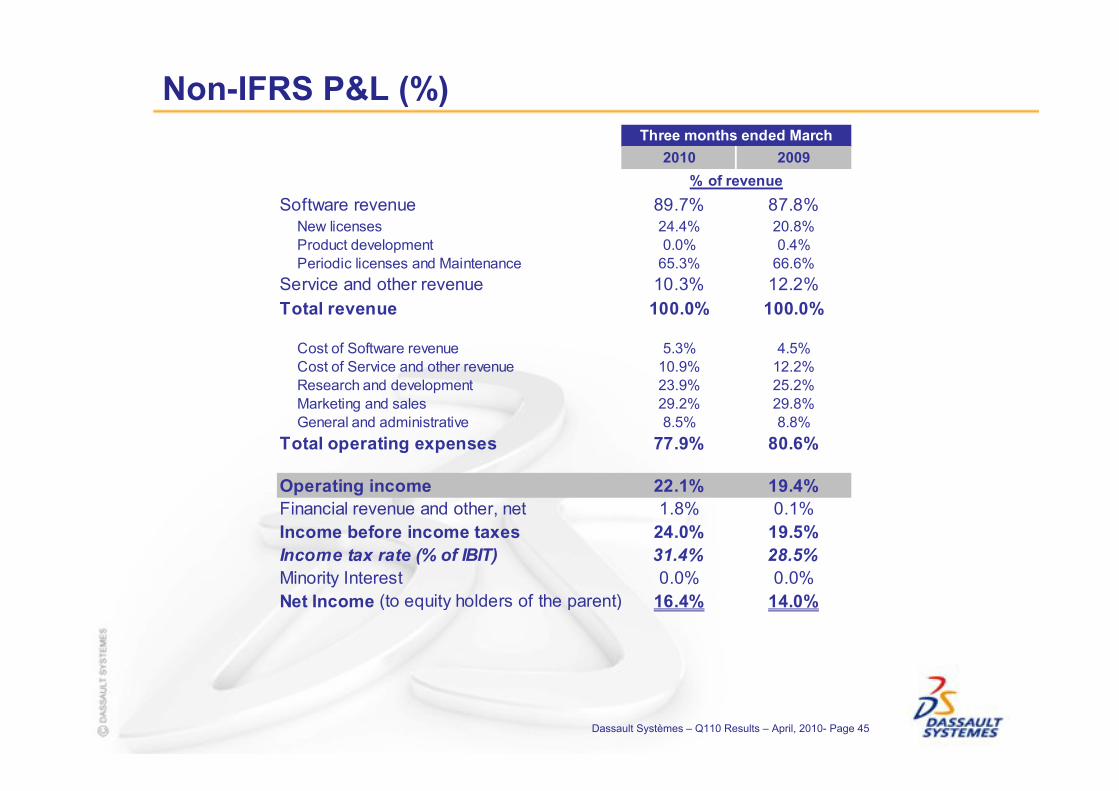
Non-IFRS P&L (%)Three months ended March
2010 2009
% of revenue
Software revenue 89.7% 87.8%New licenses 24.4% 20.8%Product development 0.0% 0.4%Periodic licenses and Maintenance 65.3% 66.6%
Service and other revenue 10.3% 12.2%Total revenue 100.0% 100.0%
Cost of Software revenue 5.3% 4.5%Cost of Service and other revenue 10.9% 12.2%Research and development 23.9% 25.2%
Dassault Systèmes – Q110 Results – April, 2010- Page 45
Marketing and sales 29.2% 29.8%General and administrative 8.5% 8.8%
Total operating expenses 77.9% 80.6%
Operating income 22.1% 19.4%Financial revenue and other, net 1.8% 0.1%Income before income taxes 24.0% 19.5%Income tax rate (% of IBIT) 31.4% 28.5%Minority Interest 0.0% 0.0%Net Income (to equity holders of the parent) 16.4% 14.0%

1Q10 IFRS – non-IFRS ReconciliationRevenue and Gross margin
(€ million, except % and per share data)
2010 IFRSAdjustment
(1)2010
non-IFRS2009 IFRS
Adjustment(1)
2009 non-IFRS
IFRSNon-IFRS
(2)
TOTAL REVENUE 311.9 0.1 312.0 309.7 1.0 310.7 +0.7% +0.4%
Total Revenue breakdown by activitySoftware revenue 279.7 0.1 279.8 271.8 1.0 272.8 +2.9% +2.6%
New Licenses revenue 76.1 64.6 +17.8%Product Development 0.0 1.2 Periodic and Maintenance revenue 203.6 0.1 203.7 206.0 1.0 207.0 (1.2%) (1.6%)Recurring portion of Software revenue 73% 73% 76% 76%
Service and other revenue 32.2 37.9 (15.0%)
Total Revenue breakdown by segmentPLM SW revenue 208.8 0.1 208.9 200.7 1.0 201.7 +4.0% +3.6%
of which CATIA SW revenue 120.7 116.5 +3.6%
Increase (Decrease)Three months ended March 31,
Dassault Systèmes – Q110 Results – April, 2010- Page 46
(1) In the reconciliation schedule above, (i) all adjustments to IFRS revenue data reflect the exclusion of the deferred revenue adjustment of acquiredcompanies; (ii) adjustments to IFRS operating expenses data reflect the exclusion of the amortization of acquired intangibles, share basedcompensation expense, and other operating income and expense, and (iii) all adjustments to IFRS income data reflect the combined effect ofthese adjustments, plus with respect to net income and diluted net income per share, the income tax effect of the non IFRS adjustments .
(2) The non-IFRS percentage increase (decrease) compares non-IFRS measures for the two different periods. In the event there is a non-IFRSadjustment to the relevant measure for only one of the periods under comparison, the non-IFRS increase (decrease) compares the non-IFRSmeasure to the relevant IFRS measure.
* No amortization of acquired intangibles is included in Software Gross margin calculation
of which CATIA SW revenue 120.7 116.5 +3.6%of which ENOVIA SW revenue 36.2 34.1 +6.2%
Mainstream 3D SW revenue 70.9 71.1 (0.3%)
Service and other revenue 32.2 37.9 (15.0%)
Total Revenue breakdown by geographyAmericas revenue 91.7 0.1 91.8 97.4 0.4 97.8 (5.9%) (6.1%)Europe revenue 140.9 137.6 0.1 137.7 +2.4% +2.3%Asia revenue 79.3 74.7 0.5 75.2 +6.2% +5.5%
Gross Margin
Cost of Software revenue (16.4) (14.0) +17.1%Software Gross margin* 94.1% 94.8%
Cost of Service and other revenue (34.3) 0.2 (34.1) (37.9) 0.1 (37.8) (9.5%) (9.8%)Service Gross margin (6.5%) (5.9%) 0.0% 0.3%

1Q10 IFRS – non-IFRS ReconciliationExpenses and Earnings
(€ million, except % and per share data)
2010 IFRSAdjustment
(1)2010
non-IFRS2009 IFRS
Adjustment(1)
2009 non-IFRS
IFRSNon-IFRS
(2)
Total Operating Expenses (262.4) 19.5 (242.9) (269.5) 19.2 (250.3) (2.6%) (3.0%)
Stock-based compensation expense (4.8) 4.8 - (6.4) 6.4 - - -
Amortization of acquired intangibles (9.7) 9.7 - (10.7) 10.7 - - -
Other operating income and expense, net (5.0) 5.0 - (2.1) 2.1 - - -
Operating Income 49.5 19.6 69.1 40.2 20.2 60.4 +23.1% +14.4%
Operating Margin 15.9% 22.1% 13.0% 19.4%
Income before income taxes 55.2 19.6 74.8 40.5 20.2 60.7 +36.3% +23.2%
Income tax expense (17.4) (6.1) (23.5) (11.7) (5.6) (17.3) - -
Minority Interest 0.0 0.0 -
Increase (Decrease)Three months ended March 31,
Dassault Systèmes – Q110 Results – April, 2010- Page 47
(1) In the reconciliation schedule above, (i) all adjustments to IFRS revenue data reflect the exclusion of the deferred revenue adjustment of acquiredcompanies; (ii) adjustments to IFRS operating expenses data reflect the exclusion of the amortization of acquired intangibles, share basedcompensation expense, and other operating income and expense, and (iii) all adjustments to IFRS income data reflect the combined effect ofthese adjustments, plus with respect to net income and diluted net income per share, the income tax effect of the non IFRS adjustments .
(2) The non-IFRS percentage increase (decrease) compares non-IFRS measures for the two different periods. In the event there is a non-IFRSadjustment to the relevant measure for only one of the periods under comparison, the non-IFRS increase (decrease) compares the non-IFRSmeasure to the relevant IFRS measure.
(3) Based on a weighted average of 119.8 million diluted shares for Q1 2010 and 118.3 million diluted shares for Q1 2009.
Net Income 37.8 13.5 51.3 28.8 14.6 43.4 +31.3% +18.2%
Diluted net income per share, in € (3) 0.32 0.11 0.43 0.24 0.13 0.37 +33.3% +16.2%
(€ million)
Cost of Service and other revenue (34.3) 0.2 (34.1) (37.9) 0.1 (37.8)Research and development (77.4) 2.8 (74.6) (82.1) 3.7 (78.4)Marketing and sales (92.1) 0.9 (91.2) (93.9) 1.2 (92.7)General and administrative (27.5) 0.9 (26.6) (28.8) 1.4 (27.4)Total stock-based compensation expense 4.8 6.4
2009 IFRS2009
non-IFRS2010
non-IFRSAdjust.
Three months ended March 31,
2010 IFRS Adjust.

Exchange Rate Evolution
1Q10 1Q09 Var.
€/US$ 1.38 1.30 +6%
€/JPY 125.5 122.0 +3%
Average Exchange rates Estimated Breakdown of P&L by currency for 2010
US$ JPY
Revenue (As a % of Revenue)
34.0% 15.0%
Of which was hedged - 5%
Operating Expenses(As a % of Expenses)
40.0% 6.0%
Dassault Systèmes – Q110 Results – April, 2010- Page 48
€/US$ – 1Q10/1Q09 Variance €/JPY – 1Q10/1Q09 Variance
Average €/JPY rate +3%
Average €/US$ rate +6%

Comparing Q1 2010 with ObjectivesNon-IFRS*
€m RevenueOperating Expenses
Operating Income
Operating Margin
Non-IFRS Objectives - mid range 290.0 230.5 59.5 20.5%
Growth (%) (7%) (8%) (2%) +1.1pt
Impact of Actual Currency Rates
US$ impact (1.45 1.38) +5.0 +4.6 +0.4
Dassault Systèmes – Q110 Results – April, 2010- Page 49
JPY impact (140.0 125.5) +5.0 +1.6 +3.4Other (incl. GBP, KRW and hedging) +0.0 +0.6 -0.6
Difference of Results over objectives at actual rates +12.0 +5.6 +6.4
Non-IFRS Results 312.0 242.9 69.1 22.1%
Growth (%) +0% (3%) +14% +2.7pts
* For a reconciliation to IFRS financial information, please refer to the tables in the Appendix.
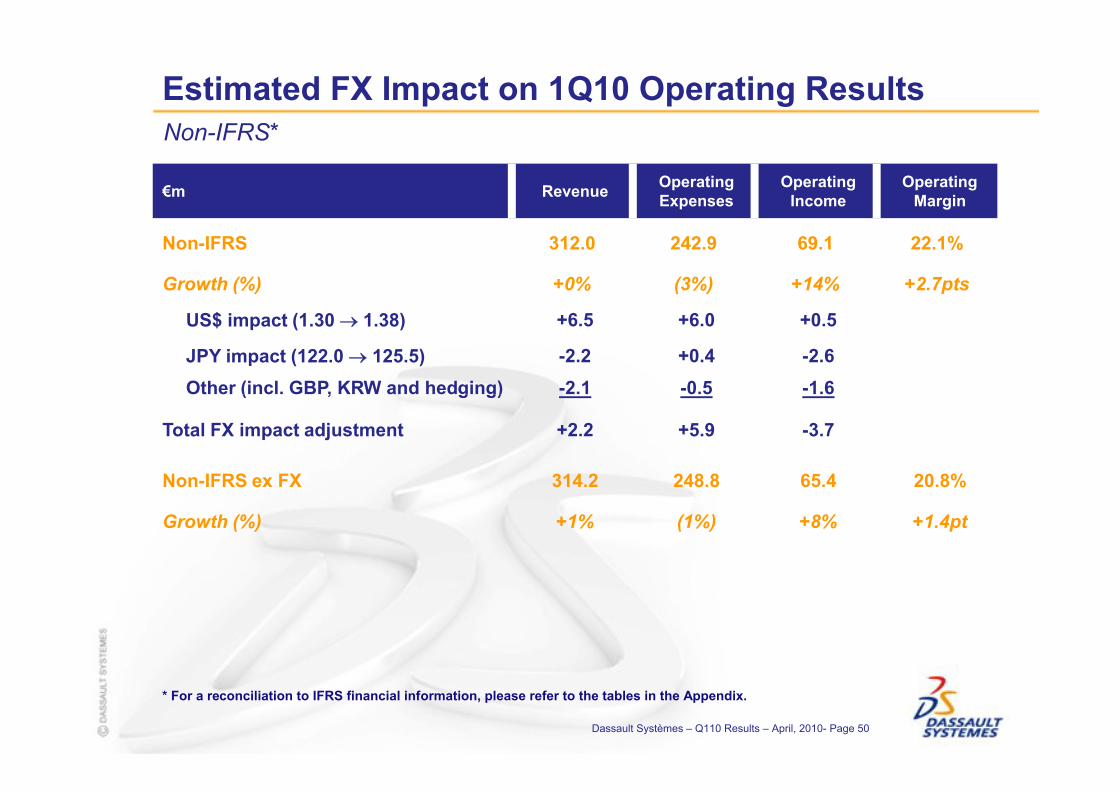
Estimated FX Impact on 1Q10 Operating ResultsNon-IFRS*
€m RevenueOperating Expenses
Operating Income
Operating Margin
Non-IFRS 312.0 242.9 69.1 22.1%
Growth (%) +0% (3%) +14% +2.7pts
US$ impact (1.30 1.38) +6.5 +6.0 +0.5
JPY impact (122.0 125.5) -2.2 +0.4 -2.6
Other (incl. GBP, KRW and hedging) -2.1 -0.5 -1.6
Dassault Systèmes – Q110 Results – April, 2010- Page 50
* For a reconciliation to IFRS financial information, please refer to the tables in the Appendix.
Other (incl. GBP, KRW and hedging) -2.1 -0.5 -1.6
Total FX impact adjustment +2.2 +5.9 -3.7
Non-IFRS ex FX 314.2 248.8 65.4 20.8%
Growth (%) +1% (1%) +8% +1.4pt

Financial Revenue and OtherIFRS
€m 1Q10 1Q09 Growth
Interest Income 1.7 3.7 (54%)
Interest Expense (1.9) (2.0) (5%)
Financial net Income (0.2) 1.7 (112%)
Exchange Gain / Loss 5.2 (1.7) (406%)
Dassault Systèmes – Q110 Results – April, 2010- Page 51
Exchange Gain / Loss 5.2 (1.7) (406%)
Other Income / Loss 0.7 0.3 133%
Total 5.7 0.3 1800%
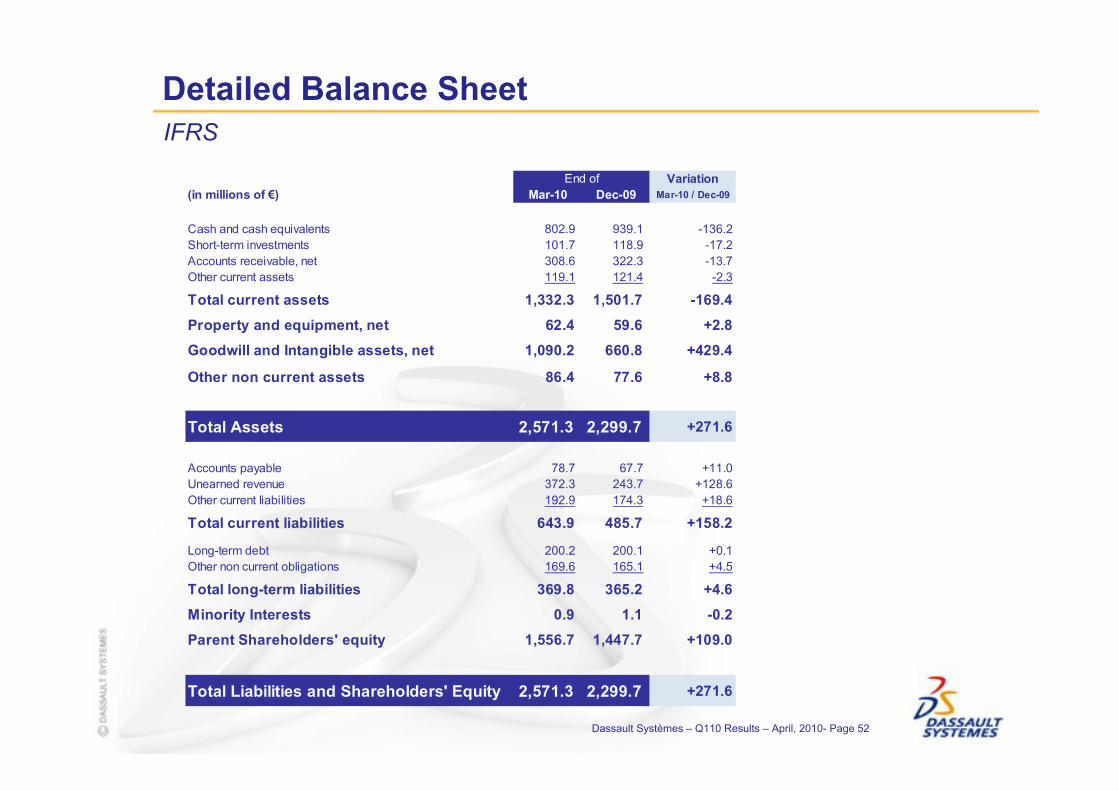
Detailed Balance SheetIFRS
End of Variation(in millions of €) Mar-10 Dec-09 Mar-10 / Dec-09
Cash and cash equivalents 802.9 939.1 -136.2Short-term investments 101.7 118.9 -17.2Accounts receivable, net 308.6 322.3 -13.7Other current assets 119.1 121.4 -2.3
Total current assets 1,332.3 1,501.7 -169.4
Property and equipment, net 62.4 59.6 +2.8
Goodwill and Intangible assets, net 1,090.2 660.8 +429.4
Other non current assets 86.4 77.6 +8.8
Dassault Systèmes – Q110 Results – April, 2010- Page 52
Total Assets 2,571.3 2,299.7 +271.6
Accounts payable 78.7 67.7 +11.0Unearned revenue 372.3 243.7 +128.6Other current liabilities 192.9 174.3 +18.6
Total current liabilities 643.9 485.7 +158.2
Long-term debt 200.2 200.1 +0.1Other non current obligations 169.6 165.1 +4.5
Total long-term liabilities 369.8 365.2 +4.6
Minority Interests 0.9 1.1 -0.2
Parent Shareholders' equity 1,556.7 1,447.7 +109.0
2,571.3 2,299.7 +271.6Total Liabilities and Shareholders' Equity

Trade Accounts Receivable / DSOIFRS
75 7679
83
7579
67
7780
7672
7883
74 7577
8378 76
8689
50
60
70
80
90
100
DAYS
Dassault Systèmes – Q110 Results – April, 2010- Page 53
Note: DSO increased +7% Y/Y.
0
10
20
30
40
1Q05 2Q05 3Q05 4Q05 1Q06 2Q06 3Q06 4Q06 1Q07 2Q07 3Q07 4Q07 1Q08 2Q08 3Q08 4Q08 1Q09 2Q09 3Q09 4Q09 1Q10

Consolidated Statement of Cash FlowsIFRS
(in millions of €) 1Q10 1Q09 Variation
Net income attributable to equity holders of the parent 37.8 28.8 +9.0Minority interest - - +0.0Net income 37.8 28.8 +9.0Depreciation and amortization of property & equipment 5.3 5.6 -0.3Amortization of intangible assets 10.7 12.1 -1.4Other non cash P&L items 4.4 (1.3) +5.7Changes in working capital 75.1 51.1 +24.0
Net Cash Provided by (Used in) Operating Activities (I) 133.3 96.3 +37.0
Acquisition of assets and equity, net of cash acquired (329.8) (6.4) -323.4Sale of fixed assets 0.2 0.2 +0.0
Dassault Systèmes – Q110 Results – April, 2010- Page 54
Sale of fixed assets 0.2 0.2 +0.0Sale (Purchase) of short-term investments, net 19.2 (0.6) +19.8Loans and others - (0.2) +0.2
Net Cash Provided by (Used in) Investing Activities (II) (310.4) (7.0) -303.4
Repayment of short term and long term debt - - +0.0Share repurchase (1.5) - -1.5Exercise of DS stock-options 2.2 0.3 +1.9Cash dividend paid - - +0.0
Net Cash Provided by (Used in) Financing Activities (III) 0.7 0.3 +0.4
40.2 18.9 +21.3
Increase (Decrease) in Cash (V) = (I)+(II)+(III)+(IV) (136.2) 108.5 -244.7
Cash and cash equivalents at Beginning of Period 939.1 794.1
Cash and cash equivalents at End of Period 802.9 902.6
Cash and cash equivalents variation (136.2) 108.5
Effect of exchange rate changes on cash and cash equivalents (IV)

Exchange rates (€/US$) Exchange rates (€/JPY)
PeriodAverage
Rate%
GrowthEnding
Rate%
Growth
2007 1.37 9.2% 1.47 11.8%2008 1.47 7.3% 1.39 (5.5%)2009 1.39 (5.2%) 1.44 3.5%
1Q10 1.38 6.1% 1.35 1.3%1Q09 1.30 (13.1%) 1.33 (15.8%)1Q08 1.50 14.4% 1.58 18.7%1Q07 1.31 9.0% 1.33 10.0%
PeriodAverage
Rate%
GrowthEnding
Rate%
Growth
2007 161.4 10.5% 164.9 5.1%2008 152.3 (5.6%) 126.1 (23.5%)2009 130.3 (14.5%) 133.2 5.6%
1Q10 125.5 2.8% 125.9 (4.0%)1Q09 122.0 (22.6%) 131.2 (16.6%)1Q08 157.7 0.8% 157.4 0.0%1Q07 156.5 11.4% 157.3 10.5%
Dassault Systèmes – Q110 Results – April, 2010- Page 55
2Q09 1.36 (12.7%) 1.41 (10.3%)2Q08 1.56 15.9% 1.58 16.7%2Q07 1.35 7.3% 1.35 7.8%
3Q09 1.43 (4.9%) 1.46 2.4%3Q08 1.50 9.4% 1.43 0.9%3Q07 1.37 7.9% 1.42 12.0%
4Q09 1.48 12.2% 1.44 3.5%4Q08 1.32 (9.1%) 1.39 (5.5%)4Q07 1.45 12.3% 1.47 11.8%
2Q09 132.6 (18.8%) 135.5 (18.6%)2Q08 163.4 0.3% 166.4 (0.1%)2Q07 162.8 13.2% 166.6 14.1%
3Q09 133.8 (17.3%) 131.1 (12.9%)3Q08 161.8 (0.1%) 150.5 (8.0%)3Q07 161.9 9.3% 163.6 9.5%
4Q09 132.7 4.9% 133.2 5.6%4Q08 126.4 (23.0%) 126.1 (23.5%)4Q07 164.3 8.2% 164.9 5.1%

Headcount
Closing Headcount – March 2010
45%47%
8%
At Closing - TOTALMar-10 Mar-09 % growth Dec-09 % growth
M&S + COR Ser 3,507 3,792 -7.5% 3,595 -2.4%
R&D + COR SW 3,650 3,584 1.8% 3,596 1.5%
G&A 649 643 0.9% 643 0.9%
Total 7,806 8,020 -2.7% 7,834 -0.4%
Dassault Systèmes – Q110 Results – April, 2010- Page 56
M&S + COR Ser
R&D + COR SW
G&A

Dassault Systèmes – Q110 Results – April 2010 - Page 57Thank You!