Embed Size (px)
Citation preview

Analyst Professional Development Seminar
NASBO Staff:
Stacey Mazer
Brian Sigritz
Kathryn White
2
www.nasbo.org
Leah Wavrunek
Lauren Cummings
Brukie Gashaw

www.nasbo.org
3

www.nasbo.org
Current Economic and Fiscal Situation for States
4

www.nasbo.org
5
State Fiscal Overview
Fiscal 2016 -- 6th consecutive annual increase in general fund spending and revenues
Most states: continued stability and slow growth▫ Less midyear cuts and budget gaps▫ Most states ended fiscal 2015 with revenues above projections or on target
Common theme in State of States of need to create jobs, grow the economy, and provide opportunity for all to succeed▫ Many said need to prioritize transportation, education, and workforce training to
achieve this goal
Some states are facing difficult budget environments due to various issues
Fiscal improvements over the last several years have not returned states to normal patterns of growth

www.nasbo.org
6
Major Challenges to State Budgets: 2016+ Revenues and spending have yet to surpass pre-recession highs
after accounting for inflation
▫ Revenue growth projected to be modest in fiscal 2016
Future economic growth
Health care costs
Pensions and retiree health care
Infrastructure
Certain states impacted by oil price declines, federal cuts, tax related issues, long-term liabilities, slow economic growth, etc.
Federal uncertainty
Debt service levels around 5%, very manageable

www.nasbo.org
Current Fiscal Situation:Indicators
7

www.nasbo.org
8
Slow Budget Growth Continues
1993
1994
1995
1996
1997
1998
1999
2000
2001
2002
2003
2004
2005
2006
2007
2008
2009
2010
2011
2012
2013
2014
2015
2016
-8
-6
-4
-2
0
2
4
6
8
10
12
General Fund Expenditure Growth (%)
%
*Average
*38-year historical average annual rate of growth is 5.5 percent *Fiscal 2015 numbers are estimated; fiscal 2016 are recommended Source: NASBO Spring 2015 Fiscal Survey of States

www.nasbo.org
9
States Direct Most New Spending to K-12 and Medicaid
K-12
Higher Ed
Public Ass
ist.
Medica
id
Correcti
ons
Transp
ortatio
n
All Other
-2
0
2
4
6
8
10
12$10.2
$2.6
$0.1
$9.2
$1.8
-$0.7
$6.4
FY 2016 Recommended General Fund Spending Changes by Category
($ in
Bill
ions
)
Source: NASBO Spring 2015 Fiscal Survey

www.nasbo.org
10
Fiscal 2015 GF Revenue Below Pre-Recession Peak After Inflation
FY 2007 FY 2008 FY 2009 FY 2010 FY 2011 FY 2012 FY 2013 FY 2014 FY 2015 FY 2016$500
$550
$600
$650
$700
$750
$800
$655$680
$626$610
$650
$669
$716$728
$755
$778$772*
General Fund Revenue: FY 2007-FY 2016
Source: NASBO Spring 2015 Fiscal Survey of States; Fiscal 2016 numbers are recommended*Aggregate revenue levels would need to total $772 billon in fiscal 2015 to be equivalent with real 2008 revenue levels.
www.nasbo.org
11
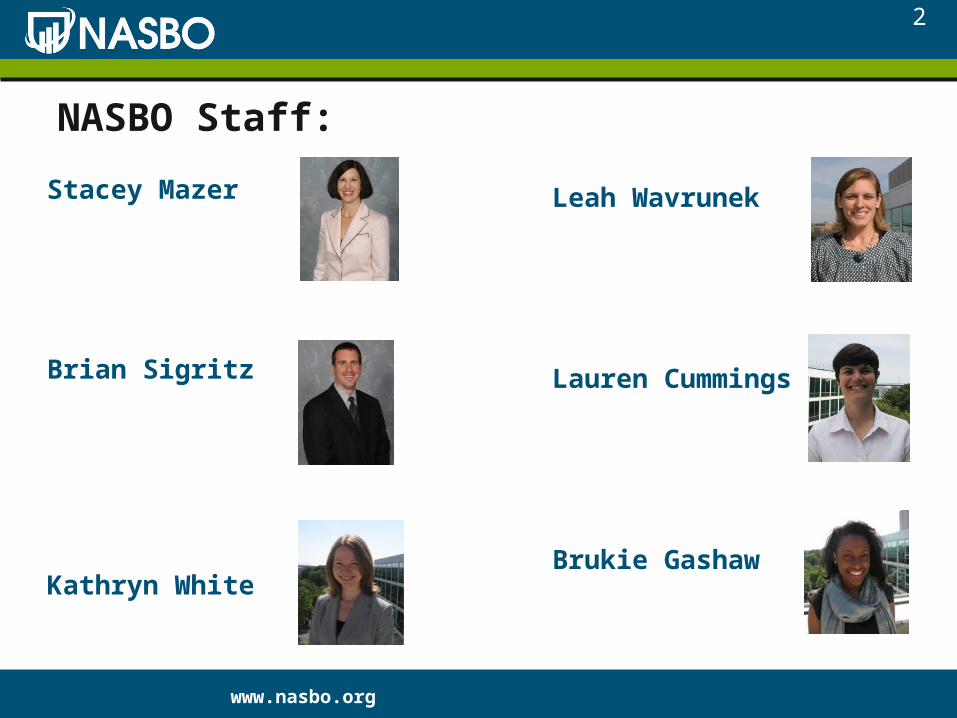
States’ Reserves Haven’t Reached Peak Levels
FY 06 FY 07 FY 08 FY 09 FY 10 FY 11 FY 12 FY 13 FY 14 FY 15 FY 160.0%
2.0%
4.0%
6.0%
8.0%
10.0%
12.0%
14.0%
11.5%
10.1%
8.6%
5.7%
5.2%
7.1%
8.4%
10.4%9.9%
8.0%
7.1%
Balances as a Percent of Expenditures

www.nasbo.org
12
1990
1991
1992
1993
1994
1995
1996
1997
1998
1999
2000
2001
2002
2003
2004
2005
2006
2007
2008
2009
2010
2011
2012
2013
2014
2015
$0
$5
$10
$15
$20
$25
$30
$35
$40
0
10
20
30
40
50
20
28
35
22
9 813
72 3 1
16
37 37
18
5 2 4
13
41 39
23
811
811
Enacted Budget Cuts Made After the Budget Passed
Number of states Amount of reduction
$ In
Mill
ions
Num
ber o
f Sta
tes
Recession ends
Recession ends
Recession ends
Midyear Budget Cuts Relatively Minimal in Fiscal 2015 at $2B
Source: NASBO Spring 2015 Fiscal Survey *Fiscal 2015 midyear cuts are ongoing

www.nasbo.org
13
Critical Challenges

www.nasbo.org
14

www.nasbo.org
15

www.nasbo.org
16
Higher Education Funding
States to Colleges: Prove You’re Worth It▫- July 28, 2015 (Stateline)
More States Grade Public Colleges on Performance▫June 23, 2015 (CNBC)

www.nasbo.org
17
State Severance Tax Revenue as a Percentageof Total State Tax Collections
Alaska
North
Dak
ota
Wyo
ming
New M
exico
Wes
t Virg
inia
Mon
tana
Texas
Louis
iana
Okla
hom
a0
20
40
60
80 72.4
53.8
39
18.512.7 11.5 10.9 8.9 7.5
Fiscal 2014
%
Source: U.S. Census Bureau
Federal Issues
▫Highway Trust Fund▫ESEA (No Child Left Behind)▫Few or no appropriation bills by Oct 1▫Sequestration ▫Debt limit ▫Taxes
18

Revenue Issues
▫Revenues recovering slowly compared to past recession
▫Greater volatility▫April windfall▫Gaming becoming limited
19

www.nasbo.org
20
Background on State Spending Trends

www.nasbo.org
21
Source: NASBO State Expenditure Report

www.nasbo.org
22
Total State Expenditures by FunctionEstimated Fiscal 2014
Elementary & Secondary Edu-
cation19.5%
Higher Education10.1%
Public Assistance1.4%
All Other32.4%
Corrections3.1%
Transportation7.7%
Medicaid25.8%
Source: NASBO State Expenditure Report
www.nasbo.org
23
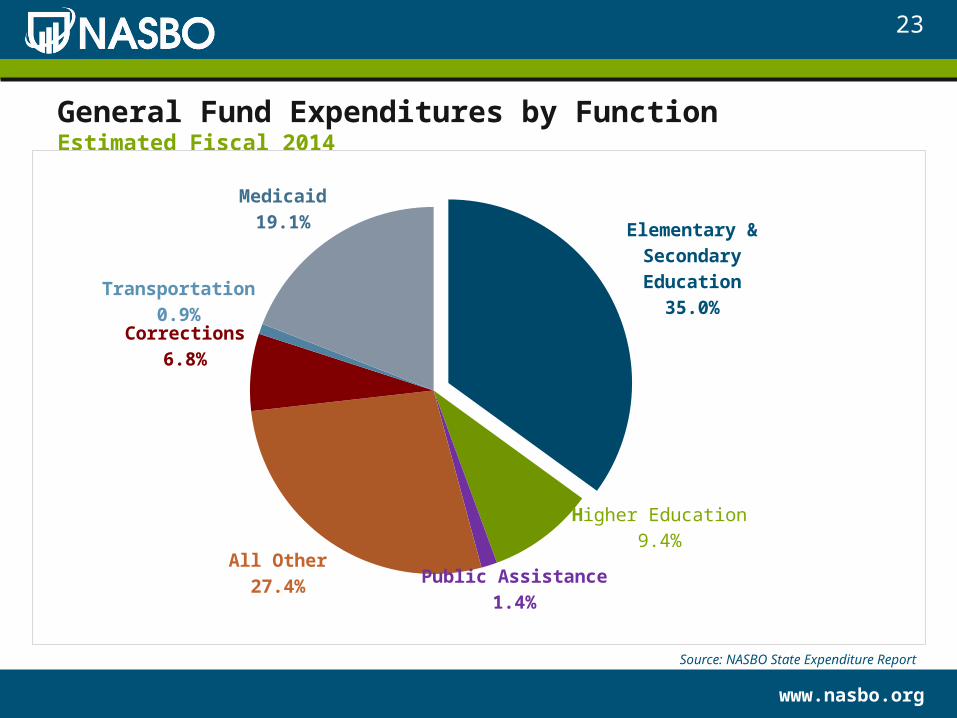
General Fund Expenditures by FunctionEstimated Fiscal 2014
Elementary & Secondary Ed-
ucation35.0%
Higher Education9.4%
Public Assistance1.4%
All Other27.4%
Corrections6.8%
Transportation0.9%
Medicaid19.1%
Source: NASBO State Expenditure Report

www.nasbo.org
24
Federal Funds Expenditures by FunctionEstimated Fiscal 2014
K-129.9%
Higher Education3.7%
Public Assistance2.6%
All Other25.0%
Corrections0.1%
Transportation7.7%
Medicaid51.0%
Source: NASBO State Expenditure Report

www.nasbo.org
25
Revenue Sources in the General Fund (Percentage)
Sales 31%
Personal Income 42%
Corporate Income 6%
Gaming 1%
Other Taxes & Fees 20%
Estimated Fiscal 2014
Source: NASBO State Expenditure Report

www.nasbo.org
Outlook
26

www.nasbo.org
27
State Fiscal Outlook
42 states recommended general fund spending increases in FY 2016, but growth still below average
Revenue growth projected to remain slow in fiscal 2016
Uncertainty remains concerning federal spending decisions and ACA implementation
Tough competition for general funds
Dealing with infrastructure, long-term liabilities
States will continue to make some painful choices

www.nasbo.org
28

Decision Making
You make important decisions in the public arena. Public policy decision making shapes our lives in many ways.
Analyze what processes are followed in public policy decision making by government officials at all levels, from elected officials to mainstream managers.
Analyze how the processes themselves impact the outcomes. How are important decisions made?
29

Relationships
Critical: your reputation, interaction, building of trust
While sunshine laws and rules governing open meetings are the norm, decisions are often made based on understandings and agreements forged between individuals in informal settings.
30

Don’t let emotions get in the way…

Pitfalls of groupthink
In large scale public policy endeavors, the involvement of groups is absolutely essential.
However, as shown with the Challenger launch decision, groupthink can also adversely affect organizational success.
32

33