Embed Size (px)
Citation preview

Analyst Presentation
September 2014
2
EQT Corporation (NYSE: EQT)
EQT Plaza
625 Liberty Avenue, Suite 1700
Pittsburgh, PA 15222
Pat Kane - Chief Investor Relations Officer
(412) 553-7833
The Securities and Exchange Commission (SEC) permits oil and gas companies, in their filings with the SEC, to disclose only proved, probable and possible
reserves that a company anticipates as of a given date to be economically and legally producible and deliverable by application of development projects to
known accumulations. We use certain terms in this presentation, such as “EUR” (estimated ultimate recovery) and total resource potential, that the SEC's rules
strictly prohibit us from including in filings with the SEC. We caution you that the SEC views such estimates as inherently unreliable and these estimates may
be misleading to investors unless the investor is an expert in the natural gas industry. We also note that the SEC strictly prohibits us from aggregating proved,
probable and possible (3P) reserves in filings with the SEC due to the different levels of certainty associated with each reserve category.
Disclosures in this presentation contain certain forward-looking statements. Statements that do not relate strictly to historical or current facts are forward-
looking. Without limiting the generality of the foregoing, forward-looking statements contained in this presentation specifically include the expectations of plans,
strategies, objectives and growth and anticipated financial and operational performance of the Company and its subsidiaries, including guidance regarding the
Company’s strategy to develop its reserves; drilling plans and programs (including spacing and the number, type, average lateral length and location of wells to
be drilled); projected natural gas prices, including liquids price uplift and changes in basis; projected market mix and Permian Basin production mix; total
resource potential, reserves, EUR and expected decline curve; projected production sales volume and growth rates (including l iquids sales volume and growth
rates); internal rate of return (IRR), compound annual growth rate (CAGR), and expected after-tax returns per well; technology (including drilling and
completion techniques); projected finding and development costs, operating costs, unit costs, well costs, and gathering and transmission revenue deductions;
projected gathering and transmission volumes and growth rates; the Company’s access to, and timing of, capacity on third-party pipelines; infrastructure
programs (including the timing, cost and capacity of such programs); the timing, cost and capacity of the Ohio Valley Connector (OVC) and Mountain Valley
Pipeline (MVP) projects; the expected terms and structure of the proposed joint venture related to the MVP project, including the affiliate(s) of the Company to
own and/or operate the MVP; projected EBITDA; projected cash flows resulting from, and the value of, the Company’s general partner and limited partner
interests and incentive distribution rights in EQT Midstream Partners, including the assumptions used in making such projections; monetization transactions,
including midstream asset sales (dropdowns) to EQT Midstream Partners and other asset sales and joint ventures or other transactions involving the
Company’s assets; the amount and timing of any repurchases under the Company’s share repurchase authorization; projected capi tal expenditures; liquidity
and financing requirements, including funding sources and availability; projected operating revenue and cash flows; hedging strategy; the effects of government
regulation and litigation; the Company dividend and EQT Midstream Partners distribution amounts and rates; and tax position. These forward-looking
statements involve risks and uncertainties that could cause actual results to differ materially from projected results. Accordingly, investors should not place
undue reliance on forward-looking statements as a prediction of actual results. The Company has based these forward-looking statements on current
expectations and assumptions about future events. While the Company considers these expectations and assumptions to be reasonable, they are inherently
subject to significant business, economic, competitive, regulatory and other risks and uncertainties, most of which are difficult to predict and many of which are
beyond the Company’s control. With respect to the proposed OVC and MVP projects, these risks and uncertainties include, among others, the ability to obtain
regulatory permits and approvals, the ability to secure customer contracts, the availability of skilled labor, equipment and materials, and, with respect to the
MVP, the risk that the parties may not consummate the joint venture. Additional risks and uncertainties that may affect the operations, performance and results
of the Company’s business and forward-looking statements include, but are not limited to, those set forth under Item 1A, “Risk Factors,” of the Company’s
Form 10-K for the year ended December 31, 2013, as updated by any subsequent Form 10-Qs. Any forward-looking statement speaks only as of the date on
which such statement is made and the Company does not intend to correct or update any forward-looking statement, whether as a result of new information,
future events or otherwise.
EQT Cautionary Statements
3
The Company uses Adjusted EQT Midstream EBITDA as a financial measure in this presentation. Adjusted EQT Midstream EBITDA is defined as EQT Midstream operating income (loss) plus depreciation and amortization expense less gains on dispositions. Adjusted EQT Midstream EBITDA also excludes EQT Midstream results associated with the Big Sandy Pipeline and Langley processing facility. Adjusted EQT Midstream EBITDA is not a financial measure calculated in accordance with generally accepted accounting principles (GAAP). Adjusted EQT Midstream EBITDA is a non-GAAP supplemental financial measure that Company management and external users of the Company’s financial statements, such as industry analysts, investors, lenders and rating agencies, use to assess: (i) the Company’s performance versus prior periods; (ii) the Company’s operating performance as compared to other companies in its industry; (iii) the ability of the Company’s assets to generate sufficient cash flow to make distributions to its investors; (iv) the Company’s ability to incur and service debt and fund capital expenditures; and (v) the viability of acquisitions and other capital expenditure projects and the returns on investment of various investment opportunities.
The Company believes that the presentation of Adjusted EQT Midstream EBITDA in this presentation provides useful information in assessing the Company’s financial condition and results of operations. Adjusted EQT Midstream EBITDA should not be considered as an alternative to EQT Midstream operating income or any other measure of financial performance or liquidity presented in accordance with GAAP. Adjusted EQT Midstream EBITDA has important limitations as an analytical tool because it excludes some but not all items that affect operating income. Additionally, because Adjusted EQT Midstream EBITDA may be defined differently by other companies in the Company’s industry, the Company’s definition of Adjusted EQT Midstream EBITDA will most likely not be comparable to similarly titled measures of other companies, thereby diminishing the utility of the measure. Please see slide 49 in the Appendix for a reconciliation of Adjusted EQT Midstream EBITDA to EQT Midstream operating income, its most directly comparable financial measure calculated in accordance with GAAP.
The Company is unable to provide a reconciliation of projected EBITDA to projected operating income, the most comparable financial measure calculated in accordance with GAAP, due to the unknown effect, timing and potential significance of certain income statement items.
Non-GAAP Measures

4
Finding and development costs (F&D costs) from all sources for
peer companies presented in this presentation are calculated as
the cost incurred, relating to natural gas and oil activities in
accordance with Financial Accounting Standards Board
Accounting Standards Codification 932 (ASC 932), divided by the
sum of extensions, discoveries and other additions; purchase of
natural gas and oil in place; and revisions of previous estimates,
as provided for years 2011 – 2013 and derived from publicly
available information filed with the SEC.
Per unit operating expenses are calculated by dividing the sum of
lease operating expenses, production taxes and the gathering and
transmission costs for equity gas, by production sales volumes
for the same period. Per unit operating expenses in the
presentation are calculated from publicly available information
filed with the SEC for the year ended December 31, 2013.
Calculations Within This Presentation
5
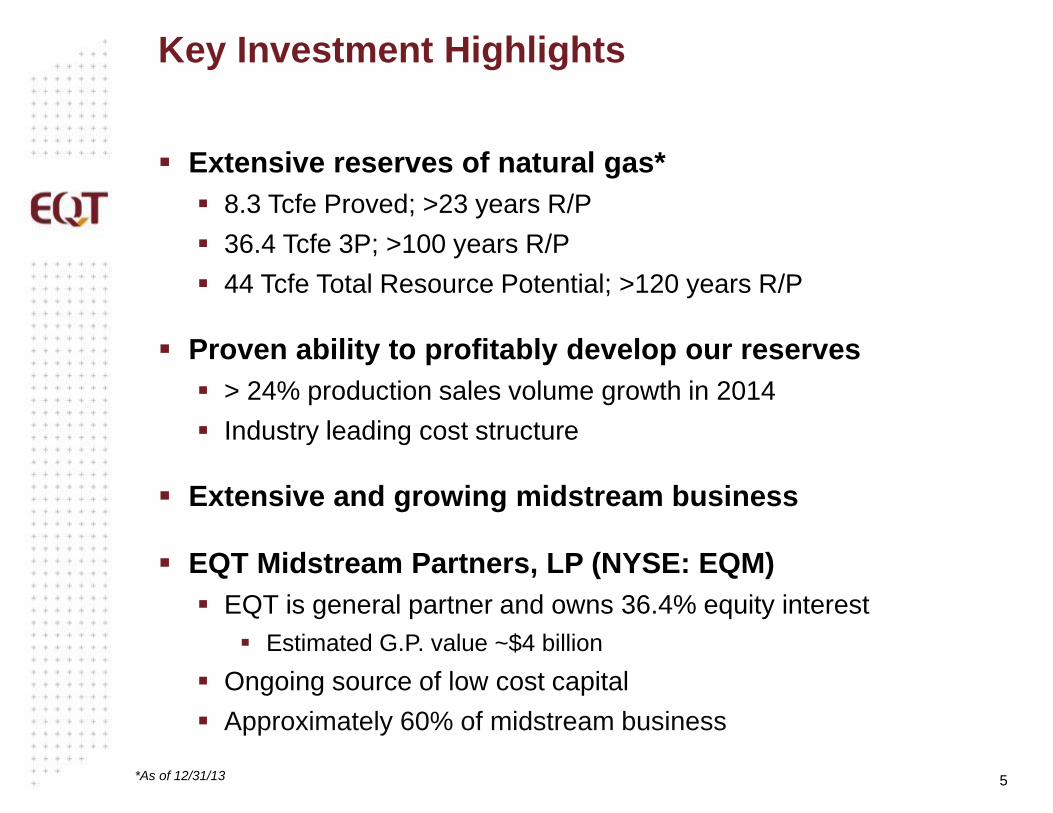
Extensive reserves of natural gas*
8.3 Tcfe Proved; >23 years R/P
36.4 Tcfe 3P; >100 years R/P
44 Tcfe Total Resource Potential; >120 years R/P
Proven ability to profitably develop our reserves
> 24% production sales volume growth in 2014
Industry leading cost structure
Extensive and growing midstream business
EQT Midstream Partners, LP (NYSE: EQM)
EQT is general partner and owns 36.4% equity interest
Estimated G.P. value ~$4 billion
Ongoing source of low cost capital
Approximately 60% of midstream business
Key Investment Highlights
*As of 12/31/13

6
2013 Operating Income of $654.6 million
Leading Appalachian E&P Company
8.3 Tcfe proved reserves
3.6 MM acres
10,400 pipeline miles
As of 12/31/13

7
0
200
400
600
800
1,000
1,200
1,400
1,600
Marcellus
Huron horizontal
Vertical
Marcellus Shale drilling driving growth
Production By Play
Pro
du
cti
on
MM
cf/
d
Began horizontal drilling
2006 2007 2008 2009 2010 2011 2012 2013 2014E
8
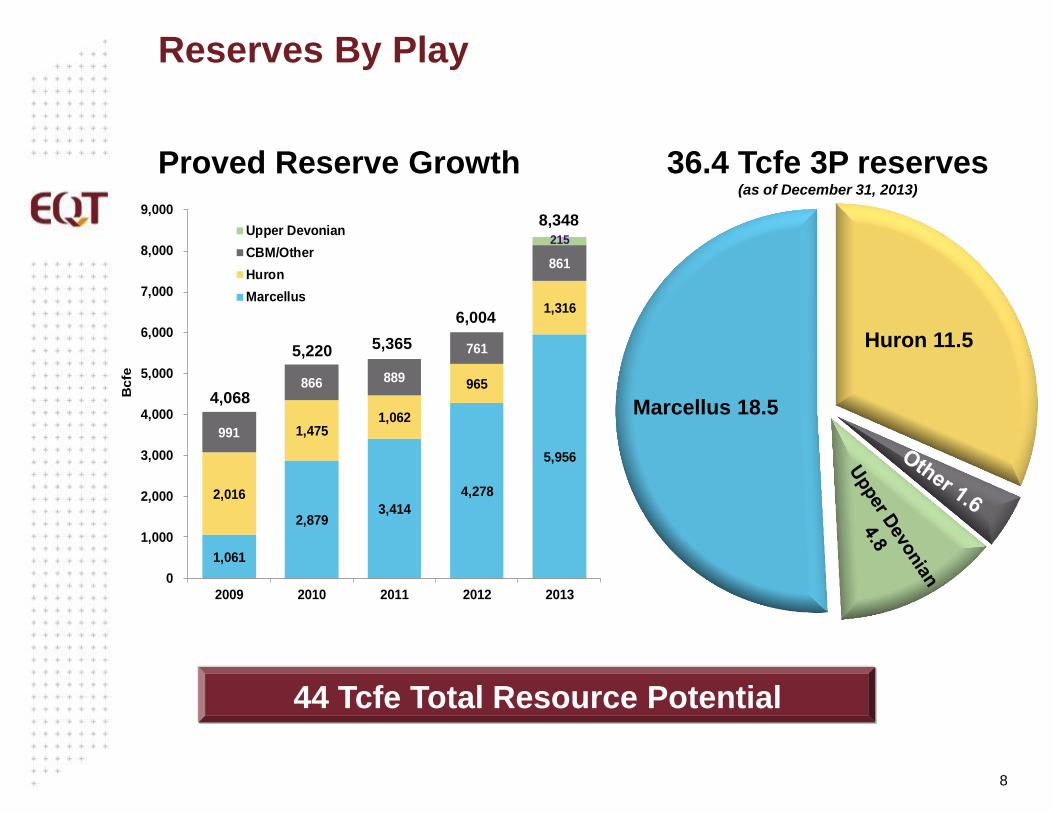
Proved Reserve Growth
Reserves By Play
36.4 Tcfe 3P reserves (as of December 31, 2013)
44 Tcfe Total Resource Potential
1,061
2,879 3,414
4,278
5,956
2,016
1,475 1,062
965
1,316
991
866 889
761
861
215
0
1,000
2,000
3,000
4,000
5,000
6,000
7,000
8,000
9,000
2009 2010 2011 2012 2013
Bcfe
Upper Devonian
CBM/Other
Huron
Marcellus
4,068
5,220
6,004
8,348
5,365
Marcellus 18.5
Huron 11.5

9
Near term development focused in four areas
Marcellus Play
580,000 EQT acres
86% NRI / 80% HBP
33% “wet”
18.5 Tcfe 3P
23.9 Tcfe total resource potential
201 wells in 2014
>50% of acreage will utilize RCS
Central PA
Southwestern PA
Northern WV (Wet)
EQT acreage
Northern WV (Dry)
10
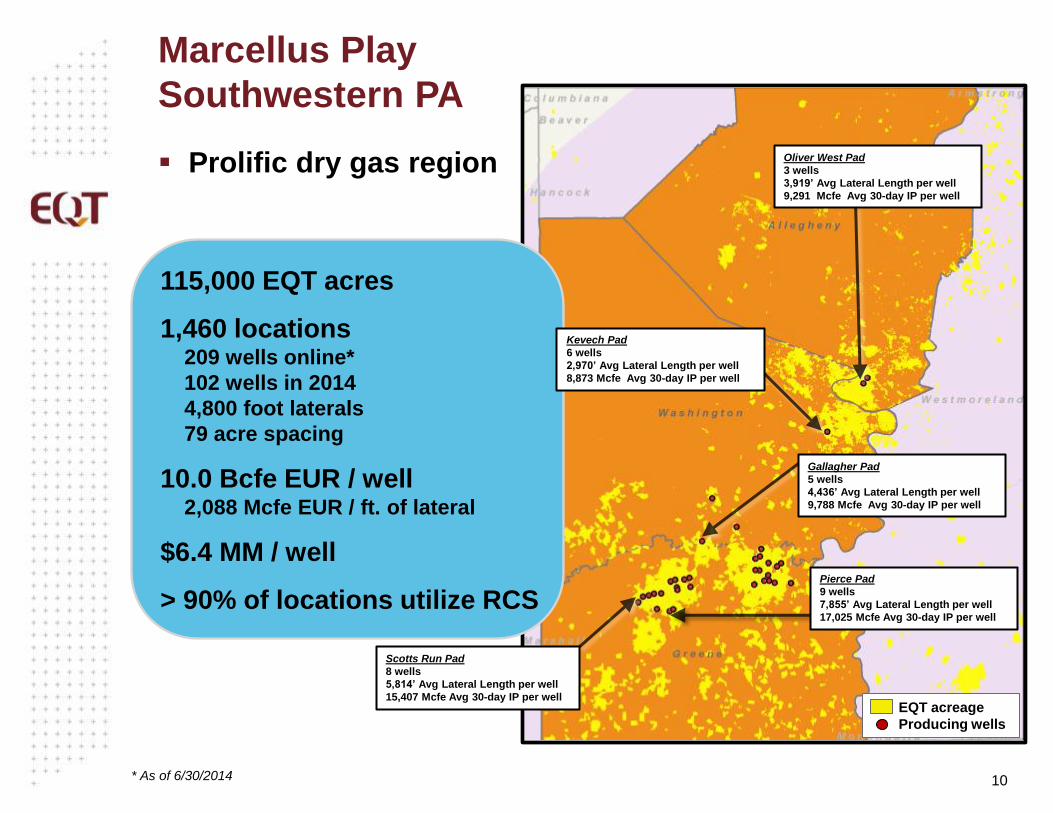
Prolific dry gas region
Marcellus Play
Southwestern PA
115,000 EQT acres
1,460 locations 209 wells online*
102 wells in 2014
4,800 foot laterals
79 acre spacing
10.0 Bcfe EUR / well 2,088 Mcfe EUR / ft. of lateral
$6.4 MM / well
> 90% of locations utilize RCS
Scotts Run Pad
8 wells
5,814’ Avg Lateral Length per well
15,407 Mcfe Avg 30-day IP per well
Pierce Pad
9 wells
7,855’ Avg Lateral Length per well
17,025 Mcfe Avg 30-day IP per well
Kevech Pad
6 wells
2,970’ Avg Lateral Length per well
8,873 Mcfe Avg 30-day IP per well
* As of 6/30/2014
Oliver West Pad
3 wells
3,919’ Avg Lateral Length per well
9,291 Mcfe Avg 30-day IP per well
Gallagher Pad
5 wells
4,436’ Avg Lateral Length per well
9,788 Mcfe Avg 30-day IP per well
EQT acreage
Producing wells

11
Enhanced economics from liquids uplift
Marcellus Play
Northern West Virginia – Wet Gas Area
90,000 EQT acres
1,060 locations 134 wells online**
73 wells in 2014
4,800 foot laterals
83 acre spacing
9.8 Bcfe EUR / well* 2,043 Mcfe EUR / ft. of lateral*
$6.4 MM / well
100% of locations utilize RCS
Producing Pads
Big 190 Pad
5 wells
6,308’ Avg Lateral Length per well
12,511 Mcfe Avg 30-day IP per well
PEN 16 Pad
5 wells
3,562’ Avg Lateral Length per well
8,883 Mcfe Avg 30-day IP per well
* Liquids converted at 6:1 Mcfe per barrel (1.8 Bcfe per well from liquids.) EUR assumes ethane rejection. Ethane recovery would result in
EUR of 12.0 Bcfe
** As of 6/30/2014
OXF160 Pad
3 wells
5,286’ Avg Lateral Length per well
9,317 Mcfe Avg 30-day IP per well
EQT acreage
Producing wells
12
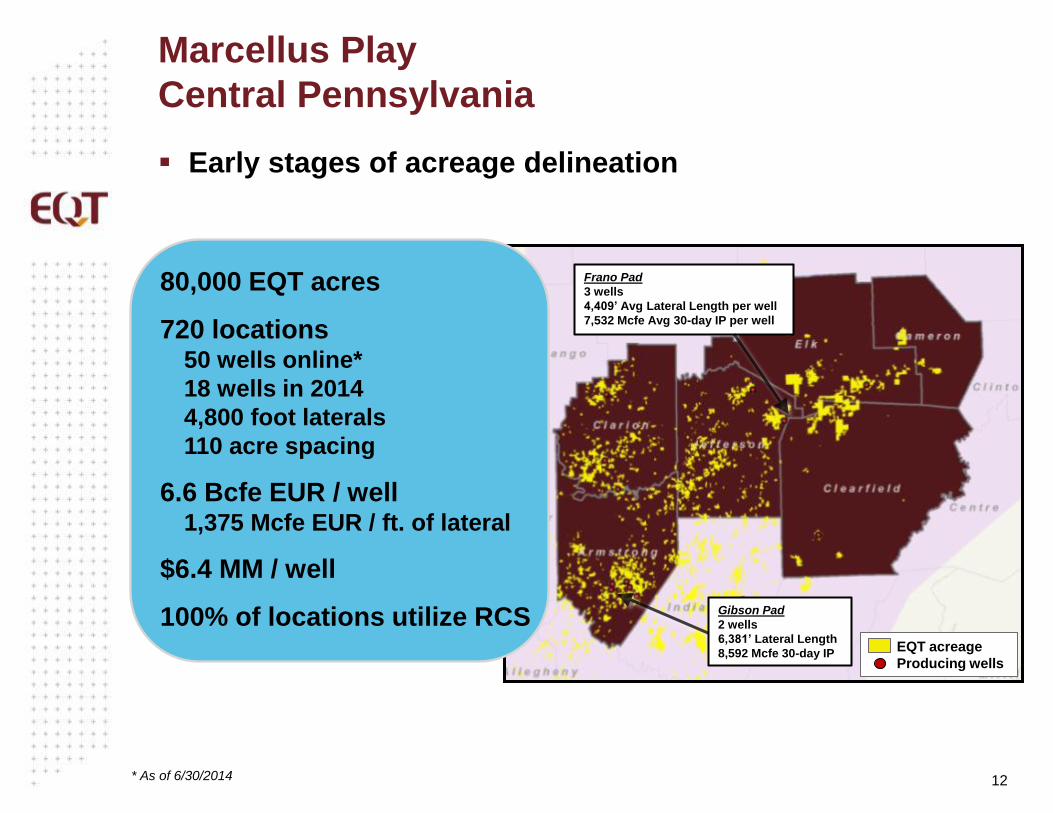
Early stages of acreage delineation
Marcellus Play
Central Pennsylvania
80,000 EQT acres
720 locations 50 wells online*
18 wells in 2014
4,800 foot laterals
110 acre spacing
6.6 Bcfe EUR / well 1,375 Mcfe EUR / ft. of lateral
$6.4 MM / well
100% of locations utilize RCS
Frano Pad
3 wells
4,409’ Avg Lateral Length per well
7,532 Mcfe Avg 30-day IP per well
Gibson Pad
2 wells
6,381’ Lateral Length
8,592 Mcfe 30-day IP
* As of 6/30/2014
EQT acreage
Producing wells

13
EQT’s newest development area
Marcellus Play
Northern West Virginia – Dry Gas Area
30,000 EQT acres
300 locations 46 wells online*
8 wells in 2014
4,800 ft laterals
97 acre spacing
8.4 Bcfe EUR / well 1,741 Mcfe EUR / ft. of lateral
$6.3 MM / well
80% of locations utilize RCS
GRT26 Pad
2 wells
3,270’ Avg Lateral Length per well
6,547 Mcfe Avg 30-day IP per well
RSM119 Pad
6 wells
3,537’ Avg Lateral Length per well
3,529 Mcfe Avg 30-day IP per well
* As of 6/30/2014
Flanigan Pad
2 wells
6,889’ Avg Lateral Length per well
9,417 Mcfe Avg 30-day IP per well EQT acreage
Producing wells

14
Marcellus Economics
IRR - Blended Marcellus Development Areas
Realized Price
PRICE ATAX IRR
$4.00 59%
$4.50 82%
$5.00 110%
See appendix for IRR by development area

15
Developed in conjunction with Marcellus
Upper Devonian Play
*As of 6/30/2014
Near-term Upper
Devonian testing
& development area
170,000 near-term testing
& development EQT acres
2,000 locations 22 wells online*
36 wells in 2014
4,800 foot laterals
83 acre spacing
6.1 Bcfe EUR / well* 1,274 Mcfe EUR / ft. of lateral
$5.6 MM / well
2014 drilling program to
delineate acreage position
Wetzel County
11 wells
4,396’ Avg Lateral Length per well
5,663 Mcfe Avg 30-day IP per well
Greene County
7 wells
5,964’ Avg Lateral Length per well
8,191 Mcfe Avg 30-day IP per well
EQT acreage
16
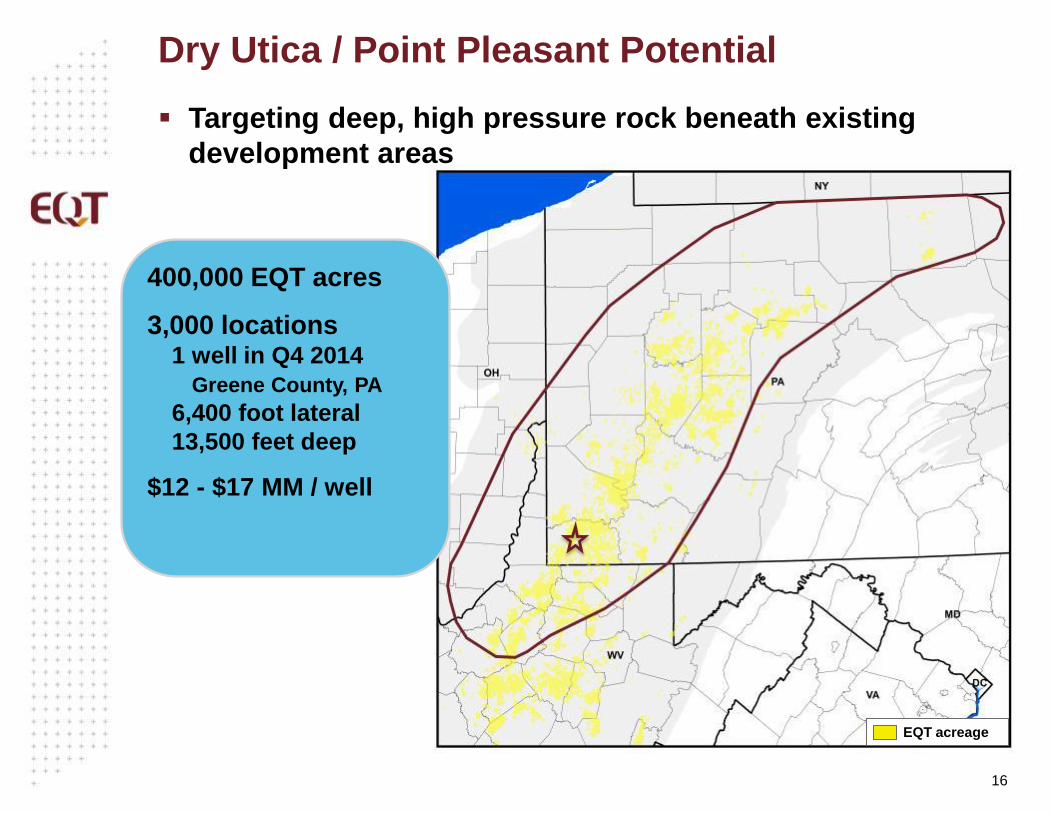
Targeting deep, high pressure rock beneath existing
development areas
Dry Utica / Point Pleasant Potential
400,000 EQT acres
3,000 locations 1 well in Q4 2014
Greene County, PA
6,400 foot lateral
13,500 feet deep
$12 - $17 MM / well
EQT acreage

17
Targeting high-return, liquid-rich acreage
Huron Play
Kentucky
120 wells
1.4 MM EQT acres 85 % Wet; 15 % Dry
10,000+ horizontal locations 900 horizontal wells online**
120 wells planned in 2014
6,000 foot laterals
1.4 Bcfe EUR / well* 230 Mcfe EUR / ft. of lateral*
$1.6 MM / well
* Liquids converted at 6:1 Mcfe per barrel (0.4 Bcfe per well from liquids). EUR assumes ethane rejection.
** As of 6/30/2014
EQT acreage
18
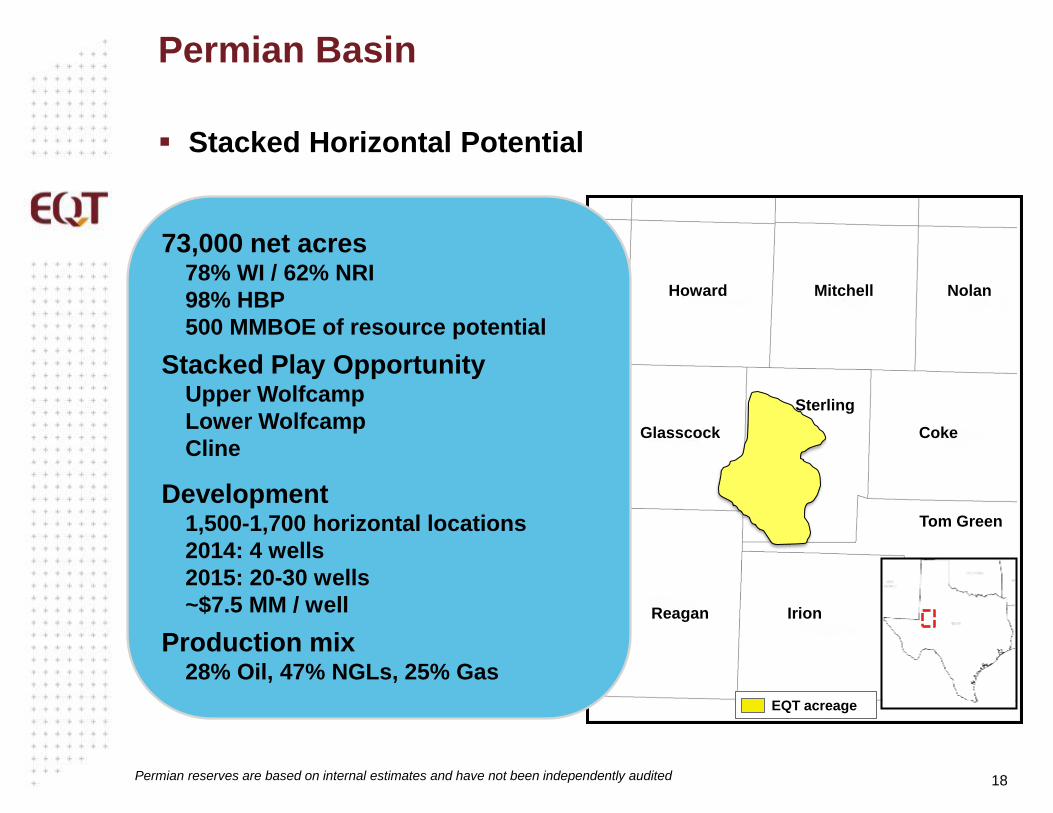
Stacked Horizontal Potential
Permian Basin
Howard Mitchell Nolan
Coke
Sterling
Glasscock
Reagan Irion
Tom Green
73,000 net acres 78% WI / 62% NRI
98% HBP
500 MMBOE of resource potential
Stacked Play Opportunity Upper Wolfcamp
Lower Wolfcamp
Cline
Development 1,500-1,700 horizontal locations
2014: 4 wells
2015: 20-30 wells
~$7.5 MM / well
Production mix 28% Oil, 47% NGLs, 25% Gas
Permian reserves are based on internal estimates and have not been independently audited
EQT acreage

19
0.00
1.00
2.00
3.00
4.00
EQ
T
RIC
E
CH
K
SW
N
CO
G
NF
G
XC
O
RR
C
AR
XE
C
SM
ST
R
CX
O
EO
G
EG
N
NF
X
WL
L
0.00
2.00
4.00
6.00
AR
CO
G
RR
C
EQ
T
SW
N
RIC
E
NF
G
SM
ST
R
XE
C
CX
O
CH
K
EO
G
WL
L
EG
N
XC
O
NF
X
Industry Leading Cost Structure
$/M
cfe
$/M
cfe
3-year F&D (all sources)
Per Unit Operating Expenses
Mean = $1.68
Mean = $2.74
For the three years ended 12/31/13
Year ended 12/31/13
$0.88
$0.52
20
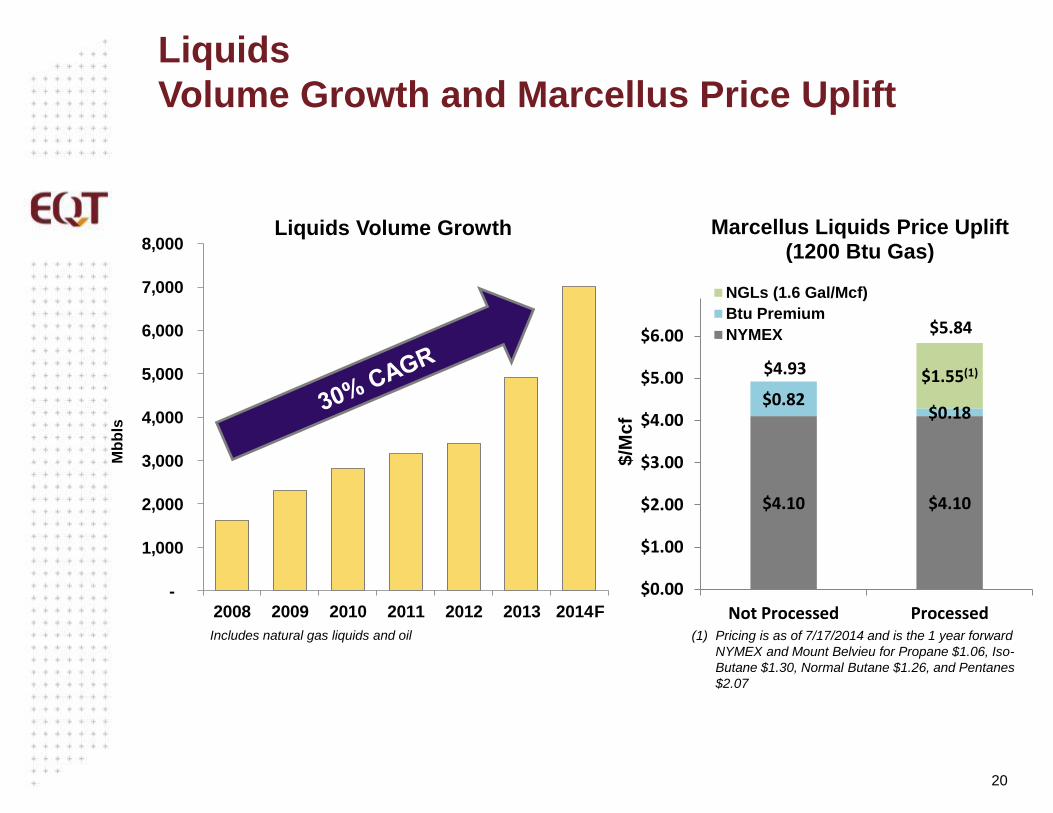
Liquids
Volume Growth and Marcellus Price Uplift
(1) Pricing is as of 7/17/2014 and is the 1 year forward
NYMEX and Mount Belvieu for Propane $1.06, Iso-
Butane $1.30, Normal Butane $1.26, and Pentanes
$2.07
-
1,000
2,000
3,000
4,000
5,000
6,000
7,000
8,000
2008 2009 2010 2011 2012 2013 2014F
Mb
bls
Includes natural gas liquids and oil
Liquids Volume Growth
$4.10 $4.10
$0.82 $0.18
$1.55(1) $4.93
$5.84
$0.00
$1.00
$2.00
$3.00
$4.00
$5.00
$6.00
Not Processed Processed$
/Mc
f
Marcellus Liquids Price Uplift (1200 Btu Gas)
NGLs (1.6 Gal/Mcf)
Btu Premium
NYMEX
21
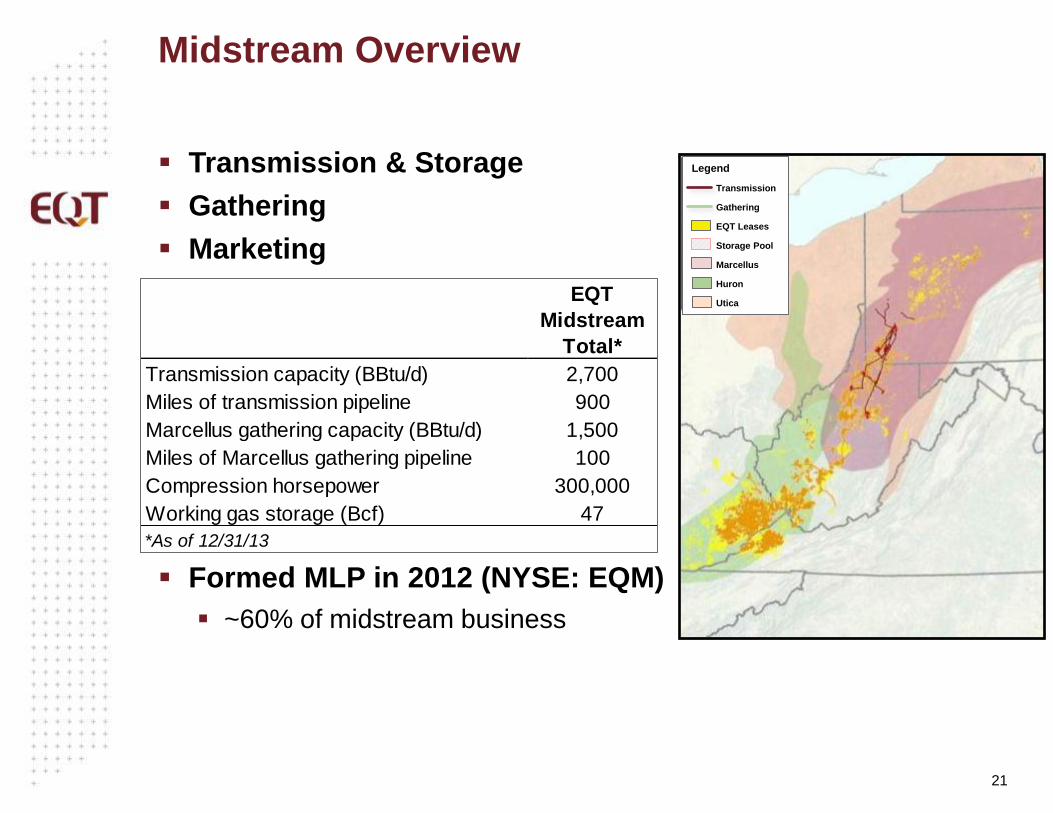
Transmission & Storage
Gathering
Marketing
Formed MLP in 2012 (NYSE: EQM)
~60% of midstream business
Midstream Overview
EQT
Midstream
Total*
Transmission capacity (BBtu/d) 2,700
Miles of transmission pipeline 900
Marcellus gathering capacity (BBtu/d) 1,500
Miles of Marcellus gathering pipeline 100
Compression horsepower 300,000
Working gas storage (Bcf) 47
*As of 12/31/13
Legend
Transmission
Gathering
EQT Leases
Storage Pool
Marcellus
Huron
Utica
22
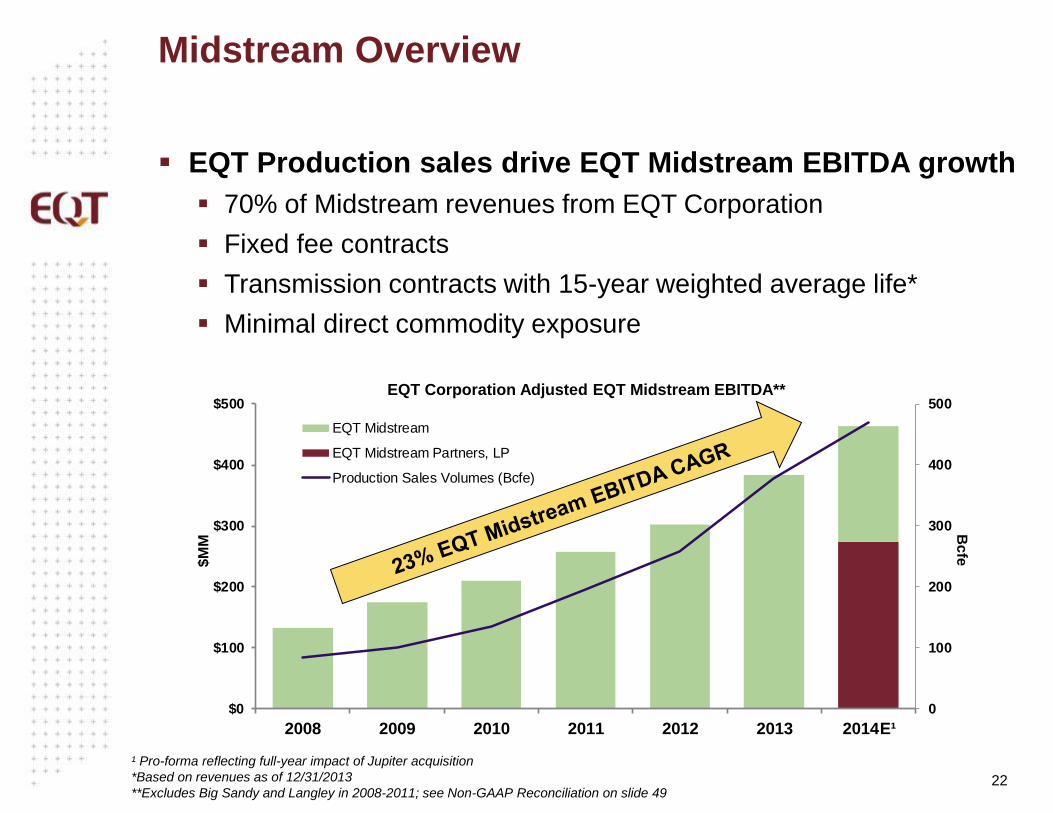
EQT Production sales drive EQT Midstream EBITDA growth
70% of Midstream revenues from EQT Corporation
Fixed fee contracts
Transmission contracts with 15-year weighted average life*
Minimal direct commodity exposure
Midstream Overview
¹ Pro-forma reflecting full-year impact of Jupiter acquisition
*Based on revenues as of 12/31/2013
**Excludes Big Sandy and Langley in 2008-2011; see Non-GAAP Reconciliation on slide 49
Bcfe
$M
M
EQT Corporation Adjusted EQT Midstream EBITDA**
0
100
200
300
400
500
$0
$100
$200
$300
$400
$500
2008 2009 2010 2011 2012 2013 2014E¹
EQT Midstream
EQT Midstream Partners, LP
Production Sales Volumes (Bcfe)

23
Transmission and storage
2.25 Tbtu/d current capacity
700 mile FERC-regulated
interstate pipeline
32 Bcf of working gas storage
Gathering System
Jupiter Gathering System
Highlights market valuation of
midstream assets
EQT ownership
2.0% GP interest – 1.2 MM units
34.4% LP interest – 21.3 MM units
EQT Midstream Partners, LP (NYSE: EQM)
*Based on 2014 EBITDA guidance by EQT Midstream Partners
EQM Price
per Unit
Implied EBITDA
Multiple*
Value of EQM LP
Units ($MM)
$90 21.1x $1,917
$92 21.6x $1,960
$94 22.0x $2,002
$96 22.5x $2,045
$98 23.0x $2,087
$100 23.4x $2,130
EQM Compressor Station
Equitrans Transmission
Sunrise Pipeline
Jupiter area
Equitrans Gathering
Storage Pool
EQT Acreage
Marcellus Fairway

24
EQT Midstream Partners, LP Distributions
*Forecast based on assumed $0.03 per unit quarterly distribution increase each quarter through 2019
$2.14 $2.62
$3.10 $3.58
$4.06 $4.54
$0.00
$1.00
$2.00
$3.00
$4.00
$5.00
$6.00
$7.00
$8.00
2014E 2015E 2016E 2017E 2018E 2019E
To
tal D
istr
ibu
tio
n p
er
LP
Un
it
LP Unit Distribution GP Distribution per LP Units
$2.37
$3.31
$4.27
$5.23
$6.19
$7.15
EQM forecasting 29% per unit distribution growth in 2014*
EQM forecasting 22% per unit distribution growth in 2015*

25
EQT Midstream Partners, LP General Partner Cash Flow Valuation
Assumptions:
-$0.03 per unit quarterly distribution increase each quarter through 2019
-$75 Million of EBITDA dropped in ’15, ’16, & ’17 at 10.0x EBITDA financed 50/50 debt/equity
$0
$50
$100
$150
$200
$250
2014E 2015E 2016E 2017E 2018E 2019E
$ M
illio
ns
$14
$45
$82
$123
$194
$158
Present value of GP cash flows = $3.9 billion
2014E
Present Value of 2014-2019 470$
Present Value Terminal Value 3,435$
Present Value of GP Cash Flows 3,905$
$ Billion
3.0% 4.0% 5.0%
7.0% 4.1$ 5.3$ 7.8$
8.0% 3.2$ 3.9$ 5.1$
9.0% 2.6$ 3.1$ 3.8$ WA
CC
GP Discounted Cash Flow Sensitivity
Terminal Growth

26
EQT sold to EQT Midstream
Partners May 2014
$1.2 billion
35 mile gathering system in
Greene and Washington
Counties in Pennsylvania
10-year firm transportation
agreement
Currently 225 MMcfe/d
Additional 550 MMcfe/d by
year-end 2015
EQT Midstream Partners, LP
Jupiter Gathering System
Jupiter
Central PA
Southwestern PA
Northern WV (Wet)
Northern WV (Dry)

27
Tioga
65 MMcf/d
Pluto
60 MMcf/d
Mercury
250 MMcf/d
Saturn
225 MMcf/d
Longhorn
130 MMcf/d
Terra
80 MMcf/d
Applegate
150 MMcf/d
Jupiter*
Equitrans Transmission
EQT acreage
EQT Midstream
Marcellus Gathering
(MMcf/d)
2013
year-end
capacity
2014
capacity
additions
Total
capacity
after
additions
Pennsylvania 1,150 120 1,270
West Virginia 350 320 670
Total 1,500 440 1,940
NOTE: Capacity for each system represents estimated year-end 2014 capacity
2014 CAPEX
$240 MM (EQT)
$105 MM (EQM)

28
Allegheny Valley Connector
EQT acquired December 2013
200 mile FERC-regulated
interstate pipeline
450 BBtu/d capacity
15 Bcf working gas storage
~$90 MM CAPEX in 2014
~$40 MM projected annual
EBITDA
EQT Midstream
Transmission
Equitrans Transmission
Allegheny Valley Connector
EQT acreage
Allegheny Valley Connector Storage Field

29
Pipeline to growing demand
center in southeast US
Completed a non-binding open
season in July 2014
JV with NextEra Energy
JV to construct & own pipeline
EQT and/or EQM will be operator
2 Bcf/day capacity
1 Bcf/day committed from two
Foundation Shippers
Q4 2018 expected in-service
EQT Midstream
Mountain Valley Pipeline Project
30
Safety – Our first priority
All accidents are preventable
Company goal = zero incidents
Committed to:
The environment
Our employees and contractors
The communities where we drill and work
EQT Foundation charitable giving of >$4 million / year
More than $20 million / year in state and local taxes
Corporate Citizenship
31
Committed to operate in accordance with federal, state and
local regulations
Industry leading spill prevention plans and results
Supports the disclosure of frac fluid additives
Utilize multiple barriers to protect drinking water supplies
Pre-drilling water sampling within 2,500’ of drilling locations
Multi-well pads reduce surface impacts
Drilling and Hydraulic Fracturing

32
Extensive reserves of natural gas
Proven ability to profitably develop our reserves
Committed to maximize shareholder value by:
Accelerating the monetization of our vast reserves
Operating in a safe and environmentally responsible manner
Funding with cash flow and debt capacity
Investment Summary

33
Appendix

34
Capital Investment Summary
Excludes acquisitions
Midstream Production Distribution
0.0
0.5
1.0
1.5
2.0
2.5
3.0
2010 2011 2012 2013 2014F
$B
$1.1 $1.2
$1.4
$1.8
$2.3

35
EQT has 580,000 total Marcellus acres
Expect to develop in four areas for several years
Active areas represent 315,000 acres and 3,540 locations
EQT has 130,000 additional acres in PA & 135,000 additional
acres in WV
Estimated 1,200 Mcfe EUR per lateral foot for wells drilled on
additional acres
Marcellus Play
Acres Within Each Core Development Area
Type curve and well cost data posted on www.eqt.com under investor relations
1Based on 4,800 laterals with lateral spacing estimates ranging from 500’ to 1,000’ 2EQT holds approximately 45,000 acres in the northern WV dry area – near-term development focused on 30,000 acres 3EQT holds approximately 160,000 acres in central PA – near-term development is focused on 80,000 acres
EUR (Mcfe) /
Lateral Foot Total Net Acres
Total Net
Undeveloped
Acres
Locations Utilizing
Reduced Cluster
Spacing Locations¹
Southwestern PA 2,088 115,000 93,000 90% 1,460
Northern WV - Wet1
2,043 90,000 75,000 100% 1,060
Northern WV - Dry² 1,747 30,000 27,000 80% 300
Central PA3
1,375 80,000 72,000 100% 720
315,000 267,000 94% 3,540
36
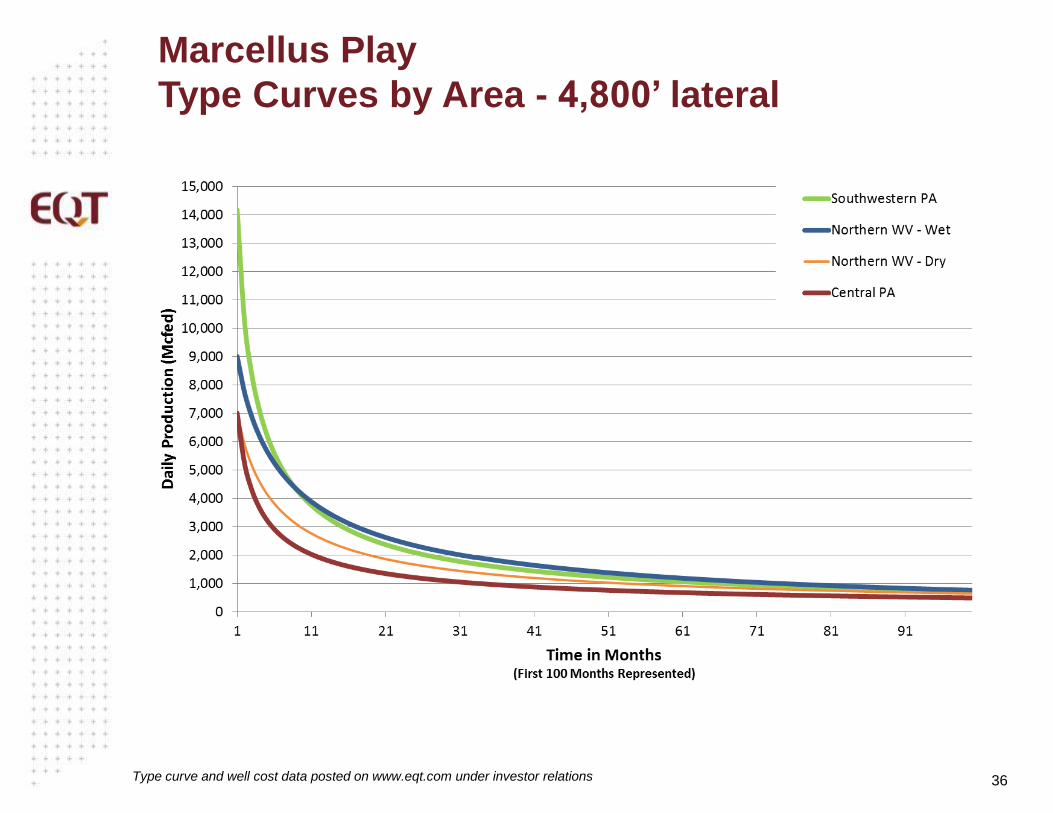
Marcellus Play
Type Curves by Area - 4,800’ lateral
Type curve and well cost data posted on www.eqt.com under investor relations
37
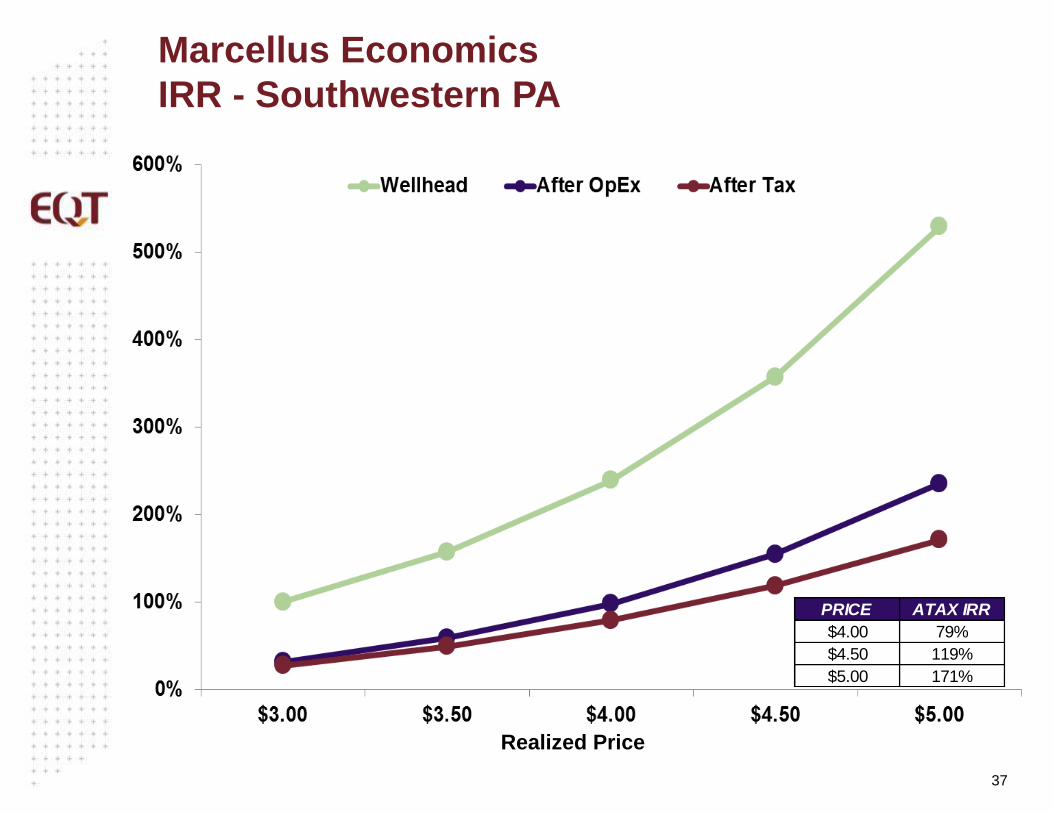
Marcellus Economics
IRR - Southwestern PA
Realized Price
PRICE ATAX IRR
$4.00 79%
$4.50 119%
$5.00 171%

38
Marcellus Economics
IRR - Northern WV – Wet Gas Area
Realized Price
PRICE ATAX IRR
$4.00 111%
$4.50 141%
$5.00 176%

39
Marcellus Economics
IRR - Central PA
Realized Price
PRICE ATAX IRR
$4.00 19%
$4.50 28%
$5.00 38%
40
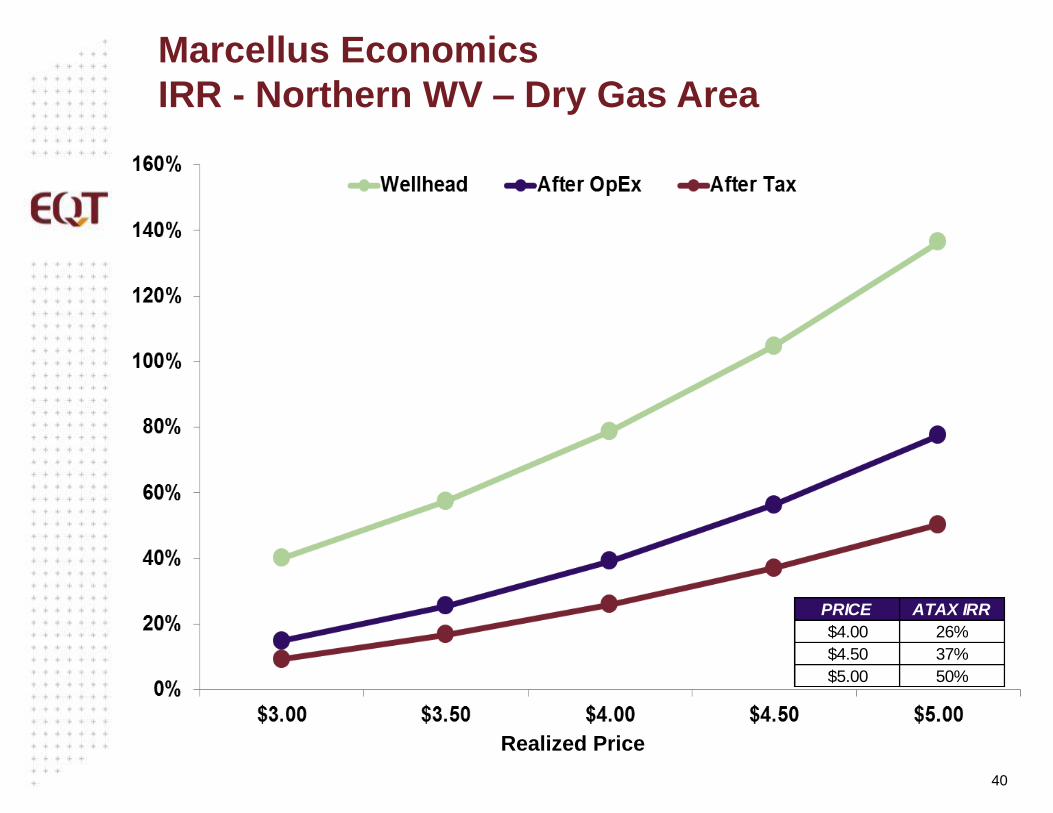
Marcellus Economics
IRR - Northern WV – Dry Gas Area
Realized Price
PRICE ATAX IRR
$4.00 26%
$4.50 37%
$5.00 50%

41
Upper Devonian Play
Blended Type Curve - 4,800’ lateral
Type curve and well cost data posted on www.eqt.com under investor relations

42
Upper Devonian
IRR
Realized Price
PRICE ATAX IRR
$4.00 32%
$4.50 45%
$5.00 59%

43
0%
20%
40%
60%
80%
100%
120%
$3.00 $3.50 $4.00 $4.50 $5.00
Wellhead Wellhead After OpEx ATAX
Huron Play
IRR
Realized Price
PRICE ATAX IRR
$4.00 35%
$4.50 42%
$5.00 50%

44
Marcellus Capacity
Market Mix* EQT Capacity & Firm Sales
2014E 2015E
Tetco M2 48-50% 36-38%
Tetco M3 26-28% 28-30%
TCO 11-13% 9-10%
Midwest 0% 9-10%
NYMEX 11-13% 14-16%

45
Ample Financial Flexibility to Execute Business Plan
Moody’s Standard & Poor’s Fitch
Long-term debt Baa3 BBB BBB-
Outlook Stable Stable Stable
Debt ratings
Strong balance sheet
-
200
400
600
800
2014 2015 2016 2017 2018 2019 2020 2021 2022 2023 2024 2025 2026
$M
M$
MM
11
166
3 0
708 700
11
774
0 10 0 0
115
Manageable debt maturities
($ thousands, except net debt / capital) June 30, 3014
$330,000 2,497,619
(1,274,265)$1,553,354
4,276,592
27%Net debt / capital
Short-term debtLong-term debtCash and cash equivalentsNet debt (total debt minus cash)
Total common stockholders' equity
46
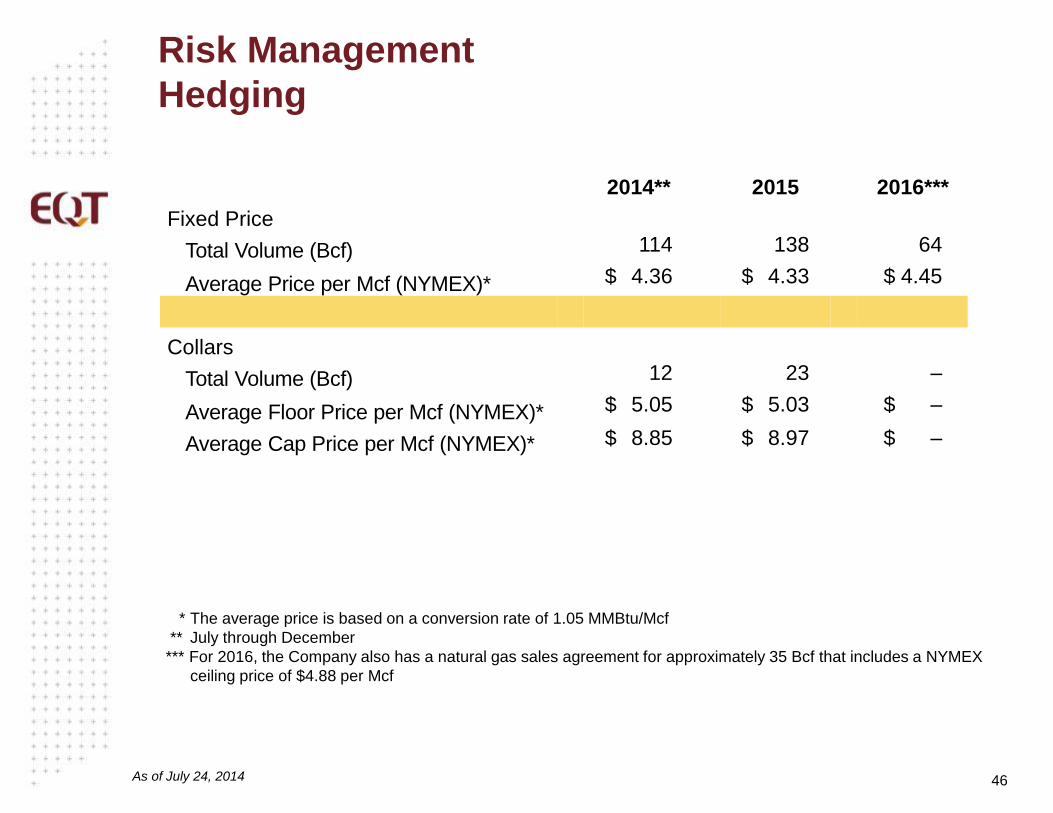
Risk Management
Hedging
As of July 24, 2014
* The average price is based on a conversion rate of 1.05 MMBtu/Mcf
** July through December
*** For 2016, the Company also has a natural gas sales agreement for approximately 35 Bcf that includes a NYMEX
ceiling price of $4.88 per Mcf
2014** 2015 2016***
Fixed Price
Total Volume (Bcf) 114 138 64
Average Price per Mcf (NYMEX)* $ 4.36 $ 4.33 $ 4.45
Collars
Total Volume (Bcf) 12 23 –
Average Floor Price per Mcf (NYMEX)* $ 5.05 $ 5.03 $ –
Average Cap Price per Mcf (NYMEX)* $ 8.85 $ 8.97 $ –
47
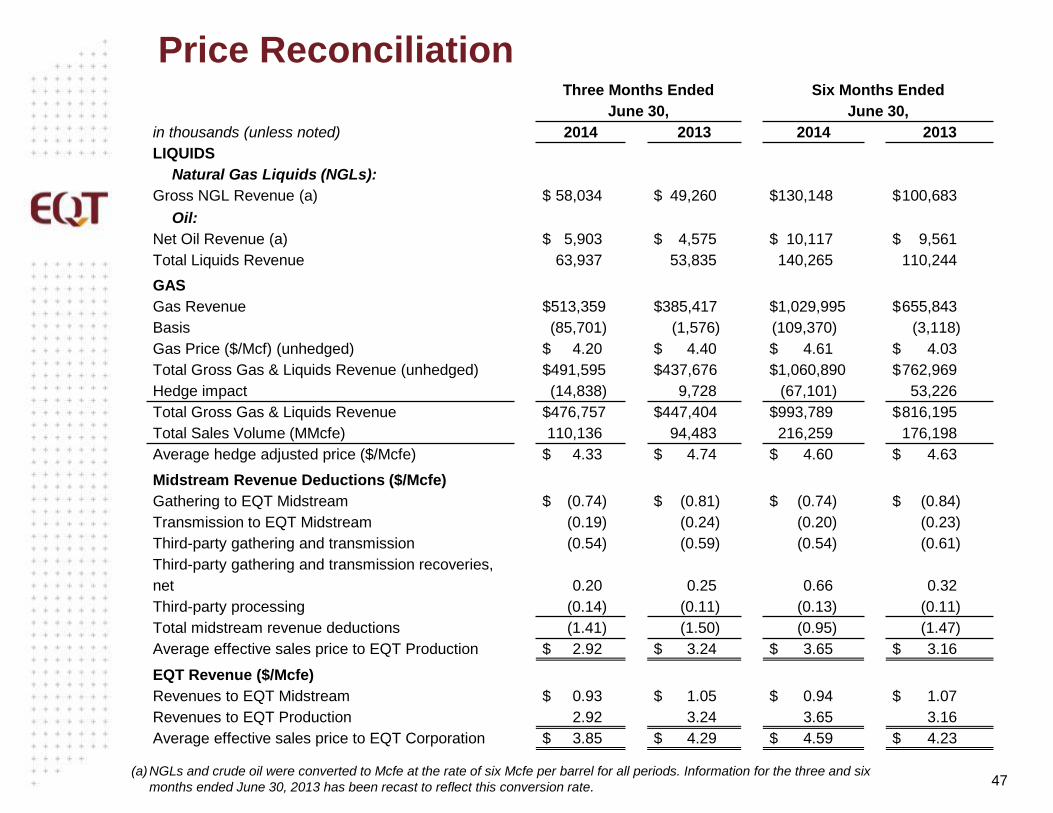
Price Reconciliation
(a)NGLs and crude oil were converted to Mcfe at the rate of six Mcfe per barrel for all periods. Information for the three and six
months ended June 30, 2013 has been recast to reflect this conversion rate.
Three Months Ended Six Months Ended
June 30, June 30,
in thousands (unless noted) 2014 2013 2014 2013
LIQUIDS
Natural Gas Liquids (NGLs):
Gross NGL Revenue (a) $ 58,034 $ 49,260 $130,148 $ 100,683
Oil:
Net Oil Revenue (a) $ 5,903 $ 4,575 $ 10,117 $ 9,561
Total Liquids Revenue 63,937 53,835 140,265 110,244
GAS
Gas Revenue $513,359 $385,417 $1,029,995 $ 655,843
Basis (85,701) (1,576) (109,370) (3,118)
Gas Price ($/Mcf) (unhedged) $ 4.20 $ 4.40 $ 4.61 $ 4.03
Total Gross Gas & Liquids Revenue (unhedged) $491,595 $437,676 $1,060,890 $ 762,969
Hedge impact (14,838) 9,728 (67,101) 53,226
Total Gross Gas & Liquids Revenue $476,757 $447,404 $993,789 $ 816,195
Total Sales Volume (MMcfe) 110,136 94,483 216,259 176,198
Average hedge adjusted price ($/Mcfe) $ 4.33 $ 4.74 $ 4.60 $ 4.63
Midstream Revenue Deductions ($/Mcfe)
Gathering to EQT Midstream $ (0.74) $ (0.81) $ (0.74) $ (0.84)
Transmission to EQT Midstream (0.19) (0.24) (0.20) (0.23)
Third-party gathering and transmission (0.54) (0.59) (0.54) (0.61)
Third-party gathering and transmission recoveries,
net 0.20 0.25 0.66 0.32
Third-party processing (0.14) (0.11) (0.13) (0.11)
Total midstream revenue deductions (1.41) (1.50) (0.95) (1.47)
Average effective sales price to EQT Production $ 2.92 $ 3.24 $ 3.65 $ 3.16
EQT Revenue ($/Mcfe)
Revenues to EQT Midstream $ 0.93 $ 1.05 $ 0.94 $ 1.07
Revenues to EQT Production 2.92 3.24 3.65 3.16
Average effective sales price to EQT Corporation $ 3.85 $ 4.29 $ 4.59 $ 4.23
48
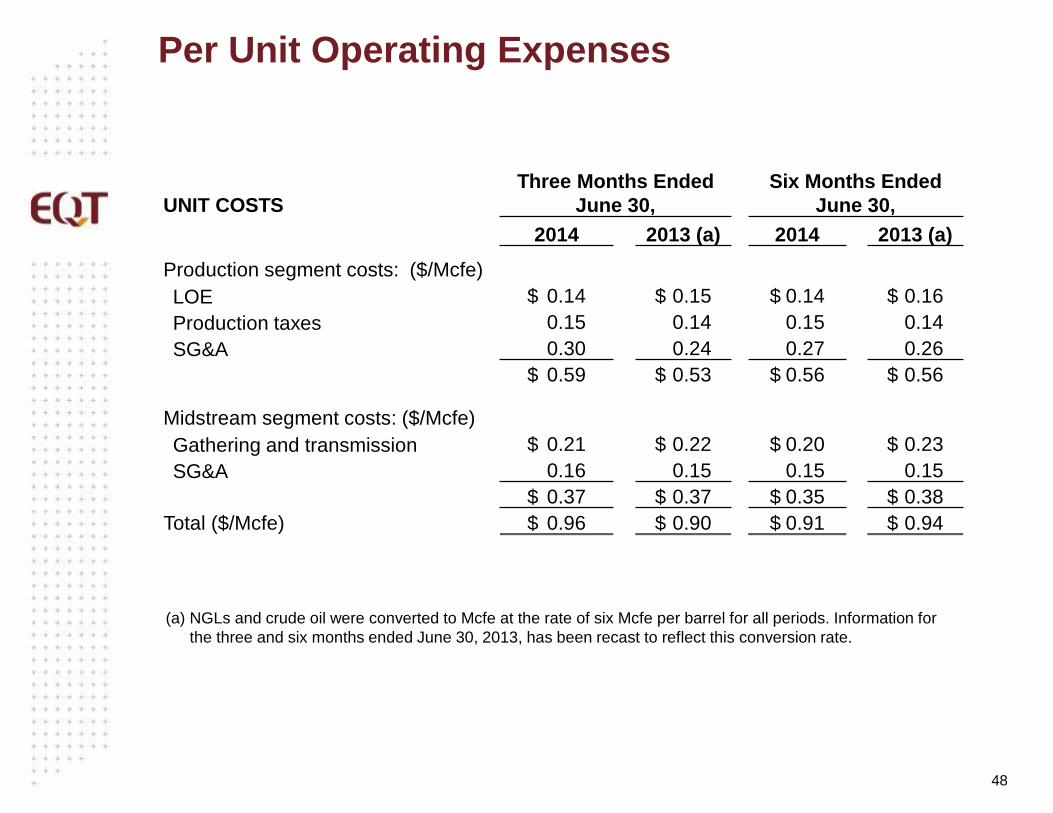
Per Unit Operating Expenses
UNIT COSTS
Three Months Ended
June 30,
Six Months Ended
June 30,
2014 2013 (a) 2014 2013 (a)
Production segment costs: ($/Mcfe)
LOE $ 0.14 $ 0.15 $ 0.14 $ 0.16
Production taxes 0.15 0.14 0.15 0.14
SG&A 0.30 0.24 0.27 0.26
$ 0.59 $ 0.53 $ 0.56 $ 0.56
Midstream segment costs: ($/Mcfe)
Gathering and transmission $ 0.21 $ 0.22 $ 0.20 $ 0.23
SG&A 0.16 0.15 0.15 0.15
$ 0.37 $ 0.37 $ 0.35 $ 0.38
Total ($/Mcfe) $ 0.96 $ 0.90 $ 0.91 $ 0.94
(a) NGLs and crude oil were converted to Mcfe at the rate of six Mcfe per barrel for all periods. Information for
the three and six months ended June 30, 2013, has been recast to reflect this conversion rate.

49
Appendix
Non-GAAP Reconciliation
(millions) 2008 2009 2010 2011 2012 2013
Midstream operating income $120 $154 $179 $417 $237 $329
Add: depreciation and amortization 35 53 62 57 65 75
Less: gains on dispositions – – – 203 – 20
Less: Big Sandy and Langley 23 32 31 14 – –
Adjusted Midstream EBITDA $132 $175 $210 $257 $302 $384
EQT Corporation Adjusted Midstream EBITDA