Embed Size (px)
Citation preview

1
POLITECNICO DI TORINO
Corso di Laurea Magistrale
in Ingegneria Energetica e Nucleare
Tesi di Laurea Magistrale
Scenario Analysis of biomass trade from Brazil to
Europe: challenges and opportunities
Relatori
Carpignano Andrea
Sauer Ildo Luis
Correlatori
Gerboni Raffaella
Grosso Daniele
Candidato
Flavia Digiacomo
Luglio 2018


1
TABLE OF CONTENTS NOMENCLATURE ..................................................................................................................................... 6
1. INTRODUCTION ................................................................................................................................... 8
1.1 CONTEXT ........................................................................................................................................ 8
1.2 OBJECTIVE OF THE RESEARCH ....................................................................................................... 9
1.3 METHODOLOGY ........................................................................................................................... 10
1.3.1 BACKGROUND ANALISYS ...................................................................................................... 10
1.3.2 ENERGY MODELS .................................................................................................................. 10
1.3.2.1 TIAM, PET and RECOR: a brief description. ....................................................................... 10
1.4 THESIS STRUCTURE ...................................................................................................................... 12
2. GLOBAL OVERWIEW OF BRAZIL ENERGY SECTOR ............................................................................. 14
2.1 MAIN CHARACTERISTIC OF THE COUNTRY ................................................................................ 14
2.2 CURRENT ENERGY SUPPLY IN BRAZIL ........................................................................................ 15
2.3 ELECTRICITY SUPPLY IN BRAZIL ................................................................................................... 16
2.4 CURRENT FINAL ENERGY CONSUMPTION IN BRAZIL .................................................................. 17
2.5 BRAZILIAN POTENTIALS AND CHALLENGES ................................................................................. 19
2.6 THE BRAZILIAN ENERGY SUSTAINABILITY .................................................................................... 20
3. GLOBAL OVERWIEW OF EU28 IN ENERGY SECTOR ........................................................................... 22
3.1 MAIN CHARACTERISTIC OF THE EU ............................................................................................. 22
3.2 CURRENT SUPPLY ENERGY MIX IN EU28 ................................................................................... 23
3.3 FINAL ENERGY CONSUMPTION OF EU28 .................................................................................... 25
4. THE MAIN ENERGY AND ENVIROMENTAL POLICIES IN BRAZIL AND EU28 ....................................... 27
5. BIOMASS IN BRAZIL ........................................................................................................................... 30
5.1 ETHANOL IN BRAZIL ..................................................................................................................... 33
5.1.1 THE BRAZILIAN ETHANOL SUSTAINABILITY .......................................................................... 44
5.2 BRAZILIAN WOOD PELLET AS EUROPEAN RESOURCE ................................................................. 45
5.2.1 THE BRAZILIAN WOOD SUSTAINABILITY .............................................................................. 51
6. SCENARIOS ........................................................................................................................................ 52
6.1 BASE RUN .................................................................................................................................... 53
6.2 RESULTS FROM THE BASE RUN OF REACCESS MODEL (BASE scenario) ...................................... 56
6.3 INPUT DATA FOR THE SIMULATION OF THE BIOMASS EXPORTATION FROM BRAZIL TO EU (“BIO
BRAZIL 2” SCENARIO) ........................................................................................................................ 59
6.3.1 TECHNICAL DATA AND ASSUMPTIONS ................................................................................. 60
6.3.1.1 PELLET ................................................................................................................................ 60

2
6.3.1.2 ETHANOL ........................................................................................................................... 61
6.3.2 ENERGY DATA AND ASSUMPTIONS ...................................................................................... 62
6.3.2.1 PELLET ................................................................................................................................ 62
6.3.2.2 ETHANOL ........................................................................................................................... 62
6.3.3 ECONOMIC DATA AND ASSUMPTIONS ................................................................................ 62
6.3.3.1 PELLET ................................................................................................................................ 62
6.3.3.2 ETHANOL ........................................................................................................................... 63
6.3.4 INPUT DATA FOR BRAZILIAN BIODIESEL ............................................................................... 64
6.4 RESULTS FROM BIO BRAZIL 2 SCENARIO ..................................................................................... 65
6.5 INPUT DATA AND HYPOTHESIS FOR THE SIMULATION OF ALTERNATIVE SCENARIOS (“ADV” and
“BIO BRAZIL 3” SCENARIOS) .............................................................................................................. 73
6.6 THE ADV SCENARIO RESULTS ...................................................................................................... 75
6.7 BIO BRAZIL 3 SCENARIO RESULTS ................................................................................................ 78
7. SUMMARY, CONCLUSIONS AND RECOMMENDATIONS .................................................................... 81
7.1 SUMMARY ................................................................................................................................... 81
7.1.1 THE POSSIBILITY OF GROWTH OF THE BRAZILIAN ETHANOL´S PENETRATION IN THE
EUROPEAN MARKET .......................................................................................................................... 82
7.1.2 THE POSSIBILITY OF THE BRAZILIAN PELLET´S PENETRATION IN THE EUROPEAN MARKET .... 84
7.1.3 COMPARISON OF SCENARIO RESULTS AND LITERATURE RESULTS .......................................... 85
7.2 CONCLUSIONS AND RECOMMENDATIONS ................................................................................. 86
REFERENCES .......................................................................................................................................... 88
ANNEX ................................................................................................................................................... 94
AKNOWLEDGMENT ............................................................................................................................... 97

3

4
ABSTRACT
In this study, the compatibility of two converging environment-oriented policies is analysed. The first
approach corresponds to the aim of the European Union (EU28) at reaching the energy goal
established in the latest global climate agreements (i.e. COP21 and COP22), focusing in particular on
diversifying the energy matrix and on increasing the energy security. The second approach is the
commitment of Brazil to exploit its wide potential in terms of raw material for the production of
biomass and thus bioenergy. The main question is whether the exportation from Brazil to Europe could
be convenient for both parties from the economical point of view and, concomitantly, if the actual
Brazilian potential is able to satisfy the external demand of biomass in term of quantity, quality and
sustainability. In the first part of this study, the current global energy situation in Brazil is described,
paying attention in particular to the biomass sector and underlining both opportunities and limits
considering different points of view (e.g. production, logistic, policies, and laws). The present energy
situation in Europe and its energy policies linked to the biomass sector are then illustrated. After this,
some scenarios, in which the role of biomass trade from Brazil to Europe is assessed, are designed
(using the model generator TIMES). It was possible to obtain some model’s proposed trends in a time
horizon that spans up to year 2040 mainly related to the international commodities trade between
South America and Europe in terms of energy content. Constraints and hypothesis have been
considered with the aim of realizing a model as close as possible to reality.
Results from modelling are the Brazilian biomass production and trade potential and, at the same time,
the European biomass consumption and import potential. All these results are included in a current
global context because obtained using a global model in which a competition between energy systems
of countries from all part of the world is a key feature, respecting the actual environmental policies on
biofuels. Furthermore, all scenarios results are compared with literature values. The main conclusion
from the analysis is that pellet, ethanol and biodiesel trade is interesting for both parties because the
implemented BR-EU corridors are always chosen by the model at expense of other corridors between
EU and other external Countries. Another very important point is that the recent introduction of
regulations, which force advanced biofuels penetration in the EU energy mix, will be reducing the
consumption in transport sector of other energy source like first generation (1G) biofuels and
hydrogen.

5

6
NOMENCLATURE
ABIPEL= Associação Brasileira das Indústrias de Pellets
ANEEL= Agência Nacional de Energia Elétrica
ANP= Agência Nacional do Petróleo, Gás Natural e Biocombustíveis
BNDES= Banco Nacinal do Desenvolvimento
CENBIO= Centro Nacional Brasilero de Referencia en Biomasa
CIF= Cost Insurance and Fraight
COFINS= Contribuicao para o Financiamento da Seguridade Social
CONAB= Companhia Nacional de Abastecimento
COP21= Conference of Parties
EU28= European Union - with 28 Member States
FIESP= Federacao das Industrias dos Estado de Sao Paulo
FOB= Free on Board
GAMS= General Algebraic Modeling System
GBEP= Global Bioenergy Partnership
GDP= Gross Domestic Product
IBGE= Instituto Brasileiro de Geografia e Estatística
ICMS= Imposto sobre a Ciirculacao e Mercadorias e prestacao de Servicos
IEA= International Energy Agency
IINAS= International Institute for Sustainability Analysis and Strategy
ILUC= Indirect Land Use Change
LCA= Life Cycle Assessment
LUC= Land Use Change
PET= Pan European TIMES model
PIS= Programa de Integracao Social
PRONAF= Programa Nacional de Fortalecimento da Agricultura Familiar
REACCESS= Risk of Energy Availability: Common Corridors for Europe Supply Security

7
RECOR= REaccess CORriod model
RES= Reference Energy System
ROW= Rest of World (with respect to EU)
RSB= Roundtable on Sustainable Biomaterials
TIAM= The TIMES Integrated Assessment Model
UNICA= União da Indústria de Cana-de-Açúcar
WBA=World Bioenergy Association

8
1. INTRODUCTION
1.1 CONTEXT
Due to favourable climatic conditions and the availability of land, Brazil is one of the world's largest
producers of raw material to produce bioenergy. For example, according to a study published in 2017
[1], Brazil has 105 mega hectares of degraded area usable as forest suitable to produce biomass for
the production of pellet, and it is the major producer of wood from planted forest. Moreover the
Annual Average Increment (AAI1) of planted forest in Brazil is higher compared with the rest of the
world in a range between 30% and 50%, [2]; the wood residues (from forest and from agriculture)
generated in 2016 in Brazil corresponds to 47.8 Mt [2], which is almost equivalent to 14.5 Mtep; Brazil
is also the second ethanol producer at world level (about 37% of the global ethanol production, with
about 28 Mm3 produced in 2016, [3]), and the first world producer of sugarcane (651,841 Mt produced
in the crop of 2016/17, [4]). Hence, it is of great interest to know the potential of this country in terms
of export in an era in which the biomass market in general plays an important and coveted role.
In particular it is studied here the possibility of Brazilian exportation to the European Union (EU282)
which is actually one of the biggest consumer of bioenergy. It is demonstrated by the last biofuels
statistics [5]: around 18.1% of EU heating and cooling was renewable (2016) [6], with biomass
representing the largest contribution; the EU28 is the world´s largest wood pellet consumer (about Mt
22.2 of pellet consumed in 2016 [5]), and the heat and power consumption from solid biomass is
almost 45% [5]. That occur because the European Union needs to diversify its energy mix and thereby
to increase its energy supply security, to reduce its GHG gas emissions which is today one of the major
common targets to light the climate change. Moreover, with the modification of the Renewable Energy
Directive (the RED that became RED II)3, some mandatory percentages on the use of biofuels in
transport were imposed (7% of conventional biofuels), as a contribution to ensure that EU will produce
at least 27% of its energy from renewable sources in 2030. But the actual blending of bioethanol and
biodiesel in transport fuels (3.3% and 5.8 % respectively [5]) are far below the targeted 10%. These
data show that the EU is not able to produce biomass in enough quantity to satisfy its internal demand;
thus, an importation from third countries could help in reaching its objectives.
Thanks to many studies available in literature [7, 8, 9, 10], it is already well-known that the only two
competitive markets from Brazil to Europe in term of biomass are the ethanol and the pellet ones (the
reasons in favour of this assumption are explained in this study). Biodiesel is excluded from the analysis
because its production costs in Brazil are very high and the quantity too low to be exported in Europe
with acceptable economic profits. Considering all these reasons, only pellet and ethanol are analysed
here as export products.
As the statistical data of UNICA, ANP, ANEEL, CONAB etc., and literature [3, 11, 12, 13] demonstrate,
the ethanol exportation is already developed and affirmed, while the participation of Brazil at the
world pellet production is less than 4% (EU contribute for 50% in the pellet world production [5]), and
1 AAI is the volume by which the forest grows per unit area over a 12 month period. 2 EU28= Austria, Belgio, Bulgaria, Cipro, Croazia, Danimarca, Estonia, Finlandia, Italia, Lettonia, Lituania, Lussemburgo, Malta, Paesi Bassi, Polonia, Portogallo, Regno Unito, Repubblica Ceca, Romania, Slovacchia, Slovenia, Spagna, Svezia, Ungheria. 3 RED= Renewable Energy Directive 2009/28/EC; RED II= Renewable Energy Directive (EU) 2015/1513.

9
only USA and Canada have an affirmed and developed wood pellet international market. Their
exportation is mostly destined to EU since Europe at the present time is the biggest producer and the
biggest consumer of pellet in the world (10.8 Mt produced in 2011 [14, 15], and 15 Mt in 2015 [16]),
with a final balance resulting in a deficit. The possibility for Brazil to become one of these supply
countries is high but not obvious. The difficulties are discussed below. Moreover, in this study the
prospective solution developed in a recent study done in the Sao Paulo University [2] was considered
for the estimation of the pellet production in the future: the production of pellet from short rotation
eucalypt wood and passing through a chlorine purification process4. This solution has been shown to
be very promising and feasible end it was also mentioned by others scientific studies like the IEA pellet
report [1]; for this reason, it was taken into consideration.
1.2 OBJECTIVE OF THE RESEARCH
In this work, the main objective is to simulate and analyse the exportation of ethanol and pellet from
Brazil to Europe and see how it can influence the whole energy system, using the TIMES model
generator. In other words, an updated set of biomass energy Corridors has been implemented in an
existing world energy model; the description of the model and of the framework is available in
Paragraph 1.4 The updated model has been run to study a set of scenarios based on the availability
and/or forced demand of biomass.
The scenarios obtained may occur because they are based on available real data and on hypotheses
considering the current situation. To do this it was necessary a preliminary deep research and
bibliographic analysis to understand the problem, to have specific and reliable technical, economic and
socio-economic data about the analyzed biomass (i.e. production, demand, % of exportation, trade
4 (Why Eucalypt wood?) From a productive point of view, Brazilian eucalypt has higher values comparing with
the rest of the world: the traditional planted forests of Eucalyptus in Brazil have an average yield of 287 m3 / ha,
in 7 years, around 25 tons per hectare year; while in Sweden, for example, to obtain this same production, would
require 10.2 ha. In addition of this, eucalypt is known for its ability to grow in degraded fields. Despite this, for
the moment, the use of wood from planted forests (currently destined to serve the pulp and wood panel sectors,
among other productive sectors), does not reach competitive production costs in the biomass market for energy
use as well as for the production of wood pellets, [2].
(Why short rotation?) The solution could be to increase the number of plants per hectare aiming at the greater
production of biomass in smaller useful area. This is possible with the production of forests (suitable for the
production of biomass for the production of pellets) with short rotation, which allow almost twice the
productivity per hectare of traditional planted forests, with the same productive cost, ( yields of about 45 tons
of dry mass per hectare in cycles of 1 years ), [17].
(Why purification process?) The drawback of Brazilian eucalypt wood is the high concentration of chlorine and
other impurities that must be reduced to comply with the sustainability prerequisites dictated by the European
standards. However, also this problem seems to be resolved thanks to a recently discovered process that consists
of removing chlorine and other inorganic substances (i.e. alkali metals) from eucalypt wood, in order to allow
the production of solid biofuels (wood pellets or others) free of dioxins and corrosive compounds resulting from
combustion, in order to meet the requirements of the European standard, thus allowing access to the
international market for wood pellets.

10
variables, production and transportation costs, policies, etc.), and so to be able to evaluate the long-
term (up to 2040) effects of the scenario created.
1.3 METHODOLOGY
1.3.1 BACKGROUND ANALISYS
The studies that have been useful for the realization of this thesis can be subdivided into 3 different
typologies: 1. Official databases and statistics for the collection of numerical data; 2. Articles and
manuals for practicing the modelling tools (e.g. the use of the TIMES interfaces); 3. Scientific papers
and texts to deepen the analysis and knowledge of the background concepts such as sustainability and
biomass utilization, processing and trade assessments.
Among type 3 references we can mention P.F.A. Shikida et al. [18] who write about the possibility to
diversify the supply of energy increasing the use of bioenergy from biofuels investigating the Brazilian
and the European experiences. Another study was done in 2014 by IINAS [19] to highlight the
challenges and the opportunities of the trade of energy wood for developing countries and, in
particular, the case of Brazil with the cooperation of CENBIO is also studied [19]. In 2011 a report [20]
on the impact of the Brazilian ethanol exportation was realized. It underlines both the impact and the
potential of the ethanol exported from Brazil and its previsions result in line with the actual situation.
1.3.2 ENERGY MODELS
Taking into account all issues explained above, some scenarios have been developed here, with the
aim to simulate a connection (the Corridor) between Brazil and Europe. The energy models utilized are
PET, TIAM and RECOR (the union of these three models is known as REACCESS model) and all these
are TIMES based. The simulations give as output the trend of the specific trade analysed in term of
emissions and energy flows, from 2015 to 2040. The time horizon chosen is divided into periods and
the decisions taken by the model refer to the central years of each time period (they are called
´´milestone years´´).
The optimal solution calculated by the model is found minimizing the objective function that is the
system cost. The data of the base year is given as input, (like supply quantities, end-use demands,
feedstock prices, technical and economic parameters, policies, etc.), on the base of the research done
in the first part of this study; some of these data, projected in the future on the base of some
hypothesis, are given as input too. The outputs of the model are calculated also thanks to some
macroeconomic inputs (like GDP, population, etc.), called drivers.
To do this, a preliminary detailed research on Brazilian energy system was necessary to understand its
real biomass exportation potential and to find all the values necessary for the realization of the
scenarios. In addition to this it was necessary a preliminary knowledge of TIMES and the models used;
in the next paragraph there is a brief description of them.
1.3.2.1 TIAM, PET and RECOR: a brief description.
TIMES was developed by the IEA-ETSAP (Energy Technology Systems Analysis Program) and was
derived from the model generator MARKAL (MARket Allocations). It is a model generator because with
it, it is possible to construct a model defining a Reference Energy System (RES), that is the description
of the energy chain including the mining, the production, the transformation, the trade and the end

11
use of all energy forms. The RES is made of several technologies and commodities logically interrelated
one with the other. A technology is any process that produces, transforms and/or consumes a
commodity. It is characterized by technical and economic parameters (like activity, capacity, technical
life, investment cost, etc) and by emission coefficients. The commodities are any form of energy,
material or emissions. The end-use is composed by five sectors (industry, agriculture, commercial,
residential and transport) and each sector has a demand profile which can variate between weeks and
within weeks can variate in day/night and peak periods. Energy demands are determined by several
exogenous drivers (such as GDP growth, population growth) through the application of demand
elasticities. In addition to the drivers, also elasticities, technology costs and parameters, climate
parameters are exogenous to the model.
TIMES describes the energy system analyzed using a system of linear equations. The set of linear
equations describing the model is then solved (using Linear Programming) to find the ideal solution;
this is done by minimizing the objective function (which is the minimum cost of the energy system)
according to a number of input and constraints defined by the user, in medium or long-term time
horizons (the longer time horizon extends up to 2100).
Typical input data are:
- Demand at the base year and the projections;
- Supply;
- Policies (emission coefficient, incentive, taxes, etc);
- Technical and economical data (timelife, energy cost, investment cost, etc).
Typical output data are:
- Commodities flux in the time;
- Emissions in the time;
- Commodities prices;
- Objective function (the minimum cost of the system).
All these data are implemented using an interface, developed by KANORS company, called VEDA Front-
End for the introduction of the inputs and VEDA Back-End for the reading of the output.
The optimization models that TIMES generates are: linear; rich in technological data; bottom-up
forecasting; demand-driven (the energy demands are exogenous to the model); with a partial
equilibrium approach. So, all the investment decisions are made by the model in each time period with
full knowledge of future events (future energy demand of a sector, future price of a commodity, etc.)
and with an economic equilibrium approach for the energy markets, corresponding to the point of
intersection between the supply curve and the demand curve. It means that the model works always
assuming an economic equilibrium for each energy market5.
PET, TIAM and RECOR are three models based on TIMES and so they have all the features just
described.
5 A market is said to have reached an equilibrium at prices p and quantities q when no consumer wishes to purchase less than q and no producer wishes to produce more than q at price p, [35]. In other words: the production of energy products is always equal to its consumption.

12
TIAM is the model of the energy system of the Rest of world (ROW) with respect to Europe (EU). It
initially included the RES of the following 15 regions: Africa, Australia-New Zealand, Canada, Central
and South America, China, Eastern Europe, Former Soviet Union, India, Japan, Mexico, Middle-East,
Other Developing Asia (ODA), South Korea, United States, and Western Europe. Then, the EU was
isolated as one region and 3 regions were modified: Western Europe, Former Soviet Union and Eastern
Europe were substituted by Russia, Central Asia and Other Europe. Each region is linked with the others
by energy trades and emission permits. The RES of TIAM contains more than one thousand
technologies and one hundred commodities in each region and its time horizon is from 2005 to 2100.
PET has a separate representation of each member state (27 European Union states plus Iceland,
Norway and Switzerland) and of the energy trades between the states. KANLO company defined the
RES for each country model. Since it is TIMES based, the RES of each state is very well defined in
technology. Each technology described with economical and technical data. PET uses the partial
equilibrium of TIMES, where the demand for energy services depends endogenously on own price
elasticities [36]. It may be used as an integrated EU model or as a series of stand-alone models for each
member state [36] and its time horizon is from 2005 (the base year) to 2100.
RECOR was born after (2009) the other two models as a tool to analyze the European energy imports
and the risk of European energy availability. It links PET and TIAM in a macro energy model composed
by 45 regions: 30 European states of the PET model plus 15 regions of the ROW of the TIAM model.
The integration of TIAM with PET was done subtracting the European region from TIAM, in this way
was created a continuity in the supply and demand energy of ROW: the resource supply of TIAM is
represented by a separate module that also feeds the European model (PET) through the corridors. A
corridor is represented as a process. It starts from the region of the ROW and goes to Europe. A corridor
can be considered as a series of different branches because in each region it has to have parameters
(like cost, risk, etc) typical of that region. The branches also include feeder branches that collect energy
in some region of the ROW and concentrate it in one or several corridors. RECOR includes hundreds of
corridors each composed of several branches. This new process type was coded in the GAMS code of
TIMES and is now a permanent feature of the TIMES generator [35].
1.4 THESIS STRUCTURE
The structure of this work is basically divided into 3 main parts:
1. Review of the actual energy system of both European Union (EU28) and Brazil, and description
of the actual energy policies linked with the biomass sector (chapters: 2, 3, 4, 5);
2. Description of the scenarios, of the hypothesis done to generate them and of the results
obtained by the simulations (chapter 6);
3. Summary and conclusions (chapter 7).
The development of the first part of the work (research statement, review, state of the art, data
collection, hypothesis) took place at the Institute of Environment and Energy (IEE) of the San Paolo
university in Brazil. This was essential for getting to know the Brazilian reality concerning biomass, as
well as the real potential and current interests in this field. The opportunity to speak personally with
specialists in the field and receive information on site, helped to grasp some details that probably could
not have been grasped if working from Italy.

13
For the second part of the work (simulations and analysis of the results) instead, the time spent at the
Turin Polytechnic was fundamental having direct access to the model and to a workstation needed for
the simulations.

14
2. GLOBAL OVERWIEW OF BRAZIL ENERGY SECTOR
This chapter aims at giving an idea of the current energy balance in Brazil in order to highlight its export
capacity, in terms of energy, to the rest of the world.
2.1 MAIN CHARACTERISTIC OF THE COUNTRY
With an extension of about 8,515,767 km2, Brazil is the biggest of South America's countries and the
fifth largest in the world in terms of area and population. It counted about 207,000,000 of inhabitants
in 2016 and about 209,000,000 in 2017 [37]. It was estimated an average growth of 0.6% during the
next ten years, [38]. The biggest growth will be in the North and Central-West area.
About the economic activity, Brazil manifested a hard decline on GDP during 2015 (-3.8% with respect
to 2014), and during 2016, (-3.6% with respect to 2015), [39]. Looking at the historical series, this was
the largest worsening in the history of the country, with a similar occurred in 1930-1931. A fall in GDP
means that the country had an economic recession.
The GDP at current prices6 registered in 2016 was 2,080 GUS$ [39].
Since Brazil is a big player in the world market of agricultural commodities and it has an increasing
exportation of primary sector products (agriculture and mining), an economic revival is likely in the
next years but for the moment Brazil is still under the world GDP averages. In the following line graph
(Figure1), there is the comparison between different GDP time series at current prices in GUS$, [40].
Figure 1: GDP at current prices in GUS$; comparison between Brazil, developed countries, developing countries (Brazil is included here), EU28 and world trend [40].
6 Gross Domestic Product represents the total value at current prices of final goods and services produced within a country during a specified time period.
0
10000
20000
30000
40000
50000
60000
70000
80000
90000
19
80
19
82
19
84
19
86
19
88
19
90
19
92
19
94
19
96
19
98
20
00
20
02
20
04
20
06
20
08
20
10
20
12
20
14
20
16
GU
S$
YEARS
Brazil
Advanced economies
Emerging market anddeveloping economies
European Union
World

15
2.2 CURRENT ENERGY SUPPLY IN BRAZIL
The actual (2016) internal available energy7 in the country is about Mtep 288, and the various percentage
contributions on total showed in Figure2 [38].
Figure 2: Brazilian energy supply, [%] [38].
The previous pie chart (Figure2) includes the whole Brazilian energy supply divided into energy type in terms
of percentages. It can be described splitting the renewable energy sources from the not renewable one as
Figures 2.1 and 2.2 show.
Figure 2.1: Share of not renewable Brazilian energy supply in 2016 [38].
7 It is calculated as the algebric sum of production (+), export (-), import (+) and losses, reinjection and changes of stocks (+ or -) [38].
petroleum and oil products
natural gas
coal&coke
uranium
other not REN
hydraulic
wood and charcoal
sugarcane and products
wind
others REN
64%
22%
10%4%
petroleum and oil products
natural gas
coal and coke
uranium and others not REN

16
Figure 2.2: Share of renewable Brazilian energy supply in 2016 [38].
Considering these values, the amount of fossil fuels in the domestic energy supply is about Mtep 163 and the
renewable sources represents about 45% of the Brazilian energy mix (see Figure 2). This percentage is higher
than the world´s average registered in 2016 and at the same time higher than the one registered in Brazil in
2015 (about 43%). A direct consequence of the reduction of energy production by fossils sources is the
reduction of CO2 emissions (it decreased from 1.55 tCO2/tep in 2015 to 1.48 tCO2/tep in 2016) [42].
Among the fossil sources (Figure2.1) the largest parts in terms of quantity are: petroleum and oil products
(64%) and natural gas (22%); among the renewable ones (Figure 2.2): sugarcane products (38%) and
hydroelectric (27%), [42].
2.3 ELECTRICITY SUPPLY IN BRAZIL
It is interesting to show the domestic electricity supply by source (Figure 3).
Figure 3: Domestic electricity supply by source [%] [38].
27%
18%38%
2% 5%
10%
hydraulic
wood and charcoal
sugar cane products
wind
solar
others REN(solar, biodiesel, biogas,industrial gas of charcoal, black liquorand other biomass)
Hydropower
Biomass( Includes wood, sugarcanebagasse, black-liquor and other)
Wind
Natural gas
Oil products
Nuclear
Coal and coal products

17
As Figure 3 shows, the electricity production by not renewable sources in 2016 is of 18% and it was of
25,9% in 2015 [38]. The generation of electric power in 2016 was of about 59,971 ktep and, as is shown in
Figure 3, the main source of generation was the hydraulic [38].
2.4 CURRENT FINAL ENERGY CONSUMPTION IN BRAZIL
The main indices of the final energy consumption8 are listed in the table 1:
Index (2015) Values
Final use of energy [Mtep] 256
Final use of energy per
capita[tep/capita]
1.43
Energy intensity [9] [tep/kUS$(2010)] 0.1
Table 1: Brazilian final energy consumption index (2015) [43].
In the left side of Figure 4 is visible Brazil is far from the average consumption per capita level of the
developed countries (2015). Infact it has only 1.43 tep per capita placing itself at the penultimate place
compared to the seven countries shown in the graph. After him only India.
Figure 4: Energy consumption per capita and energy intensity of some representative countries of the world (2015) [43].
Generally, less energy is consumed when economies are experiencing a recession and this is proved by the
economical values shown in the previous chapter (decrease of GDP between 2014 and 2015).
8 It not includes losses in distribution and storage energy and losses in transformation processes. The sum of the Final Energy Consumption, losses in distribution and storage and losses in production processes is called ``Gross Inland Energy Consumption``, also known as Domestic Energy Supply. 9 It is the total energy consumption per unit of GDP (PPP).
0
1
2
3
4
5
6
7
tep
/cap
ita
Energy consumption per capita [toe/capita]
0
0,05
0,1
0,15
0,2
0,25
tep
/kU
S$(2
01
0)
Energy intensity=energy consumption/GDP[toe/10^3(2010)US$]

18
In the right side of the same Figure 4, it is represented the energy intensity of the same seven countries in
2015. Excluding Russia, which ranks first, distancing itself a lot from other countries, the values oscillate
between 0.16 of the China and 0.09 of the Germany. Brazil, as well as Japan, has an energy intensity of 0.1.
In accordance with the ANP statistics, there was a reduction of energy intensity compared with the previous
year (2014), despite the GDP fell from 2014 to 2015, and it is linked with an increase of the energy efficiency
and the change in the request of energy by the different sectors.
Looking at the final energy consumption by sector, it is evident how the predominant sectors are the
industrial sector (31.5%) and the transport ones (32.2%). Between the 2015 and 2016 there was a reduction
of 2.2% (5 Mtep) in the energy consumption. Figure 5 quantifies the consumption by sector in 2015 and in
2016:
Figure 5: Energy consumed by different sectors in 2015 and 2016, [Mtep] [42].
As far the transport sector is concerned it is estimated an increment of the passengers and freight vehicles
of 4% and 3.5% until 2026 [44] and an increment of about 4% in rail's transports [44]; this means that there
will be obviously consequent growth of the total energy demand. The estimated average growth is 1.6%
between 2016 and 2026 [44] and it will be satisfied by a larger percentage of ethanol (17%) and diesel oil
(43%) with respect to the other forms of energy.
With regards to the energy consumption by source (see Figure 6 and Table 2), the fossil sources (natural
gas+coal+oil products) exceed the renewable share (wood and charcoal+sugarcane products) with a
percentage on the total energy consumption of 53,5%. However, considering the actual environmental
policies and energy targets, they are not destined to grow in quantities because the contribution given by
the source of energy with less GHG gas emissions (electricity from renewables, sugarcane derivatives,
biodiesel, waste obtained in the pulp production process, charcoal) will probably become more and more
important. Infact, it can be considered that the electricity is destined to increase (thanks to the electric cars),
as well as the cane derivatives, like ethanol because it can substitute heavy vehicle gasoline. It has to be
underlined the ethanol in Brazil can be blended with gasoline in its anhydrous form, with fixed percentage
0
10.000
20.000
30.000
40.000
50.000
60.000
70.000
80.000
90.000
2015 2016
Mte
p
YEAR
Industrial sector
Transport sector
Energy sector
Othersectors(agriculture,trade,public,housing)
Not energy sectors

19
which, with the Brazilian low n° 13.033 (September 2014), must fall within the blending range of 18% to
27,5%. While hydrate ethanol can be sold as is without blending. As well as biodiesel will increase thanks to
the actual law n° 13.263 (March 2016) that says it has to be share with diesel at a rate of 8%. Waste from
paper production will also increase because the cellulose production is always growing in Brazil. On the
contrary, wood and vegetal coal will decrease in the final consumption because there are other sources with
a bigger energy efficiency (like LPG in the residential sector, for example).
Figure 6: energy consumption per source (2015), [%] [38].
ENERGY SOURCE ktep %
Sugarcane products 43,264 16.9
Wood & charcoal 21,248 8.3
Electricity 44,288 17.3
Coal coke, tar, steam coal 11,520 4.5
Natural gas 17,408 6.8
Oil products 108,032 42.2
Other (biodiesel, black liquor, ...) 10,240 4 Table 2: ktep consumed in Brazil per sources [38].
2.5 BRAZILIAN POTENTIALS AND CHALLENGES
Brazil is actually the second major exporter of ethanol in the world but its actual exportation of other biomass
is limited compared to its real production potential. For example, only 2% of the total wood from the planted
forest is actually exported [21]; furthermore, most of the wood residues generated from wood factories are
left in the fields. It is necessary for the soil regeneration but the percentage that the soil requires is much
lower than the one is left on it, so the wood residues remain only a potential gain since it could be reused or
used to produce bioenergy (production of vegetable coal, thermal energy and electricity).
4,506,80
8,30
16,90
17,30
42,20
4,00
coal and its products
natural gas
wood and charcoal
sugarcane products
electricity
oil products
other(biodiesel,black liquor,..)

20
Comparably to what is explained in the literature [11, 16, 22] these limitations are caused by problems linked
to external and internal legislation, lack of subsidies and investments, a need of specific policies for the use
of lignocellulosic residues, and other diverse economic and social aspects. For example, the high import
duties imposed on ethanol imports in EU to protect European producers, which are subsidized, make the
exportation less profitable. Besides, while the Brazilian logistic structure is well consolidated for ethanol, it is
not the same when one considers the wood pellet: in Brazil there is lack of adequate ports for biomass export
and the storage and transport systems are inadequate for the market.
In addition to this, the sustainability is another big challenge. To achieve the goals of GHG emission savings
and to use alternative energy sources instead fossils ones (such as coal, oil, natural gas), it is necessary that
the fossil-replacing energies be sustainable under all the points of view. For this reason, the EU28 policy for
renewable energy (composed by Climate Change Package and Fuel Quality Directive) includes the RED II that
regulates the sustainability of all kinds of biomass with specific requirements. These criteria are available in
term of quantities in a certification system called ENplus10 for residential use and ISO18122 for industrial use.
The certification is valid for the internal trade and for imports, and it is based on the following main
characteristics: (1) the greenhouse gas emission savings from the use of biofuels must be at least 50 % (in
2017) compared to fossil fuels; (2) the biomass is not to be derived from land with high biodiversity value;
(3) the biomass is not to be derived from land with a high carbon stock (lands that contribute in a particular
way to reduce CO2 from the atmosphere, thanks to the process of photosynthesis of plants) [6].
Consequently, the commodities made available from the supply country, and in this case from Brazil, must
have these characteristics to be exported and, at the same time, be socially and economically competitive.
That is the principal challenge of solid and liquid Brazilian biomass trade to the European Union.
2.6 THE BRAZILIAN ENERGY SUSTAINABILITY
There are a lot of studies on the Brazilian biomass sustainability due to the general awareness that an impact
on the system and on the ecosystem needs to be avoided. The predominance of biomes in the Brazilian soil
(the 62% of the total 851 Mha of the country is constituted by biomes like Amazon forest, Pantanal (wetland),
etc.), has always raised the question on the impact on biodiversity, direct and indirect change land use (LUC;
ILUC), misuse of the land (food VS biofuels crops), deforestation. These are considered the most important
environmental impacts to address, mainly for GHG and ecosystems, but they are not the only ones.
Moreover, the sustainability is not only linked to environmental aspects but to social and economic aspects
as well.
According to the IBGE [23] the problem of the land availability in Brazil is mainly linked to agriculture and
breeding, that are in a continuous increase year after year. For example, the deforestation linked with pine
and eucalyptus cultivation (used for energy wood production) representsonly the 2% of the total area of the
country; moreover since the sugarcane expansion mainly concerns the Center-South of Brazil, the
deforestation cannot be linked to sugarcane expansion crop because it is far from biomes and also because
the climatic conditions for a good growth of sugarcane are different from the ones of Amazonia or the other
Brazilian biomes; while the 65% of deforestation of the Brazilian biomes, is caused by the agriculture
expansion and the 33% by the breeding expansion [23]. Other Brazilian studies [18, 24, 25, 26] show that the
land needed by sugarcane production is small compared with other large-scale crops (cacao, coffee, corn,
etc.); in addition to this and according to a study done in 2011 [27], the indirect land-use change (ILUC) effects
of ethanol expansion resulted in only about 0,14 ha of new land coming from previously unused land for each
new hectare of sugarcane and this value is higher than the values found in Brazilian literature [27]. However,
10 It is avaible in the annex a table reporting the ENplus and the ISO certification.

21
there are also some studies which show the impact that would occur if the biofuels production expanded
into biomes the consequence of which should not be overlooked.
To keep under control the growing crops (like sugarcane, palm, corn, etc.) utilized for the biofuels production,
in Brazil there are dedicated mapping systems that take into account various sustainability indices that must
be respected. The land zoning is an important methodology that facilitates the correct use of the soil thanks
to established guidelines that aim to protect and recover forests and water sources in sugarcane plantations,
to control erosion and the content of the water flow, to stipulate a proper pesticides management, to
encourage the reduction of air pollution and solid waste from industrial processes. All this allows to estimate
some fundamental environmental parameters (i.e. water consumption, emissions of atmospheric pollutants,
existing biome conservation, soil and topographical restrictions, etc.).

22
3. GLOBAL OVERWIEW OF EU28 IN ENERGY SECTOR
This chapter will describe the current European energy situation with the aim of highlighting the current
import trend in the sector.
3.1 MAIN CHARACTERISTIC OF THE EU
In this study it is chosen to consider only the 28 countries of Union Europe (EU), so all data refer to them.
It has to be remembered that each EU country is a unique reality. This means that GDP and demographic
growth, for example, may vary greatly from one country to another. Each country also applies its own
strategy.
However, since the purpose of this study is to analyze the biofuels flow from Brazil to Europe, here the EU is
seen as a single entity and so all data describe an average trend of all 28 countries.
Europe extends over 4,326,253 km2 and counts about 508 million of inhabitants, [45]. Every year births
outweigh the deaths so the European population is increasing. The population increases also for the positive
migratory balance.
The economic situation of EU28 is described by a GDP at current (2016) prices in GUS$ of 17,110 [40].
Just to give a full view of the differences in the GDP values of the 28 countries of EU, Figure 7 below shows
the historical series (from 1980 to 2016) of GDP per capita in US$ per capita.
Figure 7: GDP per capita, current (2016) price; US$ per capita: values for the 28 countries of EU from 1980 to 2016 [40].

23
It can be seen how the trend is almost similar for all 28 countries during the time: it is continuing to increase
with some oscillations. The most relevant increase was from 2001 to 2008.
Luxembourg is the only state that differs from others with a GDP per capita of 103,160 GUS$ per capita in
2015 (it is much higher than the EU28 average GDP per capita registered in the same year: 32,280 GUS$ per
capita); while all the rest of the countries registered values between 7,020 (Bulgaria) and 62,340 (Ireland)
GUS$ per capita, in 2015.
3.2 CURRENT SUPPLY ENERGY MIX IN EU28
The total primary energy production in 2015 in EU28 was of 767 Mtep; 0.8% lower than in 2014 [45]. That is
splitted into source type with the percentages showed in Figure 8.
Figure 8: PRODUCTION OF PRIMARY ENERGY IN EU-28 (2015), Mtep [45].
The share of renewable energy is 27% of the total production (see Figure 8) which is equivalent to 205
Mtep. It is composed by the contributions of the different renewable energy sources as Figure 9 shows. The
higher percentage is given by the wood and other solid biomass with a production of 91.4 Mtep (44% of the
total renewable energy produced).
29%
19%14%
10%
27%
1%
Nuclear energy
Solid fuels
Natural gas
Crude oil
Renewable energy
Other not Ren

24
Figure 9: RENEWABLE ENERGY PRODUCTION (2015), [%] [45].
According to the EUROSTAT database, in the last ten years, there was a positive trend in production of
renewable energy and, at the same time, a negative trend in primary energy production of fossil fuels and
nuclear energy. The biggest decrease occurred in the production of oil products (-43.9%) and in natural gas
production (-43.5%) [45]. This resulted in an increase in the import of primary energy and energy products.
The actual main suppliers of energy sources to EU28 are Russia, Norway, and Algeria for natural gas;
Colombia, USA, and Russia for solid fuels; Russia, Norway, Nigeria for crude oil. An important thing to not
compromise the security of the supply is to diversify the external suppliers.
The total energy imported in 2015 was of 1,482,203 ktep [45] and it is subdivided into the energy sources
reported in the table 3:
Source of Energy imported in 2015
Coal Crude oil
Oil products
Natural gas
Electricity Biofuels and waste
ktep
151,511
600,353
338,103
341,181
35,289
15,761
Table 3: European (EU28) energy import in 2015 [45].
Imports were much lower than exports, in 2015. The total energy exported in 2015 was of 575,502 ktep [45]
and it is subdivided into the different energy sources listed in the table 4:
Source of Energy exported in 2015
Coal Crude oil
Oil products
Natural gas
Electricity Biofuels and waste
ktep
39,205
51,357
347,429
93,958
34,063
9,484
Table 4: European (EU28) energy export in 2015 [45].
5%
14%
13%
6%
3%
44%
8%
6%
1% 0%
Renewable wastes
Hydropower
Wind
Solar
Geothermal
Wood & other solid biomass
Biogas
Biodiesel
Biogasoline
Other liquid biofuels

25
3.3 FINAL ENERGY CONSUMPTION OF EU28
The final energy consumption in 2015 was 1,113 Mtep, while the Gross inland consumption of energy11
within the EU28 in 2015 was 1,627 Mtep, 1.2% higher than in 2014.
As it mentioned, each member of EU28 has its own energy system, energy mix, economy and since final
energy consumption depends on these aspects, it is very different among all Member States.
The different shares of the final energy consumption in terms of type of energy are listed in the table 5,
(2015):
Type of energy
Coal Crude oil Oil products
Natural gas
Geothermal, solar
Biofuels and waste
Electricity Heat
ktoe 35,701 2,389 462,514 241,080 2,525 87,770 235,707 45,874 Table 5: European (EU28) final energy consumption; ktep [45].
Oil products continue to be the most important energy source for the European economy while natural gas
remains the second most important energy source. According to Eurostat studies, the contribution of
renewable energy is increasing. It was about 13% in 2015 but there are very different values between the
member countries of EU28: in Latvia and Sweden, renewable energies accounted for over 35 % of their gross
inland energy consumption in 2015 (35.1 % and 40.5 % respectively) while the lowest share of renewable
energy in gross inland consumption was in Malta (2.6 %), Netherlands (4.7 %) and Luxembourg (4.9 %) [45].
Looking at the consumption by final use sector, the biggest part of energy in EU28 in 2015 was used in energy
transformation (26.0 %), followed by the transport sector (22.0 %), industry sector (16.8 %), residential sector
(16.9 %), services (9.0 %), non-energy use (5.9 %) and other (3.2 %). If we do not include the energy for
transformations and losses and the energy used for not energy consumption12, we obtain the final energy
consumption that was 1,113 Mtep (as discussed in the previous paragraph). It includes three dominant
categories: transport (33.1 %), households (25.5 %) and industry (23.5 %) as it can be seen in Figure 10:
11 Gross inland energy consumption represents the quantity of energy necessary to satisfy inland consumption of the geographical entity under consideration. It is defined as primary production plus imports, recovered products and stock changes, less exports and fuel supply to maritime bunkers (for sea-going ships of all flags). It describes the total energy needs of a country, covering: consumption by the energy sector itself; distribution and transformation losses; final energy consumption by end-users; non-energy use of energy products and statistical differences, (EUROSTAT definition [45]). 12 It includes fuels that are used as raw materials and are not consumed as fuel or transformed into another fuel. Non-energy consumption in 2015 amounted about 97 Mtoe, [45].

26
Figure 10: Final energy consumption in EU28 (2015) per sector of final demand [45].
23%
25%33%
13%
2%
4%
INDUSTRY
HOUSEHOLDS
TRANSPORT
SERVICES
AGRICULTURE AND FORESTRY
OTHER

27
4. THE MAIN ENERGY AND ENVIROMENTAL POLICIES IN BRAZIL AND EU28
In this chapter the general objectives and some of the most important directives of the Brazil and EU are
listed; in addition to these, a lot of projects are already ongoing and always in phase of evolution to improve
and guarantee the biomass production chain continuity and the growth of biomass market at the global level.
We are in a century in which there is the need to diversify the energy mix in order to increase the security of
supply. One of the global interests is also to reduce the greenhouse gases (GHG) emissions.
One way to do this for any country is to try to use renewable energy resources instead of fossils as much as
possible because it increases security in providing a service that it is vital for economic and social
development.
In 2014 the European Commission planned to reduce the greenhouse gas emissions of 40 % below 1990
levels, to increase the use of renewable energy to at least 27 % of total consumption and renewed the
objectives of 20-20-20 on energy efficiency policies (i.e. to reduce the primary energy consumption by 20%
by improving energy efficiency). All these objectives have been planned in order to be reached in 2030.
The European Commission, which has taken into account all the goals planned, also proposed a set of
measures to reach those targets. Among the proposed measures there is the one aimed at increasing the
share of energy from renewable sources and low carbon emission in transport. The practice was known as
the Directive 2009/28/CE or RED (Renewable Energy Directive) and consisted of introducing biofuel blending
obligations with traditional fuels. It established for all Member States the obligation in 2020 to cover 10% of
the energy needs of the transport sector through renewable sources but now it has been modified with the
Directive 2015/1513/CE. This defines the maximum limit of 7% (within 10% expected) for the use of first-
generation biofuels (like from cereals and sugary and oily crops) in the mix of final energy consumption in
transport; the remaining 3% must be covered by fuels derived from raw materials other than food (like
second generations biofuels from waste, lignocellulosic, discards or algae), by electric vehicles or electrified
rail transport. This change in the Directive has been made considering the potential impact deriving from the
use of soil for dedicated crops but also to protect the European biofuels producers. The same Directive,
according to the principle that biofuels must comply with specific sustainability criteria, also set a target of
50% reduction of GHG emissions produced in the entire lifecycle of biofuels with respect to fossil fuels (from
2010 to 2017 the reduction was of 35% and since 2018 must be 60%).
These proposals, like the others, are made based on analysis of current energy modeling scenarios projected
in the future, to avoid negative impacts on the current economy and society.
Referring to the world energy targets, there were two important conferences known as COP21 and COP22:
- the first in Paris in December 2015 in which the temperature limit increase was established to be below 2
°C (before 2100) compared to pre-industrial average and it has been said to try to extend this limit to 1.5 °C.
- the second in Marrakesh in November 2016 in which the agreements reached in Paris from 55 members
states (representing the 55% of the world GHG emissions) has been ratified.

28
In particular, during the COP21, Brazil established to reduce the GHG emissions of 37% (compared with 2005)
until 2025 (43% until 2030), to increase the use of renewable energy in the Brazilian energy mix up to 45% in
2030 and to increase the sustainable bioenergy13 up to 18% of the total energy mix in 2030. These targets
are based on some premises:
- The 13.263 law (March 2016) that give the obligation to use biodiesel mixed with fossil diesel with the
percentage of 8% (B8) in 2017, 9%(B9) in 2018 and 10%(B10) in 2019.
- The 13.033 law (September 2014) that give the obligation to blend gasoline with anhydrous ethanol with a
percentage that must fall within the blending range of 18% to 27,5%.
- The target production of 45 [Mm3] of ethanol in 2025 e of 54 [Mm3] in 2030.
- The construction of two nuclear plants by 2030.
As for Europe, also for Brazil, every energy choice is evaluated based on scenarios and on the history of
policy´s mechanisms adopted previously [46].
In the table 6 the goals of EU28 and Brazil that to have to be reached in 2030 are summarizedd:
Country Reduction of
GHG
emissions
Share of
energy from
renewable
sources
Energy
efficiency:
reduction of
primary energy
consumption
About transport consumption
EU28 40%(wrt 1990
level: Mt
CO2eq 5,244.2
[16])
27% (% of the
total final
consumption)
20% 10%RES in transport= 7% from
first generation biofuels + 3%
from second generations
biofuels
Brazil 43% (wrt 2005
level: Mt
CO2eq 827.5
[16])
45% and 18%
of bioenergy
(% of tot
supply energy
mix)
Obligation on blending the
diesel with specific percentage
of biodiesel
Table 6: Enviromental goals for EU28 and Brazil up to 2030.
With COP22, it was also funded the ´´Biofuturo´´ (the initiative started by the Brazilian government): an
international platform (20 countries relevant in the world market of advanced biofuels), which is committed
to maintaining the agreements reached in COP21 and accelerating the development and diffusion of
advanced biofuels, as a sustainable alternative to fossils.
In addition to this, at the European Biomass Conference & Exhibition (Stockholm, 2017), a project called
BECOOL was presented. It is a project conceived in Italy and it is being developed in synergy with another
Brazilian project called BIOVALUE which deals with the same themes. The main objectives of the projects are:
to identify integrated crop systems both for food production and for energy production, to identify advanced
13 Every biomass product (liquid, solid, gas), that can be used to produce energy.

29
logistics systems for the biofuels supply chain and to optimize the biochemical and thermochemical
transformation processes of biomass.
As far as Brazil is concerned, the Renova Bio is a plan that wants to increase the use of biofuels in Brazil (for
example, doubling the ethanol production from the actual 28 to 54 [Mm3] in 2030). It is based on the
exchange of "emission reduction certifications" measured in tons of carbon and not in subsides.
Currently, the only incentives in force are allocated to the acquisition of new vehicles in the Taxes on
Industrialized products (IPI) and in the Tax on the Circulation of Goods (ICMS) [47]. These subsidies
correspond to a tax on carbon of 80 US$ per tCO2 [47]. With the Renova Bio, the CO2 emitter becomes a
creditor in proportion to its emission. These credits are called CBIO (Biofuel Decarbonization Credit) and can
be traded in a "carbon market", which functions as a specific stock exchange for this purpose. These CBIO
will be a financial asset, traded on the stock exchange, emitted by the biofuel producer [47].
It is also important to mention some directives and bills related to solid biomass sector. In 2012, for example,
the bill 3.529/2012 has been promoted which, although it has not yet been approved, proposes the electric
generation from biomass and to make its price fall. It tries to guarantee investment on bioenergy that is a
social, environmental and economic benefit for Brazilian society. To do this it is essential to give tax benefits
and do competitive actions. There are also some financing programs from the government (PRONAF Florestal
e Eco PRONAF, Propflora and BNDES Florestal) and other private financing, that aim to help the reforestation
and the restoration of protected and degrades areas.

30
5. BIOMASS IN BRAZIL
In the first part of this chapter it is briefly described the entire biomass mix in Brazil. Then, considering the
Brazilian biomass balance, biomass that represents the major potential of exportation is described in detail.
First, it is useful to remember that biomass could be categorized according to its own origin and its final
utilization to better understand its production chain, potential and limits. One way to divide the origin of
biomass suitable for the Brazilian case is to differentiate woody, non-woody and organic residues biomass.
The following graph, elaborated by CENBIO, presents that classification and the main processes of conversion
of biomass into energy, [49]:
Figure 11: Biomass classification and conversion process from biomass to energy [49].
All the type of biomass available in the Brazilian energy mix belongs to one of the 3 macro sectors just
mentioned because it derives from a raw material (i.e. biodiesel can derive from residual frying oil, vegetable
oils, animal fat, etc.; ethanol can derive from sugar cane juice or from molasses) that belongs to one of these
three sectors.
As discussed in the previous chapters, among the renewable energy sources available in Brazil today (45% of
the total energy mix), about 30% includes biomass (of all forms: liquid, solid, gas). The percentages and values
in tep (2016) of each kind of biomass are listed in Table 7 [41] and showed in previous Figure 2 and 2.2:

31
Type of biomass
wood and charcoal
sugar cane derivatives (17.5% = 50.3 Mtep), of which:
Others (4,5% = 12,9 Mtep)
Unit quantities
23.1 Mtep
Ethanol: 14.4 Mtep
Cane bagasse: 35.9 Mtep
Biodiesel: 3,009 ktep
Biogas: 137 ktep
Black liquor: 8,447 ktep
industrial gas of charcoal: 83 ktep
others biomass: 1,130 ktep
Percentage
8%
5% of the total energy mix
12,5% of the total energy mix
1%
Table 7: The biomass (liquid, solid, gas) of the Brazilian energy mix [41].
To sum up, the contribution of bioenergy to the total primary energy supply registered in 2016 was of 86.2
Mtep [41].
In the final use of energy, the biomass represented the 30% in Brazil and so it counted 73,709 ktep in 2016
[41]. The use of biomass could be divided into 3 different main sectors: to produce electricity; to produce
thermal energy and as a fuel in transport.
The total final consumption in transport sector in 2016 was of 82,651 ktep [3] and the share of biomass was
of 20% (16,530 ktep).
Looking at the electric sector only, in the same year (2016) the share of renewables in electricity production
was about 81% [41]; in particular 49,236 GWh of electricity were produced from biomass (wood, cane
bagasse and black liquor) [41] representing about the 7.9% of the total primary electricity supply (619,693
GWh).
In the thermoelectric generation (2016), the biomass (sugarcane, black liquor, wood and others) contribution
was of 31% [41]. The 17% of the total electricity generated by thermoelectric power plants is given by solid
forest biomass (black liquor, charcoal and other wood residues).
The different types of biomass used to produce bioenergy in Brazil are:
- Firewood: this could be also a raw material because it can be used to produce charcoal and not just
electricity. For example, in 2016, of the total 51,603 kt of firewood, 22,997 kt were used for charcoal
production and 1,301 kt was used to produce electricity, while the rest of tons are lost during the
transformation processes, (15,997 ktep (2016) = 6.3% of the total final use) [41].
- Sugar cane bagasse used to produce electricity, (29,791 ktep (2016) = 11.7% of the total final use) [41].
- Black liquor used to produce electricity, (6,246 ktep (2016) = 2.4% of the total final use) [41].
- Ethanol used as fuel to transports and agricultural aircraft, (13,889 ktep (2016) = 5.6% of the total final use)
[41].
- Biodiesel used as fuel to transportation (3.8 Mm3 [42] which correspond to 2,970 ktep, calculated
considering a pci of 8,88*10-4 tep and a density of 880 kg/m3 = 1.16%). It grows up until 4.4 Mm3 in 2017 [42].

32
- Biogas used to produce electricity and thermal energy, (it was around 3,680 ktep= 1.44%, calculated for
difference between the total [ total mean the sum of biodiesel and biogas that is around the 2.6% of the
total final use and so it is around 6,656 ktep], and the biodiesel value which is around 2,970 ktep).
- Charcoal used to produce thermal energy but also used in the steel and iron production (3,529 ktep (2016)
[15] = 1.4% of the total final use).
Table 8 illustrates the energy balance of all types of biomass (in liquid, solid and gas form), in tep unit.
Summing all values of biomass energy, the total bioenergy obtained is shown in the second line of the Table.
Mtep in 2016 Available supply Final consumption Exportation Importation
TOTAL BIOENERGY 86.2 73.7
ETHANOL 14.4 (28.3 Mm3) 13.9 (27.7 Mm3) (1 Mm3) 0.935 Mm3
BIODIESEL 3 (3.8 Mm3) 3 (3.8 Mm3)
BIOGAS 0.137 3.7
WOOD AND
CHARCOAL
23.1 Wood: 16; (57.5
Mt)
Charcoal: 3.5; (5.5
Mt)
0
BAGASSE 35.9 29.8 (136.2 Mt) 0
BLACK LIQUOR 8.4 6.2
OTHER 1.2
Table 8: Energy balance per type of biomass (2016) [41].
As Table 8 shows, from the quantitative point of view the biomass exportation potential in Brazil could be
characterized by two main sources of energy: ethanol (Brazil is already the major exporter at word level), and
wood (actually Brazil is just a potential exporter because of some technical problems linked to many factors
that are discussed in chapter 5.2).
From literature [50, 51, 52] it is also known that, in addition to being produced in quantities necessary to
satisfy the domestic demand, the production cost of Biodiesel is too high and therefore not competitive on
the international market. This is due to a series of socio-environmental barriers that Brazil has not been able
to overcome yet.
The bagasse and the black liquor are sub products of ethanol and paper industry, respectively; they just
contribute, after being transformed into energy, to feed the same industry of which they represent the waste.
For these reasons, it makes sense to deal exclusively with ethanol and wood biomass exportation. However,
they are some issues as well that need to be taken into consideration and that will be explained in the next
chapters.

33
5.1 ETHANOL IN BRAZIL
Ethanol is a chemical substance with a C2H6O molecular formula. It is one of the two major biofuels utilized
in Brazil. It is used in internal combustion engines with spark ignition (Otto cycle). The other one is biodiesel,
which is used in compression ignition (Diesel cycle) engines. So, both are mainly used in Brazil as fuel in
automotive substituting, partially or totally, fossil gasoline and diesel respectively. Brazil is the first in the
world as biofuels consumer with about 18% of fuels utilized.
Ethanol is produced mainly through the fermentation of sugars and the Brazilian ethanol feedstock is
principally represented by sugarcane14. It is a first generation (1G) biofuel (1G biofuel means that it came
directly from saccharine, like sucrose fructose and glucose), since the second generation (2G) is still under
development. In addition, biodiesel and biogas are 1G biofuels but they derive from different materials and
process. The 1G ethanol produced in Brazil could be anhydrous (water content of 0.5%) which is used blended
with gasoline, or hydrated (water content of 5%) which is used in the engines specially designed for this type
of fuel (called flex-fuel engine).
The 2G ethanol comes from cellulose, hemicellulose or starches; consequently, its production process is more
difficult and more expensive because a previous step is required before fermentation. For these reasons, it
is not widespread yet. However, there are already a lot of pilot projects and laboratories working on these
technologies15. Moreover in 2014 Brazil started to produce 2G ethanol destined to exportation, but the
production capacity is still inconsistent.
There are 3 types of sugarcane plants: only sugar producers, only ethanol producers, both sugar and ethanol
producers. Today, there are 378 production units of both ethanol and sugar in Brazil (2017) [42]. Their actual
production capacity is about 750 Mt of sugarcane (considering a capacity factor of 90% of the nominal value).
All units authorized to produce ethanol have anhydrous and hydrated ethanol production capacity of about
120,000 and 219,000 m3/day respectively [42]. Then, considering a typical number of harvesting days, an
average of production capacity is 23 and 41 Gliter/year, respectively [38].
Considering for example the 2016/2017 crop and according with UNICA, a production of 651,841 kt of
sugarcane (607,137 from center-south and 44,704 from north-east) was registered. From this, 38,734 kt of
sugar and 27,254,000 m3 of ethanol were produced (of which the anhydrous was 11,589,000 and the
hydrated 15,665,000 m3).
In addition, two new production units are being installed thus production will increase. With this numbers
Brazil is the second producer of ethanol in the world (about the 37% of the world production) and the largest
sugarcane world´s producer. The 92.4% of the Brazilian ethanol production came from the Centre-South
region (San Paolo, Minas Gerais, Goias, Parana’ and Others) and the rest from the North-East region (mainly
the State of Pernambuco). Figure 12 shows where the actual ethanol plants are localized in Brazil:
14 Ethanol could derives from other feedstock like: corn (mainly used in USA); sugarbeet( wide used in EU); wheat (used in EU); agricultural residues; wood; dedicated crops. 15 See ABENGOA site in the section dedicated to the 2G biofuels or TASK 39 of IEA Bioenergy.

34
Figure 12: On the left the localization of the ethanol/sugar plants in Brazil registered in 2017 [42]. On the right, the characterization per type (only ethanol=blue, only sugar=red, sugar+ethanol=violet production) of the Brazilian plants, updated at 2015 [IBGE].
As shown in the map, it is evident that the plants are localized like that due to logistic reasons. The proximity
of the production plants to the sugarcane plantations is essential in order to reduce transport costs and
emissions and to facilitate distribuition as well.
According to some studies [53, 54, 55, 56, 57, 58, 59] a new promising region for the increase of sugar cane
plantation is the so-called MATOPIBA16(see Figure 13).
Figure 13: MATOPIBA geographical region in Brazil.
According to the IBGE [59], the planted area with sugarcane registered in 2017 in that region was (see table
9):
16 MA-TO-PI-BA: Maranhao-Tocantins-Piaui´-Bahia.

35
Region Sugarcane planted area in 2017 [59]
MARANHAO 52,367 ha
TOCANTINS 38,140 ha
PIAUI´ 17,454 ha
BAHIA 108,461 ha Table 9: hectare of sugarcane planted area in 2017 [59].
Thanks to the UNICA database it was possible do the following line graph (figure 14) that shows the evolution
of sugarcane planted area of the MATOPIBA area from 2010 to 2017.
Figure 14: hectare of sugarcane planted area [UNICA].
Sugarcane is growing up considerably. The biggest contribution given to this rise was due to the Tocantins
region. According with CONAB [66], the production of sugarcane has grown a lot from 2010/11 to 2016/17
in Tocantins, as shows the Figure 15:
Figure 13: production of sugarcane in the state of TOCANTINS from 2010/11 to 2016/17 [66].
9.000
59.000
109.000
159.000
209.000
ha
year
BAHIA[ha]
MARANHAO [ha]
TOCANTINS [ha]
PIAUI'[ha]
MATOPIBA (sum of thefour regions] [ha]
0
500
1000
1500
2000
2500
3000
kt o
f su
garc
ane
crop year
PRODUCTION OFSUGACANE IN TOCANTINS

36
This rapid growth represents the evidence of an interest in production expansion in that area by producers.
This is because there is on one side the need to increase the production of ethanol and on the other the
favorable conditions for doing it in this area.
From these considerations and from the research done, a potential for further future growth has been
estimated here. According to Carneiro Filho el al., the MATOPIBA region still has a total of 9,671 Mha of
potential area suitable for agriculture [60]. Of these, 6,100 Mha belong to the native vegetation, the rest to
pastures and others uses. So, considering that the remaining 3,571 Mha, could be used to plant sugarcane to
produce ethanol, it is possible to do an estimation of the ethanol production potential of this region:
𝑝𝑜𝑡𝑒𝑛𝑡𝑖𝑎𝑙 𝑣𝑜𝑙𝑢𝑚𝑒 𝑜𝑓 𝑒𝑡ℎ𝑎𝑛𝑜𝑙 = (𝑝𝑜𝑡𝑒𝑛𝑡𝑖𝑎𝑙 𝑠𝑢𝑔𝑎𝑟𝑐𝑎𝑛𝑒 𝑝𝑙𝑎𝑛𝑡𝑒𝑑 𝑎𝑟𝑒𝑎) ∗ (ethanol production efficiency)
Where:
- potential volume in liter;
- potential area in Mha;
- production efficiency in liter/Mha
Considering the actual average efficiencies of production (75 ton of cane per ha; 85 liters of ethanol per ton
of cane), the potential production of ethanol from MATOPIBA area would be of 22,765,000 m3. On one hand
this value could be underestimated because it is expected that also the efficiencies of production used for
the calculation will grow and because it does not consider in the calculation the 6,100 Mha that belong to
native vegetation; but on the other hand it could be overestimated because it was considered null the
production of sugar (all the sugarcane harvest used to produce ethanol) and null the production of soy, cotton
or other products that today represents a high percentage of the total agricultural production.
Speaking now about the logistic, in the following pictures (Figures 16 and 17) it is represented the actual
transport network for gas, oil and ethanol [61].
Figure 16: Detail of the Brazilian transport network: the ethanol, oil and gas line in the south-east of the country [61].

37
Figure 17: Legend of the figure 14 [61].
Another source that gives detailed information about the logistic is the IBGE [23]. Below there is a brief
description of the logistics related to biofuels. The logistic for the internal market could be divided into 3
levels: distribution (it's the wholesale with retailers or big consumers), resale, and consumption. Each base
of distribution has a storage capacity. Of the 282 liquid fuel distribution bases in Brazil, 91 are located in the
Southeast Region, which corresponds to 32.3% of the total units. The South Region, the second in number of
bases, concentrates 22.0% of the total. The biofuels stored are then injected in the mesh thanks to the
connections between the base of distribution and the most important road axes of the territory and with the
network of pipelines. In this way, biofuel pass from the refineries to the bases and from these to the retailers.
The two main infrastructures for liquid fuels are the retailers and the transporters retailers17, [62, 63].
Infrastructures responsable for the retail trade of liquid fuels are present in almost the entire national
territory, but not homogeneously. The most populous cities of the country are among those that have more
resellers [23]. Despite this, population concentration is not the only factor that explains the dispersion of the
stations, since they also have significant concentrations in municipalities and in areas that are connected to
major circulation and logistic axes [23]. The types of internal consumption of biofuels are different, but for
the ethanol (also for biodiesel) the main consumption is for transport (almost 95.6% of ethanol) [41].
As far as logistic of exports18 are concerned, the path made by ethanol is different because it has to be
transported from the distribution bases to the export port (mainly to the Santos and Paranagua´ ports).
Santos is the major Brazilian port (87.74% of the Brazilian exportation) with a total capacity of 3,400,000 m3/y
[65]. The ethanol can be transported to the Santos port by trucks or by train. The most utilized way is the
first one: in 2008, 99. 85% of the ethanol that arrived at the Port of Santos was by road [65]. It is not the
same for the Paranagua´ port where the railroad has a significant relevance: in 2008, this way of transport
carried 395,800 m3 of ethanol destined for export to that port, which represent the 42% of the total ethanol
drained there [65]. In 2009, the total shipping capacity of this port was of 1,100,000 m3 [SETTEN, 2010].
The production, export and import of ethanol registered in the year 2016 are [Mm3] [41, 42]:
- Production: 28.3 (of which: 11.7 anhydrous and 16.6 hydrous);
- Exportation: 1.0;
- Importation: 0.9.
17 These type of retailers market and deliver diesel oil to specific types of consumers who can not move to supply. This is the case of agricultural machinery, for example, or of industrial machinery and production of electricity by diesel oil [23]. 18 More information about the logistic in the document of IBGE [64].

38
Brazil is an affirmed ethanol exporter if comparing its exported quantity with the ones exported by the rest
of the countries of the world; for the moment (2017), it is in fact the second in the world after the USA. In
the following line graph there are the production, importation and exportation trends of the total ethanol
(hydrous and anhydrous) in Brazil from 2006 to 2016, (unit of measure: 103 m3):
Figure 18: BALANCE OF ETHANOL IN BRAZIL; [103 m3] [42].
The ethanol imported arrives in Brazil mainly from the USA. But Brazil also exports ethanol to USA (mainly to
California). That occurs because the Brazilian ethanol has the best footprint carbon emission, because it is
produced from sugarcane and the American one from corn; so, Brazil earns subsidies by selling ethanol to
USA. But, at the same time, Brazil must respect the obligations of blending ethanol with gasoline in a limit
range between 18 and 27.5% (Brazilian low N° 13.033, September 2014 ) and, when the export is higher than
the right value to satisfy the internal demand, Brazil is forced to import ethanol.
According with the UNICA [4] data, the total volume of exported ethanol to the rest of the world registered
in 2017 was 1,418,927 m3. Of these, 45,930 m3 were destined to Europe with a value of 23,694,000 US$ FOB19,
(it means about 0.516 US$/liter) [4].
There are a lot of issues linked to the supply and the production of the sugarcane:
- the yield plantation (for example the plantation recorded in 2016 compared to the previous year was less
than 1%, so fewer sugar canes in the crop [66]);
- the performance of sugarcane [kg di ATR20/ton of sugarcane], that can be affected by a premature harvest
or a deterioration in agricultural techniques which had a negative impact on the amount of sugar cane with
a consequent decrease in agricultural production (for example: the performance has been deteriored by the
increase of 4% of vegetal impurities in the sugar cane harvest between 2007 and 2016 [38]).
19 FOB contracts relieve the seller of responsibility once the goods are shipped. After the goods have been passed the ship's rail, they are considered to be delivered into the control of the buyer. 20 ATR= Açucar Total Recuperable; [kg di ATR/ton of sugarcane] = quality of sugarcane/industrial efficiency.
0
5000
10000
15000
20000
25000
30000
35000
2006 2007 2008 2009 2010 2011 2012 2013 2014 2015 2016
10
3m
3
year
PRODUCTION[10^3 m3]
IMPORT[10^3 m3]
EXPORT[10^3 m3]

39
However, there is technological potential for improving performance, but the presence of debt in the sector
has prevented the implementation of such practices.
In this context, sugar cane destined for ethanol production was 54% in 2016 [38].
One of the residuals of sugar and ethanol production is the “bagasse”, which is used to produce electric or
thermic energy as mentioned in the introduction of chapter 5, or 2G ethanol. It also used to produce pellet
[67], even if in low quantity. The line graph below shows the quantity of bagasse produced every year from
2006 to 2016 [66].
Figure 19: Bagasse production from 2006 to 2016, [kt] [66].
The electricity produced, classified as bioelectricity, is used to feed the sugarcane plant itself and the surplus
is exported to the distribution network. The sugar-alcohol sector is self-sufficient in the electricity production
and the surplus that is sold to the national network system (‘’SIN’’= ‘’Sistema interligado nacional’’) is growing
year after year. In fact, the surplus of bioelectricity from bagasse in Brazil grew up from 20.5 to 21.1 TWh
between 2015 and 2016 (the total bioenergy production from bagasse was 35.2 TWh, which only 14.1 TWh
used for self-consuming). This kind of bioelectricity is an important alternative to the hydroelectricity
generation because its production occurs precisely during the dry seasons, when the reservoirs are at the
lowest level.
In addition to this, the cane also produces “tops and leaves” ("palhas and pontas", it is the 30% of the cane),
which is potentially usable for the production of second generation biofuels (i.e. lignocellulose) or for the
production of electricity (both technologies are under development). Its introduction in the market, however,
currently sees many issues such as the transport of raw material from fields to the 2G ethanol production
plant.
Another residual of the cane is the "vinasse" from the fermentation of which it is possible to produce biogas
and therefore electricity, as is the case in the Bonfim industry (SP). However, the cost of production chain is
high, for this reason it is not widespread yet.
An important aspect of the Brazilian ethanol production is the sustainability of the production process. A lot
of studies show that both the energy balance and the carbon footprint of the chain production are the best,
compared with ethanol produced with feedstock different from sugarcane (i.e. sugar beet, corn, soybeans).
In addition to the problem of the water pollution due to the vinasse disposal has been solved, thanks to the
CETESB (environmental Agency of Sao Paulo) that in 2006 started to control the amount of vinasse discarded
on soils with the aim to avoid the contamination of the underground water. The problem of air pollution due
120000
130000
140000
150000
160000
170000
2006 2007 2008 2009 2010 2011 2012 2013 2014 2015 2016
kt
years
bagasse production [kt]

40
to bagasse burning in boilers for cogeneration and of the sugarcane before the harvesting was solved in 2002
with the introduction in the state of Sao Paulo of an environmental legislation (the Green Protocol)
establishing to stop sugarcane burning and introducing the mechanized harvest. Regarding the burning of
bagasse, the problem was solved thanks to the systems of control on the pollutant emission.
As far as concern the land use is concerned, a lot of debates occurred but it is confirmed that the
deforestation is not linked to ethanol production. It must be taken into account that the amount of land
available for agriculture in Brazil was 355 Mha in 2015 and from these 24% used for agriculture and only 2.5%
occupied by sugarcane ethanol.
A negative but inevitable point on sugarcane crops is the need to utilize agrochemicals that kill all organisms
that could compromise the right growth of the plant and that speed up the growth of the cane. However, the
fertilizer used in Brazil are less than that used in other countries (i.e. the fertilizer used in Australian sugarcane
crops is 48% bigger than the Brazilian one). Furthermore, the crops of sugarcane in general do not require
large amounts of fertilizers compared with crops of the same extension as coffe, corn, soybeans; besides,
with the use of vinasse as fertilizer (that helps the productivity and the potassium content of the soil) the
quantity of agrochemicals needed to sugarcane diminishes even more.
Beyond the sustainability aspects, it is important to take into account the economic ones. At each logistic
level corresponds an ethanol price: price at the producer; price at the distribution base; price of retail; final
consumer price. Moreover, there is also a different price for the ethanol destined to be exported.
The overall production process in 2006 reached a cost ranged from 0.18 to 0.25 US$/l, that was at that time
the lowest cost of biofuels in the world [29]. However, from 2006 to now many improvements in the
production technologies and higher input costs have been done, so the overall costs have risen.
The production cost of hydrated and anhydrous ethanol could be calculated dividing the sugarcane cost
[R$/ton of sugarcane] by the industrial production efficiency of ethanol (hydrated and anhydrous) [liter
ethanol/ton of sugarcane]. According to PECEGE report (2016) [100], the production cost of sugarcane in
2016 was of 97 R$/t 21 (29.65 US$/t). So, considering an industrial production of 74.66 l ethanol
anhydrous/tcane and of 77.8 ethanol hydrous/tcane [100], the production cost of anhydrous and hydrous
etanol result in 1.29 (0.39 US$/l) and 1.24 R$/l (0.38 US$/l) respectively, (i.e. 0.383 US$/l anhydrous and
0.368 US$/l hydrous22). These values agree with CEPEA platform [68]. Then, according to CEPEA platform
(2017), the average price at the producer plant is 0.57 US$ per liter of hydrous ethanol and 0.59 US$ per liter
of anhydrous ethanol [68]. Almost the 80% of the ethanol price is composed by the cost of the sugarcane
(the raw material) and it varies a lot year after year because it depends on the ATR cost23 that in turn depends
diverse aspects (for example, it depends on the percentage of sugar and ethanol produced in that year) [69].
The distribution price and the price for the consumers are obviously higher because they include, besides the
production costs, also the transport costs and taxes. For example, the internal consumer price in the same
year (2017) was around 0.91 US$/l (3 R$/l) [70].
21 It was calculated as arithmetic average between 3 different values from 3 diferents regions of Brazil; see table 4 of the [58] reference. 22 Currency Exchange 2017: 3,369 R$/US$. 23 The price of sugarcane (raw material), can be calculed starting from the average price of the kg ATR (total açúcar recuperável) which is calculed using a formula valid for all Brazilian region and avaible in the manual of Consecana [57].

41
Since ethanol is mainly used as automotive fuel instead of gasoline, it is interesting compare the Brazilian
ethanol price with the Brazilian gasoline price. Figure 20 gives an idea of the current price (for the final
internal consumer) of the hydrous ethanol24 and the gasoline in Brazil [4].
Figure 20: trend of price for the internal consumers of hydrated ethanol (used as fuel) and gasoline in Brazil; years: 2016 and 2017 [4].
Looking at the Figure 20, it is evident that gasoline and ethanol prices have almost the same trend but ethanol
is cheaper than gasoline for the consumers. It is confirmed also by other IBGE´s studies [12] and the historical
trends available in ANP database [71] demonstrates that it was the same also in the past years.
It is interesting to observe that the ethanol´s export price result lower than the ethanol´s internal sale price.
This occur because there are not export taxes for ethanol in Brazil so the exported ethanol´s price is given
only by production costs and transport costs, while the price of internal consumed ethanol includes also some
taxes like ICMS, PIS and COFINS.
Figure 21 shows the change in the exported ethanol´s price of the lasts four years and the change of the
exported volume of ethanol of the same years [4].
24 Is given only the hydrous ethanol price because the anhydrous ethanol is not sold alone in the internal market but only mixed with gasoline.
0,6
0,7
0,8
0,9
1
1,1
1,2
Hydrous ethanol internal consumer price [US$/l] Gasoline internal consumer price [US$/l]

42
Figure 21: annual average export price and annual volume of ethanol exported by Brazil [4].
It is obviously evident that at lower exported volumes correspond higher prices per unit of volume and vice-
versa. This price is in the range of 0.47 to 0.64 US$/l [4] and it refers to the total (anhydrous and hydrated)
ethanol exported from Brazil without specifying from what port or to what country. However, the prices per
port may vary for several reasons. For example, freight may be larger for a port, because it is more distant
from the destination, or because it has higher taxes, or because it has less draft or less availability of
backloads. Moreover, since the shipments are not necessarily regular throughout the year, the average FOB
price will be higher for the port that has shipped the most during the high price period (i.e. in the off season).
It is considered now the variation of the annual production cost per crop and the variation of the volume
produced (first of anhydrous ethanol and then of hydrous ethanol) in the same crop. The following graphs
(Figure 22 and 23) show it:
Figure 22: PRODUCTION [4] AND UNIT PRODUCTION COST [30] PER SUGARCANE CROP.
0,4
0,45
0,5
0,55
0,6
0,65
0,7
1300000
1400000
1500000
1600000
1700000
1800000
1900000
2014 2015 2016 2017
US$
/lit
er
klit
er
year
EXPORTED VOLUME: kliter/year ANNUAL AVERAGE EXPORT PRICE: US$/liter/year
400
600
800
1000
1200
1400
1600
1800
2000
7000
8000
9000
10000
11000
12000
13000
20
05
/20
06
20
06
/20
07
20
07
/20
08
20
08
/20
09
20
09
/20
10
20
10
/20
11
20
11
/20
12
20
12
/20
13
20
13
/20
14
20
14
/20
15
20
15
/20
16
20
16
/20
17
R$
/m3
10
3m
3
crop year
ANHYDROUS ETHANOLPRODUCTION [1000 m^3]
ANHYDROUS PRODUCTIONCOST [R$/m^3]

43
Figure 23: PRODUCTION AND UNIT PRODUCTION COST PER SUGARCANE CROP; [4, 30].
It can be noticed that the production trend is very unstable for both anhydrous and hydrated ethanol. This is
due to various factors such as harvest efficiency, percentage of sugar produced in that year, market prices
and others, (all these factors vary a lot from year to year). However, if we consider the total production we
can say that it almost continuously grew up from 2006 to 2016 as it can be observed in the figure 18.
As far as production costs are concerned, it is evident how they are increasing from the 2005/2006 crop to
the last crop. It occurred both for anhydrous and hydrous ethanol in the same way because the production
process has evolved over time becoming more sustainable and efficient but at the same time more expensive,
as it is well explained in [29].
Just to compare the cost of ethanol production in Brazil and Europe, below some values are listed. These
values could fluctuate in wide ranges because the cost of biofuels mainly depend from the biomass feedstock
prices which can change between different European countries and it account for 60-80% of the final price
of ethanol. The technologies of ethanol production are now mature and little changes and improvements on
it do not influence the production cost much. The following table 10 contains some production costs of
European ethanol that were found in literature:
Source Type of feedstock Production cost
ECN report [73] Sugar beet (North West Europe) 0.32-0.53 Euro/litre
Setis.ec.europa.eu, 2012 [74] Wheat; sugar beet 0.64 Euro/litre
BTG report, 2004 [73] Wheat 0.59 Euro/litre
BTG report, 2004 [73] Sugar Beet 0.60 Euro/litre Table 10: ethanol production costs found in literature.
As it is shown in the table, the most recent information found dates back to 2012. According with it, the most
recent cost of ethanol (without distinguishing what kind of feedstock was used), was around 0.64 Euro/l. The
same paper reports that this cost is forecasted to increase to 0.82 Euro/l in 2020. However, another source
[75] says that in 2013 the price of European ethanol was 0.62 Euro/l but with the pressure of the strong
global competition (mainly USA and Brazil) which have encouraged a duty-free ethanol import, the European
ethanol price had a drop [75]. It has also to be noticed that the European ethanol price remain uncompetitive
with respect to third countries (like for example Guatemala, Bolivia, Pakistan, Peru, Costa Rica), because their
ethanol production is driven by a solid form of support and bilateral free trade agreements. Importing
250
450
650
850
1050
1250
1450
1650
1850
7500
9500
11500
13500
15500
17500
19500
21500
20
05
/20
06
20
06
/20
07
20
07
/20
08
20
08
/20
09
20
09
/20
10
20
10
/20
11
20
11
/20
12
20
12
/20
13
20
13
/20
14
20
14
/20
15
20
15
/20
16
20
16
/20
17
R$
/m3
10
3 m
3
crop year
HYDROUS ETHANOLPRODUCTION PER CROP[1000m^3]
HYDROUS ETHANOL COSTPRODUCTION PERCROP[R$/m^3
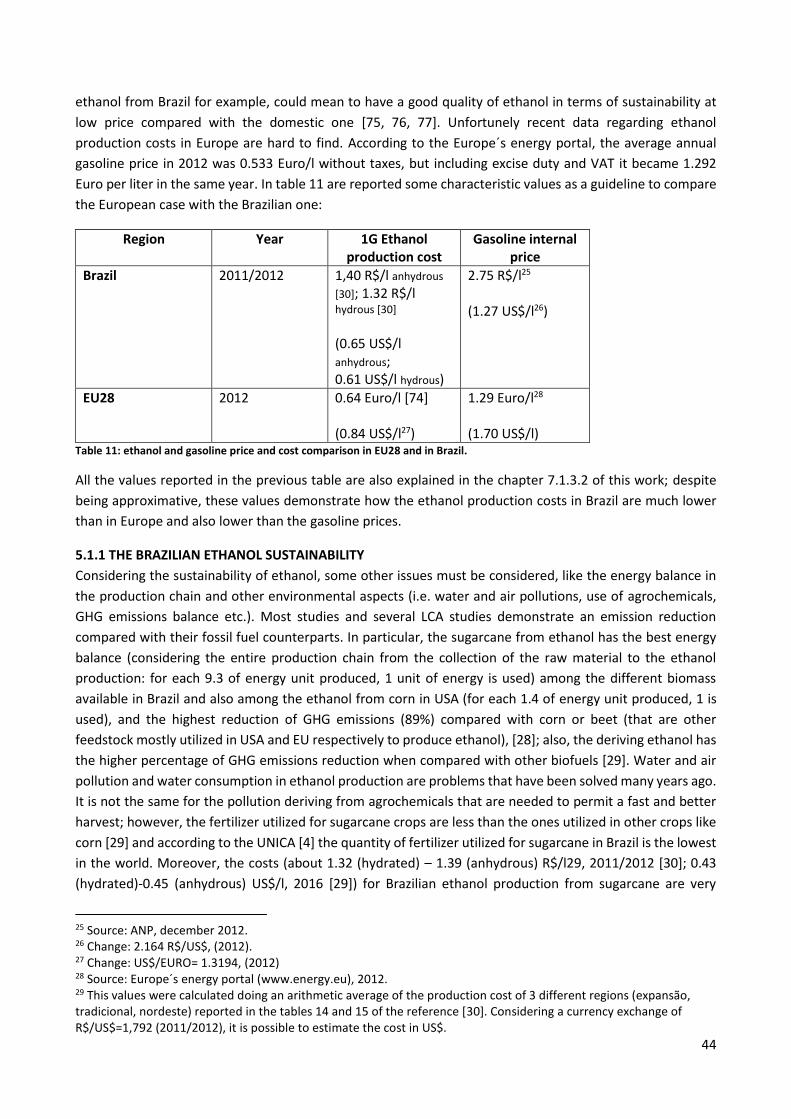
44
ethanol from Brazil for example, could mean to have a good quality of ethanol in terms of sustainability at
low price compared with the domestic one [75, 76, 77]. Unfortunely recent data regarding ethanol
production costs in Europe are hard to find. According to the Europe´s energy portal, the average annual
gasoline price in 2012 was 0.533 Euro/l without taxes, but including excise duty and VAT it became 1.292
Euro per liter in the same year. In table 11 are reported some characteristic values as a guideline to compare
the European case with the Brazilian one:
Region Year 1G Ethanol production cost
Gasoline internal price
Brazil 2011/2012
1,40 R$/l anhydrous
[30]; 1.32 R$/l hydrous [30] (0.65 US$/l anhydrous; 0.61 US$/l hydrous)
2.75 R$/l25 (1.27 US$/l26)
EU28 2012 0.64 Euro/l [74] (0.84 US$/l27)
1.29 Euro/l28 (1.70 US$/l)
Table 11: ethanol and gasoline price and cost comparison in EU28 and in Brazil.
All the values reported in the previous table are also explained in the chapter 7.1.3.2 of this work; despite
being approximative, these values demonstrate how the ethanol production costs in Brazil are much lower
than in Europe and also lower than the gasoline prices.
5.1.1 THE BRAZILIAN ETHANOL SUSTAINABILITY
Considering the sustainability of ethanol, some other issues must be considered, like the energy balance in
the production chain and other environmental aspects (i.e. water and air pollutions, use of agrochemicals,
GHG emissions balance etc.). Most studies and several LCA studies demonstrate an emission reduction
compared with their fossil fuel counterparts. In particular, the sugarcane from ethanol has the best energy
balance (considering the entire production chain from the collection of the raw material to the ethanol
production: for each 9.3 of energy unit produced, 1 unit of energy is used) among the different biomass
available in Brazil and also among the ethanol from corn in USA (for each 1.4 of energy unit produced, 1 is
used), and the highest reduction of GHG emissions (89%) compared with corn or beet (that are other
feedstock mostly utilized in USA and EU respectively to produce ethanol), [28]; also, the deriving ethanol has
the higher percentage of GHG emissions reduction when compared with other biofuels [29]. Water and air
pollution and water consumption in ethanol production are problems that have been solved many years ago.
It is not the same for the pollution deriving from agrochemicals that are needed to permit a fast and better
harvest; however, the fertilizer utilized for sugarcane crops are less than the ones utilized in other crops like
corn [29] and according to the UNICA [4] the quantity of fertilizer utilized for sugarcane in Brazil is the lowest
in the world. Moreover, the costs (about 1.32 (hydrated) – 1.39 (anhydrous) R$/l29, 2011/2012 [30]; 0.43
(hydrated)-0.45 (anhydrous) US$/l, 2016 [29]) for Brazilian ethanol production from sugarcane are very
25 Source: ANP, december 2012. 26 Change: 2.164 R$/US$, (2012). 27 Change: US$/EURO= 1.3194, (2012) 28 Source: Europe´s energy portal (www.energy.eu), 2012. 29 This values were calculated doing an arithmetic average of the production cost of 3 different regions (expansão, tradicional, nordeste) reported in the tables 14 and 15 of the reference [30]. Considering a currency exchange of R$/US$=1,792 (2011/2012), it is possible to estimate the cost in US$.

45
competitive when compared to other biofuels production costs, like for example European biodiesel (1US$/l
[31]), or to ethanol costs production in other countries (i.e. in Australia) [29].
5.2 BRAZILIAN WOOD PELLET AS EUROPEAN RESOURCE
As described in the previous chapters, it is evident that not only the liquid but also the solid biomass plays an
important role in the energy production and final energy consumption in Brazil: wood and charcoal 30
represents the 8% of the Brazilian energy mix and black liquor about 1%; about the final consumption, the
sum of all solid biomass is around 21%). In Brazil solid biomass manly means wood biomass, because solid
biomass from herbaceous or fruit are negligible.
Woody biomass is used to produce electricity, heat and charcoal.
Of the total electric energy generated in 2016, the part produced with biomass derived from forests in the
form of chip, black liquor or charcoal, represents almost the 8% [41], but if we consider only the
thermoelectric generation, the participation of biomass is almost 30% of the total produced in 2016 [41].
The industrial sector is the one with the highest heat production demand by biomass (25.1 ktons of wood to
produce 29,7 Mtep [41]). The heat demand for service is of 94,1 ktep and of 6,3 ktep for residential [43].
24,773 tons of wood are requested to produce about 6.301 Mt of charcoal per year [41].
However, the use of solid biomass that is traded internationally in the form of wood pellet, briquettes,
woodchip and other modern biomass that are certified by recognized programs of sustainability (i.e. ENplus,
RSB, WBA, GBEP, ISO), is still underdeveloped. Brazil does not have a good position in both the production
(almost 50% of production is accounted for by the EU, followed by North America with 33%; China and Russia
together are about 13% [16]), and the international wood pellet trade, and this is in contrast with the
potential of the country [21]. The actual export situation is hampered by logistical and transport problems,
lack of infrastructures, of a regulation for the determination of quality standards of the Brazilian pellet and
of strategic plans for this type of market.
The traditional solid biomass that is still used as domestic fuel, especially in rural areas without the access to
electricity or other form of energy, is subject to a series of issues such as low efficiency, degradation of
environment, gases emissions, sustainability, overexploitation and other possible negative effects. This is
one of the reasons why bioenergy from solid biomass in Brazil has to shift to become a modern and
competitive commodity. Another reason to reach this goal could be the energy independency and the
problem of climate change, but for Brazil the driving force is the real possibility to become one of the most
important exporters of pellet within a framework in which that type of trade, together with biofuels for
transport is increasing a lot in the last years. This would represent an opportunity for a domestic industrial
development and an internal economic growth; so, it is worth to give opportunities to Brazilian wood biomass
to become sustainable and competitive at world level through economic and technological support.
The reasons why Brazil has a wide potential in this sector are basically linked with the followig elements:
30 Charcoal derives from wood and it is used for cooking or for smelting iron and/or other metals in many countries.

46
- Brazil currently counts 105 Mha of degraded area usable as energetic forest;
- According to IBA´ [78], the 1% of the Brazilian soil (7.84 Mha) is occupied by planted forests (72.7%
eucalypt=5.7 Mha; 20.4% pines=1.6 Mha; 6.9% others);
- Being Brazil in tropical zone, it shows favorable climate and soil conditions for biomass production;
- The Annual Average Increment (AAI31) of planted forest in Brazil is higher compared with the rest of
the world in a range between 30% and 50% [1, 79]. For example, the average productivity of
eucalyptus reaches (2016) 35.7 m³/ha/year and the average productivity of pines and other species
reaches 30.5 and 15.0 m³/ha/year respectively [78];
- The rotation (period between planting and harvesting of trees) is the shortest in the world.
Brazil is also the major world producer (measured as the volume of wood produced per unit area per year)
of wood from planted forest and the wood is the best biomass to produce pellet, according to ENplus.
Considering the current area of planted forests and the national AAI, it is estimated32 an average production
of sustainable wood in Brazil of around 288.7 Mm3 per year. In addition, Brazil has a large amount of wood
waste annually generated: almost 80 Mt generated in 2016 of which, 30 Mt was forestry residues and 50 Mt
was wood for energy (it is almost equivalent to 967,467 PJ).
The best way to export wood from Brazil is in form of pellet because it is a fuel with a higher PCI compared
with PCI of natural wood (4,600 kcal/kg), with a low moisture content (7-10%) and easy to be transported
and stored because of its low volume. As a consequence, its transport costs are low and so pellet correspond
to a viable alternative in reducing the costs of large thermal energy consumers, which are not close to the
storage point. In addition, there are other reasons linked to the importer country (in this study it is the EU28),
which are explained below.
Starting from the year 2010, an exponential increase in the demand for pellets has taken place as an
alternative for satisfying mainly residential heating, since internal conflicts (Russia interrupts the supply of
gas through the pipeline in Ukraine and therefore the transport to Europe) have threatened European energy
security. Furthermore, in 2010, various policies were launched to reduce dependence on fossil fuels and to
reduce emissions of greenhouse effect gases. Pellet consumption continued to increase, also due to the
Fukushima disaster in 2011, which led to the decommission of some nuclear power plants in Europe. Because
of climate change and energy security, in many European countries there are taxes on fuels derived from the
oil used for heating and for this reason it is of increased interest to meet the demand for heating with
alternative fuels. Also in the thermoelectric sector, there is the trend to replace completely or partially fossil
fuels with alternative fuels to reduce CO2 emissions. For example, there are countries in the EU that have not
been able to achieve emission reduction targets because of the use of coal as fuel in thermoelectric plants
(since 2009, for example, Germany has been producing eucalypt for pellets in Madagascar, after obtaining
little reduction in the internal energy mix with intermittent renewable sources such as solar and wind [19,
80, 81]).
In this scenario the European pellet market has grown, and it tends to grow even more, both in electricity
generation and in the residential heating sector. Today the EU28 is the biggest producer and consumer of
wood pellet. In Figure 24 the production and consumption trends are shown, starting from 2009 to 2016.
31 AAI: it is the volume by which the forest grows per unit area over a 12 month period. 32 This estimative represents the supply of wood available in the period from the planting age to the optimum cutting point. The total production cycle could change depending on the species. The commercial spacing used is 3m x 3m (meters between planting lines), and may vary depending on the final destination of the forest production.

47
Figure 24: EU pellet production and consumption; 2009-2015 [82].
The production grew from almost 8 Mt in 2009, to almost 14.8 in 2016. Concerning the total consumption
(both residential and industrial ones), it passes from 9.5 to 22.2 Mt during the same period. It is evident how
the demand is always higher than the internal production. According to the EU Biofuels Annual (2017), EU
wood pellet production is not expected to be able to keep up with the demand from both the residential
heating market and for power generation. The gap between production and consumption is actually mainly
covered by the biomass import from Canada and USA, but a lot of studies demonstrate that Brazil is a good
potential exporter of wood pellet to satisfy the growing European demand, [1, 14, 15, 33, 83, 84, 85, 86].
The EU Biofuels Annual [5] says also that the major raw material for pellets has traditionally been sawdust
and by products from sawmills but there is a big interest in diversifying the raw material. Additional feedstock
could come from forest residues, wood waste and agricultural residues; however, the internal feedstock is
not sufficient for supplying the full demand. This is another reason why Brazil could be an excellent exporter
of pellets for Europe.
However, the actual situation in Brazil is very far from its real potential. In 2016, for example, there were only
13 pellet production plants in operation and their total production was almost 75,000 t/year [87, 33]. These
0
5
10
15
20
25
2009 2010 2011 2012 2013 2014 2015 2016
Mt
year
EU PELLETPRODUCTION,[EuropeanBiomass Association,(AEBIOM)]; unit: 1,000 Mt
EU PELLET CONSUMPTION,[GTIS]; unit: 1,000 Mt

48
plants have a production capacity of about 209,750 t/y, so their current production reaches only 35% of this
capacity. In Figures 25 and 26 the Brazilian pellet plants and their geographical location are described.
Figure 25: On the left all the pellet plants in Brazil in 2014 [87]; on the right all the pellet plants in Brazil in 2016, [2, 33].
Figure 26: Location of the pellet plants in Brazil in2014 [87]. NB: the numbers refers to the figure 22 of the left side.
Almost all industries (81%) are located in the southern states of the country (Paraná, Santa Catarina, Rio
Grande do Sul), and the rest in the center state of São Paulo33.
33 It hosts the largest concentration of pine and eucalyptus plantations of Brazil and also generates around 73 % of the waste from the wood processing industries.

49
The exportation is done only by 3 producing companies (the only ones that obtained the A1 ENplus34), which
export pine (15,000 t/y, i.e. the 33% of the total production in 2016) since it is, for the moment, the only one
that meets the international standards of quality. However, its production cost is too high to be competitive
in the international trade and for this reason not developed. It is expansive because the factories are small,
with low production efficiency (a standard equipment produce from 0.5 to 4.0 t/h) and consequently with
high production costs [87]. In general, the production is mainly destined to domestic market [33]. This low
production can be justified by a poor domestic demand, due to the lack of knowledge considering benefits
and advantages in the use of pellets, and also because the pellet market is still unstable. The low production
is also linked to the use of residual biomass (wood waste35) as feedstock for the pelletizing industries, which
does not allow a large-scale production. The pellet from agricultural residues would be much cheaper but it
has a lot of drawback in comparison with the pellet from forests: lower energy content and higher rates of
sulfur, nitrogen, chlorine and silica, which after combustion act as corrosive and mutagenic abrasives [88].
The only feedstock to produce enough quantity of pellet to be exported can be obtained with planted forests
(using lignocellulosic biomass residues or/and plantations for energy use). In the Table 12 are reported the
quantities of residual wood from planted forests of Pinus and Eucalyptus in Brazil.
Residues [Mt]
Rio Grande do Sul
Santa Caterina
Parana´ Sao Paulo Minas Gerais
Espirito Santo
Bahia
Eucalyptus & Pinus
1.2 2.98 4.74 3.43 1.87 0.46 1.25
Table 12: Brazilian residual wood from planted forests [85].
The most of these residues are left in the field for its regeneration and only a small part is used to produce
electricity. According to [2] and since the country is well developed in forestry and has got a large amount of
degraded areas that can be utilized to cultivate eucalypt, a promising solution for the marketing of Brazilian
pellet to third countries (Europe in particular), would be to use short rotation eucalyptus from planted energy
forests, as raw material to produce pellet. With the increase of the number of plants per hectare (assuming
variable spacing of 3x0.5, 3x1 and 3x1.5 meters), a larger biomass production occurs in a smaller area: in this
way, it would possible to reach, with the same productive cost as traditional planted forests, yields of 45-55
tons of dry mass per hectare in cycles of 1 years (twice the productivity per hectare of traditional planting36),
and meet to the export demand [17, 89, 90]. Although these are experimental data, they are in line with the
large production potential of Brazil [17, 89, 90].
Just to give a comparison with the other countries of South America, in the table 13 there are some data
relative to the actual (2016) production and export of pellet [91].
34 The ENplus certification scheme defines three different classes of pellet quality, based on the classes provided for in ISO 17225-2 and identified as follows: (1) ENplus A1; (2) ENplus A2; (3) ENplus B. In the point 2 of the appendix there are only the pellet properties of interest to the study and the relative threshold values of the different parameters for the different quality classes. 35 Quantity of wood waste generated in Brazil in 103t/year : 27,750 from wood industry(90.7%); 1,930 from urban áreas (6.3%), 923 from construction sectors (3%) [STCP,2011; SAE,2011]. 36 The production of traditional planted eucalyptus florests is, with a spacing of 3x2 and 3x3 meters of planting between plants, with a productive cycle of 5 - 7 years, and considering an average AAI (national - 41 m³ / ha / year), around 25 tons of dry mass per hectare per year. Under these conditions, wood productivity is able to meet only the national demand of the woody sector (cellulose, panels, etc.) and it is in most cases economically unviable for energy use.

50
Country BRAZIL ARGENTINA CHILE COLOMBIA MEXICO
Pellet produced (t)
75,000 6,000 30,000 0 4,000
Pellet exported (t)
15,000(33% della
produz. tot.) 3,440 2,565 0 1,513
Wood residues (m3)
17,194,000 305,000
1,916,000
566,000
Not Found
Table 13: Central and South America pellet production, pellet export and wood residues production [91].
It is evident how Brazil has well-established forestry and agricultural sectors, with large technical potential
for pellets production from planted forests, wood residues and agricultural residues. However today, it
produces pellets mainly for the internal demand, while the share of pellet exported is still unimportant
compared with its potential.
An obstacle for the Brazilian pellet exportation is the lack of Brazilian sustainability standards, that must be
put in place to safeguard the environment, and to meet desired social and economic criteria. In fact, short
rotation eucalyptus represents a promising scenario (in price and productivity), but at the same time it
contains rates of chlorine and ash up to five times higher than allowed by international standards37. However,
a process allowing the removal of chlorine and other inorganic rates present in eucalyptus wood has recently
been patented. With it, it is possible to produce pellets that are in line with the European sustainability
standards. So, short rotation eucalyptus energy forests can be one solution for the penetration of Brazilian
pellet in the international market [22].
Another issue is the logistic costs (precarious railroads, expensive freight, ports adaptable but not adapted
yet) [63] and a set of bureaucratic and economic difficulties that make investments in pellet more difficult,
making the international trade difficult too. Although the country is believed to have the potential to become
a future global leader in the production and distribution of pellet, in reality it is a big challenge.
The price of pellet could vary a lot because linked to the quality of the pellet (feedstock), port (CIF38) or (FOB),
type of market to be reached (for residential or industrial use) and others. According with the report from
Argus Biomass Markets (2016), it can vary in a range from 97 to 200 US$/t and the spot average price in 2016
was (CIF) US$/t 127.17 (based on the ports of Amsterdam-Rotterdam-Antwerp, ARA) and 150 (FOB) US$/t.
According with [22], in Brazil the production cost of wood pellets of a standard factory is around R$/t 380.00,
from which 50% is absorbed by capital investment and O&M (production costs) and 50% by the acquisition
of residual biomass (raw material cost). The price of pellet in the internal market is in the range of 450.00-
600.00 R$/t (FOB) [22]. Another source [92] underlines that Brazilian pellet cost production per ton is
between R$ 290 and R$ 380 and it is sold at prices ranging from R$/t 490-650 (FOB). The cost of producing
pellets in Brazil results lower to the selling price of pellets in Europe. However, the current pellet production
efficiency is low and therefore the cost could become even lower if this efficiency had improved. In addition
to this, according to a study done by FIESP (Federation of Industries of the State of São Paulo), the cost of
Brazilian electricity (which is used in pellet production process) is high when compared with other countries
(like USA), and there is not adequate logistical structure which becomes an increase in costs.
37 The international standards considered in this work are the European ones. That values are avaible in the certification called ENplus, (see the annex). 38 CIF: in CIF contracts, the insurance and other costs are assumed by the seller, with liability and costs associated with successful transit paid by the seller up until the goods are received by the buyer.

51
The present average price for wood pellet of the largest EU wood pellet producers (Germany and Austria) is
245 Euro per ton39 [93]. The pellet price in Switzerland is always slightly higher (around 310 Euro/t) [62]. In
the table 14 there are the actual pellet prices in EU and in Brazil.
Country Average pellet price (internal market)
Averge pellet cost production
Brazil 122-165 Euro/t 40 (450-650 R$/t [92])
95 Euro/t41 (380 R$/t [22, 92])
EU 240-310 Euro/t [93] Table 14: Comparison in price and cost of pellet between EU28 and Brazil.
5.2.1 THE BRAZILIAN WOOD SUSTAINABILITY
It is challenging to illustrate the sustainability of the Brazilian wood for energy. It depends both on the type
of feedstock utilized and on the final biomass produced. Between the different type of lignocellulosic waste
and natural wood, the wood pellet is more efficient and less polluting than others when utilized to produce
thermal energy. Its lower heating value (LHV) is almost 18 MJ/kg and that is higher, for example, than the
chip wood (13 MJ/kg); moreover, its manufacturing and transport is very simple and relatively cheap. So, it
is a good option to substitute fossil fuel in the thermoelectric power generation for residential, industrial and
commercial sectors. It represents as well a very interesting opportunity for Brazil international market
because the country boasts a large wood feedstock able to provide both internal energy consumption
(according to [32], the internal thermal demand of the commercial and industrial sector could consume about
21 Mt of pellet per year in substitution of fossil fuels, resulting in 35% of savings), and exportation. According
to ABIPEL [33], in 2015 the pellet production in Brazil was of 75,000 t and the internal consumption was of
60,000 t; and according to different studies, like Poyry management consulting's studies [14, 15, 34], Brazil
is one of the countries in the world with a highest wood biomass potential. Considering the eucalypt wood
as a feedstock, there are some debates about its environmental impact but according to many authors [2] it
can be considered sustainable since it is able to grow in degraded areas and it is very efficient when water
supply and water are concerned.
39 It is included the Value Added Tax (VAT) per ton of pellets. 40 Currency change (from brazilian Real to Euro) of 2017. 41 Currency change (from brazilian Real to Euro) of 2017.

52
6. SCENARIOS
After a deep preliminary literature study, the most important points of which have been presented in the
previous chapters, it is possible to talk about scenarios of biomass trade from Brazil to Europe.
This chapter describes four scenarios that have been designated to assess the role of the aforementioned
trade and the results obtained through model runs. The utilized model was REACCESS which is composed by
the union of the TIAM, PET and RECOR models (all described in 1.3.2.1 paragraph).
The four scenarios are the following:
- BASE;
- BIO BRAZIL 2;
- ADV;
- BIO BRAZIL 3.
The BASE scenario, as the name suggests, was done to evaluate the initial condition of the whole energy
system as it was in the model before the implementation of the new corridors. No external constraints have
been imposed and neither processes nor commodities have been added.
The BIO BRAZIL 2 scenario results from the implementation of the following biomass corridors (five in total)
in the BASE scenario:
- pellet corridor from Santos port (San Paolo, SP) to Rotterdam port (NL);
- pellet corridor from Paranagua’ (Parana’, PA) port to Rotterdam port (NL);
- pellet corridor from Salvador (Bahia, BA) port to Rotterdam port (NL);
- ethanol corridor from Paranagua’ (Parana’, PA) to Rotterdam (NL);
- ethanol corridor from Paranagua’ (Parana’, PA) to Marseille (FR).
The ADV scenario was obtained with the imposition of the Italian Decree (DM 2 March 2018: on the use of
advanced biofuels in transport) to the BASE scenario. The Decree was imposed to all European countries and
not only to Italy, with the aim to see what would happen to the European energy system if all European
countries adopte that Decree.
Finally, the BIO BRAZIL 3 scenario was designed. It includes the constraint on the advanced biofuels (DM 2
March 2018), the five biomass corridors already implemented in the BIO BRAZIL 2 scenario and the following
two new corridors:
- ethanol corridor from Itaqui’ (Maranhao, MA) to Rotterdam port (NL);
- ethanol corridor from Itaqui’ (Maranhao, MA) to Marseille port (FR).

53
6.1 BASE RUN
The first results were obtained doing the BASE run of REACCESS model. It means without any constraint, such
as policies or other imposed limits. The base year is 2005 and the data years (in which the user gives the input
data) are 2009, 2010, 2015, 2020, 2025, 2030, 2040. The initial Reference Energy System (RES) include all
energy systems of EU28 and ROW42 and includes all corridors that link the ROW with the EU and the ones
that link the ROW with itself. The TIAM model not considers the energy system of Brazil as a single country
but it considers the energy system of the entire Central and South America (CSA). However, the CSA biomass
trade in the model is operated only by Brazil excluding a portion of biodiesel traded by Argentina.
The brown lines in Figure 27 are the corridors that represent all biomass imports from the ROW to EU and
also from the ROW to the ROW.
Figure 27: All biomass corridors of REACCESS model at the beginning. Source: Dynamic WebGIS Application.
Among these corridors, the Brazil-Europe corridor (which represents all biomass energy fluxes from Brazil to
Europe) is also present. The fluxes of biomass from Brazil to EU are represented in the model as a series of
different sea routes. The model initially includes two different sea routes (see Figure 28.a and 28.b):
- from Santos port (San Paolo) to Rotterdam port, (Figure 28.a);
- from Santos port (San Paolo) to Marseille port, (Figure 28.b).
The choice of the arriving European ports was taken for reasons related to logistics, such as avoiding high
transport costs [94]. Moreover, Rotterdam, that is the biggest European port, serves the Northern part of EU
and Marseille, that is the France’s largest commercial port, serves the Southern part of the EU. At the same
way, the starting port ( Santos) is the most important of Brazil.
42 ROW: Rest Of World. It includes the following countries: Africa, Australia-New Zealand, Canada, Central and South America, China, India, Japan, Mexico, Middle East, other developing countries of Asia, South Korea, United States, Russia, Central Asia and Other Europe.
54
Figure 28.a: Santos-Rotterdam biomass trade. Figure 28.b: Santos-Marseille biomass trade.
The only biomass shipped in these two routes are biodiesel and ethanol, while pellet trade is not present in
the BASE scenario. As mentioned above, a part of biodiesel is exported from Argentina so the biomass
corridors of the BASE scenario are the following:
-ethanol from Santos (Brazil- BR) to Rotterdam;
-ethanol from Santos (BR) to Marseille;
-ethaol from Mar de la Plata (Argentina) to Rotterdam;
-biodiesel from Santos (BR) to Rotterdam;
-biodiesel from Santos(BR) to Marseille;
-biodiesel from Mar de la plata (Argentina) to Rotterdam.
Before biodiesel and ethanol are exported to the EU, they are produced by CSA. The process of production is
present in TIAM (because the producer region is part of the ROW) and it is composed by a series of
technologies described with economical, energy and technological parameters. Each technology is linked
with the others by commodities (fluxes of energy) that are characterized by economical values and energy
quantities.
In Figure 29 there is the simplified RES which describes the production chain of the ethanol and biodiesel as
well as is present in TIAM. All the acronyms are explained in point 3 of the Appendix.

55
Figure 29: ethanol and biodiesel production chain in TIAM.
The previous representation is only a qualitative description to understand the production process of ethanol
and biodiesel in the TIAM model; all connction-lines represent a commodity flow quantity that enter in/go
out from a technology (process). Moreover, each process is characterized by different attributes like: activity
(ACT); capacity (CAP); activity cost (ACT_COST); capacity cost (CAP_COST); new capacity (NCAP); efficiency
(ACT_EFF); and so on43. In particular the mining process have an activity equal to zero in all regions and during
the all period (from 2005 to 2040).
The commodity named “SNKTOTCO2” is not an energy flow but it represents the CO2 emission for sinking. It
then goes to the various CO2 removal technologies which are not illustred here.
Doing the BASE run of REACCESS, it was possible to calculate, among others, the evolution in time of the
things listed below which will be compared with the results of the subsequent runs:
- the BASE-biomass (ethanol and biodiesel only, because pellet corridors are not present in the BASE scenario)
balance (production, consumption, import/export);
- all commodities fluxes involved in ethanol and biodiesel production;
- ships capacity, ship activity, ship consumption;
- transport demand;
43 In the annex there is the list of all these attributes with their own TIAM´s code and description.

56
- CO2 emissions.
All these results were calculated by the model for each milestone year and the most relevant are shown and
explained in the chapter 6.2.
6.2 RESULTS FROM THE BASE RUN OF REACCESS MODEL (BASE scenario)
Considering the whole Central and South America (CSA) biomass export to EU, six different ships (listed in
paragraph 6.1) exist in the model. However, the results of the all runs done show that biodiesel is exported
by Argentina and by Brazil but the ethanol export is operated only by Brazil.
The export of ethanol begins in 2015. Of the total ship capacity available in 2015 for the ethanol export, only
the 26% is used. This percentage grows until 2025 arriving at 92% and then it falls again. The following Figure
30 represents it:
Figure 30: Comparison between the ethanol ship capacity and the ethanol ship activity in the base Scenario.
The red columns represent the ship activity in PJ, while the blue columns represent the ship capacity available
for the ethanol export.
Another result is that the all biodiesel produced in CSA is also exported to EU, while it is not the same for
ethanol as the following graph (Figure 31) shows.
0
50
100
150
200
250
300
350
400
2015 2020 2025 2030 2040
PJ
Years
tot available ethanol shipcapacity
ethanol ship activity
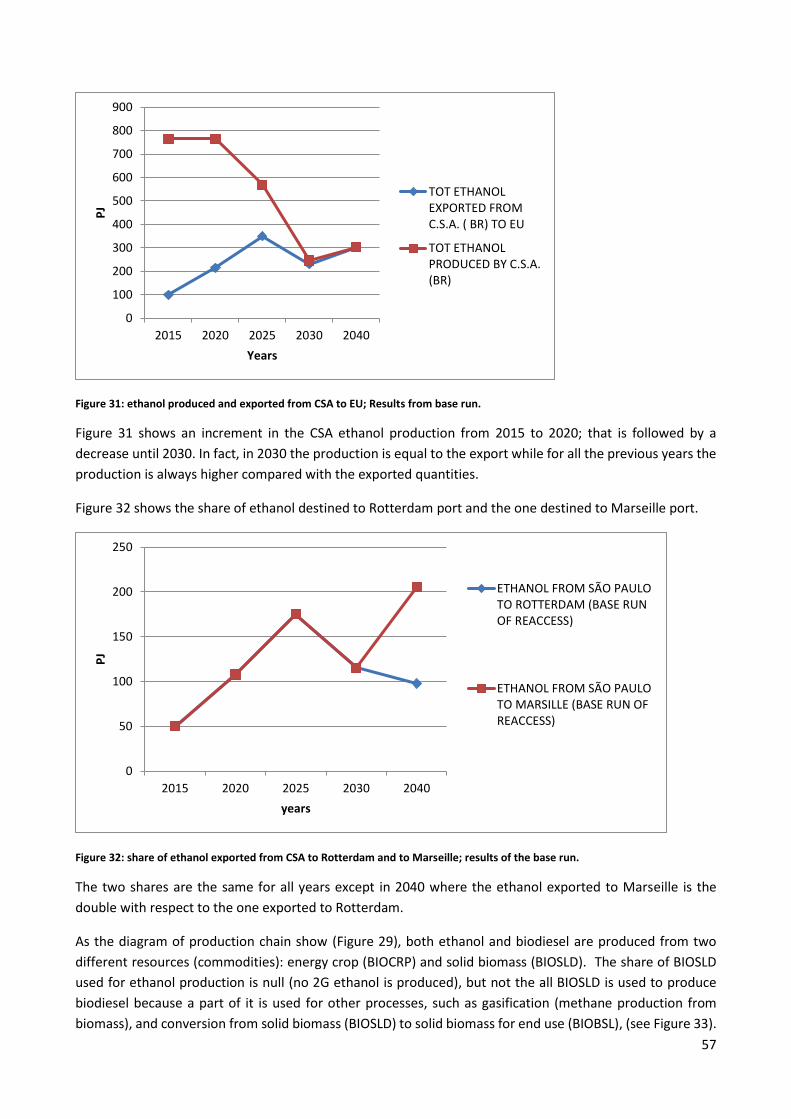
57
Figure 31: ethanol produced and exported from CSA to EU; Results from base run.
Figure 31 shows an increment in the CSA ethanol production from 2015 to 2020; that is followed by a
decrease until 2030. In fact, in 2030 the production is equal to the export while for all the previous years the
production is always higher compared with the exported quantities.
Figure 32 shows the share of ethanol destined to Rotterdam port and the one destined to Marseille port.
Figure 32: share of ethanol exported from CSA to Rotterdam and to Marseille; results of the base run.
The two shares are the same for all years except in 2040 where the ethanol exported to Marseille is the
double with respect to the one exported to Rotterdam.
As the diagram of production chain show (Figure 29), both ethanol and biodiesel are produced from two
different resources (commodities): energy crop (BIOCRP) and solid biomass (BIOSLD). The share of BIOSLD
used for ethanol production is null (no 2G ethanol is produced), but not the all BIOSLD is used to produce
biodiesel because a part of it is used for other processes, such as gasification (methane production from
biomass), and conversion from solid biomass (BIOSLD) to solid biomass for end use (BIOBSL), (see Figure 33).
0
100
200
300
400
500
600
700
800
900
2015 2020 2025 2030 2040
PJ
Years
TOT ETHANOLEXPORTED FROMC.S.A. ( BR) TO EU
TOT ETHANOLPRODUCED BY C.S.A.(BR)
0
50
100
150
200
250
2015 2020 2025 2030 2040
PJ
years
ETHANOL FROM SÃO PAULOTO ROTTERDAM (BASE RUNOF REACCESS)
ETHANOL FROM SÃO PAULOTO MARSILLE (BASE RUN OFREACCESS)

58
Figure 33: share of solid biomass use; results of the base run.
The share of BIOCRP used for the ethanol production is bigger than the one used for biodiesel production up
to 2020. In 2025 the BIOCRP used to produce ethanol is of almost 45% and in 2030 it drops sharply to almost
15% up to 2040 (see Figure 34).
Figure 34: Energy crop use; result of the base run.
As far as the CO2 emissions concerned, we can see in the following graph (Figure 35) that they gradually
increase from 1.7 GtCO2 in 2005, to 2.4 GtCO2 in 2040, without peaks or falls.
0
500
1000
1500
2000
2500
3000
3500
4000
4500
2015 2020 2025 2030 2040
PJ
YEARS
OTHER USES OF BIOSLD
BIOSLD TO PRODUCEBIODIESEL
BIOSLD TO PRODUCEETHANOL
0%
10%
20%
30%
40%
50%
60%
70%
80%
90%
100%
2015 2020 2025 2030 2040
%
YEARS
ENERGY CROP (BIOCRP)TO PRODUCE BIODIESEL
ENERGY CROP (BIOCRP)TO PRODUCE ETHANOL

59
Figure 35: CO2 emissions of the total CSA energy system; result from BASE run.
The represented emission trend refers to the total CO2 emissions produced by CSA region. These emissions
include all the CSA processes of the model.
6.3 INPUT DATA FOR THE SIMULATION OF THE BIOMASS EXPORTATION FROM BRAZIL TO EU (“BIO BRAZIL
2” SCENARIO)
The input given for the creation of the new biomass corridors and the BIO BRAZIL 2 scenario were:
- raw material supply;
- activity (production), capacity and new capacity of the examined biomass production plants along the time
(up to 2040);
- production costs, investment cost, fixed and variable costs;
- environmental policies (imposed constraints on attributes);
- other technical data (logistical data, transport costs, efficiencies, ships characteristics, etc).
To create a corridor it is important to clearly define the technologies, energy and economy that are part of
it. To do this it is necessary give the input data listed above describing the corridor as a trade process. The
trade process starts in this case from a Brazilian port and arrive to an European port transporting biomass
(commodity). For each kind of biomass trade exists a different process with its own characteristics and its
parameters.
For the choice of the input data a deep research and hypotheses have been made. These considerations are
explained in the paragraphs 6.3.1, 6.3.2, 6.3.3, 6.3.4.
1600000,000
1700000,000
1800000,000
1900000,000
2000000,000
2100000,000
2200000,000
2300000,000
2400000,000
2500000,000
2600000,000kt
CO
2
YEARS
ktonCO2 (BASE RUNOF REACCESS)

60
6.3.1 TECHNICAL DATA AND ASSUMPTIONS
6.3.1.1 PELLET
The potential export route was designed in relation to the actual Brazilian pellet production, to its domestic
use and the estimated percentage that will be destined to the exportation. Considering these values it is
possible to make an estimation of the ship load and to choose the Brazilian and European ports suitable for
this type of trade.
According with Escobar [2], the Brazilian ports that fall within the optimal area for the export of pellets are
all situated between Salvador and Paranagua'. This is due to the fact that are the nearest (not further than
150 km) to the optimal area44, in which it is possible the plantation of energy forests for the sustainable pellet
production. However, the choice was then restricted to the port that are more easily adaptable to the pellet
trade, that are those equipped with containers for the grain trade. This is because for the moment there are
no ports specifically adapted for pellet production; nevertheless, the pellet trade is currently possible through
the aforementioned existing ports. Finally, only the two major ports of the South-east and one of the north-
east were chosen, because the potential flow of exported pellets would only depend on them. The higher
production came from the South-East regions so were chosen two ports. For northern regions that produce
less only one port was chosen. The next graph represents the path followed for the choice of the export
ports.
The choice of the Europen port was obvious and easy to take. It was choosen the atual major EU port in which
already pellet trade occurs (with the North America mainly): the Rotterdam sea port.
After the choice of the ports, the distance in km was calculated using a distance simulator [108]. The ship
characteristics (ship fuel type, O&M, consumption, lifetime, etc) were choosen on the base of the other cargo
vessel ships already present in the model.
Other technical data refer to the technologies for transforming the raw material to primary energy and from
primary to secondary. In the case of Brazilian pellet, the resources are the land available for the plantation
of energy forests and the woody, agriculture and forestry residues. The first is transformed into energy crops
44 To have an idea of the optimal area, an image is available in the appendix. It was taken from [2].
sea ports close to the optimal area
•Salvador
•Aratu
•Ilheus
•Barra do Riacho
•Vitoria
•Campos
•Angra dos Reis
•Santos
•Paranagua´
sea ports easily adaptable to the pellet trade (all those which trade grain)
•Salvador
•Ilheus
•Vitoria
•Angra dos reis
•Santos
•Paranagua´
ports choosen to build the pellet-corridor BR-EU
•Santos (south-east region)
•Paranagua´(south-east region)
•Salvador (north-east region)

61
and then into pellet. The seconds, into pellet directly. All these data (i.e. efficiency of land conversion into
energy crop; production capacity) were taken from scientific studies and statistics, (mainly from [2, 33, 91]).
In particular, it is interesting to explain the choice of the efficiency to convert land to energy crop. The value
used to calculate the wood production was 45 ton of dry wood/ha/y. This value could appear higher than the
actual average productivity for a traditional Eucalyptus planted forest, (it is only 25 ton of wood/ha/y in Brazil
and only 2.5 t/ha/y in Sweden). However, if it is considered a short rotation Eucalyptus energy forest, the
number of plants per hectare increases and the aforementioned yield is achieved with the same cost of a
traditional Eucalyptus cultivation [17, 89].
With regards to the pelletization technology in Brazil, it is not widespread yet. As explained in the chapter
5.2, only about 25-30% of the actual total production capacity is exploited. So, for the exstimation of the
production capacity in 2020, 2030, 2040, 2050, it was taken into account the potential pellet production.
According with Escobar [2], it is estimated to be almost 40 Mt in 2030 and 124 Mt in 2050. Consequentely,
it was considerd a production capacity of the same order in the same years.
6.3.1.2 ETHANOL
The export routes considered are not all already existing in RECOR. The 2 ones that were added are: from
Paranagua´ Brazilian port to Rotterdam and to Marseilles ports, (with a total of 2 new differents commercial
routes). The addition of these new sea routes was done because the actual ethanol export from Brazil to the
rest of world is operated mainly by Santos and Paranagua’ ports. Both ports were already described in the
chapter 5.1. While the destination ports are the two presents in the model that serve the northen (Rotterdam
port) and the south-west (Marsille port) EU as already explained in the introduction of chapter 6. The
calculation of distance in km was estimated using the same distance simulator used for pellet´s routes [108].
The ship´s characteristics are choosen on the base of the others tanker ships already present in the model.
Other technological data refer to the ethanol chain from the raw material to the final use. As raw material it
was considered the sugarcane crops (BIOCRP) and also the lignocellulosic residues (like sugarcane bagasse
for example). The first one is used to generate a 1G ethanol and the yield to convert land to energy crop is
about 6,200 litres of ethanol per hectare (i.e. 73 ton of sugarcane per hectare); the second one is used to
produce 2G ethanol. In chapter 6.2.3.2. it was seen that the production of 2G ethanol is still poorly developed;
its production cost is still high mainly because of the difficult in the production process and in the
trasportation of raw material from the field to the production plant. However, in 2014 a 2G etanol plant
started to produce ethanol from sugarcane´s bagasse and another one started in 2015 too. Today Brazil
counted a total 2G ethanol plant capacity of 127,000 m3/y [11]. While the actual production capacity of 1G
etanol is of 39,650,000 m3/y [11], the future production capacity was calculated on the base of ten-year
Brazilian energy plan. It is forecasted a capacity of almost 42,500,000 m3 of ethanol in 2020 and 45,500,000
m3 in 2030. The 2G production capacity in the future was considered the same of the actual one despite
having many chances of growth. This choice was made to avoid overestimating the production capacity since
the development of 2G ethanol production could be very slow, [11, 95]. So, it is considered the worst case in
term of total production capacity in the future.

62
6.3.2 ENERGY DATA AND ASSUMPTIONS
6.3.2.1 PELLET
The main sources for the research of the pellet energy quantities were ABIPEL [33], BEN [41] and FAO [91];
these quantities are the production, domestic consumption and export of pellet from 2005 until now. The
estimation of the future pellet production is on the base of [2, 96]. Moreover, it was estimated the
percentage of pellet that will be exported in the future (2020, 2030, 2040). This estimation was done on the
base of the world pellet request. In particular the 3 major regions in the world were taken into account,
regions that nowadays and much more in the future are likely to need importation of pellet. In increasing
order, they are: EU, Japan and Korea, and China, [14, 15, 34, 54]. The potential external request considered
was the sum of the deficit of pellet of these 3 regions, estimated in 2020 with the data of the biofuels annual
world report. Then, the rest of Brazilian pellet produced is considered to be destined to internal consumption.
In Figure 59 (chapter 7) is shown and explained that the Brazilian potential pellet production meets and
exceeds the estimated external and internal demand.
6.3.2.2 ETHANOL
The energy data refers to UNICA source [4], as regards the amount of land available and used for the
production of sugar cane. The ANP source was used to obtain the production, export, import and then
domestic use data of the 1G ethanol. As regards the 2G ethanol production data, it was used the
“demoplants2020” platform. All the 2G ethanol produced was exported, since the production costs are still
too high for it to be profitable on the national market [41].
The production projections are made considering that the ethanol production is destined to grow: studies
have shown that in the upcoming years, ethanol yield per hectare of sugarcane (which presently is almost
6,200 l/ha) may increase until 9000 l/ha, thanks to the increase in sugarcane yield, in TAR, in fermentation
efficiency and in sugar extraction [12, 95]. The production in 2020 and in 2025 is of 35,000,000 and
43,000,000 m3 rispectively on the base of energy brazilian plan [44].
Similarly, to the hypothesis done for the projection of the 2G production capacity, also the projection of the
2G ethanol production was considered the same as today. This assumption was made on the base of the last
Brazilian Biofuel annual [11].
The export projection is almost 2,700,000 m3 in 2030, according to the energy brazilian plan [44]; then the
export in 2020 was considered an intermediate value between that of 2016 and that of 2030.
6.3.3 ECONOMIC DATA AND ASSUMPTIONS
6.3.3.1 PELLET
The economic values were calculated on the base of average values found in literature. That are the
investment production cost, that it is necessary if we want to increase the production to meet the demand.
It is an average 40 US$ per ton installed, considering a good equipment to produce pellet [96]. This value
could swing depending on the country in which the equipment is installed. For example, in Brazil it could be
a little bit more expansive, like 200 R$/t (almost 60US$/t) [96].

63
The variable and fixed O&M costs, linked to pellet production plant, that have not been modified in the
model.
It was estimated the transportation cost too. The transportation, firstly from crop land to production plant
and then from the plant to the export port, is a fundamental aspect to establish the feasibility and the
introduction in the market of a new source of energy. The viable distance from the crop to the port is 150 km
[2]. Considering the pellet transported by truck (it is the best choice of transport due to logistic reasons) [97]
and not by train, the cost of transport is almost 3 R$/km for a load of 27 tons (it is a suitable freight for pellet).
It means almost 0.11 R$/km/ton [98]. So, considering the production cost estimated in paragraph 5.2 and
adding it to the transport cost just calculated, the total cost up to the export port result almost 396.5 R$/ton.
Then it must be added the shipping cost from Brazil to Europe (i.e. Rotterdam port) to obtain the pellet price
at Rotterdam port.
The transport cost for shipping is endogenous to the model: 0.121 Euro/TJ/km [94]. Considering an average
distance of 10,000 km from Brazil port to Eu port, the total shipping cost of pellet is almost 21.80 Euro/ton
(considering a LHV of 18 MJ/kg). It is almost equivalent to 87 R$/ton (actual currency change,2018).
Summing the shipping value to all the others pellet costs described above, the cost of pellet at Rotterdam
port will be almost of 483 R$/ton (about 121 Euro/ton). This calculation agrees with literature according to
which pellet price is of 127 US$/t (CIF) and 150 US$/t (FOB) at Rotterdam port [99]. The cost of pellet at
Rotterdam port was not used in the model because it is endogenous in the model, but it is interesting to
highlight that the value found in the literature is consistent with the one of the model. In addition to this, this
value can be used to calculate the Brazilian pellet price arrived at Rotterdam port and compare it with the
European pellet price.
6.3.3.2 ETHANOL
It was considered, according to the ten-years energy plan [44], a unit investment cost for the construction of
a new ethanol production plant45 of almost 344 R$ per ton of sugarcane; then, the total investment estimated
in 2020 was of 3,435 US$46 and of 3,536 US$ in 2030.
The unit cost of the ethanol destined to export was calculated (as explained in the chapter 5.1 and as showing
in chapter 7.1), year after year, using the UNICA database [4]. Then, to obtain the value of ethanol at the
European port, it must be added the cost of freight from Brazil to Europe. As for pellets, the cost of Brazilian
ethanol arrived at European port is not an input to the model because that value is endogenous in the model
but it is interesting to highlight it for example to compare the price of Brazilian ethanol at the European port
with the one of European ethanol.
Considering the route Santos-Rotterdam, the cost of freight results in a range between 23.6 and 31.4
US$/ton47 [72]. So, considering the total ethanol exported in 2017, its price at Rotterdam port would be in
the range of 0.649 and 0.655 US$/l. This value was obtained only summing the value of ethanol exported
from Brazil with the value of freight in US$/l considering an ethanol density of 800 kg/m3. This calculation is
underestimated because sometimes there are port taxes that are not included in the estimation done by
45 Considering a plant that can produce both sugar and ethanol; a plant that can produce only ethanol has a lower cost of investment for the construction: 310.6 R$/tsugarcane. 46 Currency change: 3.413 R$/US$, [68]. 47 W100 Santos -Rotterdam 15.7 US$/ton; WS mercado pra navio Handy size WS 150-200. This means that the cost of fright is: 15.7x(1.5 – 2.0) = 23.6 – 31.4 US$/t.

64
[72]; moreover, there are also some minor insurance costs, inspection, losses, overstay that were not
considered.
The same calculation can be done considering, instead of the total exported ethanol in 2017, the volume
exported per Brazilian region. These volume quantities are available in the UNICA database with their own
value of export in US$ (FOB) (the profit margin is included). So, the only calculation that was done was
dividing the value of exported ethanol that is in US$(FOB) by its own volume in liter to have a unit cost in
US$/liter (FOB). Then, adding it to the cost of freight in US$/liter from the Brazilian port to the European port.
The results are reported in the conclusions (see 7.1 chapter) where the cost of sea transport was calculed for
three different routes (those useful for the analysis): Santos – Rotterdam; Paranagua´ - Rotterdam; Itaqui´ -
Rotterdam. The calculated shipping costs (see chapter 7.1) resulted underestimated with respect to those
used in the model, which are the following:
- 0.212 Euro/TJ/Km for Ethanol [94] (57.24 Euro/ton, considering a LHV=27 MJ/kg);
- 0.152 Euro/TJ/Km for Biodiesel [94] (56.24 Euro/ton, considering a LHV=37 MJ/kg).
The variable and fixed O&M costs linked to ethanol production plant have not been modified in the model.
6.3.4 INPUT DATA FOR BRAZILIAN BIODIESEL
Together with the other input data, useful for the simulation, other data related to the Brazilian biodiesel
production chain were also searched and included. This has been done for completeness as the model
already presents the biodiesel corridor from CSA to Europe as shown previously. In fact, thanks to further
research, it was found that the pre-existing values in the model differed very much from the actual values,
so an update was deemed appropriate. It should also be noted that biodiesel is an important biofuel in the
Brazilian energy mix, although it is used essentially for internal use as already explained in the previous
paragraphs.
Here the biodiesel data updates are briefly explained.
In Brazil the feedstock used for the production of biodiesel is of different types, but the predominant is the
soy oil (80.79%, [ANP,2015]), followed by animal fat (15.82%, [ANP, 2015]). In the production chain of the
model are present two ways of biodiesel production: the transesterification of vegetable oil (BVEGME101)
and the biodiesel production from woody biomass (BWOOFTDST110 or BZWOOFTDST110: with or without
carbon capture CCS respectively). Consequently, the percentage of biodiesel produced by animal fat was
excluded and it was taking into account only the share from soy. The third share from other feedstock (3.39%
[ANP,2015]) was not considered because negligible.
The production and the production capacity data of soy, soy oil and its derived biodiesel from 2015 to 2030,
were found in a document realized by three brazilian associations (ABIOVE, APROBIO and UBRABIO), which
shows the brazilian biodiesel projections compared with the actual situation [101]. The values were
considered reliable after a consultation with specialists in the sector; in addition of this, they match with the
ones of the ANP database and with the ones of Biofuel brazilian annual [11]. It was the same for the data
referred to the new capacity investment cost in 2020, 2025 and 2030. Fixed and variable O&M costs and
efficiency in process trasformation (from SURLAND to BIOCROP) are the ones given by the model.

65
To convert the data from quantity per year to energy per year were considered the following lower heating
values (LHV): 6,778 kJ per kg of soy [102]; 33,995 kJ per liter (=8,125 kcal/liter) of soy oil (BIOVEGOIL) [103];
33,137 MJ per m3 (9,000 kcal/kg) of biodiesel (BIODST) [41]. The density of soy oil considered was 920 kg/m3
[11]. The biodiesel density considered was 880 kg/m3 [11].
The surplus of agricultural land (SURLAND), that is the start commodity of the production chain for both
ethanol and biodiesel produced by energy crop, has been differentiated in SURLAND1 and in SURLAND2. The
first one refers to hectares of sugarcane, and second one refers to hectares of soy.
6.4 RESULTS FROM BIO BRAZIL 2 SCENARIO
Thanks to the input data just described in paragraph 6.3, the so called Bio Brazil 2 Scenario was modelled.
Then, through a run done after the first BASE run, some interesting results were obtained.
In this chapter the main results are described and compared with the BASE scenario results.
The BIO BRAZIL 2 scenario includes the implementation of new five biomass corridors already listed in the
introduction of chapter 6 and now shown in Figure 36.
Figure 36: Biomass Corridors from Brazil to EU of the BIO BRAZIL 2 scenario.
The map shows the biomass routes present in BIO BRAZIL 2 scenario. These include a total of eleven ships:
the 6 already present in the BASE scenario plus the 5 new ships implemented (all listed in the introduction of
chapter 6).
The ship activity is shown in figures 38, 39 and 40 in PJ. These pictures describe three types of biomass trade:
ethanol, biodiesel and wood pellet.
The import of pellet from Brazil to EU was null in the BASE scenario but it appears in BIO BRAZIL 2 scenario.
This means the model chose the pellet corridors created.

66
The following Figure 37 illustrate the conversion process (UBIOBSL100) which transform the solid biomass
(BIOSLD) from raw material to energy source for end use (BIOBSL, which is pellet), which is present in TIAM
model. In the same Figure is also shown the trade of pellet from Brazil to EU through the three different ships
that have been added in RECOR model (from Santos to Rotterdam; from Paranagua’ to Rotterdam and from
Salvador to Rotterdam).
Figure 37: Solid Biomass chain from production to trade_BIO BRAZIL 2 Scenario.
The BIOBSL production exceeds the export. Figure 38 shows that in the BIO BRAZIL 2 scenario the production
of pellet starts to be higher than the one of the BASE scenario in 2015. In the same year Brazil starts to export
pellet to EU end this exportation grow up in a linear way up to reach 856 PJ in 2040.
Figure 38: Trend of the production and exportation of Brazilian pellet (BIOBSL).
The growth can be justified by the increasing need of EU to buy pellet and the fact that the new scenario
provides three available routes of pellet (all starting from Brazil) that did not exist in the BASE scenario.
Moreover, since these routes are chosen by the model, it means that they are convenient in term of costs
with respect to the others from the ROW. So, it happens that EU continues to import BIOBSL from Canada
0
500
1000
1500
2000
2500
3000
3500
4000
4500
5000
2015 2020 2025 2030 2040
PJ
Years
Production of BIOBSL_Bio Brazil 2
Production of BIOBSL_Basescenario
Export of BIOBSL_Bio Brazil 2

67
and Russia with the same total quantities in both scenarios but in BIO BRAZIL 2 scenario the corridor Brazil-
EU appears.
The quantity of pellet shipped is equally distributed between the three Brazilian ports and so into the three
different ships. This trend is surely linked with the available quantity of pellet at the Brazilian ports. The fact
that it is equally distributed is due to the fact that the model cannot distinguish the region in which the
production is higher and where is lower. The model only considers the cost and so the preferred route should
be the shortest route. However, it does not exactly occur in this case because when new process is
introduced, the growth/decay values can influence the choice of the model. These values have the function
of modulate the variations of the activity of a process along the time horizon to avoid sudden changes from
one year to another in order to generate a trend which is as realistic as possible.
Figure 39: Pellet ship activity of BIO BRAZIL 2 Scenario.
The only ship activity that remains the same in both scenarios is the one of biodiesel trade. The trend is
growing along the time almost in a linear way. At each year the model prefers the cheaper route (from Brazil
to Marseille) with respect to the others (see figure 40).
0
50
100
150
200
250
300
2020 2025 2030 2040
PJ
Years
wood pellet shipactivity_Paranagua'-Rotterdam
wood pellet shipactivity_Santos-Rotterdam
wood pellet shipactivity_Salvador-Rotterdam

68
Figure 40: Biodiesel ship activity of BIO BRAZIL 2 Scenario (that is the same of that of the BASE Scenario).
The fact that the importation of CSA biodiesel to EU in BIO BRAZIL 2 scenario remains the same of the one
of the BASE scenario is due to the fact that the demand for biodiesel from Europe remains the same but the
production of biodiesel in CSA decreases from one scenario to another (see figure 42). So, it is justified that
export not increased and it also did not decrease to satisfy the EU demand.
The ethanol ship activity begins in 2015 and its trend is not stable along the time (see figure 41). This
unstable trend is due to the fact that the introduction of new process (in this case the two ships: from
Paranagua’ to Marsille and from Paranagua to Rotterdam) is modelled by some values of growth/decay
that have the function of modulate the variations of a process along the time horizon to avoid sudden
changes from one year to another to reproduce a trend as close as possible to reality.
The quantity of ethanol exported is not equally distributed into the different ships. For example, we can see
in figure 41 a high peak in 2040 for the tanker that transports ethanol from Paranagua’ to Marsille port.
This peak is unexpected because, even if only slightly, the route Paranagua’ -Marseille is the second
cheapest route. The cheapest route is from Santos (San Paolo) to Marseille. However, Santos is also the
only Brazilian port present in TIAM (before introducing new corridors) whose capacity has to be able to
export all the rest of energy sources (in addition to biodiesel) to the ROW. So, it is not always chosen by the
model, like in this case, despite being the cheapest.
0,00
50,00
100,00
150,00
200,00
250,00
300,00
350,00
400,00
450,00
2015 2020 2025 2030 2040
PJ
Years
BIODIESEL ship activity Brazil toRotterdam
BIODIESEL ship activity Brazil toMarsille
BIODIESEL ship activity Argentinato Rotterdam
BIODIESEL ship activity Argentinato Marsille

69
Figure 41: Ethanol ship activity of BIO BRAZIL 2 Scenario.
If we compare the total quantity of ethanol imported from CSA in the BIO BRAZIL 2 scenario with respect to
that imported in the BASE scenario, we can note that in the first case it is higher. The exact quantities are
showed in Table 15 (PJ).
2005 2006 2010 2015 2020 2025 2030 2040
total alceth_ship activity(PJ)_base
0,00 0,00 0,00 100,00 215,93 350,32 230,89 302,80
total alceth_ship activity(PJ)_bio brazil 2
0,00 0,00 0,00 100,00 315,93 387,62 322,46 333,28 Table 15: comparison between the ethanol imported from CSA in the base run and in bio brazil 2 scenario.
The higher quantity of ethanol imported by EU from Brazil in the Bio Brazil 2 scenario (1459,29 PJ VS. 1199,94
PJ) can be justified by an increment in ethanol availability at lower cost, if compared with the ethanol from
the other countries of the world. Moreover, there is a country that is exporting less ethanol in EU than in the
BASE scenario. This country is Africa (see Table 16). The following table shows this phenomena in term of
numbers where:
- delta_BR is the increase of ethanol imported from BR, with respect to the one of the BASE scenario;
- delta_AFR is the decrease of ethanol imported from AFR, with respect to the one of the BASE
scenario;
- delta_tot is the total increment of ethanol imported from the ROW with respect to the one of the
base scenario.
0,00
50,00
100,00
150,00
200,00
250,00
2015 2020 2025 2030 2040
PJ
Years
ethanol shipactivity_Paranagua'-Rotterdam
ethanol shipactivity_Paranagua'-Marsille
ethanol ship activity_Santos-Rotterdam
ethanol ship activity_Santos-Marsille
YEARS 2020 2025 2030 2040
DELTA_BR [PJ] 100,00 37,30 91,57 30,48
DELTA_AFR [PJ] -24,28 -26,23 -17,29 -7,51
(DELTA_BR/DELTA_TOT) [-] 1,321 3,371 1,233 1,327

70
Table 16:Comparison between ethanol imported by EU in the base scenario and in the bio brazil 2 scenario in PJ. Increase in BR share and decrease in AFR share.
The previous Table 16 highlights that in the BIO BRAZIL 2 scenario the model increases the import of ethanol
from Brazil at the expense of the one coming from Africa. In the table were showed only the years starting
from 2020 because until that year the exportation is the same between the two scenarios.
The production of CSA biofuels is represented in figure 42. Biodiesel production grow up from 2005 to 2040
without falls. The ethanol production is not increasing along the whole timeline but it is higher than the
biodiesel one except in 2030 where the ethanol production goes down and became lower than the biodiesel
one. The same occurs in the BASE scenario but before 2030, exactly between 2020 and 2025. The decrease
in production is due to a decrease in energy crop (BIOCRP) availability because the model prefers to use it to
produce biodiesel instead of ethanol (it is showed in figures 43 and 44).
Figure 42: CSA Biofuels production, BIO BRAZIL 2 Scenario.
In figure 43 and 44 the use of energy crop (BIOCRP) in the BIO BRAZIL 2 scenario and in BASE scenario
respectively is showed, differentiating the part used for the biodiesel production and the part used for the
ethanol production. In Figure 34 is represented the same thing but referring to the BASE scenario in terms of
percentage.
0
500
1000
1500
2000
2015 2020 2025 2030 2040
PJ
Years
Biodiesel production_Bio Brazil 2 Ethanol production_Bio Brazil 2
Biodiesel production_Base Run Ethanol production_Base Run
(DELTA_AFR/DELTA_TOT) [-] -0,321 -2,371 -0,233 -0,327

71
Figure 43: Energy Crop used to produce biofuel in CSA, BIO BRAZIL 2 Scenario.
Figure 44: Energy Crop used to produce biofuel in CSA, BASE Scenario.
In figures 44 is evident that until 2020 the share of BIOCRP used to produce ethanol is higher but after this
year the opposite happens. This phenomenon obviously influences the production quantities as it was
explained above.
Concerning the solid biomass (BIOSLD) used to produce biofuels, the share used to produce ethanol is null
(Figure 45). It means that the model chooses not to produce 2G ethanol in Brazil. Moreover, the BIOSLD is
not entirely used to produce biodiesel but also for other process such as gasification (methane production
from biomass), and conversion from BIOSLD to BIOBSL. Figures 45 and 46 show the BIOSLD utilization for the
two different scenarios.
0
500
1000
1500
2000
2500
3000
3500
2005 2006 2010 2015 2020 2025 2030 2040
PJ
Years
energy crop used to produce ethanol energy crop used to produce biodiesel
0
500
1000
1500
2000
2500
3000
3500
2005 2006 2010 2015 2020 2025 2030 2040
PJ
Years
energy crop used to produce ethanol energy crop used to produce biodiesel

72
Figure 45: CSA solid biomass use, BIO BRAZIL 2 Scenario.
Figure 46: CSA solid biomass use, BASE Scenario.
Comparing the previous 45 and 46 histograms, the only thing that changes is the quantity of BIOSLD used to
produce BIOBSL; that is a little bit higher for the BIO BRAZIL 2 scenario than for the BASE scenario, starting
from 2020 up to 2040. This can be justified by the fact that Brazil starts to export pellet in BIO BRAZIL 2
scenario so also the production increase. The rest of quantities remains the same along the whole time
horizon.
Finally, in Table 17 the CO2 emissions (in ktonCO2) generated by the CSA energy system in Bio Brazil 2 scenario
and in Base scenario are showed where:
- Delta CO2 = (total CSA CO2 emission of REACCESS_BASE) – (total CSA CO2 emission of REACCESS_BIO
BRAZIL 2)
- Total CO2_BASE is the total CSA CO2 emission of REACCESS_BASE.
Comparing the two, it is possible to see that emissions vary very little between one scenario and another. In
addition to this is possible to see in the third line of the table that in 2020 and in 2025, the higher emissions
0
1000
2000
3000
4000
5000
6000
2015 2020 2025 2030 2040
PJ
YEARS
BIOSLD transformed into BIOBSL
BIOSLD for gasification,biomass (tree salix etc) to methane
BIOSLD used to produce biodiesel
0
1000
2000
3000
4000
5000
6000
2015 2020 2025 2030 2040
PJ
Years
BIOSLD transformed into BIOBSL
BIOSLD for gasification,biomass (tree salix etc) to methane
BIOSLD used to produce biodiesel

73
occur in the BASE scenario; while in 2030 and 2040, the higher emissions occur for the Bio Brazil 2 scenario.
The higher discrepancy occurs in 2040 with an absolute value of percentage difference of 0,0012%.
Scenario 2020 2025 2030 2040
REACCESS_BASE [ktonCO2] 2022241 2127956 2268621 2430406
REACCESS_BIO BRAZIL 2 [ktonCO2] 2022240 2127951 2268630 2430436
(DeltaCO2)/(total CO2_BASE) [%] 0,0000 0,0003 -0,0004 -0,0012 Table 17: CO2 Emissions of the whole CSA energy system in KtonCO2; comparison between the BASE and the Bio Brazil 2 scenarios.
6.5 INPUT DATA AND HYPOTHESIS FOR THE SIMULATION OF ALTERNATIVE SCENARIOS
(“ADV” and “BIO BRAZIL 3” SCENARIOS)
After the analysis of BIO BRAZIL 2 scenario, two other sea routes were introduced in the model, which are
dedicated only to the export of ethanol. These are the listed below and are shown in figure 47:
from Itaquì port to Rotterdam port;
from Itaquì port to Marseille port.
Figure 47: ethanol corridors Itaquì-EU.
The choice of adding the Itaquì port for ethanol exportation is already discussed in chapter 5.1. So, the so
called BIO BRAZIL 3 scenario is done with the aim to analyse the effect of the introduction of these new sea
route on the whole energy system.
The costs of these two new trades result lower with respect to the ones already present in the model because
the distance of these routes is lower if compared with the others routes already modelled. So, we expect
that the model prefers them at the expense of the other ones.

74
The distance was calculated with the same distance simulator used for the other routes [108] and all the
ship’s characteristics (such as costs and fuel) are the same of the others too.
In addition to including the two new corridors listed above and those introduced in BIO BRAZIL 2 scenario (in
point 4 of appendix all the corridors of the scenario are listed), the BIO BRAZIL 3 scenario also considers the
effects of the imposition of the Italian Decree (DM 2 March 2018) extended to all European countries. This
Decree is composed by the following targets, setted for 2020:
- the minimum biofuels contribution to transport must be of 9%;
- the minimum of advanced biofuel contribution to transport must be of 0,9% of the sum (gasoline +
diesel);
- the 75% of this 0,9% must be bio-methane;
- the 25% of this 0.9% must be advanced biofuels;
- after 2020 the advanced biofuels must be equal or higher than 1,85%.
The first important consideration emerges after the calculation of the biofuels share over the total EU
transport energy consumption of the BASE scenario: the 9% of biofuels contribution results already reached
in 2020 (see Figure 48). It occurs thanks to the CO2 emissions limit just included in the BASE scenario.
Figure 48: EU energy transport demand: percentage of fossil VS biofuels and electricity.
So, it was possible to impose all the others limits, on the use of advanced biofuels, to the EU energy mix used
to satisfy the EU transport demand of the BASE scenario. Considering these values as input, another run was
done and another scenario (the ADV) was created. Finally, were added all the new corridors (new with
respect to the BASE scenario) to the ADV scenario and another run was done with the consequence creation
of the BIO BRAZIL 3 scenario.
The main results of the ADV and BIO BRAZIL 3 scenarios are described in the paragraphs 6.6 and 6.7.
0%
10%
20%
30%
40%
50%
60%
70%
80%
90%
100%
2020 2025 2030 2040
%
YEARS
biofuels+electricity fossils+hydrogen

75
6.6 THE ADV SCENARIO RESULTS
Figure 49 shows the effects of the Italian Decree imposition for two representative years: 2020 and 2040.
The green part represents the share of biofuels used in transport and it is, as expected, the higher share of
renewable transport fuels. This occurs for both scenarios and for both the representative years.
Figure 49: Share of renewable fuels used to satisfy the transport demand in EU; comparison between the BASE scenario and the ADV scenario.
In the previous bar graph, it is not so evident the share of advanced biofuels. It is justified by the fact that
the percentage imposed on the total is low. If we eliminate the share of biofuels and electricity it is visible
the difference between the BASE and the ADV scenario, in which the advanced biofuels are chosen by the
model (because imposed) at the expense of others fuel such as hydrogen (see figure 50).
Figure 50: Share of hydrogen, bio-methane, advanced biofuels on the total fuels consumed to satisfy the EU transport demand.
0
500
1000
1500
2000
2500
3000
3500
4000
4500
5000
2020 2040 2020 2040
BASE ADV
PJ
Share of biofuels in the different scenarios
Hydrogen Electricity Biofuels Bio-methane Advaced bio
0
50
100
150
200
250
300
350
400
450
2020 2040 2020 2040
BASE ADV
PJ
Share of biofuels in the different scenarios
Hydrogen Bio-methane Advaced bio

76
In figure 50 it was eliminated the share of 1G biofuels and the share of electricity. In this way it is easier to
appreciate the growth of the 2G (advanced) biofuels in the ADV scenario with respect to the BASE scenario.
However, it is important to note that if the 2G biofuels are not imposed, they may not be chosen by the
model because too much expansive.
Other effects of the imposed targets are evident on the biofuels import from CSA. Figure 51 shows the trend
of the ethanol and biodiesel trade from CSA to EU.
Figure 51: Biofuels exported from CSA to EU _ ADV scenario.
The import of biodiesel remains almost the same in quantity in comparison with the BASE scenario (the
difference is only of about 6 PJ in 2040). It is shown in Figure 52.
Figure 52: Biodiesel ship activity_comparison between the BASE and the ADV scenario.
It is not the same for the ethanol trade: it grows up until reaching 200 PJ in 2020 and then rapidly goes down
to reach 47 PJ in 2040. Considering the total ethanol exportation, it results of only 615 PJ in the ADV scenario
against the 1200 PJ of the BASE scenario.
0
200
400
600
800
1000
1200
1400
1600
2015 2020 2025 2030 2040
PJ
years
CSA (BR) exportedethanol_ADV Scenario
CSA Biodiesel export_ADVScenario
BR exported biodiesel_ADVScenario
0
200
400
600
800
1000
1200
1400
1600
2015 2020 2025 2030 2040
PJ
years
CSA_EXPORTED_BIODIESEL_BaseScenario
CSA_EXPORTED_BIODIESEL_ADVScenario

77
The phenomenon is more visible in figure 53, where the blue bars represent the BASE scenario ethanol ship
activity (export from CSA to EU) and the red bars represent the ethanol ADV scenario ship activity along the
time.
Figure 53: ethanol ship activity_comparison between the BASE and the ADV scenario.
We can expect that in future a decrease of 1G biofuels import will occur because the demand in EU became
lower (as the table 18 shows starting from 2040) in favour of the introduction of the 2G biofuels.
In the ADV scenario the decrease in ethanol import starts in 2020 and it is much bigger than the one in
biodiesel import (only 6 PJ in 2040). It can be justified because between the European transport technologies
present in the model, the ones that use ethanol are very less than the ones that use biodiesel. In fact, the
consumption of ethanol for transport in EU in the BASE scenario is only of 227.8 PJ while the one of biodiesel
is of 1246.6 PJ. Also in the ADV scenario the consumption of ethanol for transport in EU is lower than the one
of biodiesel. For example, in 2020, the ethanol consumed is of 266.2 PJ against 1324.2 PJ of biodiesel
consumed (see Table 18).
EUROPEAN ETHANOL AND BIODIESEL DEMAND FOR TRANSPORT (PJ)
2020_BASE 2020_ADV
Biodiesel 1246.6 Biodiesel 1324.2
Ethanol 227.8 Ethanol 266.2
2040_BASE 2040_ADV
Biodiesel 3398.5 Biodiesel 3372.4
Ethanol 297.6 Ethanol 283.2 Table 18: EU transport demand; BASE vs ADV scenario.
The previous table also shows that the discrepancy between the EU consumption in transport of biodiesel
and ethanol grows up to 2040.
0
50
100
150
200
250
300
350
2015 2020 2025 2030 2040
PJ
Years
CSA(BR)_EXPORTED_ETH_BaseScenario
CSA(BR)_EXPORTED_ETH_ADVScenario

78
6.7 BIO BRAZIL 3 SCENARIO RESULTS
As explained in the paragraph 6.5, after the analysis of the ADV scenario were introduced in it all the seven
new biomass corridors48. The fact that the quantity of exported ethanol has already decreased in the ADV
scenario leads to think that it will decrease this time too because the same Decree is imposed and the same
European transport technologies are present in the model.
As for the addition of new ships, we expect that the ships that will be chosen by the model for the trade are
the ones already introduced because of its lower distance from EU with respect to the others.
Figure 54 shows the resulted trends of the three different types of biomass exported from Brazil to EU in the
BIO BRAZIL 3 scenario compared with the ones of BASE scenario.
Figure 54: Pellet, ethanol and biodiesel trade from BR to EU; comparison between BIO BRAZIL 3 and BASE scenario.
The decrease of the ethanol had been foreseen. The reasons are the same already explained in chapter 6.5
in fact, even if with different numbers, the same things happen:
- with the imposition of the Decree the demand of 1G biofuels in EU becomes lower in the future so
the import of 1G biofuels is expected to decrease.
- The export of ethanol decreases much more than the almost imperceptible decrease in biodiesel
because the European transport technologies present in the model are always the same so the ones
that use ethanol are again very less than the ones that use biodiesel and the demand of ethanol for
transport in EU results much lower than the one of biodiesel.
Another thing that can be highlighted is the fact that EU ethanol import is only from Brazil, while biodiesel
import is also from Argentina, USA and ODA. Consequently, could occur that the biodiesel import decrease
is distributed on all these regions while the ethanol import decrease occurs only for Brazilian corridors.
48 All the seven corridors are listed in the point 4 of the appendix.
0
200
400
600
800
1000
1200
2015 2020 2025 2030 2040
PJ
YEARS
PELLET EXPORTEDFROM BR TO EU_BIOBRAZIL 3
ETHANOL EXPORTEDFROM BR TO EU_BIOBRAZIL 3
BIODIESEL EXPORTEDFROM BR TO EU_BIOBRAZIL 3
BIODIESEL EXPORTEDFROM BR TO EU_BASE
ETHANOL EXPORTEDFROM BR TO EU_BASE

79
Another relevant result was the inactivity of the following three ships:
- from Santos to Rotterdam (pellet);
- from Santos to Rotterdam (ethanol);
- from Santos to Marseille (ethanol).
This was not expected because the more expansive routes are the ones from Paranaguà port. However,
Santos and Paranagua’ are very near so the difference between the two routes is a few kilometres. In addition
to this, the inactivity of the three ships listed above can be justified with logistic reasons as the fact that
Rotterdam port is the main of EU and so its capacity is limited to be able to receive all the energy and
materials imports from all part of the world. At the same way Santos is the only Brazilian port present in the
model (before the addition of the new routes) and so, it has to be able to export all the other sources of
energy, in addition to biomass, from Brazil to the ROW.
For the same reason, of the two ships leaving from the nearest port (Itaquì), only the one that arrive to
Marseille is really used to export. While the one that arrive to Rotterdam port is used very little.
If we compare the ship activities of the BIO BRAZIL 3 scenario with respect to the ones of the BIO BRAZIL 2
scenario, we can observe that:
- ethanol export from BR decrease a lot with respect to the one of the Bio Brazil 2 scenario;
- pellet export from BR increase a lot with respect to the one of the Bio Brazil 2 scenario;
- biodiesel export from CSA (BR and Argentina) remains almost the same with respect to the one of
the Bio Brazil 2 scenario.
This is visible in the following three Figures (55, 56, 57).
Figure 55: ethanol ship activity: comparison between bio brazil 2 and bio brazil 3 scenarios.
0
50
100
150
200
250
300
350
400
2015 2020 2025 2030 2040
PJ
YEARS
eth ship activity Bio Brazil 2
eth_ship_activity_bio brazil 3

80
Figure 56: biodiesel ship activity: comparison between bio brazil 2 and bio brazil 3 scenarios.
Figure 57: Pellet ship activity: comparison between bio brazil 2 and bio brazil 3 scenarios.
The activity trends of ethanol and biodiesel have already been widely discussed.
Last but not least, the fact that solid biomass import increases a lot from 2006 to 2040 and it also increase
passing from the bio brazil 2 scenario to the bio brazil 3 scenario: it is a potential trade that can be taken into
account because convenient as also literature suggests.
0
200
400
600
800
1000
1200
1400
1600
2015 2020 2025 2030 2040
PJ
years
biodiesel ship activity_BioBrazil 2 scenario
biodiesel ship activity_biobrazil 3 scenario
0
200
400
600
800
1000
1200
2015 2020 2025 2030 2040
PJ
years
pellet ship activity_Bio Brazil2 scenario
pellet ship activity_bio brazil3 scenario

81
7. SUMMARY, CONCLUSIONS AND RECOMMENDATIONS
7.1 SUMMARY The analysis made in this study starts from the common interest of Brazil and European Union in exporting
and importing types of energy alternative to the fossil one. In particular it was studied the possibility of
ethanol and pellet trade between the two regions.
Figure 58: EU ethanol import & BR ethanol export.
Figure 58 shows the quantity of ethanol exported by Brazil to the rest of the world in the last seven years
(red line) and the quantity of ethanol imported by EU in the same period (blue line). The ethanol available in
Brazil has been sufficient to satisfy the European demand.
Figure 59 represents the potential of pellet exportation for Brazil (red line). It is expected to start in 2020 in
which it has a big and fast growth. For the moment the production is limited to the internal market because
it is still too low, but the growth is really possible. This growth surely requires investment of the whole sector,
like in transport, infrastructures and export port; but if there is a suitable buyer who is interested in the
import of this kind of biomass, Brazilian pellet companies are more motivated to invest. It is possible to arrive
to produce 40.77 Mt of pellet in 2030 and so it was estimated an export availability of almost 20 Mt in the
same year; the export of pellet can reach a quantity of almost 57 Mt in 2040. All these values came from
some considerations explained in the paragraph 6.2.2.1.
0
0,5
1
1,5
2
2,5
3
3,5
2011 2012 2013 2014 2015 2016 2017
Mm
3
YEAR
EU ETHANOL IMPORT[Mm^3]
BR ETHANOL EXPORT[Mm^3]

82
Figure 59: EU deficit of pellet & BR export pellet potential.
In the same graph (figure 59), the blue line represents the EU deficit of pellet from 2009 to 2030. EU results
a suitable buyer since the quality of pellet that can be produced in Brazil meet all the characteristics required
by the Enplus certification. Moreover, the European deficit of pellet is growing: it passed from 1.6 Mt in 2009
to 7.4 Mt in 2016 and it will continue to grow (in 2020 it is estimated to be 10.8 Mt [5]).
7.1.1 THE POSSIBILITY OF GROWTH OF THE BRAZILIAN ETHANOL´S PENETRATION IN THE
EUROPEAN MARKET
From this study also emerges a potential of growth for the export of ethanol from Brazil to EU as it is totally
competitive in the European market. Figure 60 shows on the Y axis the unit cost [US$/liters] of ethanol
calculated at the port of Rotterdam starting from the Santos port, and on the X axis the quantity of ethanol
[litres] exported by Brazil in 2016/17.
This representation was made for each ethanol production region. In this way it is possible to see from which
region of Brazil it is more convenient to export to Rotterdam.
The values are approximate because the cost calculated does not include some port taxes and some minor
insurance costs, inspection, losses, overstay that were considered negligible.
The cost at the port of Rotterdam essentially includes the cost of production and the cost of transportation
up to Rotterdam. The cost of ethanol is available in the UNICA database which provides the value of ethanol
per region of production without taxes (PIS, COFINS, ICMS). The cost of shipping was calculated with the
Worldscale platform estimation [72].
0
10
20
30
40
50
60
70
20
09
20
10
20
11
20
12
20
13
20
14
20
15
20
16
20
20
20
30
20
40
Mt
YEAR
EU PELLET DEFICIT Mt
BR PELLET EXPORTPOTENTIAL Mt

83
The quantities of exportable ethanol per region also derive from the UNICA database.
Figure 60: Ethanol export per Brazilian state of production [litre] VS its price at Rotterdam port starting from Santos port [US$/litre].[Done by the author using data from [72, 4] ].
Crop year: 2016/17
ETHANOL COST AT ROTTERDAM PORT (from Santos port)
SÃO PAULO MINAS GERAIS
GOIAS PERNAMBUCO PARANA´ OTHERS (it not
included the
MATOPIBA area)
US$/l(min) 0.548 0.624 1.242 1.169 1.029 2.262
US$/l(max) 0.555 0.630 1.248 1.175 1.036 2.268
Table 19: ethanol price at Rotterdam port (from Santos port).
In Table 19 the detailed cost values of Figure 60 are reported.
San Paolo emerges as the most favourable region for export to Europe. Considering that ethanol in Europe
has values close to US$ 0.8 per litre [76] (E85 is sold at 0.89-1.01 US$/l [76]), the Minas Gerais region is also
competitive. It should be emphasised that these two regions (the Centro-Sul region representing the 91% of
production [66]) and in particular San Paolo, constitute the largest percentage of ethanol production in Brazil;
therefore also in terms of quantity the market results favourable.

84
As it was seen in the chapter 5.1, an investment is planned in another suitable area available for sugar cane
production: the MATOPIBA area. It was calculated that the potential ethanol production from that area is
22,765,000 m3. Considering an increase in efficiency production from 6,375 to 9,000 liter of ethanol per
hectare, it could reach 32,138,000 m3. Another scenario of production was done by the MME [44]. It refers
to the whole Brazilian soil and foresees a production of 35,000,000 m3 in 2020 and of 43,000,000 m3 in 2025.
Considering the scenario of MATOPIBA region it is possible to develop a new route of trade from Itaqui’ (Saint
Louis, MA) port (since it would be the nearest port to that area of production) to Rotterdam. In this way the
distance to reach Europe would be less than the one starting from Santos port (almost 5 days less [104]) and
consequently the cost of transport lower.
In the table 20 is reported the calculated value of maritime transport from Itaqui’ to Rotterdam port and the
one from Santos port to Rotterdam port:
Cost of maritime freight (ethanol) Min [US$/l] Max [US$/l]
Santos - Rotterdam 0.019 0.025
Itaqui´ - Rotterdam 0.014 0.019 Table 20: comparison between the freight costs of two different sea routes; Worldscale estimation [72].
Consequently, considering that the potential production quantities in MATOPIBA are high if compared with
the actual exportation quantities, surely the cost of production would be almost similar to the one of São
Paulo. So, the value of ethanol at Rotterdam port starting from Itaquì would be similar or lower than the ones
starting from Santos port. Additionaly, it would result totally competitive with the European ethanol too.
It is interesting to remember the fast development of 2G ethanol production in Brazil. It started in 2014 and
it is a sector very promising for the future. For this reason the main ethanol producers are investing a lot to
improve the efficiency of this new technology [105]. This is interesting considering the needs of the EU to
consume as much as possible 2G biofuels, to meet the stipulated environmental policies. The production cost
of 2G ethanol are obviously higher than the ones of 1G ethanol, but is forecasted a reduction in Brazil, which
will result in the sale of absolutely competitive 2G. The cooperation between Brazil and Europe is already
existing. For example in 2016 a project called BECOOL between Italy and Brazil on the development of 2G
biofuels, was born. Pillars of BECOOL are the creation of innovative cropping systems and crop residues, the
improvement in the biomass logistics and the optimization in conversion processes of advanced biofuels for
the transport sector. BECOOL is in cooperation with a project called BIOVALUE developed in Brazil; this
cooperation will permit opportunities of new jobs and growth through the development of a sustainable
biofuels.
7.1.2 THE POSSIBILITY OF THE BRAZILIAN PELLET´S PENETRATION IN THE EUROPEAN
MARKET
Considering the cost estimations about pellet in Brazil and in Europe, results similar to those of ethanol in
term of competitiveness are obtained. As seen in this study, the cost of pellet at the export port could be
calculated summing to the production cost, the cost of transport to the port by truck considering a distance
of 150 km. This calculation gives an approximated value of 397 R$ per ton (almost 110 US$/ton considering
the actual (2018) currency change). The value at Rotterdam port will be slightly higher as it was calculated in
the paragraph 6.2.3.1, (like for example 127 CIF or 150 FOB US$/ton [99]).

85
The lowest actual price of pellet in the European market is almost 245 Euro/ton (almost 293 US$/ton
considering the actual (2018) currency change). It means that the Brazilian pellet would be totally
competitive. However, it is necessary to overcome the barriers (precarious railroads, expensive freight, ports
adaptable but not adapted yet, low production efficiency [63]) that hinder the export of this product from
Brazil. This is not a simple process but to be aware of the gain that would be obtained if this type of trade
were completed, surely helps speeding up the mechanisms of expansion of this trade.
Another issue that one has to consider is the competitiveness with the other countries that already export
pellets to Europe. The most important European pellet trade is with the USA and Canada. In 2015 the USA
exported 4.64 Mton of pellet to EU; in the same year Canada exported 1.29 Mt of its own pellet in Europe.
According to [106, 107] the cost of Canadian pellet already transported at North Vancouver to be exported
was of 104.35 US$/t.
7.1.3 COMPARISON OF SCENARIO RESULTS AND LITERATURE RESULTS
Before commenting on the scenarios results, some considerations must be underlined:
- in literature it is considered that the production is done only by Brazil and its exportation to the rest of
world, while the model refers to CSA production and to CSA exportation to the EU only;
- the objective of the scenarios of this study is giving the trends of biomass export from Brazil to EU and giving
an idea of potential situations linked to this trade that could occur in future;
- cost of shipping in the model are almost the same of literature ones regarding the pellet but higher regarding
ethanol.
The results of the BIO BRAZIL 2 scenario related to biomass exportation differ from those found in literature
(see tables 21 and 22). As the table 22 shows, only the values related to the production of ethanol in 2030
are similar because exogenously imposed.
Biomass: PELLET EXPORTATION(PJ)
Year 2030
Scenario results 526
Literature values 360
Table 21: Comparison between pellet results of BIO BRAZIL 2 scenario and literature values.
Biomass: ETHANOL PRODUCTION(PJ) EXPORTATION(PJ)
Year 2030 2030
Scenario results 922 322
Literature values 920 60
Table 22: Comparison between ethanol results of BIO BRAZIL 2 scenario and literature values.

86
Values of exported ethanol of Bio Brazil 2 scenario are higher with respect to the ones of the scenario done
by MME [44]. In 2030, for example, the MME study [44] foresights an ethanol export of 60 PJ, while the Bio
Brazil scenario accounts for 322 PJ in the same year.
Regarding the pellet values, export projections deviate from the literature values. Export values resulted of
526 PJ in 2030, while in literature they are estimated to grow up to 360 PJ in 2030.
7.2 CONCLUSIONS AND RECOMMENDATIONS
In conclusion, even if the scenario values differ from those of literature in quantities, they remain acceptable
in terms of trends because reflects the expectations. Moreover, the objective of the study, which was to
simulate the biomass trade between two countries and to analyse its trend, is reached. In fact, the creation,
updating and implementation of the biomass corridor from Brazil to Europe in REACCESS model was done.
The objective reached coincides substantially with the innovative contribution of the thesis because the new
RECOR corridor created was implemented in the model and tested with results that met the expectations
and illustrate how the new corridors behave and how the global energy system can react to the introduction
of these new corridors.
The most interesting results of the work are resumed below.
The 1G ethanol import in EU is destined to decrease in future and it will happens mainly because of the
European restriction on 1G biofuels. This result suggests to EU to start importing or investing in 2G ethanol.
Since Brazil is at the forefront in ethanol sector, it can be a good candidate to import from.
In addition to this, it was seen that the imposition of biofuels restriction on the transport energy mix in EU
allows to improve sustainability but at the same time it challenges the penetration of other fuels that would
help diversify the EU energy mix, such as hydrogen.
An interesting result concerns the import of pellet from Brazil as this is a market that has not yet been
developed. From the analysis, Brazil proved to be an interesting alternative to current pellet suppliers. In
fact, in the BASE scenario Canada and Russia are the only pellet suppliers but in BIO BRAZIL 2 scenario (and
consequently in the other scenarios) also Brazil appears as pellet supplier for EU.
If looking at the scenarios results, biodiesel export from Brazil to EU could appear convenient because its
trend is increasing along the time horizon in all scenarios analysed and the quantities exported remains
almost the same for all scenario. However, it is good to remember that in literature this trade is considered
to be not convenient for Brazil in economic terms. Nevertheless, this can be a motivating result for Brazil
which, overcoming the barriers that hinder the export of biodiesel, can consider Europe as a potential buyer.
We can conclude by saying that this scenario analysis was useful because it highlighted some aspects that
can be derived from the biomass trade from Brazil to the European Union taking into account the actual
environmental policies. Together with them, this study was useful to show the opportunities and challenges
linked to this business which is of common interest to both regions.

87

88
REFERENCES
[1] Daniela Thrän et al., Global Wood Pellet Industry and Trade Study (IEA Bioenergy: Task 40: June 2017),
2017
[2] J. Escobar, A PRODUÇÃO SUSTENTÁVEL DE BIOMASSA FLORESTAL PARA ENERGIA NO BRASIL: O CASO DOS
PELLETS DE MADEIRA, 2016.
[3] Ministeiro de minas e energia- MME, Resenha Energetica Brasileira, 2017.
[4] Uniao da indistria de cana de acucar – UNICA, UNICADATA.COM.BR , 2017.
[5] Bob Flach, Sabine Lieberz and Antonella Rossetti, EU-28 Biofuels Annual, 2017
[6] European Commission, REPORT FROM THE COMMISSION TO THE EUROPEAN PARLIAMENT, THE COUNCIL,
THE EUROPEAN ECONOMIC AND SOCIAL COMMITTEE AND THE COMMITTEE OF THE REGIONS, Brussels, 2017
[7] Luís Augusto Barbosa Cortez et al., PROÁLCOOL 40anos - Universidades e empresas: 40 anos de ciência e
tecnologia para o etanol brasileiro, Editora Edgard Blücher Ltda, 2016
[8] J.A.P. Rico & I.L. Sauer, A review of Brazilian biodiesel experiences, 2015
[9] Vanessa P. Garcilasso et al., PRODUÇÃO E USO DO BIODIESEL NO BRASIL – ANÁLISE DE BARREIRAS E
POLÍTICAS, 2015
[10] Érica Geraldes Castanheira et al., Life-cycle assessment of soybean-based biodiesel in Europe: comparing
grain, oil and biodiesel import from Brazil, 2015
[11] Sergio Barros, Agricultural Specialist, Brazil Biofuels Annual, 2017
[12] J. Goldemberg, The Brazilian biofuels industry,
[13] José Goldemberg et al., Bioethanol from Sugar: The Brazilian Experience, 2017.
[14] PÖYRY MANAGEMENT CONSULTING, Pöyry view point global market, players and trade to 2020 – Pellets
Becoming a Global Commodity, 2011
[15] PÖYRY MANAGEMENT CONSULTING, Biomass Imports to Europe and Global Availability: IEA - 2n
Workshop Cofiring biomass with coal, 2012
[16] REN21, RENEWABLES 2017 GLOBAL STATUS REPORT, 2017
[17] Humbertode Jesus Eufrade Junior et al., Sustainable use of eucalypt biomass grown on short rotation
coppice for bioenergy, 2016
[18] Pery Francisco Assis Shikida et al., A Comparison Between Ethanol and Biodiesel Production: The
Brazilian and European Experiences, 2014
[19] International Institute for Sustainability Analysis and Strategy – IINAS & Centro Nacional de Referencia
em Biomassa - CENBIO, Possibilities of sustainable woody energy trade and impacts on developing countries,
2014
89
[20] ONG Reporte Brazil & Centro de monitoramento de Agrocombustiveis, O etanol brasileiro no mundo: os
impactos socioambientais causados por usinas exportadoras, 2011
[21] Isabel Hiroko Omachi et al., PRODUÇÃO DE BIOMASSA FLORESTAL PARA EXPORTAÇÃO: O CASO DA
AMCEL, 2004
[22] J. Escobar, O potencial dos pellets de madeira: Perspectivas energéticas da madeira no Brasil. Anuário
Brasileiro de Biomassa, 2015.
[23] Istituto Bresileiro de Geografia e Estatistica – IBGE, ibge.gov.br (2017)
[24] Isaias de Carvalho Macedo et al., SUGAR CANE’S ENERGY: Twelve studies on Brazilian sugar cane
agribusiness and its sustainability, 2005
[25] Manoel Regis Lima Verde Leal & Arneldo Da Silva Walter, SUSTAINABILITY OF THE PRODUCTION OF
ETHANOL FROM SUGARCANE: THE BRAZILIAN EXPERIENCE, 2010
[26] Isaias de Carvalho Macedo, Situação atual e perspectivas do etanol, 2007
[27] Joaquim Bento Ferreira-Filho and Mark Horridge, Ethanol Expansion and Indirect Land Use Change in
Brazil, 2011
[28] Garcia JCC, Emissão de gases de efeito estufa na obtenção do etanol de cana-de-açúcar: uma avaliação
considerando diferentes cenários tecnológicos em Minas Gerais, 2011.
[29] José Goldemberg et al. , Bioethanol from Sugar: The Brazilian Experience , 2017.
[30] Xavier C & Rosa J, Custos de produção de cana-de-açúcar, açúcar e etanol no Brasil: safra 2011/2012,
2012.
[31] Adele Finco & Monica Padella, Biofuels economics and policy: agricultural and environmental
sustainability, 2012.
[32] J. Escobar, Biomasa lignocelulósica en Brasil Perspectivas de uso para pellets y briquetas en el sector
industrial (The Bioenergy International no18, p.38-39), 2013
[33] Associação Brasileira das Indústrias de Pellets – ABIPEL, biomassabr.com 2017
[34] PÖYRY MANAGEMENT CONSULTING, Wood Supply and Demand in Europe – A Delicate Balance, 2010
[35] Loulou et al., 2005 (iea-etsap.org)
[36] kanors.org
[37] http://www.worldometers.info/world-population/brazil-population/, 2017
[38] Empresa de Pesquisa Energetica – EPE, epe.gov.br, 2017
[39] http://www.imf.org/external/datamapper/NGDP_RPCH@WEO/OEMDC/ADVEC/WEOWORLD, 2017
[40] http://www.imf.org/external/datamapper/NGDPD@WEO/OEMDC/ADVEC/WEOWORLD/BRA/EU, 2017
[41] Empres de Pesquisa Energetica – EPE, Balanco Energetico Nacional (BEN), 2017

90
[42] Agencia Nacional do Petroleo – ANP, anp.gov.br, 2017
[43] http://www.iea.org/statistics, 2017
[44] Ministerio de minas e energia – MME & Empresa de pesquisa energética - EPE, Plano decenal de
expansão de energia 2026, 2017
[45] http://ec.europa.eu/eurostat, 2017
[46] Julieta A. Puerto Rico, et al., Genesis and consolidation of the Brazilian bioethanol: A review of policies
and incentive mechanisms, 2010
[47] S.T. COELHO & J.F. ESCOBAR, Renovabio - um programa exequível e promissor, Revista Opiniões,
Ribeirão Preto, SP, p. 36 - 37, 15 dez. 2017
[48] http://www.wri.org/resources/data-sets/cait-country-greenhouse-gas-emissions-data, 2017
[49] http://cenbio.iee.usp.br/img/figure41.jpg
[50] Vanessa P. Garcilasso et al., PRODUÇÃO E USO DO BIODIESEL NO BRASIL – ANÁLISE DE BARREIRAS E
POLÍTICAS, 2015
[51] Érica Geraldes Castanheira et al., Environmental sustainability of biodiesel in Brazil, 2013
[52] Fernando C. De Oliveira & Suani T. Coelho, History, evolution, and environmental impact of biodiesel in
Brazil: A review, 2016
[53] Yolanda Vieira de Abreu & Heloísa Rodrigues Nascimento, A produção da cana-de-açúcar e de etanol nas
novas fronteiras agrícolas: o estado do Tocantins, 2015
[54] Guilherme Kangussu Donagemma et al., Caracterização, potencial agrícola e perspectivas de manejo de
solos leves no Brasil, 2016
[55] IBGE, Logística e consumo de derivados da cana-de-açúcar, 2017.
[56] https://conexaoto.com.br/2014/04/09/producao-de-cana-de-acucar-cresce-820-nos-ultimos-quatro-
anos-no-estado, the last access in May 2018
[57] Matopiba - A expansão de uma nova fronteira agrícola, avaible in
http://www.administradores.com.br/artigos/empreendedorismo/matopiba/106604/, the last access in May
2018
[58] Carolina Lobello Lorensini et al.,Mapeamento e identificação da época de desmatamento das áreas de
expansão da agricultura no MATOPIBA, 2015
[59] IBGE, available in this site: https://sidra.ibge.gov.br/tabela/6588#resultado, 2018
[60] ARNALDO CARNEIRO FILHO & KARINE COSTA, A expansão da soja no Cerrado Caminhos para a ocupação
territorial, uso do solo e produção sustentável, 2016
[61] http://www.transpetro.com.br, 2018
[62] IBGE, Logística e consumo de derivados da cana-de-açúcar, 2017.

91
[63] IBGE, Logistica de energia, 2015.
[64] IBGE, Dinâmica Territorial da Produção Agropecuária: a geografia de cana de acucar, 2016
[65] Setten Alexandro de Mattos, Infraestrutura logística de exportação de açúcar e etanol no centro-sul do
Brasil, 2010
[66] Companhia Nacional de Abastecimento HYPERLINK "http://www.conab.gov.br/"– HYPERLINK
"http://www.conab.gov.br/" CONAB, conab.gov.br, 2017
[67] Konstantin Gabova et al., Sugarcane bagasse valorization by fractionation using a water-based
hydrotropic process, 2017
[68] https://www.cepea.esalq.usp.br/br/indicador/etanol.aspx, 2017
[69] CONSELHO DOS PRODUTORES DE CANA-DE-AÇÚCAR, AÇÚCAR E ÁLCOOL DO ESTADO DE SÃO PAULO -
CONSECANA-SP, MANUAL DE INSTRUCOES, Piracicaba, 2006
[70] http://www.anp.gov.br/wwwanp/precos-e-defesa-da-concorrencia/precos/composicao-e-estruturas-
de-formacao-dos-precos, 2017
[71] http://www.anp.gov.br/preco/prc/Resumo_Ultimos_Meses_Index.asp, 2017
[72] www.worldscale.co.uk, 2018
[73] European Biomass Industry Association- EUBIA, Bioethanol, 03/2013
[74] European Commission; SETIS- information for decision making,
https://setis.ec.europa.eu/system/files/Technology_Information_Sheet_Biofuel.pdf, 2017
[75] EPURE,EUROPEAN RENEWABLE ETHANOL, Enabling Innovation and Sustainable Development - State of
the industry 2015, 2015
[76] European Renewable Energy Council- EREC, Creating Markets for Renewable Energy Technologies EU
RES Technology Marketing Campaign, Bioethanol production and use, 2017
[77] Ronald Steenblik, BIOFUELS – AT WHAT COST? Government support for ethanol and biodiesel in selected
OECD countries - A synthesis of reports addressing subsidies for biofuels in Australia, Canada, the European
Union, Switzerland and the United States, 2007
[78] Industria Brasileira de arvores – IBA´, Relatorio 2017, 2017
[79] Associacao Brasileira de producao de floresta plantada - ABRAF, Anuario Estatistico ABRAF, 2016
[80] Alfons Üllenberg, Deutsche Gesellschaft für Technische Zusammenarbeit - GTZ, Foreign Direct
Investment (FDI) in Land in Madagascar, 2009
[81] Federal Ministry for Economic Cooperation and Development, Biofuels: Opportunities and risks for
developing countries, 2011.
[82] European Biomass Association, AEBIOM.com, 2017

92
[83] PÖYRY MANAGEMENT CONSULTING, Views on the Atlantic Basin Industrial Pellet Market up to 2030
Nordic Baltic Bioenergy 2013, 2013
[84] Patrik Lamers et al., Global solid biomass trade for energy by 2020: an assessment of potential import
streams and supply costs to North‐West Europe under different sustainability constraints, 2014
[85] BioTrade2020plus, Supporting a Sustainable European Bioenergy Trade Strategy, Progress report on WP
3 case studies Brazil, 2016.
[86] Helmut Haberl et al., The global technical potential of bio-energy in 2050 considering sustainability
constraints. Current Opinion in Environmental Sustainability, 2010
[87] Garcia, Dorival Pinheiro et al., TENDÊNCIAS E DESAFIOS DA INDÚSTRIA BRASILEIRA DE PELLETS DE
ORIGEM AGROFLORESTAL, 2016
[88] Wood Pellets Association of Canada - WPAC, Global pellet market outlook in 2017
(https://www.pellet.org/wpac-news/global-pellet-market-outlook-in-2017)
[89] Garcia, Eder Aparecido, Caracterização física e química do solo e avaliação do desenvolvimento de
plantas de eucalipto em função do espaçamento e da adubação, visando a colheita precoce para utilização
em bioenergia, 2010 [92] PELLETS: Uma questão de competitividade e preço, REVISTA DA MADEIRA - EDIÇÃO
N°138, 2014
[90] Laércio Couto et al., Programa de Pesquisa para Avaliação de densidade de plantio e rotação de
plantações de rápido crescimento para produção de biomassa, 2006
[91] Food and Agriculture Organization of the United Nations- FAO, 2017
[92] PELLETS: Uma questão de competitividade e preço, REVISTA DA MADEIRA - EDIÇÃO N°138, 2014
[93] pelletshome availabe in the site: https://www.pelletshome.com/pellet-prices, 2018
[94] Pregger T. Et Al., Deliverable D2.1 & D3.1 ‘Captive’ and ‘Open Sea’ Energy Import Framework, –
REACCESS Project, December 2010
[95] Carlos Ricardo Soccol et al., Bioethanol from lignocelluloses: Status and perspectives in Brazil, 2009
[96] J. F. Escobar,J. Goldemberg, S.T. Coelho, Wood pellets in Brazil: potential and challenge to export, Energy
Policy (in evaluation) JEPO-S-18-00441
[97] M. L. SILVA et. al., Análise do custo e do raio econômico de transporte de madeira de reflorestamentos
para diferentes tipos de veículos. Revista Árvore, v.31, n.6, 2007
[98] A. RANGEL et al., Simulação computacional para análise do frete no transporte de cana-deaçúcar – um
estudo de caso no estado do Rio de Janeiro. Revista Eletrônica Sistemas & Gestão, v.3, n. 3, p.250-261, 2008
[99] Argus Biomass Markets, 2016.
[100] PECEGE, Custo de producao de cana de acucar, etanol e bioeletricidade no Brazil, 2016
[101] Fabio Trigueirinho et al., Biodiesel: oportunidades e desafios no longo prazo, 2016

93
[102] Paulo Henrique Nardon Felici et al., Balanço energético das culturas de girassol e soja para produção
de biocombustível, II Jornada Académica da Embrapa Soja
[103] Alfa Laval Aalborg, PODER CALORIFICO INFERIOR
[104] Yolanda Vieira de Abreu & Heloísa Rodrigues Nascimento, A produção da cana de açúcar e de etanol
nas novas fronteiras agrícolas: o estado do Tocantins, revista LIBERATO, 2016
[105] www.raizen.com.br
[106] Shahab Sokhansanj, Cost of producing wood pellets, 2015
[107] Mozammel Hoque et al., ECONOMICS OF PELLET PRODUCTION FOR EXPORT MARKET, 2006
[108] Distance sea route simulator, www.marinetraffic.com

94
ANNEX
1. Picture with the potential area for biomass production for wood pellet.
Figure 4: potential areas for eucalyptus short rotation forests and potential ports for pellet export, [2].
2. The whole table with the ENplus and ISO certification is avaible on line: ENplus Handbook, Part 3 -
Pellet Quality Requirements, Quality Certification Scheme for Wood Pellets, 2015.
The following table representes a comparison between the ENplus (pellet for residential use) e the
ISO (pellet for industrial use) requirements (only the ones that are on limit because the rest are in
line with ENplus and ISO), with the brazilian wood pellet characteristics [38]:

95
3.
3.a Explication of the acronyms of the ethanol and biodiesel production chain
SURLAND 1= surplus of agricultural land, cost 1
SURLAND 2= surplus of agricultural land, cost 2
UBioCropProd1= energy crop production, cost1
UBioCropProd2= energy crop production, cost2
MINBIOCRP0=crop production
BCRPETH101=production of ethanol from starch and sugar crops
BWOOETH101=production of ethanol from woody biomass
BZWOOETH110=production from woody biomass with CCS
MINBIOSLD1=production of solid biomass- low price
MINBIOSLD2= production of solid biomass- medium price
MINBIOSLD3= production of solid biomass- high price
UBioWoodResidue=Agricultural and forestry residue
UBioWoodSupply=Wood for energy
BZWOOFTDST110=FT- diesel production from woody biomass with production of CO2
BWOOFTDST110=FT-diesel production from woody biomass
BVEGME101=transesterification of vegetable oils
BIOVEGOIL=vegetable oil
BCRPVEG101=vegetable oil extraction from energy crops
3.b The main properties (attributes) with their own TIAM´s code and description:
ACT =ACTIVITY
CAP =CAPACITY
NCAP =NEW CAPACITY
ACT_COST=ACTIVITY COST
NCAP_COST=NEW CAPACITY COST
NCAP_FOM=NEW CAPACITY FIXED COST
NCAP_TLIFE=NEW CAPACITY TECHNICAL LIFE
NCAP_AF=NEWCAPACITY AVAILABILITY FACTOR
ACT_EFF=ACTIVITY EFFICIENCY (it defines the amount of activity that can be produced by one unit of
flow of a commodity or commodities on the shadow side of the process. The shadow side of a process
is the side opposite to the side of the primary group (PCG). ACT_EFF cannot be used for storage or
trade processes, [iea-etsap.org/docs/TIMES-VDA.pdf])

96
VDA_FLOP=VEDA FLOW PARAMETER (it defines the amount of flow of commodity per unit of process
activity, or the sum of the flows of the commodities in the commodity group per unit of process
activity, [iea-etsap.org/docs/TIMES-VDA.pdf])
4. The list of ships that transport biomass from Brazil to EU already present in RECOR (Base run) are:
- BIO_SHP_07: ship that transports biodiesel from São Paulo (Santos port) to Rotterdam; 10056 Km
- BIO_SHP_08: ship that transports biodiesel from São Paulo (Santos port) to Marsille; 9384 Km
- BIO_SHP_09: ship that transports ethanol from São Paulo (Santos port) to Rotterdam; 10056 Km
- BIO_SHP_10: ship that transports ethanol from São Paulo (Santos port) to Marsille; 9384 Km
New ships wrt the Base run (Bio Brazil 2 run):
BIO_SHP_0001 Corr(BIOWPL) Brazil (Santos) to Netherlands (Rotterda) [];10056 Km BIO_SHP_0002 Corr(BIOWPL) Brazil (Paranagua´) to Netherlands (Rotterda) []; 10030 Km BIO_SHP_0003 Corr(BIOWPL) Brazil (Salvador) to Netherlands (Rotterda) []; 9190 Km BIO_SHP_00011 Corr (ALCETH) Brazil (Paranagua´) to Netherlands (Rotterdam) [];10030 Km BIO_SHP_00012 Corr (ALCETH) Brazil (Paranagua´) to France (Marseille) [Gibraltar]; 9644 Km
New ships wrt the Base run (Bio Brazil 3 run):
BIO_SHP_0001 Corr(BIOWPL) Brazil (Santos) to Netherlands (Rotterda) [];10056 Km BIO_SHP_0002 Corr(BIOWPL) Brazil (Paranagua´) to Netherlands (Rotterda) []; 10030 Km BIO_SHP_0003 Corr(BIOWPL) Brazil (Salvador) to Netherlands (Rotterda) []; 9190 Km BIO_SHP_00011 Corr (ALCETH) Brazil (Paranagua´) to Netherlands (Rotterdam) [];10030 Km BIO_SHP_00012 Corr (ALCETH) Brazil (Paranagua´) to France (Marseille) [Gibraltar]; 9644 Km BIO_SHP_00013 Corr (ALCETH) Brazil (Itaquì) to Netherlands (Rotterdam) [];7647 Km BIO_SHP_00014 Corr (ALCETH) Brazil (Itaquì) to France (Marseille) [];7206 Km
97
AKNOWLEDGMENT
Voglio concludere ringraziando, del Politecnico di Torino, i Professori: Andrea Carpignano, Gerboni Raffaella
e Daniele Grosso. Sono stati loro che mi hanno seguito durante l’intero periodo di stesura della tesi; in
particolare la professoressa Raffaella Gerboni, guida costante sia nel tempo trascorso in Italia che in quello
trascorso in Brasile.
Ringrazio allo stesso modo, dell’Università di San Paolo, il professor Ildo Luis Sauer, il Dottor Javier Farago
Escobar e tutti i funzionari e ricercatori che ho avuto l’opportunità di conoscere all’ Istituto di Energia e
Ambiente in Brasile. Il loro supporto e aiuto è stato fondamentale nei mesi trascorsi lì.
Ringrazio ancora tutti quanti i sopraelencati per la disponibilità, pazienza e tempo dedicatomi. Devo
principalmente a loro il raggiungimento di questo obiettivo.