Embed Size (px)
Citation preview

Analysis Planand Procedure

Why do we need to analyze?
Descriptive Results
Index Scores• Service Net
Scores• Service Area Net
Scores• Overall Index
Score
Adjectival Ratings
Recommendations
• To transform data into information that the audiences can identify with
• To generate insights that the audience can use to formulate recommendations or actions

What we should know first?
Descriptive Results versus
Index Scores

CSIS Analysis
Descriptive Result
Index Score
• Frequency/Count, Percentage
• It describes the sample only based on the number of responses
• How many said they were definitely satisfied?
• Net Scores, composite or combination of scores
• It summarizes data to provide more information
• There is deliberate identification of items.
• What is their level of satisfaction on health services?
Descriptive Results
Item
AwareTotal
Number of Responses
PercentageYes No
Vaccination for infants/children 75 75 150 50.00%
Pre-natal/post-natal/child birth services 45 105150 30.00%
Free General Consultations/Access to secondary and/or tertiary health Care 104 46
150 69.33%
Free Basic Medicine or Low-Cost Medicine Program 67 83
150 44.67%
Prevention and management of Communicable and Non-Communicable Diseases
94 56150 62.67%
Basic dental/oral hygiene 126 24 150 84.00%

Descriptive Results
• Frequencies of responses–Example: 67 said they were aware
of vaccination services• Percentages
–Example: 44.67% of the 150 respondents said they were aware of vaccination services

Index Scores
Item
AwareTotal Number
of Responses
Item Net Score
Yes (A1) No (A2)
Vaccination for infants/children 75 75 150 0.00
Pre-natal/post-natal/child birth services 45 105 150 -0.40
Free General Consultations/Access to secondary and/or tertiary health Care
104 46 150 0.39
Free Basic Medicine or Low-Cost Medicine Program 67 83 150 -0.11
Prevention and management of Communicable and Non-Communicable Diseases
94 56 150 0.25
Basic dental/oral hygiene 126 24 150 0.68

How are frequencies and index scores generated?
Questionnaires Frequencies
Database orStatistics Software
IndexGenerator
IndexScores

Area Awareness Computation

Item Awareness Net Score
= (yes – no) / total number of responses
Score Range: -1 ~ 11 is the highest possible positive score
Service Area Awareness Net Score
= sum of all item net scores / total number of subareas * 100
Awareness: Index ScoresComputation

Area Availment Computation

Scoring: Availment
Item Availment Score
= yes / total number of responses
Score Range: 0~11 is the highest possible positive score
Service Area Availment Score
=sum of all item net scores / total number of subareas * 100
Availment: Index ScoresComputation

Satisfaction Net ScoreComputation

Importance Net ScoreComputation

Weighted Scores
Definitely Satisfied/ Very Important = frequency x 2Satisfied/Somewhat Important = frequency x 1
Can’t say = frequency x 0Dissatisfied/ Somewhat not Important = frequency x -1
Definitely Dissatisfied / Not at all Important = frequency x -2
Item net score= sum of all weighted frequencies / total number of responses (average)
Service Area Net Score= (sum of all item net scores / total number of sub-areas * 2 ) * 100
Score Range: -2 ~ 22 is the highest possible positive score
Satisfaction/Importance: Index ScoresComputation

Index ScoresComputation
• Computing the Overall Citizen Awareness Index Score. The score will be computed by adding the area citizen awareness score divided by the total number of areas (8).
• Computing the Overall Citizen Availment Index Score. The score will be computed by adding the area citizen availment score divided by the total number of areas (8).
• Computing the Overall Citizen Assessment/ Satisfaction Index Score. The score will be computed by adding the area citizen satisfaction score divided by the total number of areas (8).
• Computing the Overall Citizen Needs/ Importance Index Score. The score will be computed by adding the area citizen satisfaction score divided by the total number of areas (8).
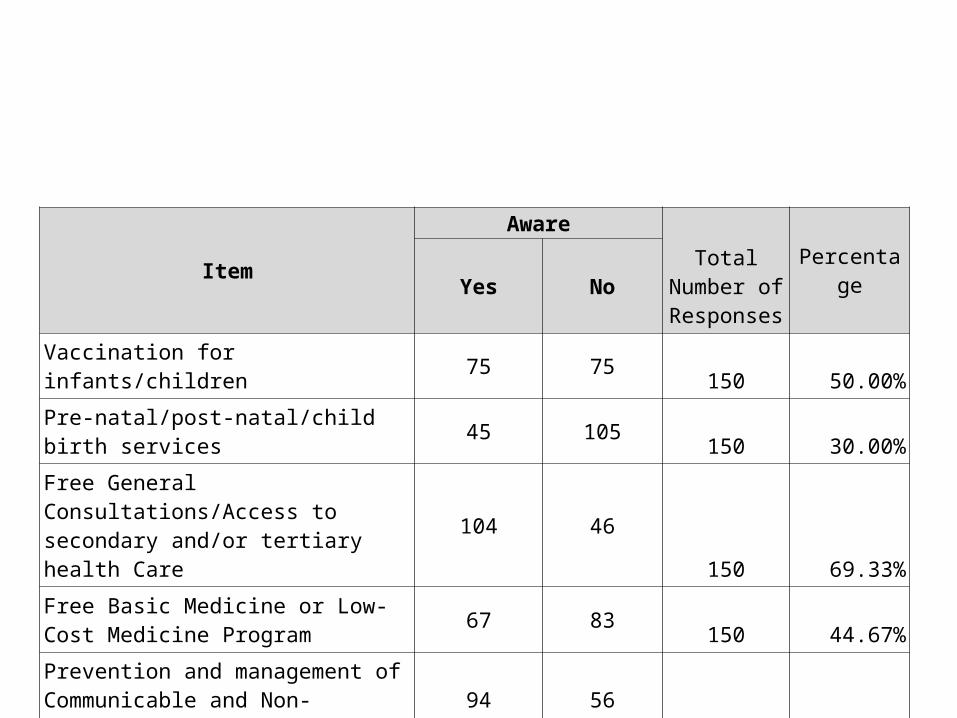
Criterion Reference Rating

What you will need:– Importance Index Scores of all Service
Areas– Satisfaction Index Scores of all Service
Areas– Leverage Plotter
Importance VS SatisfactionComputation

*Adopted from Customer Leverage Analysis

Importance-Satisfaction Leverage Analysis
0.60
0.16
Tourism Support
Agricultural Support
Environmental Management
Public Works and In-frastructure
Governance and Response
Social Welfare
Support to Education
Health

Citizens’ Attitude Toward the Local Government Unit

Weighted Scores (LBCi-LBCIv)
Definitely Agree= frequency x 2Agree = frequency x 1
Can’t Say = frequency x 0Disagree = frequency x -1
Definitely Disagree = frequency x -2
Item net score= sum of all weighted scores / total number of responses
(average) *100/2
Score Range: -2 ~ 22 is the highest positive score possible
Attitudes of Citizens Toward LGU: Index Scores
Computation

• L2: In the next five years, will you choose to stay in your current city or transfer to another one?– Get the frequency of those who said yes and
divide it by the total number of responses
• L3: What is your primary consideration/issue regarding your decision? ? – %, ranked– Split the results between “leave” and “stay”
participants
Attitudes of Citizens Toward LGU: Index Scores
Computation

Optional Analysis
• Disaggregation of descriptive results (Aw, Av, Sat and Imp) by barangay
• Disaggregation of service area index scores by socio-demographic category– For example: beneficiary of Pantawid Pamilya,
sex, age, house ownership, source of news etc.
• Cross Tabulation of between Index Scores per Socio-demographic indicator

Citizen Satisfaction Index System
END. Thank you!