Embed Size (px)
Citation preview

Analysis on CO2 Emission Embodied in Sino-US Trade Based on the GTAP8.0
Database
Jun Pang*, Yunan Yan, Shiyu Wu
(School of environment and natural resources, Renmin University of China, Beijing 100872)
Abstract: By constructing global multi-regional input-output (MRIO) table based on GTAP8.0
database, production-based and consumption-based CO2 emissions of China and the United States
were calculated in this paper, as well as CO2 emissions embodied in exports of China and the U.S
and the industry distribution. The results showed that the consumption-based CO2 emissions of
China in 2004 and 2007 were 428 Mt and 522 Mt lower than production-based CO2 emissions. To
the United States, the consumption-based CO2 emissions in 2004 and 2007 were 272 Mt and 221
Mt higher than production-based CO2 emissions. China is a net exporter of CO2 emission while
the U.S. is a net importer of CO2 emission embodied in international trade. Compared to the
United States, the CO2 emissions embodied in China's exports accounted for higher proportion
than that of the U.S. in total domestic CO2 emissions, while the emissions in imports accounted
for lower proportion than that of the U.S. in total domestic CO2 emissions.
Key Words: Sino-US Trade; embodied CO2 emission; MRIO; GTAP
1. Introduction
Climate change has become one of the serious challenges that faced by human being. The
United Nations Convention on Climate Change (UNFCCC) determined the national responsibility
for emissions reductions based on each country's total greenhouse gas (GHG) emissions. The total
GHG emissions refer to the emissions and absorptions within the jurisdiction scope of national
sovereignty. However, in the process of global economic integration, this accounting method
ignored the impact of international trade on national carbon emissions. With the deepening of the
international division of labor and the development of international trade, the products that a
country produced and consumed occurred to be geographically separated. When a country
consuming the imported goods from foreign countries and exporting its own commodities, there
remained direct and indirect energy consumption and CO2 emissions embodied in the production
process of trade goods, namely the CO2 emissions embodied in international trade. According to
the production-based accounting principles, domestic emissions include CO2 emissions from both
in domestic consumer goods and export commodities which are domestically made. However, it
doesn’t include CO2 emissions from imported consumer goods for its absence in domestic
production in the country. This carbon emissions accounting method leads to the increasing of the
total CO2 emissions of a country when its exports keeps increasing, and other highly
import-dependent countries decreased its own total CO2 emissions by avoiding the domestic
production. Consequently, it is necessary to take production-based and consumption-based CO2
emissions into consideration at the same time.
Since China's accession to the WTO, foreign trade has developed rapidly, and the exports to
developed countries increased significantly. Meanwhile, China has become the world's largest
carbon emitters, while the studied on the CO2 emissions embodied in China’s imports and exports
gained widespread concern. Chen et al. (2008) used input-output method finding that in 2006, the
CO2 emissions embodied in China’s export trade reached 3.14 billion tons, and net CO2 emissions
* Corresponding author. Tel.: +86-10-82502985; E-mail address: [email protected] (J. Pang).

embodied in exports was 1.25 billion tons. Lin and Sun (2010) applied input-output analysis (IOA)
to estimate CO2 emissions embodied in China’s exports, indicating that about 3.357 billion tons
CO2 emissions were embodied in exports and the emissions avoided by imports were 2.333 billion
tons in 2005. Li and Hewitt (2008) used input-output method to study the carbon embodied in
trade between the UK and China, the results showed that in order to meet the consumer demand of
the United Kingdom, China exported 186 million tons (Mt) CO2 in 2004 through Sino-British
trade, which accounted for 4% of the total carbon emissions of China in that year and thus reduced
11% of CO2 emissions for UK, increasing the world's CO2 emissions by 117 Mt. Liu et al. (2010)
analyzed the carbon emissions embodied in Japan-Sino trade using input-output analysis based on
Japan's industrial emissions data and studied the impacts that the Japan-Sino trade had on two
countries’ carbon emissions. The empirical results showed that the bilateral trade was conducive to
reducing carbon emissions of two countries, but at the same time there also existed the
phenomenon that Japan transferred part of carbon emissions to China through trade which made
China a net exporter country of carbon emissions embodied in trade because of the exports to
Japan. Hyun-SIK Chung and Hae-Chun Rhee (2007) estimated total CO2 emissions of Japan and
South Korea for 1990 using an input-output model. Their analysis shows that even though the
absolute level of emission is much lower in South Korea than in Japan, total emission intensities
are generally higher in the former. Korean exports to Japan are more emission intensive than the
reverse, while exports of both countries to the rest of the world are more emission intensive than
their bilateral trade. Frank Ackermana, et.al (2007) analyzed the greenhouse gas emissions
embodied in trade between Japan and the US by extending the Japanese government’s linked
Japan–US input–output model to include carbon emission coefficients for each sector. They
indicated that the most important policy implication of the research may be that US industry could
cut its carbon emissions by more than half if it matched the environmental performance of
industry in Japan.
In addition, China and the United States occupy important places in response to global
climate change process as two trading power and main carbon emission countries. So the
estimation of the carbon emissions embodied in the trade between these two countries has also
become the research focus of concern. Shui and Harriss(2006)examined the influence of
US–China trade on national and global emissions of carbon dioxide. Their initial findings reveal
that US CO2 emissions would have increased from 3% to 6% if the goods imported from China
had been produced in the US, and about 7%–14% of China’s current CO2 emissions were a result
of producing exports for US consumers during 1997-2003.They suggested that an improved
international accounting methodologies for assigning responsibility for CO2 emissions must be
designed to account for the dynamic nature of international trade. Yu and Wang (2009) calculated
the carbon emissions embodied in Sino-US trade in 1997 and 2002, which showed that in those 2
years, 6.77% and 9.32% of the total carbon emissions in the United States were transferred to
China respectively. In order to measure the carbon embodied in Sino-US merchandise trade, Yin
and Cheng (2010) calculated the carbon emission factor of trade goods of China and the U.S.
based on the input -output tables of 2 countries, which avoided the situation that using the data of
only one country to estimate the carbon embodied in bilateral trade and a big measuring deviation
appearing. The results showed that with Sino-US trade, China increased domestic CO2 emission,
while the U.S. avoided 55 -200 million tones of CO2 emission each year, accounting for 1% -3.6%
of its annual CO2 emissions. Xu et al. (2009) found that in 2002 and 2007, the CO2 emissions in

China's exports to the United States accounted for 12%-17% and 8%-12% of domestic CO2
emissions. Guo et.al (2010) quantified the impact of Sino-US international trade on national and
global CO2 emissions based on an input–output model. The results shows that Sino-US
international trade increased global CO2 emissions by 385.32 Mt as a whole in 2005, and
suggested that China should adjust the trade structure and US should accelerate the export of
advanced technologies to China in order to reduce the negative impact of Sino-US trade on
national and global CO2 emissions. Shi and Zhang (2011) used input-output tables of China to
calculate the carbon emissions embodied in exports of China to the U.S. from 2003 to 2007.
In recent years, some foreign scholars began to explore the carbon accounting embodied in
trade based on the multi-regional input-output model (Ahmad and Wyckoff, 2003; Wiedmann T.,
2008). Multi-regional input-output model can break out of the scope of a country's economy, and
internalize the relationship of import and export for the national production sectors based on the
input-output tables of each country, then get the input-output relationship of the various industries
of each countries and regions worldwide, as well as the direct and indirect investment relationship
between the final consumption of a country and other countries’ production. The domestic
emissions obtained in this way is often higher than that based on single regional input-output
model because when the domestic consumption increases, it also increases the demand of
domestic middle input indirectly through the international production chain (Miller R.E., Blair PD.,
2009). Ahmad and Wyckoff (2003) were the very scholars who first used multi-regional
input-output model to complete the calculation of carbon embodied in production, production and
trade between multinational sides. They studied the emissions of 24 OECD countries and China,
India and Russia that covering 80% of the global carbon emissions in 1995 based on each
country’s input-output tables in the OECD database. The results showed that contained a lot of
carbon emissions embodied in the international trade. In 1995, the consumption-based emissions
of OECD countries were 5% higher than domestic production-based CO2 emissions, which
accounted for 2.5% of the total global emissions in that year. This implied that a considerable
scale of emissions were embodied in the imports of goods from China, India, Russia and other
developing countries, while China and Russia are the countries that produced highest carbon
embodied in the exports to OECD nations. The domestic study that used multi-regional
input-output model came out these two years. Zhou (2010) calculated the carbon emissions
embodied in the trade between 10 countries or regions in the Asia-Pacific region in 2000, finding
that the United States was the largest net importer of carbon emissions embodied in trade,
followed by Japan, while China is the largest net exporter of carbon emissions embodied in trade.
However, the data used in this study was earlier and the scope of the study was limited to the
Asia-Pacific region, it wasn’t a truly global carbon accounting embodied in the international trade.
This paper builds global multi-regional input-output tables based on GTAP 8.0, and
calculates the production-based and consumption-based CO2 emissions of China and the United
States respectively and the CO2 emissions embodied and the industry distributions in exports of
two countries.
2. Methodology and data sources
The data used in this paper came from GTAP8.0 database. GTAP8.0 was published in 2012
which contained the data of 57 industries in 129 countries and regions in 2 norm years (2004 and
2007). GTAP8.0 database doesn’t only provide the input-output tables of each country and region,
but also distinguish the intermediate inputs and final consumption from domestic supply and

foreign exports of each country. What’s more, it provides the data of bilateral trade and CO2
emissions by industry and energy (coal, petroleum, natural gas, electricity, oil products and coal
gas).
2.1 Aggregation by region and industry
First of all, this paper integrated the 129 countries and regions provided by GTAP8.0 into 5
countries (or regions) which were China, the United States, European Union, Japan and rest of
world (ROW). Table 1 provided further details on the specific integration.
Table 1
Aggregation by region in GTAP8.0.
a See the Appendix A for the explanations for each abbreviation.
Then, this paper integrated the 57 industries provided by GTAP8.0 into 10 industries which
were agriculture, food processing, transportation, services, mining and resources, construction,
manufacturing, paper products and publishing, mineral products and petrochemical. Table 2
provided further details on the specific integration.
No. Region Countries (or regions) contained in this region a
1 China CHN、HKG、XEA、TWN
2 The United
States USA
3 European Union
AUT、BEL、CYP、CZE、DNK、EST、FIN、FRA、DEU、GRC、
HUN、IRL、ITA、LVA、POL、LTU、LUX、MLT、NLD、PRT、
SVK、ESP、SVN、SWE、GBR、BGR、ROU
4 Japan JPN
5 The rest of
world
AUS、NZL、XOC;
KOR、KHM、IDN、LAO、MYS、PHL、SGP、THA、VNM、BGD、
XSE、IND、PAK、LKA、XSA、KAZ、KGZ、XSU、IRN、ARM、
AZE、GEO、TUR、XWS;
CAN、MEX、XNA、BOL、BRA、CHL、ARG、URY、COL、ECU、
PRY、PER、VEN、XSM、CRI、GTM、NIC、PAN、XCA、XCB;
CHE、NOR、ALB、BLR、HRV、RUS、UKR、XEE、XEF、XER;
EGY、MAR、TUN、XNF、NGA、SEN、XWF、XCF、XAC、ETH、
MDG、MWI、MUS、MOZ、UGA、ZMB、ZWE、XEC、BWA、
ZAF、XSC

Table 2
Aggregation by industry in GTAP8.0.
No. Aggregate Industry Industries contained in this aggregate industry b
1 Agriculture pdr、wht、gro、v_f、osd、c_b、pfd、ocr、ctl、oap、rmk、
wol
2 Food processing cmt、omt、vol、mil、pcr、sgr、ofd、b_t
3 Mining and resources coa、oil、gas、frs、fsh、omn
4 Paper products and
publishing ppp
5 Petrochemical p_c、crp
6 Mineral products i_s、nfm、fmp、nmm
7 Manufacturing tex、wap、lea、lum、mvh、ele、otn、ome、omf
8 Construction cns
9 Transportation atp、wtp、otp
10 Services ely、gdt、wtr、trd、cmn、ofi、isr、obs、ros、osg、dwe b See the Appendix B for the explanations for each abbreviation.
2.2 Building the global multi-regional input-output table
By convention, i, j used in this paper represent each industry. r, s represent each country (or
region). In GTAP8.0, the input-output relation of domestic product of country r can be represented
as
r r r r rs
i ij i i ij sx vdfm vdpm vdgm vxmd (1)
r
ix is the total output of industry i of country r.
r
ijvdfm is the intermediate input demand of
industry j of country r towards industry i. (In GTAP 8.0, this variable values contain the demand
to investment of r country towards the product of industry i.) r
ivdpm
is the personal
consumption demand of country r towards the product of industry i. r
ivdgm is the government
consumption demand of country r towards the product of industry i. rs
ivxmd is the output
demand of country s towards the product of industry i of country r.
What’s more, GTAP 8.0 provides the data of the intermediate inputs and final consumption
in each country’s total imports, but doesn’t divide the total imports by different importing country.
Therefore, if we use GTAP8.0 to build global multi-regional input-output tables, we need to do the
further subdivisions of each country’s intermediate inputs and final consumption of total imports
by importing country. In order to achieve this goal, this paper assumed that when country r
imported product i from the whole world (including country s) and used product i as the
intermediate inputs or final consumption, the percentage of product i that became the intermediate
inputs of country r from country s compared to the total global imports of product i of country r,
equals to the percentage of product i as the final consumption of country r imported from country
s compared to the total global imports of product i of country r. Both of them were equal to the
percentage of country r’s imports from country s compared to country r’s total global imports.
Therefore,

*sr r
ij ijz z ×
sr
i
r
i
e
m (2)
*sr r
i iy y ×
sr
i
r
i
e
m (3)
zsr
ij is the imports from industry i of country s as the intermediate inputs of industry j in
country r. z*r
ij is the total imports from industry i of the whole world as the intermediate inputs of
industry j in country r. esr
i is the imports from country s to industry i of country r. mri is the imports
from around the world to industry i of country r. ysr
i is the imports from industry i of country s as
the final consumption of industry j in country r. y*r
i is the total imports from industry i of the
whole world as the final consumption of industry j in country r.
After applying the above treatment, we got the global MRIO tables contained 5 countries (or
regions) and 10 industries. The basic structure is given in Table 3 as follows.
Table 3
The basic structure of the global multi-region input-output(MRIO)tables.
Intermediate inputs Final consumption Total
Output CO2
A B … E A B … E
Intermediate
inputs
A ZAA
ZAB
… ZAE
YAA
YAB
… YAE
XA C
A
B ZBA
ZBB
… ZBE
YBA
YBB
… YBE
XB C
B
… … … … … … … … … … …
E ZEA
ZEB
ZEE
YEA
YEB
YEE
XE C
E
Added values … … … …
Total investment XA X
B … X
E
A, B…E all represent the countries. The intermediate inputs ZAA
, ZAB
are 10×10 matrixes
reflecting the input-output relations of 10 industries among or within countries (or regions).YAA
,
YAB
…YEE
, XA, X
B…X
E, C
A,C
B…C
E are 10×1 matrixes. Y
AA, Y
AB…Y
EE are the final consumption
of each country (or sector) for domestic use and foreign output. XA, X
B…X
E are the total output.
CA, C
B…C
E are the CO2 emissions.
2.3 Production-based and consumption-based CO2 emissions amounting
On the bases of the above MRIO tables, the input-output relations of all the counties can be
represented as
EAk
k AA AA AB AE A
EBkB BA BB BE B
k A
E EA EB EE E
EEk
k A
Y
X A A A X
YX A A A X
X A A A X
Y
(4)
The column vector on left-hand side of the equation is the total outputs of each industry in
each country (or region). The first part on the right side of the equation is a 50×50 matrix

representing the direct consumption coefficient composed by the element
srsr ij
riji
za
x , showing
that the input-output relations of the industries between different countries (or regions). Arr on the
diagonal of the matrix is the input-output relations of domestic industry, while Ars
on the
off-diagonal of the matrix is the input-output relations of industries between country r and country
s. The last column of the matrix on the right side of the equation is the final demand matrix,
representing the final consumptions produced by each country that provided to its own country
(Yrr) and exported to foreign countries (Y
rs).
In equation (4), we got the final consumption column vector of country r,
d YT
r Ar Br ErY Y , including the final consumption of the imports (Ysr) and the
domestic final consumption (Yrr). We also got the production row vector of country r,
p Yr rA rB rEY Y , including the final consumption of the domestic production of
goods (Yrr) and the final consumption of domestic production of goods exported to country s (Y
rs).
The consumption-based CO2 emissions r
dC and the production-based CO2 emissions r
pC of a
country can be represented as
1 ˆr r
dC E I A d
(5)
1ˆr r
pC E I A p
(6)
Here, ˆ rd , ˆ rp are diagonal matrix. E is a 50×1 CO2 direct consumption coefficient matrix
composed by element er
r irii
c
x .
3 Results and analysis
3.1 Production-based and consumption-based CO2 emissions
Fig. 1 depicts the production-based and consumption-based CO2 emissions of China and the
United States in 2004 and 2007. In 2004, the production-based CO2 emissions of the U.S. reached
5.900 billion tons; while it was only 4.072 billion tons for China. When it came to 2007, the
production-based CO2 emissions of China reached 5.123 billion tons and got close to the United
States’ emissions (5.942 billion tons). If we take a look at the consumption-based CO2 emissions,
the outputs for China and the U.S. in 2004 were 3.645 and 6.172 billion tons respectively; while in
2007, the CO2 emissions of China reached 4.600 billion tons and it was 6.162 billion tons for the
U.S. The above results showed that the production-based and consumption-based CO2 emissions
of China and the United States differed remarkably. For China, the consumption-based CO2
emissions were 428 Mt and 522 Mt less than production-based CO2 emissions in 2004 and 2007
respectively. For the U.S., it remained 272 Mt and 220 Mt increasing. This implied that a fraction
of China’s CO2 emissions came from the production the exports consumed by foreigners; however,
the United States avoided a fraction of CO2 emissions by using exports product from other
countries.
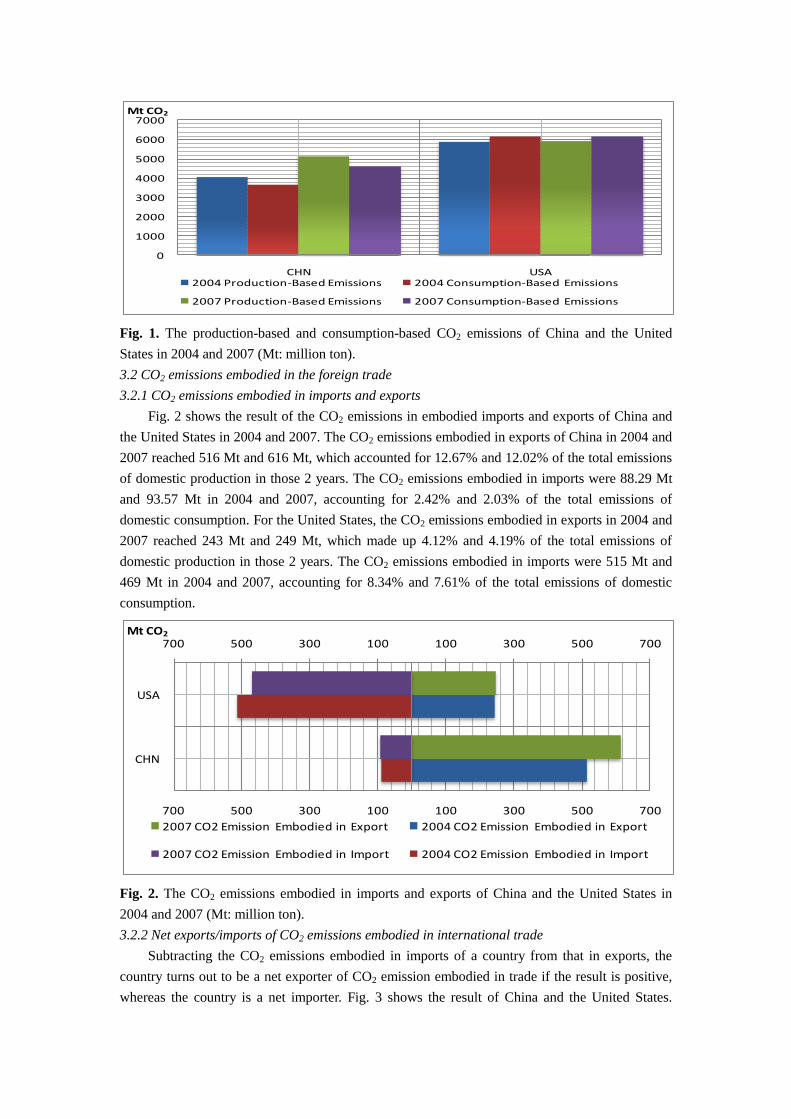
Fig. 1. The production-based and consumption-based CO2 emissions of China and the United
States in 2004 and 2007 (Mt: million ton).
3.2 CO2 emissions embodied in the foreign trade
3.2.1 CO2 emissions embodied in imports and exports
Fig. 2 shows the result of the CO2 emissions in embodied imports and exports of China and
the United States in 2004 and 2007. The CO2 emissions embodied in exports of China in 2004 and
2007 reached 516 Mt and 616 Mt, which accounted for 12.67% and 12.02% of the total emissions
of domestic production in those 2 years. The CO2 emissions embodied in imports were 88.29 Mt
and 93.57 Mt in 2004 and 2007, accounting for 2.42% and 2.03% of the total emissions of
domestic consumption. For the United States, the CO2 emissions embodied in exports in 2004 and
2007 reached 243 Mt and 249 Mt, which made up 4.12% and 4.19% of the total emissions of
domestic production in those 2 years. The CO2 emissions embodied in imports were 515 Mt and
469 Mt in 2004 and 2007, accounting for 8.34% and 7.61% of the total emissions of domestic
consumption.
Fig. 2. The CO2 emissions embodied in imports and exports of China and the United States in
2004 and 2007 (Mt: million ton).
3.2.2 Net exports/imports of CO2 emissions embodied in international trade
Subtracting the CO2 emissions embodied in imports of a country from that in exports, the
country turns out to be a net exporter of CO2 emission embodied in trade if the result is positive,
whereas the country is a net importer. Fig. 3 shows the result of China and the United States.
0
1000
2000
3000
4000
5000
6000
7000
CHN USA
Mt CO2
2004 Production-Based Emissions 2004 Consumption-Based Emissions
2007 Production-Based Emissions 2007 Consumption-Based Emissions
700500300100100300500700
700 500 300 100 100 300 500 700
CHN
USA
Mt CO2
2007 CO2 Emission Embodied in Export 2004 CO2 Emission Embodied in Export
2007 CO2 Emission Embodied in Import 2004 CO2 Emission Embodied in Import

According to Fig. 3, China is a net exporter of CO2 emission embodied in the international trade.
Its net exports of CO2 emissions embodied in trade reached 428 Mt and 522 Mt in 2004 and 2007,
accounting for 10.51% and 10.19% of domestic production-based CO2 emissions of those two
years. The U.S. is a net importer of CO2 emission embodied in trade. Its net imports of CO2
emissions embodied in the international trade reached 272 Mt and 221 Mt in 2004 and 2007,
making up 4.40% and 3.58% of domestic consumption-based CO2 emissions of those two years.
Fig. 3. The net exports of CO2 emission of China and the United States embodied in trade in 2004
and 2007 (Mt: million ton).
As a whole, the United States avoided massive domestic CO2 emissions through imports,
while China produced great CO2 to satisfy the global consumption demand as a net exporter of
CO2 emissions embodied in trade. The accounting methods of production-based CO2 emissions
ignore the carbon offsetting in export commodities. However, the accounting method of
consumption-based CO2 emissions measures the CO2 emission level of a country more precisely.
3.3 Industry analysis
3.3.1 Industry distribution of CO2 emissions embodied in exports
Fig. 4 depicts the industry distribution of the CO2 emissions embodied in exports of China
and the United States in 2004 and 2007. Manufacturing was the main industry of CO2 emissions
embodied in China’s exports, whose CO2 emissions embodied in exports reached 354 Mt and 441
Mt in 2004 and 2007, accounting for 68.56% and 71.60% of all CO2 emissions in China’s exports
in those two years. Similarly, manufacturing was also the main industry producing massive CO2
embodied in exports of the U.S. The CO2 emissions embodied in exports reached 112 Mt and 111
Mt in 2004 and 2007, accounting for 46.2% and 44.7% of all CO2 emissions in exports of the
United States in those two years.
-400 -300 -200 -100 0 100 200 300 400 500 600
CHN
USA
Mt CO2
2007 Net CO2 Emission Embodied in Export 2004 Net CO2 Emission Embodied in Export

Fig. 4. The industry distribution of the CO2 emissions embodied in exports of China and the
United States in 2004 and 2007.
Fig. 4 shows that the proportions of the CO2 emissions embodied in the exports of agriculture,
transportation and petrochemical of the U.S. were significantly higher than those of China. When
we look at the absolute number of the CO2 emissions of these 3 industries embodied in exports, it
can be summarized that in both 2004 and 2007, the CO2 emissions of agriculture and
transportation embodied in America’s exports were higher than those in China. The CO2 emission
embodied in the exports of petrochemical of the U.S. was higher than that of China in 2004 and
lower than that of China in 2007. Although the CO2 emissions embodied in services sector of 2
countries’ exports occupied the similar proportion, the absolute numbers turned out to be 84.42 Mt
and 83.08 Mt in 2004 and 2007 for China, and 38.82 Mt and 41.62 Mt for the United States.
3.3.2 Industry distribution of the CO2 emissions embodied in net imports/exports
Fig. 5 depicts the Industry distribution of the CO2 emissions embodied in net exports and
imports of China and the United States in 2004 and 2007. In 2004 and 2007, except for mining
and resources, all of the other 9 industries of China were net exporters of CO2 emissions embodied
in the international trade. For the United States, except for agriculture, construction, transportation
and services, other industries belonged to net importers of CO2 emissions embodied in trade.
Manufacturing was the main net importer of CO2 emissions embodied in U.S.’s trade but the main
net exporter of CO2 emissions embodied in China’s trade at the same time.
Fig. 5. The Industry distribution of the CO2 emissions embodied in net exports/imports of China
and the United States in 2004 and 2007.
0% 20% 40% 60% 80% 100%
2004
2007
2004
2007C
HN
USA
Agriculture
Food Processing
Mining and Resources
Paper Products and Publishing
Petrochemical
Mineral Products
Manufacturing
Construction
Transportation
Services
-100.00% -50.00% 0.00% 50.00% 100.00%
2004
2007
2004
2007
CH
NU
SA
Agriculture
Food Processing
Mining and Resources
Paper Products and Publishing
Petrochemical
Mineral Products
Manufacturing
Construction
Transportation
Services

4. Conclusions and discussions
Using GTAP8.0 to build global multi-regional input-output tables to measure each country’s
CO2 emissions can fully reflect a country’s production and emissions on the production chain of
imported products caused by domestic consumption. What’s more, it also reflected the real
changes of domestic production and emissions caused by the increase of domestic consumption
under the influence of international production chain through the feedback effect of the chain. The
results were more accurate when compared to using single-regional input-output tables.
The calculating results of each country’s production-based and consumption-based CO2
emissions varied significantly, especially for large foreign trade countries such as China and the
United States. The present results show that the consumption-based CO2 emissions of China in
2004 and 2007 were 428 Mt and 522 Mt lower than production-based CO2 emissions. To the
United States, the consumption-based CO2 emissions in 2004 and 2007 were 272 Mt and 220 Mt
higher than production-based CO2 emissions. In the context of globalization, the developed
countries like the United States avoided the CO2 emissions by reducing its production of import
commodities as a major importer, while China and other exporting countries bore a large number
of CO2 emissions because of the massive production of the exports.
Compared to the United States, the CO2 emissions embodied in China's exports accounted for
higher proportion than that of the U.S. in total domestic CO2 emissions, while the emissions in
imports accounted for lower proportion than that of the U.S. in total domestic CO2 emissions.
China was a net exporter of CO2 emissions embodied in international trade, whose net exports of
CO2 emissions reached 428 Mt and 522 Mt respectively in 2004 and 2007. However, the United
States is a net importer of CO2 emissions embodied in trade, whose net imports of CO2 emissions
reached 272 Mt and 221 Mt in 2004 and 2007, respectively.
In 2004 and 2007, except for mining and resources, all of the other 9 industries of China were
net exporters of CO2 emissions. For the United States, except for agriculture, construction,
transportation and services, other 6 industries belonged to net importers of CO2 emissions.
Manufacturing was the main net importer of CO2 emissions embodied in the U.S.’s trade but the
main net exporter of CO2 emissions embodied in China’s at the same time.
In conclusion, in order to ease China’s pressure on the reductions in GHG (greenhouse gas)
emissions, it remains the orientation of development that needs to be consistently adhered to in the
future to adjust economical structure, speed up technical innovation and improve energy
utilization efficiency. On the one hand, policy guidance and funding investment should be used to
develop and exploit new renewable energy like solar, geothermal, wind and biomass energy at
suitable regions. This can increase the proportion of clean energy in China. There is a need for
China to control the development of energy-intensive manufacturing industry properly. The
eliminating of the backward production capacity and the encouraging of the technology innovation
to promote transformation of high-grade manufacturing should also be paid attention to at the
same time. For other export-dependent industries, they can seek business opportunities from the
global wave of “low-carbon” by designing and producing low-carbon product to realize the
restructuring of exports. China might also make its effort to implement carbon tax on domestic
enterprises at the appropriate time, and use the tax revenues to supplement the energy and
greenhouse gas reductions of companies, to promote the transformation of China’s enterprises to
low carbonization and put them on a low carbon path. On the other hand, just because the recent
economic growth of China relied heavily on the external market, the carbon emissions started

moving to domestic environment and China’s export-oriented economy will be punctured when
the U.S. and Europe start to impose carbon tariffs towards China in the future. Therefore, it can be
the future development orientation for China to encourage the shifts of capital, technology, talents
and markets to domestic-consumption-dependent industries.
Reference
Ahmad N. & Wyckoff A.W. (2003). Carbon Dioxide Emissions Embodied in International Trade
of Goods. Paris: OECD Working Paper, (15). 1- 65.
Chen Y., Pan J. H., Xie L. H. (2008). Energy Embodied in Goods of International Trade in China:
Calculation and Policy Implications. Economic Research Journal. 43(7). 11- 25. (In Chinese)
Chung H. S. & Rhee H. C., (2007) Carbon Dioxide Emissions of Korea and Japan and Its
Transmission via International Trade. International Economic Journal. 15(4). 117-136
Frank A., Masanobu I., Mikio S. (2007). The carbon content of Japan–US trade. Energy Policy. 35.
4455-4462.
Guo J., Zou L. L., Wei Y. M. (2010). Impact of inter-sectoral trade on national and global CO2
emissions: An empirical analysis of China and US. Energy Policy. 38. 1389-1397.
Lin B. Q. & Sun C. W. (2010). Evaluating Carbon Dioxide Emissions in International Trade of
China. Energy Policy. 38(1). 613- 621.
Li Y. & Hewitt C. N. (2008). The Effect of Trade between China and the UK on National and
Global Carbon Dioxide Emissions. Energy Policy. 36. 1907- 1914.
Liu X. B., Ishikawa M., Wang C., Dong Y. L. & Liu W. L. (2010). Analyses of CO2 Emissions
Embodied in Japan- China Trade. Energy Policy. 38(3). 1510- 1518.
Shi H. L., Zhang Z. J. (2011). Empirical Analysis on CO2 Emission Embodied in Exports of China
to US. Journal of International Trade. (4). 56- 64. (In Chinese)
Shui B. & Harriss R. C. (2006). The Role of CO2 Embodiment in US- China Trade. Energy Policy.
34. 4063- 4068.
Wiedmann T. (2008). Development of An Embedded Carbon Emissions Indicator- Producing A
Tine Series of Input- Output Tables and Embedded Carbon Fioxide Emissions for the UK by
Using A MRIO Data Optimization System. Defra. London.
Xu M. , Allenby B. & Chen W. Q. (2009). Energy and Air Emissions Embodied in Sino-US Trade:
Eastbound Assessment Using Adjusted Bilateral Trade Data. Environment Science &
Technology. 43. 3378-3384.
Yu H. C., Wang L. M. (2009). Research on the Carbon Emission Transfer by Sino-US
Merchandise Trade. Journal of Natural Resources. (10). 1837- 1846. (In Chinese)
Yin X. P., Cheng M. (2010). CO2 Embodied in Goods of China-US Trade: Analysis and Policy
Implications. China Industrial Economics. (8). 45- 55. (In Chinese)
Zhou X. (2010). Emissions Embodied in International Trade and Trade Adjustment to National
GHG Inventory. Management Review. 22(6). 17-24. (In Chinese)
Appendix A
Abbr. Country Abbr. Country
alb Albania mng Mongolia
arg Argentina mar Morocco
arm Armenia moz Mozambique
aus Australia nam Namibia

aut Austria npl Nepal
aze Azerbaijan nld Netherlands
bhr Bahrain nzl New Zealand
bgd Bangladesh nic Nicaragua
blr Belarus nga Nigeria
bel Belgium nor Norway
bol Bolivia omn Oman
bwa Botswana pak Pakistan
bra Brazil pan Panama
bgr Bulgaria pry Paraguay
khm Cambodia per Peru
cmr Cameroon phl Philippines
can Canada pol Poland
xcb Caribbean prt Portugal
xcf Central Africa qat Qatar
chl Chile xca Rest of Central America
chn China xea Rest of East Asia
col Colombia xec Rest of Eastern Africa
cri Costa Rica xee Rest of Eastern Europe
civ Cote d’lvoire xef Rest of EFTA
hrv Croatia xer Rest of Europe
cyp Cyprus xsu Rest of Former Soviet Union
cze Czech Republic xnf Rest of North Africa
dnk Denmark xna Rest of North America
ecu Ecuador xoc Rest of Oceania
egy Egypt xsc Rest of South African Customs
slv El Salvador xsm Rest of South America
est Estonia xsa Rest of South Asia
eth Ethiopia xse Rest of Southeast Asia
fin Finland xwf Rest of Western Africa
fra France xws Rest of Western Asia
geo Georgia xtw Rest of World
deu Germany rou Romania
gha Ghana rus Russian Federation
grc Greece sau Saudi Arabia
gtm Guatemala sen Senegal
hnd Honduras sgp Singapore
hkg Hong Kong svk Slovakia
hun Hungary svn Slovenia
ind India zaf South Africa
idn Indonesia xac South Central Africa
irl Ireland esp Spain
irn Islamic Republic of Iran lka Sri Lanka
isl Israel swe Sweden
ita Italy che Switzerland
jpn Japan twn Taiwan
kaz Kazakhstan tza Tanzania
ken Kenya tha Thailand
kor Korea tun Tunisia

kwt Kuwait tur Turkey
kaz Kyrgyzstan uga Uganda
lao Lao People’s Democratic Republic ukr Ukraine
lve Latvia are United Arab Emirates
ltu Lithuania gbr United Kingdom
lux Luxembourg usa United States of America
mdg Madagascar ury Uruguay
mwi Malawi ven Venezuela
mys Malaysia vnm Viet Nam
mlt Malta zmb Zambia
mus Mauritius zwe Zimbabwe
mex Mexico
Appendix B
Abbr. Industry Abbr. Industry
ATP Air transport OFD Food products nec
B_T Beverages and tobacco products OFI Financial services nec
C_B Sugar cane, sugar beet OIL Oil
CMN Communication OME Machinery and equipment nec
CMT Bovine meat products OMF Manufactures nec
CNS Construction OMN Minerals nec
COA Coal OMT Meat products nec
CRP Chemical, rubber, plastic products OSD Oil seeds
CTL Bovine cattle, sheep and goats, horses
OSG
Public Administration, Defense,
Education, Health DWE Dwellings
ELE Electronic equipment OTN Transport equipment nec
ELY Electricity OTP Transport nec
FMP Metal products P_C Petroleum, coal products
FRS Forestry PCR Processed rice
FSH Fishing PDR Paddy rice
GAS Gas PFB Plant-based fibers
GDT Gas manufacture, distribution PPP Paper products, publishing
GRO Cereal grains nec RMK Raw milk
I_S Ferrous metals ROS Recreational and other services
ISR Insurance SGR Sugar
LEA Leather products TEX Textiles
LUM Wood products TRD Trade
MIL Dairy products V_F Vegetables, fruit, nuts
MVH Motor vehicles and parts VOL Vegetable oils and fats
NFM Metals nec WAP Wearing apparel
NMM Mineral products nec WHT Wheat
OAP Animal products nec WOL Wool, silk-worm cocoons
OBS Business services nec WTP Water transport
OCR Crops nec WTR Water