Embed Size (px)
Citation preview
SIJDEB, 1(3), 2017, 277-296 p-ISSN: 2581-2904, e-ISSN: 2581-2912
SRIWIJAYA INTERNATIONAL JOURNAL OF DYNAMIC ECONOMICS AND BUSINESS
http://ejournal.unsri.ac.id/index.php/sijdeb
Analysis of Work Performance and Export Competitiveness in Province of Indonesia
Nani Rosita
Central Bureau of Statistics (BPS) [email protected]
Abstract The purpose of this study is to analyse the export performance of provinces in Indonesia, the effect of export and capital stock on the long-term and short-term economic growth of Indonesia and the competitiveness of provinces in exporting Indonesia’s leading products. The panel data from 33 provinces in Indonesia from 2000-2016 is used in this study. The secondary data is consist of gross regional domestic product (GRDP), export value and gross fixed capital formation (GFCF). Export performance is measured using regional export performance index meanwhile, the effect of export and capital stock on long-term and short-term economic growth is analysed using cointegrated panel model and error correction model (ECM) panel. Finally, RCA dynamic is used in analysing export competitiveness. The results show that export performance of each province have various rating on the regional economies. Only 11 provinces have regional export performance index higher than while, meaning that only 33.3% of the total provinces, while the rest of the provinces have index that are less than one. This shows that only few provinces that can provide good performance of export. Based on the co-integrated test, there is a long-term relation between GRDP, export and GFCF. In both long-term and short-term, export and GFCF have positive impact on GRDP showing that the increase in export and/or GFCF will increase GRDP, which will results in economic growth. Furthermore, the results of RCA dynamic show that the export competitiveness is not always following the growth of national export segment. Indonesia’s rubber and coal exports have negative growth of national export segment while export of palm oil, coffee and textile have positive growth. Keywords: export performance, competitiveness, export led growth,
cointegrate panel, ECM panel

Rosita/SIJDEB, 1(3), 2017, 277-296
278
INTRODUCTION Foreign trade is an important aspect in every country's economy. It is relate to economic growth, international trade which is often consider as an "engine of growth" (Salvatore 1997: 423).Although the theory of economic growth does not explicitly and clearly using international trade variables as one of the main components in determining economic growth. The basic theories that have considered international trade variables are the new growth theory or endogenous. In the new growth theory has been considered the possibility of externality or increasing return to scale in production function Externalities that can be generated from import and export activites and to other countries.According to Jung and Marshall (1985) as cited in Ramly (2013), the relationship between exports and growth are consist of four possibilities or hypotheses: export led hypothesis, internally generated export hypothesis, and growth reducing export hypothesis). The result of the study which shows the validity of Export Led Growth is based on the fact that: first, export has multiplier effect in expanding production and job opportunity. Second, the exchange rate encourages exports and imports of capital goods thus increasing domestic economic potential. Third, the volume of trade and competition in the market contest led to the emergence of economies of scale and acceleration in the advancement of production techniques (Ramly, 2013).
Table 1. GDP based on Expenditure in 2014-2016 based on constant price in 2010
GDB using GDP component (Billion Rupiah) Proportion Growth Rate Growth Resources
2014 2015 2016 2014 2015 2016 2014 2015 2016 2014 2015 2016 Household Consumption 4.651,48 488,26 5.126,50 54,30 54,39 54,35 5,16 4,96 5,00 2,80 2,70 2,72
Foreign Consumption 99,42 98,79 105,34 1,16 1,10 1,12 12,19 -0,63 6,63 0,14 -0,01 0,07
Government Consumption 736,28 775,93 774,30 8,60 8,64 8,21 1,16 5,38 -0,21 0,10 0,47 -0,02
Gross fixed Capital Formation
2.775,73 2916,60 3.041,83 32,40 32,49 32,25 4,57 5,07 4,29 1,48 1,65 1,38
Change in inventory 156,72 112,85 139,59 1,83 1,26 1,48 25,93 -27,99 23,70 0,47 -0,35 0,35
Export 2.046,30 2.005,95 1969,64 23,89 22,35 20,88 2,00 -1,97 -2,81 0,24 -0,44 -0,38 Import 1.988,54 1.872,35 1.817,55 23,21 20,86 19,27 2,19 -5,84 -2,93 0,51 -1,22 -0,56 Gross Domestic Product
8.566,27 8.976,93 9.433,03 100,00 100,00 100,00 5,06 4,88 5,02 5,06 4,88 5,02
Source: Indonesia Gross Domestic Product based on expenditure, 2012-2016, BPS
Indonesia's exports and GDP value tend to having trend increasing year by year. The table above shows that the proportion of export components also tends to be high to GDP. However, in recent years the GDP growth rate and exports declined even the growth rate of exports experienced the negative growth. There is no doubt that the recent decline in exports has contributed to the weakening of Indonesia's economic growth. This means that in the growth
Rosita/SIJDEB, 1(3), 2017, 277-296
279
rate there is a direct relationship between exports and GDP in recent years. While seen from the source of growth, household consumption and Gross Fixed Capital Formation (Pembentukan Modal Tetap Bruto) give a big contribution to the economic growth of Indonesia. From the table above can also be seen that in addition to household consumption, Gross Fixed Capital Formation which describes the amount of investment/capital stock and exports have a high contribution to the GDP of Indonesia. Both components as described in the theory of economic growth are the driving factor in a region's economic growth. Exports have long been the strength of the Indonesian economy. Indonesia in the Soeharto Era, known as the world's major oil producer and exporter. Indonesia entered the ranks of 11 largest oil producers in the world. However, massive oil production throughout the New Order period caused oil reserves decline sharply. Since the 1980s, Indonesia has no longer dependent on oil and gas exports, the non-oil and gas sector has dominated Indonesia's exports. This is evident from the role of non-oil / gas exports in 2015 reaching 87.65 percent (BPS). Several Indonesian non-oil/Gas export commodities can be triumphed in international markets is plantation commodities such as palm oil, rubber, coffee and cocoa. In addition, Indonesia's mining commodities can also control world market shares such as coal and natural gas. Nowadays, Exports become one of the strengths of the regional economy, the role of exports is very important to support the economic growth of a region. Since the enactment of regional autonomy, every province has been more free in determining the sector / commodity prioritized its development. The economic base theory based its view that the economic growth rate of a region is determined by the large increase in exports from the region (Tarigan, 2003: 28). The success of a region in international trade can also be seen from the competitiveness of its export products. Export competitiveness becomes the driving factor of region export performance . Competitiveness has become the key of a region to succeed in its participation in globalization and world free trade (Bustami and Hidayat, 2013). Not surprisingly, every province is compete to increase its superior product exports in order to continue to compete in the international market. Various problems are faced in export development such as the composition of exported goods is not balanced because it is dominated by certain types of commodities so that export revenues are highly dependent on the export of these commodities. Export dependence on primary products is covered by risk factors and uncertainty factors are very high, because the market and prices for such export products are uncertain (Todaro, 2003: 7). For example, processed rubber commodities, in addition to facing price problems that often fluctuate also face rival rubber synthesis. Another problem of Indonesian exports is export destination countries which are still concentrated in certain countries such as the United States, China and Japan. As a result of dependence on the countries that mentioned is very large. Any turmoil that occurs in the country will affect export performance. This

Rosita/SIJDEB, 1(3), 2017, 277-296
280
turmoil is not limited only to economic turmiol but also the non-economic that occurs in the country. Recently Various problems export activities led to a decline in the value of Indonesian exports. Because export is one of the driving factor of the region economy, so researchers are interested to analyze the export performance of the provinces in Indonesia, analyze the effect of exports and capital stock on Indonesia's long-term and short-term economic growth and analyze the competitiveness of provincial exports of Indonesia's superior products. LITERATURE REVIEW Theory of Economic Growth According to the view of classical economists, the law of diminishing returns will affect economic growth. This means that economic growth will not continue. At the beginning, if the population is small and the natural wealth is relatively excessive, the rate of return on investment made will be high. Then entrepreneurs will have more benefit. This will create new investment, and economic growth will occured. With the limited land, if the population is too much, it will decrease the level of economic activity because the productivity of each population has become negative. So the prosperity of society declined again. The economy will reach a very low level of prosperity. When this is achieved, the economy have reached stasionary state. Harrod-Domar's theory sees economic growth in terms of demand that economic growth will occur when there is an increase in investment. According to Harrod-Domar, every economy can set aside a certain proportion of its national income if only to replace damaged capital goods. However, to grow the economy, new investments are needed in addition to the stock of capital. The neo classical growth theory was developed by two economists: Robert Solow and Trevor Swan. Neoclassical theory argues that economic growth come from the addition and development of factors affecting aggregate supply. This growth theory also emphasizes that the development of production factors and technological progress is a determining factor in economic growth(Sukirno, 1994). Because the level of technological progress is determined exogenously the neo classical model of Solow is also called the exogenous growth model. Endogenous growth models assume that international trade is important as a factor affecting economic growth. The international trade model is measured through export and import activities. Regional economic growth theory commonly known as one is the theory of export bases that assume that exports are the only exogenous (independent) element in expenditure, which mean that all other expenditure elements are dependent on income. This indirectly means beyond natural increment, only an increase in exports can lead to increased regional revenues because other sectors are bound by increased regional revenues. Other sectors only increase when overall regional revenue increases.

Rosita/SIJDEB, 1(3), 2017, 277-296
281
International Trade Theory Absolute advantage of Adam Smith's theory of trade between two countries is based on absolute advantage. According to the Theory of Comparative Advantage (in Salvatore, 1997), although a country is less efficient than (or has absolute losses to) other countries in producing both commodities, there is still a basis for trade that benefits both parties. The first country must specialize in producing and exporting commodities with less absolute losses (this is a commodity with comparative advantage) and importing commodities with greater absolute losses (these commodities have comparative losses). Modern theory of international trade according to Hecksher and Ohlin is the proportion factor states that the difference in the opportunity cost of a country with another countries because of the difference in its production factors. Export-led Growth Hypothesis (ELGH)
The main of export-led growth hypothesis is that the main determinant of economic growth is exports, or in other words export becomes the driving force for economic growth. According to Lorde (2011), exports encourage specialization in the production of export commodities that encourage increased levels of productivity and can lead to increased skills in the export sector and resulting the reallocation of resources from less efficient non-trade sectors to an efficient trading sector. The starting point for investigating the Export Led Growth hypothesis stems from an AK production function:
𝑌!" = 𝐴!"
Where Y is the output, A is the productivity level and K is the stock of capital. i and t are region and time. Export X has a direct effect on productivity.
𝐴!" = 𝑓 𝑋!" = 𝑋!"!
Substituting the fit (1) into equation (2) and using the log to obtain the equation: 𝑙𝑜𝑔 𝑌!" = 𝛼𝑙𝑜𝑔 𝑋!" + 𝛽 𝑙𝑜𝑔 𝐾!" + 𝑢!"
Competitiveness Definition of competitiveness began to develop after Porter (1990) defines national competitiveness. Porter (as cited in Widyasanti, 2010) defines national competitiveness as: "the output of a country's ability to innovate in order to achieve, or maintain a favorable position compared to other countries in its key sectors" . Export competitiveness is the ability of a sector which, by comparison is more favorable for the development of an area than the average distribution of other regions in a larger area, because it has a higher exporting capability than the average of the same exports from other regions (Dikdik, 2007 : 12). In assessing competitiveness refers to the theories of international trade.

Rosita/SIJDEB, 1(3), 2017, 277-296
282
Previous Research Dreger and Zhang (2013) examine the relevance of the Export Led Growth hypothesis on regional economies in China, with empirical evidence from 28 provinces. The method used is cointegration panel and error correction model. The result of this research concludes that there are relation between three variables that is GDP, export and stock of capital. The research titled Provincial Export in export development (Export Performance Index Methodology) by Ramly (2013) aims to examine provincial export performance in Indonesia. Based on Export Performance Index Methodology calculations, provinces in Indonesia with high export performance generally include areas with high per capita income. Most of them include provinces with relatively large natural resource potential. Safari, Menik and Aula (2016) examine the effect of exports, capital formation and government expenditure on Indonesia's economic growth in the period 1975-2014. Data analysis techniques use time series data analysis with ECM (Error Correction Model). The results showed that export and capital formation variables positively affect GDP in the long term and short term and government expenditure variable negatively affect GDP in the long term and short term, economic crisis is not significant effect on GDP change. Widyasanti (2010) examines the competitiveness of Indonesian exports after Indonesia is involved in the ASEAN Free Trade Agreement (AFTA) and the ASEAN-China Free Trade Agreement (ACFTA). Export competitiveness is measured by several trade indicators, such as: export intensity index, market share, and dynamic RCA, for some of Indonesia's major export products. The results show that Indonesia is in good condition and has opened its own market share for some products. In the Chinese market, Indonesia managed to seize the market only for plastic and rubber products, mineral products and footwear. Theoretical Framework This study will see the regional / provincial export performance as measured by the Regional Export Performance Index. Then this research would like to prove whether export encourages economic growth (export led growth hypothesis), by
Export Performance Export Competitiveness
Economic Growth
Capital Stock

Rosita/SIJDEB, 1(3), 2017, 277-296
283
using the decrease of production function which include export and stock variables as independent variable, regional economic growth is represented by regional output that is provincial Regional Gross Domestic Product value. Export analysis can not be separated from the competitiveness of export products because export competitiveness will boost export performance. Therefore, this research will also describe the competitiveness of Indonesia's superior product exports regionally / province Research Hypothesis H1 : Provincial export development above its regional economic capability
(provincial export performance index more than 1). H2 : Exports and stocks of capital have a positive effect on economic growth
both in the long term and short term. H3 : Provincial export products have the competitiveness advanteages
(provincial export competitiveness index is more than 0).
METHODS The scope of research The scope of this study covers export performance, the relationship and influence of exports and capital stocks on economic growth and competitiveness of Indonesia's superior product exports. This study covers 33 provinces in Indonesia. For export competitiveness, Indonesia's five main commodities are palm oil, coffee, rubber, coal and textile products. Research period from 2000 to 2016. Types and Data Sources Data used in this research are secondary data and panel data from 33 provinces in Indonesia. Sources of secondary data used in this study came from the Central Bureau of Statistics (Badan Pusat Statistik). The data used in this research are Gross Domestic Product of Indonesia, Province Gross Regional Domestic Product, provincial and national export value, and provincial Gross Fixed Capital Formation.
Rosita/SIJDEB, 1(3), 2017, 277-296
284
Research Variables and Operational Definition The research variables used are export, capital stock, economic growth, GDP and GRDP. The operational definition used in this research are; 1. Export Performance Export performance is a success rate of export, in this study wanted to see export performance in relation to the regional economy. 2. Economic Growth Economic growth is the process of increasing the production capacity of an economy which is manifested in the form of an increase in national income / Gross Domestic Product. The provincial economic growth variable in this study is represented by provincial GDP data at constant prices in 2010 3. GDP and GRDP Gross Domestic Product (GDP) and Gross Regional Domestic Product (GRDP) is the amount of value added goods and services produced from all economic activities in a region within a particular year or period. In this study, for the calculation of export performance index of GDP and GRDP used at current prices in billions of rupiah 4. Export Export is an activity of selling or sending goods or commodities to foreign countries in accordance with government provisions with payment or international currency ie US Dollar. In this study, the export variable is measured by the export value. The unit of export value is million US $. 5. Capital Stock Capital stocks are defined as inventories of various types of capital goods, such as buildings, machinery, transportation, cattle and other capital goods, which contribute to the viability of a production process. In this study, the capital stock is measured using the value of the Gross Fixed Capital Formation of the province in Indonesia based on the constant price of 2010, in units of billions of rupiah. 6. Export Competitiveness Export competitiveness is the ability of a commodity to enter foreign markets and its ability to survive in that market. Analysis Technique To analyze the export performance used Regional Export Performance Index (IPER). This technique can be defined as the ratio between UEP and UEkP, ie:
𝐼𝑃𝐸𝑅 = 𝑈𝐸𝑃𝑈𝐸𝑘𝑃

Rosita/SIJDEB, 1(3), 2017, 277-296
285
Where UEP = size of regional exports (export value of province divided by the value of national exports) and UEkP = regional economic size (provincial GRDP / GDP). IPER is between zero and infinity. If IPER <1 then the performance or regional rating is low, in other words export development is below its regional economic capability. If IPER> 1 then the performance or regional rating is high, in other words export development above its regional economic capability. In this study, the calculation of the competitiveness of exports using the Revealed Comparative Advantage (RCA) dynamic that refers to Edwards and Schoee (2001), calculated using the formula as follows:
𝐷𝑅𝐶𝐴 = 𝛥( 𝑋!"
𝑋!"!)
𝑋!"𝑋!"!
− 𝛥( 𝑋!"
𝑋!"!)
𝑋!"𝑋!"!
The first part of the right-hand side of the equation refers to the export share of the province's export product commodity to the total value of the province's exports. The second part refers to the export share of Indonesia's export commodity products to total Indonesian exports.
Table 2. Dynamic RCA Competitiveness Matrix
Sources : Edwards & Schoer (2001)
Cointegration Panel and ECM Panel First step is examining the panel data of unit root/stationery using a method consists of two kinds, i.e. common unit root which consist of statistical test of Levi, Lin and Chu dan Breitung also individual unit root which consist of statistical test of Pesaran and Shin and PP Fisher Test. Cointegration is a long-term relationship between variables although individually not stationary but the linear combination between that variable become stationary. There is a different method in examining panel data cointegration. The method which can be used for doing the cointegration test is growth from
Product Segment in Province
Product Segment in Indonesia
Competitiveness Position
RCA Incline ↑ > ↑ Rising Star
↑ > ↓ Falling Star
↓ > ↓ Lagging Retreat
RCA Decline
↓ < ↑ Lost Opportunity
↓ < ↓ Leading Retreat
↑ < ↑ Lagging Opportunity

Rosita/SIJDEB, 1(3), 2017, 277-296
286
cointegration test in data time series, like Pedroni and Koo’s method (which used basic test of Engle-Granger cointegration) and combined individual test (Fisher/Johansen). The Requirements of cointegration examining is all variables should be stationary on the same difference. After getting the result from cointegration test, then analyze the FMOLS’s panel (Fully Modified Ordinary Least Square) for getting the effect of long term between dependent variabel and independent variable. There is a common model of FMOLS’s panel (Pedroni, 2000):
𝑦!" = 𝛼! + 𝛽!𝑋!" + 𝜇!" , 𝑤𝑖𝑡ℎ 𝑋!" = 𝑋!"!! + 𝜀!" ECM (Error Correction Model) is a model which is used for analyze short-term relationship. If the variable has a long-term relationship (there is a cointegration), so the assumption in short-term is variable has no equilibrium relationship. If there is a new balance in long-term so in short-term need an adjustment on certain time (lag) so the variable can return to equilibrium in process towards the long-term balance. Common model of ECM panel can be drawn by the equation below:
𝛥𝑌!" = 𝛽! + 𝛽!𝛥𝑋!!" + 𝛽!𝛥𝑋!!" + 𝛽!𝐸𝐶𝑇!"!! + 𝜀!"
Where 𝛥 is difference, Y is dependent variable, X is independent variable, β is a slope from independent variable, ECT is an error corrrection or salvage lag 1 from the initial equation, ε is an error or salvage and i and t is individu and time. FINDINGS The Export Performance Of Provinces In Indonesia The highest average of IPER reach 3.6419 which belongs to South Kalimantan and the lowest is 0.0357 which belongs to Nusa Tenggara Timur. The rating of 3.6419 shows that the export performance of provinces reach 3.6419 times higher than the ability of regional economy. In the other words, every 1 percent of regional economic shares to the national will create 3.6419 percent of regional exports. Rating 0.0357 means every 1 percent of regional economic shares only create 0.0357 percent exports or 96.43 percent below the capacity of its regional economy.
Table 3. IPER Value and Each Provinces Rank Period 2010-2016 Province Average
2010-2016
Rank
Province Average 2010-2016
Rank
Rosita/SIJDEB, 1(3), 2017, 277-296
287
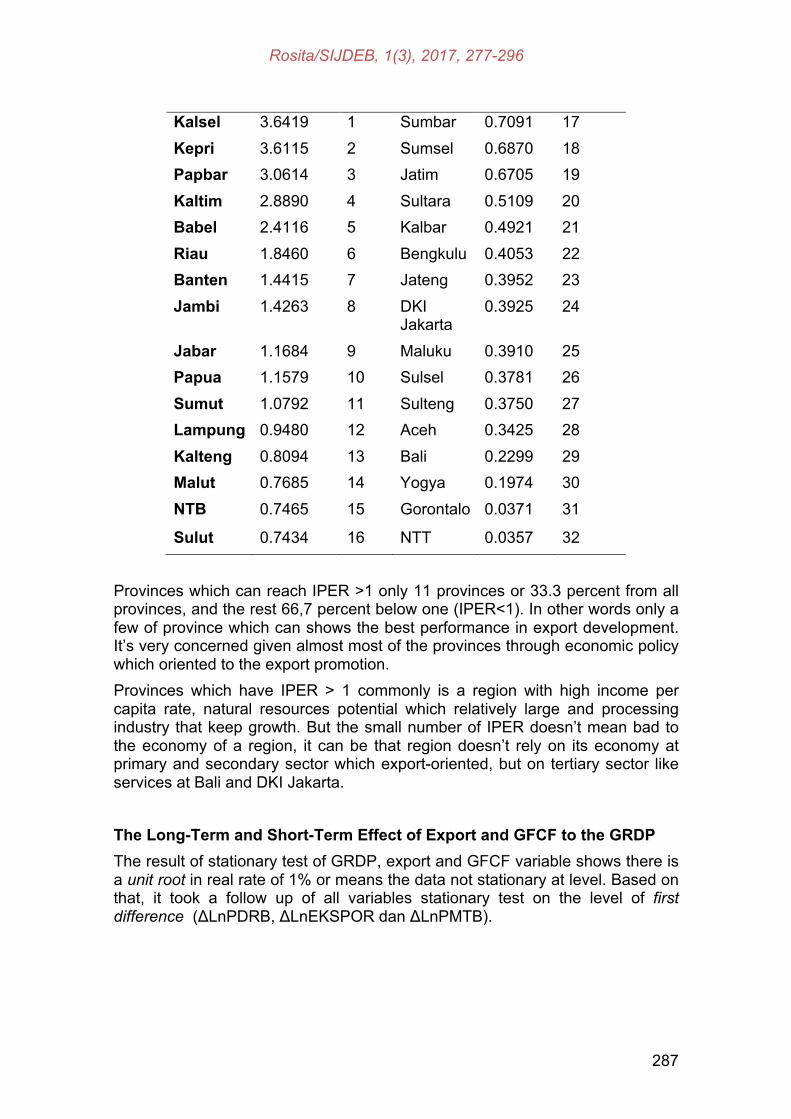
Kalsel 3.6419 1 Sumbar 0.7091 17 Kepri 3.6115 2 Sumsel 0.6870 18 Papbar 3.0614 3 Jatim 0.6705 19 Kaltim 2.8890 4 Sultara 0.5109 20 Babel 2.4116 5 Kalbar 0.4921 21 Riau 1.8460 6 Bengkulu 0.4053 22 Banten 1.4415 7 Jateng 0.3952 23 Jambi 1.4263 8 DKI
Jakarta 0.3925 24
Jabar 1.1684 9 Maluku 0.3910 25 Papua 1.1579 10 Sulsel 0.3781 26 Sumut 1.0792 11 Sulteng 0.3750 27 Lampung 0.9480 12 Aceh 0.3425 28 Kalteng 0.8094 13 Bali 0.2299 29 Malut 0.7685 14 Yogya 0.1974 30 NTB 0.7465 15 Gorontalo 0.0371 31
Sulut 0.7434 16 NTT 0.0357 32
Provinces which can reach IPER >1 only 11 provinces or 33.3 percent from all provinces, and the rest 66,7 percent below one (IPER<1). In other words only a few of province which can shows the best performance in export development. It’s very concerned given almost most of the provinces through economic policy which oriented to the export promotion. Provinces which have IPER > 1 commonly is a region with high income per capita rate, natural resources potential which relatively large and processing industry that keep growth. But the small number of IPER doesn’t mean bad to the economy of a region, it can be that region doesn’t rely on its economy at primary and secondary sector which export-oriented, but on tertiary sector like services at Bali and DKI Jakarta.
The Long-Term and Short-Term Effect of Export and GFCF to the GRDP The result of stationary test of GRDP, export and GFCF variable shows there is a unit root in real rate of 1% or means the data not stationary at level. Based on that, it took a follow up of all variables stationary test on the level of first difference (ΔLnPDRB, ΔLnEKSPOR dan ΔLnPMTB).

Rosita/SIJDEB, 1(3), 2017, 277-296
288
Table 4. The Results of Unit Root Test on Panel Data
The result of data stationary test on first difference level shows that all variables related to the research has no unit root, in the other words all stationary variables with real level test of 1%. As a follow up from stationary test above, so the related variables need a cointegration test to see whether or not the long-term relationship between that variables. The result of Pedroni cointegration test shows that on real level of 1%, Three out of seven statistical test said refuse zero hypotheses (there is no cointegration) means the variables used in research will be cointegrated each other. The result of cointegration test is concluded that all variables in this research will be cointegrated each other supported by the result of Koo cointegration test which is significantly on real level of 1%.
Table 5. The Result of Pedroni Cointegration Test
Statistical Test Unweighted Weighted
Panel υ-stat 16.36 (0.0000) 15.49 (0.0000)
Panel ρ-stati 3.07 (0.9989) 3.34 (0.9996) Panel t-stat 0.91 (0.8192) 0.78 (0.7815)
Panel ADF-stat -2.33 (0.0099) -3.09 (0.0010) Group ρ-stat 5.31 (1.0000)
Variable Diff Method2 Statistic P-Value Test Result LLC test
Breitung IPS test
PP fisher
LnPDRB LnPDRB d(LnPDRB) d(LnPDRB)
0 0 1 1
1 2 1 2
1,0000 0,0000 0,0000 0,0000
0,9982 1,0000 0,0000 0,0000 0,0000
1,0000 0,0000 0,0000 0,0000
I(1)
0,2289
LnEKSPOR LnEKSPOR d(LnEKSPOR) d(LnEKSPOR)
0 0 1 1
1 2 1 2
0,0000 0,0264 0,0000 0,0000
0,2285 0,0469 0.8353 0,0000 0,0000
0,8134 0,4144 0,0000 0,0000
I(1)
0,0000
LnPMTB LnPMTB d(LnPMTB) d(LnPMTB)
0 0 1 1
1 2 1 2
0,2278 0,0000 0,0000 0,0000
0,7556 1,0000 0,7014 I(1) 0,0009 0,0045
0,0000 0,0000 0,0000 0,0000 0,0000
Rosita/SIJDEB, 1(3), 2017, 277-296
289
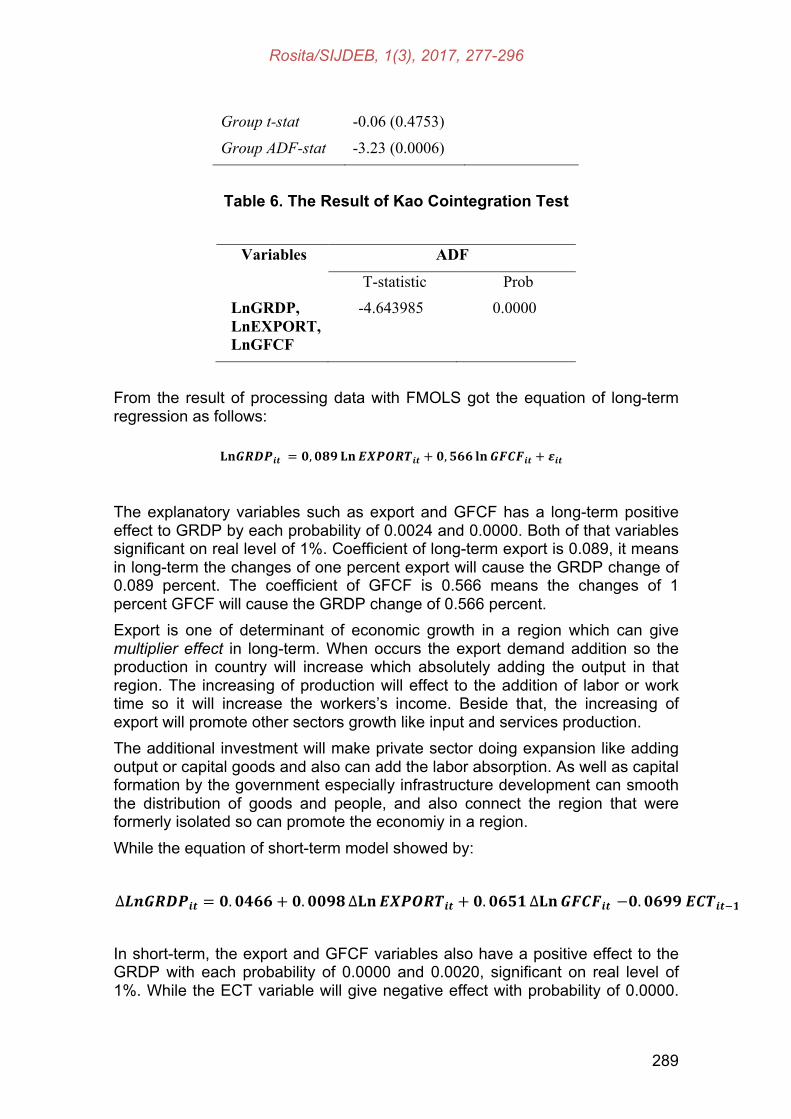
Group t-stat -0.06 (0.4753)
Group ADF-stat -3.23 (0.0006)
Table 6. The Result of Kao Cointegration Test
Variables ADF
T-statistic Prob LnGRDP, LnEXPORT, LnGFCF
-4.643985 0.0000
From the result of processing data with FMOLS got the equation of long-term regression as follows:
The explanatory variables such as export and GFCF has a long-term positive effect to GRDP by each probability of 0.0024 and 0.0000. Both of that variables significant on real level of 1%. Coefficient of long-term export is 0.089, it means in long-term the changes of one percent export will cause the GRDP change of 0.089 percent. The coefficient of GFCF is 0.566 means the changes of 1 percent GFCF will cause the GRDP change of 0.566 percent. Export is one of determinant of economic growth in a region which can give multiplier effect in long-term. When occurs the export demand addition so the production in country will increase which absolutely adding the output in that region. The increasing of production will effect to the addition of labor or work time so it will increase the workers’s income. Beside that, the increasing of export will promote other sectors growth like input and services production. The additional investment will make private sector doing expansion like adding output or capital goods and also can add the labor absorption. As well as capital formation by the government especially infrastructure development can smooth the distribution of goods and people, and also connect the region that were formerly isolated so can promote the economiy in a region. While the equation of short-term model showed by:
∆𝑳𝒏𝑮𝑹𝑫𝑷𝒊𝒕 = 𝟎.𝟎𝟒𝟔𝟔+ 𝟎.𝟎𝟎𝟗𝟖∆𝐋𝐧𝑬𝑿𝑷𝑶𝑹𝑻𝒊𝒕 + 𝟎.𝟎𝟔𝟓𝟏∆𝐋𝐧𝑮𝑭𝑪𝑭𝒊𝒕 −𝟎.𝟎𝟔𝟗𝟗 𝑬𝑪𝑻𝒊𝒕!𝟏+𝜺𝒊𝒕
In short-term, the export and GFCF variables also have a positive effect to the GRDP with each probability of 0.0000 and 0.0020, significant on real level of 1%. While the ECT variable will give negative effect with probability of 0.0000.
𝐋𝐧𝑮𝑹𝑫𝑷𝒊𝒕 = 𝟎,𝟎𝟖𝟗 𝐋𝐧𝑬𝑿𝑷𝑶𝑹𝑻𝒊𝒕 + 𝟎,𝟓𝟔𝟔 𝐥𝐧𝑮𝑭𝑪𝑭𝒊𝒕 + 𝜺𝒊𝒕
Rosita/SIJDEB, 1(3), 2017, 277-296
290
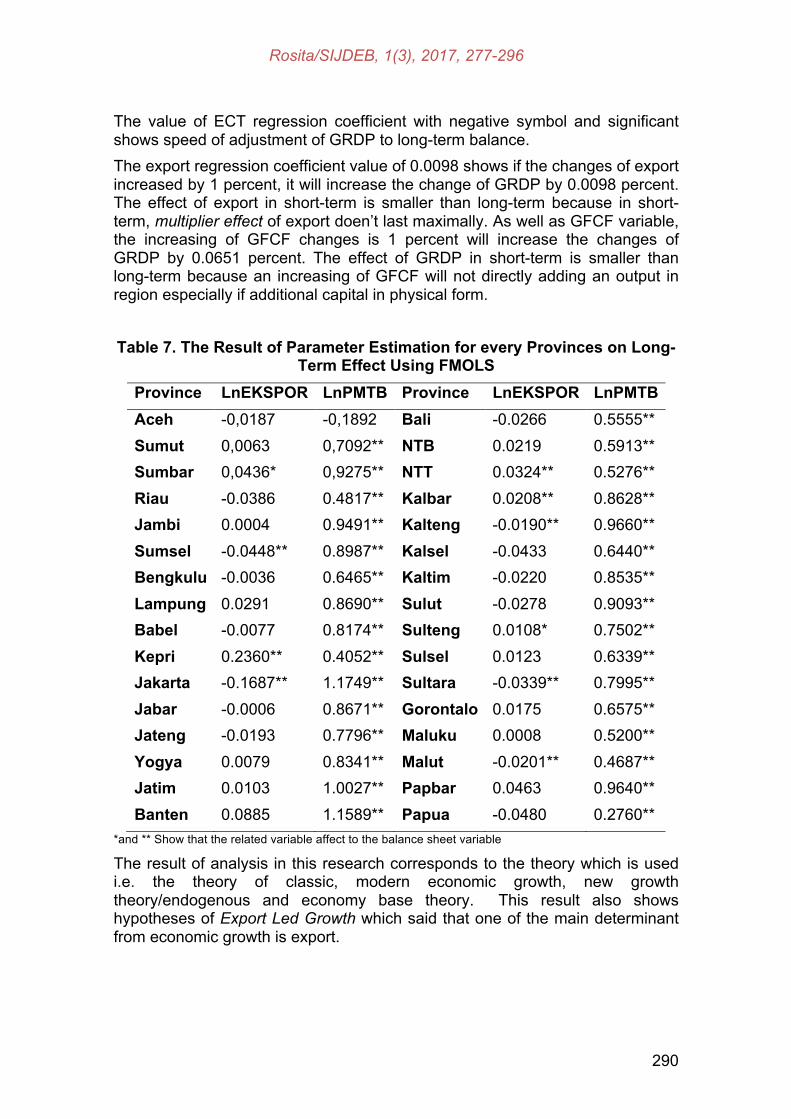
The value of ECT regression coefficient with negative symbol and significant shows speed of adjustment of GRDP to long-term balance. The export regression coefficient value of 0.0098 shows if the changes of export increased by 1 percent, it will increase the change of GRDP by 0.0098 percent. The effect of export in short-term is smaller than long-term because in short-term, multiplier effect of export doen’t last maximally. As well as GFCF variable, the increasing of GFCF changes is 1 percent will increase the changes of GRDP by 0.0651 percent. The effect of GRDP in short-term is smaller than long-term because an increasing of GFCF will not directly adding an output in region especially if additional capital in physical form. Table 7. The Result of Parameter Estimation for every Provinces on Long-
Term Effect Using FMOLS Province LnEKSPOR LnPMTB Province LnEKSPOR LnPMTB Aceh Sumut Sumbar Riau Jambi Sumsel Bengkulu Lampung Babel Kepri Jakarta Jabar Jateng Yogya Jatim Banten
-0,0187 0,0063 0,0436* -0.0386 0.0004 -0.0448** -0.0036 0.0291 -0.0077 0.2360** -0.1687** -0.0006 -0.0193 0.0079 0.0103 0.0885
-0,1892 0,7092** 0,9275** 0.4817** 0.9491** 0.8987** 0.6465** 0.8690** 0.8174** 0.4052** 1.1749** 0.8671** 0.7796** 0.8341** 1.0027** 1.1589**
Bali NTB NTT Kalbar Kalteng Kalsel Kaltim Sulut Sulteng Sulsel Sultara Gorontalo Maluku Malut Papbar Papua
-0.0266 0.0219 0.0324** 0.0208** -0.0190** -0.0433 -0.0220 -0.0278 0.0108* 0.0123 -0.0339** 0.0175 0.0008 -0.0201** 0.0463 -0.0480
0.5555** 0.5913** 0.5276** 0.8628** 0.9660** 0.6440** 0.8535** 0.9093** 0.7502** 0.6339** 0.7995** 0.6575** 0.5200** 0.4687** 0.9640** 0.2760**
*and ** Show that the related variable affect to the balance sheet variable
The result of analysis in this research corresponds to the theory which is used i.e. the theory of classic, modern economic growth, new growth theory/endogenous and economy base theory. This result also shows hypotheses of Export Led Growth which said that one of the main determinant from economic growth is export.

Rosita/SIJDEB, 1(3), 2017, 277-296
291
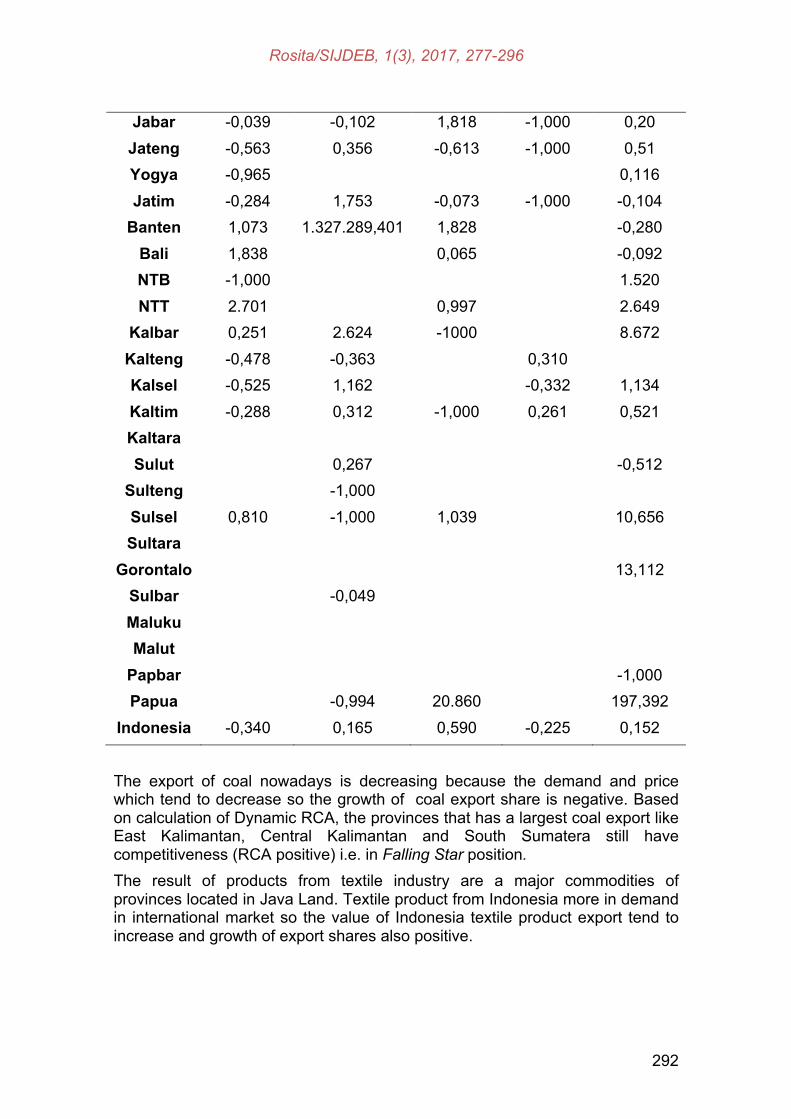
The Export Competitiveness of Provinces The export competitiveness value of provinces by using RCA showed by the substraction between the provinces export shares growth and the national export shares growth. A dynamics RCA dynamics is positive means export of provinces for that comodities have competitiveness. For rubber comodities, the value of Indonesian rubber export has been decreasing in several years because plummeted price of rubber in international market so most of the rubber export in each provinces in Indonesia decrease. But, based on criteria of Dynamic RCA, there is still 5 provinces which feel the increasing of rubber export so it’s including in Falling Star position i.e. the commodity of rubber in that provinces still have excellence competitiveness which increase although Indonesia export to that product tend to decrease. Export of Indonesia Palm oil tend to decrease but if compared with years 2010, Export of Palm oil 2016 still increase so the growth of Indonesia palm oil export shares is positive. From 23 provinces which export commodities of palm oils and its fraction, there are nine provinces which located in Lost Opportunity position which is the level of export competitiveness palm oil product is decreasing when export to that product is increasing. World demand to Indonesia coffee product tend to always increasing symbolized by the growth of coffee export shares which is positive. But, the competitiveness of province that contribute the coffee export for Indonesia more there in Lost Opportunity position. Provinces which located in that position is the largest coffee exporter like Lampung and East Java. Table 8. The Export Shares Growth of Indonesia Major Commodities Year
2016 to 2010
Province Rubber Palm Oil Coffe Coal Textile Product
Aceh 229,772 24,475 0,856 Sumut -0,484 -0,032 0,651 -0,368
Sumbar -0,451 0,259 2,173 -1000 0,299 Riau -0,578 0,187 -0,925 -0,984 -0,994
Jambi -0,617 -0,834 -0,642 -0,650 0,296 Sumsel -0,065 -0,142 -0,369 3,795 4,973
Bengkulu -0.590 1,280 0,220 Lampung -0,134 0,328 -0.075 -0.048 0.048
Babel -0,395 0,223 Kepri -0,502 0,981 -0,957 -0,160
Jakarta -0,541 2,909 33,761 -1,000 -0,513
Rosita/SIJDEB, 1(3), 2017, 277-296
292
Jabar -0,039 -0,102 1,818 -1,000 0,20 Jateng -0,563 0,356 -0,613 -1,000 0,51 Yogya -0,965 0,116 Jatim -0,284 1,753 -0,073 -1,000 -0,104
Banten 1,073 1.327.289,401 1,828 -0,280 Bali 1,838 0,065 -0,092 NTB -1,000 1.520 NTT 2.701 0,997 2.649
Kalbar 0,251 2.624 -1000 8.672 Kalteng -0,478 -0,363 0,310 Kalsel -0,525 1,162 -0,332 1,134 Kaltim -0,288 0,312 -1,000 0,261 0,521 Kaltara Sulut 0,267 -0,512
Sulteng -1,000 Sulsel 0,810 -1,000 1,039 10,656 Sultara
Gorontalo 13,112 Sulbar -0,049 Maluku Malut
Papbar -1,000 Papua -0,994 20.860 197,392
Indonesia -0,340 0,165 0,590 -0,225 0,152
The export of coal nowadays is decreasing because the demand and price which tend to decrease so the growth of coal export share is negative. Based on calculation of Dynamic RCA, the provinces that has a largest coal export like East Kalimantan, Central Kalimantan and South Sumatera still have competitiveness (RCA positive) i.e. in Falling Star position. The result of products from textile industry are a major commodities of provinces located in Java Land. Textile product from Indonesia more in demand in international market so the value of Indonesia textile product export tend to increase and growth of export shares also positive.

Rosita/SIJDEB, 1(3), 2017, 277-296
293
CONCLUSION The performance of provinces export to the regional economy of its rating varies. A provinces that are able to achieve IPER greater than 1 only 11 provinces or 33.3 percent from all provinces, th rest 66.7 percent less than 1. In the other word only a small part from provinces that can show good performance in exports development. According to the result of cointegration test there is long-term relationship between GRDP variable, exports, and GFCF. In long-term and short-term, exports and GFCF have a positive effect to the GRDP. It means the increase of exports and GFCF will increase GRDP in other words will occur economic growth. The result of competitiveness analysis with RCA Dynamic shows export competitiveness by provinces not always follow the growth of national export shares. For rubber and coal commodities despite the decline of export shares, but there are provinces which still have a competitiveness to those commodities by positive RCA Dynamic value. Otherwise, palm oil, coffee, and textile although the export shares increase but still there are provinces exporter which don’t have a competitiveness (Negative RCA Dynamic). Suggestion The provinces with low export performance especially with low export value should begin to develop the potentials in their area especially which can be export-oriented because the exports enhancement will give Multiplier effect to the other economy activities so can increase the welfare of their population. For provinces that still rely on exports of agricultural and mining products, it need diversification and specialization of export products that is supported by government policies in the development of export-based industrial zones especially outside Java Island. The industry of textile, footwear, and jewelry are the commodities on the rise demand so it can become development priority. Moreover, the promotion of exports need to be increased so that Indonesian exports don’t depend on certain countries. The government policy in increasing capital formation/investment both by private and government should continue to be activated. The government has issued a number of policies that support investment policy and large and equally infrastructure development. The government should also create a stable political and secure conditions to attract investor trust to Indonesia. Furthermore, the government should try to reduce the possibility of authority abuse or corruption especially in infrastructure development. Need further research development by adding the amount of variable and time. A deep regional analysis can be done for the next research. Besides that, the commodities addition to competitiveness analysis so more illustrates the competitiveness of export commodities Indonesia.

Rosita/SIJDEB, 1(3), 2017, 277-296
294
REFERENCES Badan Pusat Statistik. 2017. Produk Domestik Regional Bruto Indonesia
Menurut Pengeluaran 2012-2017 (Indonesian Gross Regional Domestic Product Based on Expenditure 2012-2017). Badan Pusat Statistik, Jakarta
___________________. 2017. Statistik Perdagangan Luar Negeri Indonesia 2016 (The Statistics of International Trade in Indonesia 2016). Badan Pusat Statistik, Jakarta
___________________. 2016. Produk Domestik Regional Bruto Provinsi-Provinsi di Indonesia Menurut Pengeluaran, 2011-2015 (Gross Regional Domestic Product of Provinces in Indonesia). Badan Pusat Statistik, Jakarta.
Bustami, Budi Ramanda & Paidi Hidayat. 2013. Analisis Daya Saing Produk Ekspor Provinsi Sumatera Utara (The Analysis of Exports Product Competitiveness). Jurnal Ekonomi dan Keuangan, Vol. 1, No. 2, Januari 2013
Dreger, Christian and Yanqun Zhang. 2013. On the relevance of Exports for Regional Output Growth in China. Journal of Applied Economic (Volume. 46, 2014, Issue 35)
Edwards and Schoer. 2001. The Structure and Competitiveness of South African Trade, Trade and Industrial Policy Strategy. 2001 Annual Forum, Muldersdrift. University of Capetown.
Kusdiana, Dikdik & Candra Wulan. 2007. Analisis Daya Saing Ekspor Sektor Unggulan Di Jawa Barat (The Analysis of Exports Competitiveness on Superior Sector In West Java). Jurnal Trikonomika Volume 6 No. 1. Fakultas Ekonomi UNPAS. Bandung.
Lorde, T. 2011., Export-led Growth: A Case Study of Mexico, International Journal of Business, Humanity and Technology, Vol. 1 No. 1

Rosita/SIJDEB, 1(3), 2017, 277-296
295
Safari, Menik Fitriani dan Aula Ahmad Hafidh. 2016. Analisis Pengaruh Ekspor, Pembentukan Modal, dan Pengeluaran Pemerintah terhadap Pertumbuhan Ekonomi Indonesia (The Analysis of Exports Effect, Capital Formation, and Government Expenditure to the Economic Growth in Indonesia). Prosiding Seminar Nasional, Fk. Ekonomi UNY.
Sukirno, Sadono, 1994. Pengantar Teori Ekonomi Makro. Raja Grafindo Persada : Jakarta
Pedroni P. 2000. Fully Modified OLS for Heterogenous Cointegrated Panels. Nonstationary Panels, Panel Cointegration and Dynamic Panels. Emerald Group Publishing Limited, Volume 15, pages 93–130.
Ramly, Fahrudin. 2013. Peringkat Propinsi dalam Pengembangan Ekspor (Metode Regional Export Performance Index atau REPI) (The Provincial Rankings in Exports Development (REPI Method)). Jurnal Ekonomi Cita Ekonomika, Volume VII, No. 2, Desember 2013. Universitas Pattimura Ambon.
Salvatore, Dominick. 1997. Ekonomi Internasional (International Economy). Jakarta : Erlangga
Tarigan, Robinson. 2003. Ekonomi Regional: Teori dan Aplikasi (Regional Economy: Theory and Application). Bumi Aksara. Jakarta
Todaro, MP. 2003. Pembangunan Ekonomi di Dunia Ke Tiga (The Economic Development in the Third World), Jilid 2. Erlangga, Jakarta
Widyasanti, Amalia A. 2010. Perdagangan Bebas Regional dan Daya Saing Ekspor: Kasus Indonesia (Regional Free Trade and Export Competitiveness: Indonesia Case). Buletin Ekonomi Moneter dan Perbankan, Juli 2010.

Rosita/SIJDEB, 1(3), 2017, 277-296
296