Embed Size (px)
Citation preview
1
Analysis of Water Balance and Aridity Index to Detect the Effect of Global Warming in Catchment and Irrigation Area of Jatiluhur Dam
Budi Harsoyo1, Nora H.Pandjaitan2, Dwi Putro Tejo Baskoro3
1Researcher working for The Weather Modification Technology Center, Agency for Assesment and Application of Technology, Indonesia; BPPT Building 1, 19th Floor, MH. Thamrin Street No. 8, Jakarta – Indonesia; email : [email protected] ; 2Lecturer in Civil and Environmental Engineering Major, Bogor Agricultural University; 3Lecturer in Regional Planning Science Major, Bogor Agricultural University
Introduction
The Citarum Catchment Area (CA) with the three cascading dam within it, i.e. The Saguling, Cirata and Jatiluhur dams, has a very strategic role. According to The Jasa Tirta II Public Company (PJT II) as The Caretaker of Jatiluhur Dam which according to Government Regulation No. 94/1999 is appointed as the institution responsible in the water resources management in The Citarum CA, Citarum river flow is utilized to fullfill various water demands in the downstream area with water provision priority as follows, for drinking and households purposes, environmental sanitations, irrigation water needs, electrical plant purposes and industrial demands. In matters of irrigational water needs, Jatiluhur dam provides water supply for farming area with the size of 264.000 hectar acres which are rice crops production centers in the north coast area of West Java.
Therefore with its various vital roles, The Citarum CA needed to be well-managed in order to keep the water provision balanced for the entire year. The Citarum CA water resources potential needed to be determined by way of The Water Balance approach which output could best describe The Citarum CA support rate from the water availability/potential point of view in the upstream area to provide provisions for various needs in the downstream area.
Climate change as a result of global warming had caused an indeterminate seasonal patterns. The length of wet and dry season are no longer balanced and even the timing could not be estimated with great precision. According to Idrus and Mayasari (2008) during dry season, most farming areas along the north coast of West Java often experience draught. Based on those facts, examinations are needed on draught level evident in the north coast areas of West Java which are farming irrigation areas downstream of The Citarum CA by conducting aridity index calculation.
The purpose of this research is to analyze water balance and aridity index in Jatiluhur Dam Water Catchment Area and its irrigational areas in the north coast of West Java while at the same time identified and mapped areas which needs irrigational water supply priorities in Jatiluhur irrigational farming areas in the north coast areas of West Java.
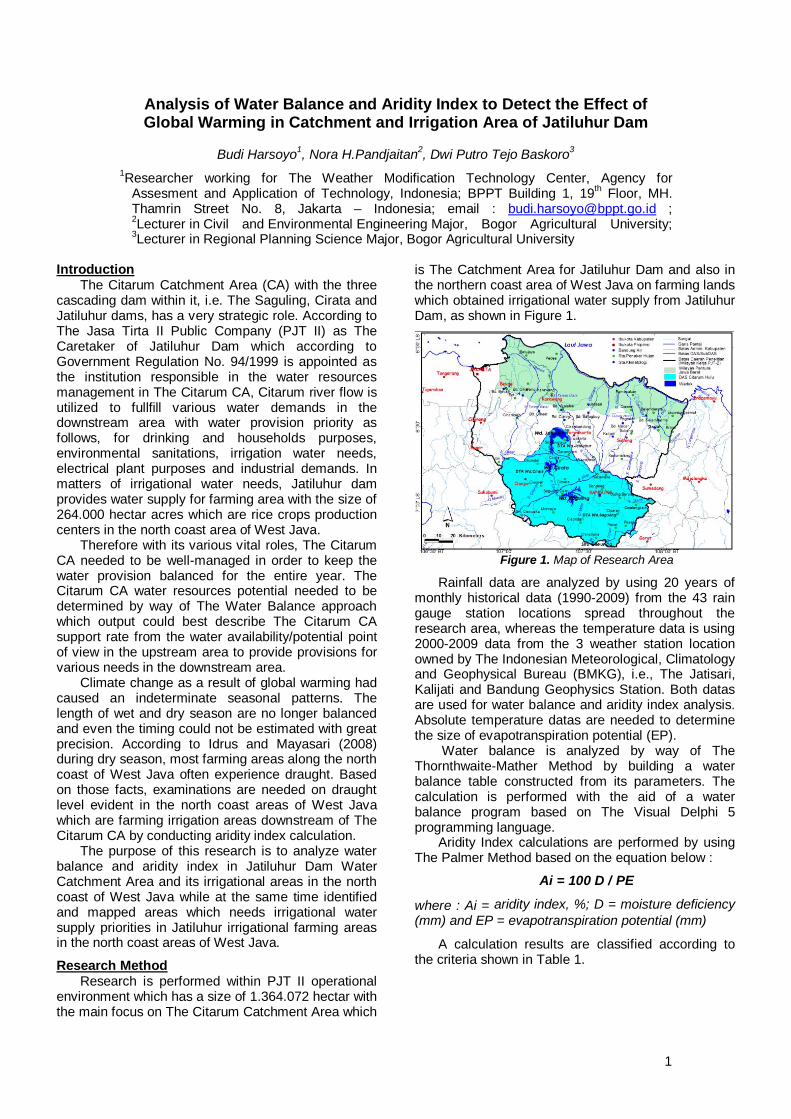
Research Method Research is performed within PJT II operational
environment which has a size of 1.364.072 hectar with the main focus on The Citarum Catchment Area which
is The Catchment Area for Jatiluhur Dam and also in the northern coast area of West Java on farming lands which obtained irrigational water supply from Jatiluhur Dam, as shown in Figure 1.
Figure 1. Map of Research Area
Rainfall data are analyzed by using 20 years of monthly historical data (1990-2009) from the 43 rain gauge station locations spread throughout the research area, whereas the temperature data is using 2000-2009 data from the 3 weather station location owned by The Indonesian Meteorological, Climatology and Geophysical Bureau (BMKG), i.e., The Jatisari, Kalijati and Bandung Geophysics Station. Both datas are used for water balance and aridity index analysis. Absolute temperature datas are needed to determine the size of evapotranspiration potential (EP).
Water balance is analyzed by way of The Thornthwaite-Mather Method by building a water balance table constructed from its parameters. The calculation is performed with the aid of a water balance program based on The Visual Delphi 5 programming language.
Aridity Index calculations are performed by using The Palmer Method based on the equation below :
Ai = 100 D / PE
where : Ai = aridity index, %; D = moisture deficiency (mm) and EP = evapotranspiration potential (mm)
A calculation results are classified according to the criteria shown in Table 1.

2
Table 1. Aridity Index Categories Aridity Index (%) Criterias
< 16,7 16,7 - 33,3
> 33,3
Draught does not occurs Medium draught Heavy draught
Ref: Sudibyakto, et al (1999)
Spatial analysis with Geographical Information System using the Arcview program version 3.3 was performed to give descriptions on spatial distributions of rainfall conditions, land water balance and aridity index in the research area. From each of those parameters, thematic maps were then made in monthly or total yearly period. Next, those three thematic maps were then overlaid upon each other in order to identify priority areas for irrigation water provision, from the hydro-climatology point of view.
Research Area Rainfall Condition Rainfall condition in The Citarum Catchment Area
and The Northern Coast Area of West Java in the last 20 years (1990-2009) are depicted in figure 2 and 3. Figure 2 depicted monthly rainfall time series in both research areas, whilst figure 3 depicts the sum of yearly rainfall accumulation. From either figures, there are no indications of rainfall decrease either in The Citarum CA or those of the northern coast. Even if we observe at the regressional analysis results in order to deduce the rainfall trends, there is a tendency that rainfall conditions in the last 10 years (2000-2009) tend to be higher compared with the conditions from the first 10 years (1990-1999). This proves that rainfall condition in The Citarum CA or in the northern coast were not influenced by global warming effects if seen from the sum of its yearly rainfall.
Figure 2. Research Area Monthly Rainfall Time Series
Graph from 1990-2009
Figure 3. Research Area Yearly Rainfall Histogram from
1990-2009 For the last two decades, the lowest rainfall
intensities in the northern coast area happened in 1997 (754 mm/year), whereas the highest would be in 2002 (1.703 mm/year), For The Citarum CA, the
lowest rainfall intensity happened in 1991 (1287 mm/year). whereas the highest occur in 1998 (2.457 mm/year).
Based on the records of years of El Nino and La Nina events, the year 1991 and 1997 were El Nino years whereas 1998 and 2002 were the La Nina years, so it could be said that rainfall in The Citarum CA or the northern coast were influenced by The ENSO phenomenon.
Figure 4. Research Area Rainfall Pattern
Figure 4 depicts rainfall pattern in research area which has monsoonal pattern, rainfall peak in The Citarum CA occurs on December (243 mm) and March (242 mm), whilst the lowest occurs on August (41 mm). For northern coast area, highest rainfall occurs on February (315 mm) and lowest on August (15 mm). Except in January and February, on the whole rainfall in The Citarum CA was higher than those of the northern coast area. Rainy season in The Citarum CA happened during the period from November to April (6 months) whilst dry season occurs during the period from May to October (6 months). For the northern coast, dry season is longer than the wet season. New rainy season period last during the month of December to March (4 months), while the period from April to November (8 months) is the dry season.
Figure 4. Research Area Yearly Historical Isohyet Map
Total yearly rainfall average in The Citarum CA was 1.856 mm/year. The Sindanglaya area, which was situated in the proximity of Jatiluhur Dam was the location with the highest yearly rainfall in The Citarum CA (3.061 mm/year), whilst the lowest was in the Cicalengka Area (1.257 mm/year). For the northern coast area, its total yearly rainfall average is 1.408

3
mm/year, the highest of which was located in Bendung Cikarang (1.708 mm/year) and lowest in Pamanukan (1.098 mm/year).
Research Area Water Balance Averages of each water balance parameters in
the research area as the results of running The Visual Delphi Programme is depicted in Table 2 and 3. Based on the rainfall sum difference (P) and evapotranspiration potential (EP), in general, The Citarum CA still experience yearly water surplus, due to the sum of P larger than EP. This is different with the northern coast area which has yearly water deficit, due to the sum of PE that is larger than P. From as much as 1.856 mm entire year total rainfall occuring in The Citarum CA, as much as 1.093 mm (58,9%) evaporates through evapotranspirations. This means that rain water surplus totalling 723 mm (31,1%) could be counted as dirrect runoff, either as surface runoff or as groundwater. For the northern area, from the total entire year rainfall as much as 1.421 mm, 1.136 mm (80,7%) of it evaporates through evapotranspi-rations and rain water surplus which has the sum of 272 mm (19,3%) could be counted as dirrect runoff.
Water deficit condition in The Citarum CA only occurs as long as 4 months (June to September), whilst to the months beside those, there are water surplus. Averages of all year water surplus total in The Citarum CA is 708 mm. With area size of 464.702, 66 hectar acres then the water surplus total in The Citarum CA is as large as 3.287,9 million m3/tahun.
For the northern coast area, with the exception of surplus in January up to March, in the next period, this area experience water deficit condition. Averages of all year total water deficit in the northern coast area is as large as -377 mm. With an area size of 372.460,23 hectar acreas then the total water deficit in that area would be 1.404,2 million m3/year.
Figure 5. Map of the difference between Rainfall (P) and Evapotranspiration Potential (PE) Yearly Historical in the
research area Research Area Aridity Index
On yearly average, The Citarum CA does not experience draught, although draught happened in July, August and September, it is still in the category of medium draught (16,7–33,3%). Draught peak in The Citarum CA happened in September (31,5%),
and on the periods of November to April there is not even one location inside the CA experiencing draught. The highest draught potential in The Citarum CA is located in The Cicalengka Area (23,3%), while The Cikole area never experienced draught condition all year round. Area averages for yearly historical aridity index value in The Citarum CA was arithmetically counted to be 7,4% (draught does not occur).
Figure 6. Map of The Research Area Yearly Historical
Aridity Index
Draught in the northern coast area happened as long as 7 months, i.e. on the period of May to November. The month of May (26,9%) and November (20,4%) is categorized into the medium draught period, whilst the period of months from June to October is categorized into heavy draught period (>33,3%). Draught peak occurs in the month of August with an index value reaching 88,0%. The only months where not even one location in the northern coast experience draught was on the month of February. Locations present in the shores of northern coast (Pedes, Pamanukan, Batujaya and Ciasem( were areas which experience the most severe draught with indexes up to 40% in value. The more south away from the beach, the less the draught intensity would be. Area averages for yearly historical draught index value in the northern coast area, arithmetically is 35,6% (heavy draught)> Draught condition in the research area is depicted quantitatively in Figure 7.
Figure 7. The Research Area Aridity Index Histogram

4
Determination of Priority Area for Irrigational Water Provision
Priority map of irrigational water provision on a farm block in The Jatiluhur irrigational area as a result of cross-matching between isohyet, water balance and aridity index map is depicted in figure 8. Analysis results suggested that northern areas needed to be prioritized for irrigational water supply purposes, as by the climatological pattern in the northern coast area which rainfall decreases as it move to the coastal area.
Figure 8. Priority Map for Irrigational Water Provision on
The Farming Block in The Jatiluhur Irrigational Area.
Conclusion 1. Regressional analysis results of the rainfall data
does not indicate any rainfall decrease either in The Citarum Upstream CA or in The northern coast area, there is even a tendency that rainfall condition in the last 10 years (2000-2009) tend to be higher compared to conditions in the first 10 years (1990-1999). This proves that rainfall conditions in The Citarum Upstream CA or The northern coast area does not influenced by the effects of global warming judging from the sum of their yearly rainfall.
2. Dry season period in the northern coast area is longer than its wet season. Rainy season occurs from the month of December to March (4 months), whilst the dry period last from April to November (8 months).
3. Lands in the northern coast areas experiences water deficit all year round due to its evapotranspiration potential being larger than the sum of its rainfall. Surplus condition only occurs for 3 months, i.e. from January to March, whereas from April to December (9 months) lands in The area experience water deficit condition.
4. Spatially, almost all area in the northern coast experience draught in heavy category all year round, with the exceptions of few locations in the southern part in the proximity of hilly topography which are in the medium draught category. Further north to the coastal areas, the higher the aridity index is, Heavy draught in the northern
coast area lasted for 5 months, from June to October, with the peak occuring in August.
REFERENCES Harsoyo, B, Widodo, FH, Syaifullah, D, Nuryanto, S
dan Sutrisno. 2007. Permodelan Hidro-Meteorologi Untuk Perhitungan Neraca Air di DAS Larona Menggunakan Metode Thornthwaite – Mather. Science and Weather Modification Technology Journal. Vol. 8, No. 1, June 2007. The Deputies of Natural Resources Development Technology, Agency for The Assessment and Application of Technology. Jakarta.
Idrus, H dan Mayasari, R. 2008. Pengalaman Teknologi Modifikasi Cuaca (TMC) di Wilayah Sungai Citarum. One Day Seminar Paper in Celebrating The 30th Year of The Founding of The Agency for Assessment and Application of Technology (BPPT). Weather Modification Technology Center, BPPT. Jakarta.
Meyers, G, McIntosh, P, Pigot, L, and Pook, M. 2007. The Years of El Niño, La Niña, and Interactions with the Tropical Indian Ocean. Journal of Climate Volume 20. American Meteorological Society. Washington DC.
Sudibyakto, 1985. Evaluasi Kekeringan Dengan Menggunakan Indeks Palmer di Daerah Kedu Selatan, Jawa Tengah. Postgraduate Thesis (S2) Postgraduate Faculty, The Bogor Agricultural Institute, Bogor.
Sudibyakto, Suyono, dan Kirono, DGC. 1999. Analisis Curah Hujan Untuk Antisipasi Kekeringan dan Mitigasinya di Daerah Aliran Sungai Progo. Majalah Geografi Indonesia, Th.13, No.23, Maret 1999., Faculty of Geography, Gajah Mada University, Yogyakarta.