Embed Size (px)
Citation preview

Pattern Recognition Letters 32 (2011) 1998–2008
Contents lists available at SciVerse ScienceDirect
Pattern Recognition Letters
journal homepage: www.elsevier .com/locate /patrec
Analysis of variance of Gabor filter banks parameters for optimal face recognition
Ángel Serrano ⇑, Isaac Martín de Diego, Cristina Conde, Enrique CabelloFace Recognition and Artificial Vision Group, Universidad Rey Juan Carlos, C/ Tulipán s/n, Móstoles, Madrid E-28933, Spain
a r t i c l e i n f o a b s t r a c t
Article history:Received 22 March 2010Available online 16 September 2011Communicated by S. Sarkar
Keywords:Gabor waveletFace recognitionAnalysis of varianceFace databaseFilter bank
0167-8655/$ - see front matter � 2011 Elsevier B.V. Adoi:10.1016/j.patrec.2011.09.013
⇑ Corresponding author. Tel.: +34 914888122; fax:E-mail address: [email protected] (Á. Serrano)URL: http://www.frav.es (Á. Serrano).
Gabor filter banks constitute a very robust tool to extract discriminant information from a visual scene.After the now ‘‘classical’’ bank with 5 frequencies and 8 orientations proposed by Lades et al. and Wiskottet al., many other parametrizations of a Gabor filter bank have appeared. In order to find the optimalparametrization for a face recognition experiment, we have performed a 6-way analysis of variance ofGabor parameters using FERET, FRAV2D, FRAV3D, FRGC and XM2VTS face databases, including frontaland turned poses, facial expressions, occlusions and changes of illumination. Considering independentcriteria to find the optimal Gabor filter bank, the bank with the highest recognition rate was found tohave 6 frequencies and narrower Gaussian widths in the space domain. These results were obtained withMahalanobis distance for a k-NN classifier, with analytical and holistic Gabor feature vectors. Moreoverabout 20% of the banks studied here obtained in average a better performance than the classical bank. Formost of the databases considered, the highest recognition rates have been achieved with analytical rep-resentations (frontal images, images with turns or occlusions), with a holistic preponderance for imageswith gestures or changes of illumination. The inferiority found for holistic Gabor representations versustheir analytical counterparts can be explained for the intrinsic redundancy and the size of the feature vec-tors of this kind of representation.
� 2011 Elsevier B.V. All rights reserved.
1. Introduction
Face biometrics is a very active research field which encom-passes topics on computer vision and pattern recognition, withmany applications in access controls, law reinforcement, surveil-lance, ID smart cards, among others (Zhao et al., 2003). However,despite this is an easy task for humans, it remains an open problemdue to the enormous complexity and variability of faces comparedto other biometrics. For example, face appearance is greatlyinfluenced by the pose angle with respect to the viewer or thecamera, the illumination direction (which can cast shadows onthe face with a dramatic effect), facial expressions (specially thoseinvolving the mouth, which is a very deformable object), the imageresolution, occlusions of parts of the face, and the presence andstyle of hair, among other factors (Chellappa et al., 2010). Thereforeface biometrics poses a very complete challenge, whose study andanalysis will allow us to extract information as general as possiblefor any object recognition problem.
Of the many pattern recognition based methods available in theliterature, Gabor wavelets have recently experienced an importantoutburst, specially in face biometrics (Shen and Bai, 2006; Serranoet al., 2010). Defined as a plane wave enveloped by a Gaussian
ll rights reserved.
+34 914888530..
function, they are able to extract features in a visual scene corre-sponding to a certain spatial frequency and orientation with a con-volution operation. According to Kamarainen et al. (2002), thegeneral definition of a Gabor wavelet is:
w ¼ f 20
prxryexp �f 2
0x2
r
r2xþ y2
r
r2y
!" #expð2pif0xr þ i/Þ; ð1Þ
where f0 stands for the frequency of the plane wave, rx and ry
define the widths of the Gaussian envelope along X and Y axes,xr = (x � x0)cosh + (y � y0)sinh, yr = �(x � x0)sinh + (y � y0)cosh, x0
and y0 define the position of the wavelet, h is the anti-clockwiseangle between the direction of propagation of the plane wave andthe X axis, and / is an offset of the wave plane.
It is usual to apply several Gabor filters with different orienta-tions and frequencies in order to extract the most significantfeatures in an image. A filter bank is built by keeping rx, ry and/ constant and by letting f0 and h take discrete values within acertain range. The frequencies are completely specified by indicat-ing: the maximum frequency (fmax), limited by Nyquist–Shannon(0.5 pixel�1), the ratio between consecutive frequencies (fratio),and the amount of frequencies (fn). Valid orientations are usuallyspread out between 0 and p radians on a stepwise basis, so onlythe number of orientations is needed (hn). The exact value of / isirrelevant, as the magnitude operation cancels out its influence,so this factor will not be taken into account. Six parameters specifya Gabor filter bank completely, comprising fn � hn filters per bank.

Fig. 1. Top: Mean frontal faces (from left to right: FERET, FRAV2D, FRAV3D, FRGCand XM2VTS). Centre: Mean faces with changes of illumination (from left to right:FRAV2D, left-lit face from XM2VTS and right-lit face from XM2VTS). Bottom: Meanfaces with 15�-turns, 30�-turns, gestures or occlusions (FRAV2D).
Á. Serrano et al. / Pattern Recognition Letters 32 (2011) 1998–2008 1999
One of the most popular Gabor filter banks is that of Lades et al.(1993) and Wiskott et al. (1997), which we shall refer to as the‘‘classical bank’’, characterized by 5 frequencies and 8 orientations.Other parameters include fmax = 0.25 pixel�1, fratio ¼
ffiffiffi2p
,r � rx ¼ ry ¼
ffiffiffi2p
, and / = 0 radians. However many authors usetheir own parametrization (Shen and Bai, 2006; Serrano et al.,2010), making the comparison of results difficult.
Previous works have already tackled the problem of Gaborparametrization and its influence in a recognition task. Kalocsaiet al. (1998) used an analytical face representation with Gaborcoefficients computed over 48 facial features. They performed a1-way analysis of variance (ANOVA) and looked for the mostdiscriminant combination of frequency and orientation for facialfeature detection. Bianconi and Fernández (2007) carried out a5-way ANOVA for texture classification, where the most significantparameters were found to be fratio, rx and ry. Thornton et al. (2007)made a similar study on the most adequate Gabor representationsfor an iris recognition problem.
Ashraful Amin and Yan (2009) made an empirical study of theperformance of the classical bank with 5 frequencies and 8 orien-tations for face recognition and applied several fusion methods,such as the concatenation and/or the summation of the Gaborchannels. The summation is faster than the concatenation, as it isprecalculated (the sum of the convolutions of an image with the fil-ter bank is the convolution with the sum of the filters in the bank),with only a slight penalty in the recognition rate (97.7% for thesummation versus 98.1% corresponding to the usual holistic useof the classical bank, see below). These results were obtained witha face database with 30 subjects.
Our goal is to find whether the classical bank is statisticallyoptimal for face recognition, or whether alternative banks achievebetter results. In order to elucidate this hypothesis, we have per-formed an analysis of variance of the recognition rate obtainedby changing the six parameters that specify a Gabor filter bank,considering five independent face databases: FERET (Phillipset al., 2000), FRAV2D (Serrano et al., 2007), FRAV3D (Conde et al.,2006), FRGC (Chang et al., 2003) and XM2VTS (Messer et al.,1999). Not only frontal images have been considered, but alsoimages with turns, gestures, occlusions and changes of illumina-tion. Each experiment has been performed by considering an ana-lytical (local or feature-based) representation, with Gaborcoefficients computed on specific landmarks, and a holistic (global)representation, where the facial information is processed as awhole (Lam and Yan, 1998; Shen and Bai, 2006; Bicego et al.,2007; Serrano et al., 2010). To match the training and test images,we have considered a k-NN classifier with up to six different defi-nitions of distance (L1, L2, L1, Mahalanobis, cosine and correlation).We shall present our results as a function of the correspondingdatabase, test set, Gabor filter bank, Gabor representation and dis-tance metrics.
Biometric systems can be divided into several stages, includingfeature extraction, classification and decision (Jain et al., 2004). Thework presented here focuses on the feature extraction process byanalysing several Gabor filter banks. For the dimensionality reduc-tion and the classification steps, we have relied on well-establishedmethods in the literature, such as Principal Component Analysis(PCA) (Turk and Pentland, 1991) and k-NN, respectively.
As main contribution of this paper, we shall show that the rec-ognition rates obtained by the classical bank can be improved byincluding an extra frequency, keeping the usual 8 orientationsand reducing the Gaussian widths rx and ry. These results areindependent of the face database used and the Gabor representa-tion (analytical/holistic) considered. Although the methodpresented here has been applied to a face recognition scenario, itis a general approach that could be generalized to any patternrecognition problem, including texture, character or iris
recognition. However we have chosen face recognition as it is avery user-friendly technique, which makes it powerful comparedto other reliable biometrics such as fingerprint or iris recognition(Zhao et al., 2003).
The rest of this paper is organized as follows. Section 2 detailsthe experiment design. Section 3 provides our results, with a dis-cussion in Section 4. Finally our conclusions can be found in Sec-tion 5.
2. Experiment design
2.1. Face databases
We have chosen 5 face databases for our experiments: FERET,FRAV2D, FRAV3D, FRGC, XM2VTS (Fig. 1), which jointly take intoaccount the face variability mentioned at the beginning of thispaper (pose angle, illumination, gestures, image resolution, occlu-sions). The same normalization process has been applied to allthe images, including face tilt correction, resizing and croppingto a standard 128 � 128 size, greyscale conversion, histogramequalization and manual facial feature detection.
We have considered a subset of the so-called ‘‘fa’’ and ‘‘fb’’ setsof FERET database (Phillips et al., 2000), with frontal images of 378subjects, each with 4 images. FRAV2D database (Serrano et al.,2007) contains 32 images of 109 subjects, including frontal views(12), 15�-turns (4), 30�-turns (4), gestures (4), occlusions (4) andchanges of illumination (4). FRAV3D database (Conde et al.,2006) provides both 2D and 3D meshes of 106 subjects withseveral poses (not the same subjects as FRAV2D). We have onlyconsidered the 2D subset with frontal views (4 images per subject).Regarding FRGC database, we used a subset of the so-called‘‘Collection D’’ of the University of Notre Dame biometric dataset(Chang et al., 2003), with 86 subjects who have at least 5 images.Finally, XM2VTS database (Messer et al., 1999) contains 295subjects with 8 frontal images per subject with diffuse illumination(CDS001 and CDS006 sets) and 4 extra images with lateralillumination (CDS008 set).
2.2. Database partitioning
For every subject in a database, 50% of his/her frontal imageshave been randomly selected for training (gallery images) andthe remainder images have been used for tests (probe images),Table 1. A unique test set with frontal images was considered forFERET, FRAV3D and FRGC databases, while multiple test sets were
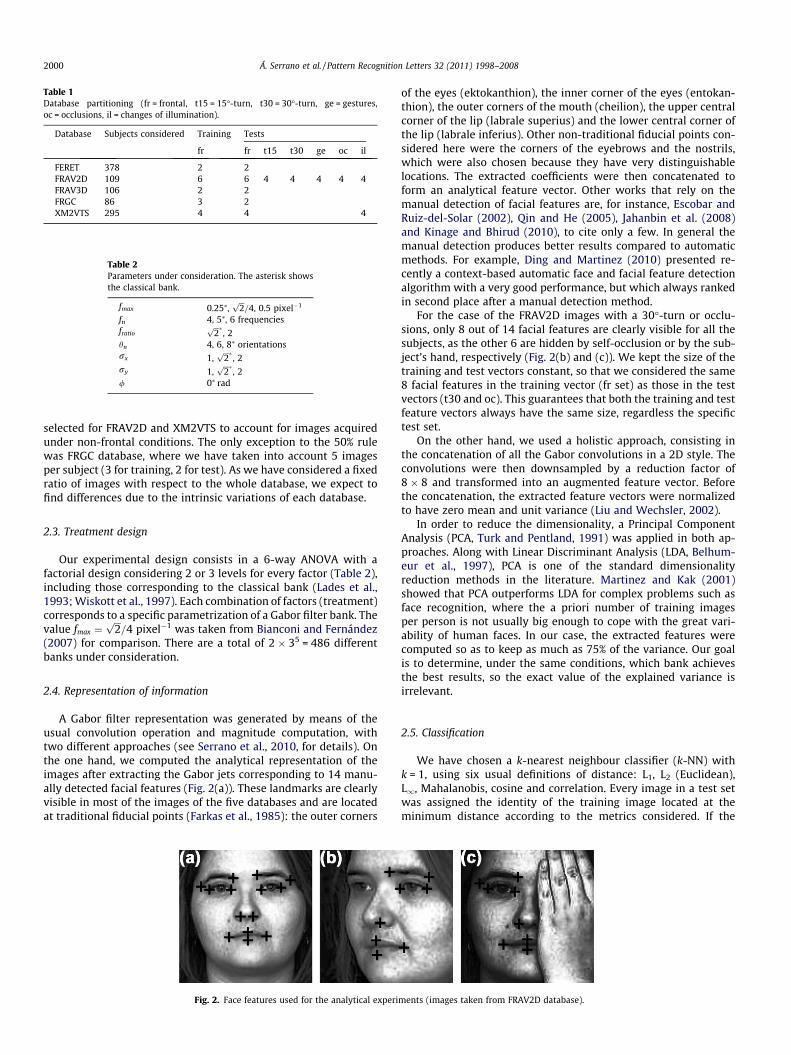
Table 1Database partitioning (fr = frontal, t15 = 15�-turn, t30 = 30�-turn, ge = gestures,oc = occlusions, il = changes of illumination).
Database Subjects considered Training Tests
fr fr t15 t30 ge oc il
FERET 378 2 2FRAV2D 109 6 6 4 4 4 4 4FRAV3D 106 2 2FRGC 86 3 2XM2VTS 295 4 4 4
Table 2Parameters under consideration. The asterisk showsthe classical bank.
fmax 0.25⁄,ffiffiffi2p
=4, 0.5 pixel�1
fn 4, 5⁄, 6 frequenciesfratio
ffiffiffi2p �
, 2hn 4, 6, 8⁄ orientationsrx 1,
ffiffiffi2p �
, 2ry 1,
ffiffiffi2p �
, 2/ 0⁄ rad
2000 Á. Serrano et al. / Pattern Recognition Letters 32 (2011) 1998–2008
selected for FRAV2D and XM2VTS to account for images acquiredunder non-frontal conditions. The only exception to the 50% rulewas FRGC database, where we have taken into account 5 imagesper subject (3 for training, 2 for test). As we have considered a fixedratio of images with respect to the whole database, we expect tofind differences due to the intrinsic variations of each database.
2.3. Treatment design
Our experimental design consists in a 6-way ANOVA with afactorial design considering 2 or 3 levels for every factor (Table 2),including those corresponding to the classical bank (Lades et al.,1993; Wiskott et al., 1997). Each combination of factors (treatment)corresponds to a specific parametrization of a Gabor filter bank. Thevalue fmax ¼
ffiffiffi2p
=4 pixel�1 was taken from Bianconi and Fernández(2007) for comparison. There are a total of 2 � 35 = 486 differentbanks under consideration.
2.4. Representation of information
A Gabor filter representation was generated by means of theusual convolution operation and magnitude computation, withtwo different approaches (see Serrano et al., 2010, for details). Onthe one hand, we computed the analytical representation of theimages after extracting the Gabor jets corresponding to 14 manu-ally detected facial features (Fig. 2(a)). These landmarks are clearlyvisible in most of the images of the five databases and are locatedat traditional fiducial points (Farkas et al., 1985): the outer corners
Fig. 2. Face features used for the analytical experi
of the eyes (ektokanthion), the inner corner of the eyes (entokan-thion), the outer corners of the mouth (cheilion), the upper centralcorner of the lip (labrale superius) and the lower central corner ofthe lip (labrale inferius). Other non-traditional fiducial points con-sidered here were the corners of the eyebrows and the nostrils,which were also chosen because they have very distinguishablelocations. The extracted coefficients were then concatenated toform an analytical feature vector. Other works that rely on themanual detection of facial features are, for instance, Escobar andRuiz-del-Solar (2002), Qin and He (2005), Jahanbin et al. (2008)and Kinage and Bhirud (2010), to cite only a few. In general themanual detection produces better results compared to automaticmethods. For example, Ding and Martinez (2010) presented re-cently a context-based automatic face and facial feature detectionalgorithm with a very good performance, but which always rankedin second place after a manual detection method.
For the case of the FRAV2D images with a 30�-turn or occlu-sions, only 8 out of 14 facial features are clearly visible for all thesubjects, as the other 6 are hidden by self-occlusion or by the sub-ject’s hand, respectively (Fig. 2(b) and (c)). We kept the size of thetraining and test vectors constant, so that we considered the same8 facial features in the training vector (fr set) as those in the testvectors (t30 and oc). This guarantees that both the training and testfeature vectors always have the same size, regardless the specifictest set.
On the other hand, we used a holistic approach, consisting inthe concatenation of all the Gabor convolutions in a 2D style. Theconvolutions were then downsampled by a reduction factor of8 � 8 and transformed into an augmented feature vector. Beforethe concatenation, the extracted feature vectors were normalizedto have zero mean and unit variance (Liu and Wechsler, 2002).
In order to reduce the dimensionality, a Principal ComponentAnalysis (PCA, Turk and Pentland, 1991) was applied in both ap-proaches. Along with Linear Discriminant Analysis (LDA, Belhum-eur et al., 1997), PCA is one of the standard dimensionalityreduction methods in the literature. Martinez and Kak (2001)showed that PCA outperforms LDA for complex problems such asface recognition, where the a priori number of training imagesper person is not usually big enough to cope with the great vari-ability of human faces. In our case, the extracted features werecomputed so as to keep as much as 75% of the variance. Our goalis to determine, under the same conditions, which bank achievesthe best results, so the exact value of the explained variance isirrelevant.
2.5. Classification
We have chosen a k-nearest neighbour classifier (k-NN) withk = 1, using six usual definitions of distance: L1, L2 (Euclidean),L1, Mahalanobis, cosine and correlation. Every image in a test setwas assigned the identity of the training image located at theminimum distance according to the metrics considered. If the
ments (images taken from FRAV2D database).

Table 3Average recognition rate and best distance metrics for every database and Gaborrepresentation (frontal experiment). Standard error of the mean in brackets.
Database Analytical representation Holistic representation
Recognitionrate
Bestdistance
Recognitionrate
Bestdistance
FERET 81.17% (0.24) Mahalanobis 81.16% (0.14) L1
FRAV2D 99.26% (0.04) Mahalanobis 99.26% (0.02) MahalanobisFRAV3D 98.16% (0.10) Mahalanobis 92.13% (0.25) MahalanobisFRGC 96.30% (0.14) Mahalanobis 87.3% (0.3) MahalanobisXM2VTS 90.23% (0.19) Cosine 90.69% (0.13) L1
Á. Serrano et al. / Pattern Recognition Letters 32 (2011) 1998–2008 2001
estimated identity corresponds to the real subject in the image, it isconsidered a correct recognition. Otherwise it is a misidentifi-cation. Keeping count of the successes or failures, this process is re-peated for all the test images, yielding a global recognition rate,which constitutes the response variable in our ANOVA experiment.We computed one recognition rate for every combination of data-base, test set, Gabor filter bank, Gabor representation and distancemetrics.
The rationale behind the choice of 1-NN is its simplicity, speed,and its popularity in similar works found in the literature. For in-stance, other Gabor-based face recognition papers using k-NN areDu and Ward (2009), Jing et al. (2009), Li et al. (2009) and Wuet al. (2009), to cite only a few. Other classifiers such us SupportVector Machines (SVM) (Vapnik, 1995) or Radial Basis Functions(RBF) (Buhmann, 2003) could yield better recognition rates, butthey also suffer from a greater complexity not present in k-NN. Thiswould make the analysis of our results more difficult, as we wouldhave to check if the bad performance of a specific Gabor filter bankis due to its intrinsic properties or to an inadequately trained clas-sifier or to overfitting.
3. Results
After introducing the criteria adopted for the optimal bankselection, we will present the results obtained with the frontal testsets, followed by the particularities derived from the non-frontalexperiments.
3.1. Criteria for optimal bank selection
Our face recognition experiment has been repeated with each ofthe 486 filter banks under study. In order to find the bank with thehighest performance for all the databases, Gabor representationsand test sets, we have analysed the results under different perspec-tives with the aim to obtain the most general definition for theoptimal bank. The adopted criteria are:
� ‘‘Best bank’’: It corresponds to the bank that obtains the highestrecognition rate. In an ordered ranking of banks, the best bank islocated at rank 1.� ‘‘Best main-effects bank’’: It is specified by considering the
influence on the recognition rate of only one Gabor parameterat a time (main effect) and repeating this process for the sixparameters under study. Therefore each parameter is selectedas the best level when averaging the recognition rates obtainedwith all the levels of the other factors.� ‘‘Best 5% bank’’: This is an alternative definition that consists in
analysing the parametrizations of the banks located at the top5% end in an ordered ranking of banks, which are expected tohave recurrent parameters. The most repeated values of eachparameter within this subset define the so-called best 5% bank.
These definitions are not expected to suggest exactly the sameoptimal parametrization, but we do expect some recurrences inthe values of certain parameters. We shall compare each definitionof optimal bank under two points of view: the recognition rateobtained with that bank and the rank or position in an orderedranking of banks. Bear in mind that, for example, a certain analyt-ical representation could achieve a higher recognition rate than thecorresponding holistic counterpart, but at the same time it couldbe located at a worse rank compared to the holistic representation,or vice versa.
In order to summarize all the results obtained for all the dat-abases, test sets and Gabor representations, a ‘‘global best bank’’will be obtained with a Borda count of the ranks obtained by each
bank in every experiment. This would be the most general defini-tion for the optimal parametrization, as it tries to provide a bankable to achieve the highest rank in the ranking in a regular basisfor as many situations as possible.
3.2. Frontal test sets
3.2.1. Optimal distance metricsIn order to learn which of the six distances provided the highest
recognition rate, we first averaged all the results over the whole setof 486 filter banks for every database and Gabor representation forfrontal images. The Mahalanobis distance provided the best resultsin 7 out of 10 cases (Table 3). In particular, for XM2VTS database,the holistic representation obtained in average a higher successrate than the analytical counterpart, unlike FRAV3D and FRGC.For FERET and FRAV2D, both representations ended in a tie.
From now on, for the sake of brevity only the results for thefrontal test sets obtained with the Mahalanobis distance will bepresented.
3.2.2. Gabor representation comparisonFig. 3 plots the recognition rate obtained by a bank with a holis-
tic representation versus the recognition rate obtained by the samebank in the analytical case. The straight line is the equality be-tween them both, so that the points located on the right side standfor the situation of a better analytical representation with respectto the holistic one for the same bank. For many banks, the recogni-tion rate exceeds 90% for these frontal test sets.
As a general rule for the five databases (Table 4), a majority ofcases a bank with the analytical representation obtains a higherrecognition rate than with the holistic one (FERET, FRAV2D,XM2VTS). In particular, this preponderance of analytical represen-tations is total for FRAV3D and FRGC databases (100%). This may beinduced by the intrinsic characteristics of these databases (3D laserrangefinders of the same brand, subjects with closed eyes inFRAV3D, red channel saturation-based artifacts around the eyesin FRGC), which have a negative impact in holistic face recognition.
As can be seen in the same table, there exists a positive correla-tion between the results obtained with the analytical representa-tion and those corresponding to the holistic one (the highestcorrelation coefficient was found to be 0.96 for XM2VTS database).This means that when a certain filter bank yields a high recognitionrate for an analytical representation, it also obtains good results inthe holistic case. In other words, the choice of a specific Gabor filterbank is more important than the Gabor representation (analytical/holistic). This allows us to look for the intrinsically best bank, as weshall mention below.
3.2.3. Classical bankWe found that the classical bank obtained a recognition rate
over the average (Table 5). In particular, this bank is generally sit-uated at the top 20% of the ordered ranking of banks, although itwas located at rank 9 for FRGC (holistic). For FRAV3D (analytical)

Fig. 3. Holistic vs. analytical recognition rates for the frontal test sets: (a) FERET, (b) FRAV2D, (c) FRAV3D, (d) FRGC and (e) XM2VTS. The straight line is the equality.
Table 4Percentage of analytic cases with a higher recognition rate compared with thecorresponding holistic representation, and correlation coefficient between theanalytical and holistic recognition rates for the same Gabor filter bank (frontalexperiment).
Database Analytical better thanholistic (%)
Holistic vs. analytical correlationcoefficient
FERET 53.30 0.83FRAV2D 65.64 0.47FRAV3D 100.00 0.37FRGC 100.00 0.79XM2VTS 51.65 0.96
2002 Á. Serrano et al. / Pattern Recognition Letters 32 (2011) 1998–2008
it achieved a 100% recognition rate tied with other 103 filters,obtaining an average rank of 52.5. As a general rule, for a holistic
representation, the classical bank is located at a better positionthan for an analytical representation. However, a better rank doesnot always mean a higher recognition rate, as the holistic recogni-tion rate was only found to be higher or equal to the analytical casefor FRAV2D and XM2VTS databases.
3.2.4. Best banksTable 6 shows the parametrizations corresponding to the ‘‘best
banks’’ for the frontal test sets. It can be easily seen that, for each facedatabase, the best bank has a different parametrization. Howeverthere are several recurrences. In all cases, the best bank for the ana-lytical representation achieved a higher recognition rate than thebest bank for the holistic one. An important tie was found forFRAV2D and FRAV3D databases, as certain Gabor parametrizations

Table 5Recognition rates (%) obtained by the classical bank (frontal experiment). The valuesin brackets represent the rank in the ordered ranking of banks.
FERET FRAV2D FRAV3D FRGC XM2VTS
Analytical 86.11(85)
99.54(230)
100.00(52.5)
98.84(89)
94.07(61)
Holistic 85.18(31)
99.69 (39) 97.17 (34) 95.35 (9) 94.07(31)
Table 7Significant factors for the analytical (A) and holistic (H) representations (frontalimages). The significance level is 0.001.
Factor FERET FRAV2D FRAV3D FRGC XM2VTS
A H A H A H A H A H
fmax w w w w w w w w w
fn w w w w w w w w w
fratio w w w w w w w
hn w w w w w w w w w w
rx w w w w w w w w w w
ry w w w w w w w w w w
fmax � fn w w w w w w w w w w
fmax � fratio w w w w w w w w w
fmax � hn w w w w
fmax � rx w w w
fmax � ry w
fn � fratio w w w w w w w w w
fn � hn w w w w
fn � rx w w
fn � ry w
f � h w w w w w w
Á. Serrano et al. / Pattern Recognition Letters 32 (2011) 1998–2008 2003
were found to have the same discriminant power due to the intrinsicproperties of these databases (the subjects are so different from oneanother that they are very easy to recognize).
In most cases, the optimal number of orientations (hn) is 8, likethe classical bank. However, these results suggest including anadditional frequency (fn = 6), which corresponds to banks with 48filters. For the other parameters, the most repeated values arefmax = 0.25, fratio ¼
ffiffiffi2p
, rx = 1 and ry = 1. Unlike the classical bank,these latter sigma values make Gabor wavelets narrower in thespace domain, but wider in the frequency one.
ratio n
fratio � rx w w w w w w w w
fratio � ry w w w w w w
hn � rx w w w w w w w w w
hn � ry w w w w w w w w w
rx � ry w w w w w w w
3.2.5. ANOVA results and best main-effects banksWe performed an analysis of variance (ANOVA) of the recogni-
tion rate as response variable and the 6 parameters that define thefilter bank. Table 7 shows that, except for few cases, all the maineffects (the 6 factors considered independently) are statisticallysignificant, unlike Bianconi and Fernández (2007), who only foundfratio, rx and ry for their texture images. Then the specific choice ofall these factors has an impact on the recognition rate. This has ledus to the definition of the so-called ‘‘best main-effects bank’’, cor-responding to the best level of each factor when averaging the re-sults obtained with all the levels of the other factors. As a generalrule, banks with 6 frequencies (fn), 8 orientations (hn) and narrowfilters (rx = ry = 1) are preferred with this definition of best bank.
With respect to the mutual interaction between pairs of factors,the three frequency-related parameters (fmax, fn, fratio) show mutualinteractions, as they define the range of frequencies surveyed bythe filter bank in the Fourier domain. There are also importantinteractions of fratio with rx, hn and ry, as well as between hn, rx
and ry. The interaction between the two sigmas is interesting asthese parameters define the width of each filter in the space do-main and therefore they have influence on the overlapping be-tween adjacent filters in the Fourier space.
As a general rule, the best main-effects banks for each databasehave obtained better recognition rates and better ranks for theanalytical case. In four situations (FERET-analytical,
Table 6Parametrization of the best banks for the analytical and holistic representations for the fr
Representation Factor FERET FRAV2D
Analytical fmax 0.25 75 banks have a tie as best banfn 5fratio 2
hn 8rx 1
ryffiffiffi2p
% 89.95 100.00
Holistic fmax 0.25 11 banks have a tie as best ban
fn 6fratio
ffiffiffi2p
hn 8rx
ffiffiffi2p
ry 1
% 87.43 99.85
FRGC-analytical, XM2VTS-analytical and XM2VTS-holistic), it is sit-uated within the top 5% of the ordered ranking of banks. Averagingall frontal test sets, its mean rank was found to be 48, which lieswithin the top 10% end of the ranking.
3.2.6. Best 5% banksConsidering the ordered ranking of 486 banks, there are 24
banks at the top 5% end of the ranking. With the ‘‘best 5% bank’’definition mentioned above, we found that the most repeatedparameters define again 8 orientations (hn) and 6 frequencies (fn).For rx and ry, almost all holistic cases use a value of 1, althoughthe analytical counterparts are divided between 1 and
ffiffiffi2p
. Amajority of cases has fmax = 0.25, while fratio is very variable anddependent on the database.
As a general rule, for each database the best 5% banks obtained abetter recognition rate for the analytical representation, but abetter rank for the holistic case. Averaging for all frontal test sets,the mean rank of the best 5% bank was found to be 20, slightlybetter than the best-main effects bank (48).
ontal test sets, with the corresponding recognition rates (%).
FRAV3D FRGC XM2VTS
ks 104 banks have a tie as best banks 0.25 0.255 6ffiffiffi
2p ffiffiffi
2p
6 8ffiffiffi2p
1ffiffiffi2p
1
100.00 100.00 95.85
ksffiffiffi2p
/4ffiffiffi2p
/4ffiffiffi2p
/46 6 5ffiffiffi
2p ffiffiffi
2p
2
6 8 81 1 1
1 1 1
98.11 96.51 95.09

Table 8Average recognition rate and best distance metrics for non-frontal images (t15 = 15�-turn, t30 = 30�-turn, ge = gestures, oc = occlusions, il = changes of illumination). Thestandard error of the mean appears in brackets.
Database Testset
Analytical representation Holistic representation
Recognitionrate
Bestdistance
Recognitionrate
Bestdistance
FRAV2D t15 29.2% (0.4) Mahalanobis 18.12%(0.17)
Cosine
t30 7.35% (0.14) Mahalanobis 3.70% (0.05) Cosinege 57.3% (0.4) Mahalanobis 66.4% (0.3) Mahalanobisoc 23.1% (0.5) Mahalanobis 6.00% (0.09) Mahalanobisil 85.9% (0.4) Mahalanobis 93.06%
(0.10)Cosine
XM2VTS il 12.02%(0.14)
Mahalanobis 16.54%(0.20)
L1
2004 Á. Serrano et al. / Pattern Recognition Letters 32 (2011) 1998–2008
3.3. Images with non-frontal acquisition conditions
3.3.1. Optimal distance metricsAs can be seen in Table 8, the Mahalanobis distance produced
again the highest recognition rates in most cases, so only the re-sults computed with this distance will be presented for non-frontalimages. Moreover, Table 9 shows that, in average, the most ade-quate representation is the analytical one for images with turnsor occlusions, with the opposite conclusion for images with ges-tures or changes of illumination.
3.3.2. Gabor representation comparisonThe comparison of the performance of a specific bank as a func-
tion of the Gabor representation shows a severe difference againbetween degraded images (turns, occlusions) and the others(Fig. 4). The former show a preponderance of the analytical repre-sentations, as the information encoded in the facial features is kepteven when important areas are hidden. In particular, in the case ofocclusions, the analytical preponderance is overwhelming with re-spect to the holistic case. The other test sets prefer holistic repre-sentations to circumvent the difficulties imposed by a facialexpression or a change of illumination.
Moreover, there is an important difference with respect to Fig. 3(frontal test sets). When the system is tested with images withturns or occlusions, the recognition rate clearly collapses, speciallyfor 30�-turns. For occlusions, the holistic representation is not evenable to achieve a 15% recognition rate, while for some banks theanalytical one this rate exceeds 54%. For images with gestures,the holistic recognition rate borders on 80%.
Although both FRAV2D and XM2VTS databases have test setsgrouped under the name ‘‘change of illumination’’, theiracquisition conditions are very different to each other. On the
Table 9Percentage of analytic cases with a higher recognition rate compared with thecorresponding holistic representation, and correlation coefficient between theanalytical and the holistic recognition rates for the same Gabor filter bank (non-frontal images).
Database Test set Analytical betterthan holistic (%)
Holistic vs. analyticalcorrelation coefficient
FRAV2D t15 96.71 0.43t30 95.47 0.29ge 2.68 0.77oc 99.79 0.57il 17.70 0.51
XM2VTS Illumination 13.99 0.38
one hand, for FRAV2D the lighting is changed from frontal diffuseto zenithal, producing slight shadows below the eyes, the noseand the lips which do not prevent from obtaining recognition ratesabove 96%. However, the light comes sideways for XM2VTS, pro-ducing a dramatic shadow effect that reduces the recognition ratedown to the 20–30% range.
3.3.3. Classical bankThe classical bank is again located at the top 20% of the ranking
of banks, except for the XM2VTS images with change of illumina-tion for both representations and the FRAV2D images with turnsin the holistic case, where it is situated in much worse ranks(Table 10). Except for the images with turns, the classical bank ob-tains a better rank for the holistic representation, as in the case ofthe frontal test sets. In particular, for images with turns, the analyt-ical representation obtained a higher recognition rate than theholistic one, with the converse situation for the images with ges-tures or those with a different illumination. For the images withocclusions, however, the analytical representation obtained a high-er recognition rate, although the holistic one occupied a betterposition in the ranking of banks.
3.3.4. Best banksWith respect to the best banks, no tie was found at the first
position in any test set. The banks with the highest recognitionrates used an analytical representation in the case of the imageswith turns, occlusions and change of illumination (FRAV2D), witha holistic preference for the images with gestures or change of illu-mination (XM2VTS). The most repeated Gabor parameters wereagain fn = 6, rx = 1 and ry = 1, with the others equal to the classicalbank (Table 11).
3.3.5. ANOVA results and best main-effects banksThe ANOVA results also showed that in most cases there exists a
statistical significance in all the main effects for a 0.001 level(Table 12). Important interactions were found again between thefrequency parameters (fn, fmax, fratio), as well as fratio � rx, frat � hn
and fmax � rx. Other interactions include hn � rx and hn � ry.
3.3.6. Best 5% banksOur results show that the parameters of the proposed best-
main effects bank and best 5% bank are again similar to those ofthe classical bank, except for more frequencies (fn = 6) and nar-rower filters in the space domain (rx = ry = 1).
3.4. Best global banks
As a way to obtain results as general as possible, we have or-dered the filter banks as a function of their ranks for all the dat-abases and test sets. The ranks obtained by each bank have beensummed for all the experiments and then reordered as a functionof this total rank (Borda count algorithm).
For the case of the analytical representation, the best globalbank was found to have the following parametrization:fmax ¼
ffiffiffi2p
=4, fn = 5, fratio = 2, hn = 8, rx = 1 and ry = 1, while the clas-sical bank obtained a global rank of 72. For the holistic representa-tion, the best global bank was found to be fmax = 0.25, fn = 6,fratio ¼
ffiffiffi2p
, hn = 8, rx = 1, ry ¼ffiffiffi2p
, with the classical bank locatedat a global rank of 15. No difference was found when this Bordacount was applied only with the frontal test sets or including thenon-frontal test sets as well.
It is of interest that the most recurrent parametrization derivedfrom the definitions of best bank, best main-effects bank and best5% bank, this is, fmax = 0.25, fn = 6, fratio ¼
ffiffiffi2p
, hn = 8, rx = 1 andry = 1, achieved the ranks 3 and 2 for the analytical and holisticrepresentations, respectively. If the global bank is computed

Fig. 4. Holistic vs. analytical recognition rates for non-frontal test sets: (a) 15�-turns (FRAV2D), (b) 30�-turns (FRAV2D), (c) gestures (FRAV2D), (d) occlusions (FRAV2D), (e)illumination (FRAV2D) and (f) illumination (XM2VTS). The straight line is the equality. The scale is the same as in Fig. 3 to facilitate the comparison.
Á. Serrano et al. / Pattern Recognition Letters 32 (2011) 1998–2008 2005
considering both Gabor representations at the same time, this isprecisely the bank at a global rank of 1, with the classical bank atthe position 38.
4. Discussion
4.1. Classical bank
With respect to the classical bank, we have seen that, as a gen-eral rule, it is usually located at the top 20% of the ordered rankingof the 486 banks surveyed in this work (average rank 96 computedover all the databases, test sets and Gabor representations), or
within the top 8% with the global bank criterion (rank 38). We haveeven seen several cases where the classical bank sank to centralpositions of the ranking, and others where it reached a top 5%position. Although the classical bank is usually above the mean,there still exists an important margin of improvement until thebest bank, which allows us to increase the recognition rate of oursystem in an important factor with the adequate parametrization.
4.2. Optimal bank parametrization
We have used independent definitions of the ‘‘optimal bank’’(best bank, best main-effects bank, best 5% bank, global bank) fordifferent face databases and test sets, and in most cases, we found

Table 10Recognition rates (%) obtained by the classical bank for non-frontal images (t15 = 15�-turns, t30 = 30�-turns, ge = gestures, oc = occlusions, il = changes of illumination). The valuesin brackets represent the rank in the ordered ranking of banks.
FRAV2D XM2VTS
t15 t30 ge oc il il
Analytical 38.76 (69) 10.32 (86) 67.89 (67) 37.84 (60) 92.89 (131) 11.25 (282)Holistic 19.95 (168) 2.98 (382) 73.39 (38) 9.63 (22) 95.64 (35) 19.5 (113)
Table 11Parametrization of the best banks for the analytical and holistic representations for non-frontal images (t15 = 15�-turns, t30 = 30�-turns, ge = gestures, oc = occlusions,il = changes of illumination).
Representation Factor FRAV2D XM2VTS
t15 t30 ge oc il il
Analytical fmaxffiffiffi2p
=4 0.25 0.5 0.25ffiffiffi2p
=4 0.25
fn 6 6 6 6 5 6fratio
ffiffiffi2p ffiffiffi
2p
2ffiffiffi2p
2ffiffiffi2p
hn 8 8 8 8 8 6rx 1 1 1 1 1 1ry
ffiffiffi2p
1ffiffiffi2p
1ffiffiffi2p
1
% 51.48 18.81 75.00 54.59 97.94 21.50
Holistic fmax 0.25ffiffiffi2p
=4ffiffiffi2p
=4 0.25 0.25 0.5
fn 6 5 6 6 6 6fratio
ffiffiffi2p
2ffiffiffi2p ffiffiffi
2p ffiffiffi
2p
2
hn 6 4 8 6 6 6rx 1 1 1 1 2 1ry 2 1 2
ffiffiffi2p
1 1
% 25.69 8.26 77.52 11.24 96.56 31.75
Table 12Significant factors for our 6-way ANOVA for the analytical (A) and holistic (H)representations for non-frontal conditions (t15 = 15�-turns, t30 = 30�-turns, ge = ges-tures, oc = occlusions, il = changes of illumination). The significance level is 0.001.
Factor FRAV2D XM2VTS
t15 t30 ge oc il il
A H A H A H A H A H A H
fmax w w w w w w w w w w w
fn w w w w w w w w w w
fratio w w w w w w w w w w w
hn w w w w w w w w w w w
rx w w w w w w w w w w
ry w w w w w w w w w
fmax � fn w w w w w w w w w w
fmax � fratio w w w w w w w w w w w
fmax � hn w w w w
fmax � rx w w w w w
fmax � ry w w
fn � fratio w w w w w w w w w w w
fn � hn w w w
fn � rx
fn � ry w
fratio � hn w w w w w
fratio � rx w w w w w w w w w w
fratio � ry w w w w
hn � rx w w w w w w
hn � ry w w w w w w
rx � ry w w w
2006 Á. Serrano et al. / Pattern Recognition Letters 32 (2011) 1998–2008
a bank with 8 orientations and 6 frequencies. The inclusion of anextra frequency is expected to have an impact on the system per-formance, as Gabor convolutions are very time-consuming (Shenand Bai, 2006). However the improvement of the recognition rateis worth the effort, as computers are getting faster and faster. Withrespect to the narrowness of the filters in the space domain
(rx = ry = 1) compared to the classical bank, this yields a bettercovering in the Fourier domain, although it also increases the over-lapping between adjacent filters. However, as we have seen, thisredundancy has a beneficial impact on the recognition rate anddoes not influence the size of the feature representations.
Our ANOVA results show that the exact value of all the sixparameters of a Gabor filter bank have a statistically significantinfluence on the recognition rate in our experiments. The optimalvalue for each parameter computed independently defines the‘‘best main-effects bank’’, as we have seen. With respect to the mu-tual interactions between the parameters, as a general rule for alldatabases, test sets and Gabor representations we found statisticalsignificance between the parameters that contribute most to thecovering of the bank in the Fourier domain: between fmax, fn and fra-
tio. Other important interactions are fratio � rx, hn � rx and hn � ry.The values of these parameters that maximize the recognition ratewere found to be the following ones: fmax � fn = 0.25 � 6,fmax � fratio ¼ 0:25�
ffiffiffi2p
, fn � fratio ¼ 6�ffiffiffi2p
, fratio � rx = 2 � 1,hn � rx = 8 � 1 and hn � ry = 8 � 1. As can be seen, except for a dis-crepancy in the value of fratio, this optimal parametrization coin-cides with the ones estimated by the other definitions of bestbank. Due to the agreement among all these criteria, for futureworks on face recognition we suggest using the following parame-trization: fmax = 0.25, fn = 6, fratio ¼
ffiffiffi2p
, hn = 8, rx = 1, ry = 1.
4.3. Gabor representation
One of the most interesting results obtained here is the suprem-acy of the analytical Gabor representation over their holistic coun-terpart. In particular, the bank with the highest recognition rate(best bank) was found to use an analytical representation for allfrontal test sets of the five databases. With respect to non-frontalconditions, this representation plays an important role in the caseof degraded images with missing or hidden facial areas, especiallyfor turned faces or with occlusions. Only for the test sets with ges-

Á. Serrano et al. / Pattern Recognition Letters 32 (2011) 1998–2008 2007
tures or changes of illumination could the holistic representationobtain better results.
This general preponderance of analytical representations, whichonly make use of the Gabor coefficients computed on specific land-marks, is unexpected according to previous works in the literature(Serrano et al., 2010). In fact, the analytical Elastic Bunch GraphMatching-based methods (Lades et al., 1993; Wiskott et al.,1997) have given way to the so-called holistic Gabor methods suchas those by Liu and Wechsler (2002) or Serrano et al. (2007), whichexploit global facial information.
Before the PCA dimensionality reduction stage, it is obvious thatthe analytical feature vectors are shorter than the holistic ones. Theformer depend on the number of facial features considered, whilethe latter depends on the size of the face image. After the PCA andkeeping the same amount of explained variance, we found that theanalytical vectors were still shorter than the holistic ones, but thereduction ratio was stronger for the holistic vectors with up to 99%in some cases. This means that the holistic representation is highlyredundant. For the k-NN classification stage, it is easier that longerfeature vectors from the training and test sets match worse thanshorter vectors, as there can be more outlier values in the test vec-tor that distorts the distance measurement. This explains why therecognition rate obtained with this representation was found to belower than for the analytical case.
Considering the five databases studied here, this behavior wasalso found for other values of the downsampling factor of the holisticfeature vectors and the explained variance, provided this variancelevel is kept equal for both analytical and holistic representations.
5. Conclusions
Our 6-way ANOVA experiment for the optimal parametrizationof a Gabor filter bank for face recognition using 5 face databases(FERET, FRAV2D, FRAV3D, FRGC and XM2VTS) has shown thatthe performance of the classical bank (Lades et al., 1993; Wiskottet al., 1997) can be improved by changing its parameters.
We have considered several independent criteria for the defini-tion of the optimal Gabor filter bank: the ‘‘best bank’’, the ‘‘bestmain-effects bank’’, the ‘‘best 5% bank’’ and the ‘‘global best bank’’.The specific parametrization of the optimal bank is highly depen-dent first on the definition of best bank adopted, as well as onthe databases used and the type of images considered in the exper-iments. It is obvious that the best bank corresponds to the bankwith the highest recognition rate (rank 1). Our results show thatthe best 5% bank definition obtains in average a better rank thanthe best main-effects bank, which is located at the top 10% endof the ranking of banks.
However after analysing all the results for the five databasesand different test sets, several recurrences do appear. In particular,considering fn = 6 frequencies (instead of 5) and narrower Gaussianwidths for the Gabor filters (rx = ry = 1, instead of the usual
ffiffiffi2p
),the recognition rate can be significantly increased. This new filterbank produces a better covering of the Fourier domain andtherefore can extract more discriminant information for arecognition system. The best values of the other parameters (fmax,fratio) are highly dependent on the specific database, although themost repeated values are fmax = 0.25 and fratio ¼
ffiffiffi2p
. The preferenceto filter banks with 8 orientations (hn) is almost unanimous for allthe experiments. These results have been obtained with the Maha-lanobis distance for our k-NN classifier (k = 1), after comparing itwith five other distance metrics (L1, L2, L1, cosine and correlation).
Our ANOVA results show that the 6 Gabor parameters are allstatistically significant to the 0.001 level, with certain interactionsbetween pairs of parameters, specially between fmax, fn and fratio, aswell as between fratio, hn, rx and ry. These interactions imply that
there exists pairs of parameters whose values do have an impacton the recognition rate, and therefore, the performance could bereduced if the Gabor parametrization is not chosen carefully. Themost recurrent interactions between factors for all the databases,test sets and Gabor representations and the suggested optimal val-ues for these parameters are fmax � fn = 0.25 � 6,fmax � fratio ¼ 0:25�
ffiffiffi2p
and fn � fratio ¼ 6�ffiffiffi2p
.Unlike previous works, we have found that the analytical Gabor
representation outperforms its holistic counterpart for frontalimages to the same level of explained variance. For degradedimages (turns, occlusions), the imbalance between the analyticaland the holistic representations is even greater. Only the tests setswith images with gestures or changes of illumination have showna preference to the holistic representation. This inferiority foundfor holistic Gabor representations can be explained for the intrinsicredundancy and the size of the feature vectors of this kind ofrepresentation.
As a summary, for future face recognition experiments wesuggest an analytical approach using the Gabor bank with 6frequencies, 8 orientations and narrow widths (fmax = 0.25, fn = 6,fratio ¼
ffiffiffi2p
, hn = 8, rx = 1, ry = 1).
References
Ashraful Amin, M., Yan, H., 2009. An empirical study on the characteristics of Gaborrepresentations for face recognition. Internat. J. Pattern Recognition Artif. Intell.23 (3), 401–431.
Belhumeur, P.N., Hespanha, J.P., Kriegman, D.J., 1997. Eigenfaces vs. Fisherfaces:Recognition using class specific linear projection. IEEE Trans. Pattern Anal.Machine Intell. 19 (7), 711–720.
Bianconi, F., Fernández, A., 2007. Evaluation of the effects of Gabor filter parameterson texture classification. Pattern Recognition 40 (12), 3325–3335.
Bicego, M., Salah, A.A., Grosso, E., Tistarelli. M., Akarun, L., 2007. Generalization inholistic versus analytic processing of faces. In: Proc. ICIAP, pp. 235–240.
Buhmann, M.D., 2003. Radial Basis Functions: Theory and Implementations.Cambridge University Press.
Chang, K., Bowyer, K., Flynn, P., 2003. Face recognition using 2D and 3D facial data.In: ACM Workshop on Multimodal User Authentication, pp. 25–32.
Chellappa, R., Sinha, P., Phillips, P.J., 2010. Face recognition by computers andhumans. IEEE Comput. 2 (2), 46–55.
Conde, C., Serrano, Á., Cabello, E., 2006. Multimodal 2D, 2.5D & 3D face verification.In: Proc. ICIP, pp. 2061–2064.
Ding, L., Martinez, A.M., 2010. Features versus context: An approach for precise anddetailed detection and delineation of faces and facial features. IEEE Trans.Pattern Anal. Machine Intell. 32 (11), 2022–2038.
Du, S., Ward, R.K., 2009. Improved face representation by nonuniform multilevelselection of Gabor convolution features. IEEE Trans. Systems Man Cybernet. PartB: Cybernet. 39 (6), 1408–1419.
Escobar, M.J., Ruiz-del-Solar, J., 2002. Biologically-based face recognition usingGabor filters and log-polar images. In: Proc. Internat. Joint Conf. on NeuralNetworks, pp. 1143–1147.
Farkas, L.G., Hreczko, T.A., Kolar, J.C., Munro, I.R., 1985. Vertical and horizontalproportions of the face in young adult North American caucasians: Revision ofneoclassical canons. Plastic Reconstruct. Surg. 75 (3), 328–337.
Jahanbin, S., Bovik, A.C., Choi, H., 2008. Automated facial feature detection fromportrait and range images. In: Proc. IEEE Southwest Symp. on Image Analysisand Interpretation, pp. 25–28.
Jain, A.K., Ross, A., Prabhakar, S., 2004. An introduction to biometric recognition.IEEE Trans. Circuits Systems Video Technol. 14 (1), 4–20.
Jing, X.-Y., Chang, H., Li, S., Yao, Y.-F., Liu, Q., Bian, L.-S., Man, J.-Y., Wang, C., 2009.Face recognition based on a Gabor-2D Fisherface approach with selecting 2DGabor principal components and discriminant vectors. In: Proc. Third Internat.Conf. on Genetic and Evolutionary Computing, pp. 565–568.
Kalocsai, P., Neven, H., Steffens, J., 1998. Statistical analysis of Gabor-filterrepresentation. In: Proc. Internat. Conf. on AFGR, pp. 360–365.
Kamarainen, J., Kyrki, V., Kälviäinen, H., 2002. Fundamental frequency Gabor filtersfor object recognition. In: Proc. IAPR ICPR, pp. 628–631.
Kinage, K.S., Bhirud, S.G., 2010. Face recognition using independent componentanalysis of GaborJet (GaborJet-ICA). In: Proc. Internat. Colloquium on SignalProcessing and Its Applications, p. 1.
Lades, M., Vorbrüggen, J., Buhmann, J., Lange, J., von der Malsburg, C., Würtz, R.P.,Konen, W., 1993. Distortion invariant object recognition in the dynamic linkarchitecture. IEEE Trans. Comput. 42 (3), 300–311.
Lam, K.-M., Yan, H., 1998. An analytic-to-holistic approach for face recognitionbased on a single frontal view. IEEE Trans. Pattern Anal. Machine Intell. 20 (7),673–686.
Li, X., Fei, S., Zhang, T., 2009. Novel dimension reduction method of Gabor featureand its application to face recognition. In: Proc. 2nd Internat. Congress on Imageand Signal Processing, pp. 1–5.

2008 Á. Serrano et al. / Pattern Recognition Letters 32 (2011) 1998–2008
Liu, C., Wechsler, H., 2002. Gabor feature based classification using the enhancedfisher linear discriminant model for face recognition. IEEE Trans. Image Process.11 (4), 467–476.
Martinez, A.M., Kak, A.C., 2001. PCA versus LDA. IEEE Trans. Pattern Anal. MachineIntell. 23 (2), 228–233.
Messer, K., Matas, J., Kittler, J., Luettin, J., Maitre, G., 1999. XM2VTS: The extendedM2VTS database. In: Proc. Internat. Conf. on Audio and Video-based BiometricPerson Authentication, pp. 72–77.
Phillips, P., Moon, H., Rizvi, S., Rauss, P., 2000. The FERET evaluation methodologyfor face recognition algorithms. IEEE Trans. Pattern Anal. Machine Intell. 22 (10),1090–1104.
Qin, J., He, Z.-S., 2005. A SVM face recognition method based on Gabor-featured keypoints. In: Proc. Internat. Conf. on Machine Learning and Cybernetics, vol. 8, pp.5144–5149.
Serrano, Á., Martín de Diego, I., Conde, C., Cabello, E., Shen, L., Bai, L., 2007. Influenceof wavelet frequency and orientation in an SVM based parallel Gabor PCA faceverification system. In: Yin, H. et al. (Eds.), Proc. IDEAL Conf., LNCS, vol. 4881.Springer-Verlag, pp. 219–228.
Serrano, Á., Martín de Diego, I., Conde, C., Cabello, E., 2010. Recent advances in facebiometrics with Gabor wavelets: A review. Pattern Recognition Lett. 31 (5),372–381.
Shen, L., Bai, L., 2006. A review on Gabor wavelets for face recognition. Pattern Anal.Appl. 9 (2–3), 273–292.
Thornton, J., Savvides, M., Kumar, B.V.K., 2007. An evaluation of iris patternrepresentations. In: Proc. BTAS Conf., pp. 1–6.
Turk, M., Pentland, A., 1991. Eigenfaces for recognition. J. Cogn. Neurosci. 3 (1), 71–86.
Vapnik, V., 1995. The Nature of Statistical Learning Theory. Springer Verlag, NewYork.
Wiskott, L., Fellous, J.M., Krüger, N., von der Malsburg, C., 1997. Face recognition byelastic bunch graph matching. IEEE Trans. Pattern Anal. Machine Intell. 19 (7),775–779.
Wu, J., An, G., Ruan, Q., 2009. Independent Gabor analysis of discriminant featuresfusion for face recognition. IEEE Signal Process. Lett. 16 (2), 97–100.
Zhao, W., Chellappa, R., Rosenfeld, A., Phillips, P.J., 2003. Face recognition: Aliterature survey. ACM Comput. Surv. 35 (4), 399–458.